Article

The Role of Blade Sinusoidal Tubercle Trailing Edge in a Centrifugal Pump with Low Specific Speed

1
National-Provincial Joint Engineering Laboratory for Fluid Transmission System Technology, Zhejiang Sci-Tech University, Hangzhou 310018, China
2
Department of Mechanical Technology, Zhejiang Institute of Mechanical and Electrical Engineering, Hangzhou 310053, China
*
Author to whom correspondence should be addressed.
Processes 2019, 7(9), 625; https://doi.org/10.3390/pr7090625
Submission received: 8 August 2019 / Revised: 10 September 2019 / Accepted: 11 September 2019 / Published: 17 September 2019
(This article belongs to the Special Issue CFD Applications in Energy Engineering Research and Simulation)

Abstract

:
Pressure pulsations may cause high-amplitude vibrations during the process of a centrifugal pump. The trailing edge shape of the blade has a critical influence on the pump’s pressure fluctuation and hydraulic characterization. In this paper, inspired by the humpback whale flipper, the authors research the impact of applying the sinusoidal tubercles to the blade suction side of the trailing edge. Numerical calculation and experiments are carried out to investigate the impact of the trailing edge shape on the pressure pulsations and performance of a centrifugal pump with low specific speed. Two designed impellers are tested, one is a sinusoidal tubercle trailing edge (STTE) impeller and the other is the original trailing edge (OTE) prototype. The detailed study indicates that the sinusoidal tubercle trailing edge (STTE) reduces pressure pulsation and enhances hydraulic performance. In the volute tongue region, the pressure pulsation amplitudes of STTE at fBPF decrease significantly. The STTE impeller also effectively changes the vortex structure and intensity in the blade trailing edge area. This investigation will be of great benefit to the optimal design of pumps.

1. Introduction

The centrifugal pump is an important energy conversion and fluid transfer tool and is widely used in various fields, such as the agriculture, industry, urban water supply, aerospace, and fire engines. According to an annual report made by the European Commission, pump systems account for about 22% of the electric energy supply in the world [1]. However, due to the low operating efficiency of pumps, most of the energy is not used efficiently. Therefore, there is an urgent need to improve the energy conversion utilization of pump systems.
In fact, when a centrifugal pump operates under partial-flow conditions, fluid transport is quite disordered. The operation efficiency is very low, especially for a pump with low specific speed. Some unsteady phenomena, such as backflow at the impeller inlet and outlet, the local cavitation, etc., affect the performance and induce large pressure pulsations and noise [2,3,4]. Pressure pulsation may cause high-amplitude vibrations [5,6], which may cause cracks in pump components and shorten the life of the pump. As for the centrifugal pump, many investigations were implemented to explore the performance and pressure pulsations through experiments or numerical simulations [7,8,9]. Fu et al. [10] analyzed the flow phenomena in a low-specific-speed centrifugal pump, and found the cavitation occurs under low flow rate, the inlet low-frequency pressure fluctuations were closely correlated to cavitation phenomena. Pei and Wang [11] studied the pressure fluctuations using statistical analysis. The highest pressure fluctuation intensity occurs at the trailing edge of the pressure side and near the volute tongue, and modifying the geometry of the leading edge in the impeller and the tongue in the volute can reduce the intensity. Jafarzadeh [12] simulated the flow of a low-specific-speed high-speed pump, and highlighted the effect of the number of blades on efficiency and head. Chu and Dong [13,14] found that the unsteady flow pattern and the rotor–stator interaction are two main excitation components of the pressure pulsations and noise. Keller et al. [15] used particle image velocimetry technology to measure the rotor–stator interaction, and found that the vortex sheds from trailing edge and affects the flow field in the volute, their collision generates strong pressure pulsation. Jia [16] explored the pressure distribution in a low-specific-speed centrifugal pump, and found that the asymmetry of pressure distribution is caused by the tongue. It may induce vibration and noise. Heskestad and Olberts [17] explored the effect of different blade trailing edge geometries on pressure pulsation and vibration, and revealed that the vortex intensity and the vortex shedding frequency are regulated by the trailing edge.
Many researchers have investigated the methods to improve the performance and weaken pressure pulsation amplitude in a low-specific-speed centrifugal pump. Gao and Zhang [18] numerically investigated the impeller with five especial blade trailing edge shapes. The final conclusions show that well-designed trailing edges can significantly improve pump efficiency and effectively reduce pressure pulsations. Spence [19] analyzed the effect of the geometric parameters of the impeller and volute on pressure pulsation, and found that increasing gap between the impeller and volute will reduce the pressure pulsation, but the efficiency may decline. Solis [20] used numerical simulation to study the influence of radial gap and splitter blades on pressure pulsation and hydraulic performance. Adding splitter blades can effectively reduce pressure pulsation, and improve performance. Amir [21] designed an original impeller and volute with CFturbo, and carried out Computational Fluid Dynamics (CFD) simulation. Then, he modified the design parameters to get new impellers and volutes, and conducted simulation calculation again until the desired results were achieved. Zhu and Chen [22] designed the gap structure blade to suppress cavitation and pressure pulsation induced by cavitation. Khalifa [23] tested cutting the impeller blade outlet to increase the effective clearance with volute, and the results show that it is useful for reducing pressure pulsations. For the pump as a turbine, the position of proper blade trailing edges also produces an effective impact on enhancing the performance and reducing pressure pulsations [24].
More recently, a large number of researchers have focused attention on the application of bionics [25,26,27]. The humpback is one of them. Despite humpback whales being bulky, they can move flexibly underwater and even jump out of the water. This is due to the fact that some sinusoidal tubercles grow in their pectoral fins. Shi et al. [28] investigated two types of 3D hydrofoil turbine blades, including one original hydrofoil and one hydrofoil with leading-edge tubercles. By comparison, the latter’s hydraulic performance is superior, and the strength of the tip vortex is also significantly reduced. Therefore, inspired by bionics, we designed a new impeller with sinusoidal tubercles on the blade trailing edge. The purpose of this case is to study the effect of the sinusoidal tubercle on the pressure pulsations and the performance of a centrifugal pump with low specific speed, and one original impeller and one new tubercle impeller are investigated by numerical calculation and experiment. The sinusoidal tubercles can divide the vortex shedding from blade trailing edge into several small vortexes. The vortex core region in the pump is reduced, and the rotor–stator interference of the impeller and volute is weakened, so as to reduce the pressure pulsation and energy loss. The pressure signals are captured by monitoring points arranged in the pump. Finally, the effect of the sinusoidal tubercle on pressure pulsations and performance are obtained and analyzed successfully.

2. Test Model Pump and Setup

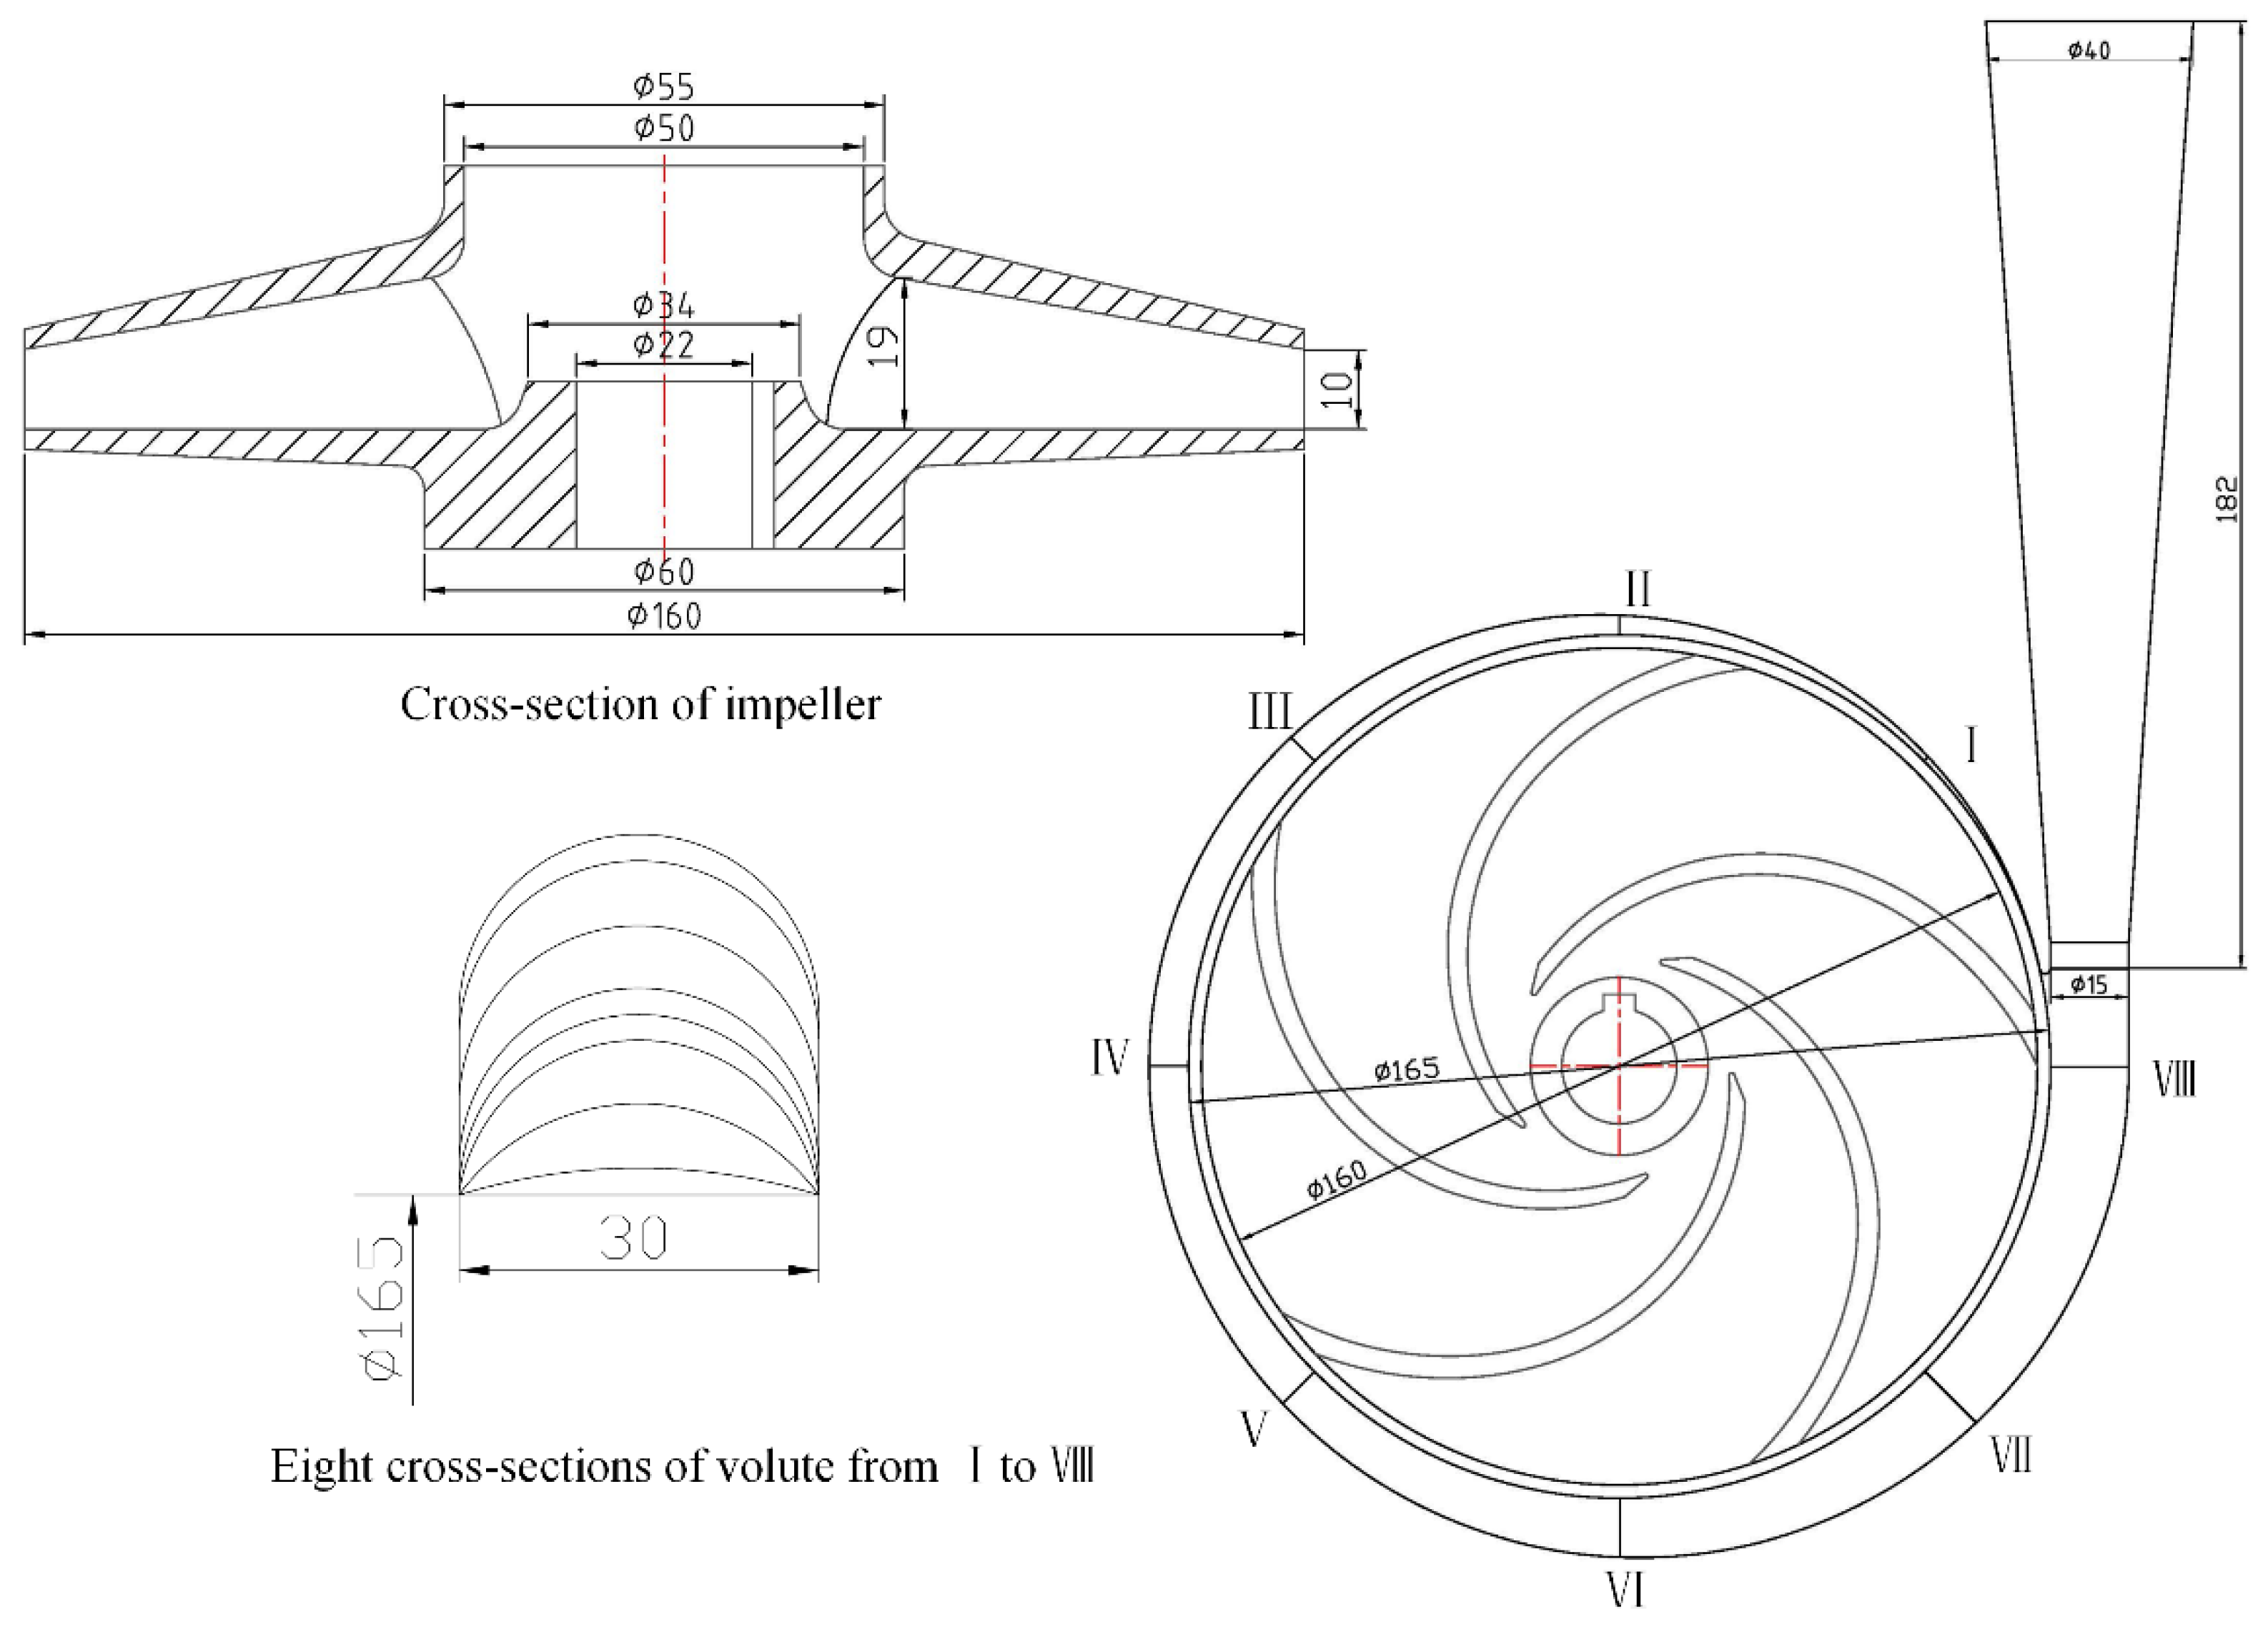
2.1. Test Model Pump

In this paper, a single-stage test model pump with low specific speed is designed to investigate the performance and pressure pulsations. The specific speed Ns ( N s = 3.65 n Q / H 0.75 ) of the model pump is 40.1. Q and H represent the nominal flow rate and nominal head, respectively. n is the speed of rotation of the pump in rpm. The test impeller has five cylindrical blades. The inlet and outlet diameters are 50 mm and 160 mm, respectively. Table 1 lists the essential geometric dimensions and design parameters. The geometry of the test model pump impeller and volute is shown in Figure 1.

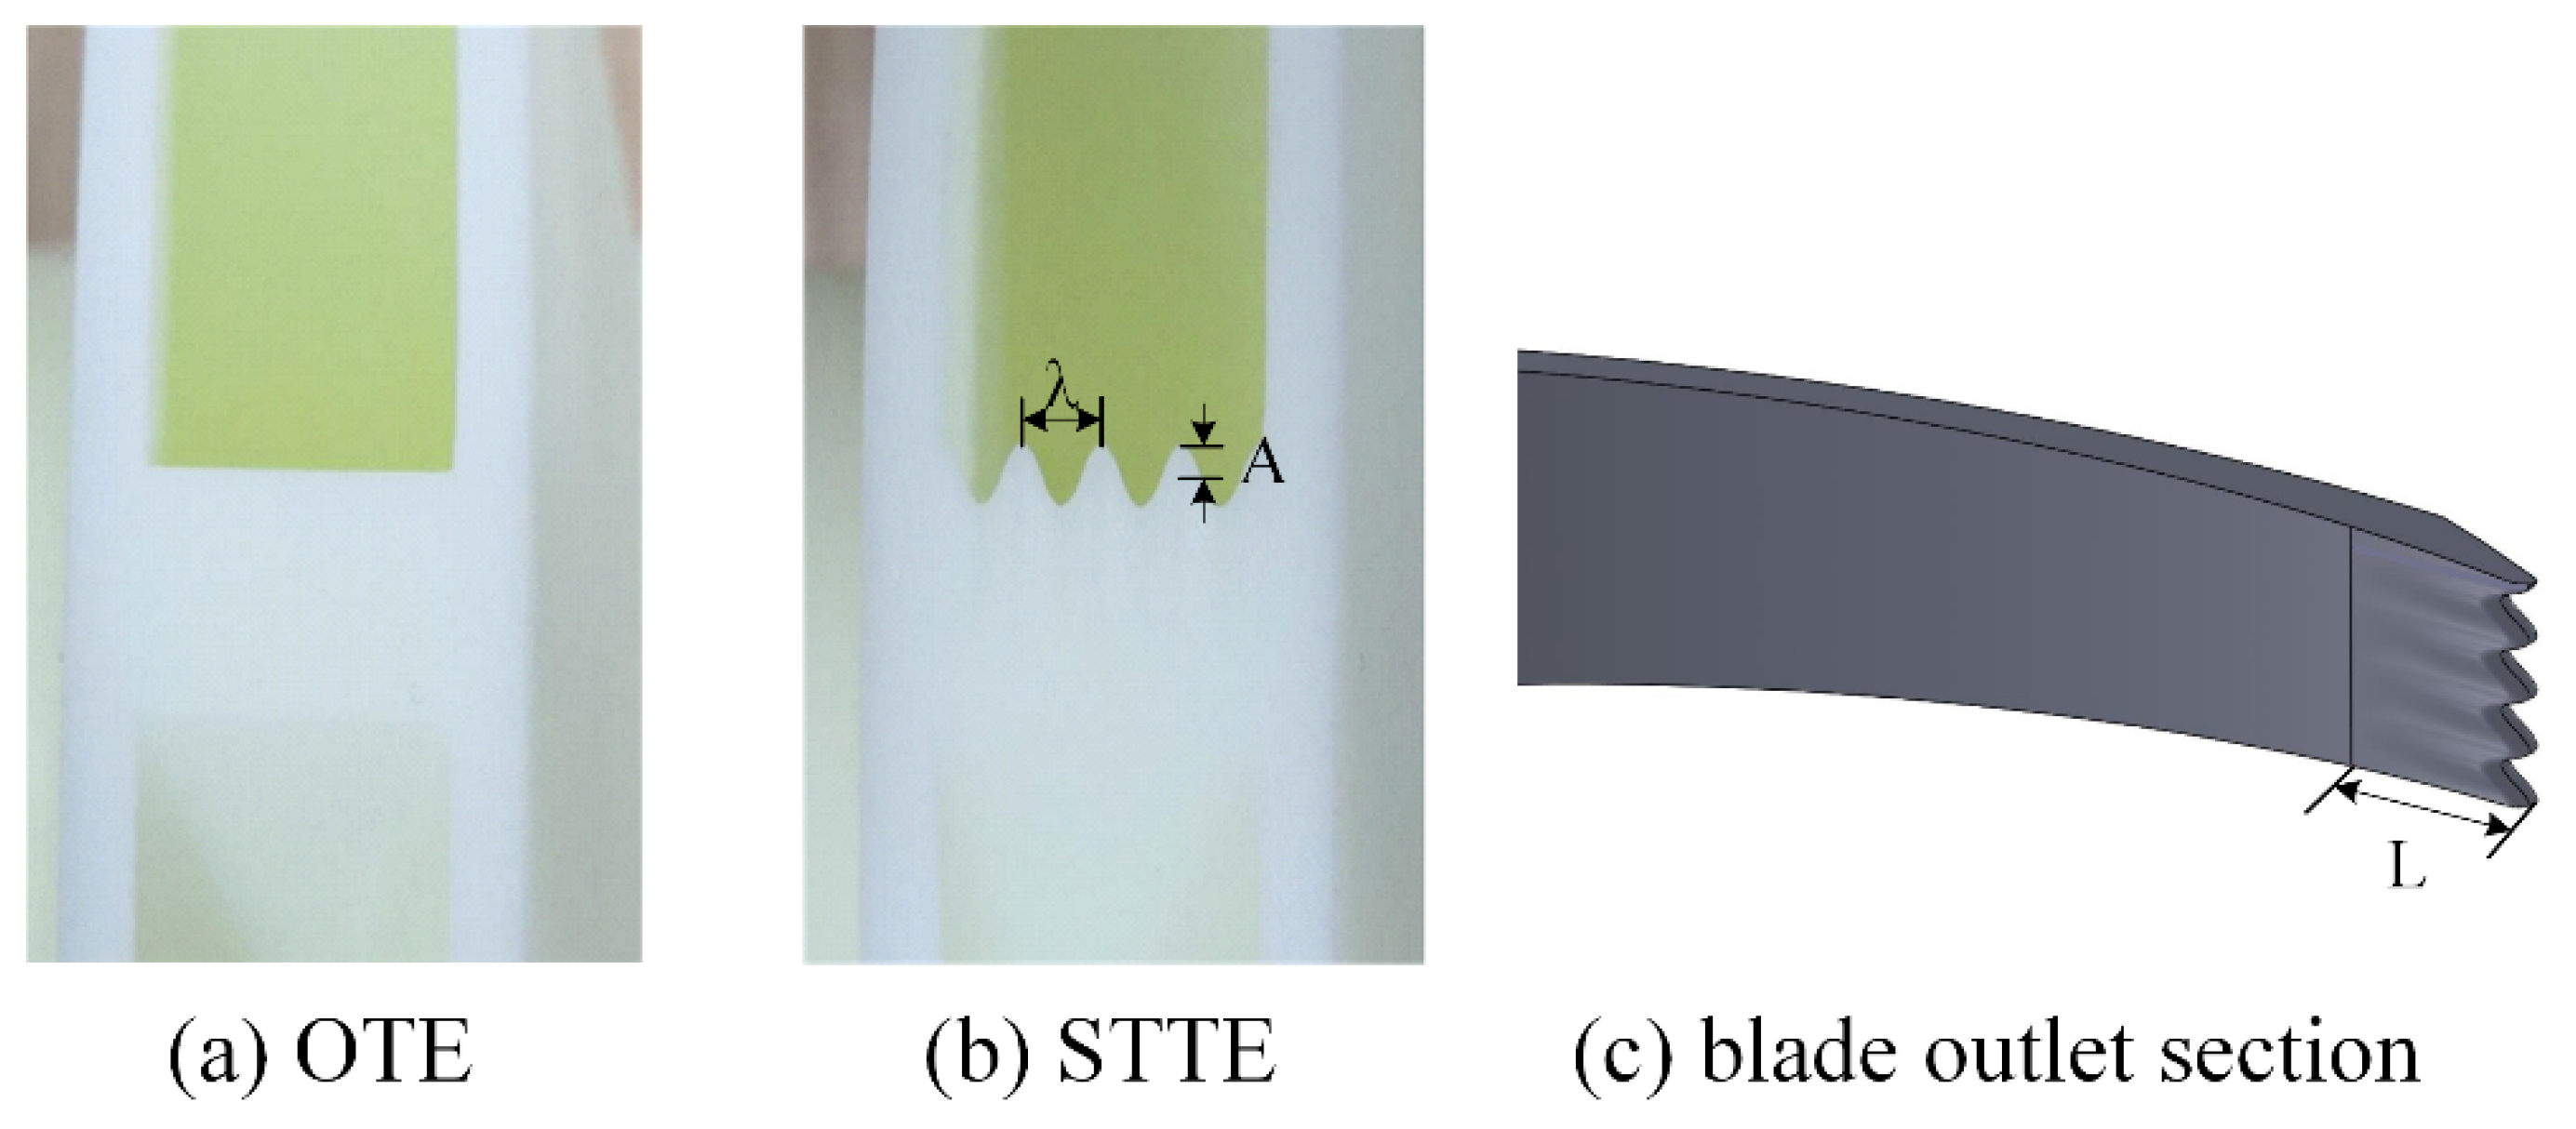
2.2. Impeller Blade Trailing Edge

Two impellers are designed and manufactured by 3DP technology. Figure 2 shows the differences between the two trailing edges, including the original trailing edge (OTE) prototype and the new designed sinusoidal tubercle trailing edge (STTE). OTE is the original trailing edge, which is a sharp corner. The vortexes shedding from the OTE are intensive. The STTE only exists on the blade suction surface, the pressure side remains constant. There are also sinusoidal grooves on the suction surface at the blade outlet, and the length of the longitudinal extension is L. Groove depth gradually decreases from A to zero along the blade profile line. As shown in Figure 2, λ is the sinusoidal wavelength, indicating the spacing of sinusoidal tubercle. A is the amplitude of the sinusoid, which is half the height of the sinusoidal tubercle. According to the width of the impeller outlet, the values of λ, A, and L are 2.5 mm, 1 mm, and 10mm, respectively. In the design process, the essential parameters of two impellers are the same.

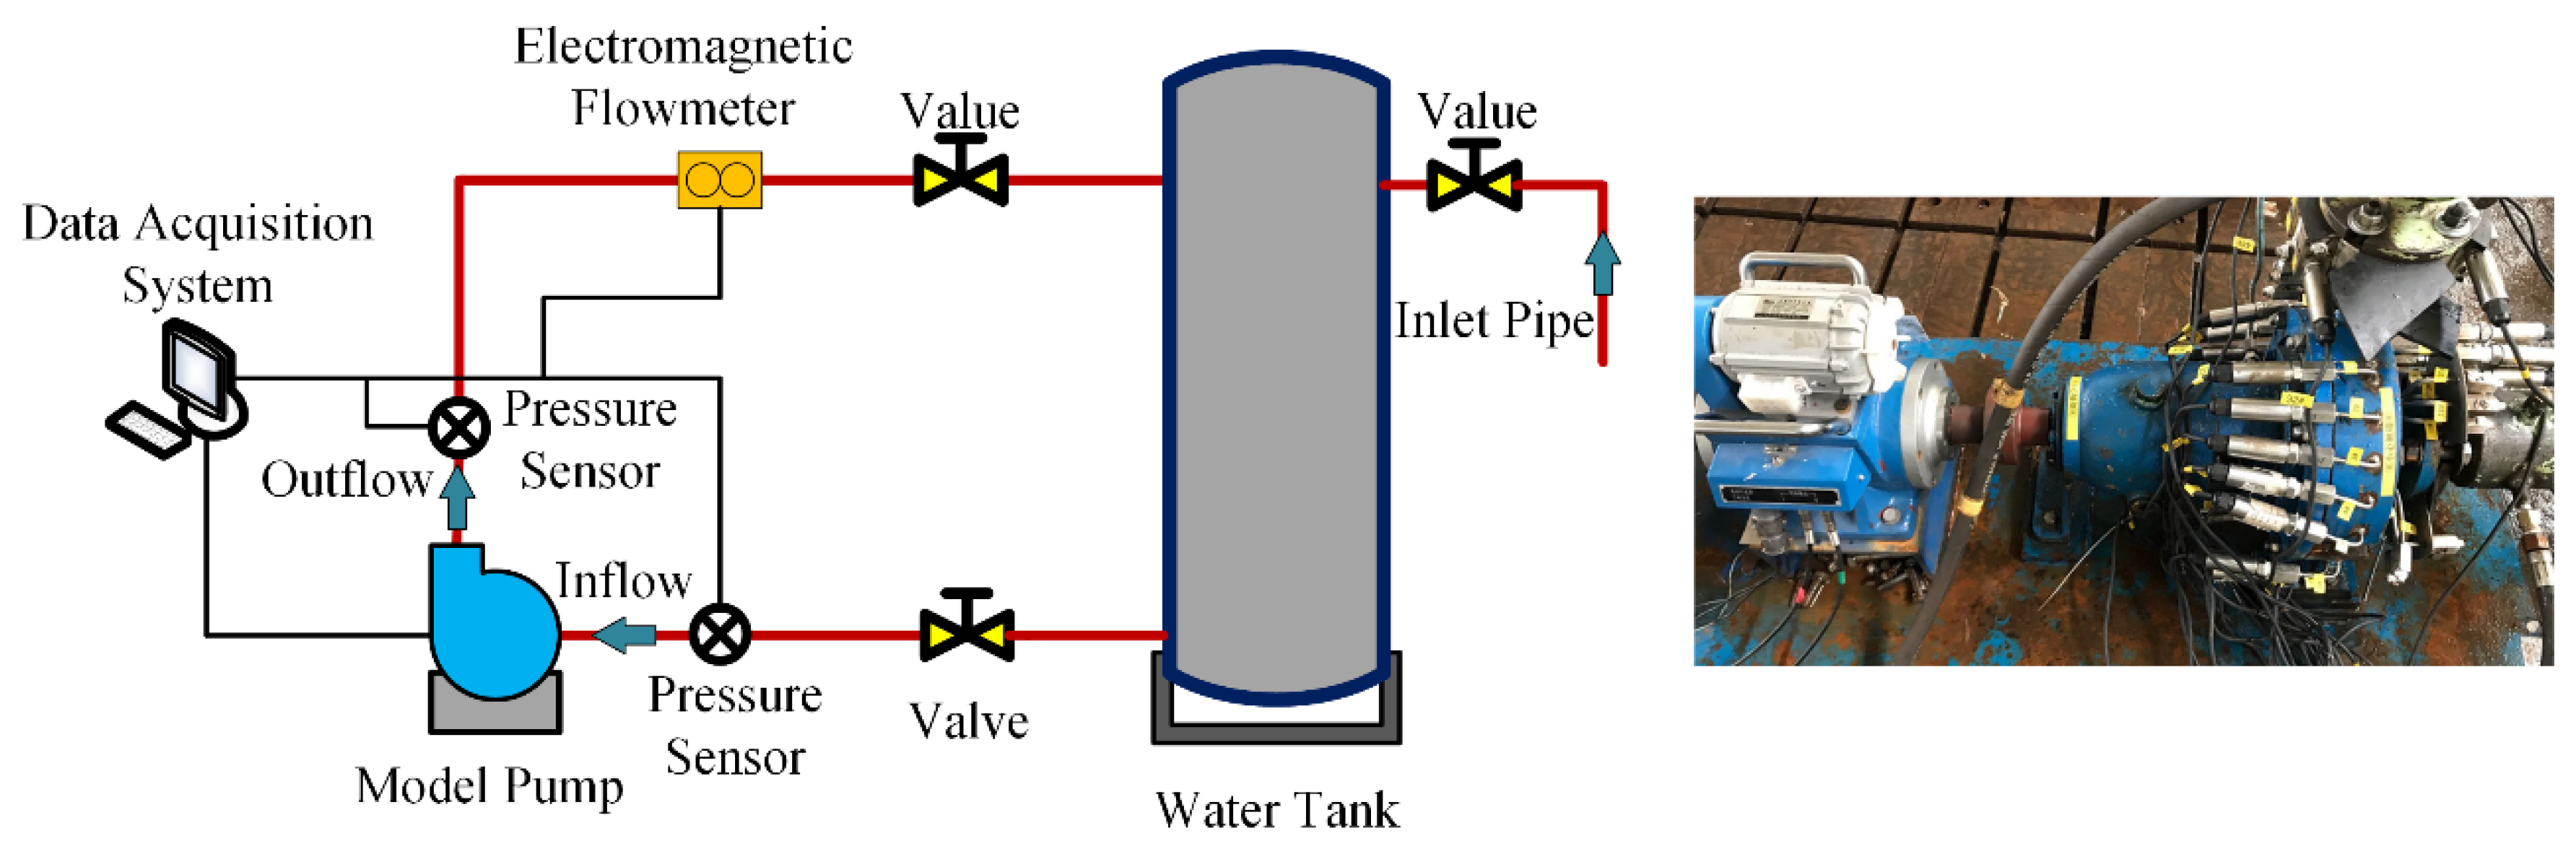
2.3. Experimental Setup

In order to obtain accurate test model pump data, the experiment was tested in a closed test rig [29], as shown in Figure 3. Pressure gauges with uncertainties of ± 0.2% are installed at the pump inlet and outlet for recording the pressure values. The flow rates of the experimental process are recorded by an electromagnetic flowmeter, the uncertainty is 0.2% class. Various flow rates (0.2–1.6QN) are regulated by valves located at the model pump outlet pipe. The test model pump is driven by a variable frequency motor with a speed of 3000 rpm. The uncertainty of the speed of rotation is 10 rpm. In order to ensure a constant speed during the experiment, a frequency inverter was used. In the experiment, the shaft torque is measured by a torque meter with uncertainties of ±0.5%. Sample signals of monitoring points are recorded by dynamic pressure sensors arranged around the volute.

3. Numerical Investigation

3.1. Numerical Method

Considering the influence of leakage flow on the flow field, the computational domain of the full flow field was used, which has seven components, including, inlet extension, front chamber, impeller, volute, back chamber, outlet extension, and wear ring, as shown in Figure 4. The test STTE impeller is also shown in Figure 4. A pair of interfaces connects each adjacent computational domain. The working fluid is water at 298 K. To avoid a reverse flow appearing in the inlet boundary, the extension length of the inlet pipe is three times that of the impeller inlet diameter in the calculation process.
More recently, CFX software has been widely used in the study of fluid simulation, which has greatly improved work efficiency [30,31,32,33,34,35]. The ANSYS CFX-18.0 is performed in the numerical simulation. Reasonable boundary conditions are conducive to convergence. The inlet boundary condition is set as uniform velocity, which is obtained by various flow rates and inlet pipe areas. Constant static pressure p = 1.013 × 10⁵ Pa is set as the outlet boundary condition. All solid walls are set as no-slip walls, and the roughness is neglected. The turbulent intensity of 5% is set in the inlet boundary. The high-resolution scheme is selected for the advection scheme, and the second order is used for the turbulence numeric. In the steady-state simulation process, the impeller is a rotating computational domain, and the others are stationary domains. The interface models between rotating–stationary and stationary–stationary domains are selected frozen-rotor and general connection, respectively. The shear stress transport (SST) k-ω model is applied to solve the turbulent flow and obtain the head and efficiency of the test pump, which has been used in many studies with reliable accuracy [36,37,38]. For transient simulation, the transient rotor–stator interface model is used for the rotating–stationary interface. The transient scheme option selects the second order backward Euler for transient simulation. The time step size determines the acquisition and post-processing of pressure signals [39]. Therefore, the setting of the time step requires an adequate response resolution to the turbulence pulsation. Finally, 240 steps are calculated in one revolution, and the time step is Δt = 8.3 × 10⁻⁵ s, corresponding to impeller rotation 1.5 degrees, as suggested by Li et al. [40]. The root mean square (RMS) is set to 1 × 10⁻⁵ to converge the result.
During the transient-state simulation, we choose the detached-eddy simulation (DES) model based on the SST k-ω model to capture the unsteady transient pressure signals in the exit region of the impeller. Compared with the large eddy simulation (LES), DES uses Reynolds Averaged Navier-Stokes (RANS) on the near wall and LES in the turbulent core. DES model can not only accurately capture the flows closed to the wall [41,42], but also save the computing resource. In the transient-state simulation, to obtain a quick convergence result, the results obtained from the steady-state simulation are set as the incipient flow condition of transient DES model. To obtain the steady operation results, we simulated the transient state for 15 revolutions, the last five revolutions data are only retained for analysis of pressure fluctuations.

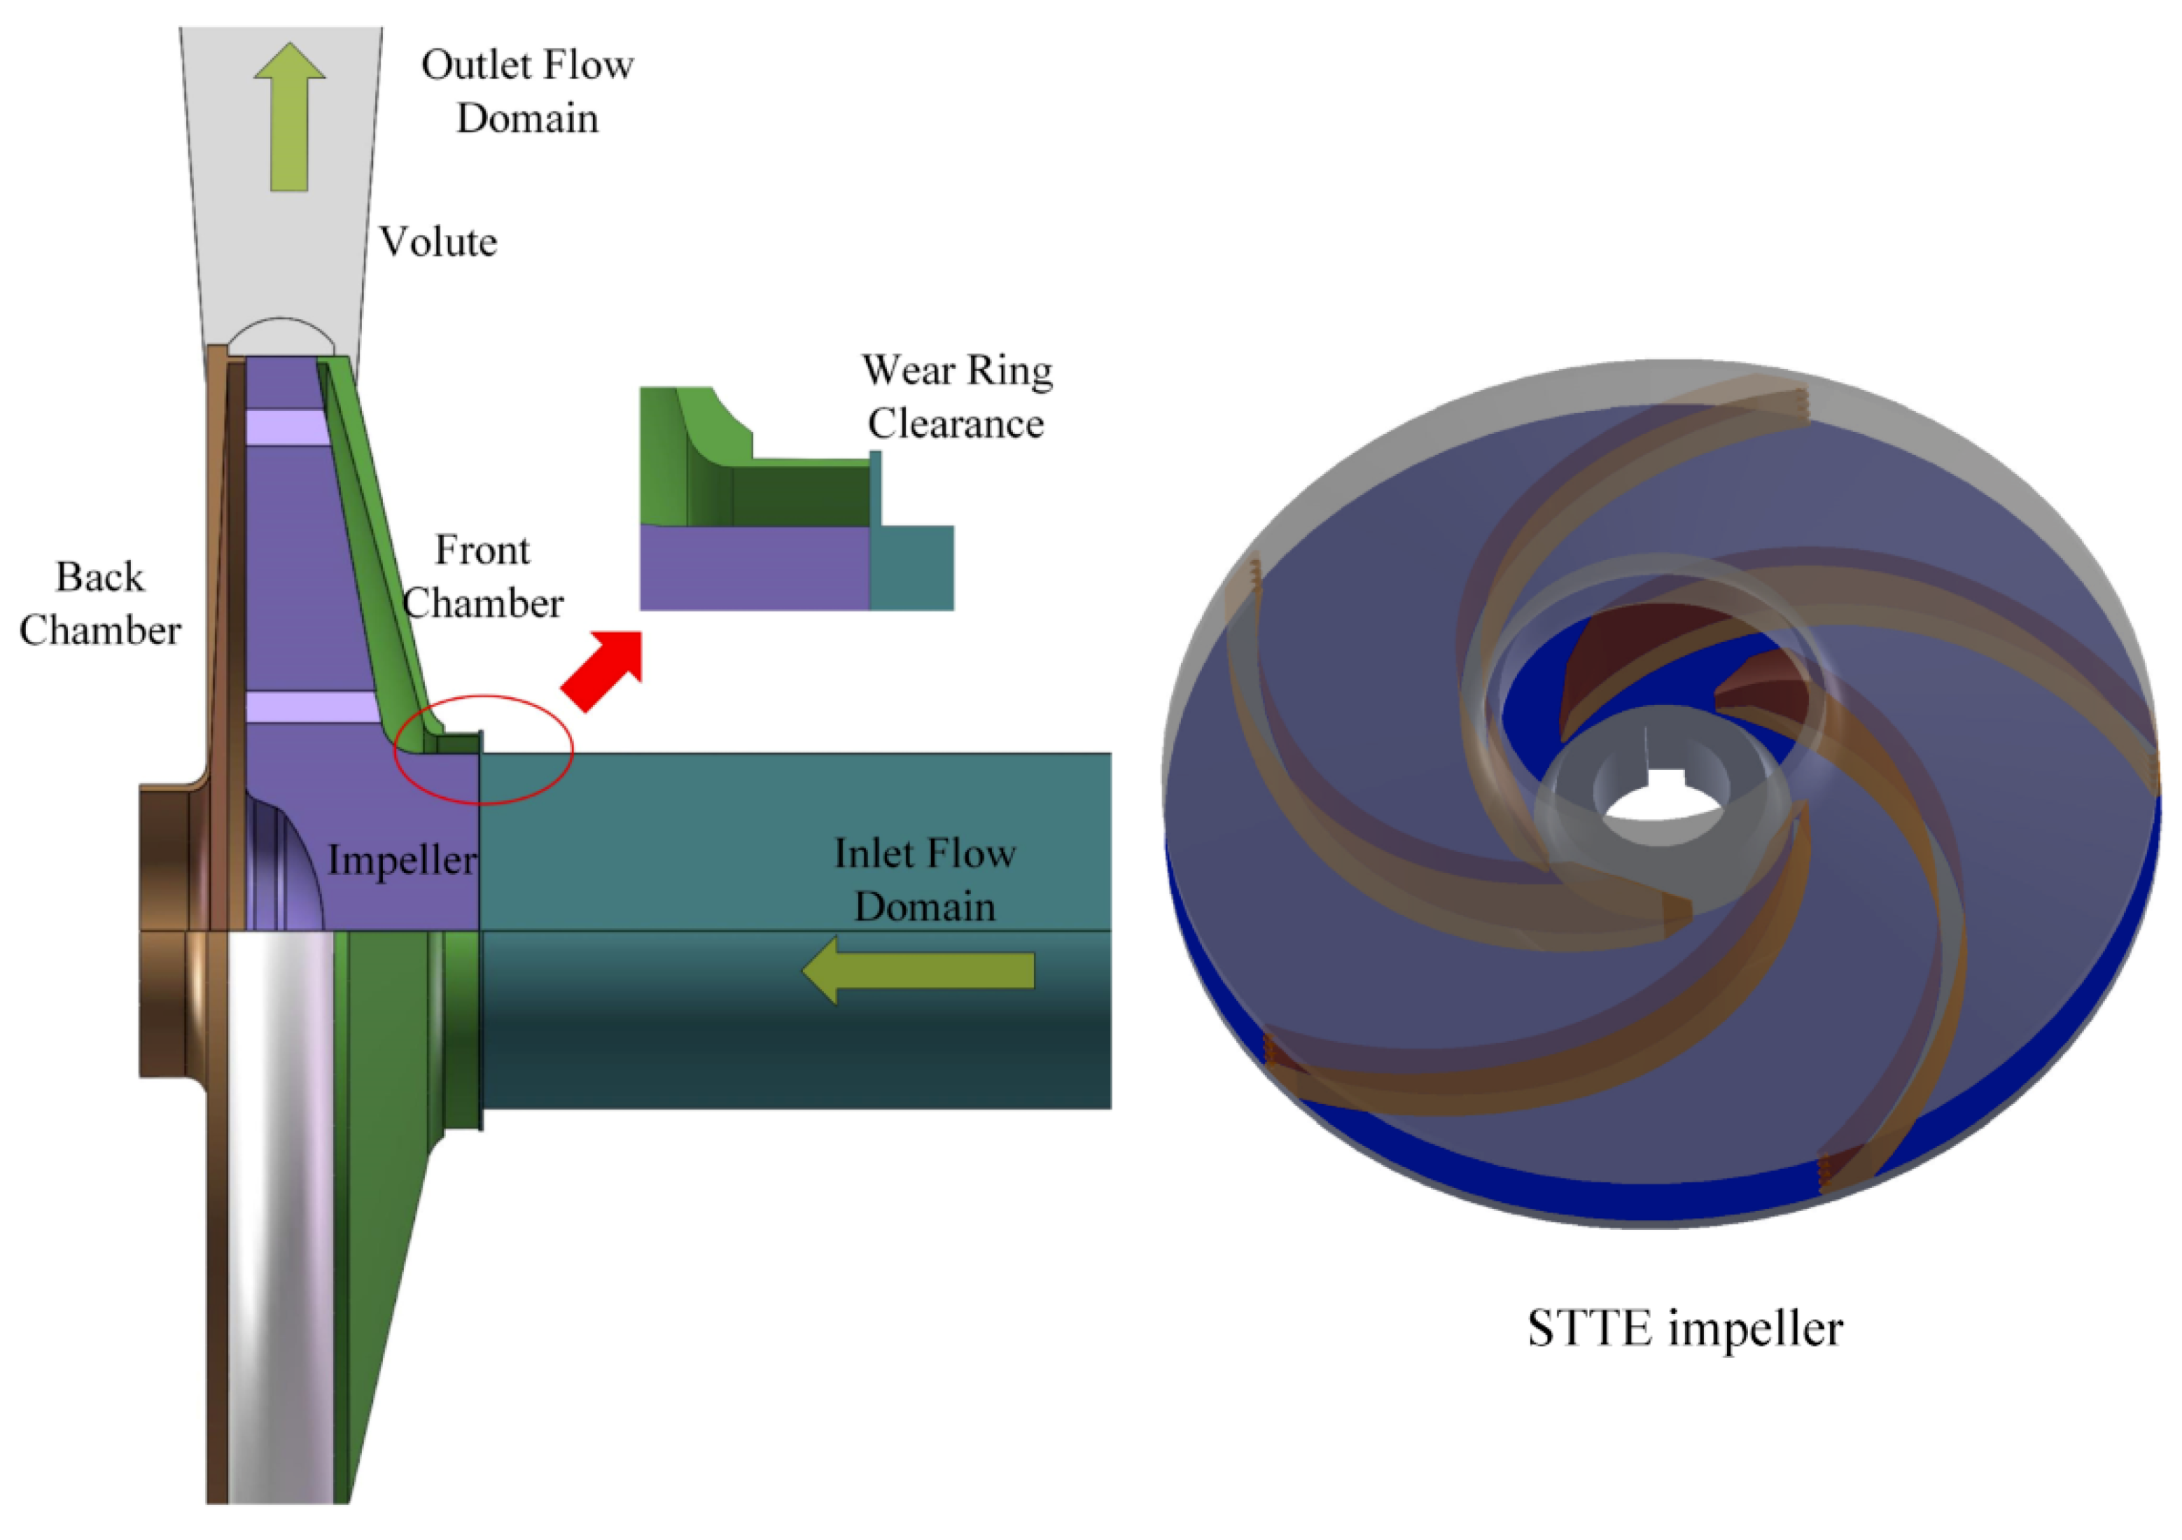
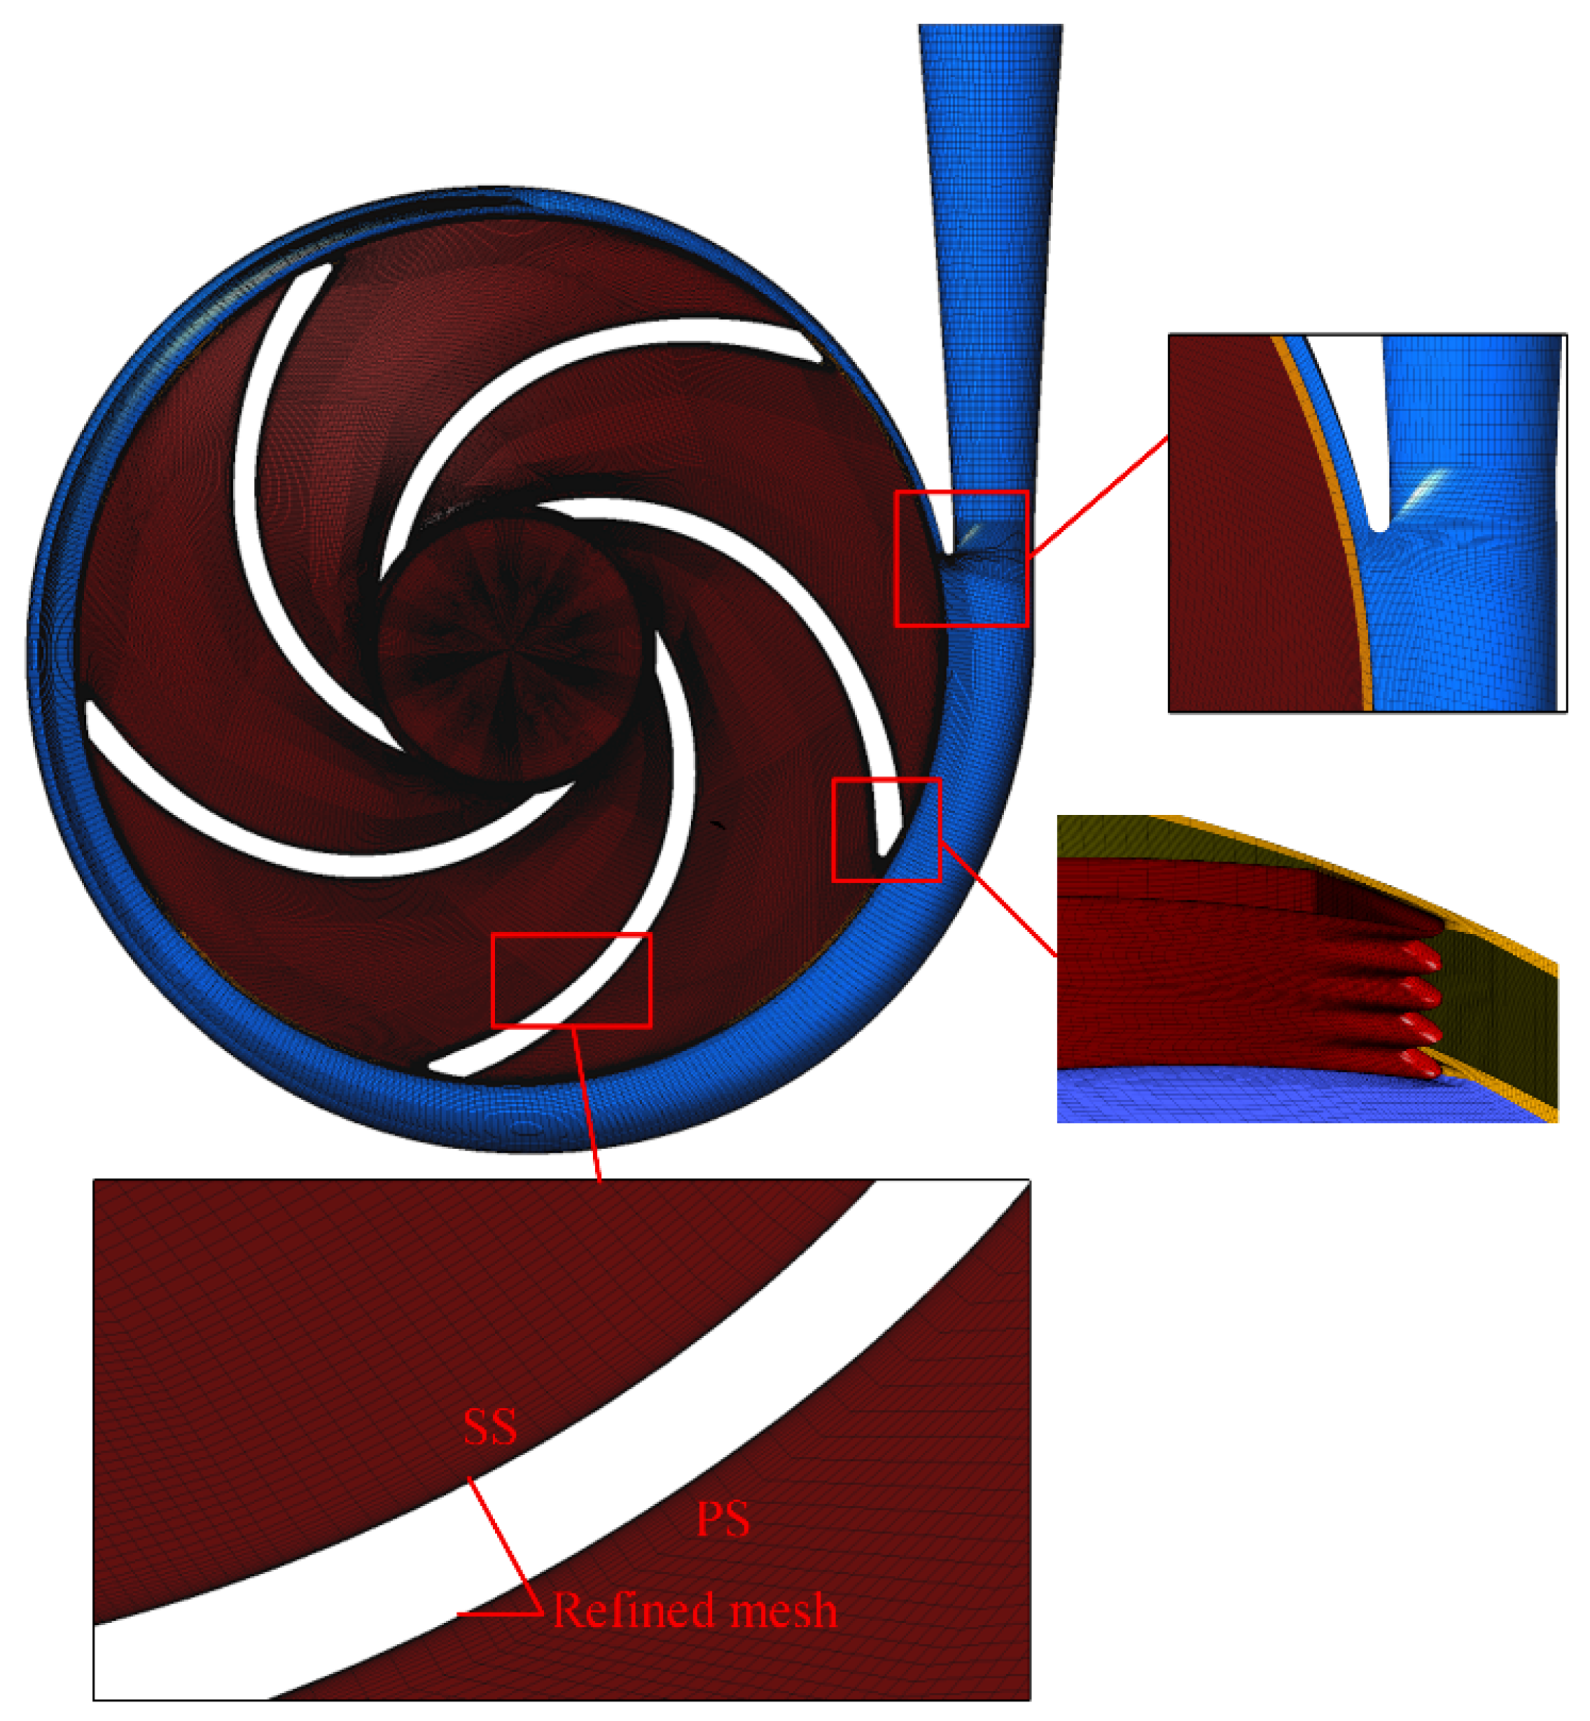
3.2. Computational Mesh

Mesh has a very significant impact on the accuracy of calculations in numerical simulation [43,44]. To ensure computational accuracy and computational efficiency, the entire computational domains adopt the structured hexahedral mesh generated by ANSYS-ICEM software. It is well known that the near-wall grid distribution directly affects calculation results [45]. Therefore, a boundary layer is generated near the wall to refine the mesh to meet the y+ requirements of the turbulence model, especially on the impeller blade wall and the volute tongue wall, as shown in Figure 5. After grid independence check [46,47,48], the total number of computational domains grids is determined to be 9.94 million. The average y+ value of the impeller is about 4.1. Detailed components of the grid distribution are displayed in Table 2.

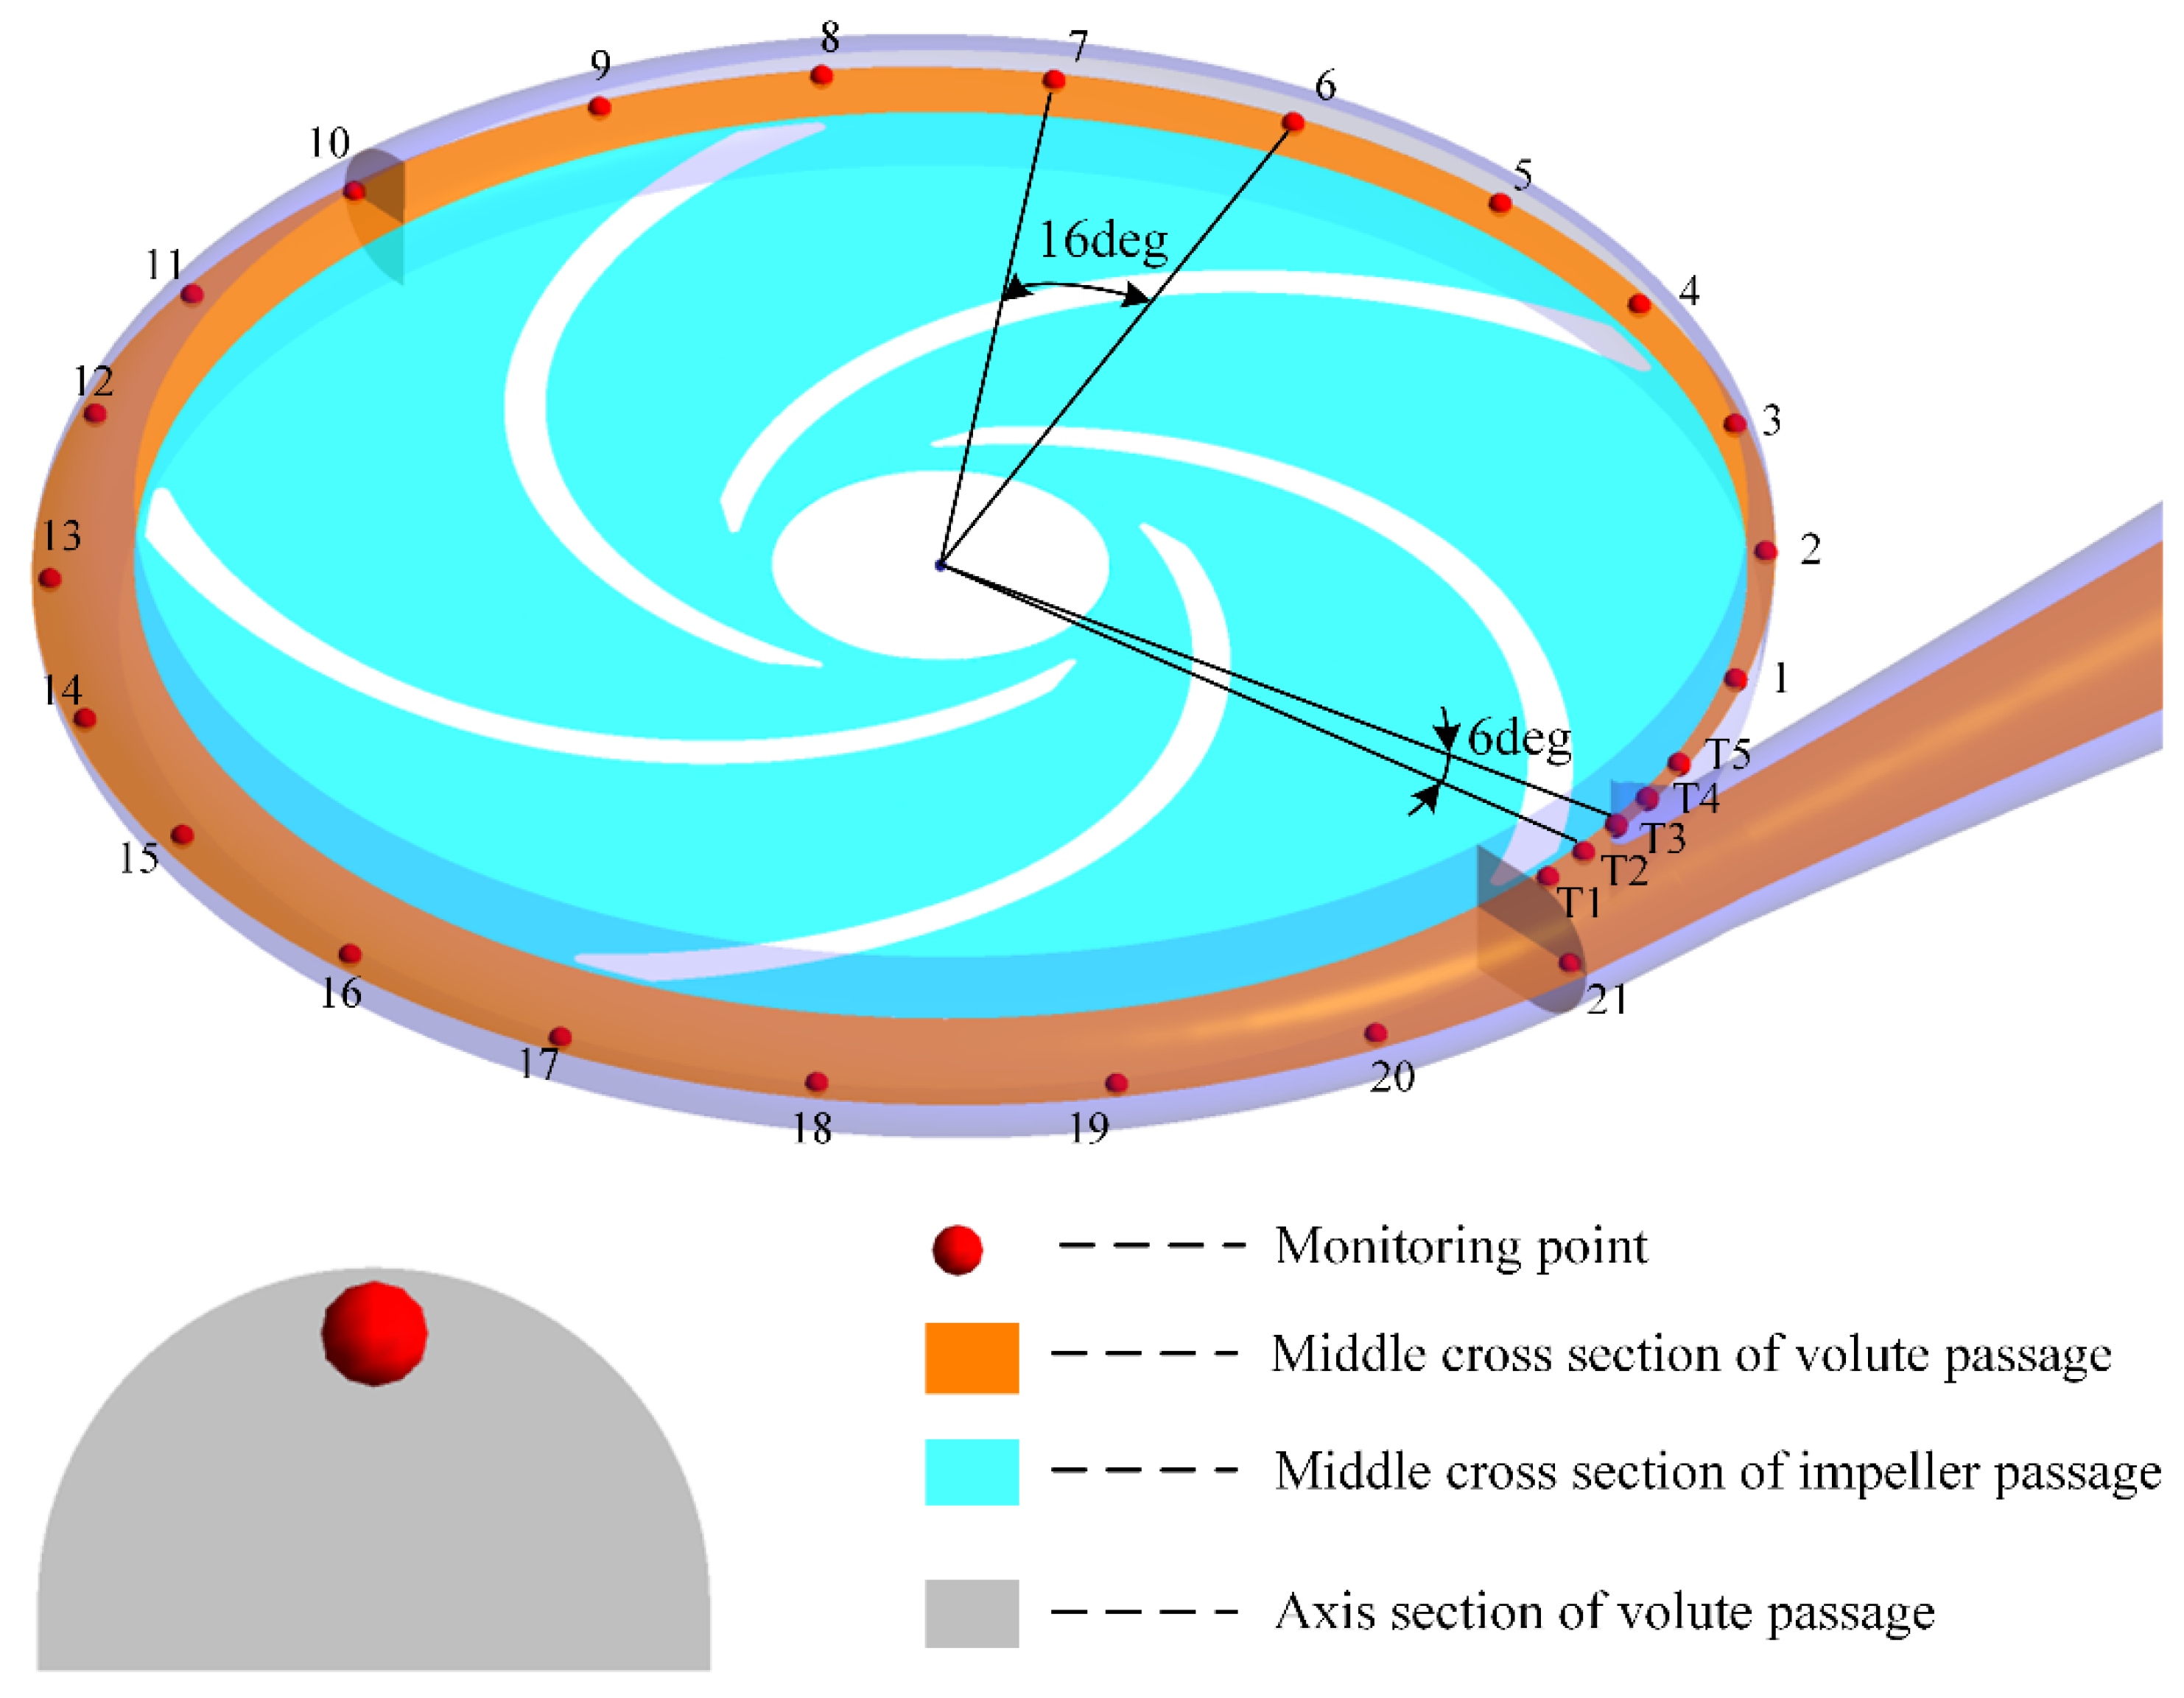
3.3. Monitoring Points Arrangement

To get fluctuating pressure signals in the volute flow channel and the tongue region, 26 monitoring points are placed at the tongue region and the middle cross-section of the volute passage. However, in order to capture exhaustive pressure signals in the rotor–stator interaction region, five monitoring points T1–T5 are set near the tongue. And the angle is only 6 degrees between adjacent points. Detailed location distributions are shown in Figure 6.

4. Results and Analysis

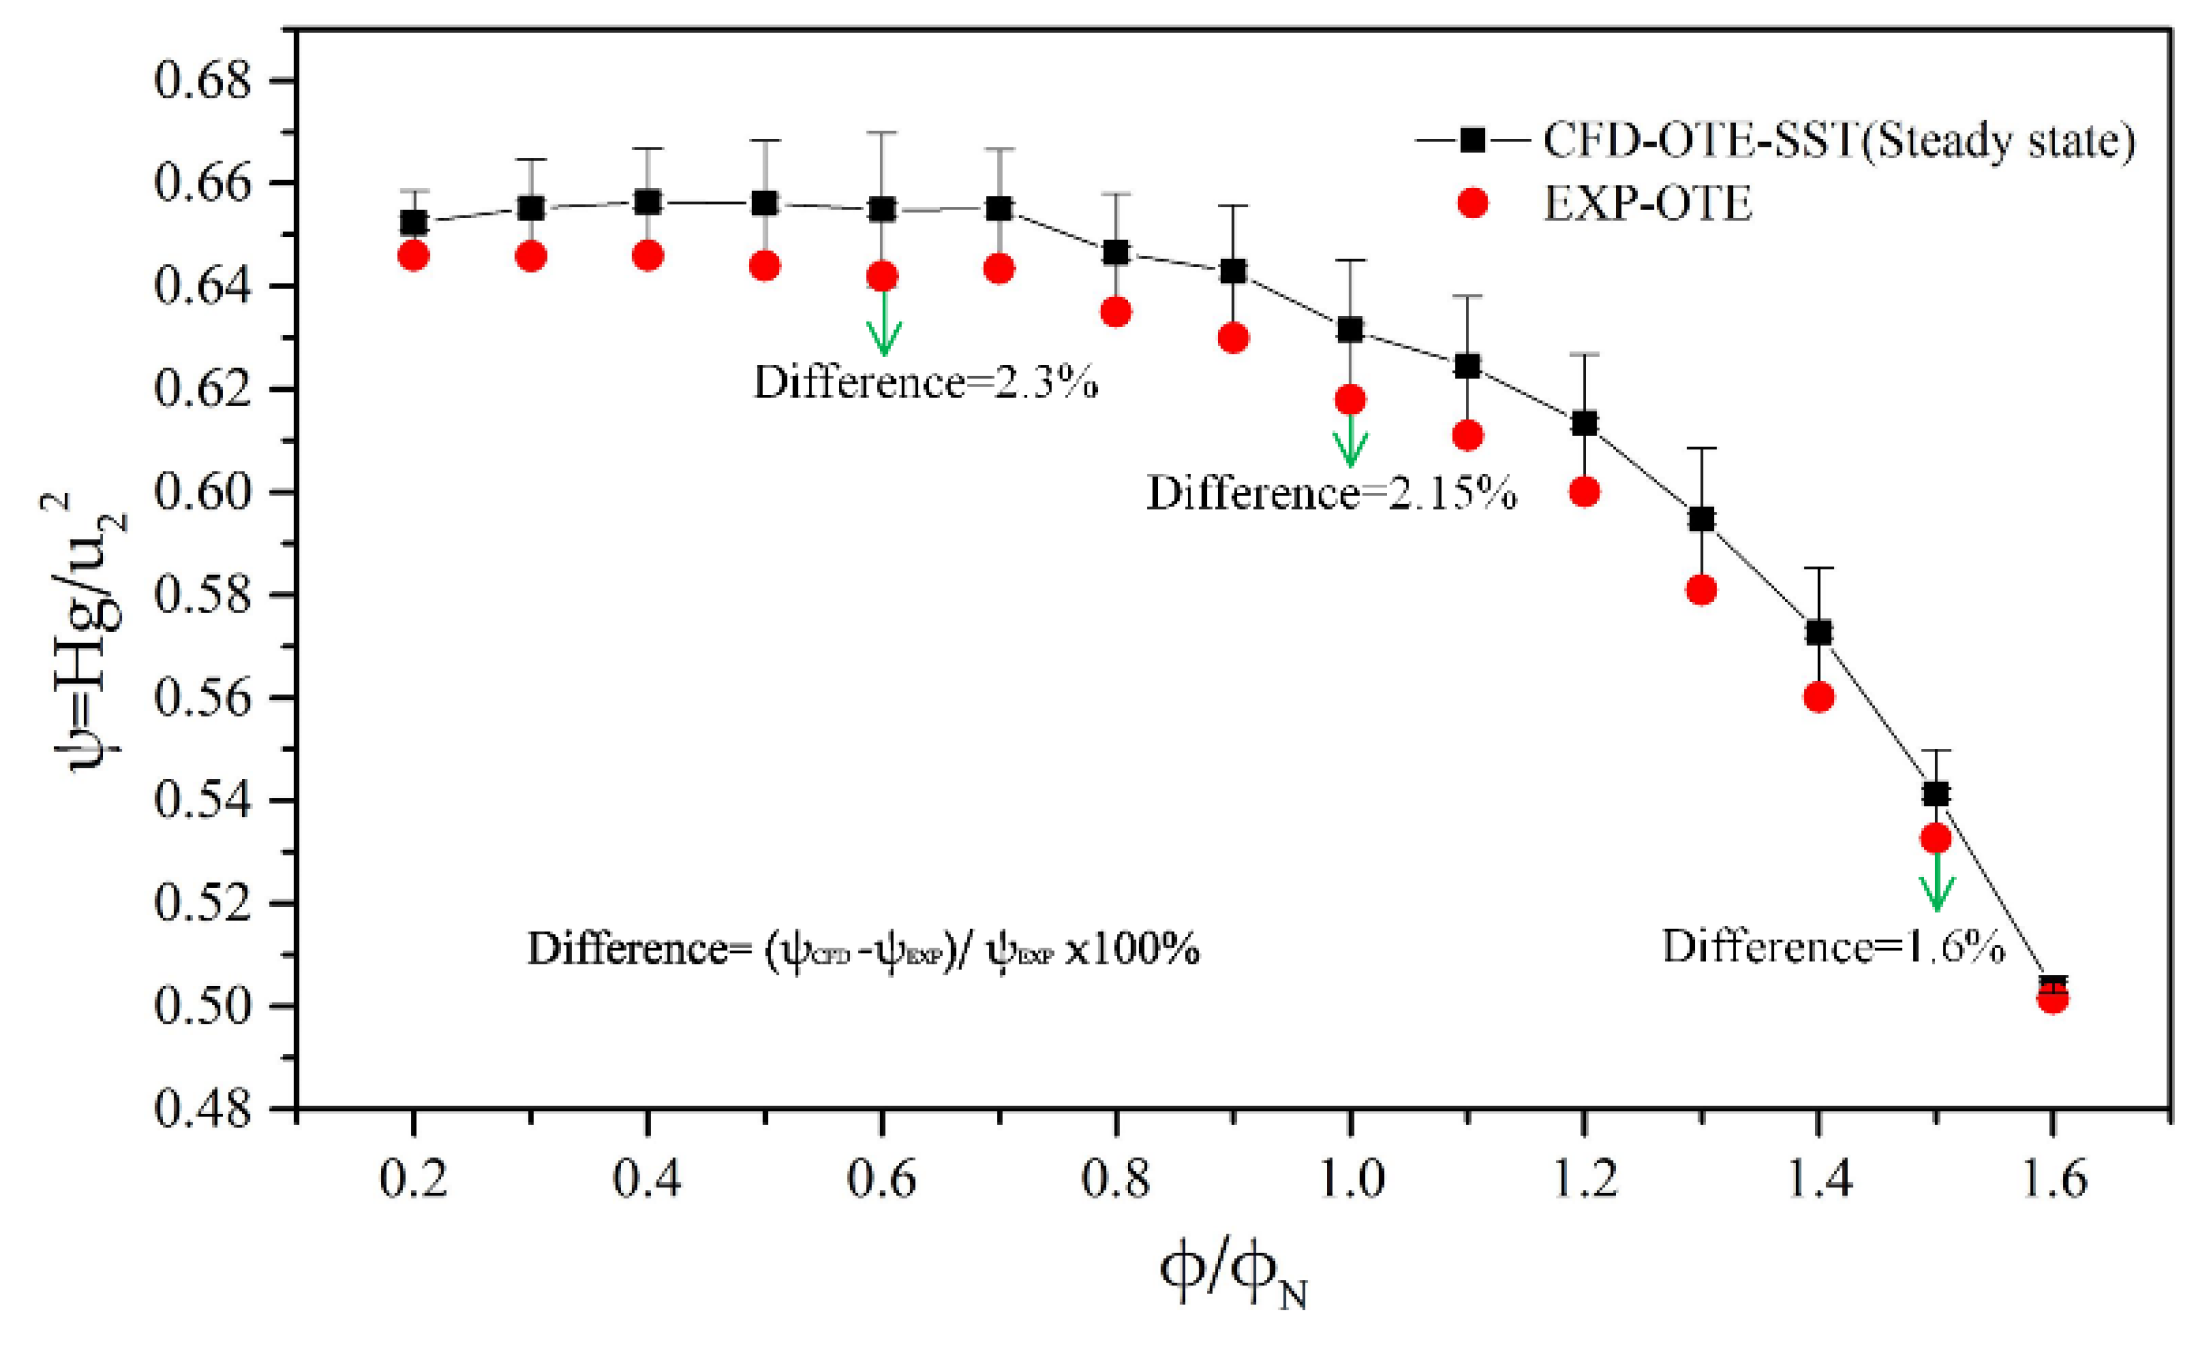
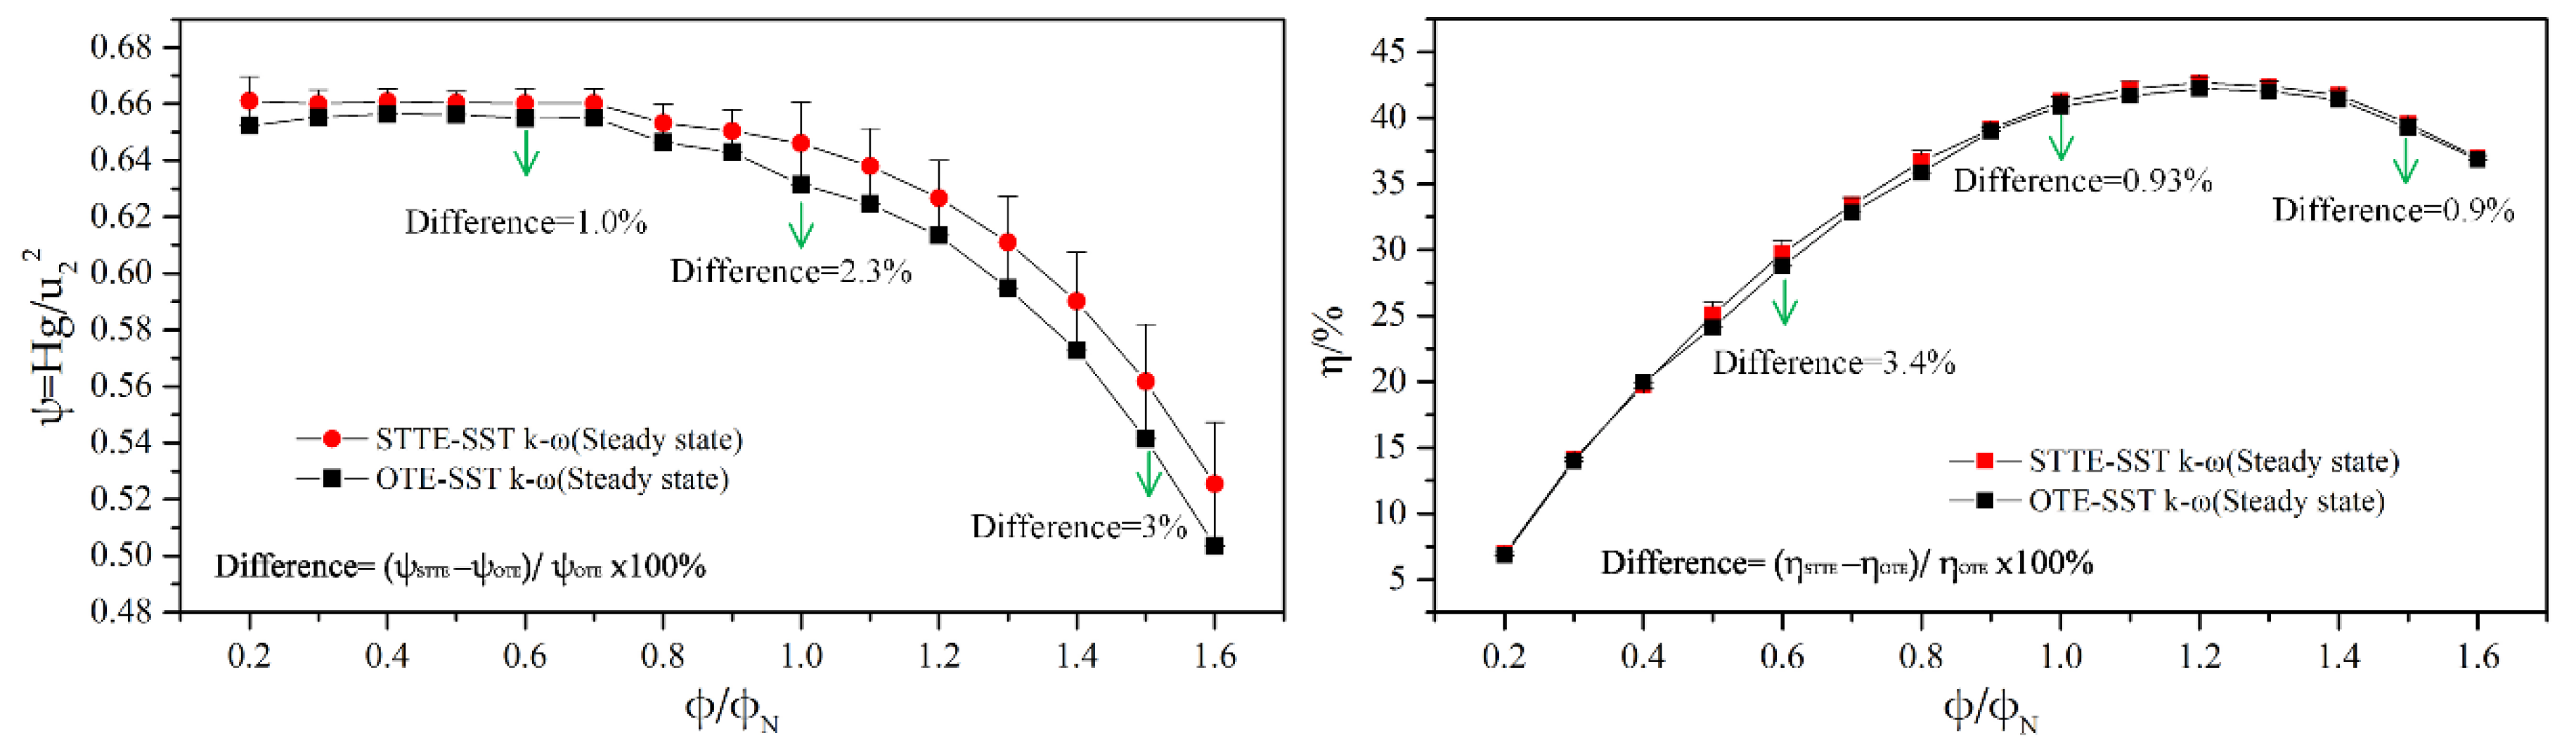
4.1. Performance Analysis of Two Test Pumps

Figure 7 shows the comparison of the numerical and tested head performance curve (φ-ψ) of the OTE pump to verify the accuracy of the calculation. The numerical results in Figure 7 are obtained by steady-state calculation using the SST k-ω model. The flow rates are tested from 0.2φN to 1.6φN. Due to the uncertainties of the pressure gauges, the experimental error was 0.2%. The amplitude of the error bar represents the difference of the OTE model pump between the simulated value and the experimental value under different operating conditions. In general, the trends are well consistent. At the nominal flow rate, the experimental and calculated head coefficient difference is 2.15%. Under the condition of large flow rates, the head coefficients of numerical simulation and the experiment are almost identical. The maximum calculation difference is less than 3%. The difference may be mainly due to the grid resolution and leakage problems. Meanwhile, the spectrum analysis of pressure is carried out and compared between the numerical simulation and experiment of the OTE pump. The experiment and CFD simulation are implemented at the nominal flow rate QN, and rotating speed of 3000 r/min. The CFD fluctuating pressure signals are obtained by transient simulation, and recorded by monitoring points set in the volute. The DES model is applied in the transient-state simulation. The pressure values from the last five revolutions are used for the Fast Fourier transform to get Figure 8. The number of pressure signals used for analysis is 1200. Obviously, the blade passing frequency (fBPF) and other harmonic frequencies can be clearly detected and distinguished. The theoretical blade passing frequency (fBPF) is 250 Hz. The calculated blade passing frequency (fBPF) is 249.02 Hz, the difference is 0.39%. The experimental blade passing frequency (fBPF) is 249.50 Hz, the difference is 0.2%. The cause for these difference is that the model pump has a certain degree of deviation during operation due to the influence of the motor, voltage, etc. It is believed that the current calculation model and method are reliable to obtain precise simulation results.
During the analysis of pressure spectra, the pressure value is dimensionless and expressed as Cp.
C p = 2 ( p p ¯ ) ρ u 2 2
where p and p ¯   represent the pressure sample values at each time step and time-average pressure, respectively. u2 is the circumferential speed at the impeller exit, ρ is the fluid density.
The performance of pumps are implemented under different flow rates from 0.2φN to 1.6φN. The CFD calculated results are obtained by steady-state simulation with the SST k-ω model. Figure 9 shows the head coefficient and efficiency curves of two blade trailing edge (BTE) profiles model pumps. The amplitude of the error bar represents the performance difference between the two model pumps under different operating conditions. For all relevant flow rates, the STTE profile pump is observed to have a better head hydraulic performance. Under the small flow conditions, there is little difference in the head performance, and the efficiency is almost constant. The difference in the head coefficient and efficiency between the two model pumps with the OTE and STTE profiles is about 2.3% and 0.93% at the nominal flow rate, respectively. The increase of the head and efficiency is due to the gentler flow of fluid from the STTE trailing edge. A typical wake-jet structure exists in the outlet area of the impeller, which causes the main energy loss of the centrifugal pump [49]. By modifying the trailing edge shape, the structure and frequency of the shedding vortex at the impeller exit are changed, and the development of the wake-jet structure is suppressed. It reduces the energy loss of the pump.

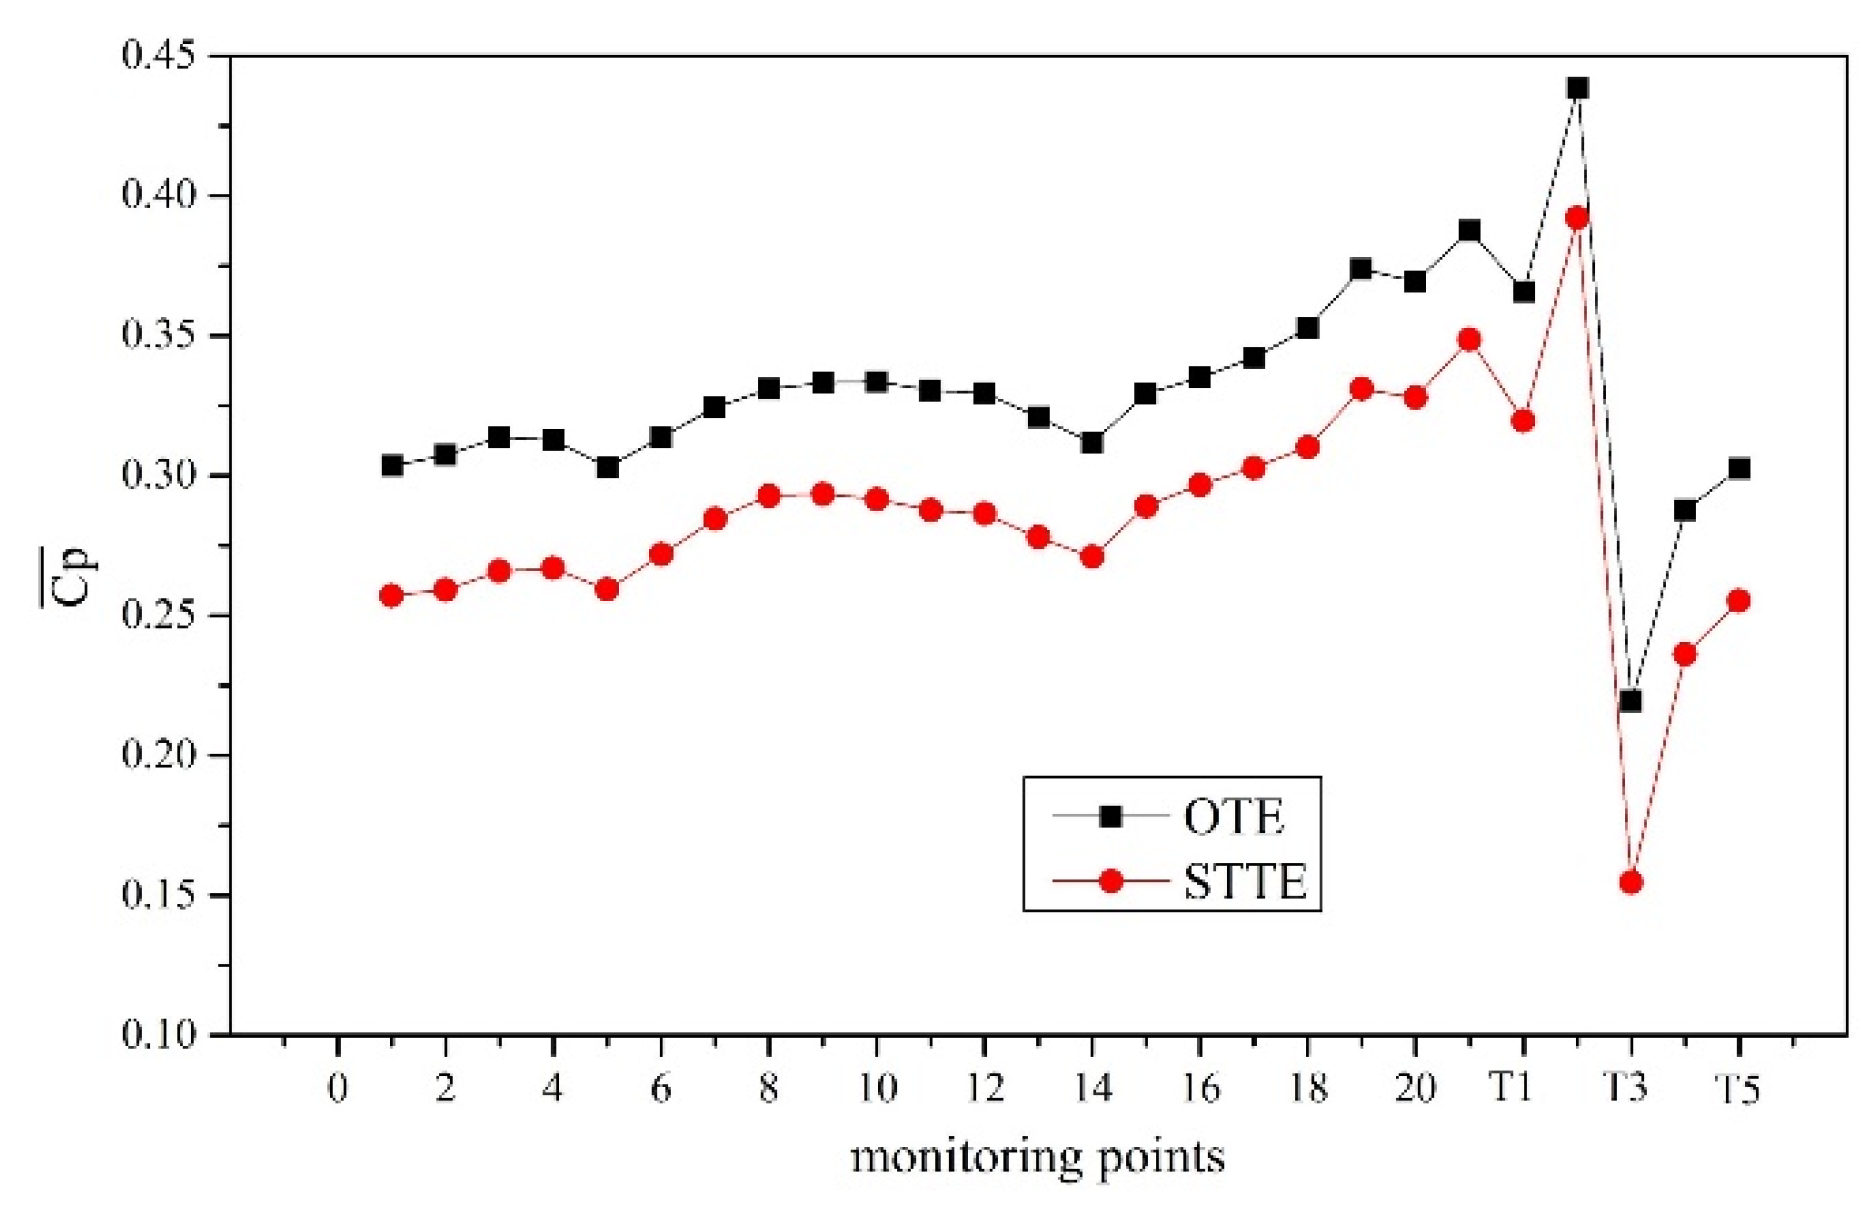
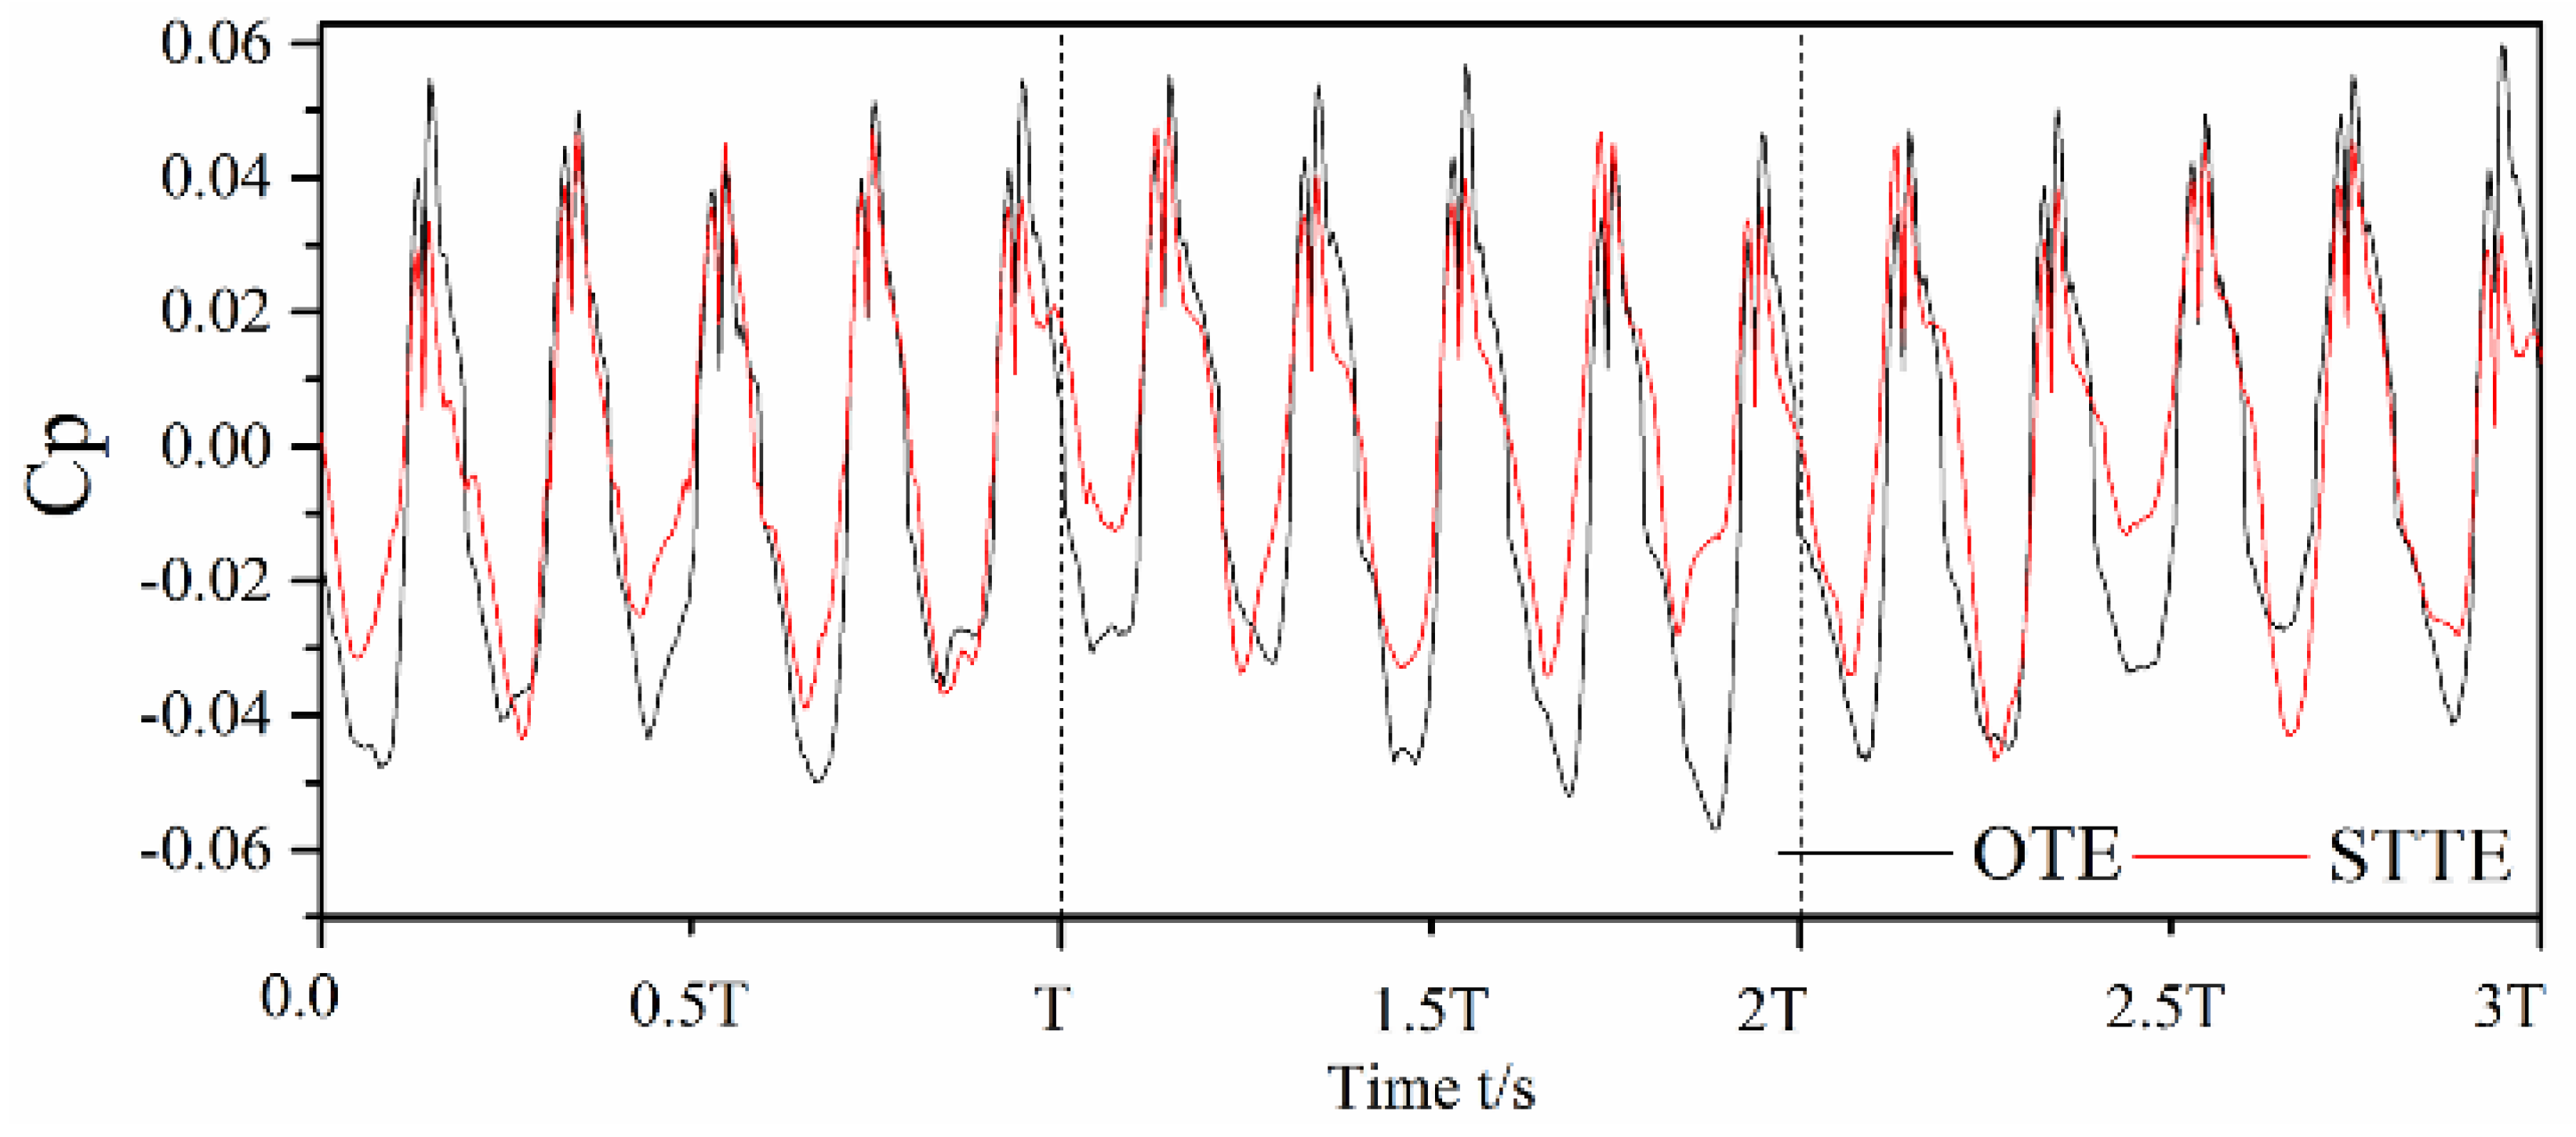
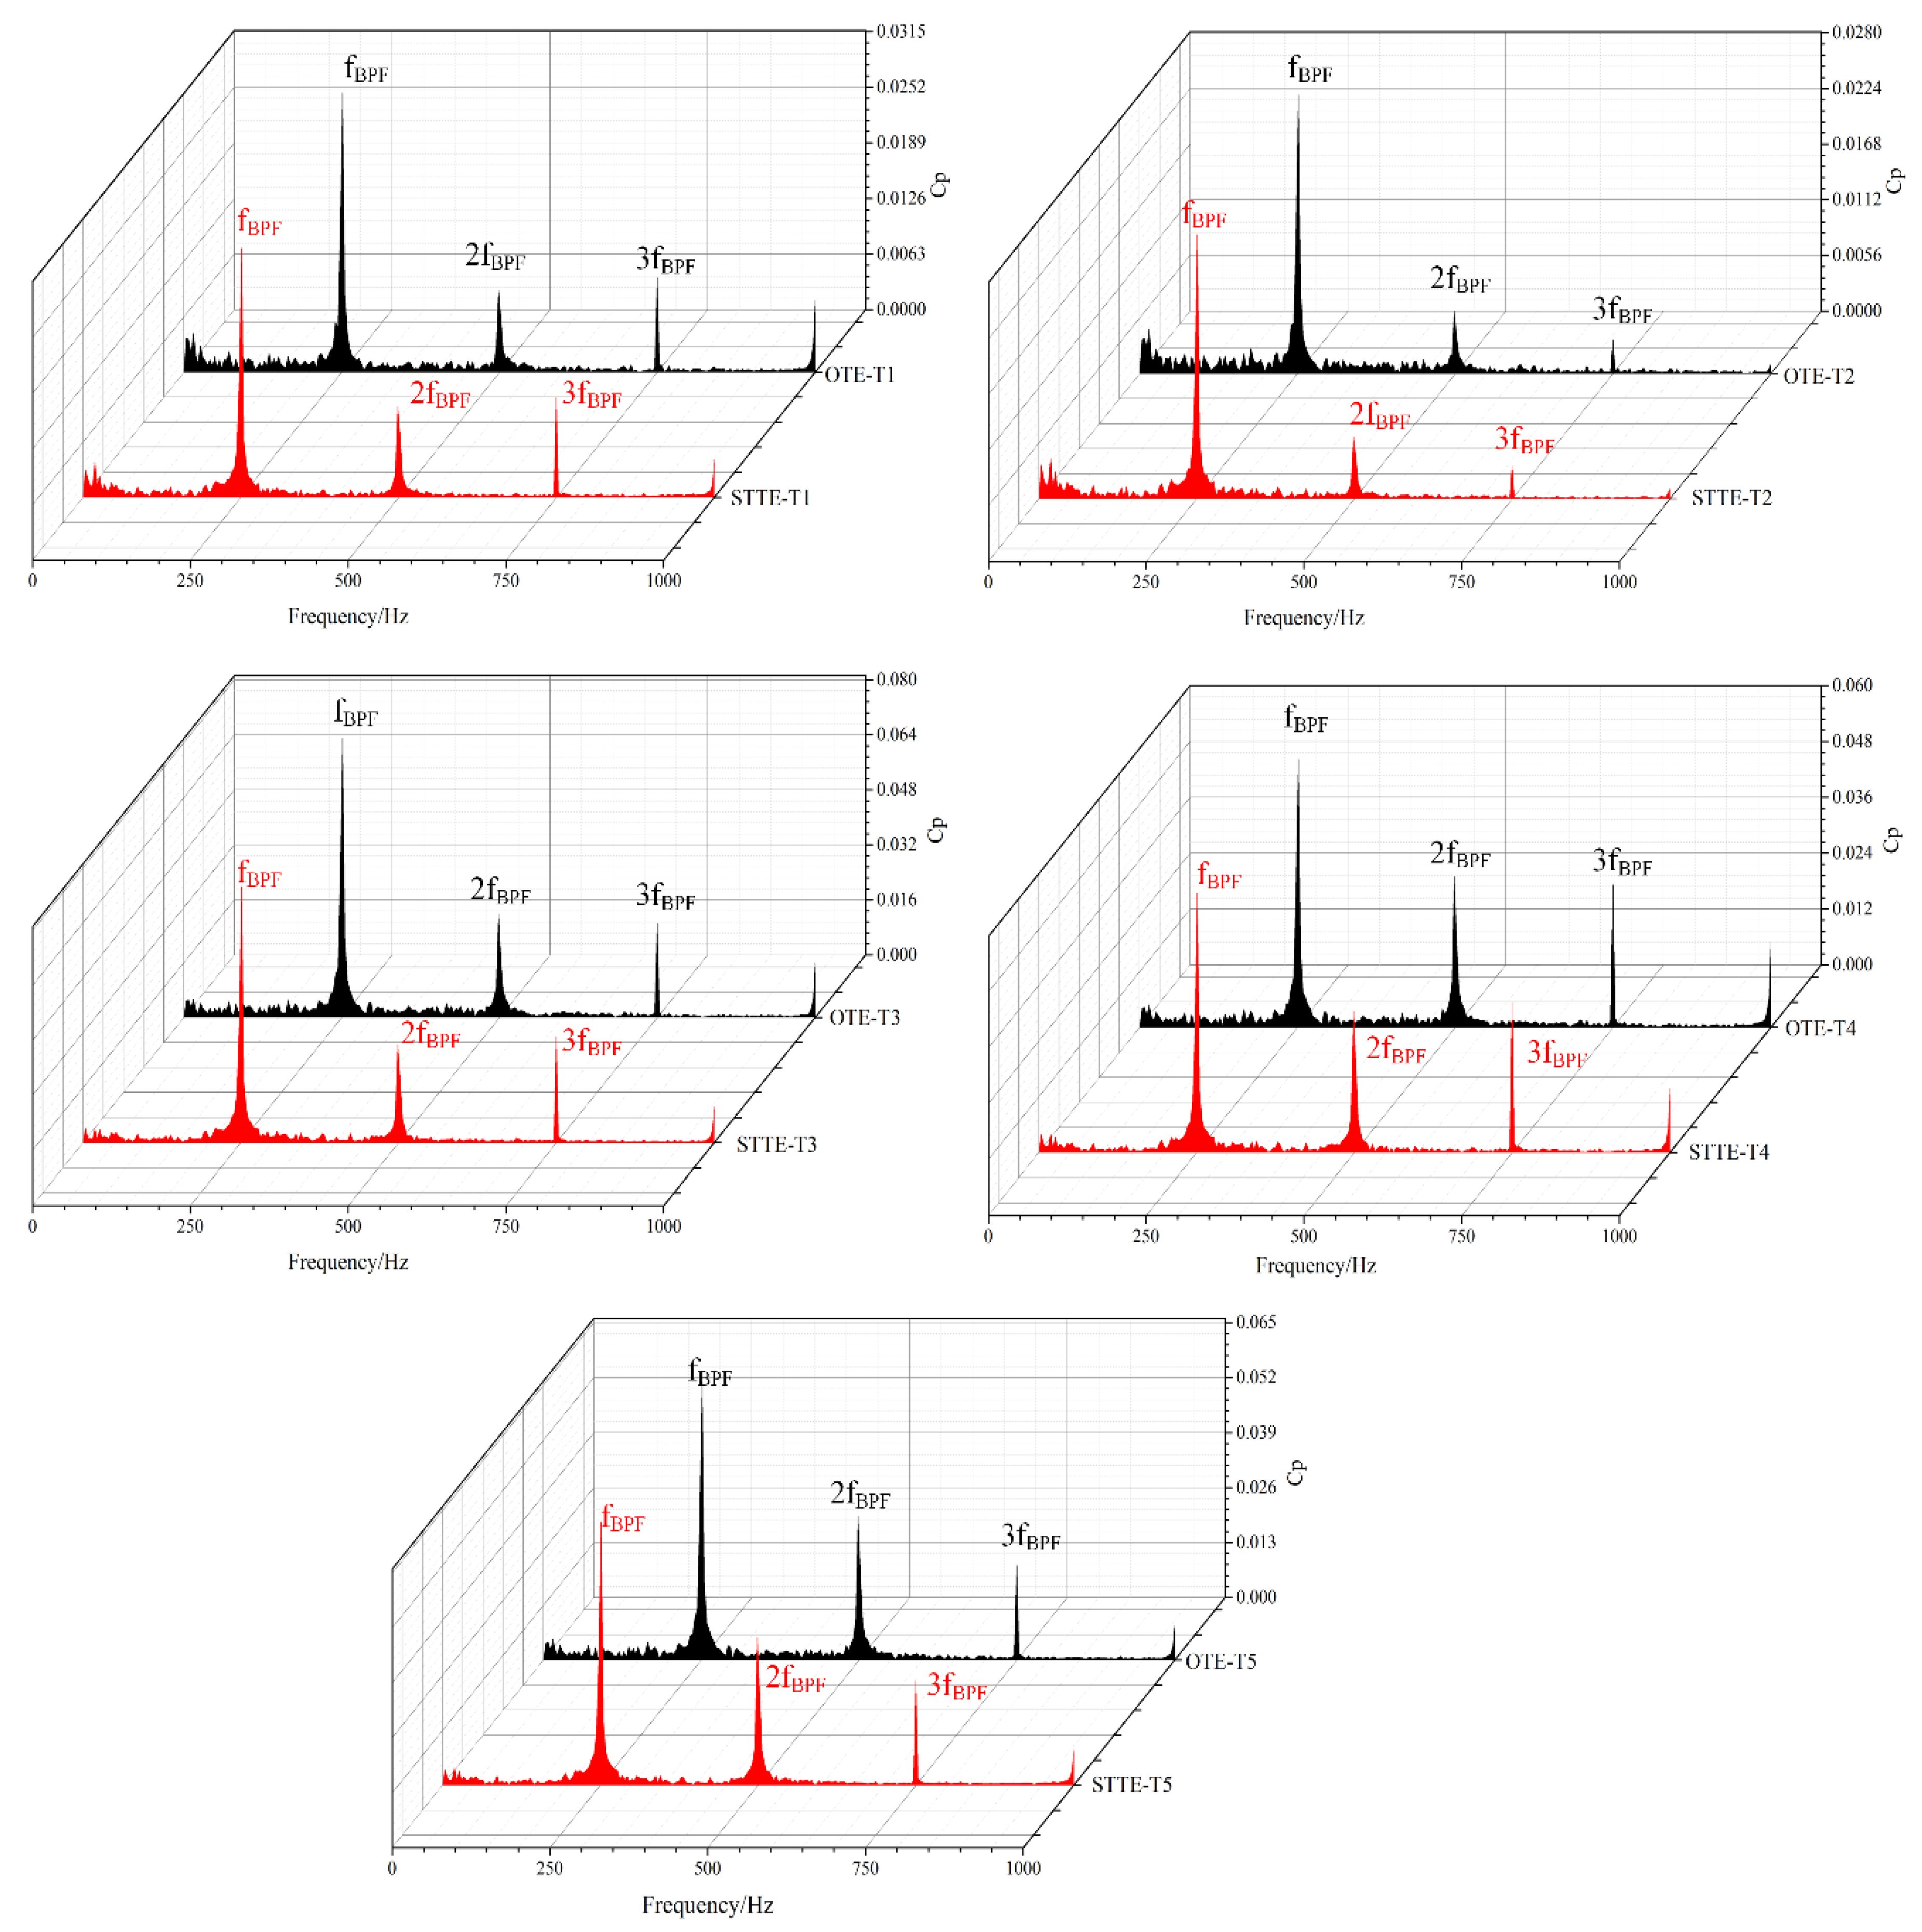
4.2. Pressure Pulsations for the Two Pumps

The pressure values are dimensionless to represent the pressure distribution in the pump cavity of the two models. The average pressure coefficient is expressed as   C p ¯ .
C p ¯ = 1 N i = 1 N p i 0.5 ρ u 2 2
where pi represents the pressure sample values at each time step, N represents the total number. We choose the pressure values of the last five revolutions to calculate. The value of N is 1200.
Figure 10 shows the pressure distribution of two model pumps in the volute at the nominal flow rate QN. No. Centrifugal pumps with two trailing edge profiles have a very similar variation in the circumferential pressure of the volute. However, the STTE profile has a smaller value at each monitoring point. The pressure value gradually increases from No.1, and the maximum value occurs at the region of the volute outlet. The maximum value of pressure is on monitoring point T2 and the minimum value of pressure is on monitoring point T3. This is because the shedding vortex on the blade hits the volute tongue and causes large pressure fluctuations [50,51,52,53].
To clearly explain how the STTE profile affects unsteady pulsations, the DES model is used in a transient-state simulation to capture the fluctuating pressure signals and the flow patterns. Figure 11 reveals the comparison of two impellers time domain pressure signals at the monitoring point T2 at the nominal flow rate coefficient φN. The pressure fluctuation curve of the three periods is shown in Figure 11. As observed, periodic pressure fluctuations are evident, and five distinct peak and valley values occur alternately in a cycle. It depends on the number of blades in the impeller. At the same time, the STTE profile has lower pressure signals than the OTE profile. Obviously, the model pump with the STTE profile has better pressure stability. It is worth noting that the STTE profile does have a more positive effect on the pressure pulsations.
For a better analysis of the effect of the blade BTE shapes on pressure fluctuation, the collected fluctuating pressure signals in the tongue region are converted into a spectrum using fast Fourier transform (FFT). The pressure values of the last five revolutions at the nominal flow rate are selected. The violent rotor–stator interaction occurs in the tongue area. We select five monitoring points (T1–T5) in the tongue area for frequency domain analysis. As can be seen from Figure 12, the primary excitation frequency is fBPF and its harmonic frequency 2fBPF and 3fBPF. The peak at fBPF always governs spectra analysis. Meanwhile, pressure coefficient amplitudes of T3, T4, and T5 are much higher than points T1 and T2, which indicates that the rotor–stator interaction is more intense in this region. This results from the small radial clearance between impeller and volute. The points T1 and T2 are far away from the volute tongue, so the rotor–stator interaction is less intense, which results in smaller pressure amplitudes. By comparing the pressure pulsation amplitudes between the two model pumps, the Cp of STTE at points T1–T5 are reduced by varying degrees at fBPF and its harmonic frequencies. In the low-frequency zone below fBPF, the model pump with the OTE shape has several more complex frequencies compared with STTE shape at the volute area. There are some more complicated flow structures in the OTE model pump, such as flow separation. Table 3 lists the contrast of the pressure coefficient Cp at blade passing frequency between two pumps.

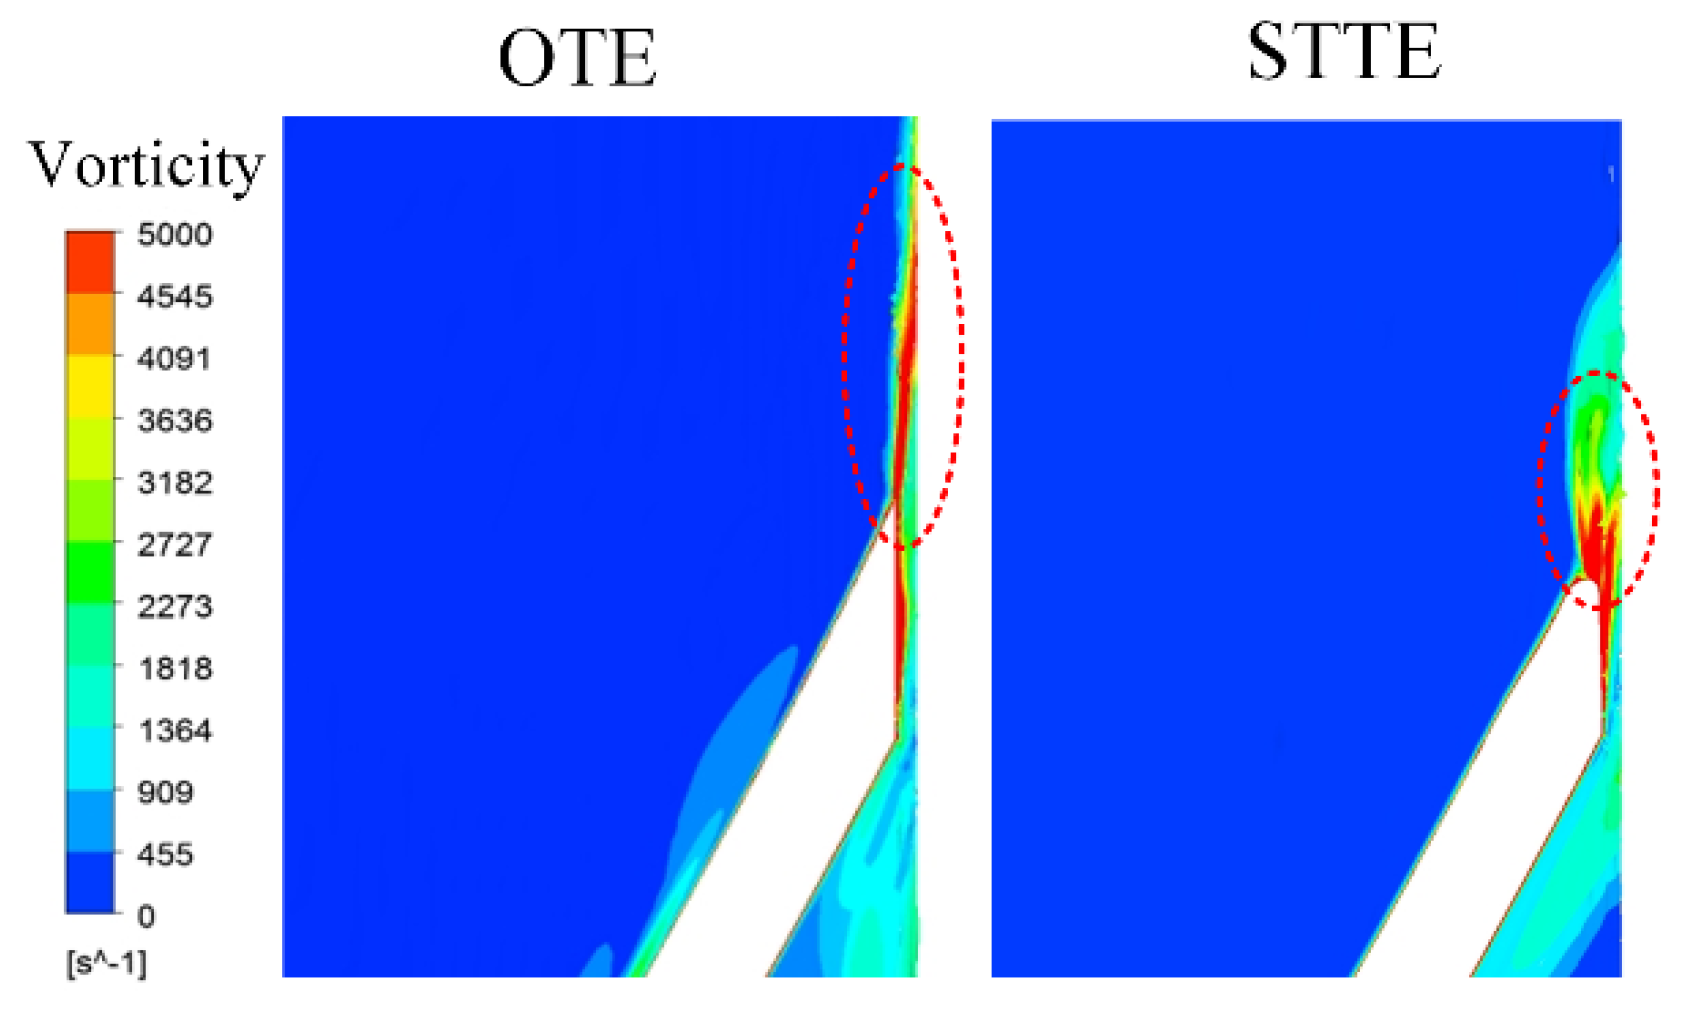
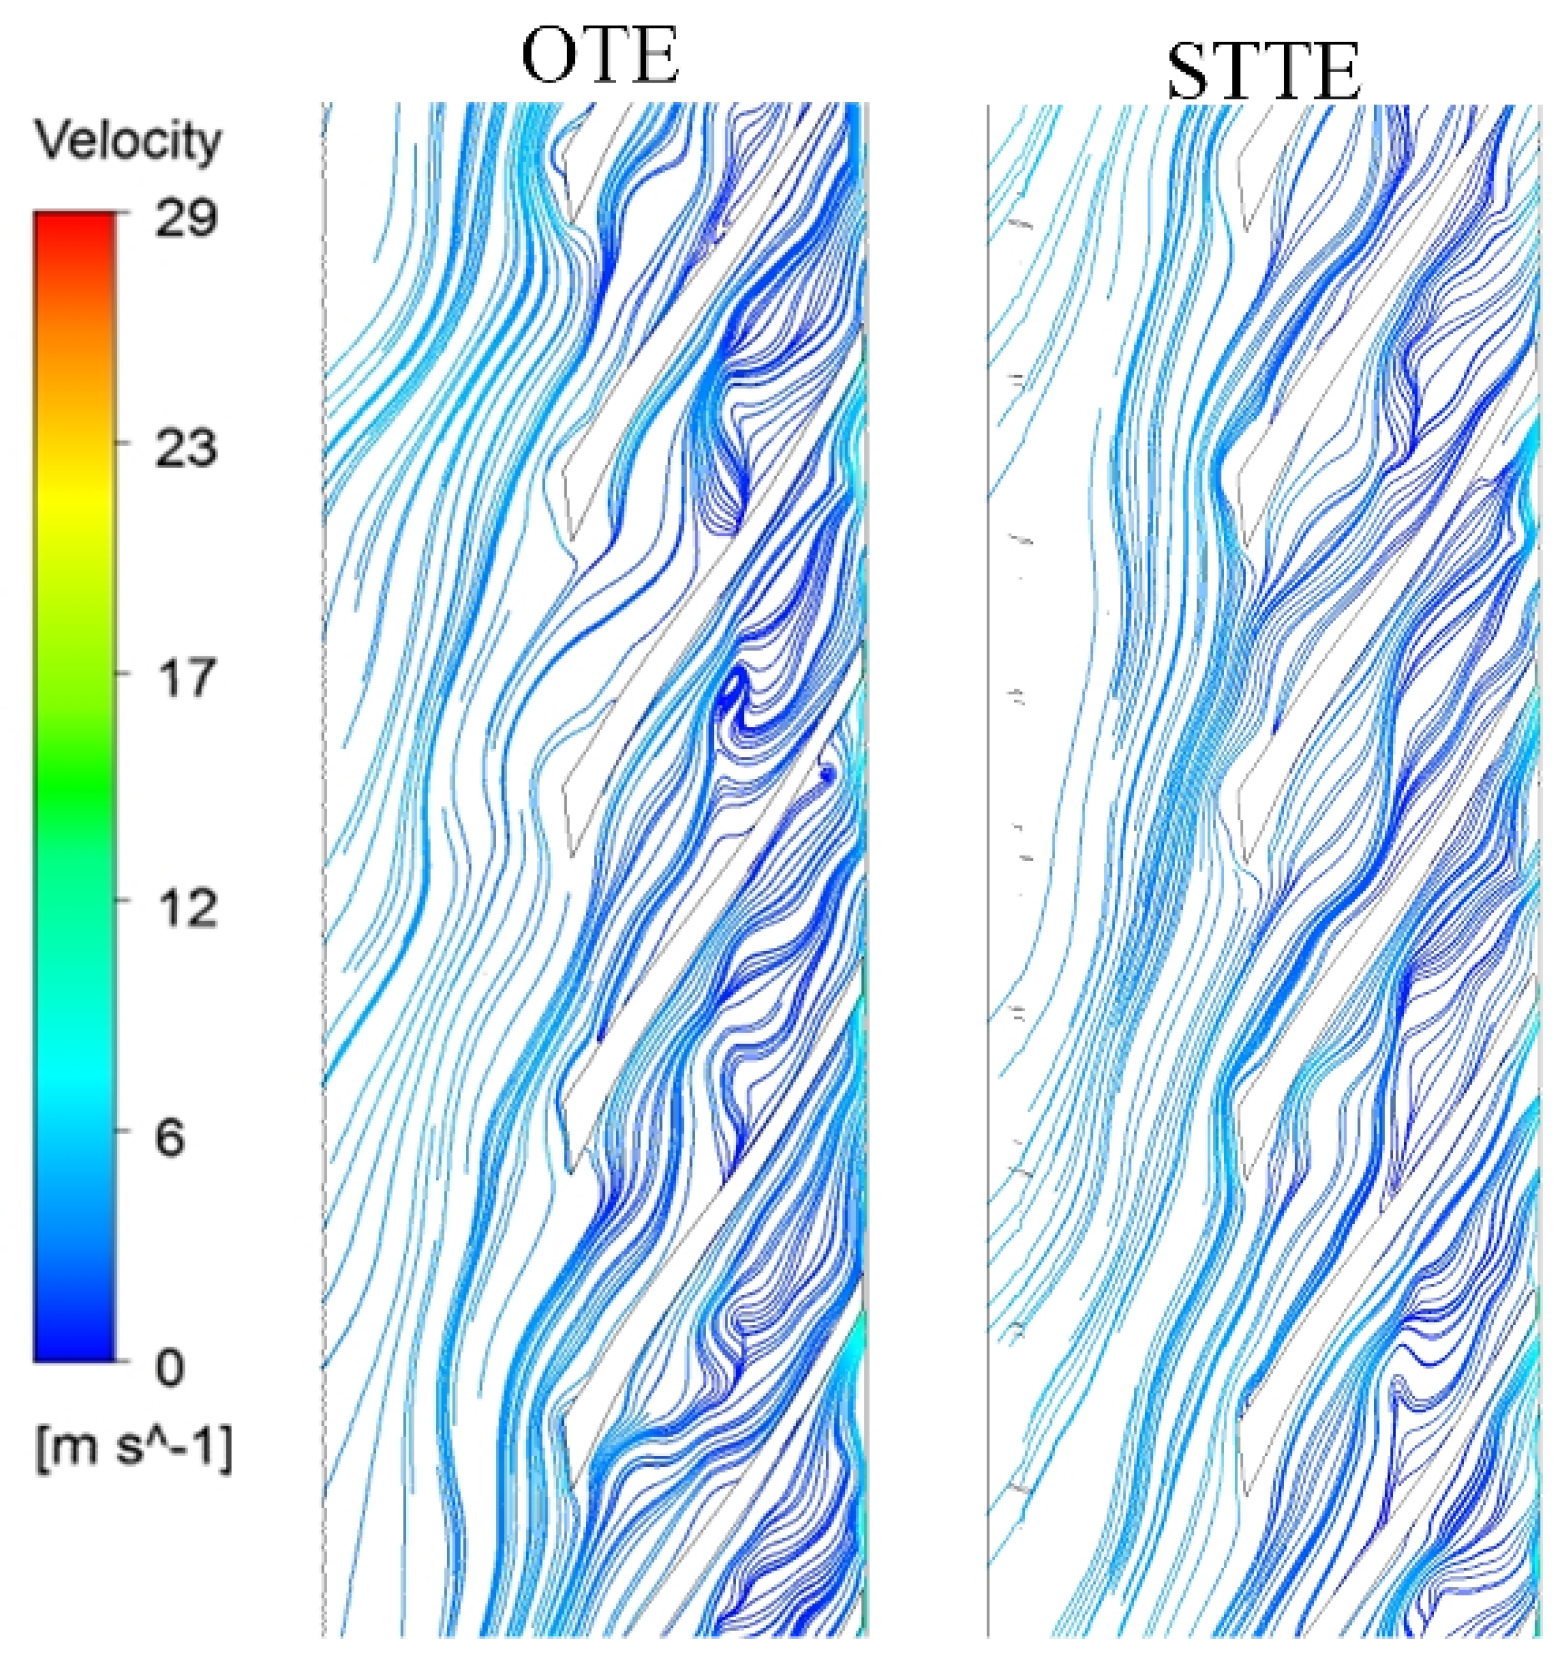
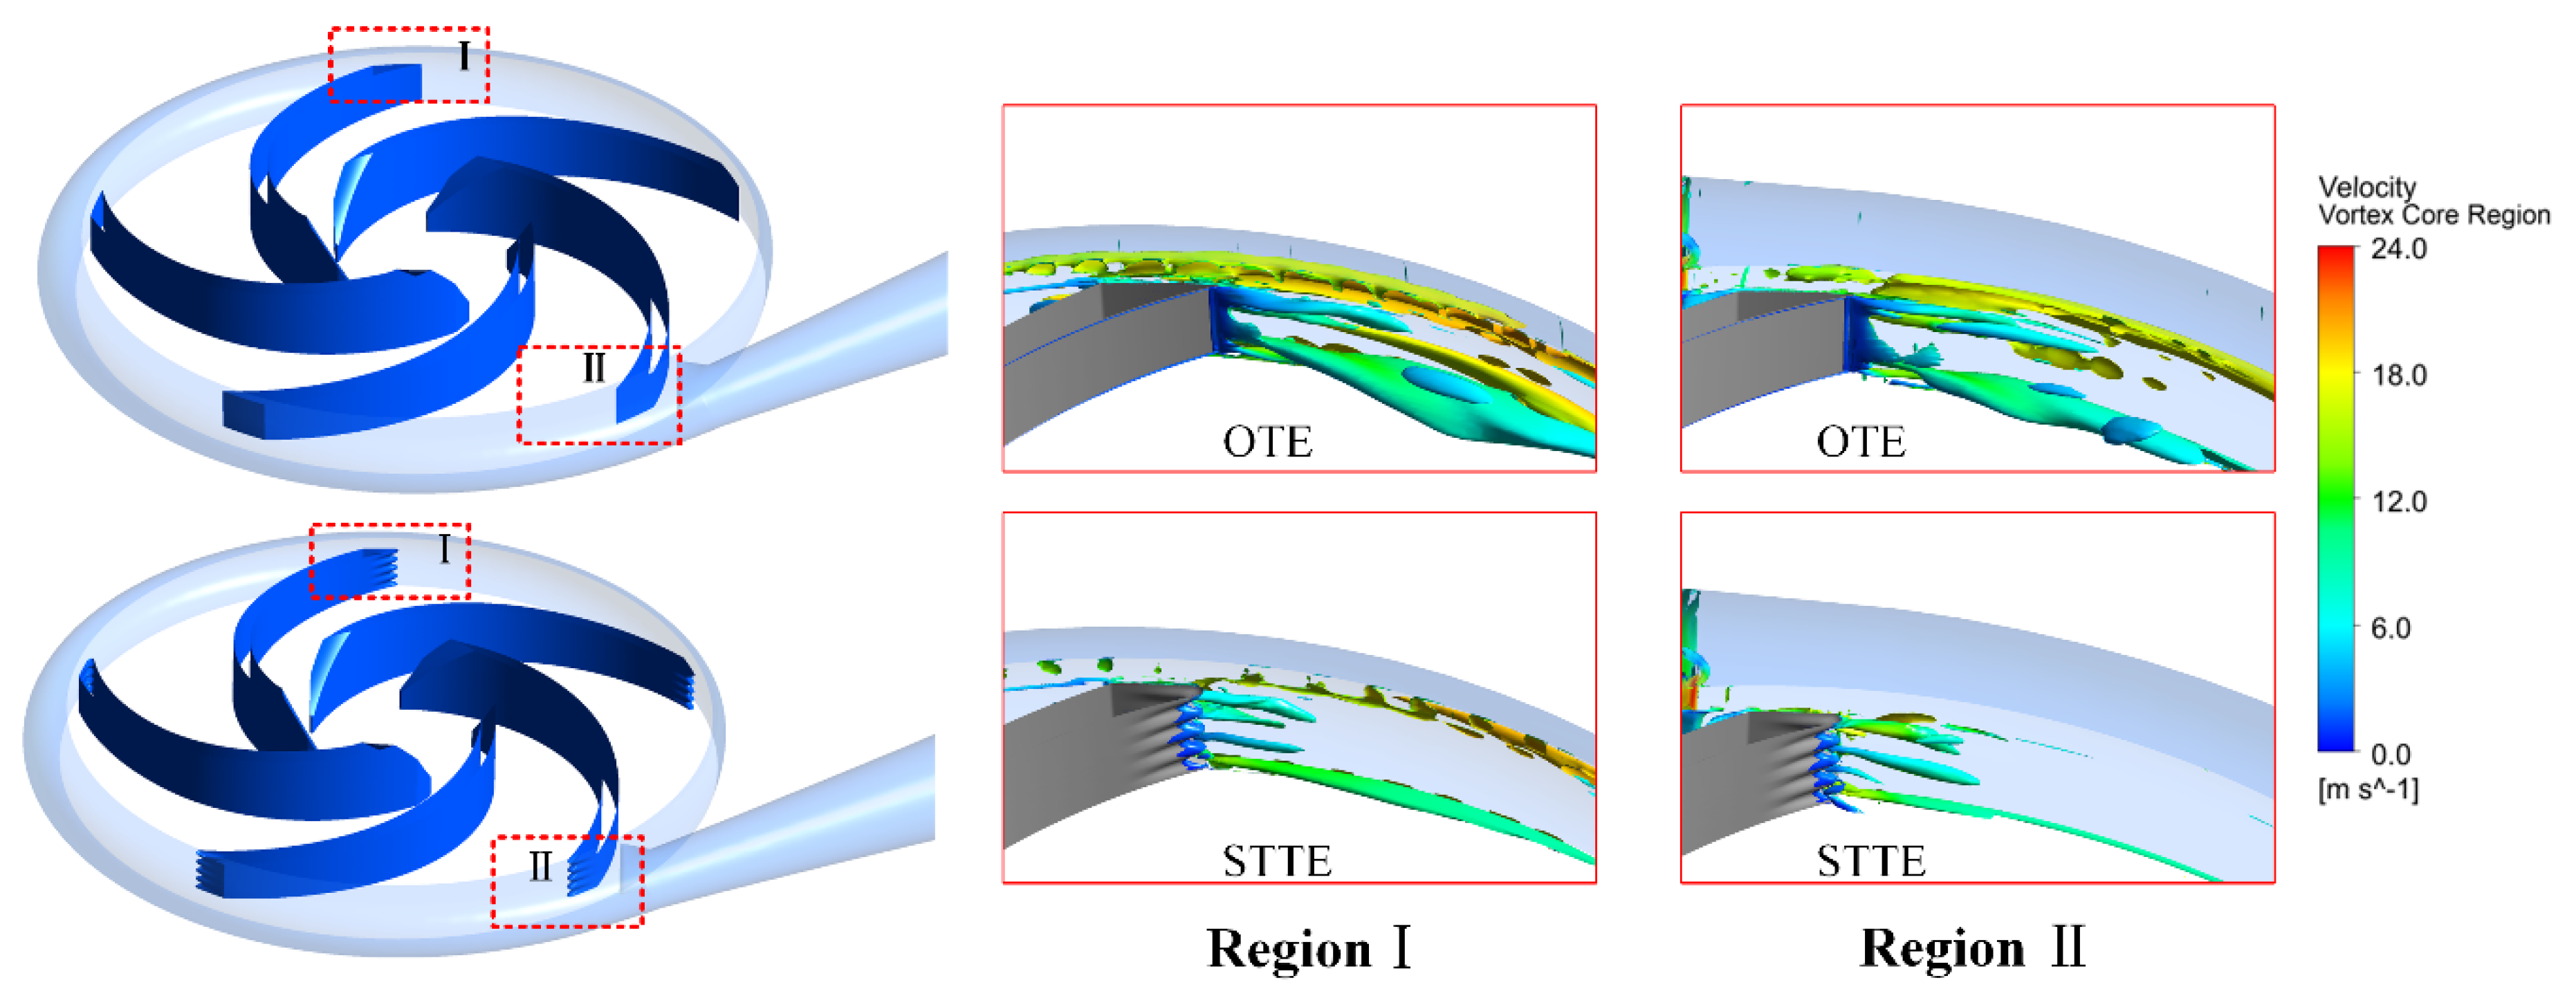
4.3. Flow Structures of Two Model Pumps

The internal flow field of the model pumps is analyzed to reveal the reasons for the pressure pulsation amplitude reduction at the nominal rate. In Figure 13, the vorticity contours of two model pumps at 50% span are shown. There are high vorticity areas at the inlet and outlet of the blade. One is associated with flow separation and the flow strike at the inlet region. The other one is produced by the wake-jet structure and shedding vortex. The rotor–stator interaction is very intense due to the hitting of the vortex shedding from the blade trailing edge with the volute tongue. Through comparing the vorticity contours of two BTE shapes, the vorticity of STTE is obviously more diminished than OTE in the blade inlet region. The shedding vortex is also weakened in the blade outlet region.
Figure 14 shows the partially enlarged view of vorticity contours at the blade trailing edge. The high vorticity area of the STTE impeller is shortened and the vorticity magnitude is also decreased. To further understand the internal flow pattern in the impeller, velocity streamlines are presented in Figure 15. It can be clearly distinguished that the STTE profile makes the flow field more uniform. For the OTE shape, flow field is quite disordered, and some vortices even occur on the pressure side of the blade. The STTE shape decreases flow separation in the blade inlet region and the middle flow channels.
In order to understand the mechanism of the STTE trailing edge improving the pump performance and pressure pulsation, and better identify the shedding vortex pattern at the impeller outlet, the vortex core distribution in the blade trailing edge (BTE) area is presented in Figure 16. As shown in Figure 16. Comparing the two model pumps, it is found that the structure of shedding vortex changed greatly in the impeller BTE region. The large intact vortexes shedding from the blade trailing edge are divided into several small vortexes by the STTE profile. The total vortex core region of the STTE model pump is significantly smaller than OTE model pump. The interaction of small vortexes with the volute is also weaker than with large vortexes. It is acceptable to control vortex shedding by modifying the trailing edge profile, which is very important for pressure stability.

5. Conclusions

In this paper, a five-blade centrifugal pump is tested and calculated to explore the effect of two BTE shapes on pressure fluctuation and performance. Time domains and frequency domains of the pressure pulsations are analyzed. Some relevant conclusions are drawn.
The impeller with the STTE profile shows better performance. The head and efficiency are increased by 2.3% and 0.93% at the nominal flow rate, respectively.
The model pump with the STTE shape has lower pressure pulsation amplitudes than the OTE shape at various monitoring points. The peak at fBPF always governs the pressure spectra. By comparison of two BTE profiles, the STTE profile makes the pressure pulsation amplitudes at fBPF reduces by varying degrees.
The vortex core distributions in the BTE region at the nominal flow rate show that the STTE shape divides the large vortex shedding from the BTE into several small vortices, which reduces the rotor–stator interaction. The internal flow of the STTE model pump becomes uniform. So, the pressure pulsation of the STTE pump is decreased. The impeller with STTE would provide a new design method to reduce pressure pulsation and improve the performance of pump.
Because this case only studied two models with specific design parameters, which may not be optimal designs, there may be little effect on efficiency. Different design parameters will be studied to find the optimal design in the future. The analysis in this paper is based on the application of STTE in a low-specific-speed centrifugal pump with low efficiency, and the conclusions might only be applicable to such a pump. The conclusions should be verified when applied to other pumps.

Author Contributions

Conceptualization, X.L.; formal analysis, B.L. and F.C.; experiment investigation, B.L., X.J., and H.F..; writing-original draft preparation, B.L.; writing-review and editing, X.L.

Funding

This research was funded by the National Natural Science Foundation of China, grant No.51776189 and U1709209, Zhejiang Province Science Foundation, grant No.LGG18E060005, and the Talent Project of Zhejiang Association for Science and Technology, grant No.2018YCGC013. The supports are gratefully acknowledged.

Conflicts of Interest

The authors declare no conflict of interest.

Nomenclature

D1Impeller entrance diameter [mm]
D2Impeller exit diameter [mm]
D3volute base circle diameter [mm]
QNominal flow rate [m3/h]
HNominal head [m]
B1Impeller inlet width [mm]
B2peller exit width [mm]
NNominal rotating speed [rpm]
ZImpeller blades number
CpPressure coefficient [= (pi- p ¯ )/(0.5 ρ u22)]
u2circumferential speed at the impeller exit [ = π D 2 n / 60 ] .
NsSpecific speed
ρFluid density [kg/m3]
C p ¯ Mean pressure coefficient
φFlow coefficient [Q/(u2R22)]
ψHead coefficient [Hg/u22]
ηEfficiency [%]
piMonitoring point pressure value [Hg/u22]
BTEblade trailing edge
STTEsinusoidal tubercle trailing edge
β1Blade inlet angle [°]
β2Blade outlet angle [°]
φNNominal flow rate coefficient
ψNNominal head coefficient

References

  1. Shankar, A.; Subramaniam, U.; Shanmugam, P.; Hanigovszki, N. A comprehensive review on energy efficiency enhancement initiatives in centrifugal pumping system. Appl. Energy 2016, 181, 495–513. [Google Scholar] [CrossRef]
  2. Majidi, K. Numerical Study of Unsteady Flow in a Centrifugal Pump. J. Turbomach. 2004, 127, 805–814. [Google Scholar]
  3. Li, X.; Jiang, Z.; Zhu, Z.; Si, Q.; Li, Y. Entropy generation analysis for the cavitating head-drop characteristic of a centrifugal pump. Proc. Inst. Mech. Eng. Part C 2018, 232, 4637–4646. [Google Scholar] [CrossRef]
  4. Bai, L.; Zhou, L.; Han, C.; Zhu, Y.; Shi, W. Numerical Study of Pressure Fluctuation and Unsteady Flow in a Centrifugal Pump. Processes 2019, 7, 354. [Google Scholar] [CrossRef]
  5. Fu, D.; Wang, F.; Zhou, P.; Xiao, R.; Yao, Z. Impact of Impeller Stagger Angles on Pressure Fluctuation for a Double-Suction Centrifugal Pump. Chin. J. Mech. Eng. 2018, 31, 10. [Google Scholar] [CrossRef] [Green Version]
  6. Wang, C.; Chen, X.; Qiu, N.; Yong, Z.; Shi, W. Numerical and experimental study on the pressure fluctuation, vibration, and noise of multistage pump with radial diffuser. J. Braz. Soc. Mech. Sci. Eng. 2018, 40, 481. [Google Scholar] [CrossRef]
  7. Fu, Q.; Yuan, S.; Zhu, R. Pressure Fluctuation of the Low Specific Speed Centrifugal Pump. Appl. Mech. Mater. 2012, 152–154, 935–939. [Google Scholar] [CrossRef]
  8. Cui, B.; Chen, D.; Xu, W.; Jin, Y.; Zhu, Z. Unsteady Flow Characteristic of Low-Specific-Speed Centrifugal Pump under Different Flow-Rate Conditions. J. Therm. Sci. 2015, 24, 17–23. [Google Scholar] [CrossRef]
  9. Zhang, W.; Yu, Y.; Zhu, S. Characteristic analysis on the pressure fluctuation in the impeller of a low specific speed mixed flow pump. IOP Mater. Sci. Eng. 2016, 129, 012035. [Google Scholar] [CrossRef] [Green Version]
  10. Fu, Y.X.; Yuan, J.P.; Yuan, S.Q.; Pace, G. Numerical and Experimental Analysis of Flow Phenomena in a Centrifugal Pump Operating Under Low Flow Rates. J. Fluids Eng. 2014, 137, 011102. [Google Scholar] [CrossRef]
  11. Pei, J.; Wang, W.J.; Yuan, S.Q. Statistical analysis of pressure fluctuations during unsteady flow for low-specific-speed centrifugal pumps. J. Cent South Univ. 2014, 21, 1017–1024. [Google Scholar] [CrossRef]
  12. Jafarzadeh, B.; Hajari, A.; Alishahi, M.M.; Akbari, M.H. The flow simulation of a low-specific-speed high-speed centrifugal pump. Appl. Math. Model. 2010, 35, 242–249. [Google Scholar] [CrossRef]
  13. Chu, S.; Dong, R.; Katz, J. Relation between Unsteady Flow, Pressure Fluctuations, and Noise in a Centrifugal Pump-Part B: Effects of Blade-tongue Interactions. J. Fluids Eng.-Trans. ASME 1997, 117, 30–35. [Google Scholar] [CrossRef]
  14. Chu, S.; Dong, R.; Katz, J. Relation between Unsteady Flow, Pressure Fluctuations, and Noise in a Centrifugal Pump-Part A: Use of PDV Date to Compute the Pressure Field. J. Fluids Eng.-Trans. ASME 1997, 117, 24–29. [Google Scholar] [CrossRef]
  15. Keller, J.; Blanco, E.; Barrio, R.; Parrondo, J. PIV Measurements of the Unsteady Flow Structures in a Volute Centrifugal Pump at a High Flow Rate. Exp. Fluids 2014, 55, 1820. [Google Scholar] [CrossRef]
  16. Jia, X.; Cui, B.; Zhu, Z.; Yu, X. Numerical Investigation of Pressure Distribution in a Low Specific Speed Centrifugal Pump. J. Therm. Sci. 2018, 27, 25–33. [Google Scholar] [CrossRef]
  17. Heskestad, G.; Olberts, D.R. Influence of Trailing-Edge Geometry on Hydraulic-Turbine-Blade Vibration Resulting From Vortex Excitation. J. Eng. Power 1960, 82, 103. [Google Scholar] [CrossRef]
  18. Gao, B.; Zhang, N.; Li, Z.; Ni, D.; Yang, M. Influence of the Blade Trailing Edge Profile on the Performance and Unsteady Pressure Pulsations in a Low Specific Speed Centrifugal Pump. J. Fluids Eng.-Trans. ASME 2016, 138, 051106. [Google Scholar] [CrossRef]
  19. Spence, H.; Aaral-Teixeira, I. Investigation into pressure pulsations in a centrifugal pump using numerical methods supported by industrial tests. Comput. Fluids 2008, 37, 690–704. [Google Scholar] [CrossRef]
  20. Solis, M.; Bakir, F.; Khelladi, S.; Noguera, R. Numerical Study on Pressure Fluctuations Reduction in Centrifugal Pumps: Influence of Radial Gap and Splitter Blades. ISRN Mech. Eng. 2011, 2011, 479594. [Google Scholar] [CrossRef]
  21. Amir, J.; Hossein, A. Impeller and volute design and optimization of the centrifugal pump with low specific speed in order to extract performance curves. JCAMECH 2018, 49, 359–366. [Google Scholar]
  22. Zhu, B.; Chen, H. Cavitation suppression of low specific speed centrifugal pump with gap drainage blades. J. Hydrodyn. 2012, 24, 729–736. [Google Scholar] [CrossRef]
  23. Khalifa, A.E. Effect of Blade Exit Shape on Performance and Vibration of a Double Volute Centrifugal Pump. Int. J. Mater. Mech. Manuf. 2014, 2, 261–264. [Google Scholar] [CrossRef]
  24. Binama, M.; Su, W.; Cai, W.; Li, B.; Alexis, M.; Li, B.; Emmanuel, B. Blade trailing edge position influencing pump as turbine (PAT) pressure field under part-load conditions. Renew. Energy 2019, 136, 33–47. [Google Scholar] [CrossRef]
  25. Xue, G.; Liu, Y.; Zhang, M.; Ding, H. Numerical Analysis of Hydrodynamics for Bionic Oscillating Hydrofoil Based on Panel Method. Appl. Bionics Biomech. 2016, 2016, 6909745. [Google Scholar] [CrossRef] [PubMed]
  26. Xin, H.; Zhang, C.; Wei, J.; Hu, X.; Wei, H. Wind turbine bionic blade design and performance analysis. J. Vis. Commun. Image Represent. 2019, 60, 258–265. [Google Scholar]
  27. Yang, Z.; Li, G.; Song, Y.; Bai, Y. Effects of setting angle and chord length on performance of four blades bionic wind turbine. IOP Earth Environ. Sci. 2017, 93, 012041. [Google Scholar] [CrossRef]
  28. Shi, W.; Atlar, M.; Norman, R.; Aktas, B.; Turkmen, S. Numerical optimization and experimental validation for a tidal turbine blade with leading-edge tubercles. Renew. Energy 2016, 96, 42–55. [Google Scholar] [CrossRef] [Green Version]
  29. Gu, Y.; Pei, J.; Yuan, S. Clocking effect of vaned diffuser on hydraulic performance of high-power pump by using the numerical flow loss visualization method. Energy 2019, 170, 986–997. [Google Scholar] [CrossRef]
  30. Cheng, H.Y.; Bai, X.R.; Long, X.P.; Ji, B.; Peng, X.X.; Farhat, M. Large eddy simulation of the tip-leakage cavitating flow with an insight on how cavitation influences vorticity and turbulence. Appl. Math. Model. 2019, 77, 788–809. [Google Scholar] [CrossRef]
  31. Wang, C.; Shi, W.; Wang, X. Optimal design of multistage centrifugal pump based on the combined energy loss model and computational fluid dynamics. Appl. Energy 2017, 187, 10–26. [Google Scholar] [CrossRef]
  32. Li, D.; Fu, X.; Zuo, Z.; Wang, H.; Li, Z.; Liu, S.; Wei, X. Investigation methods for analysis of transient phenomena concerning design and operation of hydraulic-machine systems-A review. Renew. Sustain. Energ Rev. 2019, 101, 26–46. [Google Scholar] [CrossRef]
  33. Zhang, Y.; Chen, T.; Li, J.; Yu, J. Experimental study of load variations on pressure fluctuations in a prototype reversible pump turbine in generating mode. ASME J. Fluids Eng. 2017, 139, 074501. [Google Scholar] [CrossRef]
  34. Liu, M.; Tan, L.; Cao, S. Cavitation–vortex–turbulence interaction and one-dimensional model prediction of pressure for hydrofoil ALE15 by large eddy simulation. ASME J. Fluids Eng. 2019, 141, 021103. [Google Scholar] [CrossRef]
  35. Huang, B.; Qiu, S.; Li, X.; Wu, Q.; Wang, G. A review of transient flow structure and unsteady mechanism of cavitating flow. J. Hydrodyn. 2019, 31, 429–444. [Google Scholar] [CrossRef]
  36. Yousefi, H.; Noorollahi, Y.; Tahani, M.; Fahimi, R.; Saremian, S. Numerical simulation for obtaining optimal impeller’s blade parameters of a centrifugal pump for high-viscosity fluid pumping. Sustain. Energy Technol. Assess. 2019, 34, 16–26. [Google Scholar] [CrossRef]
  37. Yi, S.; Zhu, H.; Zhang, J. Experiment and numerical study of a new generation three-stage multiphase pump. J. Pet. Sci. Eng. 2018, 169, 471–484. [Google Scholar]
  38. Pei, J.; Zhang, F.; Appiah, D.; Hu, B.; Yuan, S.; Chen, K.; Asomani, S.N. Performance Prediction Based on Effects of Wrapping Angle of a Side Channel Pump. Energies 2019, 12, 139. [Google Scholar] [CrossRef]
  39. Wang, C.; Hu, B.; Zhu, Y.; Wang, X.; Luo, C.; Cheng, L. Numerical Study on the Gas-Water Two-Phase Flow in the Self-Priming Process of Self-Priming Centrifugal Pump. Processes 2019, 7, 330. [Google Scholar] [CrossRef]
  40. Li, X.; Gao, P.; Zhu, Z.; Li, Y. Effect of the blade loading distribution on hydrodynamic performance of a centrifugal pump with cylindrical blades. J. Mech. Sci. Technol. 2018, 32, 1161–1170. [Google Scholar] [CrossRef]
  41. Xu, C.; Chen, L.; Lu, X. Large-eddy and detached-eddy simulations of the separated flow around a circular cylinder. J. Hydrodyn. 2007, B19, 559–563. [Google Scholar] [CrossRef]
  42. Lin, D.; Su, X.; Yuan, X. DDES Analysis of the Wake Vortex Related Unsteadiness and Losses in the Environment of a High-Pressure Turbine Stage. ASME J. Turbomach. 2018, 140, 041001. [Google Scholar] [CrossRef]
  43. Wei, Y.; Yang, H.; Lin, Z.; Wang, Z.; Qian, Y. A novel two-dimensional coupled lattice Boltzmann model for thermal incompressible flows. Appl. Math. Comput. 2018, 339, 556–567. [Google Scholar] [CrossRef]
  44. Liu, Q.; Ye, J.; Zhang, G.; Lin, Z.; Xu, H.; Zhu, Z. Metrological performance investigation of swirl flowmeter affected by vortex inflow. J. Mech. Sci. Technol. 2019, 33, 1–10. [Google Scholar] [CrossRef]
  45. Zhang, W.; Li, X.; Zhu, Z. Quantification of wake unsteadiness for low-Re flow across two staggered cylinders. Proc. Inst. Mech. Eng. Part C JMES 2019, 233, 0954406219866478. [Google Scholar] [CrossRef]
  46. Zhang, S.; Li, X.; Hu, B.; Liu, Y.; Zhu, Z. Numerical investigation of attached cavitating flow in thermo-sensitive fluid with special emphasis on thermal effect and shedding dynamics. Int. J. Hydrog. Energy 2019, 44, 3170–3184. [Google Scholar] [CrossRef]
  47. Liu, Q.; Ye, J.; Zhang, G.; Lin, Z. Study on the metrological performance of a swirlmeter affected by flow regulation with a sleeve valve. Flow Meas. Instrum. 2019, 67, 83–94. [Google Scholar] [CrossRef]
  48. Wang, W.; Osman, M.K.; Pei, J.; Gan, X.; Yin, T. Artificial Neural Networks Approach for a Multi-Objective Cavitation Optimization Design in a Double-Suction Centrifugal Pump. Processes 2019, 7, 246. [Google Scholar] [CrossRef]
  49. Zhang, N.; Liu, X.; Gao, B.; Xia, B. DDES analysis of the unsteady wake flow and its evolution of a centrifugal pump. Renew. Energy 2019, 141, 570–582. [Google Scholar] [CrossRef]
  50. Wang, C.; He, X.; Shi, W.; Wang, X.; Wang, X.L.; Qiu, N. Numerical study on pressure fluctuation of a multistage centrifugal pump based on whole flow field. AIP Adv. 2019, 9, 035118. [Google Scholar] [CrossRef] [Green Version]
  51. Li, D.; Wang, H.; Qin, Y. Mechanism of High Amplitude Low Frequency Fluctuations in a Pump-Turbine in Pump Mode. Renew. Energy 2018, 126, 668–680. [Google Scholar] [CrossRef]
  52. Liu, Y.; Tan, L. Tip clearance on pressure fluctuation intensity and vortex characteristic of a mixed flow pump as turbine at pump mode. Renew. Energy 2018, 129, 606–615. [Google Scholar] [CrossRef]
  53. Lun, Y.; Lin, L.; He, H.; Zhu, Z.; Wei, Y. Effects of Vortex Structure on Performance Characteristics of a Multiblade Fan with Inclined tongue. Proc. Inst. Mech. Eng. Part A J. Power Energy 2019, 233, 0957650919840964. [Google Scholar] [CrossRef]
Figure 1. The geometry of the test model pump impeller and volute.
Processes 07 00625 g001
Figure 2. Differences between two trailing edges: (a) original trailing edge (OTE), (b) sinusoidal tubercle trailing edge (STTE), (c) blade outlet section
Processes 07 00625 g002
Figure 3. Closed test platform and model pump.
Processes 07 00625 g003
Figure 4. Computational domain and the test STTE impeller.
Processes 07 00625 g004
Figure 5. Structured hexahedral mesh of the impeller and volute.
Processes 07 00625 g005
Figure 6. Location of monitoring points.
Processes 07 00625 g006
Figure 7. Numerical and experimental results comparison of the OTE model pump.
Processes 07 00625 g007
Figure 8. Comparison of experimental and numerical pressure spectra of OTE pump at the nominal flow rate at monitoring point16 and T2.
Processes 07 00625 g008
Figure 9. Numerical calculation results comparison of two model pumps (steady-state, SST k-ω).
Processes 07 00625 g009
Figure 10. Pressure distribution of two model pumps at the nominal flow rate coefficient φN.
Processes 07 00625 g010
Figure 11. Time-domain pressure pulsations at point T2 at the nominal flow rate coefficient φN.
Processes 07 00625 g011
Figure 12. Frequency-domain pressure pulsations at points T1–T5 at the nominal flow rate coefficient φN.
Processes 07 00625 g012
Figure 13. Vorticity distributions on the blade-to-blade surface at 0.5 span.
Processes 07 00625 g013
Figure 14. Partially enlarged view of vorticity contours at 0.5 span.
Processes 07 00625 g014
Figure 15. Velocity streamline distributions at 0.5 span.
Processes 07 00625 g015
Figure 16. Vortex core distributions in the blade trailing edge (BTE) region at the nominal flow rate.
Processes 07 00625 g016
Table 1. Geometric dimensions and design parameters.
Main ParametersSignsValues
Nominal rotating speed (rpm)n3000
Nominal flow rate (m3/h)QN10
Nominal head (m)H35
Specific speedNs40.1
Impeller blades numberZ5
Impeller inlet diameter (mm)D150
Impeller exit diameter (mm)D2160
Impeller exit width (mm)B210
Impeller inlet width (mm)B119
volute base circle diameter(mm)D3165
volute exit diameter (mm)D440
Blade inlet angleβ123
Blade outlet angleβ223
Nominal flow rate coefficientφN0.017
Nominal head coefficientψN0.622
Roughness in impeller passage(μm)Ra10.4
Roughness in volute(μm)Ra21.6
Inlet Reynolds numberRe70396
Table 2. Detailed components of the grid distribution.
ComponentsImpellerVoluteBack ChamberFront ChamberInlet ExtensionOutlet Extension
Number7,636,570932,106391,136390,150365,792228,096
Table 3. Comparison of Cp at blade passing frequency.
Monitoring PointsCp of OTE ProfileCp of STTE ProfileReduction (%)
T10.03160.02810.4
T20.02810.02665.3
T30.0810.07458.2
T40.05770.05583.3
T50.0650.06235.5

