Impact of Fractionation Process on the Technical and Economic Viability of Corn Dry Grind Ethanol Process


Abstract
1. Introduction
2. Materials and Methods
2.1. Process Description
2.2. Economic Analysis

| Name | Process | Coproducts | Description | Reference |
|---|---|---|---|---|
| CDG | Conventional dry grind | DDGS, Corn oil | The corn was cleaned, milled and mixed with water to produce of slurry with 32% solids. Corn starch was hydrolyzed to glucose and converted to ethanol in liquefaction and simultaneous saccharification and fermentation (SSF) steps. Pure ethanol was recovered using distillation and molecular sieve systems and denatured by adding octane. The unfermented material (whole stillage) was processed to recover corn oil and DDGS. Whole stillage was centrifuged to produce wet grains and thin stillage. Thin stillage was concentrated (known as syrup) and centrifuged to recover oil. Defatted syrup was mixed with wet grains and dried to produce DDGS. | [26,37] |
| QG | Quick germ | DDGS, Corn oil, Germ | Corn was soaked in water (27% solids) at 59 °C for 12 h [29]. Soaked corn was coarsely ground and incubated with α-amylase (0.6 g/kg corn) at 55 °C for 4 h at pH 4.5 [5]. The process design for germ recovery was similar to Ramirez et al. [38,39]. Slurry was passed through two set of hydrocyclones with feed to underflow ratio of 80% and 70% for the first and second hydrocyclones, respectively. Germ was recovered in the overflow of first hydrocyclone and the remaining slurry was passed through second hydrocyclone. Germ was washed using water recycled from dry grind process. Amount of water used germ washing was twice the amount solids in the germ stream. Washed germ was dewatered to 50% moisture and dried to 10% moisture. Filtrate stream from dewatering step and overflow of second hydrocyclone was added to corn soaking step. The slurry recovered from underflow of second hydrocyclone was processed similar to CDG. | [5,29,38,39] |
| QGQF | Quick germ quick fiber | DDGS, Corn oil, Germ, Fiber | Corn soaking (29% solids), grinding, incubation and coproduct recovery steps were similar to QG. Germ and fiber mixture was recovered in the overflow of first hydrocyclone due to higher specific gravity in QGQF compared to QG (due to higher solids). Washing, dewatering and drying steps were similar to QG. Germ and fiber were separated using set of aspirators. Stream recovered from underflow of second hydrocyclone was processed similar to CDG. | [5,38,39] |
| E1 | Enzymatic milling with front end fine fiber recovery | DDGS, Corn oil, Fiber, Germ, Fine fiber | Corn soaking and grinding steps were similar to QGQF. Ground corn was incubated with α-amylase (0.6 g/kg corn) at 55 °C for 2 h followed by incubation with protease (1 g/kg corn) at 45 °C for 2 h. Germ and coarse fiber were separated with process similar to QGQF. Compositions of germ and fiber in E1 were different than QGQF due to incubation with protease. The underflow from second hydrocyclone was passed through 200 mesh screen to separate fine fiber from the mash. Fine fiber was washed and dewatered similar to germ and fiber washing step. Fine fiber was dried in rotary drum dryer [38,39]. Water separated during filtration was recycled in corn soaking step. The underflow from 200 mesh screen was processed similar to CDG. | [5,38,39] |
| E2 | Enzymatic milling with post-fermentation fine fiber recovery | DDGS, Corn oil, Fiber, Germ, Fine fiber | Soaking, grinding, enzyme incubation and germ and fiber separation steps were similar to E1 process. The underflow from second hydrocyclone was processed similar to CDG till the ethanol recovery step. Whole stillage was passed through 200 mesh screen to separate fine fiber (overflow) from whole stillage. Separated fine fiber was washed and dewatered similar to E1. The underflow from 200 mesh screen was processed with downstream process similar to CDG. | [5,38,39] |
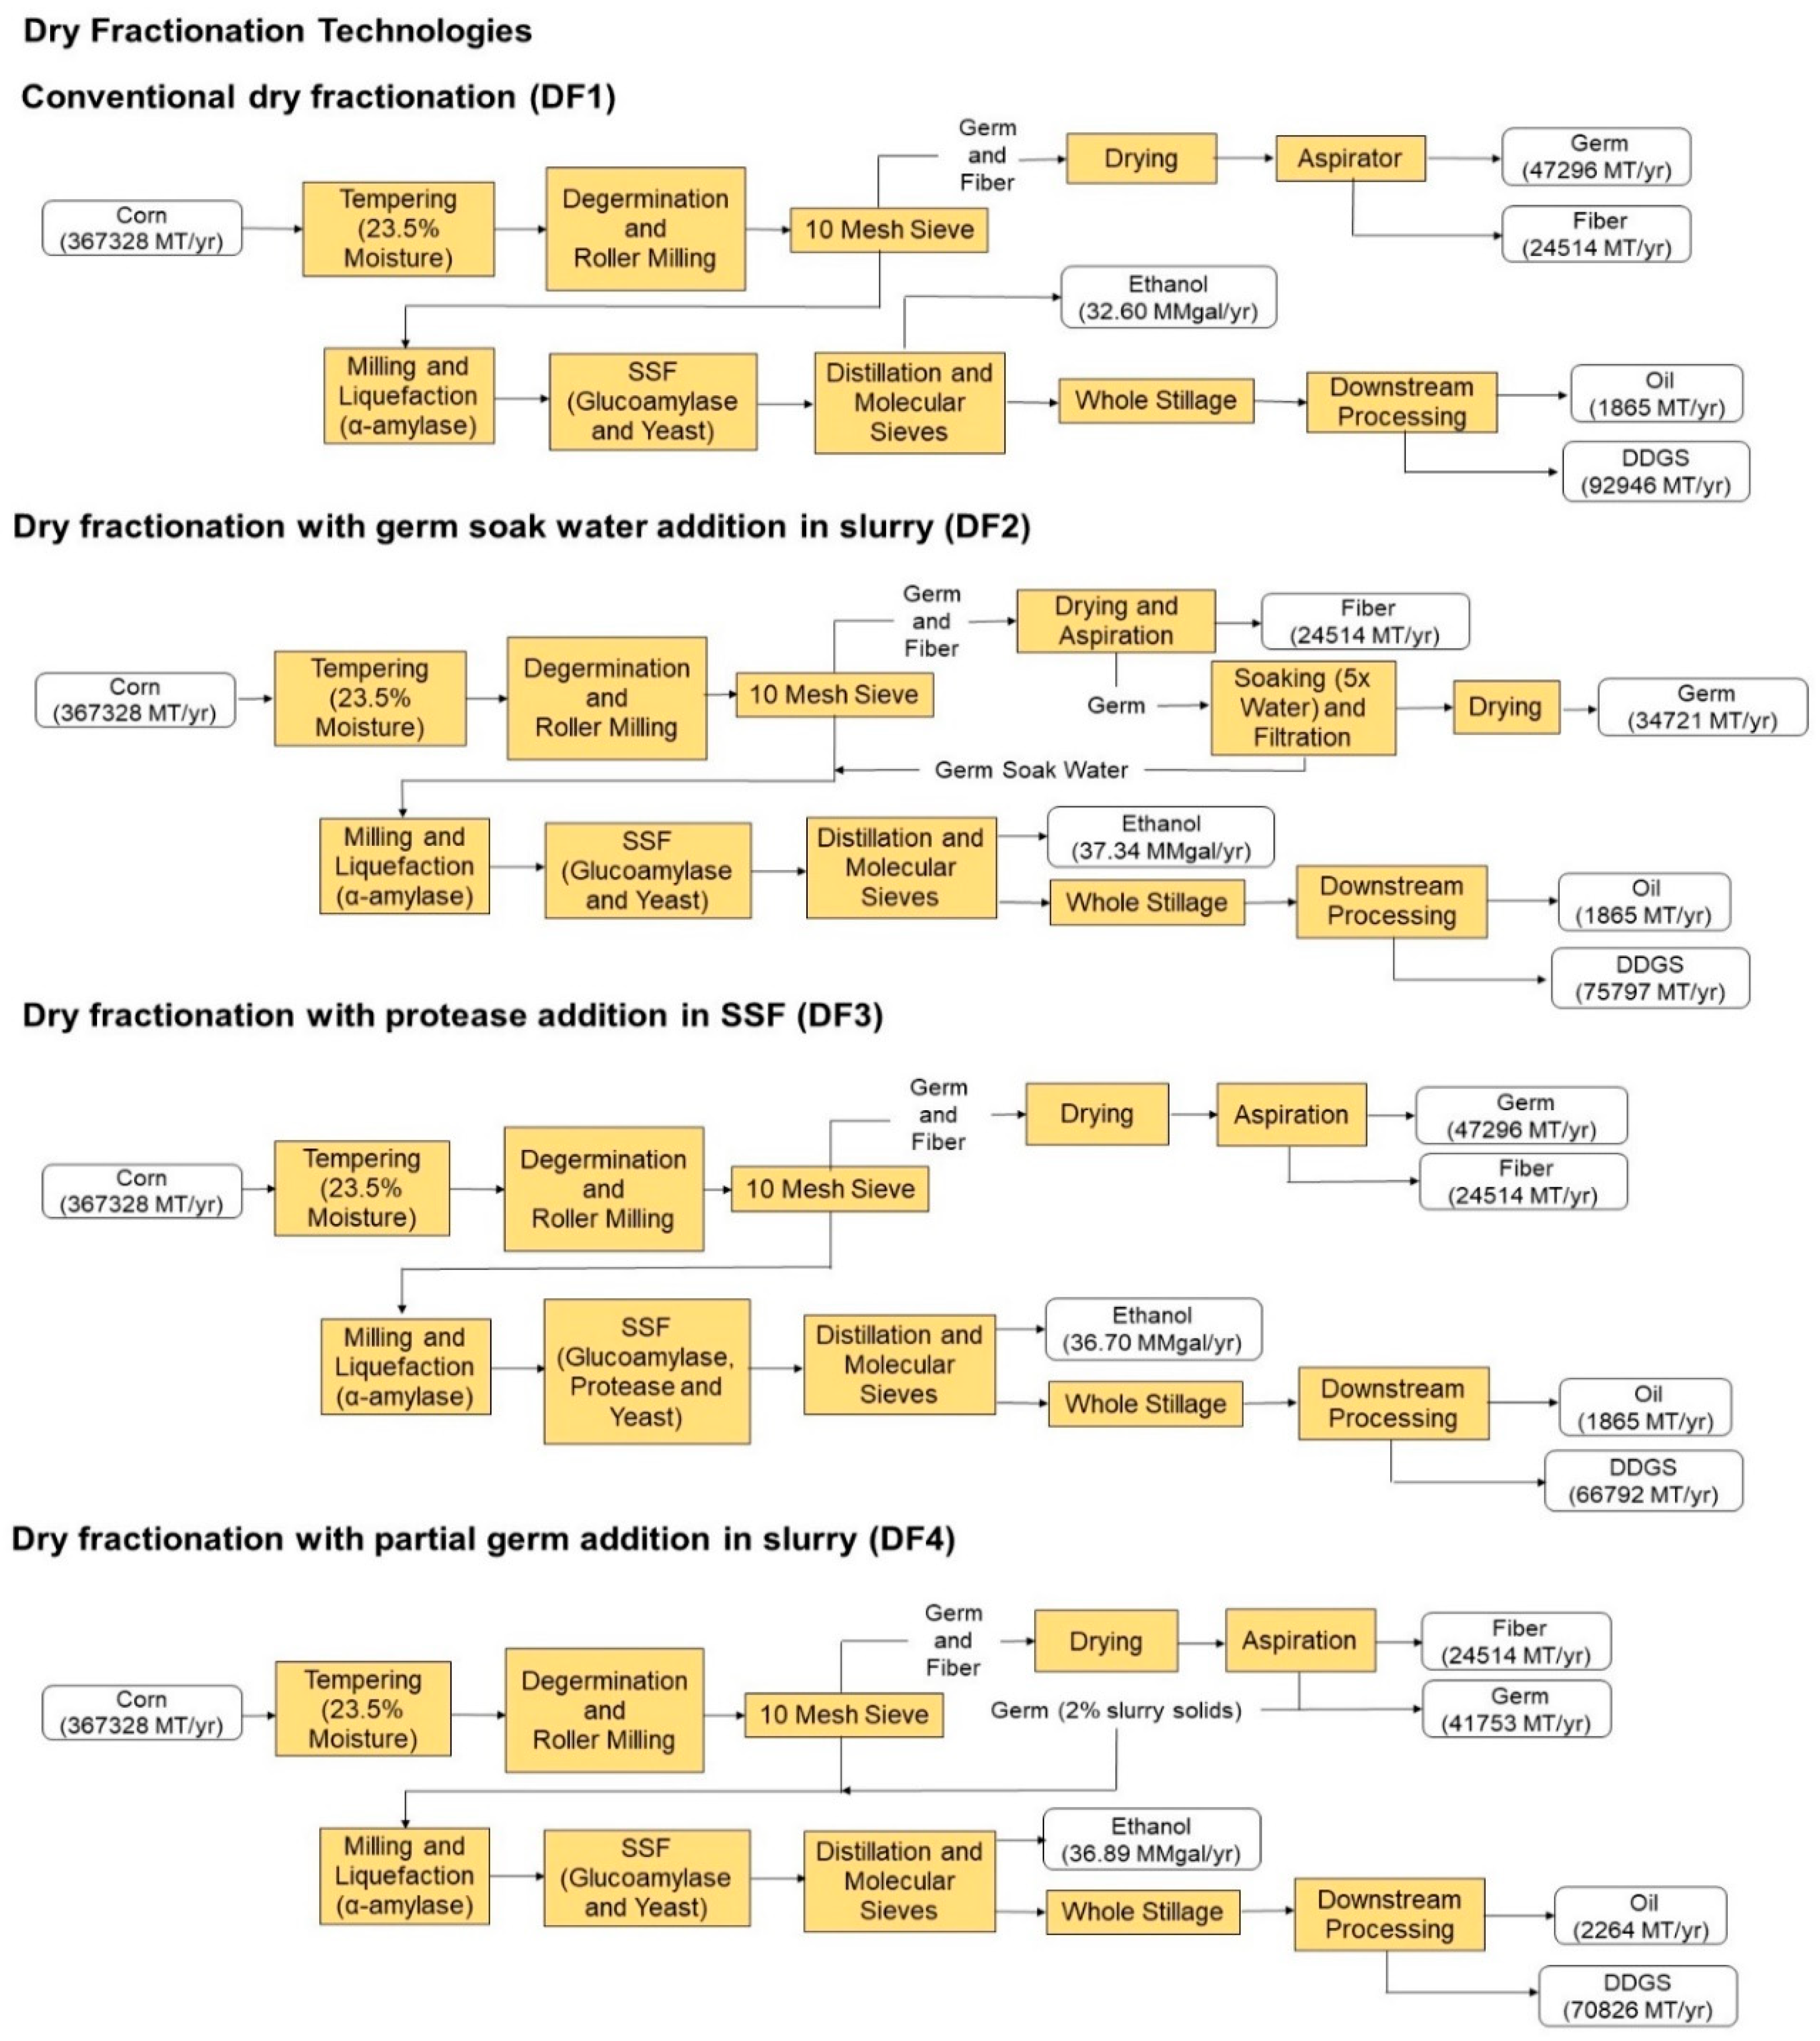
| DF1 | Conventional dry fractionation | DDGS, Corn oil, Germ, Fiber | Corn was tempered with water for 18 min to raise corn moisture to 23.5% and ground using degermination mill. The degermed corn was passed through a roller mill and sieved through 10 mesh sieve. Germ and pericarp (overflow) were separated from endosperm particles (underflow) during the sieving step. The underflow of the sieve was processed similar to the conventional dry grind process. The germ and pericarp particles were dried to 10% moisture and separated using aspirator. Separation of germ in the DF1 process lead to incomplete utilization of glucose [21,24]. Fermentation efficiency (89%) was adjusted to account for the post-fermentation residual glucose [21]. | [20,21,24] |
| DF2 | Dry fractionation with germ soak water addition in slurry | DDGS, Corn oil, Germ, Fiber | Dry fractionation process model (DF1) was modified to incorporate utilization of germ soak water in the slurry making (DF2). Germ produced in the dry fractionation was soaked in water for 12 h at 30 °C with 1:5 germ to water ratio. Soaked germ was dewatered to 25% moisture using a screen and dried to 10% moisture in a fluidized bed dryer. The underflow of filter was processed similar to conventional dry grind process. Changes in germ composition post-soaking were adjusted according to Juneja et al. [24]. Complete conversion of glucose to ethanol was assumed in the SSF step [21,24]. | [20,21,24] |
| DF3 | Dry fractionation with protease addition in SSF | DDGS, Corn oil, Germ, Fiber | Dry fractionation process model (DF1) was modified to incorporate protease addition in the fermentation process (DF3). Commercially recommended dose of protease (1 g/kg corn) was added in the fermentation tank [45]. Complete conversion of glucose to ethanol was assumed in the SSF step [21,24]. | [20,21,24,45] |
| DF4 | Dry fractionation with partial germ addition in slurry | DDGS, Corn oil, Germ, Fiber | Dry fractionation process model (DF1) was modified to incorporate partial germ addition during slurry making (DF4). Dry germ equivalent to 2% solids in slurry was added during slurry making process. Complete conversion of glucose to ethanol was assumed in the SSF step [21,25]. | [20,21,25] |
| Process | Coproduct | Yield a (%) | Oil b (%) | Protein b (%) | Fiber b (%) | Starch b (%) | Revenue ($/MT) | Reference |
|---|---|---|---|---|---|---|---|---|
| CDG | DDGS | 33.12 | 6.79 | 33.31 | 30.11 | 6.50 | 120.26 | |
| Oil | 1.74 | 100 | 560.00 | |||||
| QG | Germ | 6.78 | 36.45 | 20.86 | 19.92 | 6.13 | 311.96 | [5,23] |
| DDGS | 28.04 | 3.05 | 34.27 | 30.73 | 7.64 | 126.76 | ||
| Oil | 0.66 | 100 | 560.00 | |||||
| QGQF | Germ | 6.78 | 36.46 | 20.95 | 19.92 | 6.13 | 312.10 | [5,23] |
| Fiber c | 9.02 | 1.07 | 10.38 | 62.33 | 14.58 | 11.66 | [5,14] | |
| DDGS | 20.27 | 3.95 | 42.67 | 14.80 | 10.37 | 197.03 | ||
| Oil | 0.62 | 100 | 560.00 | |||||
| E1 | Germ | 7.15 | 39.05 | 18.64 | 18.91 | 11.72 | 328.76 | [5,23] |
| Fiber c | 10.00 | 5.29 | 11.71 | 50.27 | 20.31 | 14.73 | [5,15] | |
| Fine Fiber c | 4.40 | 0.64 | 13.91 | 19.00 | 54.91 | 20.88 | [5,15] | |
| DDGS | 18.11 | 1.99 | 43.29 | 15.23 | 11.09 | 203.24 | ||
| Oil | 0.28 | 100 | 560.00 | |||||
| E2 | Germ | 7.15 | 39.05 | 18.64 | 18.91 | 11.71 | 328.76 | [5,23] |
| Fiber c | 10.00 | 5.29 | 11.70 | 50.26 | 20.30 | 14.73 | [5,15] | |
| Fine Fiber c | 5.22 | 2.59 | 22.22 | 53.05 | 2.67 | 53.40 | [5,46] | |
| DDGS | 15.14 | 1.99 | 48.41 | 5.51 | 12.74 | 254.01 | ||
| Oil | 0.23 | 100 | 560.00 | |||||
| DF1 | Germ | 13.64 | 18.36 | 17.75 | 25.02 | 20.98 | 160.18 | [5,23] |
| Fiber | 7.07 | 1.65 | 7.49 | 39.50 | 47.51 | 6.00 | [20] | |
| DDGS | 26.79 | 2.88 | 29.42 | 14.06 | 7.34 | 93.68 | ||
| Oil | 0.60 | 100 | 560.00 | |||||
| DF2 | Germ | 10.00 | 25.01 | 17.00 | 34.08 | 17.29 | 212.59 | [23,24] |
| Fiber | 7.07 | 1.65 | 7.49 | 39.50 | 47.51 | 6.00 | [20] | |
| DDGS | 21.85 | 3.53 | 39.94 | 17.25 | 9.16 | 172.21 | ||
| Oil | 0.60 | 100 | 560.00 | |||||
| DF3 | Germ | 13.64 | 18.36 | 17.75 | 25.02 | 20.98 | 160.18 | [5,23] |
| Fiber | 7.07 | 1.65 | 7.49 | 39.50 | 47.51 | 6.00 | [20] | |
| DDGS | 19.25 | 4.01 | 41.51 | 19.58 | 10.22 | 186.91 | ||
| Oil | 0.60 | 100 | 560.00 | |||||
| DF4 | Germ | 12.03 | 18.36 | 17.75 | 25.02 | 20.98 | 160.18 | [5,23] |
| Fiber | 7.07 | 1.65 | 7.49 | 39.50 | 47.51 | 6.00 | [20] | |
| DDGS | 20.42 | 4.59 | 40.55 | 20.41 | 9.68 | 178.02 | ||
| Oil | 0.73 | 100 | 560.00 |
3. Results and Discussion
3.1. Process Yields
3.2. Capital Investments
3.3. Operating Costs
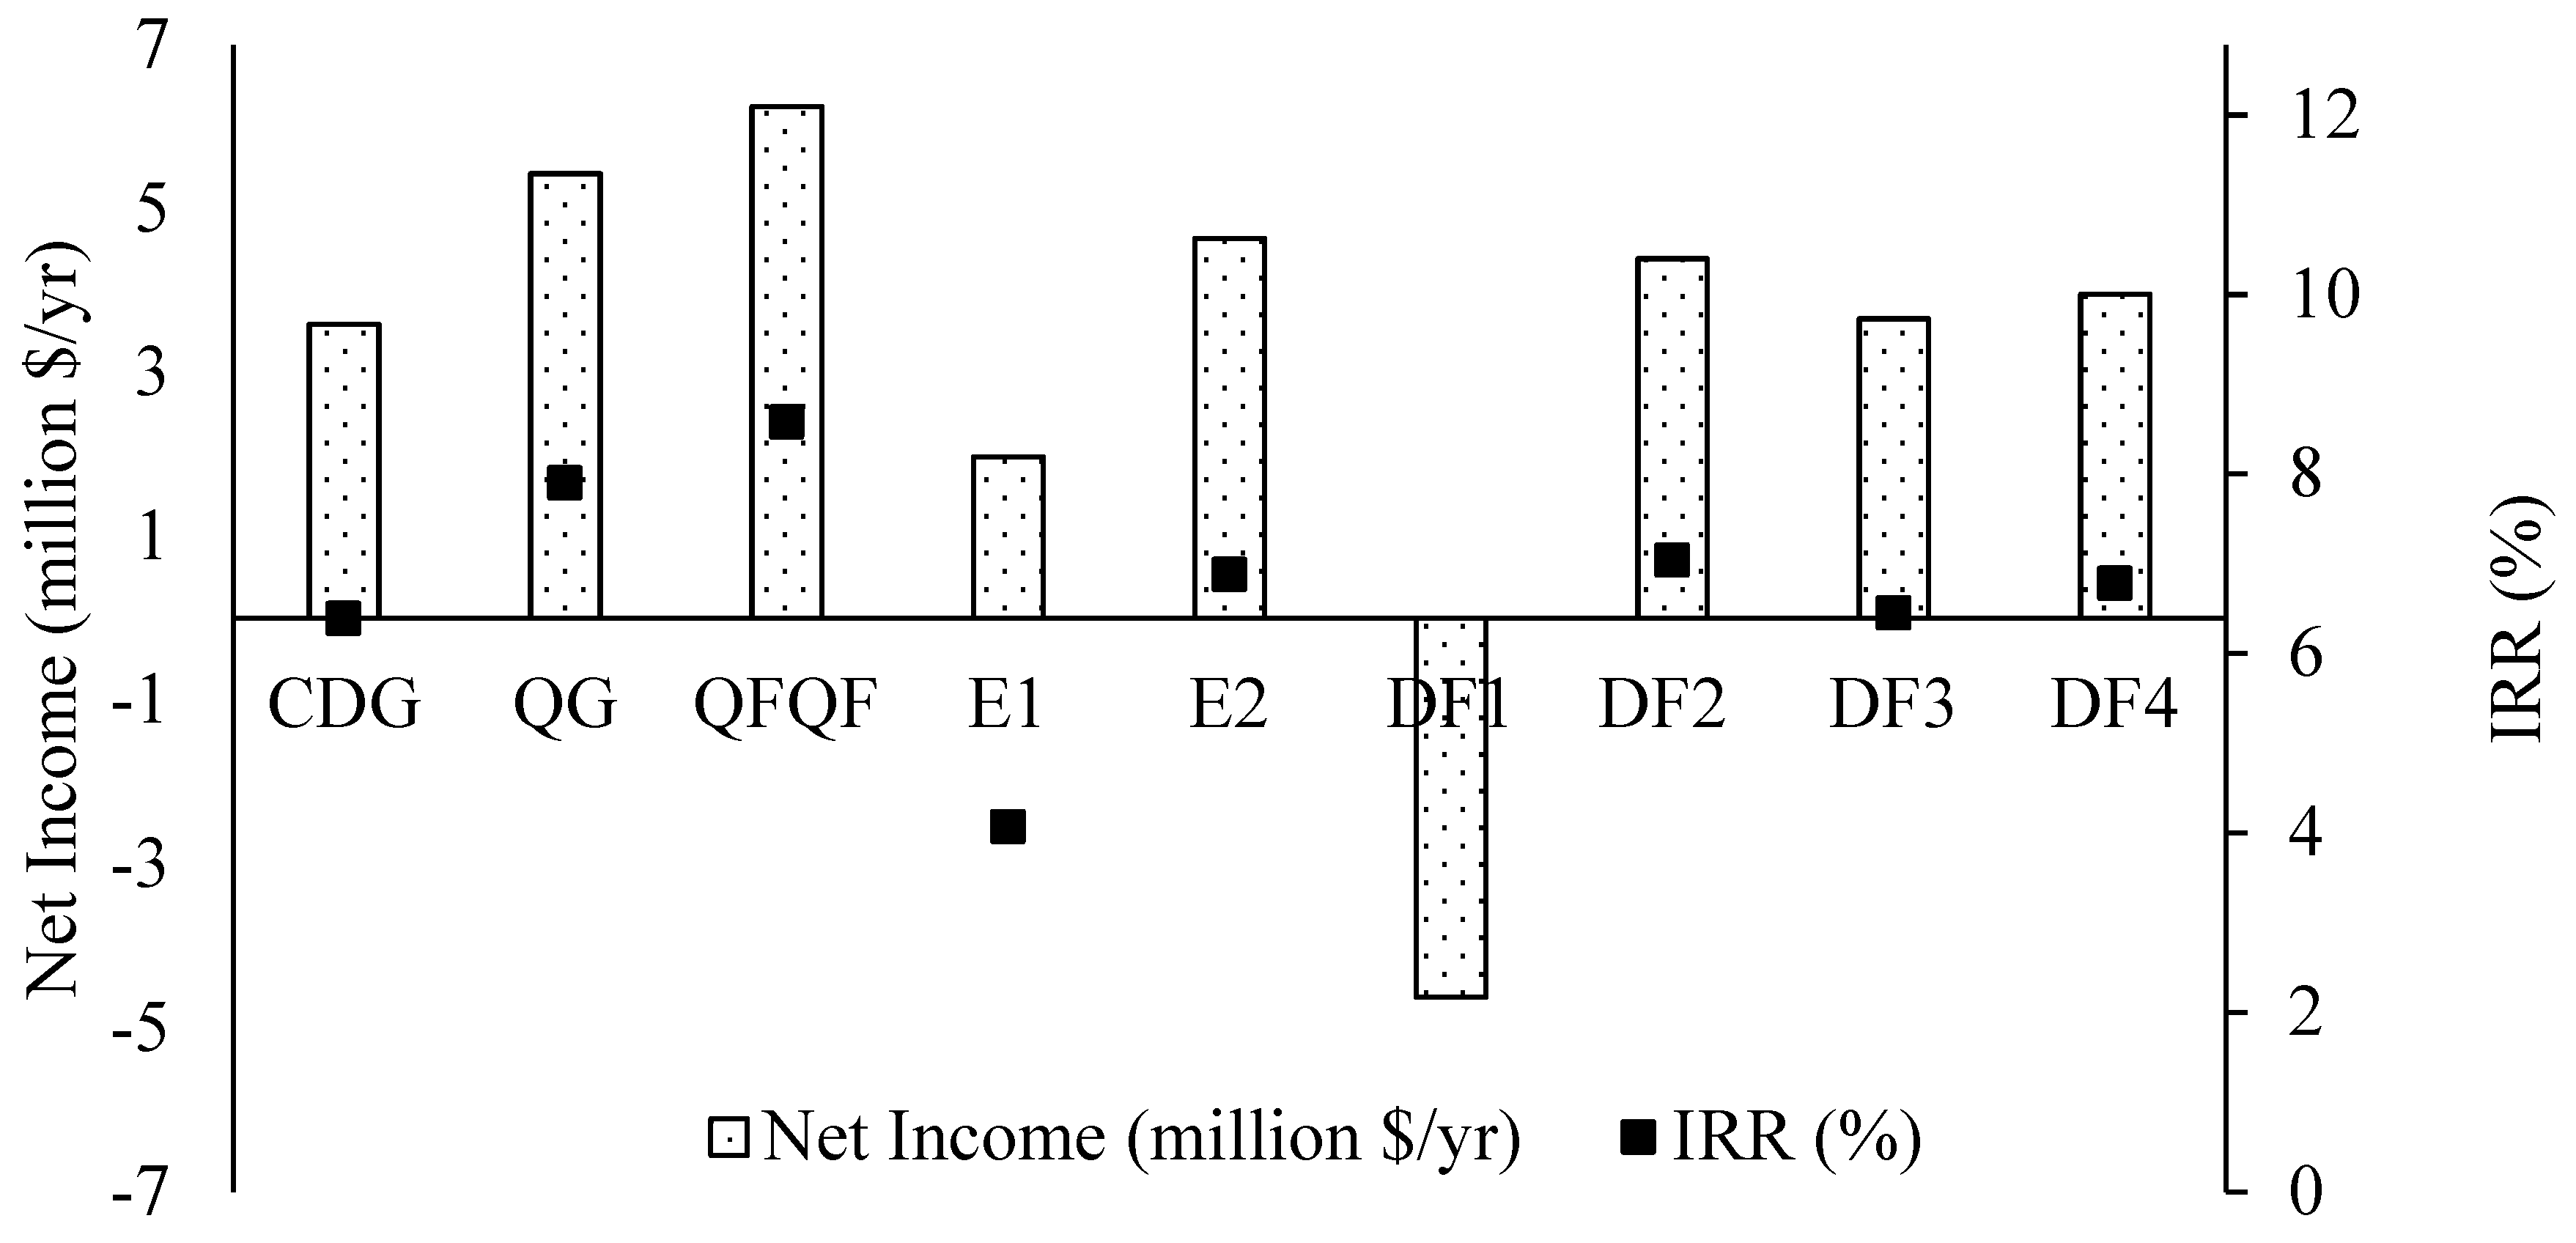
3.4. Ethanol Production Costs and Profitability Analysis
3.5. Sensitivity Analysis
3.5.1. Effect of Protease Prices on Ethanol Production Cost
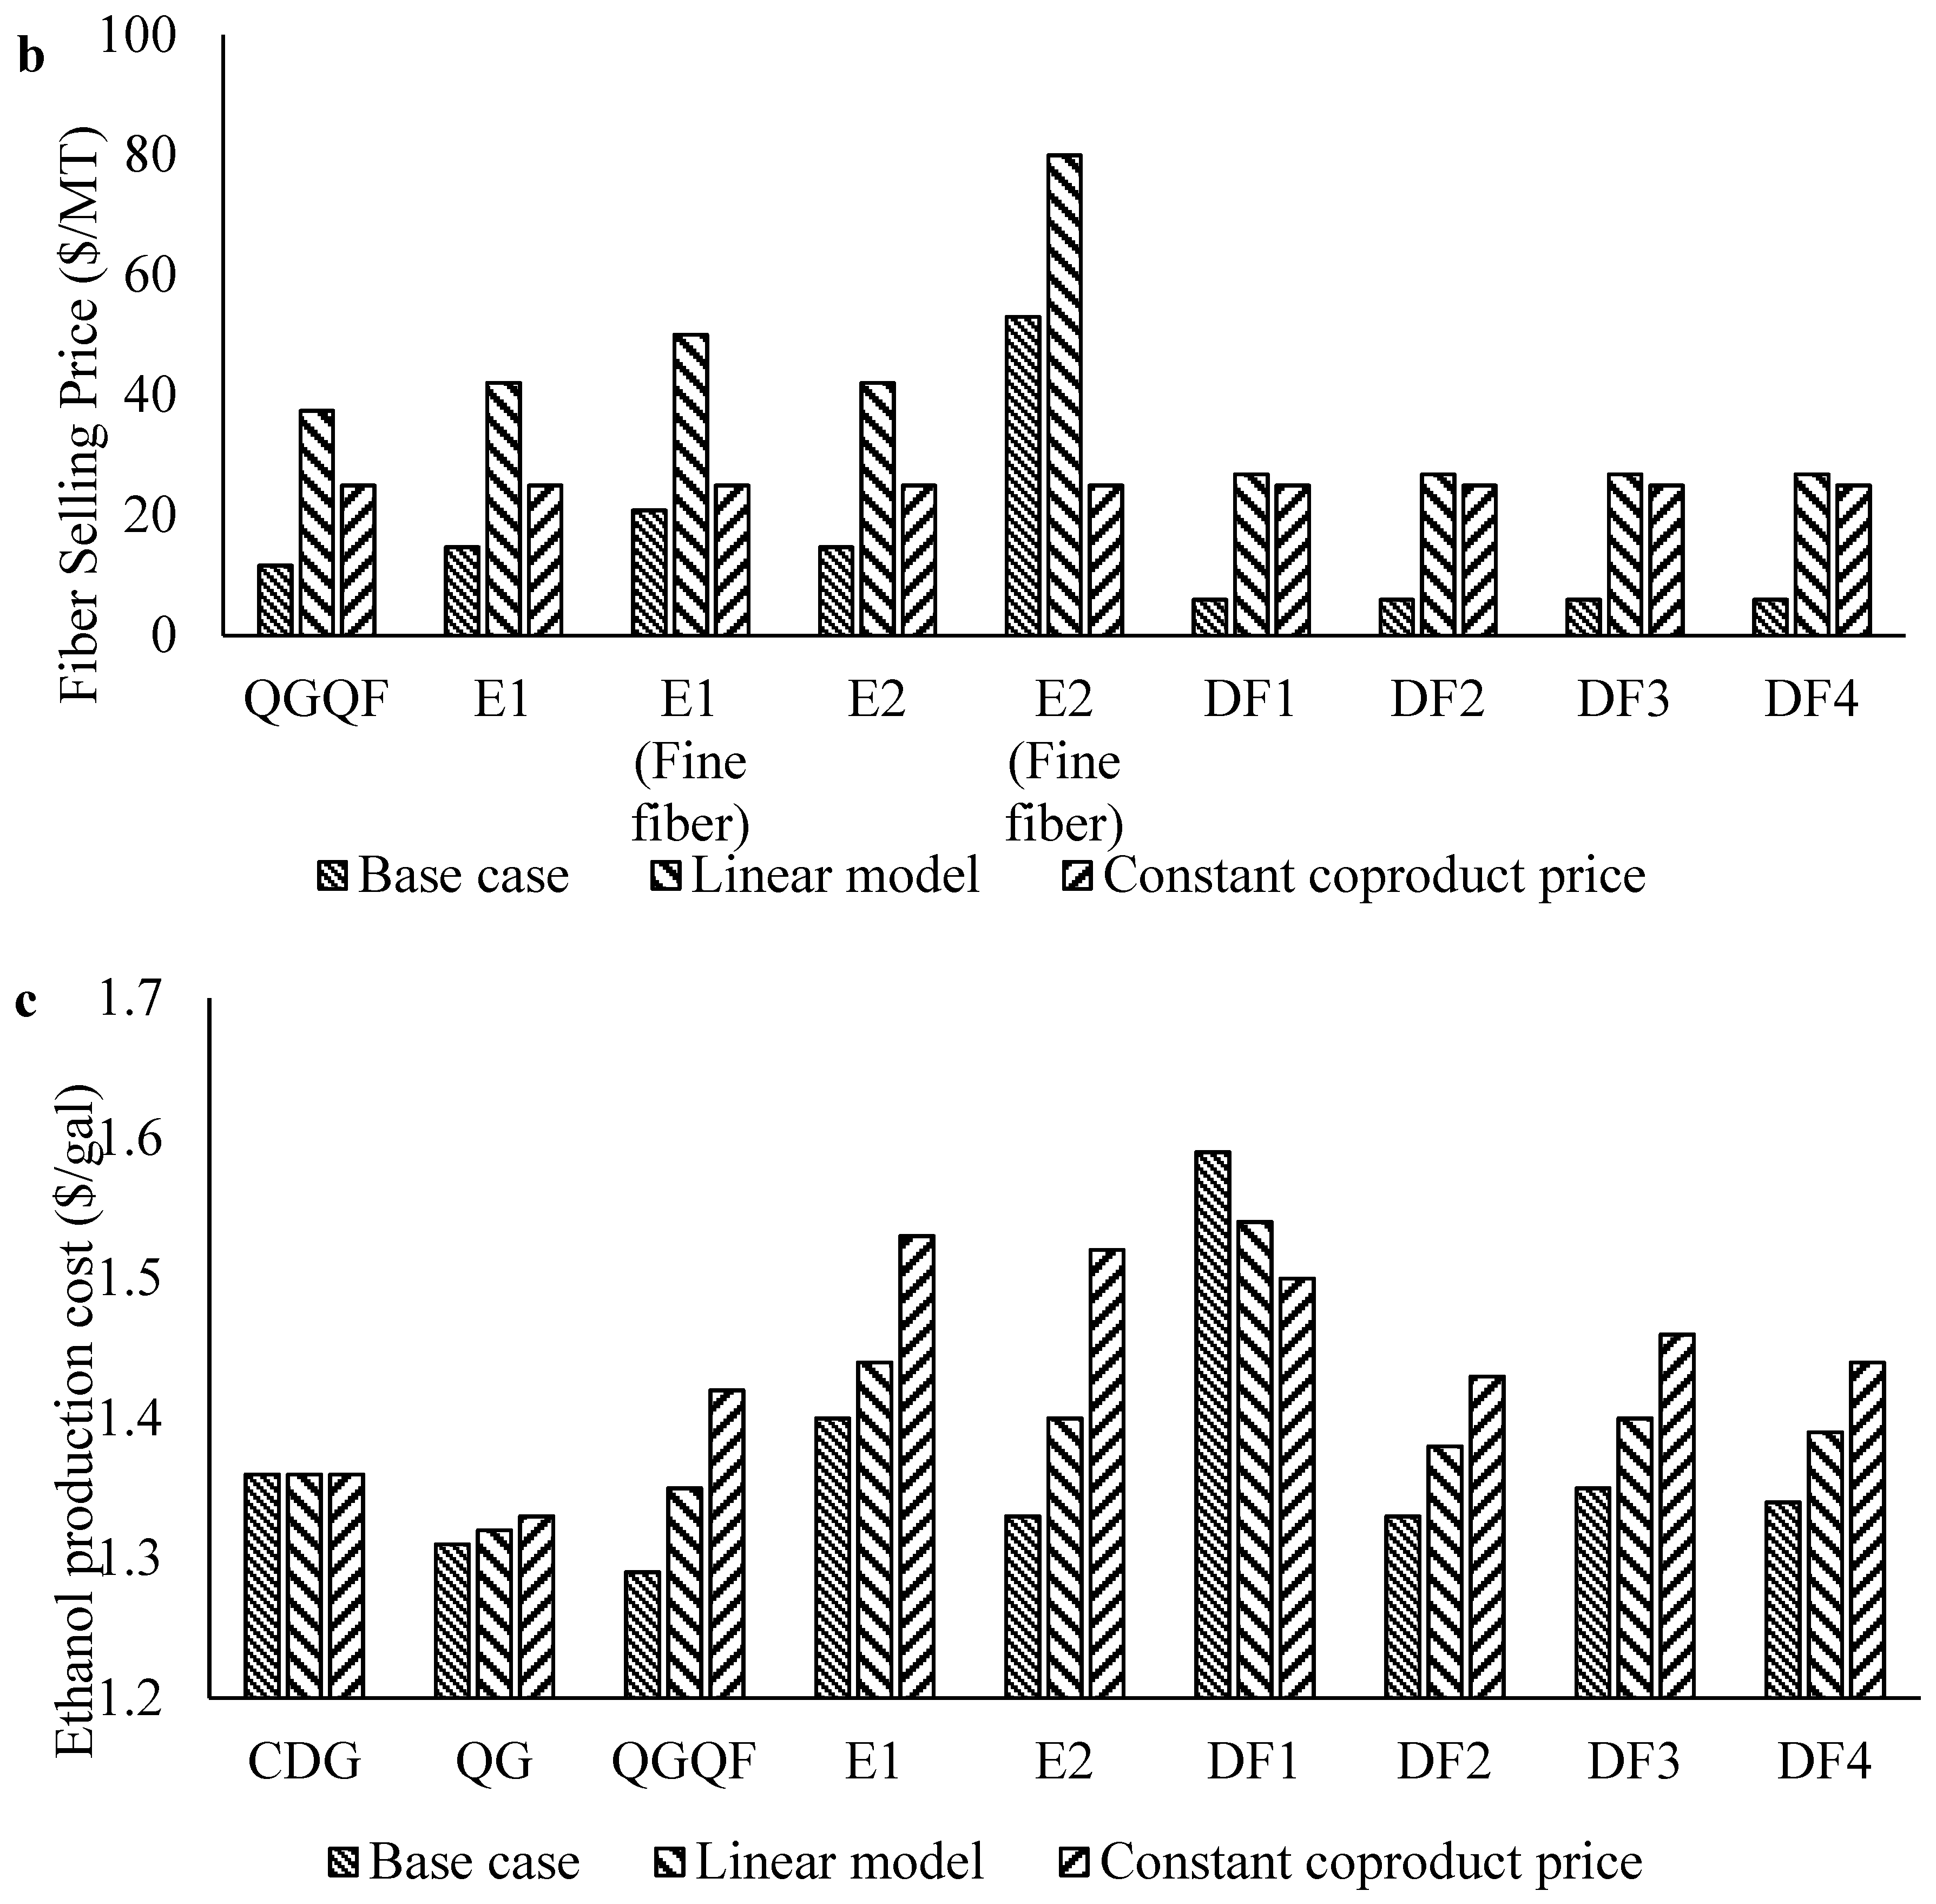
3.5.2. Effect of Coproduct Price Model on Ethanol Production Cost
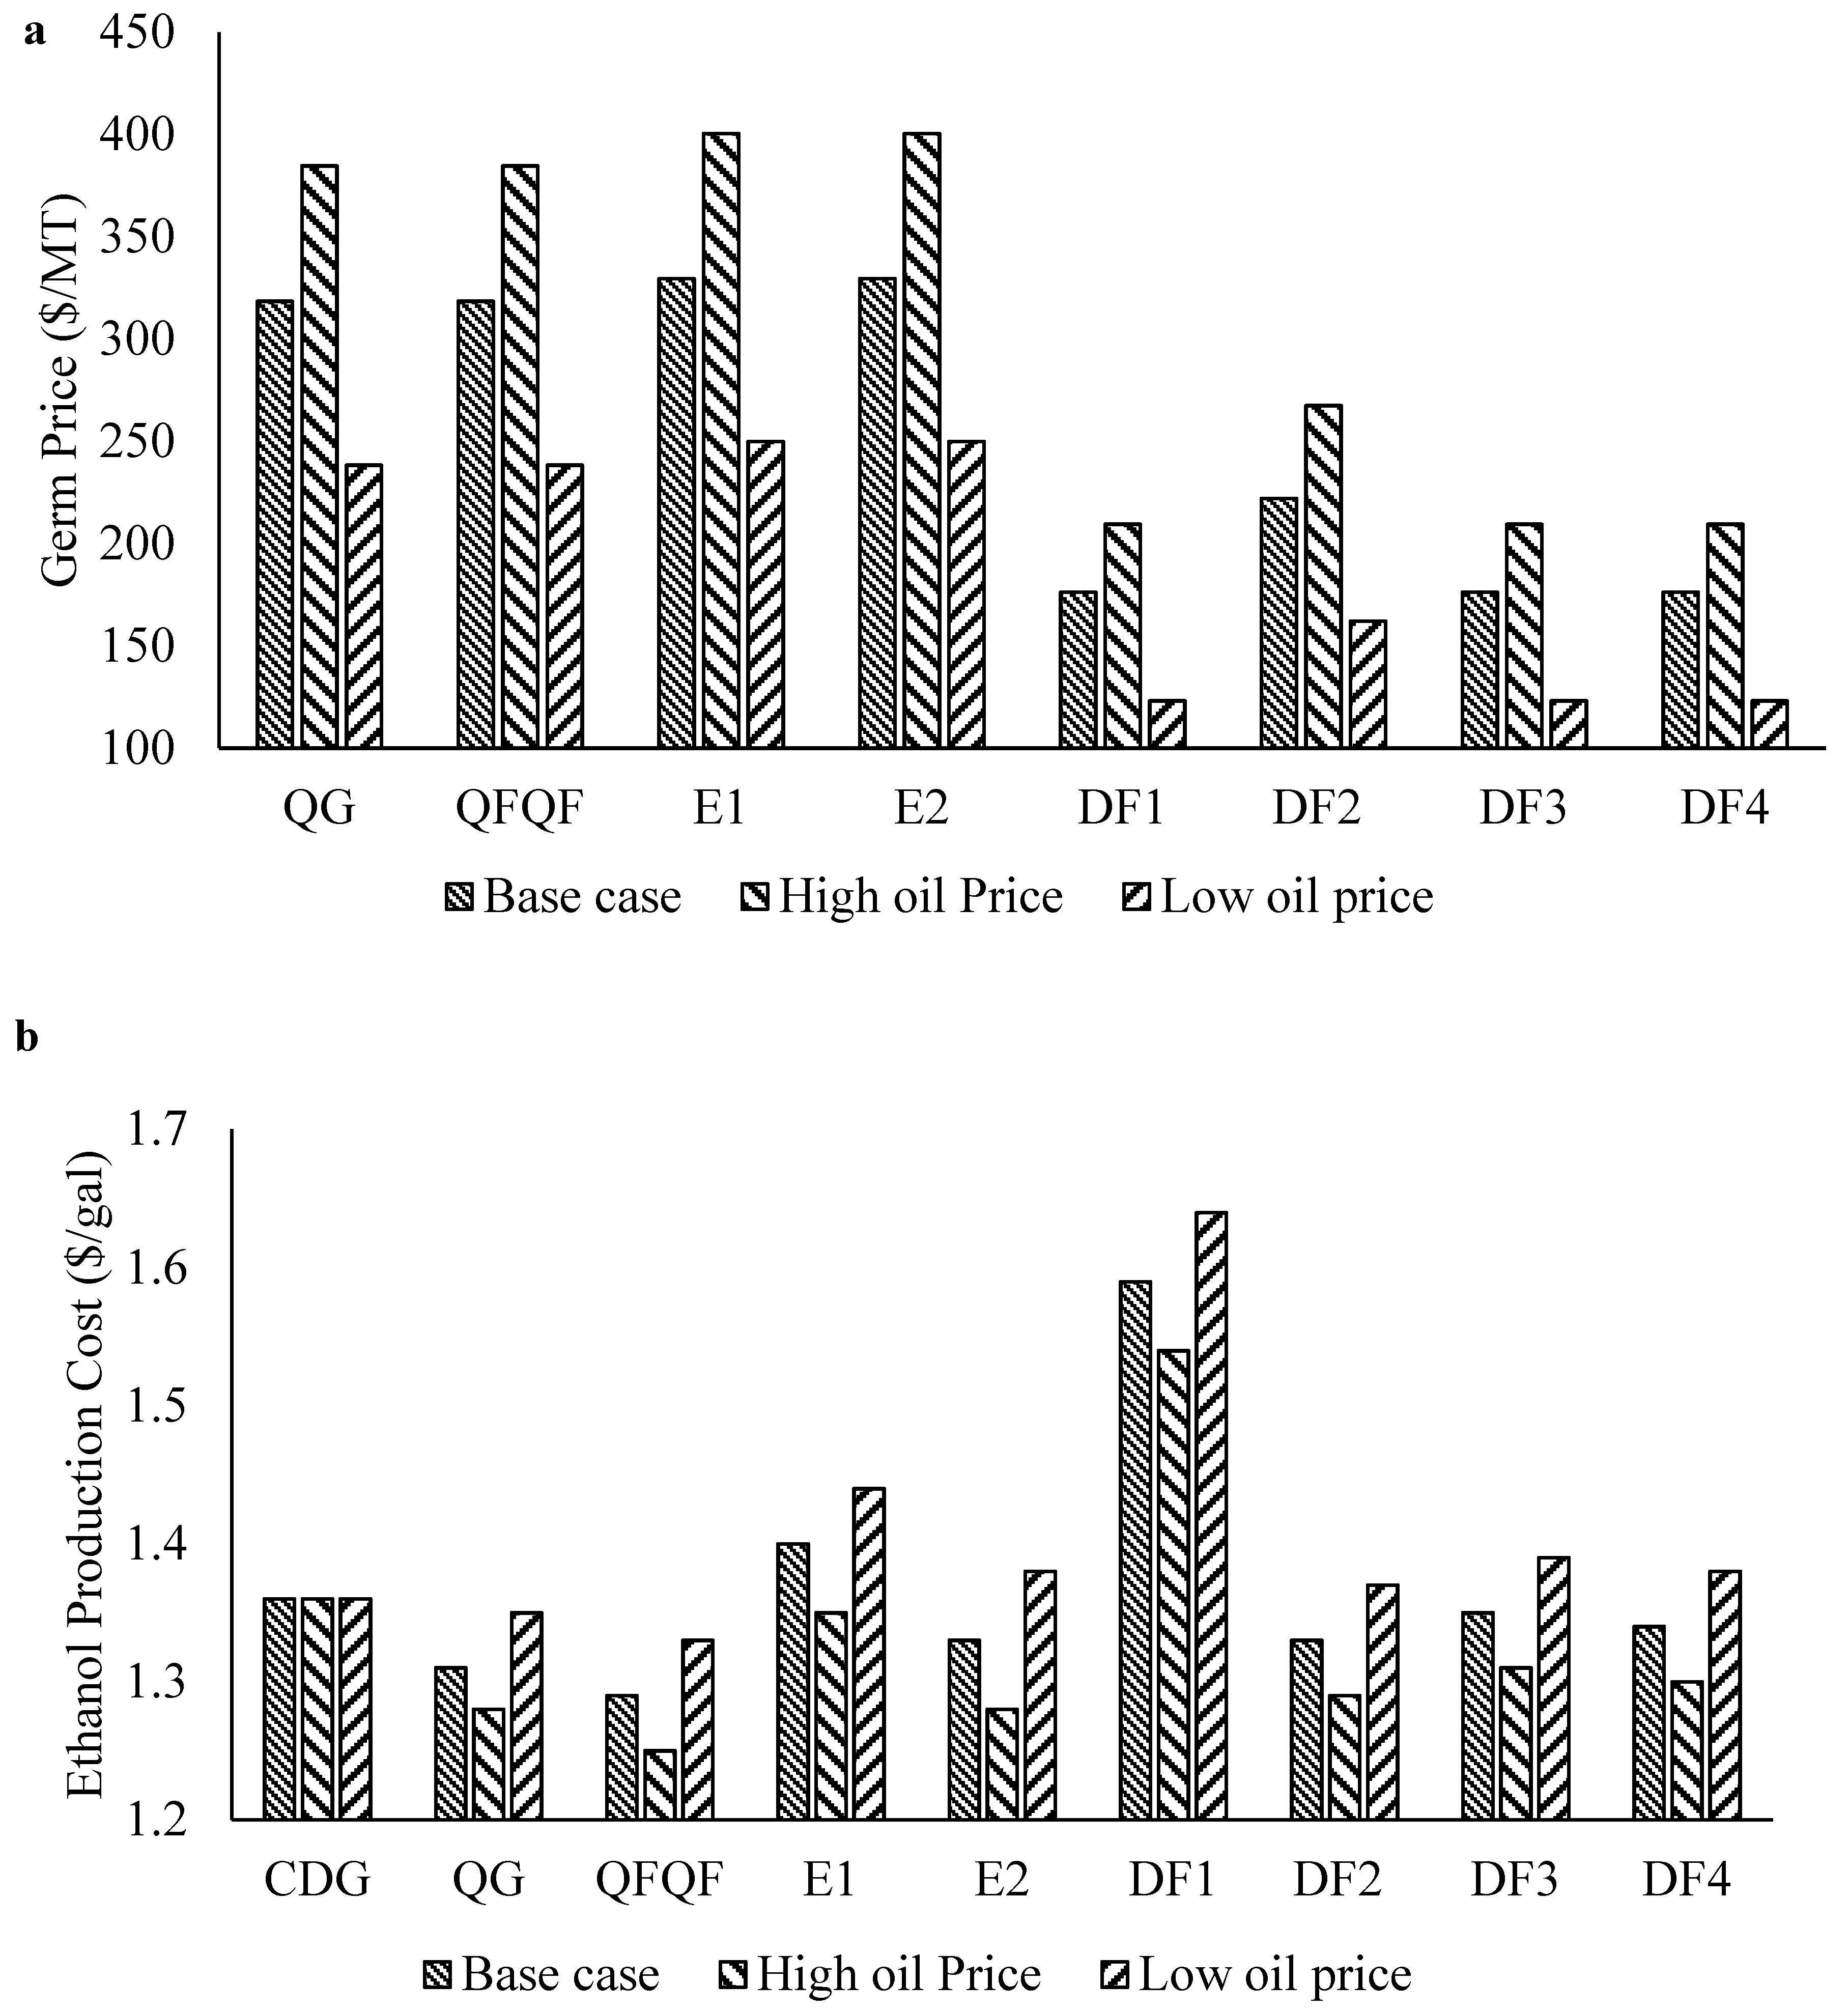
3.5.3. Effect of Germ Selling Price on Ethanol Production Cost
4. Conclusions
Supplementary Materials
Author Contributions
Funding
Conflicts of Interest
References
- RFA. Powered with Energy; RFA: Ellisville, MO, USA; RFA: Washington, DC, USA, 2019; Available online: https://ethanolrfa.org/wp-content/uploads/2019/02/RFA2019Outlook.pdf. (accessed on 9 July 2019).
- Rausch, K.D.; Belyea, R.L. The future of coproducts from corn processing. Appl. Biochem. Biotechnol. 2006, 128, 47–86. [Google Scholar] [CrossRef]
- Bothast, R.J.; Schlicher, M.A. Biotechnological processes for conversion of corn into ethanol. Appl. Microbiol. Biotechnol. 2005, 67, 19–25. [Google Scholar] [CrossRef]
- Singh, V.; Moreau, R.A.; Doner, L.W.; Eckhoff, S.R.; Hicks, K.B. Recovery of Fiber in the Corn Dry-Grind Ethanol Process: A Feedstock for Valuable Coproducts. Cereal Chem. 1999, 76, 868–872. [Google Scholar] [CrossRef]
- Singh, V.; Johnston, D.B.; Naidu, K.; Rausch, K.D.; Belyea, R.L.; Tumbleson, M.E. Comparison of Modified Dry-Grind Corn Processes for Fermentation Characteristics and DDGS Composition. Cereal Chem. 2005, 82, 187–190. [Google Scholar] [CrossRef]
- Yadav, M.P.; Johnston, D.B.; Hotchkiss, A.T.; Hicks, K.B. Corn fiber gum: A potential gum arabic replacer for beverage flavor emulsification. Food Hydrocoll. 2007, 21, 1022–1030. [Google Scholar] [CrossRef]
- Singh, V.; Doner, L.W.; Johnston, D.B.; Hicks, K.B.; Eckhoff, S.R. Comparison of coarse and fine corn fiber for corn fiber gum yields and sugar profiles. Cereal Chem. 2000, 77, 560–561. [Google Scholar] [CrossRef]
- Moreau, R.A.; Powell, M.J.; Hicks, K.B. Extraction and Quantitative Analysis of Oil from Commercial Corn Fiber. J. Agric. Food Chem. 1996, 44, 2149–2154. [Google Scholar] [CrossRef]
- Moreau, R.A. Corn Oil. In Bailey’s Industrial Oil and Fat Products; John Wiley & Sons: Hobaken, NJ, USA, 2005. [Google Scholar]
- Kim, S.M.; Li, S.; Pan, S.-C.; Ding, Y.; Basu, R.; van Egmond, P.; Singh, V. A whole stillage sieving process to recover fiber for cellulosic ethanol production. Ind. Crop. Prod. 2016, 92, 271–276. [Google Scholar] [CrossRef]
- Gáspár, M.; Kálmán, G.; Réczey, K. Corn fiber as a raw material for hemicellulose and ethanol production. Proc. Biochem. 2007, 42, 1135–1139. [Google Scholar] [CrossRef]
- Mosier, N.S.; Hendrickson, R.; Brewer, M.; Ho, N.; Sedlak, M.; Dreshel, R.; Welch, G.; Dien, B.S.; Aden, A.; Ladisch, M.R. Industrial scale-up of pH-controlled liquid hot water pretreatment of corn fiber for fuel ethanol production. Appl. Biochem. Biotechnol. 2005, 125, 77–97. [Google Scholar] [CrossRef]
- Shrestha, P.; Khanal, S.K.; Pometto, A.L.; van Leeuwen, J. Ethanol production via in situ fungal saccharification and fermentation of mild alkali and steam pretreated corn fiber. Bioresour. Technol. 2010, 101, 8698–8705. [Google Scholar] [CrossRef]
- Dien, B.S.; Nagle, N.; Hicks, K.B.; Singh, V.; Moreau, R.A.; Tucker, M.P.; Nichols, N.N.; Johnston, D.B.; Cotta, M.A.; Nguyen, Q.; et al. Fermentation of “Quick Fiber” produced from a modified corn-milling process into ethanol and recovery of corn fiber oil. Appl. Biochem. Biotechnol. 2004, 115, 937–949. [Google Scholar] [CrossRef]
- Dien, B.S.; Johnston, D.B.; Hicks, K.B.; Cotta, M.A.; Singh, V. Hydrolysis and Fermentation of Pericarp and Endosperm Fibers Recovered from Enzymatic Corn Dry-Grind Process. Cereal Chem. 2005, 82, 616–620. [Google Scholar] [CrossRef]
- Dien, B.S.; Hespell, R.B.; Ingram, L.O.; Bothast, R.J. Conversion of corn milling fibrous co-products into ethanol by recombinant Escherichia coli strains K011 and SL40. World J. Microbiol. Biotechnol. 1997, 13, 619–625. [Google Scholar] [CrossRef]
- Singh, V.; Eckhoff, S. Effect of soak time, soak temperature, and lactic acid on germ recovery parameters. Cereal Chem. 1996, 73, 716–720. [Google Scholar]
- Wahjudi, J.; Xu, L.; Wang, P.; Singh, V.; Buriak, P.; Rausch, K.D.; McAloo, A.; Tumbleson, M.E.; Eckhoff, S. Quick fiber process: Effect of mash temperature, dry solids, and residual germ on fiber yield and purity. Cereal Chem. 2000, 77, 640–644. [Google Scholar] [CrossRef]
- Wahjudi, J.; Xu, L.; Wang, P.; Buriak, P.; Singh, V.; Tumbleson, M.; Rausch, K.; Eckhoff, S. The “quick fiber” process: Effect of temperature, specific gravity, and percentage of residual germ. Cereal Chem. 2000, 77, 640–644. [Google Scholar] [CrossRef]
- Rausch, K.D.; Pruiett, L.E.; Wang, P.; Xu, L.; Belyea, R.L.; Tumbleson, M.E. Laboratory Measurement of Yield and Composition of Dry-Milled Corn Fractions Using a Shortened, Single-Stage Tempering Procedure. Cereal Chem. 2009, 86, 434–438. [Google Scholar] [CrossRef]
- Murthy, G.S.; Singh, V.; Johnston, D.B.; Rausch, K.D.; Tumbleson, M.E. Evaluation and Strategies to Improve Fermentation Characteristics of Modified Dry-Grind Corn Processes. Cereal Chem. 2006, 83, 455–459. [Google Scholar] [CrossRef]
- Murthy, G.S.; Sall, E.D.; Metz, S.G.; Foster, G.; Singh, V. Evaluation of a dry corn fractionation process for ethanol production with different hybrids. Ind. Crop. Prod. 2009, 29, 67–72. [Google Scholar] [CrossRef]
- Johnston, D.B.; McAloon, A.J.; Moreau, R.A.; Hicks, K.B.; Singh, V. Composition and economic comparison of germ fractions from modified corn processing technologies. J. Am. Oil Chem. Soc. 2005, 82, 603–608. [Google Scholar] [CrossRef]
- Juneja, A.; Kumar, D.; Singh, V. Germ soak water as nutrient source to improve fermentation of corn grits from modified corn dry grind process. Bioresour. Bioprocess. 2017, 4, 38. [Google Scholar] [CrossRef]
- Ramchandran, D.; Wang, P.; Dien, B.; Liu, W.; Cotta, M.A.; Singh, V. Improvement of Dry-Fractionation Ethanol Fermentation by Partial Germ Supplementation. Cereal Chem. 2015, 92, 218–223. [Google Scholar] [CrossRef]
- Kwiatkowski, J.R.; McAloon, A.J.; Taylor, F.; Johnston, D.B. Modeling the process and costs of fuel ethanol production by the corn dry-grind process. Ind. Crop. Prod. 2006, 23, 288–296. [Google Scholar] [CrossRef]
- McAloon, A.; Taylor, F.; Yee, W.; Ibsen, K.; Wooley, R. Determining the Cost of Producing Ethanol from Corn Starch and Lignocellulosic Feedstocks; National Renewable Energy Laboratory: Lakewood, CO, USA, 2010. [Google Scholar]
- Wood, C.; Rosentrater, K.A.; Muthukumarappan, K. Techno-economic modeling of a corn based ethanol plant in 2011/2012. Ind. Crop. Prod. 2014, 56, 145–155. [Google Scholar] [CrossRef]
- Taylor, F.; Mcaloon, A.J.; Craig, J.C.; Yang, P.; Wahjudi, J.; Eckhoff, S.R. Fermentation and costs of fuel ethanol from corn with quick-germ process. Appl. Biochem. Biotechnol. 2001, 94, 41–49. [Google Scholar] [CrossRef]
- Rajagopalan, S.; Ponnampalam, E.; McCalla, D.; Stowers, M. Enhancing profitability of dry mill ethanol plants. Appl. Biochem. Biotechnol. 2005, 120, 37–50. [Google Scholar] [CrossRef]
- Rodríguez, L.F.; Li, C.; Khanna, M.; Spaulding, A.D.; Lin, T.; Eckhoff, S.R. An engineering and economic evaluation of quick germ–quick fiber process for dry-grind ethanol facilities: Analysis. Bioresour. Technol. 2010, 101, 5282–5289. [Google Scholar] [CrossRef]
- Li, C.; Rodríguez, L.F.; Khanna, M.; Spaulding, A.D.; Lin, T.; Eckhoff, S.R. An engineering and economic evaluation of quick germ–quick fiber process for dry-grind ethanol facilities: Model description and documentation. Bioresour. Technol. 2010, 101, 5275–5281. [Google Scholar] [CrossRef]
- Singh, V.; Eckhoff, S.R. Economics of Germ Preseparation for Dry-Grind Ethanol Facilities. Cereal Chem. 1997, 74, 462–466. [Google Scholar] [CrossRef]
- Singh, V.; Rausch, K.D.; Yang, P.; Shapouri, H.; Belyea, R.L.; Tumbleson, M.E. Modified Dry Grind Ethanol Process; Departments of Agricultural Engineering, University of Illinois at Champaign-Urbana, UILU: Urbana, IL, USA, 2001. [Google Scholar]
- Lin, T.; Rodríguez, L.F.; Li, C.; Eckhoff, S.R. An engineering and economic evaluation of wet and dry pre-fractionation processes for dry-grind ethanol facilities. Bioresour. Technol. 2011, 102, 9013–9019. [Google Scholar] [CrossRef]
- Kelsall, D.; Pigott, R. Grain milling and cooking for alcohol production: Designing option in dry milling. In The Alcohol Textbook: A Reference for the Beverage, Fuel and Industrial Alcohol Industries, 5th ed.; Ingledew, W.M., Kelsall, D.R., Austin, G.D., Kluhspies, C., Eds.; Nottingham University Press: Nottingham, UK, 2009; pp. 161–175. [Google Scholar]
- Somavat, P.; Kumar, D.; Singh, V. Techno-economic feasibility analysis of blue and purple corn processing for anthocyanin extraction and ethanol production using modified dry grind process. Ind. Crop. Prod. 2018, 115, 78–87. [Google Scholar] [CrossRef]
- Ramírez, E.C.; Johnston, D.B.; McAloon, A.J.; Singh, V. Enzymatic corn wet milling: Engineering process and cost model. Biotechnol. Biofuels 2009, 2, 2. [Google Scholar] [CrossRef]
- Ramirez, E.C.; Johnston, D.B.; McAloon, A.J.; Yee, W.; Singh, V. Engineering process and cost model for a conventional corn wet milling facility. Ind. Crop. Prod. 2008, 27, 91–97. [Google Scholar] [CrossRef]
- Cheng, M.-H.; Rosentrater, K.A. Economic feasibility analysis of soybean oil production by hexane extraction. Ind. Crop. Prod. 2017, 108, 775–785. [Google Scholar] [CrossRef]
- Huang, H.; Long, S.; Singh, V. Techno-economic analysis of biodiesel and ethanol co-production from lipid-producing sugarcane. Biofuels Bioprod. Biorefin. 2016, 10, 299–315. [Google Scholar] [CrossRef]
- Kumar, D.; Murthy, G.S. Impact of pretreatment and downstream processing technologies on economics and energy in cellulosic ethanol production. Biotechnol. Biofuels 2011, 4, 27. [Google Scholar] [CrossRef]
- Kumar, D.; Long, S.P.; Singh, V. Biorefinery for combined production of jet fuel and ethanol from lipid-producing sugarcane: A techno-economic evaluation. GCB Bioenergy 2018, 10, 92–107. [Google Scholar] [CrossRef]
- ERS. Feed Grains Data Delivery System; Economic Research Service, USDA: Washington, DC, USA, 2019. Available online: https://www.ers.usda.gov/db/feedgrains/ (accessed on 20 March 2019).
- Vidal, B.C., Jr.; Rausch, K.D.; Tumbleson, M.E.; Singh, V. Protease Treatment to Improve Ethanol Fermentation in Modified Dry Grind Corn Processes. Cereal Chem. 2009, 86, 323–328. [Google Scholar] [CrossRef]
- Arora, A.; Dien, B.S.; Belyea, R.L.; Wang, P.; Singh, V.; Tumbleson, M.E.; Rausch, K.D. Ultrafiltration of Thin Stillage from Conventional and E-Mill Dry Grind Processes. Appl. Biochem. Biotechnol. 2011, 164, 58–67. [Google Scholar] [CrossRef]
- Wang, K.; Ou, L.; Brown, T.; Brown, R.C. Beyond ethanol: A techno-economic analysis of an integrated corn biorefinery for the production of hydrocarbon fuels and chemicals. Biofuels Bioprod. Biorefin. 2015, 9, 190–200. [Google Scholar] [CrossRef]
- Srinivasan, R.; Singh, V.; Belyea, R.L.; Rausch, K.D.; Moreau, R.A.; Tumbleson, M.E. Economics of Fiber Separation from Distillers Dried Grains with Solubles (DDGS) Using Sieving and Elutriation. Cereal Chem. 2006, 83, 324–330. [Google Scholar] [CrossRef]
- Ash, M.; Matias, M. Oil Crops Outlook; Economic Research Service, USDA: Washington, DC, USA, 2018.


| Raw Material | Annual Costs (×1000 $/Year) | ||||||||
|---|---|---|---|---|---|---|---|---|---|
| CDG | QG | QGQF | E1 | E2 | DF1 | DF2 | DF3 | DF4 | |
| Alpha-Amylase | 579 | 1075 | 1075 | 1075 | 1075 | 579 | 579 | 579 | 579 |
| Caustic | 223 | 223 | 223 | 223 | 223 | 0.22 | 0.22 | 0.22 | 0.22 |
| Corn | 48,579 | 48,579 | 48,579 | 48,579 | 48,579 | 48,579 | 48,579 | 48,579 | 48,579 |
| Glucoamylase | 836 | 836 | 836 | 836 | 836 | 836 | 836 | 836 | 836 |
| Lime | 39 | 39 | 39 | 39 | 39 | 39 | 39 | 39 | 39 |
| Liquid Ammonia | 161 | 161 | 161 | 161 | 161 | 161 | 161 | 161 | 161 |
| Octane | 1982 | 1971 | 1934 | 1836 | 1903 | 1607 | 1841 | 1810 | 1819 |
| Sulfuric Acid | 81 | 167 | 167 | 167 | 167 | 81 | 81 | 81 | 81 |
| Yeast | 179 | 179 | 179 | 179 | 179 | 179 | 179 | 179 | 179 |
| Protease | 827 | 827 | 827 | ||||||
| Total | 52,660 | 53,230 | 53,193 | 53,922 | 53,989 | 52,285 | 52,519 | 53,314 | 52,497 |
| Utility | Annual Costs (×1000 $/Year) | ||||||||
|---|---|---|---|---|---|---|---|---|---|
| CDG | QG | QGQF | E1 | E2 | DF1 | DF2 | DF3 | DF4 | |
| Std. Power | 2053 | 2984 | 3044 | 3102 | 3122 | 2666 | 2870 | 2695 | 2720 |
| Cooling Water | 537 | 541 | 482 | 530 | 520 | 417 | 475 | 417 | 426 |
| Chilled Water | 560 | 521 | 470 | 437 | 462 | 441 | 463 | 441 | 450 |
| CT Water | 372 | 365 | 353 | 334 | 347 | 299 | 337 | 330 | 333 |
| Steam | 6108 | 5891 | 5554 | 5439 | 5649 | 4834 | 5379 | 5095 | 5165 |
| Natural Gas | 761 | 885 | 1142 | 1236 | 1244 | 705 | 833 | 730 | 746 |
| Total | 10,392 | 11,187 | 11,033 | 11,078 | 11,343 | 9361 | 10,358 | 9709 | 9840 |
| Coproduct | Annual Revenue (×1000 $/Year) | ||||||||
|---|---|---|---|---|---|---|---|---|---|
| CDG | QG | QGQF | E1 | E2 | DF1 | DF2 | DF3 | DF4 | |
| Ethanol | 58,289 | 57,940 | 56,860 | 53,976 | 55,938 | 47,264 | 54,140 | 53,220 | 53,494 |
| DDGS | 13,818 | 12,332 | 13,856 | 12,771 | 13,340 | 8722 | 13,053 | 12,484 | 12,608 |
| Corn Oil | 3042 | 1156 | 1083 | 489 | 408 | 1044 | 1044 | 1044 | 1268 |
| Germ | 7494 | 7493 | 8168 | 8169 | 8333 | 7709 | 8333 | 7357 | |
| Fiber | 365 | 511 | 511 | 147 | 147 | 147 | 147 | ||
| Fine-fiber | 318 | 962 | |||||||
| Total | 75,148 | 78,923 | 79,656 | 76,234 | 79,327 | 65,511 | 76,094 | 75,228 | 74,874 |
© 2019 by the authors. Licensee MDPI, Basel, Switzerland. This article is an open access article distributed under the terms and conditions of the Creative Commons Attribution (CC BY) license (http://creativecommons.org/licenses/by/4.0/).
Share and Cite
Kurambhatti, C.; Kumar, D.; Singh, V. Impact of Fractionation Process on the Technical and Economic Viability of Corn Dry Grind Ethanol Process. Processes 2019, 7, 578. https://doi.org/10.3390/pr7090578
Kurambhatti C, Kumar D, Singh V. Impact of Fractionation Process on the Technical and Economic Viability of Corn Dry Grind Ethanol Process. Processes. 2019; 7(9):578. https://doi.org/10.3390/pr7090578
Chicago/Turabian StyleKurambhatti, Chinmay, Deepak Kumar, and Vijay Singh. 2019. "Impact of Fractionation Process on the Technical and Economic Viability of Corn Dry Grind Ethanol Process" Processes 7, no. 9: 578. https://doi.org/10.3390/pr7090578
APA StyleKurambhatti, C., Kumar, D., & Singh, V. (2019). Impact of Fractionation Process on the Technical and Economic Viability of Corn Dry Grind Ethanol Process. Processes, 7(9), 578. https://doi.org/10.3390/pr7090578