Article

Numerical Study of the Effects of Injection Fluctuations on Liquid Nitrogen Spray Cooling

1
State Key Laboratory of Multiphase Flow in Power Engineering, Xi’an Jiaotong University, Xi’an 710049, China
2
Key Laboratory of Cryogenics, Technical Institute of Physics and Chemistry, Chinese Academy of Sciences, Beijing 100190, China
3
University of Chinese Academy of Sciences, Beijing 100049, China
*
Author to whom correspondence should be addressed.
Processes 2019, 7(9), 564; https://doi.org/10.3390/pr7090564
Submission received: 15 July 2019 / Revised: 16 August 2019 / Accepted: 19 August 2019 / Published: 23 August 2019
(This article belongs to the Special Issue Thermodynamics: Modeling and Simulation)

Abstract

:
Spray cooling with liquid nitrogen is increasingly utilized as an efficient approach to achieve cryogenic cooling. Effects of injection mass flow rate fluctuations on the evaporation, temperature distribution, and droplet distribution of a spray field were examined by employing a validated Computational Fluid Dynamics (CFD) numerical model. The numerical results indicated that injection fluctuations enhanced the volume-averaging turbulent kinetic energy and promoted the evaporation of the whole spray field. The strengthened mass and heat transfer between the liquid nitrogen droplets and the surrounding vapor created by the fluctuating injection led to a lower temperature of the whole volume. A relatively smaller droplet size and a more inhomogeneous droplet distribution were obtained under the unsteady inlet. The changes of the frequency and the amplitude of the fluctuations had little effects on the overall spray development. The results could enrich the knowledge of the relation between the inevitable fluctuations and the overall spray development and the cooling performance in a practical spray cooling system with cryogenic fluids.

1. Introduction

Evaporative cooling by liquid nitrogen spray is extensively used to achieve immediate cooling, thermal uniformity, and temperature accuracy in a large space, such as a cryogenic wind tunnel [1], as it is non-polluting and has a high efficiency. In a practical turbulent spray field with liquid nitrogen, the droplet movement, the evaporation, and the liquid and vapor mixing occur simultaneously and couple tightly. Better understanding of the spray mechanism can guide the design of a liquid nitrogen spray cooling system and improve its efficiency.
A dominant input parameter affecting the spray characteristics is the inlet pressure. Volmajer and Kegl [2] pointed out that a higher pressure difference leads to a stronger cavitation. Kannan and Anand [3] stated that the injection pressure is vital to the combustion characteristics and the efficiency of the engine. The change of the spray dispersion, the vapor fraction, and the droplet sizes with change in the injection pressure were investigated in a free spray by Park and Kim [4]. Palani et al. [5] concluded that the spray field is significantly influenced by the injection pressure based on an examination of all spray parameters. Ghurri et al. [6] conducted an experimental study and the result shows that the spray is produced more quickly and it penetrates faster under a higher injection pressure. The majority of the research were conducted under steady conditions with constant inlet pressures and constant injected mass flow rates.
However, the pressure fluctuation phenomenon inevitably occurs at the liquid nitrogen supply system as stated in [7] and in our previous study [8]. In order to accurately control the injection of liquid nitrogen and the temperature in a cooling space, it is necessary to ascertain the effect of the pressure variation on the atomization characteristics. The instantaneous mass flow rate, the atomization process, and the spray field structure will be greatly affected in a complex unsteady flow field yielded by the supply pressure fluctuation. Wang et al. [9] carried out numerical simulations to evaluate the effects of injection pressure fluctuations on the spray behavior in the diesel engine. They pointed out that the supply pressure variation promotes the fuel/gas mixing inside the diesel spray field and enhances the disturbance of both the liquid and the gas phase. A numerical study was conducted on the basis of a simplified computational code by Ubertini [10] and the results indicated that the mass flow rate and the spray characteristics are considerably influenced by the injection pressure fluctuations.
Most research work has focused on the effects of the inlet pressure fluctuation on the cavitating process with room-temperature working fluids [11,12,13]. The studies reached a general conclusion that the presence of the fluctuation promotes the likelihood of the cavitation. For cryogenic fluid, the dynamic cavitation of liquid hydrogen was numerically conducted by Zhu et al. [14] and the enhanced vortex intensity in the cavity was revealed under an unsteady condition. In our previous research, the influence of the pressure fluctuation on the cavitating flow of liquid nitrogen was presented [8]. It was shown that the amplitude of the fluctuation generally strengthened the cavitation.
On the contrary, pressure fluctuations were unavoidably induced by the cavitation because of the growth and the collapse of the cavitated bubbles [15,16,17]. The experimental study captured significant quasi-periodic pressure fluctuations in the cavitation region when the sheet/cloud cavitation occurred [18]. Moreover, Yutaka Ito et al. observed the periodical shedding of the liquid nitrogen (LN2) cavitation cloud over a plano-convex hydrofoil and a bluff body [19]. Zhu et al. [14] numerically obtained the unsteady features of the hydrogen cavitation and they experimentally investigated the unsteady cavitation characteristics of LN2 through a transparent venturi tube [20].
In all, the injection pressure oscillation is a spontaneous phenomenon. To the best of our knowledge, the influence of injection fluctuations on the development of the liquid nitrogen spray is rarely reported. Lack of comprehensive understanding of the influence threatens the control and improvement of the cooling performance in a cryogenic spray system. It is thereby of great importance to investigate the impact of such instability on spray formations. The result in [8] shows that the outlet mass flow rate oscillates periodically and synchronously with the inlet pressure fluctuation. Therefore, the effect of mass flow rate fluctuation will be described instead of the fluctuating inlet pressure in this study. Due to various difficulties and limitations in the experimental measurement, numerical simulations receive noticeable attention.
In the present study, a computational fluid dynamics (CFD) model based on the Eulerian–Lagrangian approach was validated by the experimental data. Simulations were performed to study the effects of injection mass flow rate fluctuations on the spray characteristics and the cooling performance. This investigation could be considered as a guideline for accurately governing the cooling performance of a cryogenic spray cooling system.

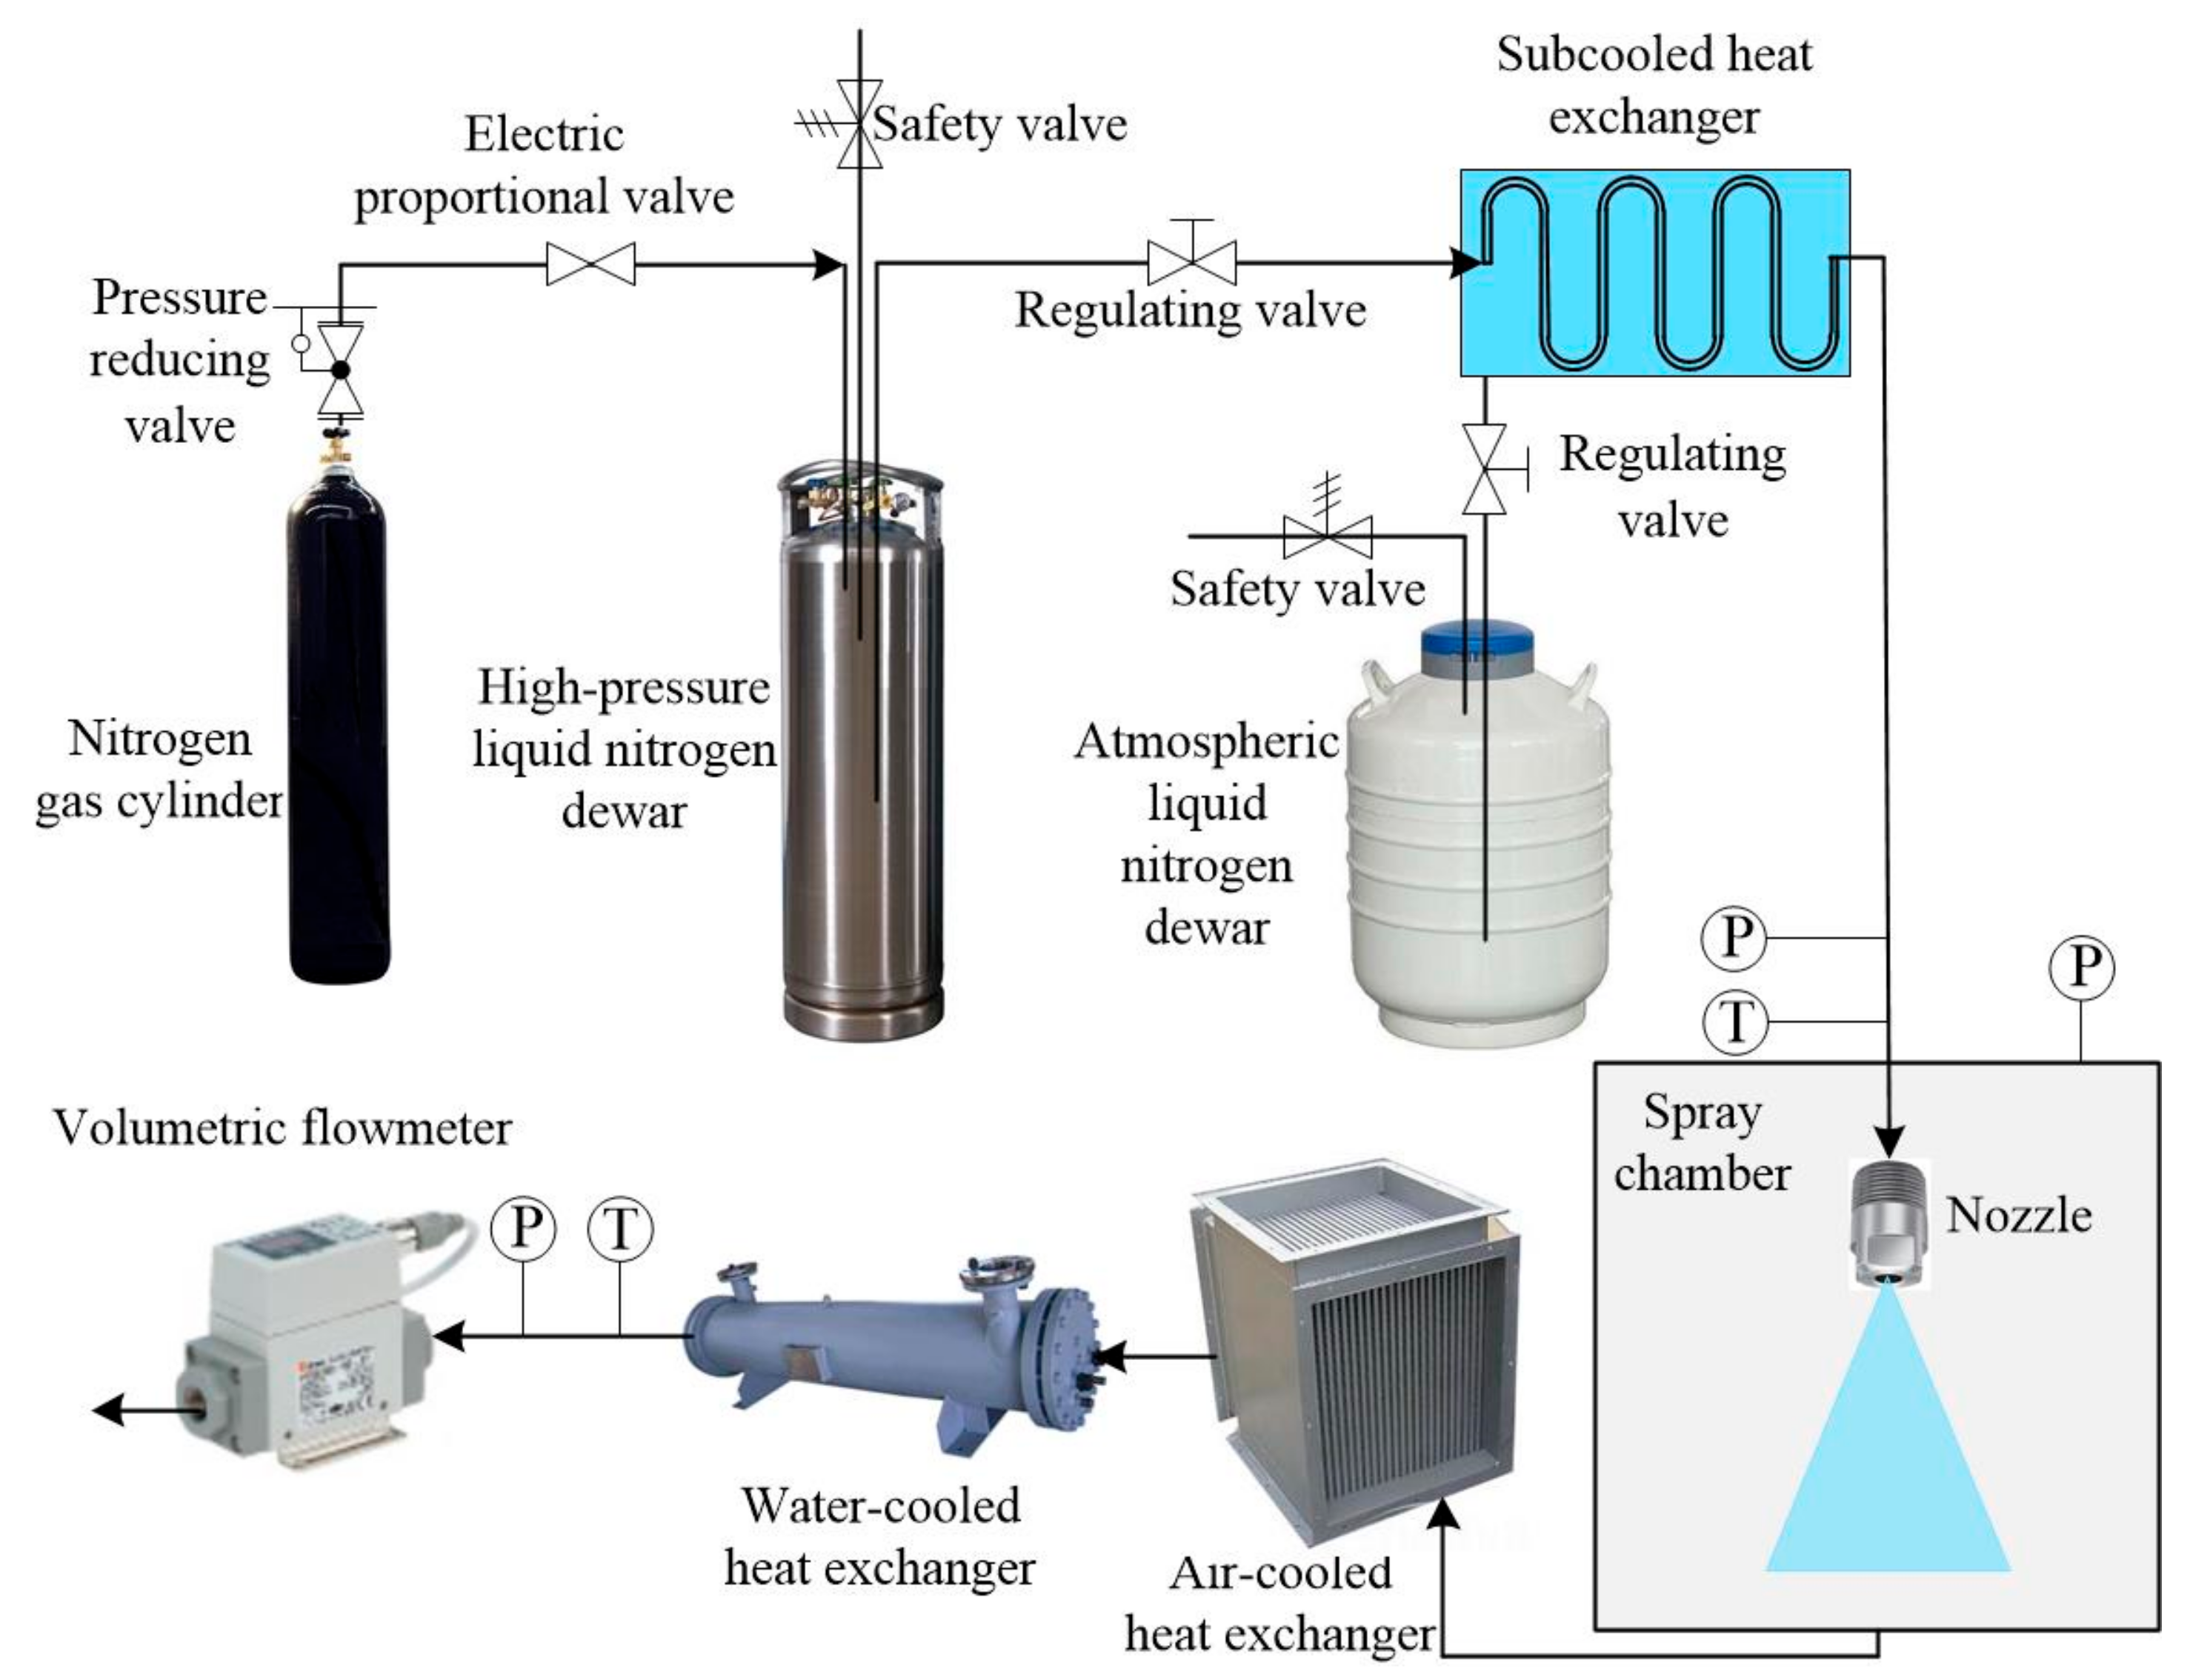
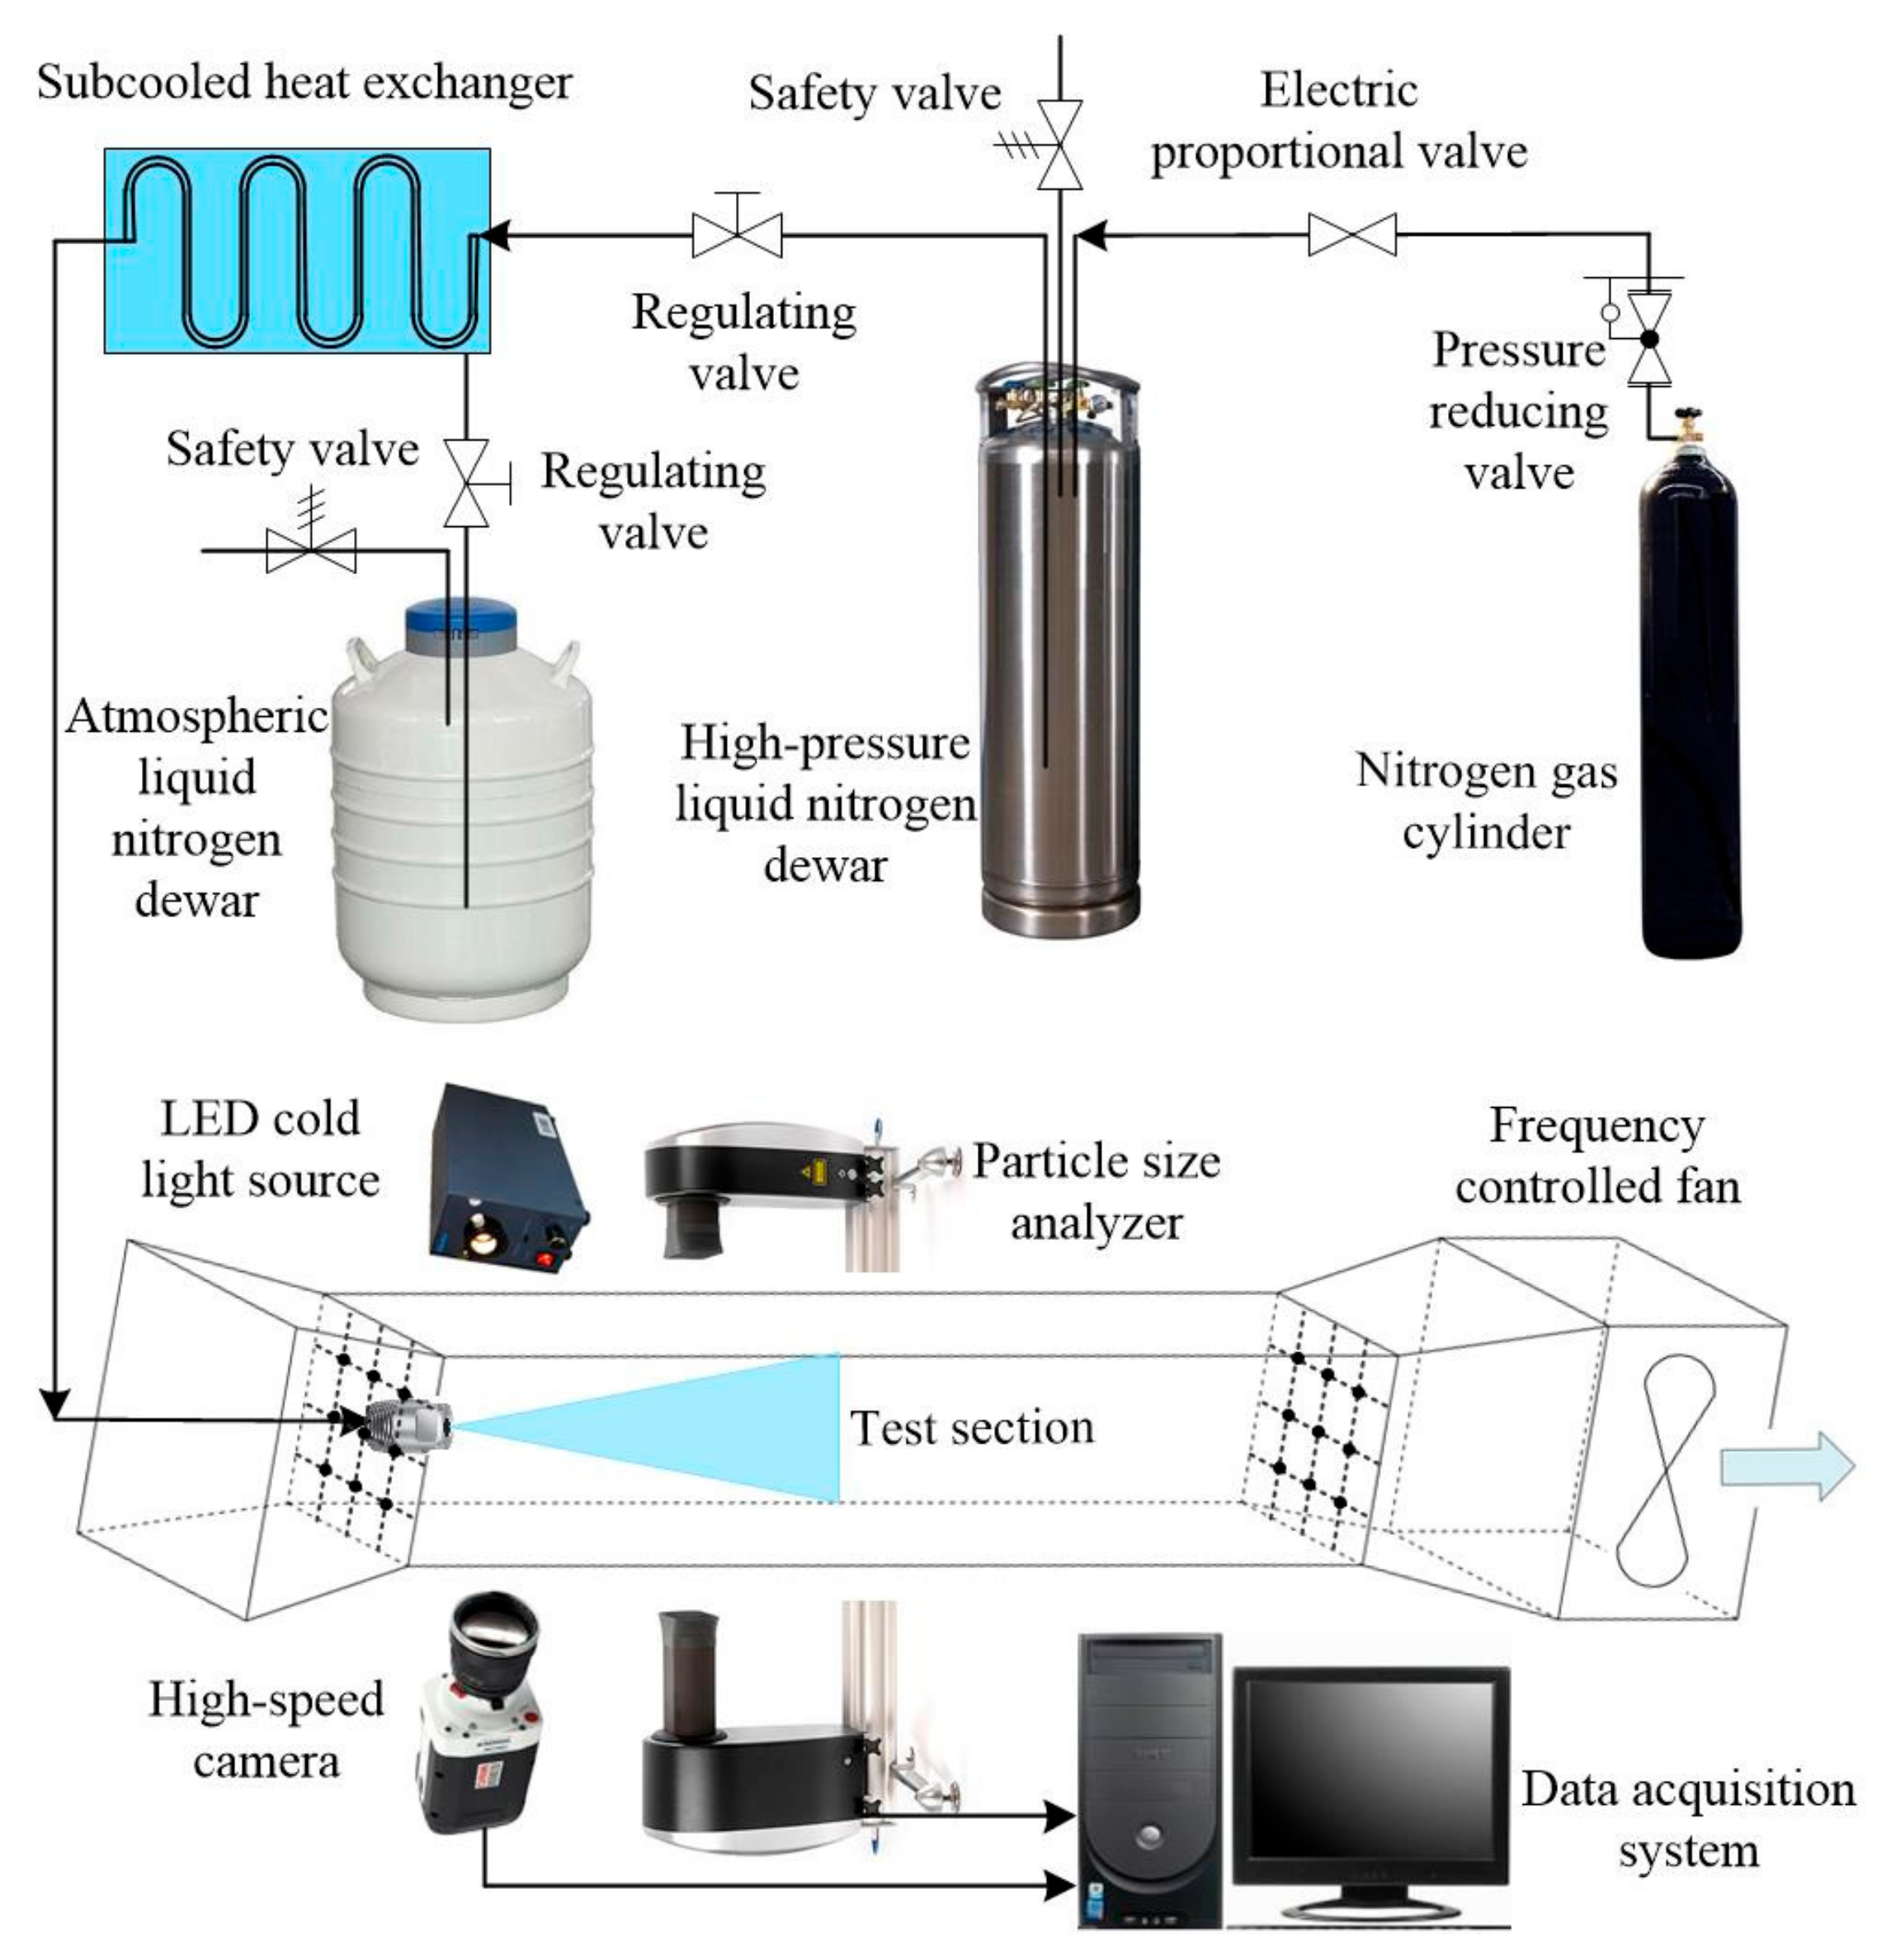
2. Experimental Study

The measurement of mass flow rates under different injection pressures was first conducted. Then, the evaporative cooling performance of the LN2 spray system was determined.

2.1. Mass Flow Rate Measurement

The mass flow rates of the nozzle 1/8HH-SS-1.0 from Spraying Systems Co. were measured before conducting the experimental study on the cooling performance of the LN2 spray system. The schematic diagram of the mass flow rate measuring system is shown in Figure 1. The liquid nitrogen squeezed by the high-pressure nitrogen from the Dewar flows through the subcooled heat exchanger. Then, the subcooled liquid nitrogen enters the nozzle and is sprayed into the spray chamber, where the two-phase fluid is collected and transferred. The complete evaporation of liquid nitrogen is achieved through the air-cooled heat exchanger, and the evaporated nitrogen is warmed up by the water-cooled heat exchanger. The volume flow rate is measured when the warmed nitrogen flows through the volumetric flowmeter. The density of the warmed nitrogen is fixed by the temperature and pressure at the inlet of the volumetric flowmeter. Thus, the mass flow rate is obtained.
The injection pressure was regulated by an electric proportional valve. The inlet temperature was kept at approximately 80 K and the outlet pressure fluctuated between 0.015–0.035 MPa. The discharge coefficient C d was defined as C d = Q ˙ m / Q ˙ m , i d e a l = Q ˙ m / A o ( 2 ρ Δ P ) 0.5 . The changes of the mass flow rate and the discharge coefficient with the pressure difference are plotted in Figure 2. The correlation of the discharge coefficient was proposed, as shown in Equation (1), which provided an experimental foundation for the cooling performance study of the LN2 spray system.
C d = 0.7258 0.5925 Δ P P cr
where Q ˙ m is the mass flow rate, Q ˙ m , i d e a l is the ideal mass flow rate, A o is the cross-sectional area of the orifice, P cr is the critical pressure of liquid nitrogen. Δ P varies from 0.1 MPa to 0.5 MPa.

2.2. Cooling Performance

The schematic diagram of the experimental system based on the LN2 spray cooling in a once-through air duct is illustrated in Figure 3. The test section is a rectangular duct of dimensions 300 × 300 × 1600 mm3. A frequency-controlled fan was installed to change the airflow velocity by adjusting the power frequency. A high-speed camera (HG-100 K from Redlake Co., USA) was used to capture the spray field and the Malvern Spraytec Laser Particle Size Analyzer was used to measure the particle diameter and distribution. The temperatures of the nine points were measured at the inlet and outlet planes of the air conduct, during the experiments.
The higher-pressure LN2, provided the same way as that in the mass flow rate measuring system, flowed through the subcooled heat exchanger to maintain the temperature at approximately 80 K, which ensured the consistency of the experimental conditions with the measurement of the mass flow rate. The experimental data were recorded after the experimental system reached a fully subcooled state by precooling.
Table 1 displays the temperature drops under different airflow velocities and LN2 mass flow rates. The mass flow rates were calculated by Equation (1) based on the measured pressure differences. The drops from the inlet temperature to the outlet temperature increased with the LN2 mass flow rates, while they showed a decreasing trend with increasing velocities. The droplet distributions were recorded and can be seen in Table 1 in [21]. The near-field spray angles fluctuated around 60° during the experimental studies, which were measured from the images recorded by the high-speed camera.

3. Numerical Approach

3.1. Numerical Method

Simulations were implemented using the finite volume CFD code ANSYS/Fluent 16.0, which employs the Eulerian–Lagrangian approach [22] to model the atomization process. This approach utilizes the Eulerian framework to describe the continuous phase, uses the Lagrangian framework to describe the dispersed phase, and then solves the two-phase flows in a fully coupled manner. The simplification, low-computational cost, and reasonable accuracy enables the availability of the standard k-ε model [23] in modeling turbulence effects for the spray injection. Moreover, it is reported that the numerical results were insensitive to turbulence models in [24].

3.1.1. Continuous Phase

The Reynolds-time averaged Navier–Stokes conservation equations could describe the continuous phase. The source terms of the mass, energy, and momentum of the droplets were introduced into the continuous phase governing equations, to reflect their influence. The governing equations of the continuous phase are [25,26]:
ρ v i x j = S m
ρ v i v j x j = ρ g p x j + x j μ v i x j + v j x i 2 3 μ δ i j v j x j + S mp
ρ v i E x j = p v i x j + x j i n h i J i + x j k T x j + Φ + S e
ρ v i Y j x j = J i , i x j + S m
where S e , S m , and S mp are the source terms of energy, momentum, and droplet mass, respectively, which are used to take into account the coupling exchange between droplets and vapor during the process.

3.1.2. Discrete Phase

The temperature difference between the continuous phase and the discrete phase leads to the heat and mass transfer between the droplet and the airflow. The energy equation of the droplet is expressed by the heat convection and vaporization and is shown as:
m ˙ p C p Δ T p = h c A p T T p + m ˙ p h f g
where h c is the convection heat transfer coefficient, m ˙ p is the evaporative rate.
The boiling rate equation is enabled as soon as the droplet reaches the boiling temperature.
d ( d p ) d t = 4 k ρ p c p , d p ( 1 + 0.23 Re d ) ln [ 1 + c p , ( T T p ) h f g ]
Droplet trajectory is predicted by integrating the force balance on the particle, which equates the droplet inertia with the forces, and can be written in the Lagrangian framework:
d u p d t = F D + F g + F
where F g is the gravitational force, F is an additional acceleration term, and F D is the drag force.

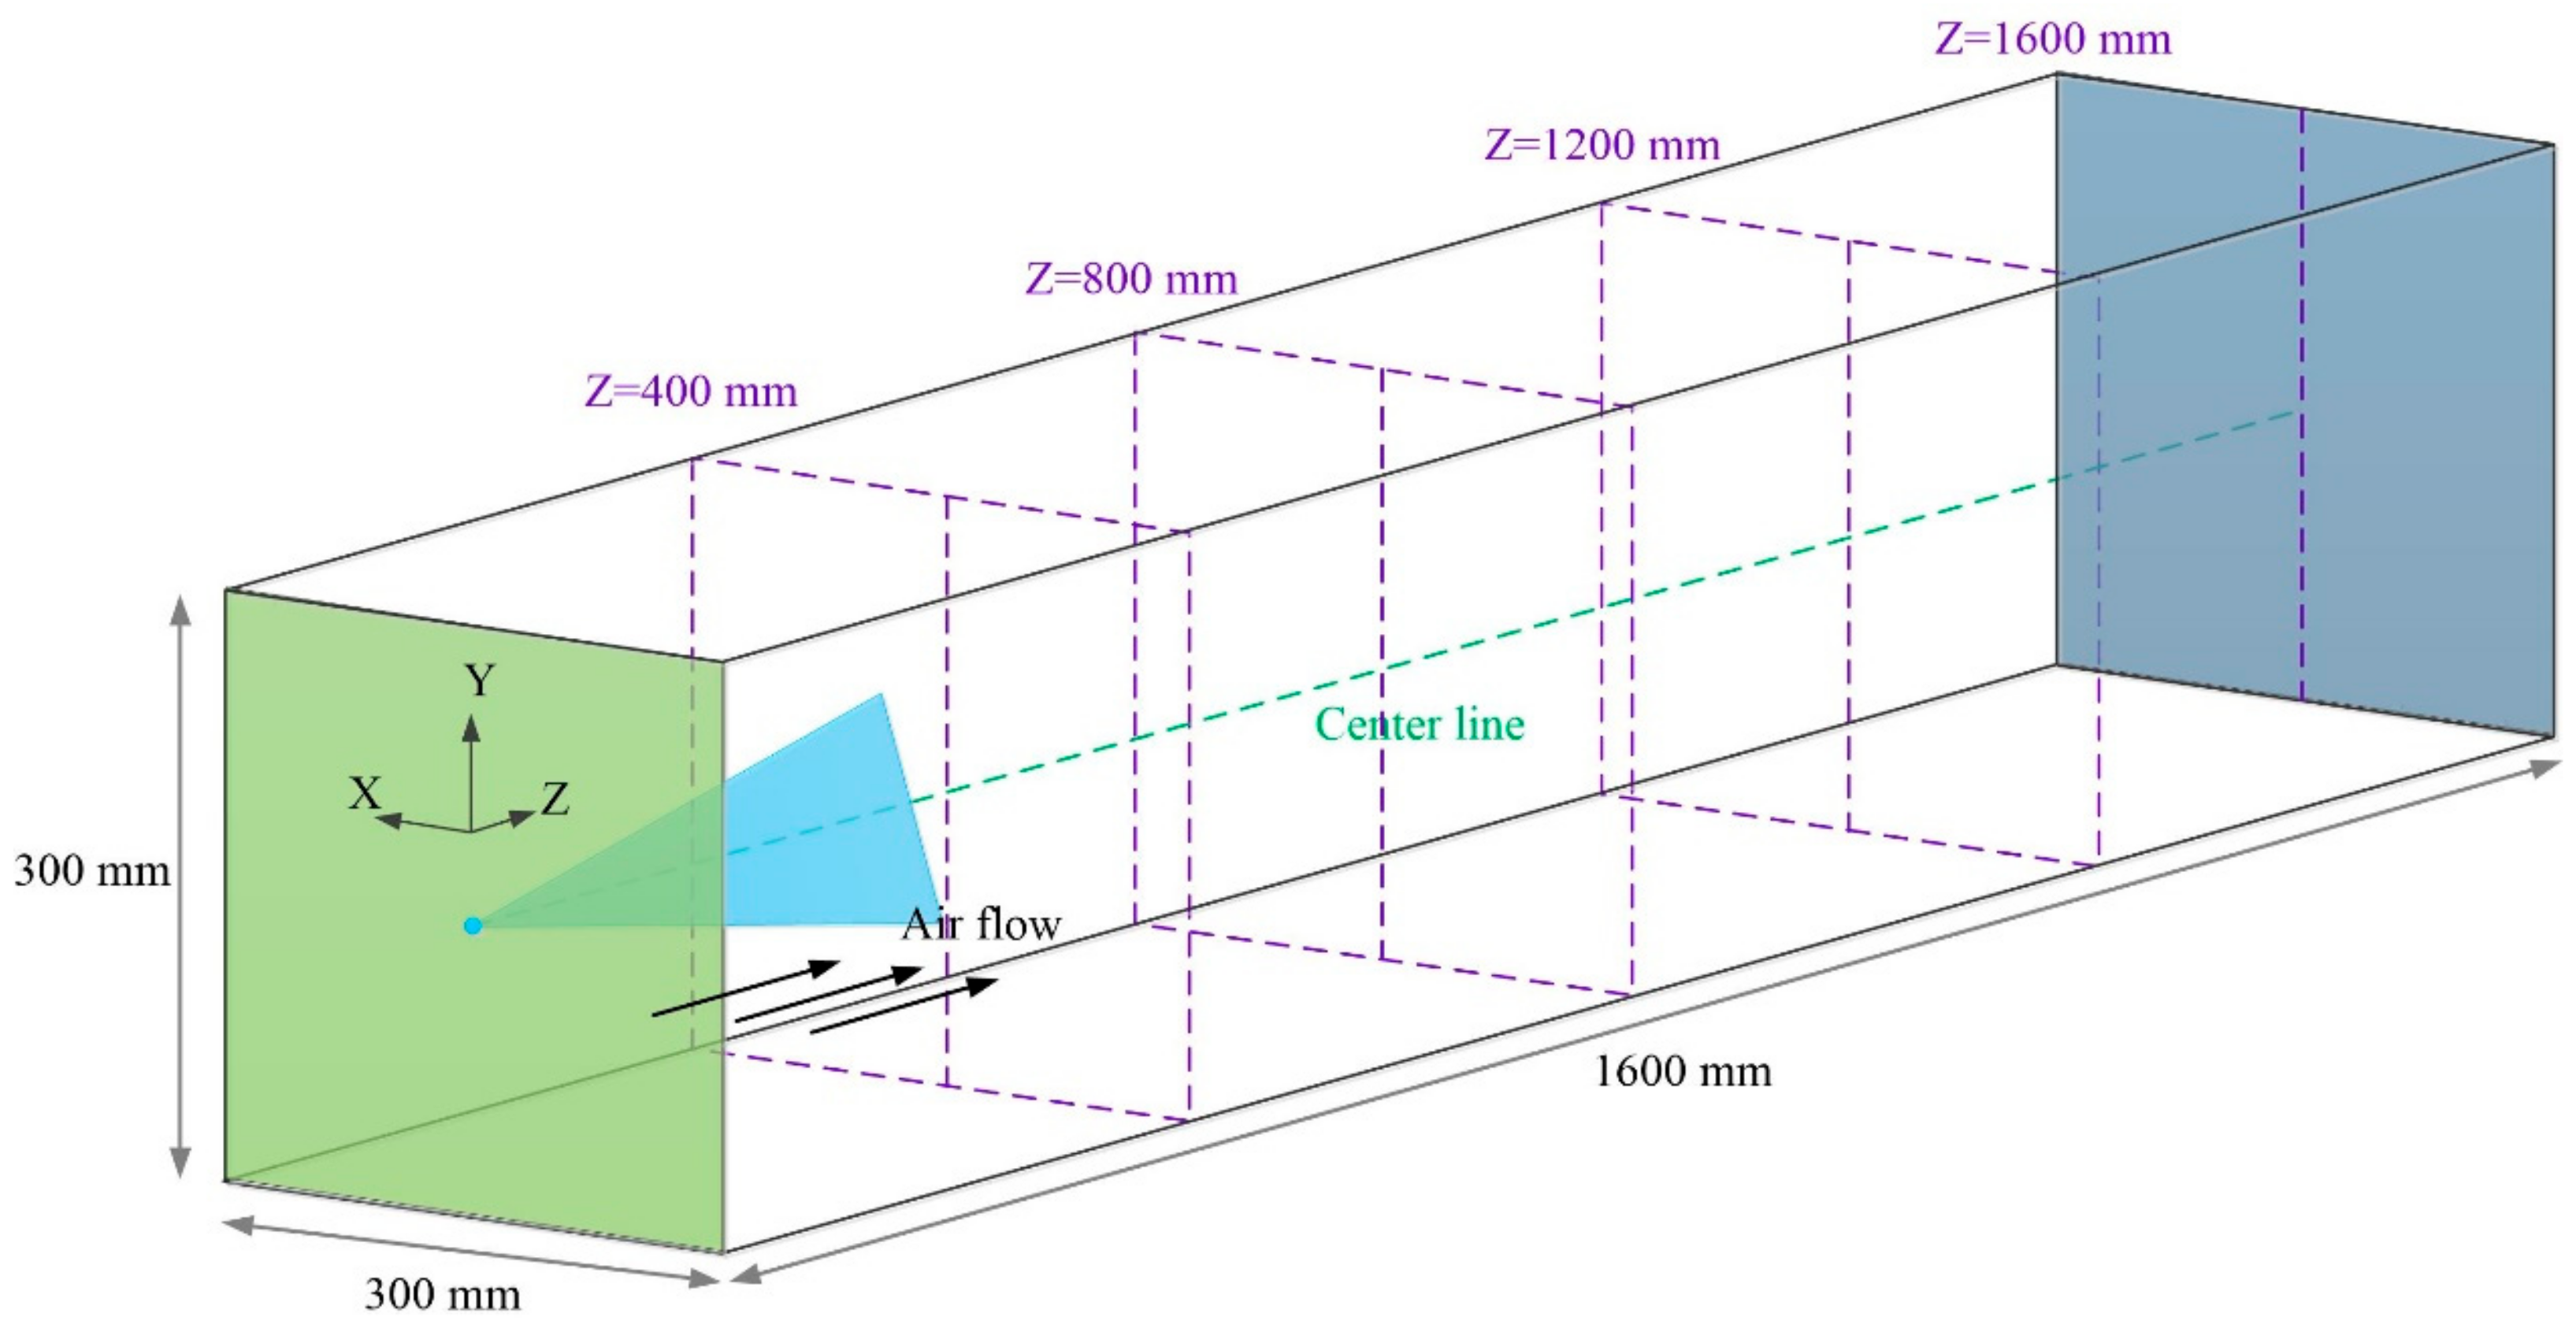
3.2. Computational Geometry and Grid

A 3D numerical model equivalent to the air-duct test section in experimental study with dimensions 300 × 300 × 1600 mm3 was developed, as shown in Figure 4. The spray injection was placed at the center of the inlet plane and was directed horizontally along the airflow direction. The continuous phase was set as the mixture of water-vapor, oxygen, and nitrogen. The inlet in green and outlet in blue of the model were specified as the velocity-inlet and the pressure-outlet, respectively. The mean velocity and the thermal inlet boundary conditions were constant values measured in the experiment. The flow pressure at the duct outlet was set to the atmospheric pressure. The convective heat transfer and the external radiation heat transfer were prescribed for these walls, as the thermal boundary conditions. The heat transfer coefficient was specified as 5 W/(m2·k) and the external emissivity was fixed at 0.9, according to [27].
The effect of the air duct walls on the impinging droplets was considered by imposing the “reflected” boundary condition. The trajectories were terminated at the outlet where the ‘escaped” boundary condition was set. The Rosin–Rammler distribution, which was the most widely used among empirical distribution functions, was employed to characterize the spray [28]. The SIMPLE algorithm was used for the pressure and the velocity coupling. The second order upwind scheme was utilized for the spatial discretization scheme, except for the turbulent where the first order upwind scheme was employed. A quicker and better convergence could be obtained by adjusting the under-relaxation factors. The continuous phase was interacted by the discrete phase, which was updated at every continuous phase iteration.
Three structured meshes of 112,694 (coarse), 226,629 (default), and 439,569 (fine) cells were built for the mesh independence study by checking the effect of grid sizes on the average temperature, the average turbulent kinetic energy, and the average turbulent dissipation rate of specified cross-sections, as well as the velocity profile along the center line. The results in Figure 5 show that the computed results under the default mesh were more consistent with those under the fine mesh. Taking comprehensively into account the accuracy and the computational resource, the default mesh was chosen in the following simulations.

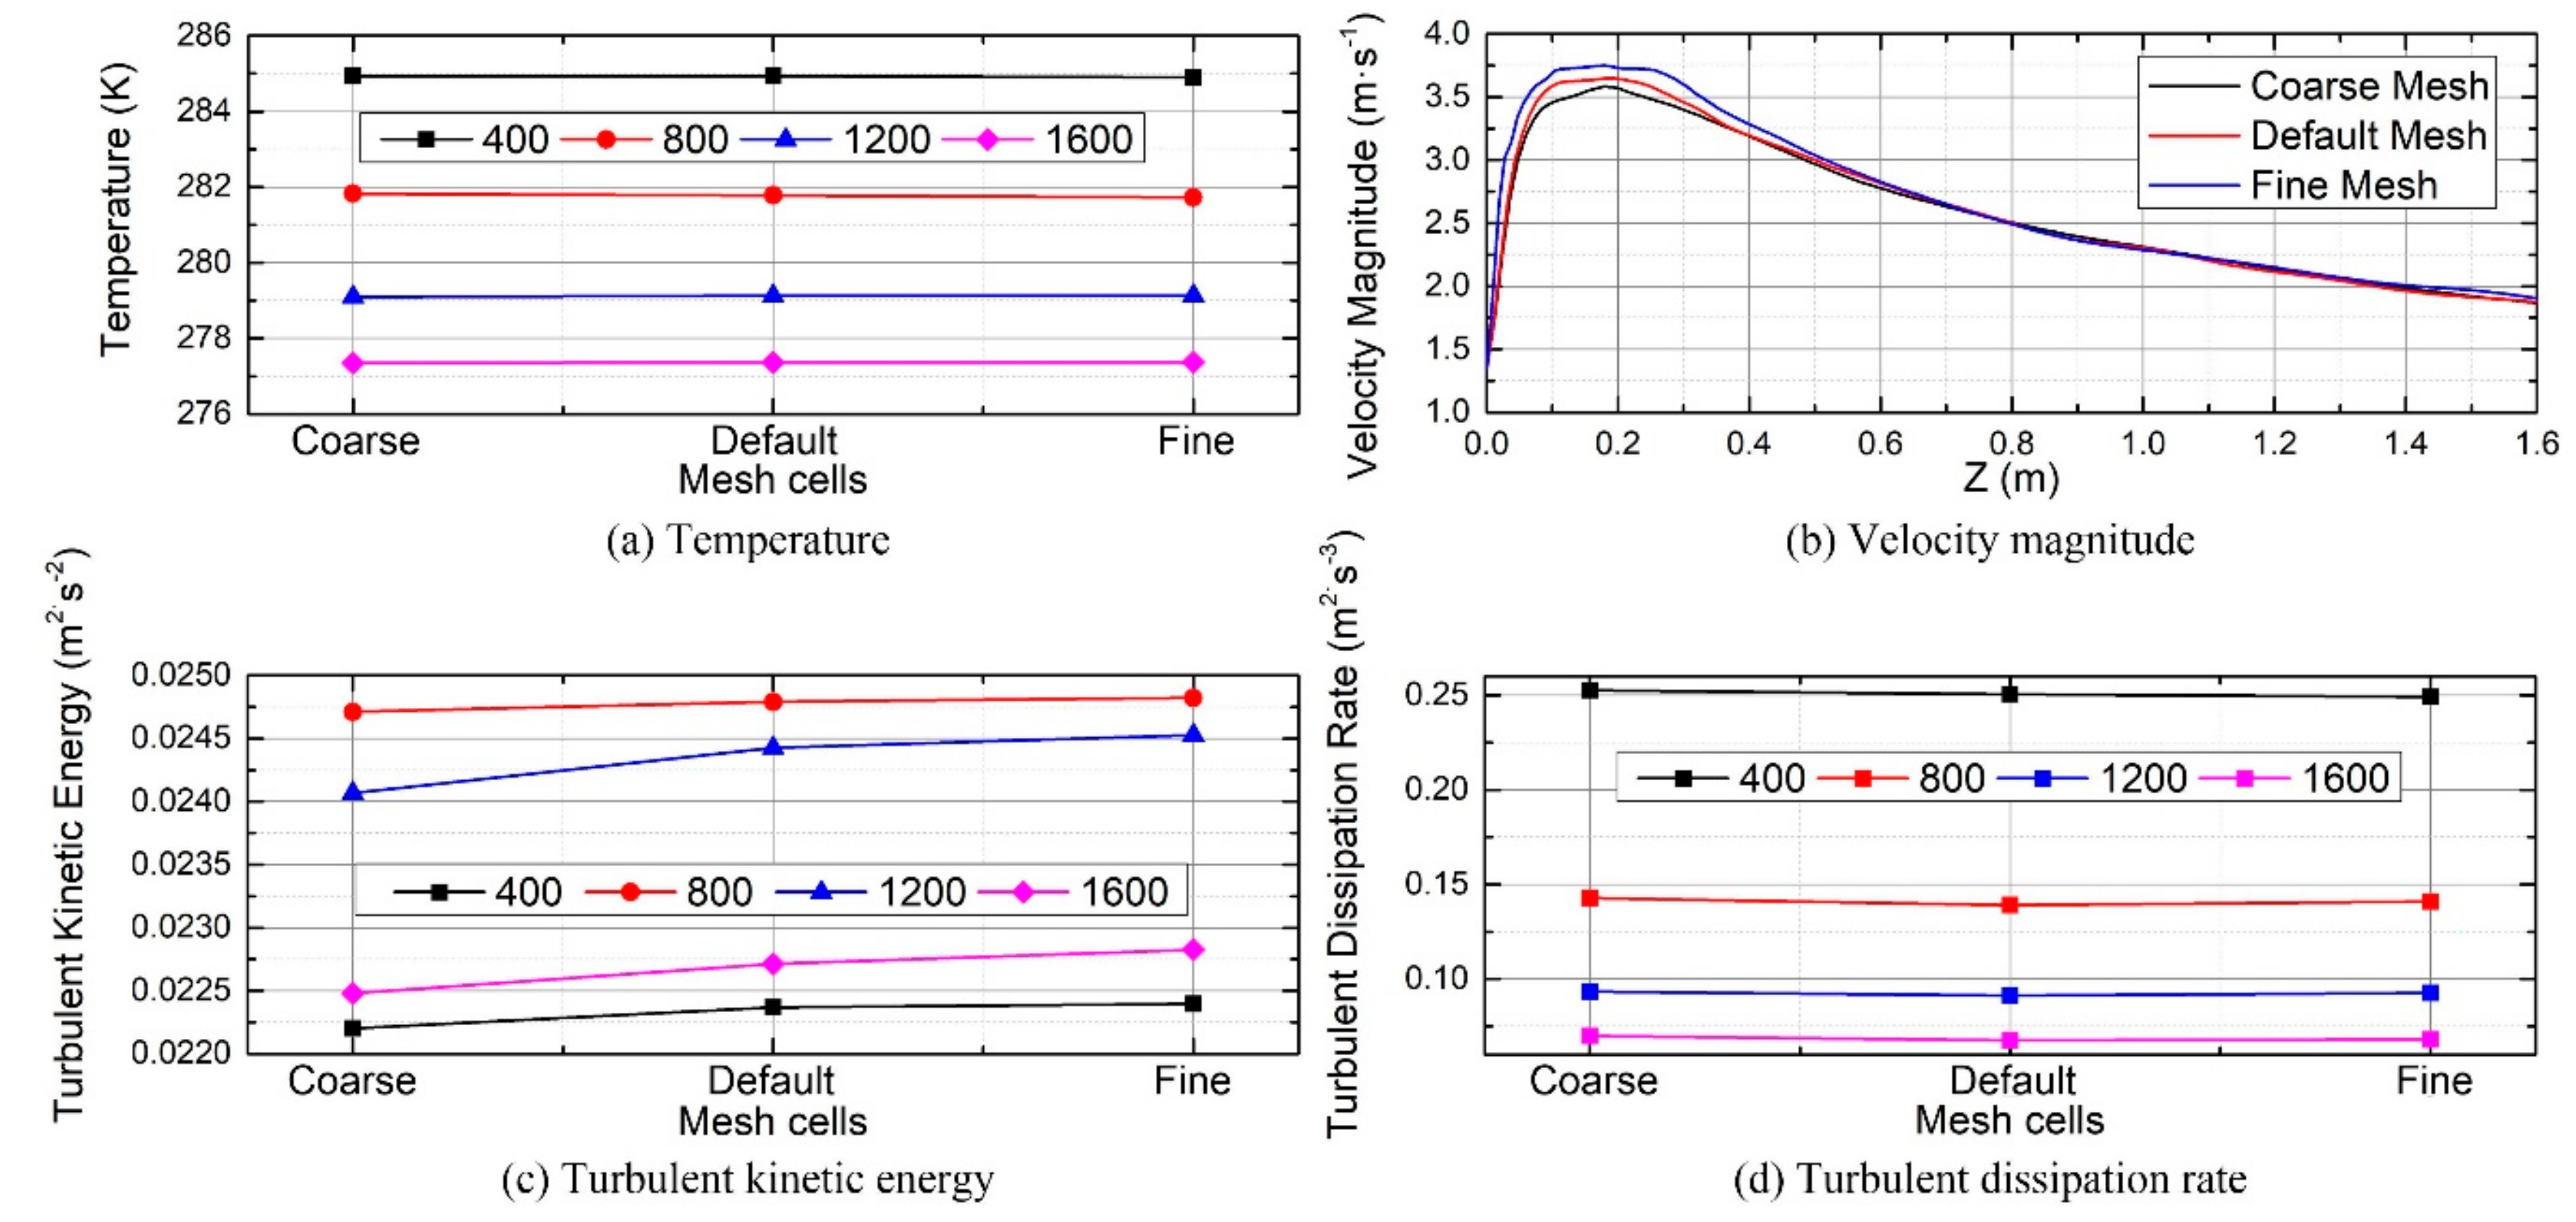
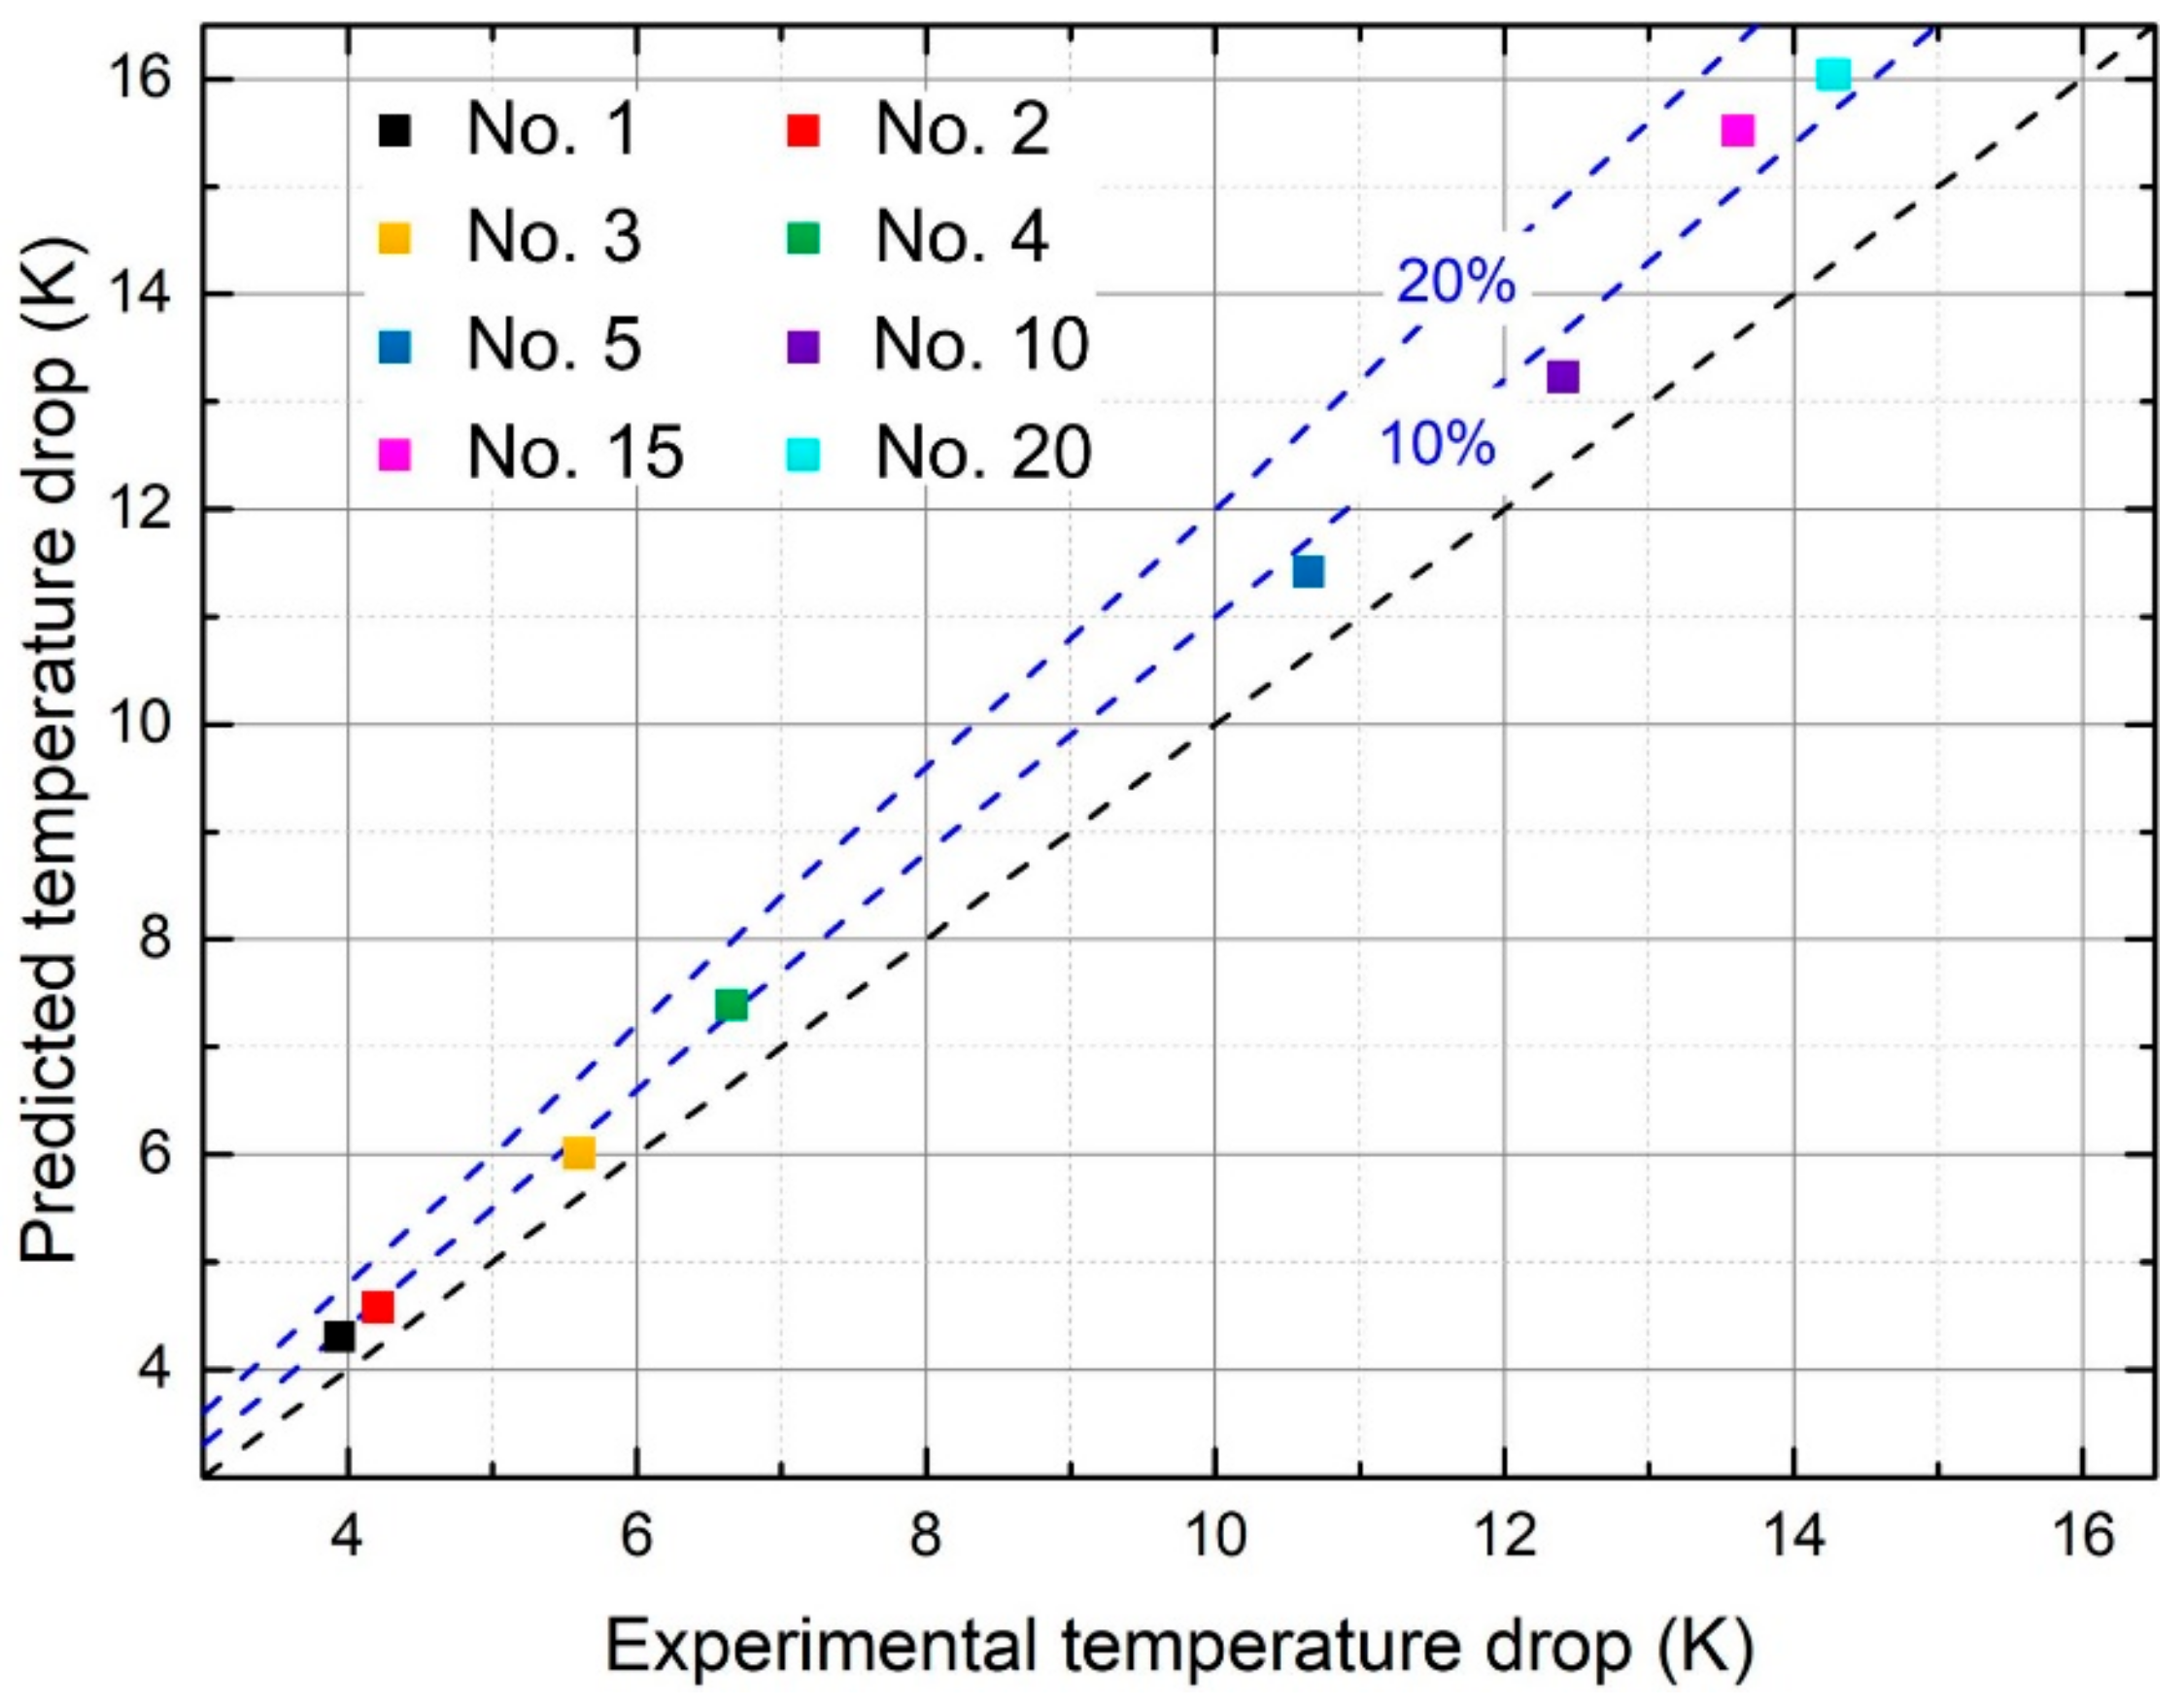
3.3. Model Verification

The numerical model was validated against the experimental data based on the average temperature drops between the inlet and outlet plane of the tested section. Eight experimental cases were chosen for comparison; the results are presented in Figure 6. It is clear that the numerical predictions agreed well with experimental data and their deviations were within 20%. Compared with numerical temperature drops, the smaller measured results were obtained mainly due to the heat leakage in the experiment.

4. Results and Discussion

As mentioned in the introduction, the spray injection pressure was fluctuant in a practical spray system and the mass flow rate oscillated periodically and synchronously with the inlet pressure fluctuation. Therefore, to ascertain its effect on the liquid nitrogen spray, sine-wave-type mass flow rate variations with different amplitudes and frequencies were assumed in the calculations. The sine function is given by:
Q ˙ in = Q ˙ initial + A sin 2 π f t
where Q ˙ initial is the constant mass flow rate, A is the amplitude, f is the frequency, and t is the simulation time or injection time. In this study, A is set to be 10% and 20% of the mass flow rate, and f is set to be 1 Hz, 10 Hz, 20 Hz, 40 Hz, and 60 Hz, respectively. The following computations were conducted at No. 5 in Table 1 in the experimental study with Q ˙ initial of 0.005 kg·s−1 and a flow velocity of 1.34 m·s−1, which was referred to as Case A in the numerical study. The evaporation rate of Case A was about 0.004 kg·s−1 and the evaporation ratio, (i.e., the ratio of the evaporation rate to the mass flow rate) was about 80%. In order to evaluate the impact of the fluctuations under different evaporation ratio cases, the computational conditions were expanded to Case B with Q ˙ initial of 0.01 kg·s−1 and a flow velocity of 5 m·s−1, and Case C with a Q ˙ initial of 0.02 kg·s−1, and a flow velocity of 10 m·s−1. The overall computational cases are detailed in Table 2.

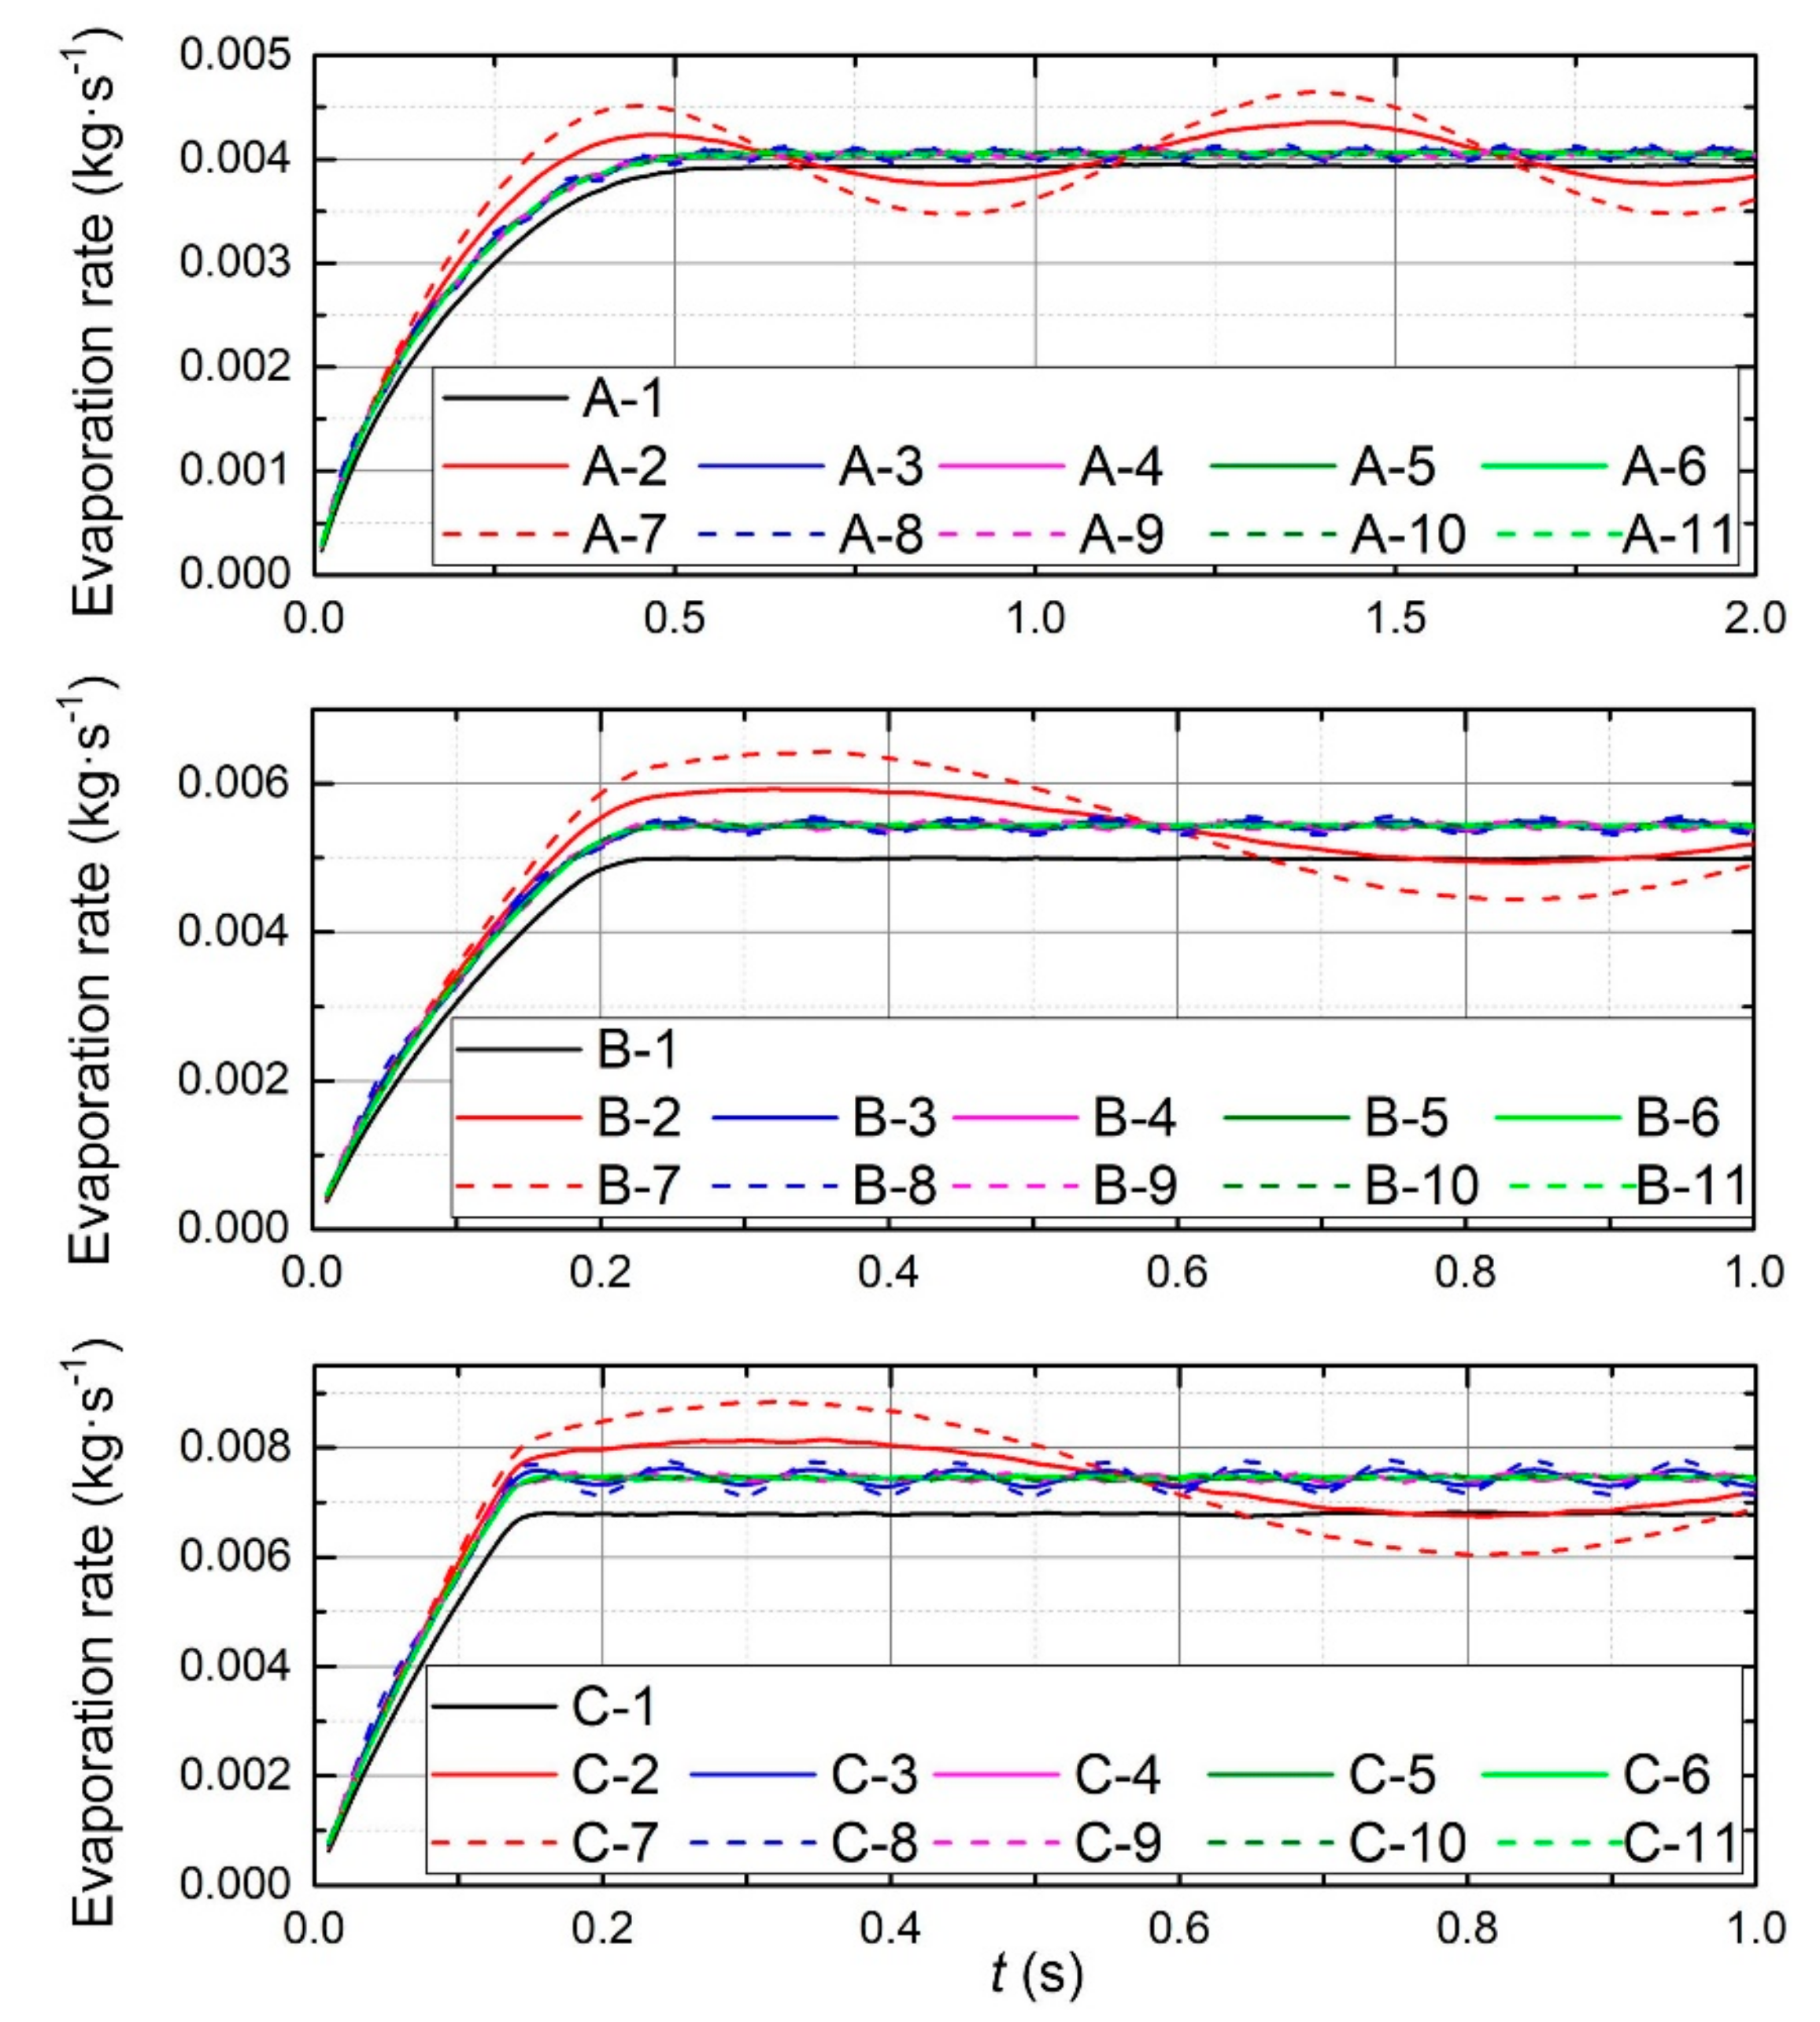
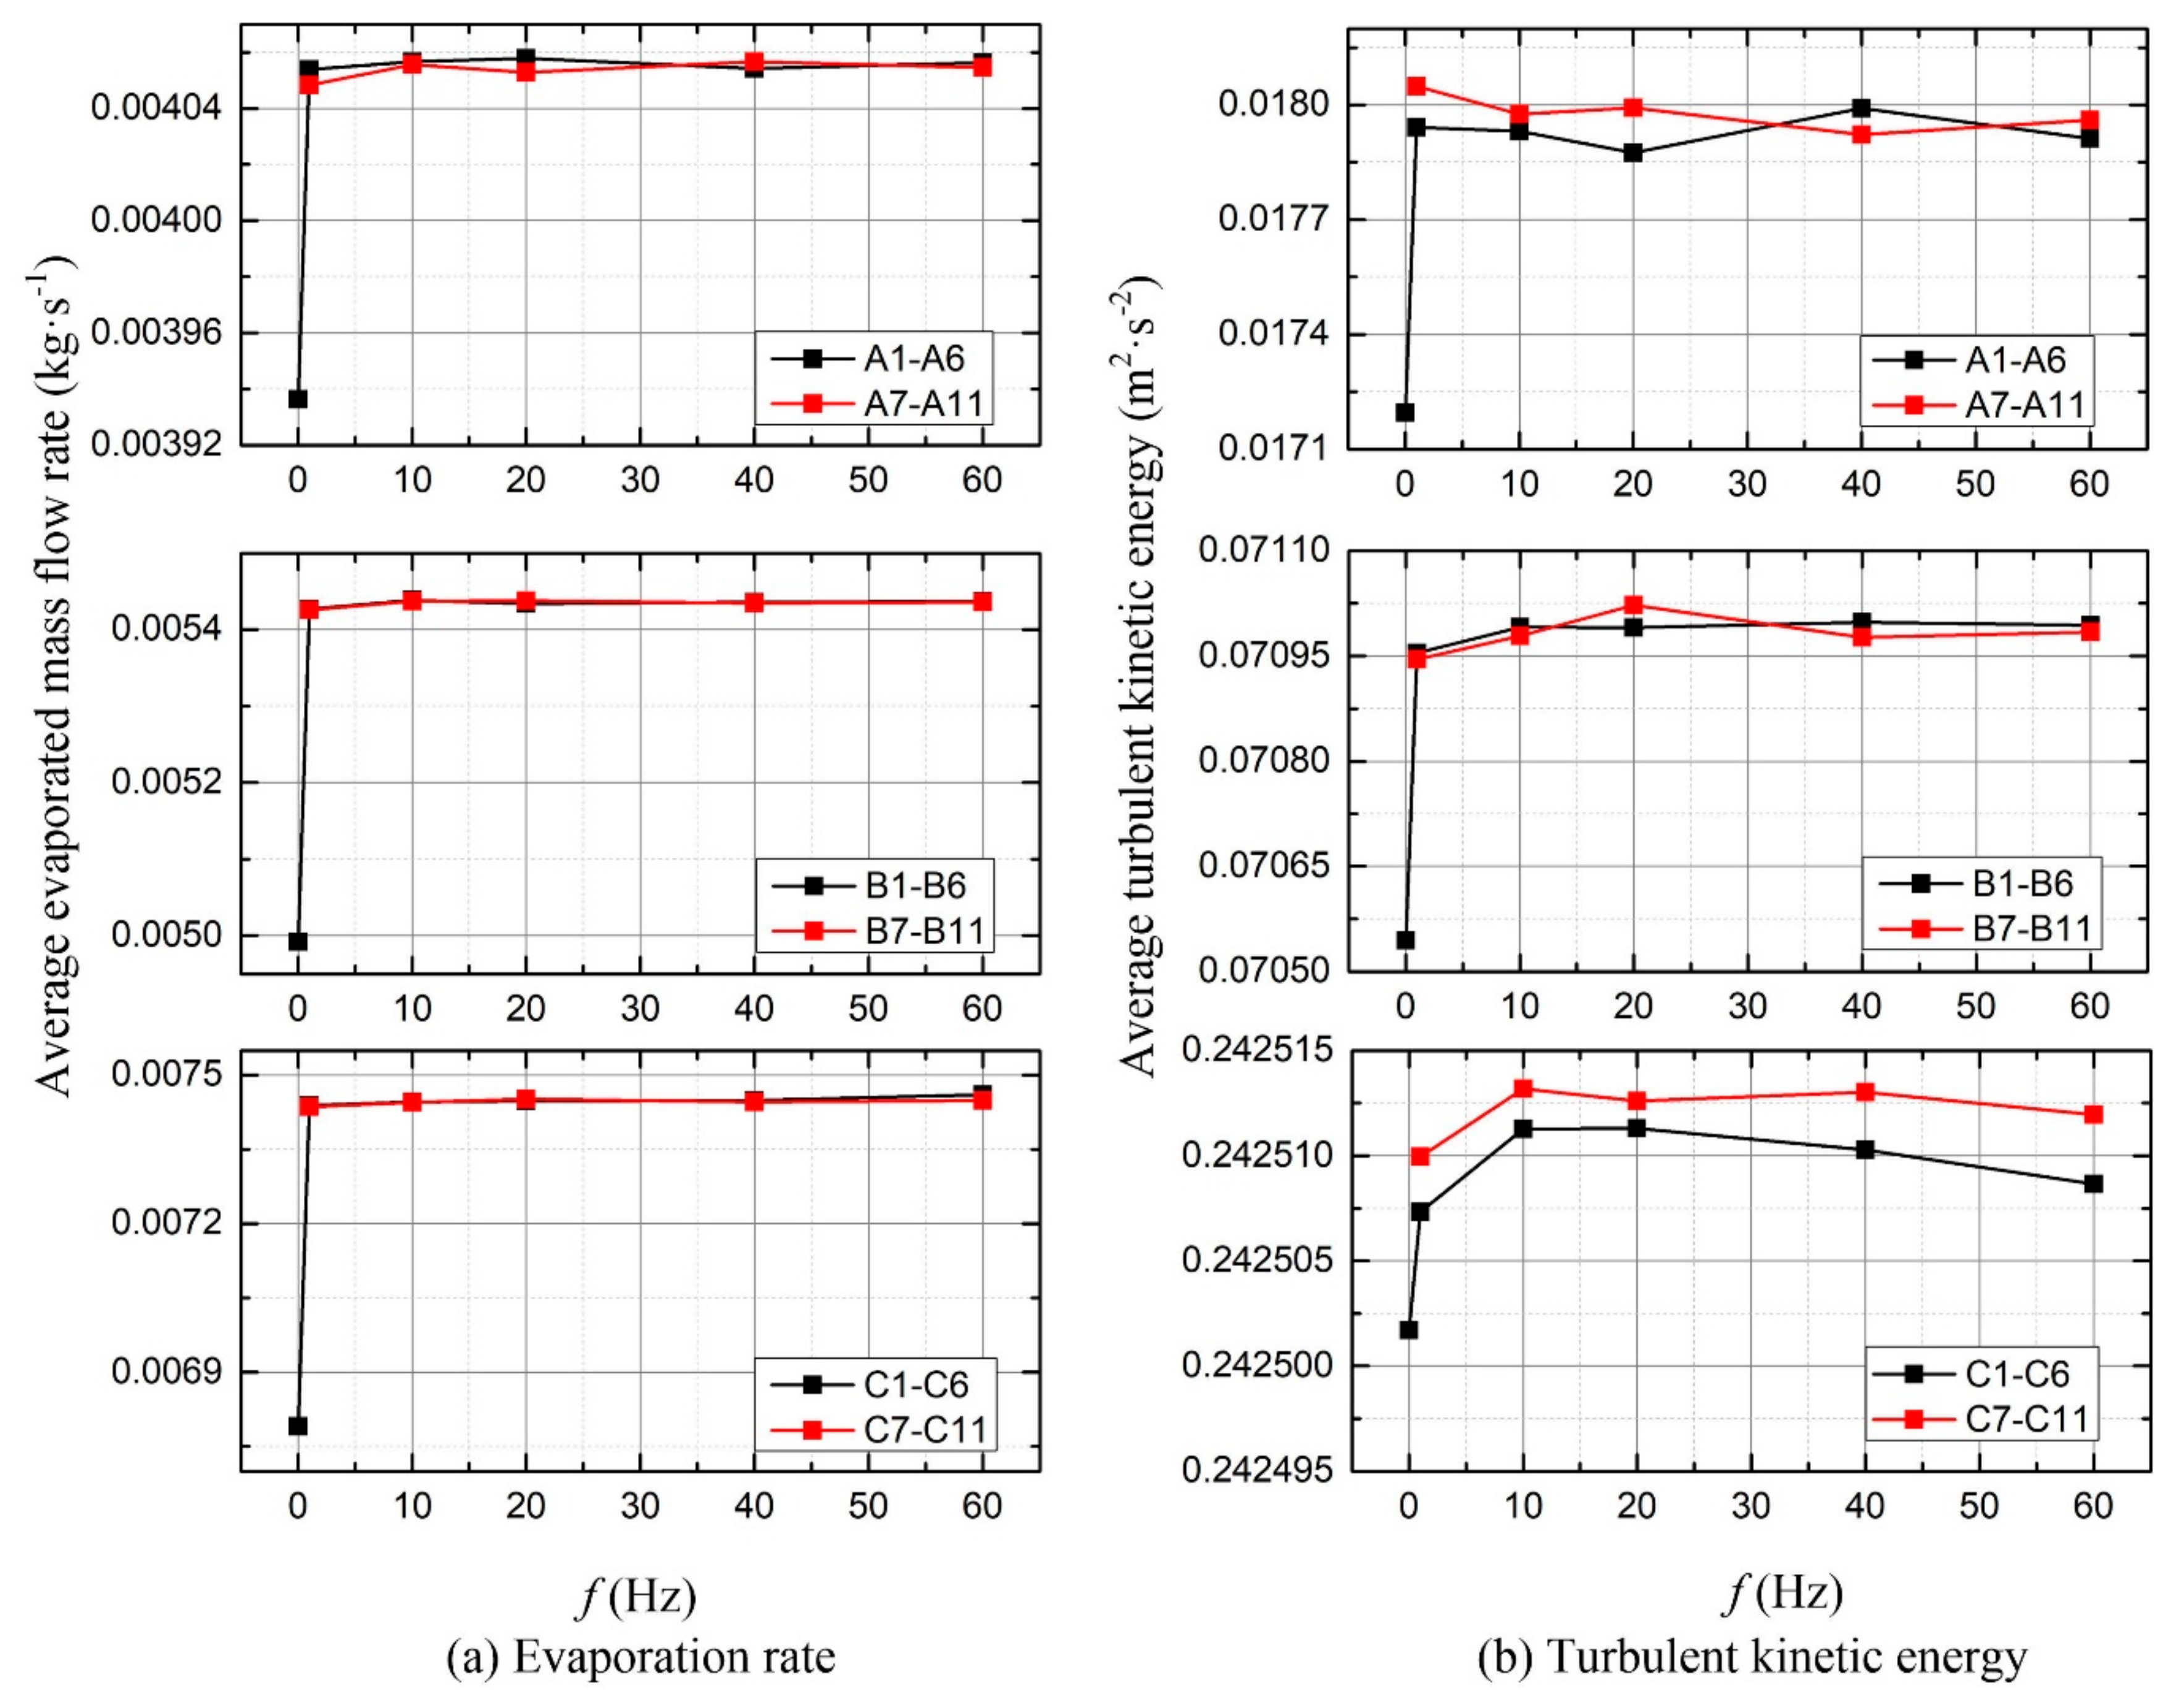
4.1. Evaporation of Spray Field

The time-dependent evaporation rates under different cases are presented in Figure 7. The trend of evaporation rates could be divided into two independent phases. During the initial stage of the liquid nitrogen spray, the evaporation rates increased gradually. As the amplitude increased under a given frequency, the corresponding liquid nitrogen evaporated slightly fast. The reason was that the maximum injection momentum increased with the peak value of the mass flow rate, which could slightly increase the amount of injection at the same time. During the full development stage of the liquid nitrogen spray, the evaporation rates fluctuated periodically around an average value, at the same frequency as the injection flow rate. It was seen that the evaporation rate of Case A was the smallest with the smallest fluctuation, followed by Case B, and Case C had the largest fluctuation.
The average evaporation rates were obtained by averaging the values over time during the full developmental stage and are illustrated in Figure 8a. The evaporation ratios of Case A, Case B, and Case C were around 80%, 50%, and 34%, respectively. It indicated that incomplete evaporation happened under all cases and a portion of liquid nitrogen droplets escaped from the duct. For a specific case, the oscillating injection enhanced the average evaporation rate, compared with the steady injection. Among the three cases, the difference between the steady and oscillating injection of Case A was the smallest and that of Case C was the largest, which was about a 10% increase. It indicated that the oscillating injection had a more significant impact on the computational cases with a smaller evaporation ratio. Moreover, the evaporation hardly changed with the frequency and the amplitude of the mass flow rate fluctuation.
The intensive evaporation was induced by the fluctuating injection, because of the increased turbulent kinetic energy (TKE) of the whole spray field. The average TKE was obtained by averaging over the entire volume, as shown in Figure 8b. As the injection mass flow rate fluctuated, the vapor field background would be disturbed more intensively, and then more turbulence would be introduced accordingly and the corresponding average TKE of the spray field would increase [9]. Most of the research reported that the turbulent kinetic energy has a strong potential to enhance the droplet vaporization [29,30,31,32] and the evaporation rate of the spray field.
Refer to the impact of the fluctuating injection on the average TKE, the decreasing trend was Case A, Case B, and Case C. For Case C, a small change of the average TKE probably led to a great change of the average evaporation rate. For a given case, the average TKE would be independent of the frequency and the amplitude of the mass flow rate fluctuation.

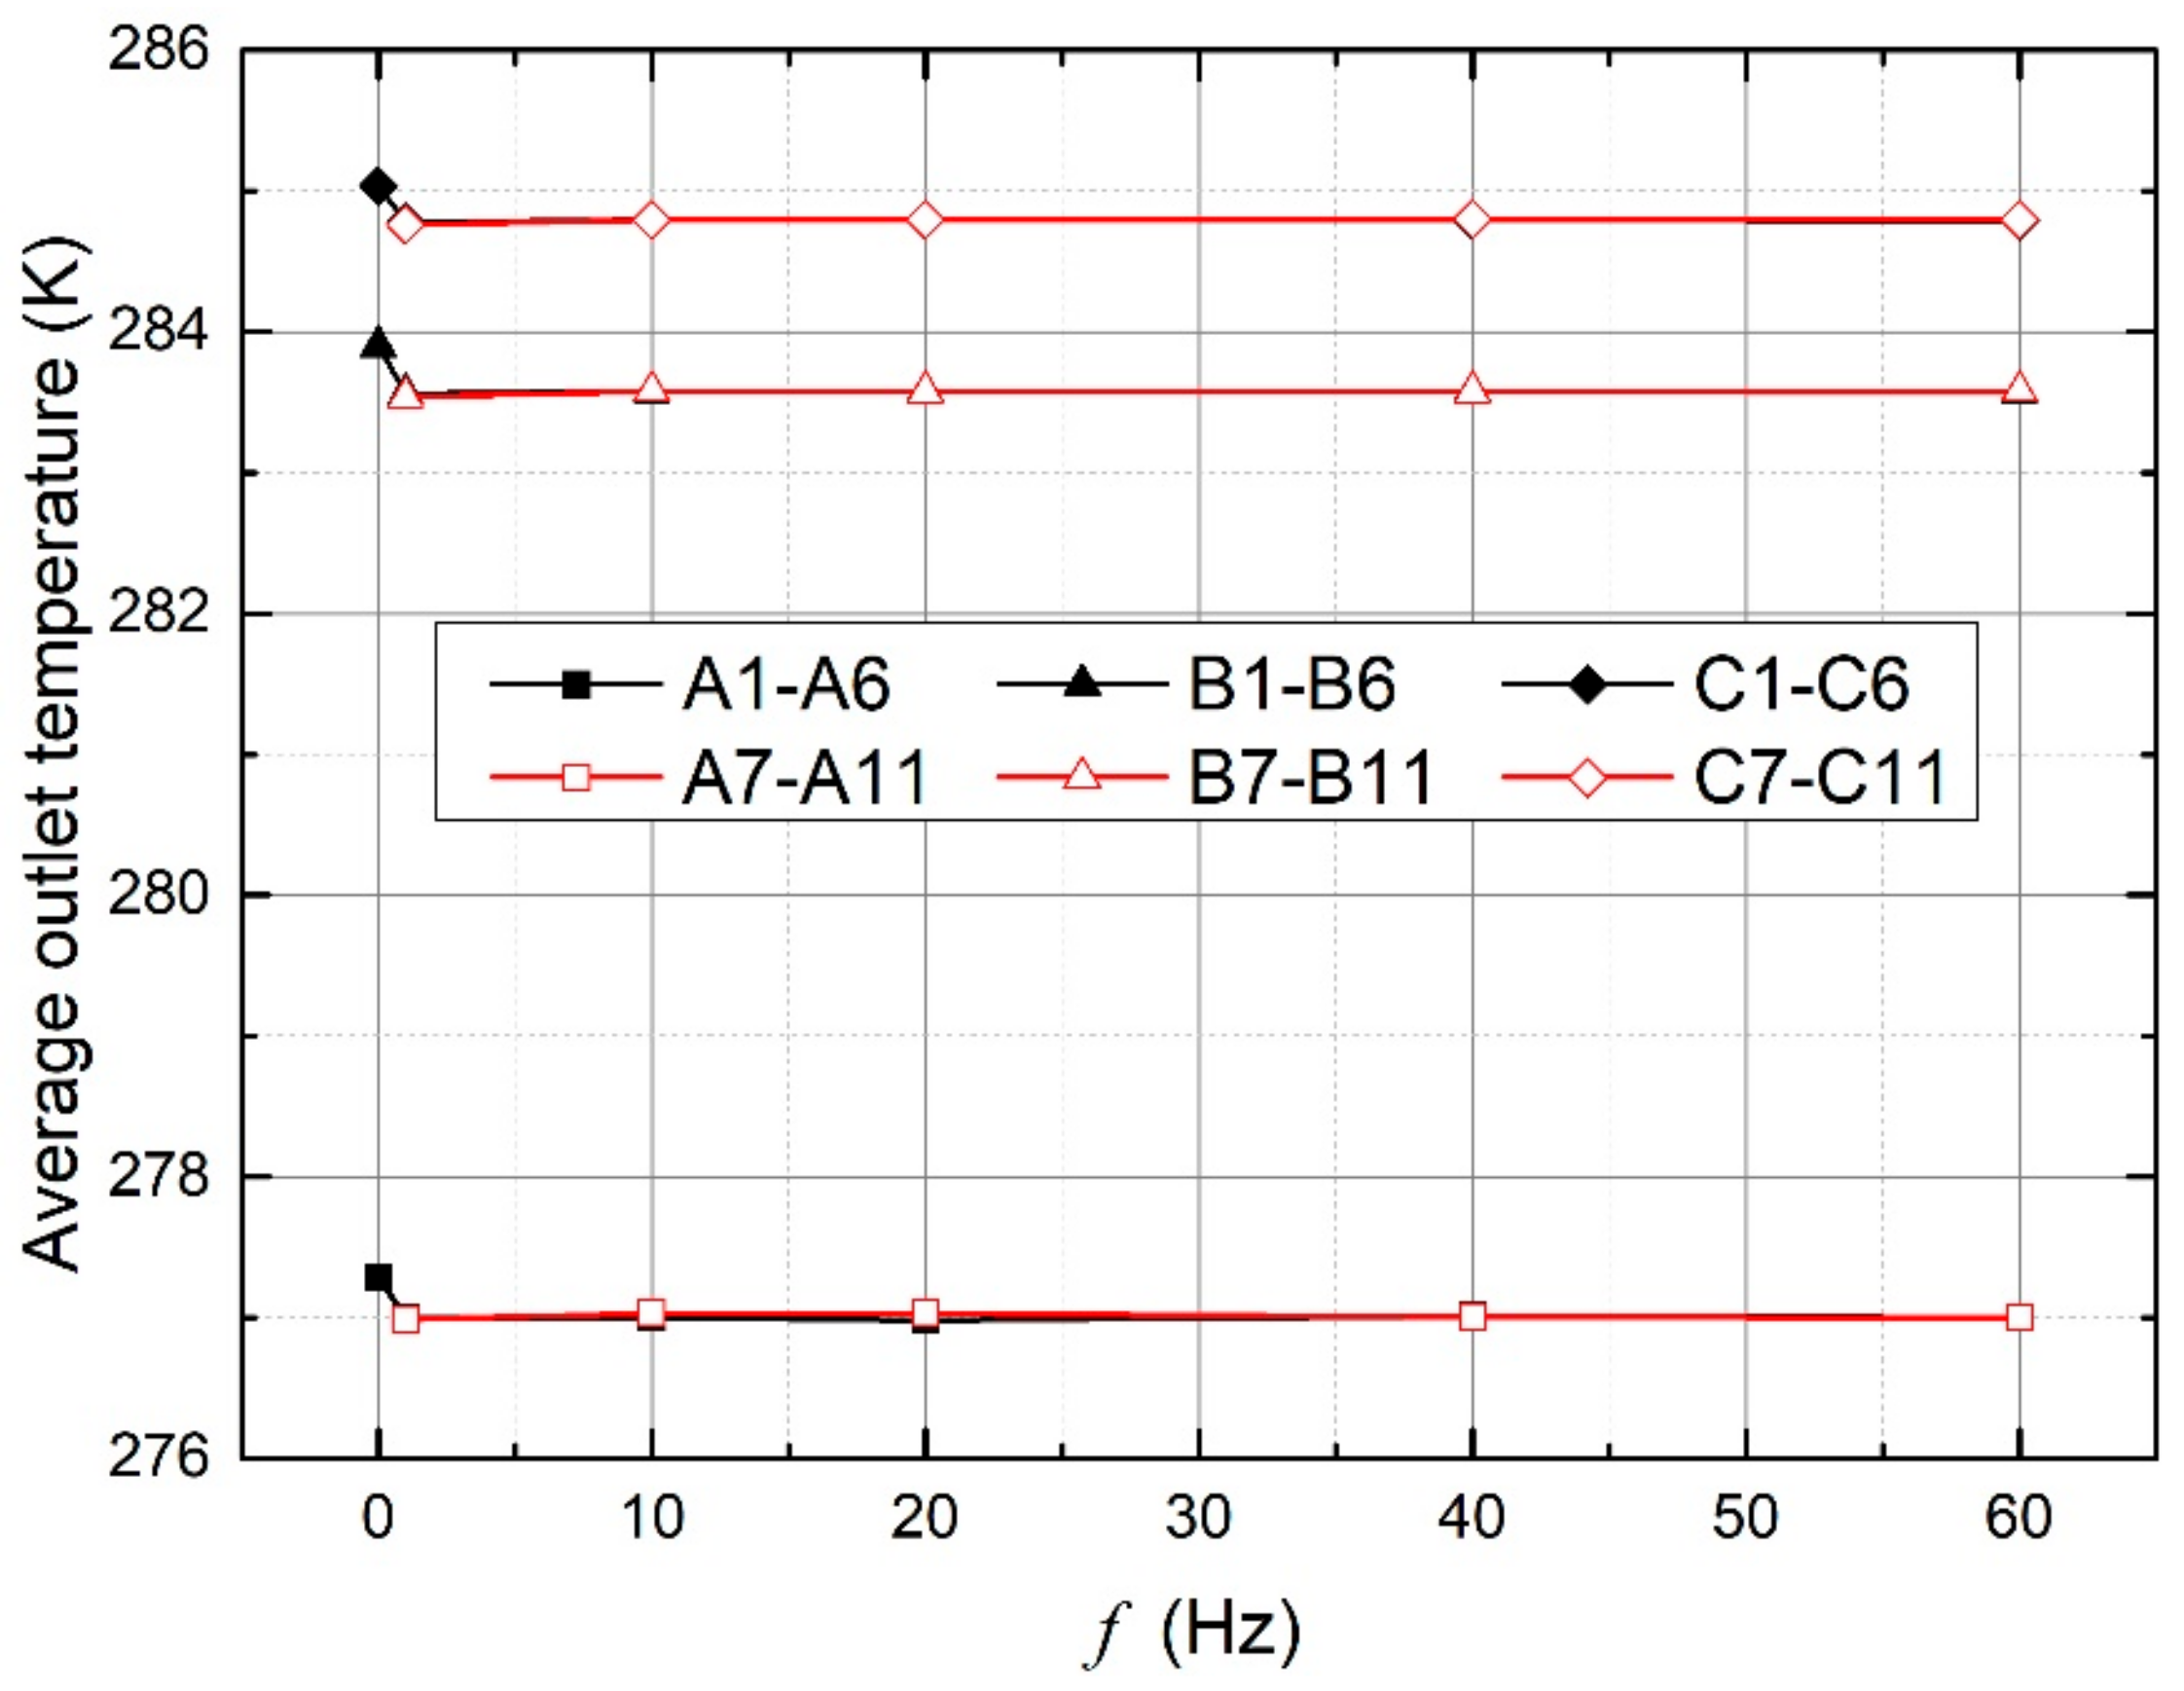
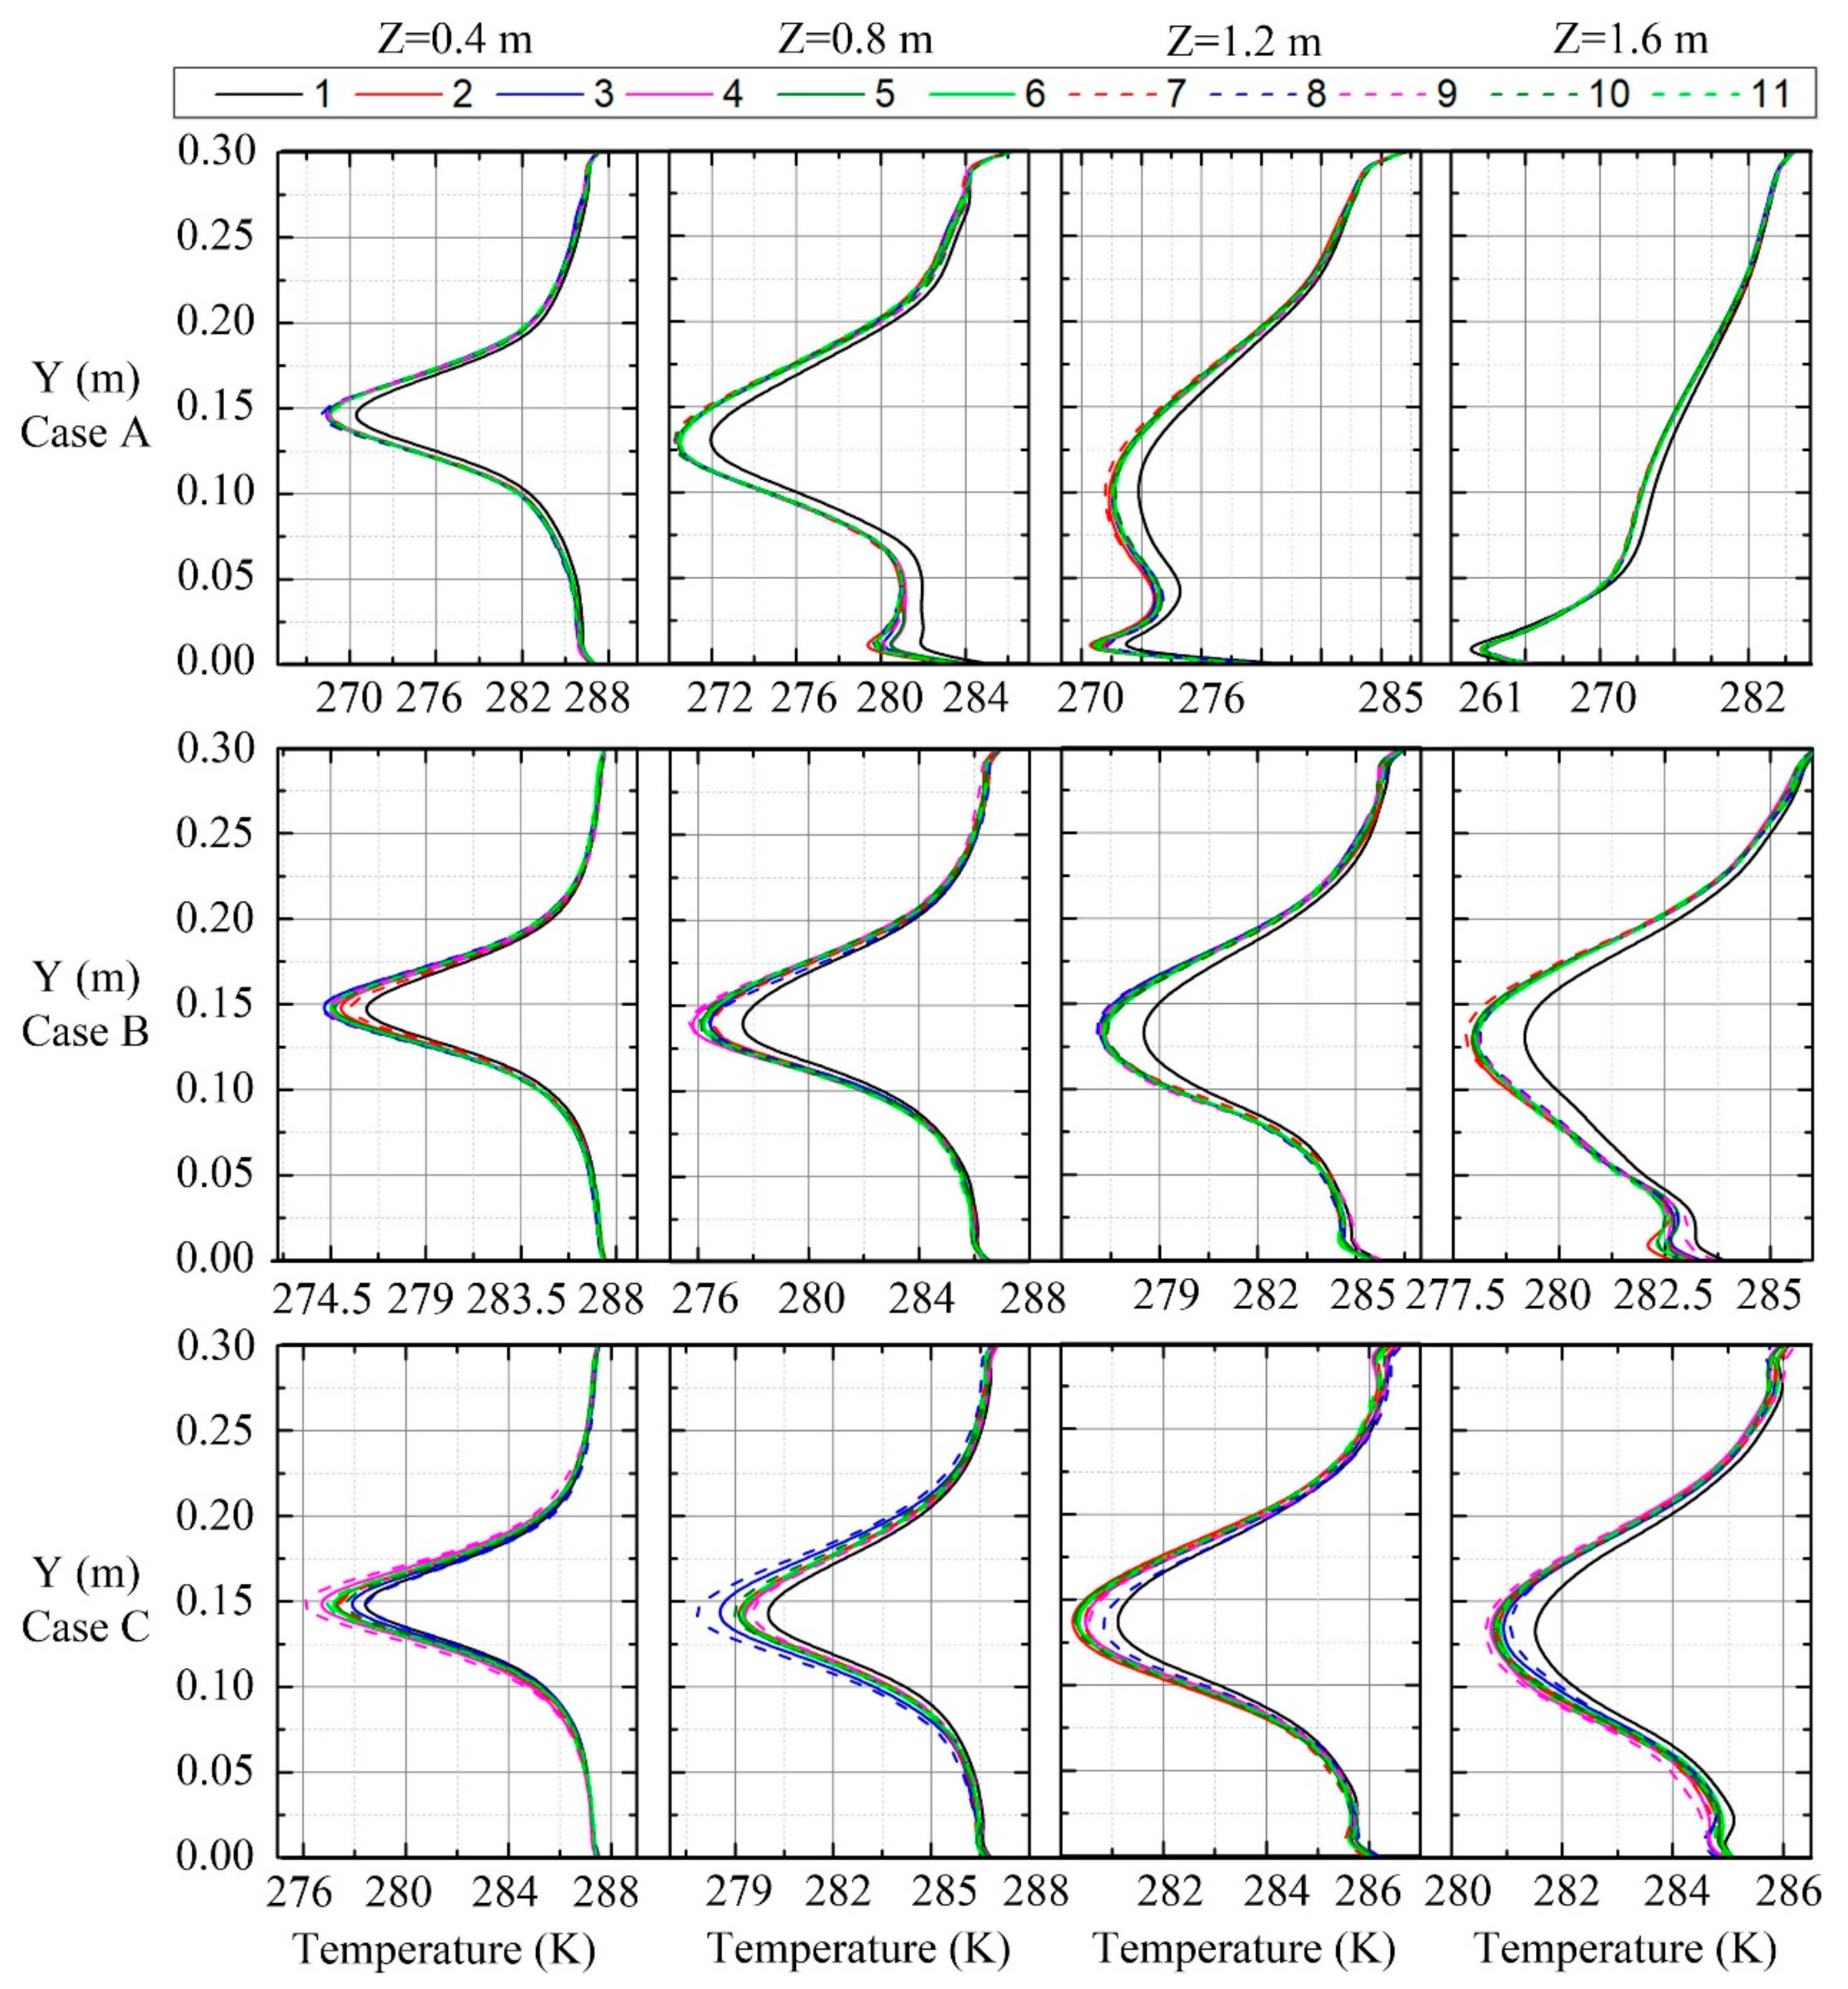
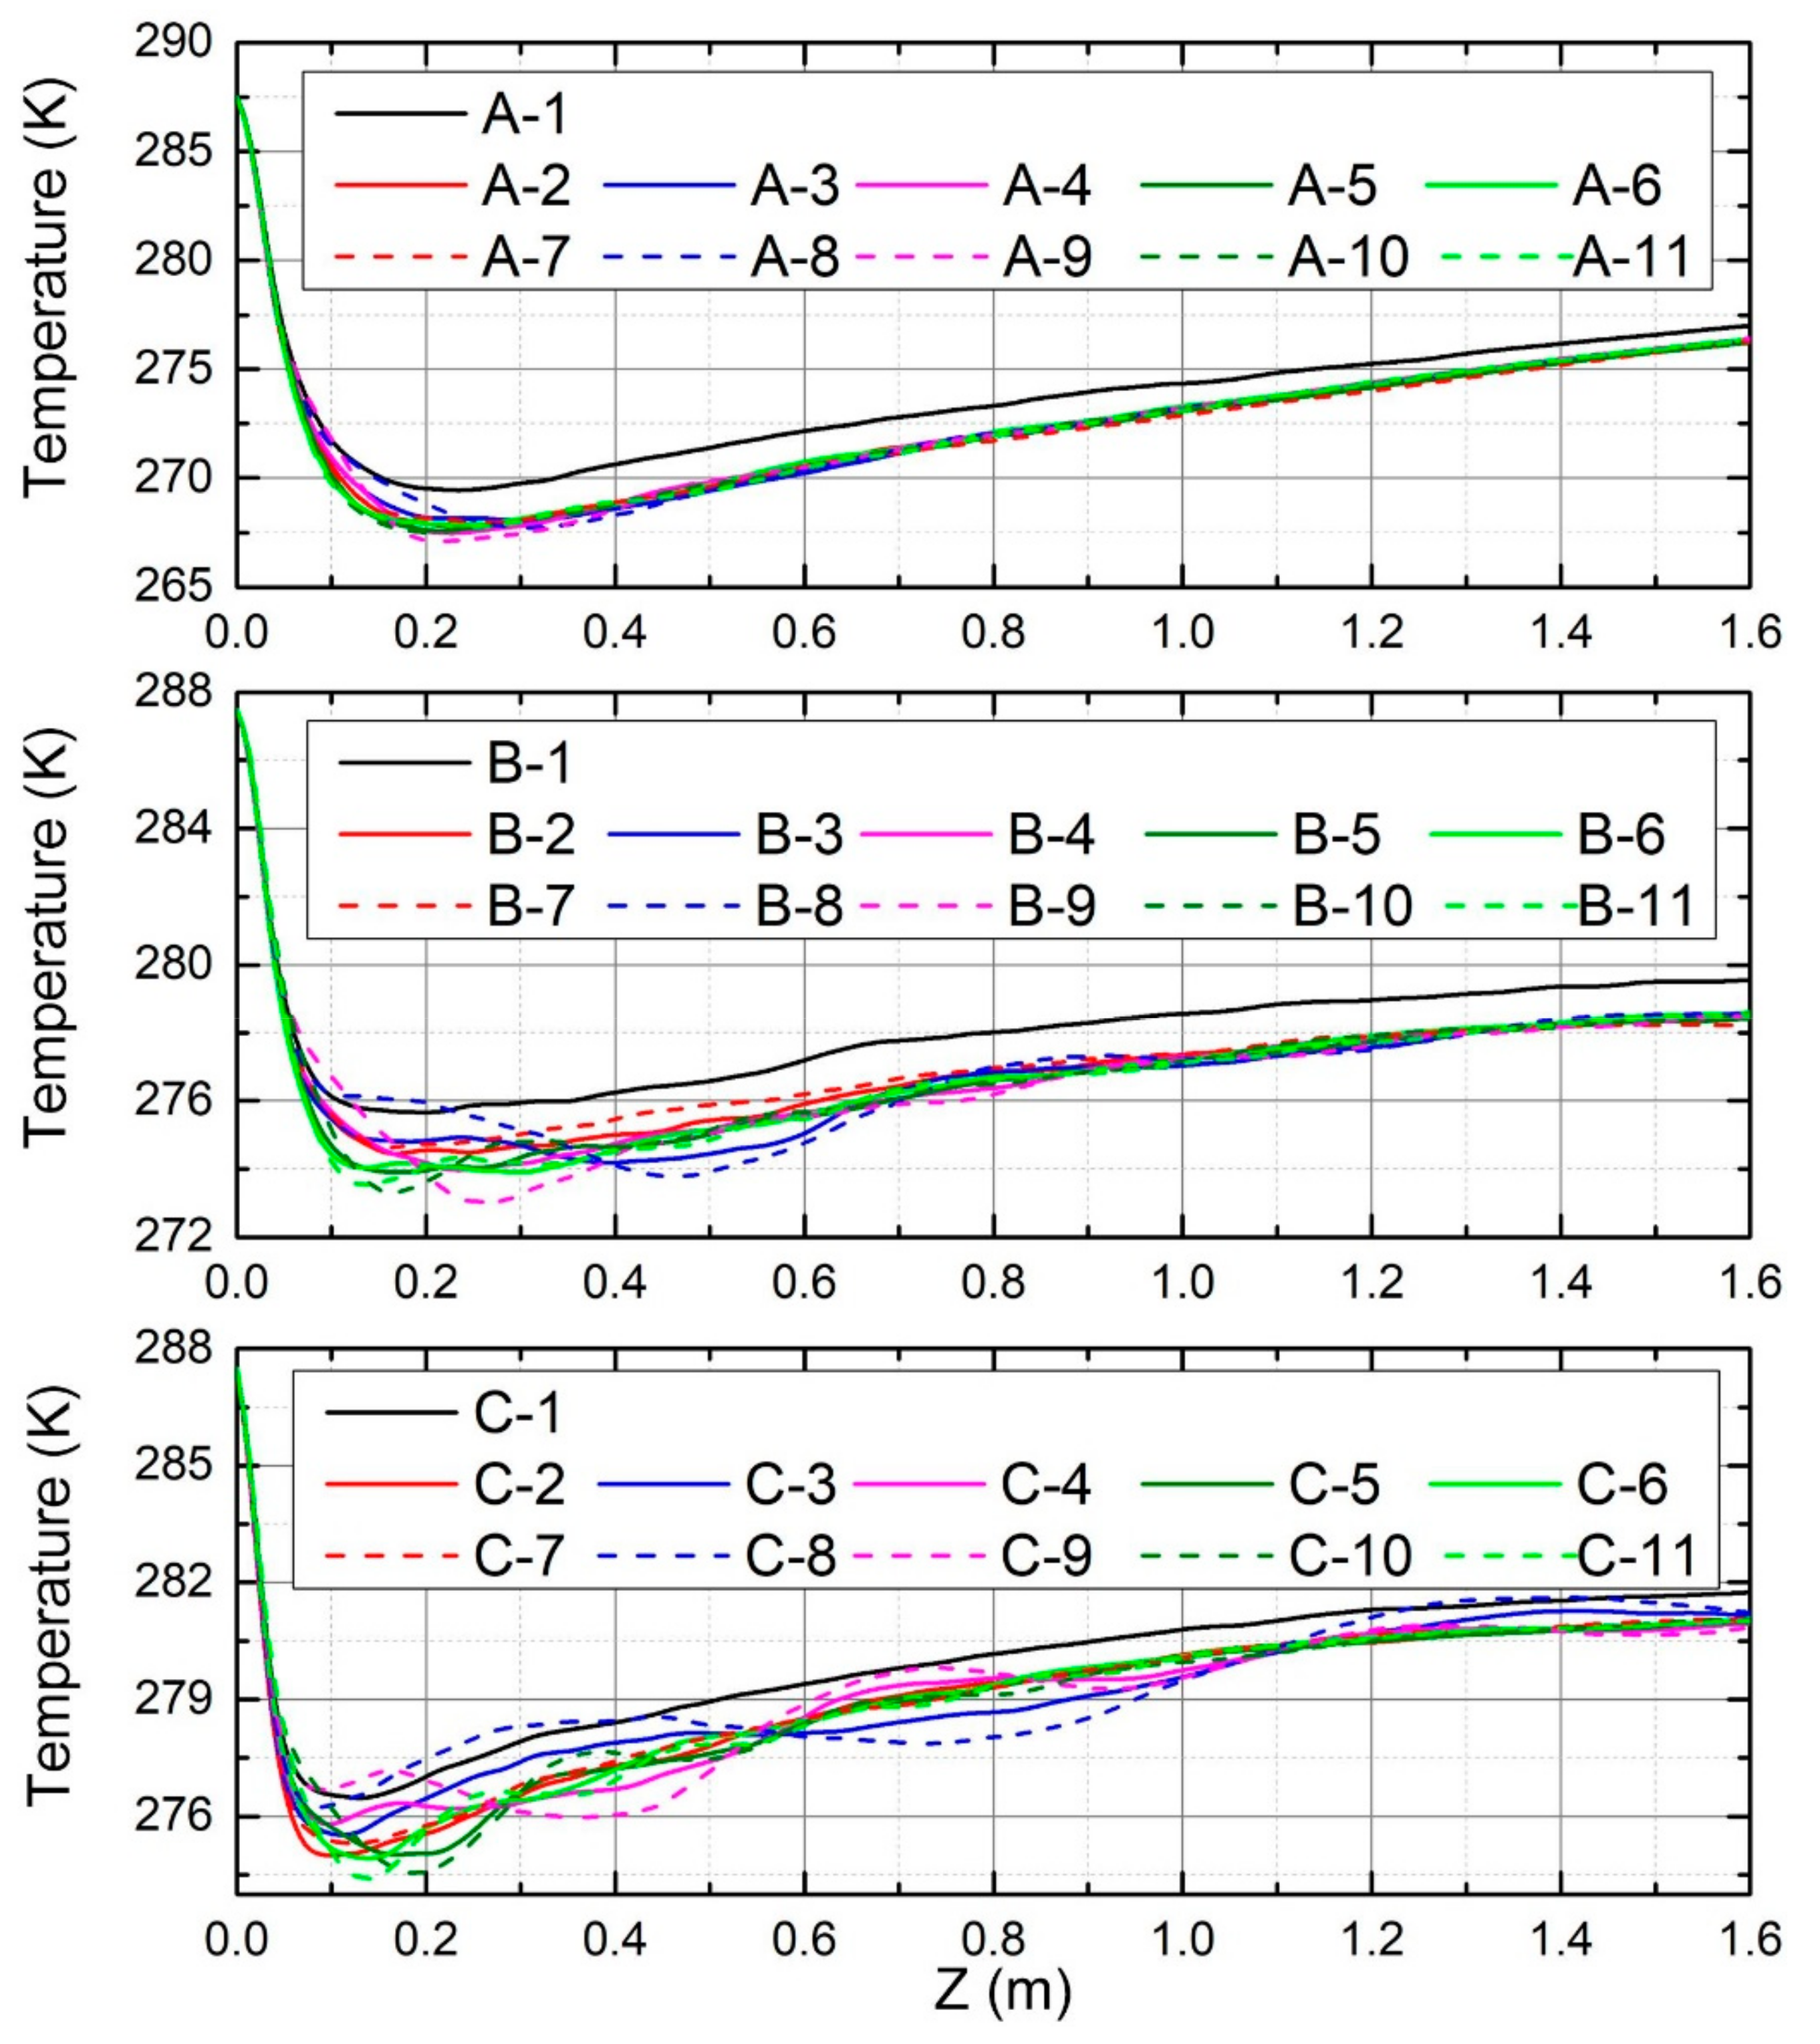
4.2. Temperature Distribution

The outlet temperature gradually decreased as liquid nitrogen was sprayed into the vapor field and fluctuated periodically during the full development stage of the spray. The phenomenon was similar to the evaporation rate. The average outlet temperatures obtained through mass-weighted-averaging method under different cases were displayed in Figure 9. The highest evaporation ratio under Case A resulted in the lowest average outlet temperature. By contrast, Case C had the highest average outlet temperature.
The most important characteristic that governed the transport rate was the relative velocity between the droplets and their surrounding medium. Even though the initial droplet velocity was the same, it would follow the air velocity along the duct after a short time at the beginning. Thus, the bigger the air velocity, the shorter was the residence time, the smaller was the evaporation ratio, and the higher was the average outlet temperature obtained.
A higher evaporation rate under the injection variation produced more cooling and a lower outlet temperature, compared with the steady inlet condition. The changes of the frequency and the amplitude hardly affected the average outlet temperature.
Figure 10 shows the temperature distributions under three cases along vertical lines at four different positions of the center plane. The temperature distributions were symmetrically close to the nozzle tip. Gravity was relatively more pronounced at the downstream area of the spray field, where the momentum of the droplets decreased. A downward movement of the droplets resulted in more cooling effects in the lower part of the duct, followed by asymmetric distributions of temperature. Case A with lowest air velocity was most affected by gravity.
The fluctuating injection led to a lower temperature at a given position, compared with a constant injection. The temperature difference between the constant and oscillating inlet increased from Case A to Case C. For Case C, with the smallest evaporation ratio, the temperature difference between different fluctuation amplitudes and frequencies was enhanced. On the contrary, the temperature curves of Case A were almost independent of the frequency and the amplitude. It was illustrated that the oscillating inlet played a more notable role when the evaporation ratio was relatively smaller.
The temperature distributions along the central line of the duct are indicated in Figure 11. It can be seen that the temperature gradually increased with the distance along the axial direction. The conclusion that gravity becomes more obvious away from the nozzle was further verified.
The temperature curve fluctuated periodically at the downstream field under a specific case. The fluctuation gradually increased with the decreased evaporation ratio from Case A to Case C. At the farther downstream area, the temperature fluctuation gradually decayed. This phenomenon was attributed to the reason that the oscillation of the mass flow rate is naturally attenuated as the transmission distance increases. Meanwhile, a weakened temperature difference between the constant and oscillating injection was obtained. Therefore, we could expect that no temperature fluctuation and no temperature difference could be observed near the outlet, based on the assumption of the infinitely long computing geometry.

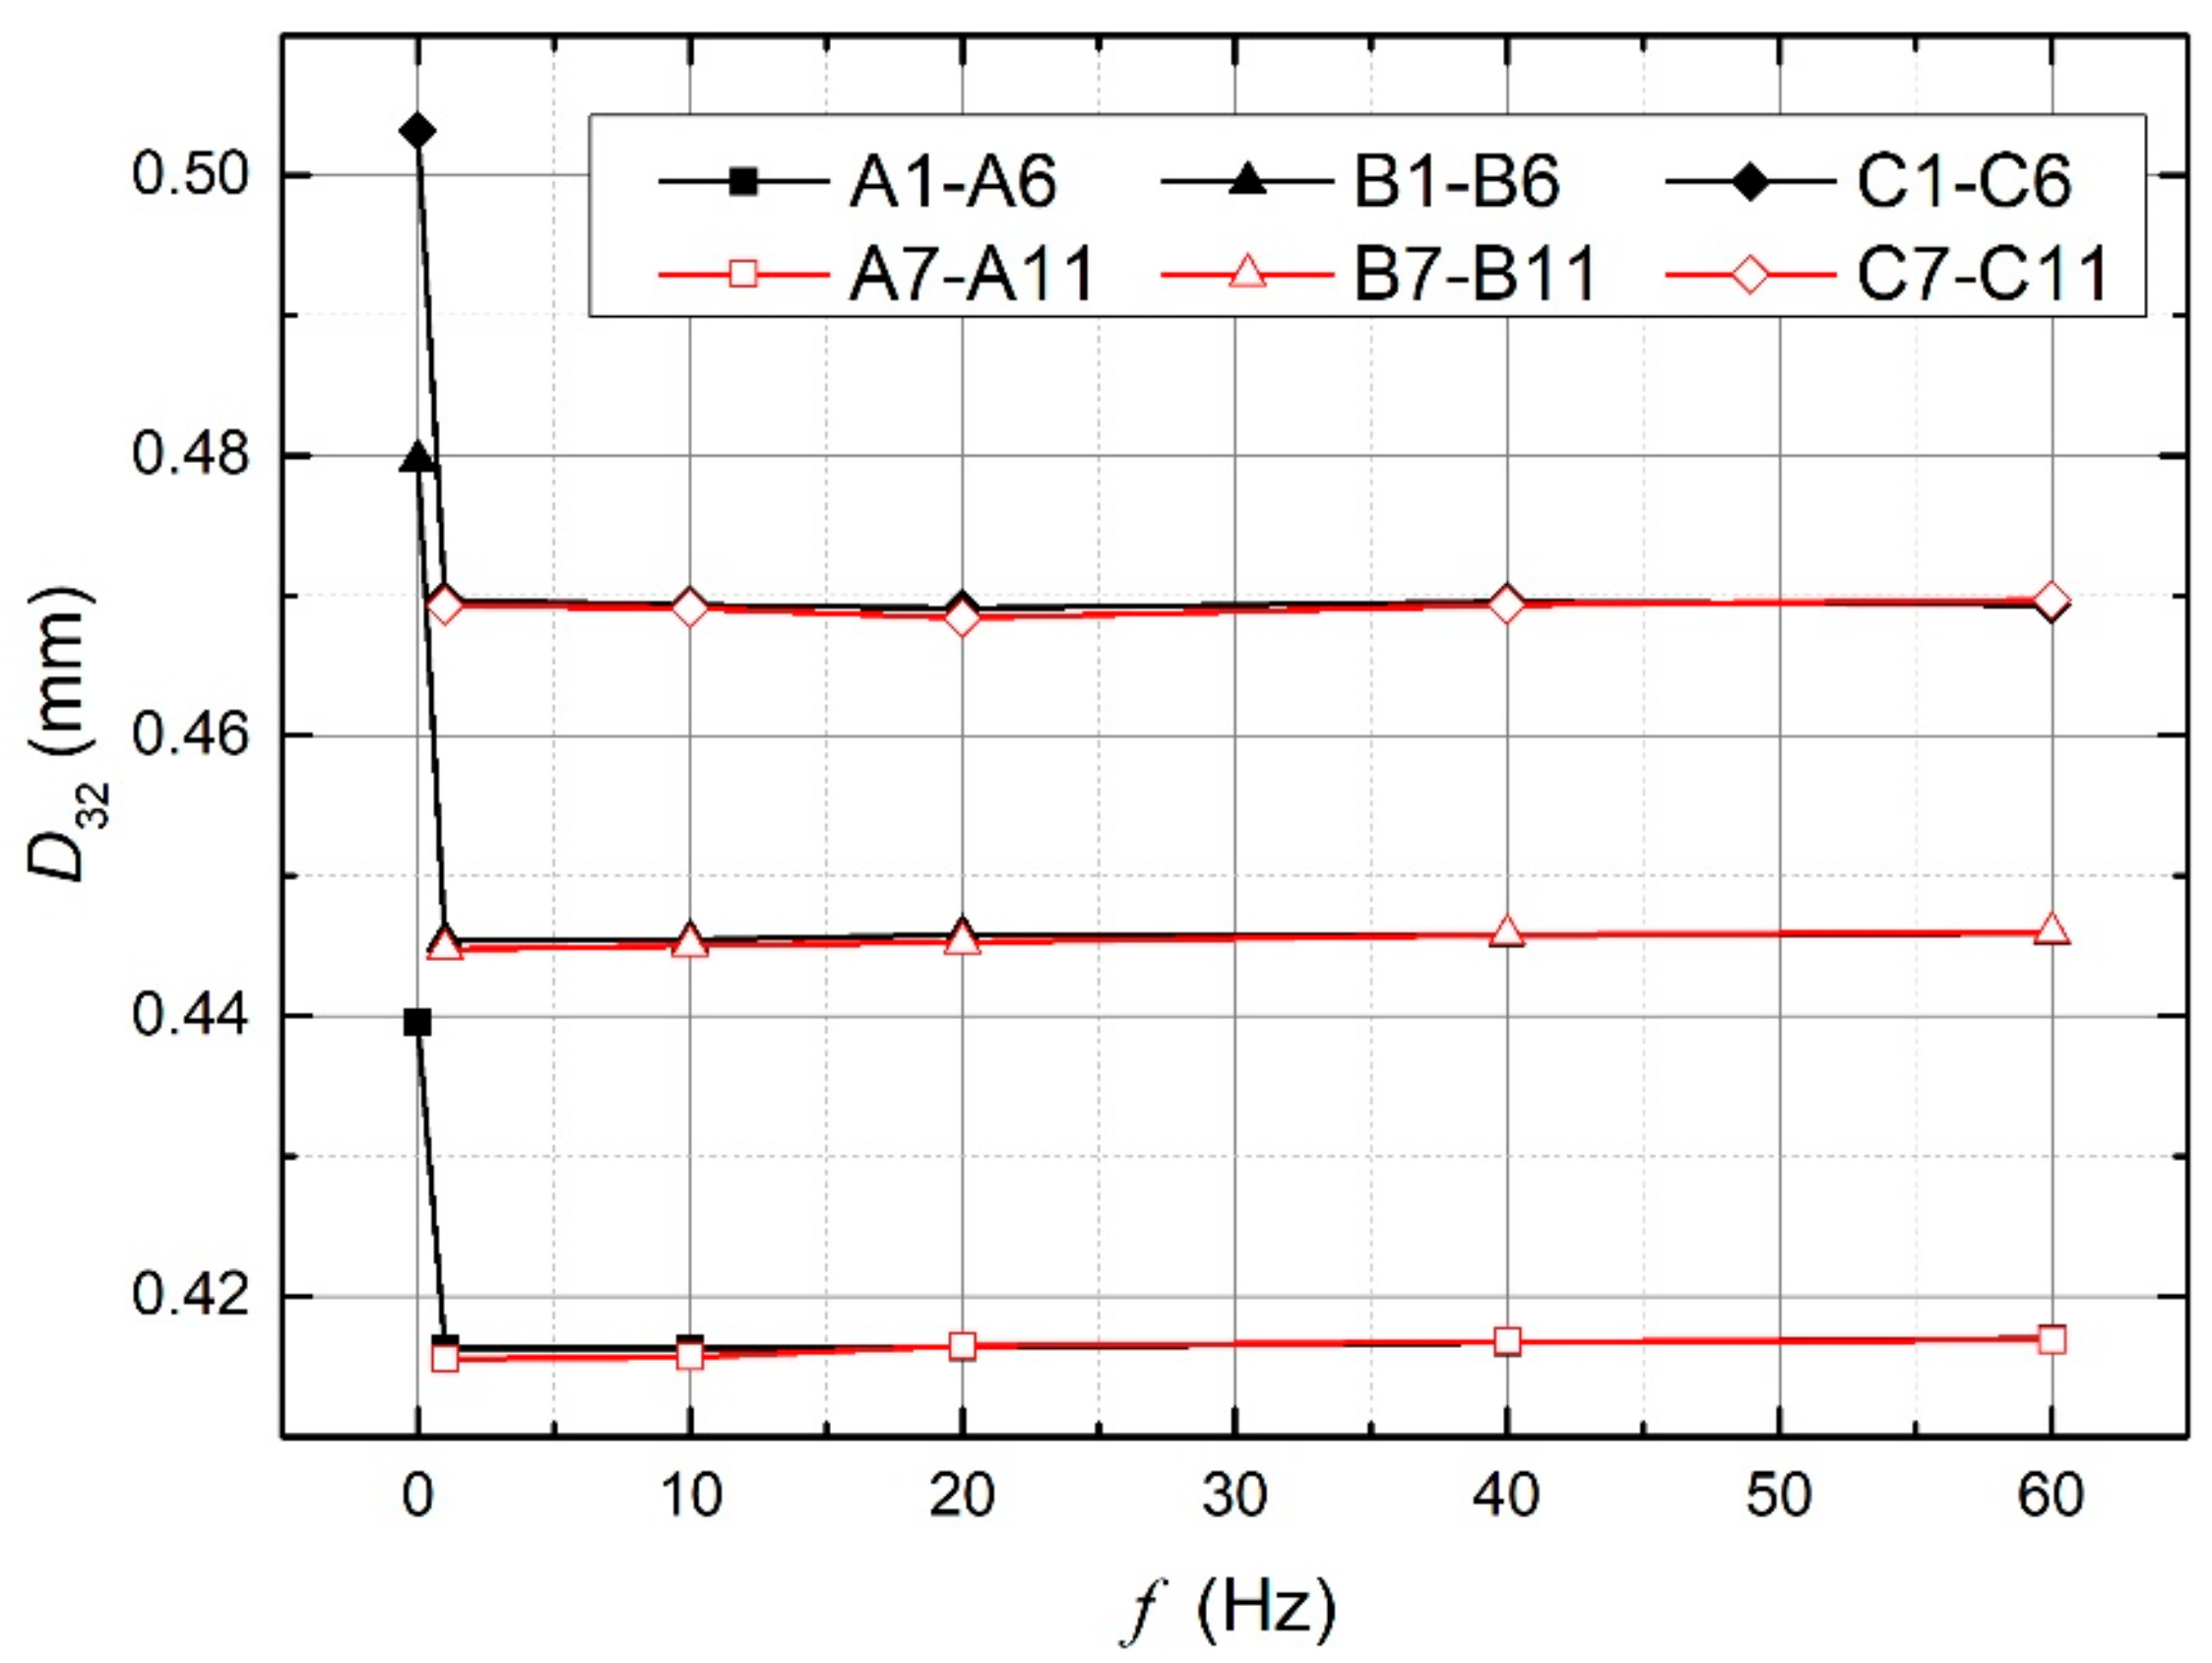
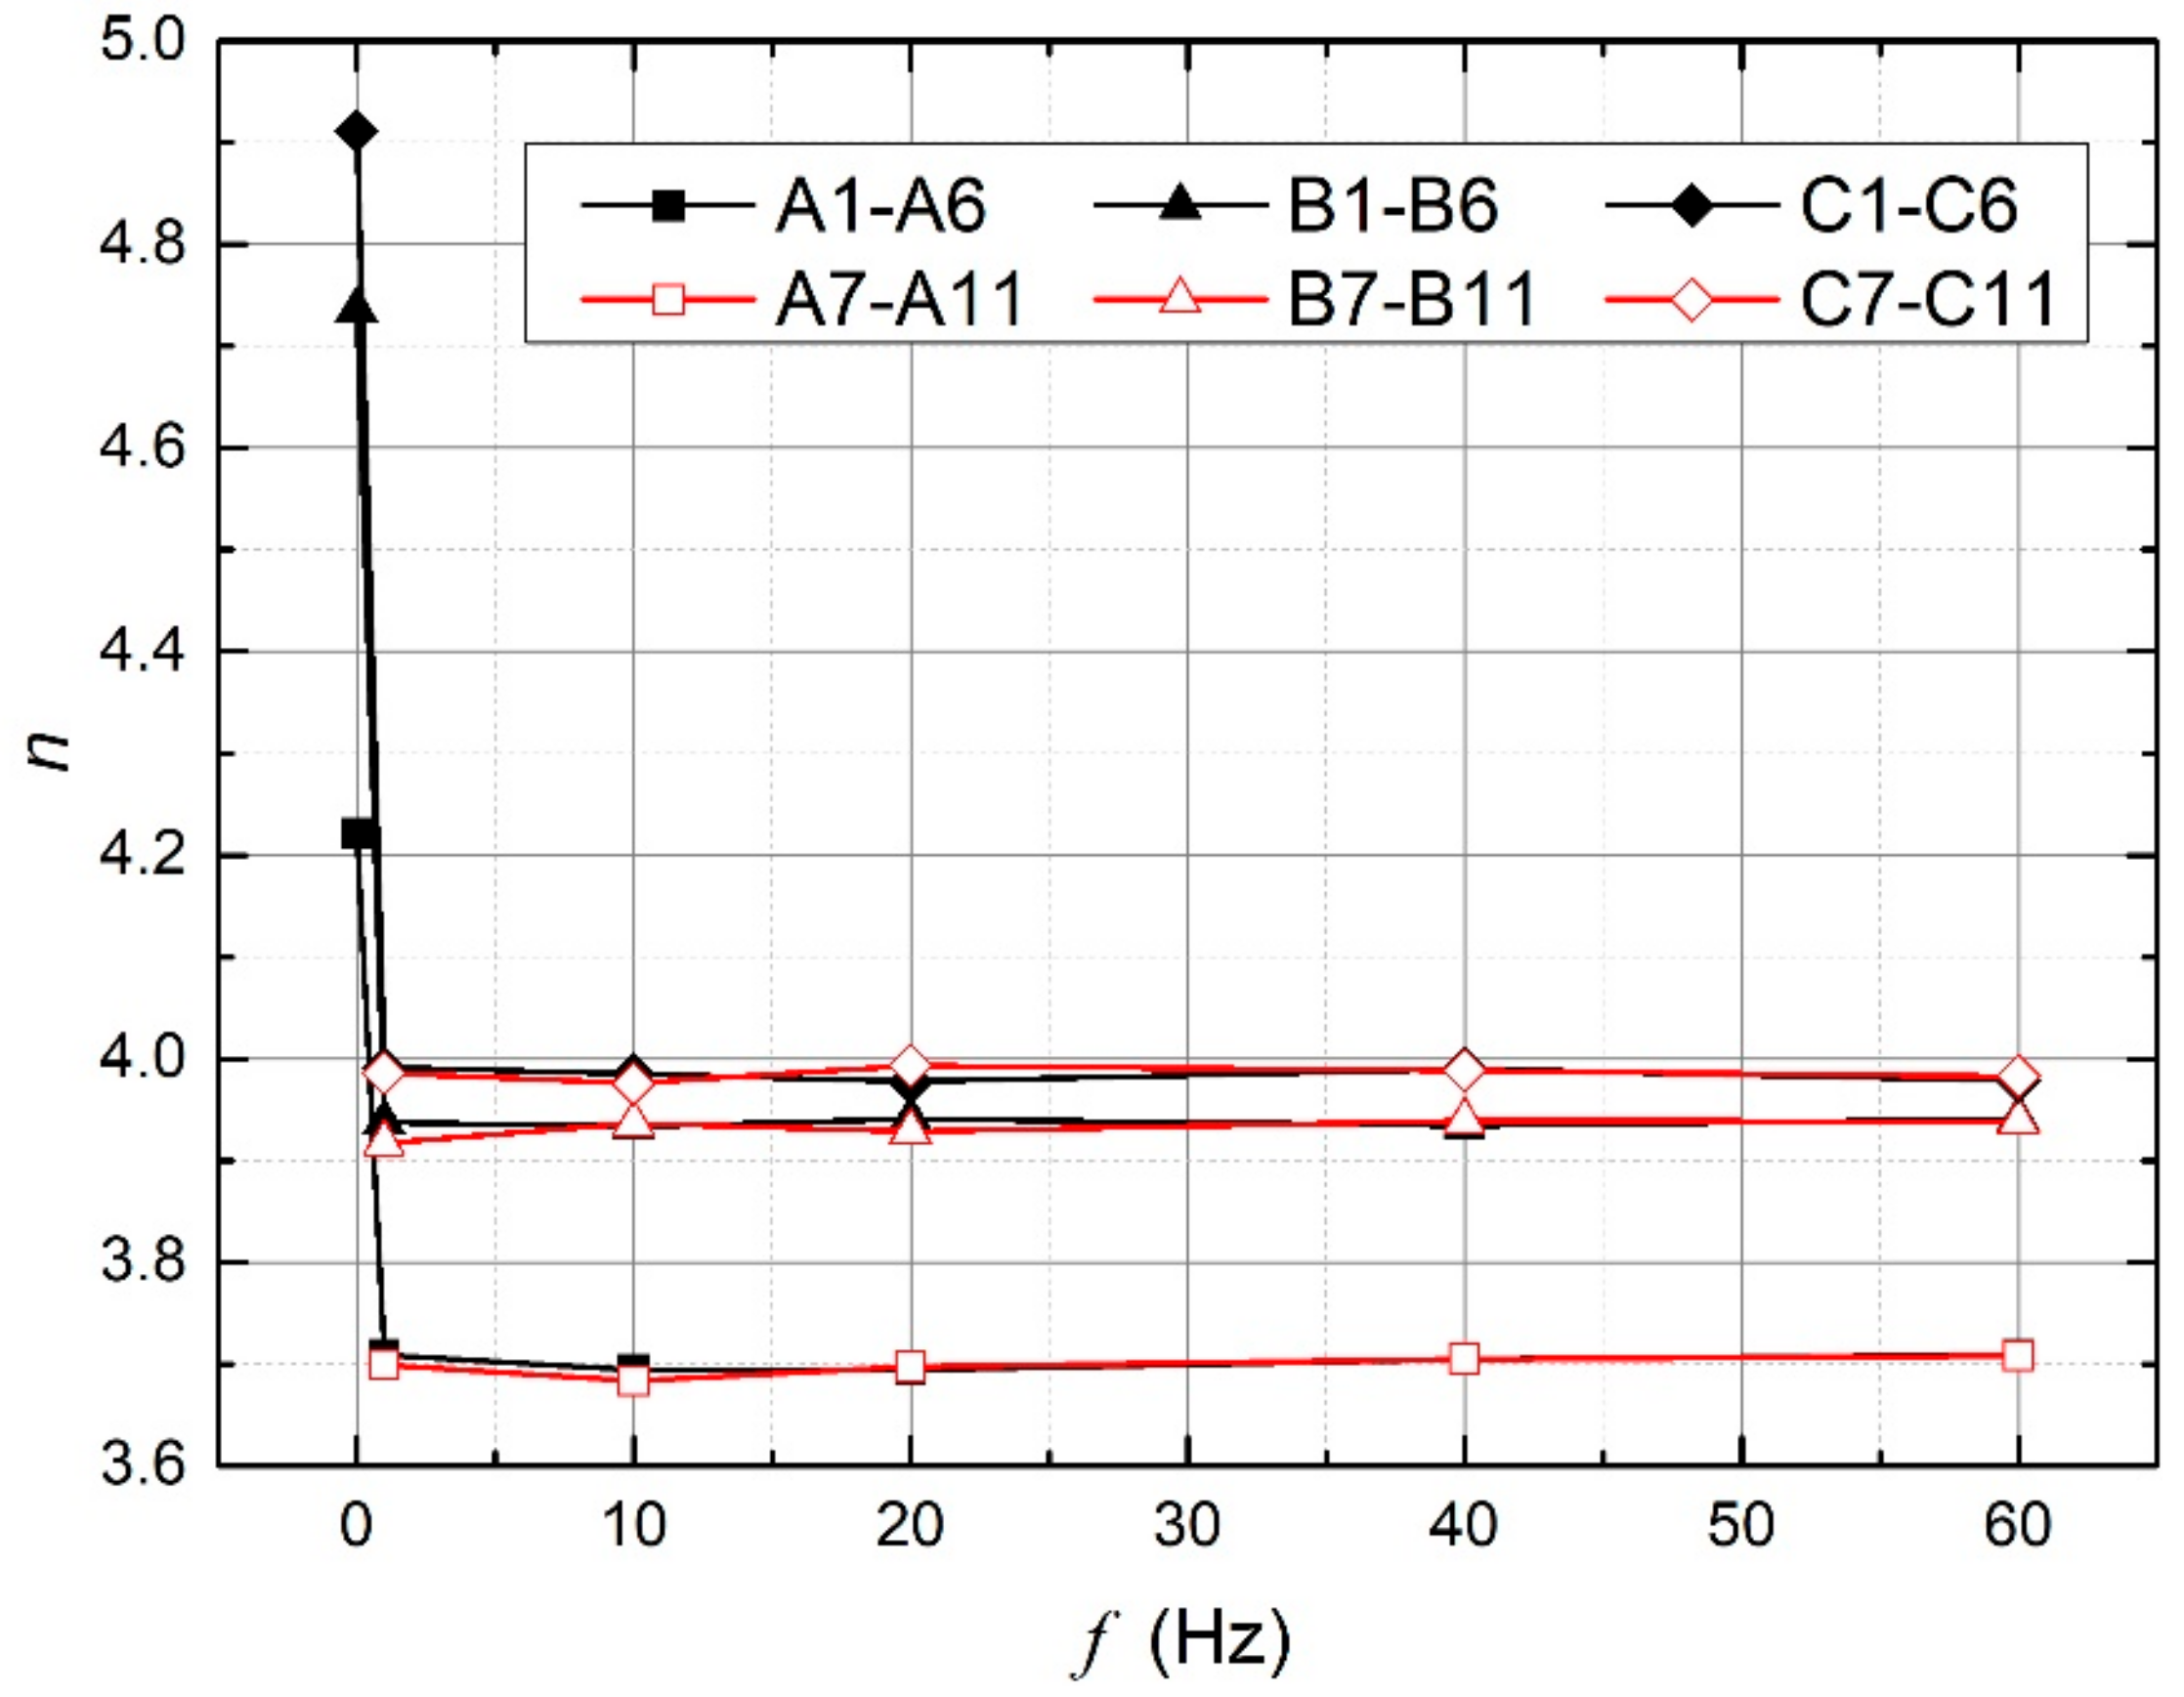
4.3. Droplet Distribution

In order to evaluate the fluctuation of the injected mass flow rate, the droplet size and the particle distribution were analyzed herein. The mean diameter [33] D32 named the Sauter mean diameter was evaluated to measure the droplets evaporation in the liquid nitrogen spray field. The overall D32 under computational cases with different fluctuations is shown in Figure 12. The D32 of Case C was the largest and that of Case A was the smallest. The droplet diameters, which were initially identical for three cases, kept reducing with the evaporating process. The smallest evaporation ratio of Case C led to the weakest evaporation of each single droplet and the largest droplet size.
Under a given case with inlet mass flow rate fluctuations, the droplet size was relatively smaller. This description supported the proposition that the injection fluctuation had a greater potential to strengthen the turbulence and enhance evaporation inside the spray field.
The semi-empirical methods [28], which were obtained by fitting the measured data to predetermined mathematical functions, were employed to evaluate the atomization quality and assess the non-uniform characteristics of the droplets. Among them, the Rosin–Rammler model was widely used. It is expressed in the form:
V c = 1 exp D c n
where, Vc is the fraction of the total volume of droplets less than D. c is the mean diameter. The exponent n indicates the distribution width of the droplet size. A higher value of n means a more uniform distribution of the spray.
Figure 13 shows the overall n of the three computational cases with different fluctuations. The maximum value of n was obtained under Case C and the minimum value was obtained under Case A, which meant that Case C had the minimal droplet dispersion. Reference [34] described that droplets near the edge of the spray field evaporated more rapidly than those at the center. The smallest droplet size under Case A illustrated more mass transfer from the liquid nitrogen droplets to air. Therefore, a gross discrepancy in size between droplets at the center and those near the edge led to a more uneven distribution. Droplets under Case C traveled through the duct at a higher velocity and pushed the air away, which weakened the contact and the interaction between the vapor and liquid. The largest droplet size would show the least evaporation of the droplets near the edge. Therefore, the most uniform droplet distribution was in the spray field.
When the supply mass flow fluctuation was activated, the value of n decreased under a given case. Especially, a greater reduction happened under Case C. A more inhomogeneous droplet distribution was resulted from a stronger turbulence inspired by supply variations. The effects of the fluctuation amplitude and frequency on the dispersion and vaporization of droplets were almost negligible.

5. Conclusions

The numerical model was verified by the experimental data. Then, abundant numerical simulations were performed under a wide range of frequencies and amplitudes of the fluctuations. The major findings summarized from this research were as follows:
During the full development stage of the liquid nitrogen spray, the evaporation rates and the outlet temperatures fluctuated periodically around an average value, at the same frequency as the fluctuation of the injection flow rate.
The difference of the average evaporation rate between the steady and oscillating injection under the computational case with the smallest evaporation ratio was the largest. It indicated that the oscillating injection had a more significant impact on the computational cases with a smaller evaporation ratio. The evaporation rate hardly changed with the frequency and the amplitude of the mass flow rate fluctuation.
As the injection mass flow rate fluctuated, the corresponding average TKE of the spray field increased, which induced intensive evaporation of the spray field. A higher evaporation rate under the injection variation produced more cooling and a lower temperature at the outlet plane, as well as at a specific position, compared with the steady inlet condition. The changes of the frequency and the amplitude hardly affected the average TKE and the average outlet temperature.
Under a given case with inlet mass flow rate fluctuations, the droplet size was relatively smaller due to the strengthened TKE and the enhanced evaporation inside the spray field. A more inhomogeneous droplet distribution resulted from a stronger turbulence inspired by supply variations. The effects of the fluctuation amplitude and frequency on the dispersion and vaporization of droplets were almost negligible.
The findings could be exploited for the design of cryogenic spray cooling systems and the optimization of the temperature uniformity of the systems.

Author Contributions

Investigation, R.X.; data curation and paper writing, R.X. and X.L.; experiment system design, L.C. and L.L.; experimental apparatus construction, R.X. and Y.R.; supervision and project administration, Y.H. All authors contributed equally in this paper.

Funding

This research was funded by the National Nature Science Foundation of China (51806162).

Acknowledgments

This project was supported by the Youth Innovation Team of Shaanxi Universities, and partially supported by the Open Research Project of Key Laboratory of Cryogenics, TIPC, CAS (CRYO201806).

Conflicts of Interest

The authors declare no conflict of interest. The founding sponsors had no role in the design of the study; in the collection, analyses, or interpretation of data; in the writing of the manuscript, and in the decision to publish the results.

Nomenclatures

A Amplitude Q ˙ m Mass flow rate
A o Cross-sectional area of the orifice Q ˙ m , i d e a l Ideal mass flow rate
A p Droplet surface area Re d Droplet Reynolds number
C d Discharge coefficient S e Energy source term
C p Specific heat of droplet S m Source term of mass
d p Droplet diameter S mp Source term of droplet mass
E Internal energy T Temperature
f Frequency u p Droplet velocity
F Additional acceleration term v Velocity
F D Drag force Y j Mass fraction of species j
F g Gravitational force
h c Heat transfer coefficientGreek symbols
h f g Latent heat ρ Density
h i Sensible enthalpy of species i μ Dynamic viscosity
J i Diffusing flux of species i δ i j Mean strain tensor
k Fluid thermal conductivity Φ Viscous dissipation
m ˙ p Droplet mass
p PressureSubscripts
pPressure differencei, jCartesian coordinate directions
P cr Critical pressure of liquid nitrogenpDroplet
Q ˙ initial Steady mass flow rate Fluid region

References

  1. Fey, U.; Engler, R.H.; Egami, Y.; Iijima, Y. Transition detection by temperature sensitive paint at cryogenic temperatures in the European Transonic Wind tunnel (ETW). In Proceedings of the 20th International Congress on Instrumentation in Aerospace Simulation Facilities, DLR Göttingen, Germany, 25–29 August 2003; pp. 77–88. [Google Scholar]
  2. Volmajer, M.; Kegl, B. Cavitation phenomena in the injection nozzle: Theoretical and numerical analysis. Environ. Health Perspect. 2004, 113, 638–643. [Google Scholar]
  3. Kannan, G.; Anand, R. Experimental evaluation of DI diesel engine operating with diestrol at varying injection pressure and injection timing. Fuel Process. Technol. 2011, 92, 2252–2263. [Google Scholar] [CrossRef]
  4. Park, K.; Kim, B.-H. Numerical analysis of the effect of injection pressure variation on free spray and impaction spray characteristics. KSME Int. J. 2000, 14, 236–250. [Google Scholar] [CrossRef]
  5. Palani, R.; Nallusamy, N.; Pitchandi, K. Spray characteristics of diesel and derivatives in direct injection diesel engines with varying injection pressures. J. Mech. Sci. Technol. 2015, 29, 4465–4471. [Google Scholar] [CrossRef]
  6. Ghurri, A.; Kim, J.-D.; Kim, H.G.; Jung, J.-Y.; Song, K.-K. The effect of injection pressure and fuel viscosity on the spray characteristics of biodiesel blends injected into an atmospheric chamber. J. Mech. Sci. Technol. 2012, 26, 2941–2947. [Google Scholar] [CrossRef]
  7. Karsli, S.; Yilmaz, M.; Comakli, O. The effect of internal surface modification on flow instabilities in forced convection boiling in a horizontal tube. Int. J. Heat Fluid Flow 2002, 23, 776–791. [Google Scholar] [CrossRef]
  8. Xue, R.; Chen, L.; Zhong, X.; Liu, X.; Chen, S.; Hou, Y. Unsteady cavitation of liquid nitrogen flow in spray nozzles under fluctuating conditions. Cryogenics 2019, 97, 144–148. [Google Scholar] [CrossRef]
  9. Wang, X.; Han, Z.; Su, W. A numerical study of the effects of pressure fluctuations inside injection nozzle on high-pressure and evaporating diesel spray characteristics. Appl. Math. Model. 2016, 40, 4032–4043. [Google Scholar] [CrossRef]
  10. Ubertini, S. Injection Pressure Fluctuations Model Applied to a Multi-Dimensional Code for Diesel Engines Simulation. J. Eng. Gas Turbines Power 2004, 128, 437–445. [Google Scholar]
  11. Ramamurthi, K.; Patnaik, S. Influence of periodic disturbances on inception of cavitation in sharp-edged orifices. Exp. Fluids 2002, 33, 720–727. [Google Scholar] [CrossRef]
  12. Yuan, W.; Schnerr, G.H. Cavitation in Injection Nozzles—Effect of Model Parameters and Boundary Conditions. Presented at Fourth International Symposium on Cavitation (CAV2001), Pasadena, CA, USA, 20–23 June 2001. [Google Scholar]
  13. Wang, X.; Su, W. Numerical investigation on relationship between injection pressure fluctuations and unsteady cavitation processes inside high-pressure diesel nozzle holes. Fuel 2010, 89, 2252–2259. [Google Scholar] [CrossRef]
  14. Zhu, J.; Wang, S.; Qiu, L.; Zhi, X.; Zhang, X.; Jiakai, Z.; Shunhao, W.; Limin, Q.; Xiaoqin, Z.; Xiaobin, Z. Frequency characteristics of liquid hydrogen cavitating flow over a NACA0015 hydrofoil. Cryogenics 2018, 90, 7–19. [Google Scholar] [CrossRef]
  15. Breslin, J.P.; Andersen, P. Hydrodynamics of Ship Propellers; Cambridge University Press: Cambridge, UK, 1996. [Google Scholar]
  16. Jung, J.; Lee, S.; Han, J. Study on correlation between cavitation and pressure fluctuation signal using high-speed camera system. In Proceedings of the 7th International Symposium on Cavitation, Ann Arbor, MI, USA, 16–20 August 2009. [Google Scholar]
  17. Ji, B.; Luo, X.; Wu, Y.; Peng, X.; Duan, Y. Numerical analysis of unsteady cavitating turbulent flow and shedding horse-shoe vortex structure around a twisted hydrofoil. Int. J. Multiph. Flow 2013, 51, 33–43. [Google Scholar] [CrossRef] [Green Version]
  18. Chen, G.; Wang, G.; Hu, C.; Huang, B.; Gao, Y.; Zhang, M. Combined experimental and computational investigation of cavitation evolution and excited pressure fluctuation in a convergent–divergent channel. Int. J. Multiph. Flow 2015, 72, 133–140. [Google Scholar] [CrossRef]
  19. Ito, Y.; Seto, K.; Nagasaki, T. Periodical shedding of cloud cavitation from a single hydrofoil in high-speed cryogenic channel flow. J. Therm. Sci. 2009, 18, 58–64. [Google Scholar] [CrossRef]
  20. Zhu, J.; Xie, H.; Feng, K.; Zhang, X.; Si, M. Unsteady cavitation characteristics of liquid nitrogen flows through venturi tube. Int. J. Heat Mass Transf. 2017, 112, 544–552. [Google Scholar] [CrossRef]
  21. Ruan, Y.; Hou, Y.; Xue, R.; Luo, G.; Zhu, K.; Liu, X.; Chen, L. Effects of operational parameters on liquid nitrogen spray cooling. Appl. Therm. Eng. 2019, 146, 85–91. [Google Scholar] [CrossRef]
  22. Nijdam, J.J.; Guo, B.; Fletcher, D.F.; Langrish, T.A. Lagrangian and Eulerian models for simulating turbulent dispersion and coalescence of droplets within a spray. Appl. Math. Model. 2006, 30, 1196–1211. [Google Scholar] [CrossRef] [Green Version]
  23. Li, X.; Wang, T. Effects of Various Modeling Schemes on Mist Film Cooling Simulation. J. Heat Transf. 2007, 129, 472–482. [Google Scholar] [CrossRef] [Green Version]
  24. Montazeri, H.; Blocken, B.; Hensen, J.; Hensen, J. Evaporative cooling by water spray systems: CFD simulation, experimental validation and sensitivity analysis. Build. Environ. 2015, 83, 129–141. [Google Scholar] [CrossRef]
  25. Fluent Help Documents; Fluent Corporation: Canonsburg, PA, USA, 2015.
  26. Alkhedhair, A.; Gurgenci, H.; Jahn, I.; Guan, Z.; He, S. Numerical simulation of water spray for pre-cooling of inlet air in natural draft dry cooling towers. Appl. Therm. Eng. 2013, 61, 416–424. [Google Scholar] [CrossRef]
  27. Xue, R.; Ruan, Y.; Liu, X.; Cao, F.; Hou, Y. The influence of cavitation on the flow characteristics of liquid nitrogen through spray nozzles: A CFD study. Cryogenics 2017, 86, 42–56. [Google Scholar] [CrossRef]
  28. Lefebvre, A.H. Atomization and Sprays; Hemisphere Pub. Corp.: Washington, DC, USA, 1989; pp. 127–145. [Google Scholar]
  29. Birouk, M.; Gökalp, I. Current status of droplet evaporation in turbulent flows. Prog. Energy Combust. Sci. 2006, 32, 408–423. [Google Scholar] [CrossRef]
  30. Birouk, M.; Gökalp, I. A new correlation for turbulent mass transfer from liquid droplets. Int. J. Heat Mass Transf. 2002, 45, 37–45. [Google Scholar] [CrossRef]
  31. Wang, H.; Luo, K.; Fan, J. Effects of turbulent intensity and droplet diameter on spray combustion using direct numerical simulation. Fuel 2014, 121, 311–318. [Google Scholar] [CrossRef]
  32. Montazeri, H.; Blocken, B.; Hensen, J.L. CFD analysis of the impact of physical parameters on evaporative cooling by a mist spray system. Appl. Therm. Eng. 2015, 75, 608–622. [Google Scholar] [CrossRef] [Green Version]
  33. Mugele, R.A.; Evans, H.D. Droplet Size Distribution in Sprays. Ind. Eng. Chem. 1951, 43, 1317–1324. [Google Scholar] [CrossRef]
  34. Xue, R.; Ruan, Y.; Liu, X.; Chen, L.; Zhang, X.; Hou, Y.; Chen, S. Experimental study of liquid nitrogen spray characteristics in atmospheric environment. Appl. Therm. Eng. 2018, 142, 717–722. [Google Scholar] [CrossRef]
Figure 1. Schematic diagram of mass flow rate measuring system.
Processes 07 00564 g001
Figure 2. Mass flow rate and discharge coefficient versus pressure difference.
Processes 07 00564 g002
Figure 3. Schematic diagram of the experimental system of LN2 spray cooling in air duct.
Processes 07 00564 g003
Figure 4. Computational geometry.
Processes 07 00564 g004
Figure 5. Mesh independence study.
Processes 07 00564 g005
Figure 6. Comparison of numerical predictions with experimental results.
Processes 07 00564 g006
Figure 7. Time-dependent evaporation rates under different cases.
Processes 07 00564 g007
Figure 8. Average evaporation rate and turbulent kinetic energy under different cases.
Processes 07 00564 g008
Figure 9. Average outlet temperature under different cases.
Processes 07 00564 g009
Figure 10. Temperature along vertical lines at the center plane.
Processes 07 00564 g010
Figure 11. Temperature along center lines of computational geometry.
Processes 07 00564 g011
Figure 12. Overall D32 under computational cases with different fluctuations.
Processes 07 00564 g012
Figure 13. Overall n under computational cases with different fluctuations.
Processes 07 00564 g013
Table 1. Temperature drops under different airflow velocities and LN2 mass flow rates.
No.p (MPa)Mass Flow Rate (kg·s−1)Flow Velocity (m·s−1)Temperature Drop (K)
10.1270.0056.73.9
20.1270.0055.364.0
30.1270.0054.025.6
40.1270.0052.686.7
50.1270.0051.3410.6
60.2040.00616.74.3
70.2040.00615.364.6
80.2040.00614.026.3
90.2040.00612.688.6
100.2040.00611.3412.4
110.2850.00716.75.1
120.2850.00715.365.8
130.2850.00714.026.9
140.2850.00712.689.4
150.2850.00711.3413.6
160.3380.00766.75.5
170.3380.00765.365.8
180.3380.00764.027.8
190.3380.00762.6810.2
200.3380.00761.3414.3
Table 2. Computational cases.
Case Q ˙ initial (kg·s−1)Flow Velocity (m·s−1)Af (Hz)
A-10.0051.3400
A-210%1
A-310%10
A-410%20
A-510%40
A-610%60
A-720%1
A-820%10
A-920%20
A-1020%40
A-1120%60
B-10.01500
B-210%1
B-310%10
B-410%20
B-510%40
B-610%60
B-720%1
B-820%10
B-920%20
B-1020%40
B-1120%60
C-10.021000
C-210%1
C-310%10
C-410%20
C-510%40
C-610%60
C-720%1
C-820%10
C-920%20
C-1020%40
C-1120%60

