1. Introduction
In the working process, the power lithium-ion battery is accompanied by heat generation, and its complex internal structure is easy to make the temperature distribution uneven and result in local overheating. Once the heat runs out of control, the consequence will be extremely serious [
1,
2]. Therefore, it is necessary to configure an effective battery thermal management system (BTMS) to ensure the ideal electrochemical performance and safety of the battery.
Some cooling strategies have been implemented in the BTMS, including air cooling, liquid cooling, phase change material (PCM) cooling, heat pipe cooling, and a combination of them [
3]. The air cooling system is usually regarded to be reliable but not effective for its low heat transfer capacity; the liquid cooling system is too complex to increase the power consumption of the pump while cooling high-power lithium-ion batteries, and there is the possibility of leakage. In the phase change cooling system, the weight and volume of phase change materials affect the performance and arrangement of the vehicle [
4].
As a promising cooling technology, heat pipe cooling has been first applied in the field of aerospace and achieved remarkable results. At present, it has been widely used in energy, chemical industry, aerospace, electronics, power, and other fields. Nowadays, the heat pipe cooling system of the power battery for electric vehicles is still in the stage of research. As a kind of heat conducting element, the heat pipe can conduct heat thousands of times more than the metal conductor, which can transfer heat from one object to another quickly and efficiently. It has high thermal conductivity, good isotherm, reversible heat flow direction, variable heat flow density, good environmental adaptability, as well as the performance of thermal diodes and thermal switches. Meanwhile, the controllable heat pipe can maintain constant temperature by controlling the thermal resistance [
5]. Although the heat pipe structure is relatively simple and light, its working reliability is high and its cost is relatively low. Even under a lower temperature difference, it can transfer a lot of heat [
6]. Additionally, the heat pipe can be manufactured in various shapes and sizes, allowing them to be tailored to different application [
7]. These excellent characteristics make the heat pipe cooling technology have significant advantages and feasibility in the field of BTMS. Therefore, the introduction of heat pipe cooling technology into BTMS has great application prospects.
At present, research on heat pipe cooling schemes mainly focuses on the working medium, the arrangement scheme of the heat pipe and the mode of secondary cooling. There are also a few research studies that improve the heat pipe performance from the perspective of heat pipe structure. Putra et al. [
8] found that when the heat generation rate of the battery is greater than 1.61 W/cm
2, the heat transfer efficiency of the working medium using ethanol was the highest. Chi et al. [
9] found that the optimum liquid filling rate of the heat pipe increased with the heat generation rate of the battery. Under the same heat generating power, Rao et al. [
10] showed that when the heat pipe was installed vertically, the surface temperature rose and the local temperature difference of the battery was smaller than when it was placed horizontally. Wang et al. [
11] soaked the condensation section of the heat pipe in the water tank, the results indicated that the temperature of the battery did not exceed 42 °C after 2 h of continuous discharge at the discharge rate of 2C. Ye et al. [
12] designed a scheme of forced air cooling for the condensation section of heat pipe, so that the temperature of battery could be maintained below 3 °C under the condition of 1C discharge rate. For the forced-air cooling of the condensation section of the heat pipe, researchers usually strengthen the heat dissipation capacity of the heat pipe system by changing the number, spacing, thickness, and air cooling flow velocity of the fins.
In these studies of the heat pipe cooling scheme, the design of the battery pack was not carried out for specific vehicle parameters, and the heat generation rate of the battery was measured by experiment or calculated by using the Bernadi battery heat generation model, which did not consider the microstructure of the battery.
This paper is organized as follows.
Section 2 firstly designs the power battery pack for a certain electric vehicle. Then a new multi-scale and multi-field coupling model which considers the relationship between micro and macro parameters in the actual microstructure of the battery electrodes is introduced in detail, and the heat generation rate is obtained by COMSOL simulation. The process of designing the heat pipe cooling system and establishing the computational fluid dynamics (CFD) model is presented in
Section 3. The analysis and discussion of the influence of different factors on the heat pipe cooling system by FLUENT are given in
Section 4, followed by conclusions in
Section 5.
2. Design of Battery Pack
2.1. Calculation of Initial Design Parameters
The parameters of the studied certain passenger electric vehicle possesses the following parameters: the acceleration time of 9.2 s, the maximum speed of 150 km/h, and the average speed of 50 km/h. When the vehicle is running, the battery power and the resistance power of the car are balanced. The power consumed by driving resistance includes rolling resistance power, air resistance power, slope resistance power, and accelerating resistance power. The power balance equation of the vehicle is shown in Equation (1).
In Equation (1), ηT represents the transmission efficiency; G is the vehicle gravity, N; f is the rolling resistance coefficient of between the ground and the tire of electric vehicle; ua represents speed of the vehicle, km/h; i is the road slope; CD is the air resistance coefficient; A is the windward area of the front windshield, m2; m represents the weight of the electric vehicle, kg; and δ is the conversion factor of rotating mass.
Power performance of the vehicle is mainly evaluated by three indexes: the maximum vehicle speed, the maximum climbing degree, and the acceleration time. According to Equation (1), it can be calculated that the required power under the three working conditions of maximum speed (ua = 150 km/h), maximum climbing degree (I = 0.2, ua = 15 km/h) and the end of 100 km acceleration time are 32.41 kW, 12.54 kW, and 74.55 kW, respectively. According to the statistical results of the voltage level of the power battery system, it is recommended that the voltage level of the electric vehicle power battery system is 144 V, 288 V, 346 V, 400 V, etc. Considering the requirements of safety and light weight, the maximum power of the battery system should be greater than 74.55 kW, and the voltage level of the battery system should be selected as 288 V.
In the actual working process, there is a problem that the battery system of electric vehicles is overloaded or inefficient. The voltage range of the battery system can withstand is between 80% and 120%, so the working voltage range of the battery system is between 230.4 V and 345.6 V.
The goal of the electric vehicle is designed to achieve that the driving distance is not less than 300 km at the speed of 50 km/h. According to Equation (1), the required power is calculated to be
Pe = 2.96 kW. Battery system capacity
Q can be calculated as the following Equation (2):
where
S is the cruising range, km;
Pe and
P0 are the output power and the accessory power consumption respectively, kW, which cannot exceed 15% of the battery working power;
Va is the average speed, km/h;
U represents the voltage of electric motor, V;
ηe is the effective capacity coefficient, which is 0.7.
The capacity of the battery system calculated by Equation (2) needs to reach 101.34 Ah.
2.2. Electrical Design of Battery Pack
The nominal voltage of the lithium iron phosphate (LFP) battery is 3.2 V and the nominal capacity is 12 Ah. According to the working voltage range of the battery system is 230.4~345.6 V, it is known that 72 to 108 batteries are required to be connected in series. In this paper, 90 batteries are selected to be connected in series, and the voltage is 288 V, which satisfies the requirements. Considering that the capacity of the battery system is 101.34 Ah, nine batteries need to be connected in parallel. Therefore, it needs to connect 90 batteries in series and 9 batteries in parallel, which means a total of 810 batteries can meet the requirements of the battery system. In order to facilitate installation and management, the power battery system in this paper is divided into 18 battery packs, and each pack contains 45 battery monomers.
As for the series and parallel forms of batteries, Wang et al. [
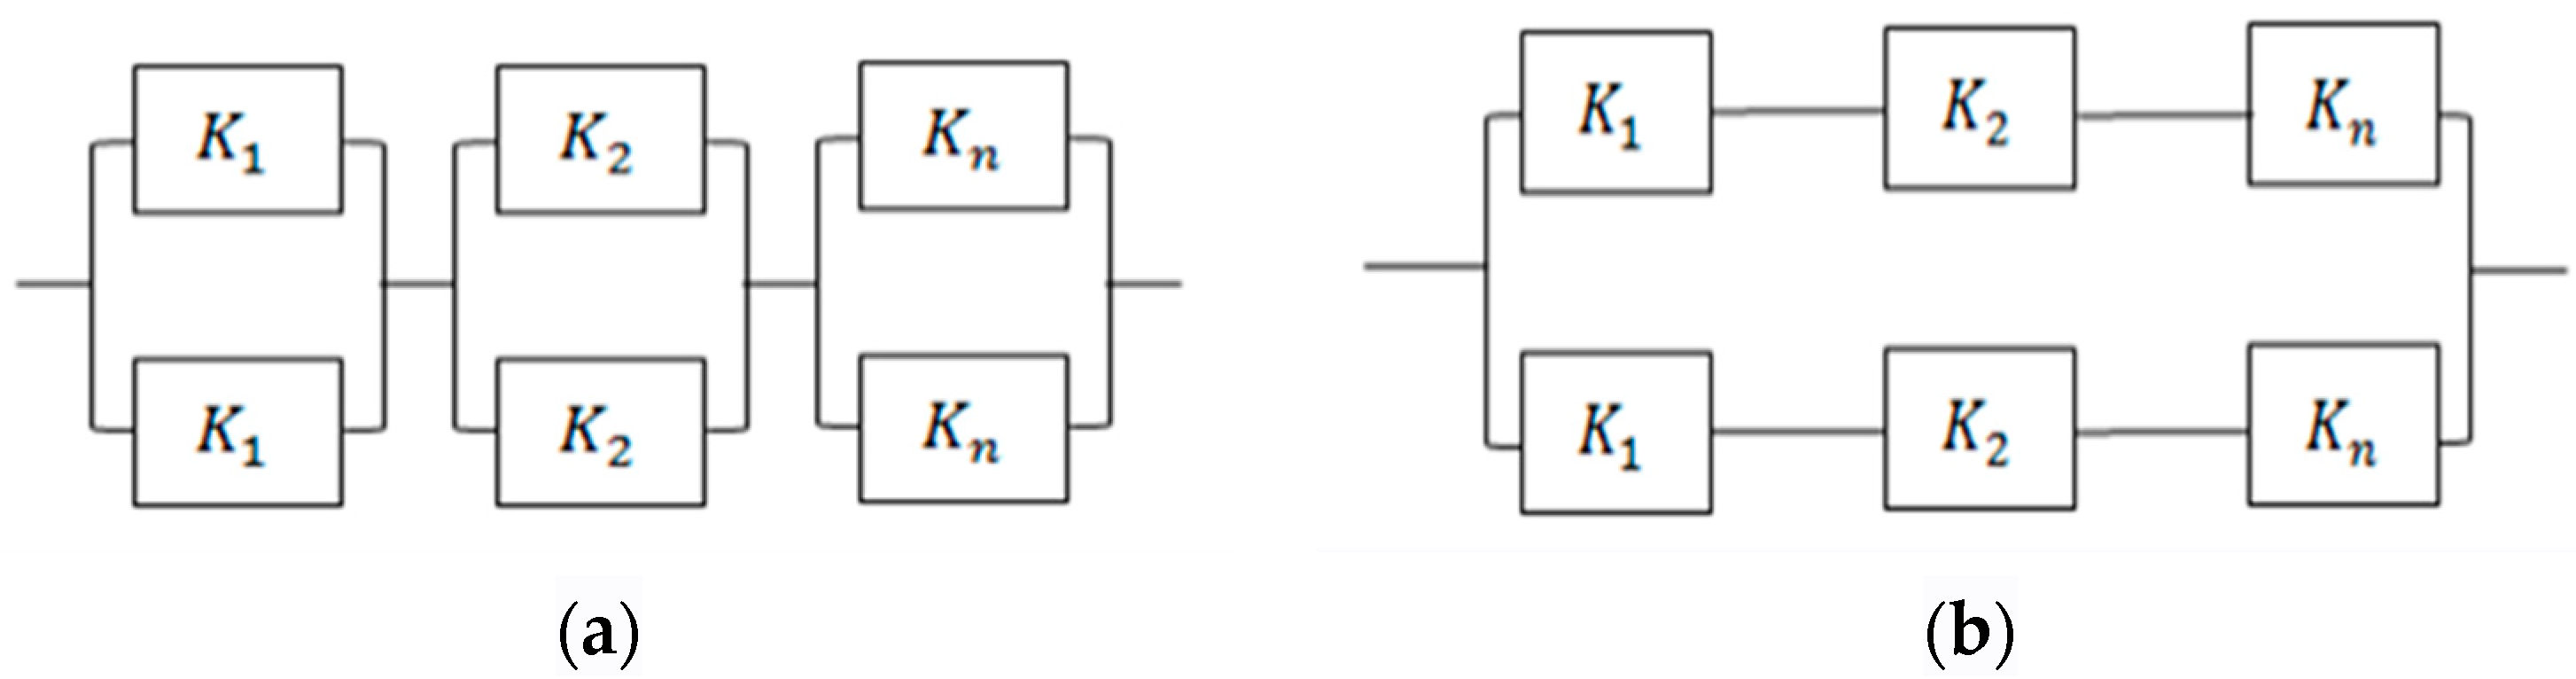
13] found that the voltage distribution of battery packs was uneven and the consistency was poor when the lithium-ion battery packs were grouped in the form of being connected in series first and then connected in parallel. And in the form of being connected in parallel first and then in series, the voltage distribution of the battery pack was relatively uniform. In this paper, the number of series connection is obviously larger than that of parallel connection, so it is necessary to discuss the influence of series connection and parallel connection on the battery system. The forms of parallel connection followed by series connection and series connection followed by parallel connection of batteries are shown in
Figure 1.
In the model of
Figure 1, the battery monomers are independent of each other. Even if there is damage, the probability of failure is the same, so the mathematical model of battery pack reliability can be established. The mathematic models of parallel connection followed by series connection and series connection followed by parallel connection are respectively shown in Equations (3) and (4).
where,
K(
x) is the reliability;
Pk and
Sk are the number of parallel batteries and series batteries respectively;
Ki(
x) is the reliability of the
ith batteries, and the reliability of the batteries is more than 90%, assuming that the reliability is 90% in this paper.
The reliability of the two forms calculated by Equations (3) and (4) is 0.985 and 0.499 respectively. Therefore, the battery pack should be connected in parallel first and then connected in series. The battery monomers in the battery pack are connected in parallel to form one battery module, and each of the 15 modules is connected in series to form a battery pack. Every 3 battery monomers in the battery pack are connected in parallel into a battery module, and every 15 modules are connected in series into a battery pack.
2.3. Simulation of Battery Heat Generation
2.3.1. Multi-Scale Model of the Battery
The microstructures and morphologies of battery materials play a decisive role in the performance of the battery. However, whether it is a three-dimensional battery model, a quasi-two-dimensional model, or a single-particle model, the macro-homogeneity theory is used in the process of constructing models, which is greatly different from the complex micropore structure of the actual electrode. Therefore, in the study of the mesoscopic scale model of the lithium-ion battery, finding out the key parameters that limit or affect the battery performance has become a hotspot in the field of numerical simulation of the lithium-ion battery [
14].
The effective physical parameters of porous electrodes are important characteristic parameters of electrodes, which are closely related to the microstructure of electrodes and are the bridge connecting the microstructure and macroscopic process of the electrode. Therefore, accurate prediction of the effective physical parameters of the porous electrode of lithium-ion battery is the premise of obtaining the correct numerical simulation results by the electrochemical-thermal coupling model [
15]. The effective physical parameters of the electrode mainly include the effective thermal conductivity of the liquid phase and solid phase, the effective diffusion coefficient of lithium-ions, etc, which are usually corrected by the Bruggeman empirical formula.
The effective conductivity and the effective electrolyte diffusion coefficient of lithium-ion batteries are calculated respectively by Equations (5) and (6).
In Equations (5) and (6),
σ and
De represent lithium-ions conductivity and diffusion coefficient in the porous electrode;
ε denotes the electrode porosity;
τ represents the electrode tortuosity; with
τ and
ε being previously defined,
α and
γ are constants [
16].
In general, without considering the real structure of the holes in the electrodes and assuming that the electrodes are a homogeneous porous medium, the empirical values
α = 1.5 and
γ = 1 are used in the study of electrochemical-thermal coupling models for lithium-ion batteries with different electrodes. However, the error between the empirical value and the value when considering the actual microstructure of the electrode is large. For the square LFP battery studied in this paper, references [
16,
17,
18] used different methods of numerical reconstruction to reconstruct the microstructure of different electrodes, and obtained the actual porosity, tortuosity, and values of
α,
γ of the electrode, as shown in
Table 1.
Referring to [
16,
17], the porosity of the positive electrode of the battery is 0.45,
α is 1.53,
γ is 1.8, the porosity of the negative electrode is 0.285,
α is 2.421, and
γ is 1.
2.3.2. Electrochemical Model
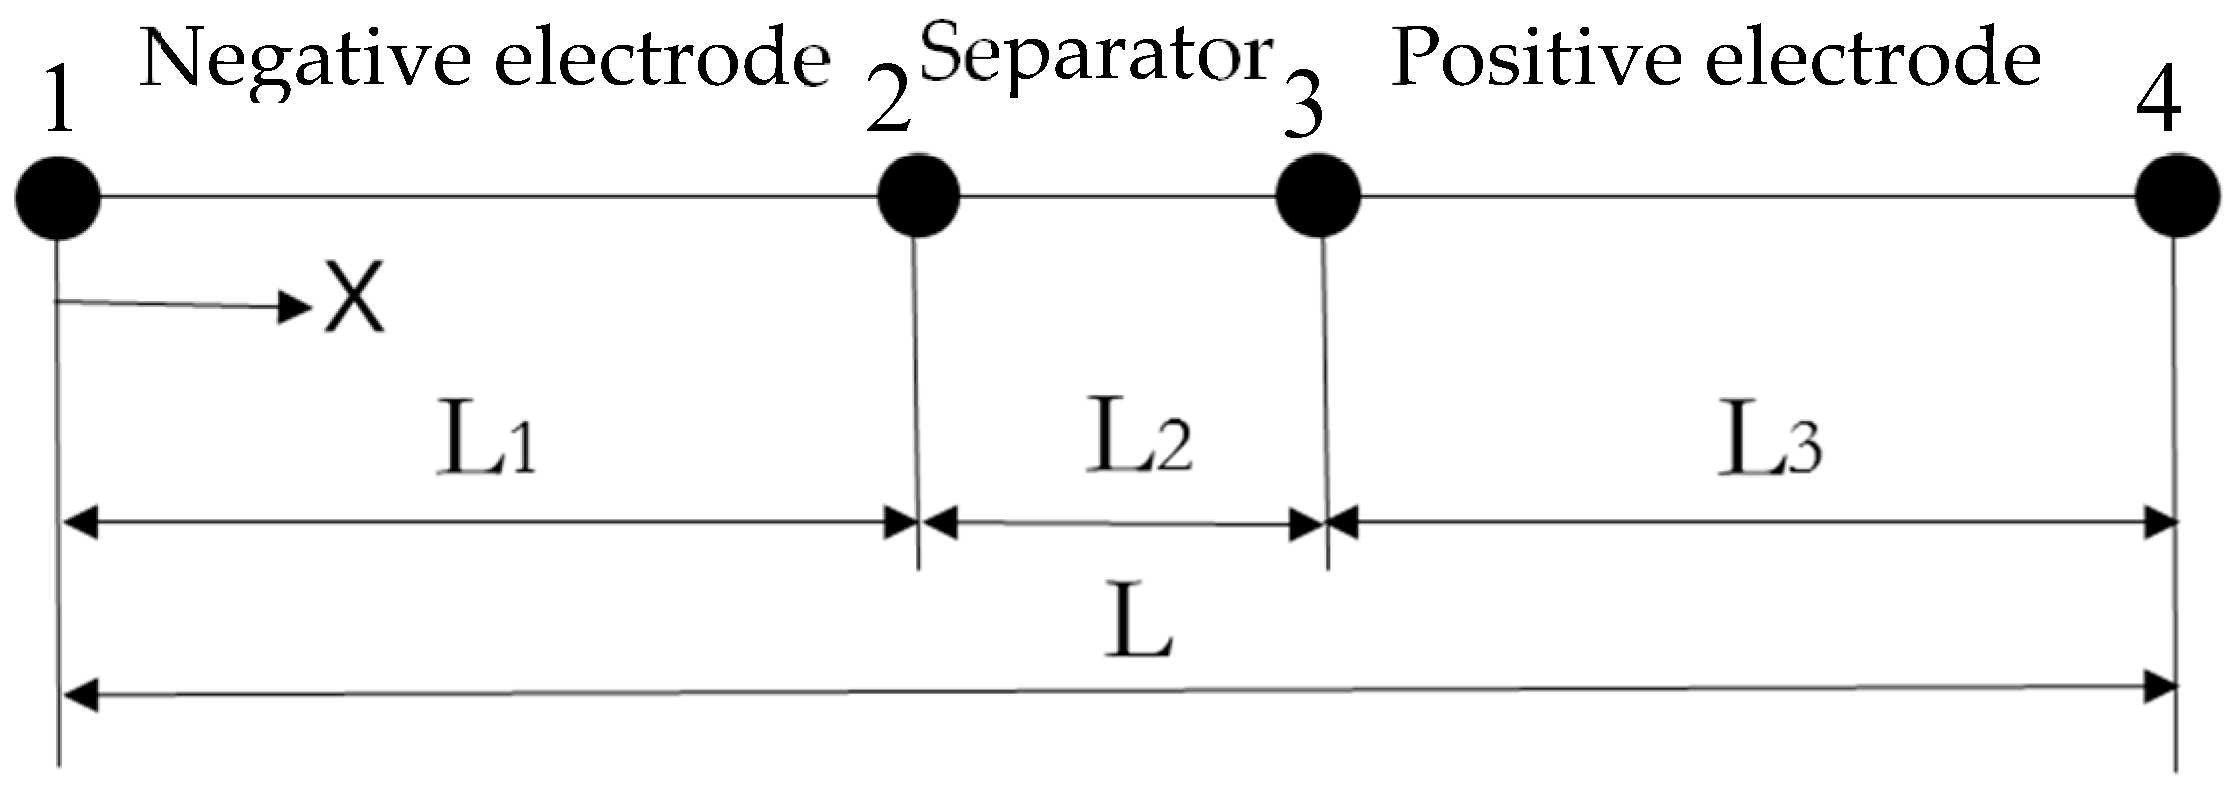
The schematic diagram of the one-dimensional electrochemical model of the lithium-ion battery monomer is shown in
Figure 2.
The model consists of a negative current collector (copper), a negative electrode (graphite), a separator (polyethylene), a positive electrode (lithium iron phosphate), and a positive current collector (aluminum). Among them, the negative current collector and the positive current collector are simplified to two points of 1 and 4.
The electrochemical reaction at the junction of solid phase and liquid phase can be described by the Butler–Volmer equation, which is expressed as follows:
where
j0 and
jn is the exchange current density and the local current density of the electrode surface respectively, A/m
2;
αa and
αc are the transfer coefficients of the anode and cathode respectively, which is 0.5 in this paper;
T is the thermodynamic temperature,
K;
η is the overpotential, V;
F is the Faraday constant, which is 96,485 C/mol; and
R represents the ideal gas constant, which is 8.3143 J/(mol·K).
During the electrochemical reaction at the interface of the porous medium electrode, lithium-ions diffuse in the thin layer of the solid and liquid phase interfaces, which realizes the embedding or de-embedding process. At the same time, the solid compound is exchanged electronically to maintain electrical neutrality. This process conforms to the charge conservation, and it can be expressed as follows:
where
σeeff and σseff represent the effective conductivity of liquid and solid phase, S/m;
φe and
φs represent the potential of liquid and solid phase respectively, V;
t+ denotes the transport number of lithium-ions, which is 0.363 in this paper;
ce is the concentration of electrolyte solution, mol/m
3; and
Sa is the specific surface area of porous electrodes, m
2/m
3.
The mass conservation of lithium-ion batteries during discharge includes liquid-phase mass conservation and solid-phase mass conservation. It can be expressed as follows:
where
εe is the volume fraction of the liquid phase;
cs denotes the concentration of lithium-ions in the solid phase, mol/m
3;
Deeff represents the effective diffusion coefficient of liquid phase, m
2/s;
Ds is the diffusion coefficient of solid phase, m
2/s.
2.3.3. Thermal Model
The energy conservation equation of the battery follows:
where
ρ is the average density of the battery, kg/m
3;
Cp is the average specific heat capacity of the battery, J/(kg·K);
kx,
ky, and
kz represent the thermal conductivity in the
x,
y, and
z directions, respectively, W/(m·K);
q is the heat generation rate, W/m
3.
The total heat generated by lithium-ion batteries during charging and discharging is mainly composed of three parts: reversible electrochemical reaction heat
Qrev, irreversible polarization heat
Qact, and irreversible ohmic heat
Qohm:
where
U represents open circuit voltage,
V.
In addition to irreversible heat, reversible heat, and Ohmic heat, with the main electrochemical reaction, there is often some side reaction heat accompanied by side reaction. The heat generated in this part is usually small and can be ignored [
19]. So, the heat generation rate of the battery can be expressed as Equation (17).
where
V is the volume of the single battery, m
3;
t represents time, s.
2.3.4. Material Properties
For the heat pipe with very high thermal conductivity, Xiang et al. [
20] found that when the battery heating power is lower than 35 W, the equivalent thermal conductivity of the heat pipe is almost unchanged, which is 15,700 W/(m K). Tian et al. [
21] ignored the complex boiling phenomenon in the wick, and also used the equivalent thermal conductivity to estimate the performance of the heat pipe cooling, so as to study the heat dissipation effect of different equivalent thermal conductivity of the heat pipes. Since the focus of this study is the heat dissipation of the battery, the complex flow and phase transition process inside the heat pipe are not considered in the multi-field coupling analysis of the battery pack, and the excellent heat conduction performance of the heat pipe is characterized by equivalent thermal conductivity.
The thermal conductivity, density, and specific heat capacity of the battery can be calculated equivalently by the mathematical method.
where
li,
ki,
ρi, and
Cp,i represent the thickness, thermal conductivity density, and specific heat capacity of various materials inside the battery, respectively.
From the data in
Table 2, the equivalent thermal conductivity of the battery is calculated as
kx = 0.9 W/(m·K),
ky =
kz = 2.7 W/(m·K), and the equivalent density is
ρ = 1958.7 kg/m
3, equivalent specific heat capacity is
Cp = 733.65 J/(kg·K).
2.3.5. Boundary Conditions
The discharge process of the one-dimensional model of the lithium-ion battery is set to constant current discharge. At the outer boundary 1 of the negative electrode of the model, the battery is defined to be grounded, where the potential is 0.
At the outer boundary 4 of the positive electrode of the model, a constant current density is defined as iapp. There is no lithium ion current at the outer boundary of the negative electrode and at the outer boundary of the positive electrode. The current density of the electron current is equal to the current density applied by the battery.
At the boundary 2 and 3 of the separator, the electron current density is 0.
In the thermal model, the main form of heat exchange between battery and external environment is convective heat transfer. The external environment is usually a fluid with certain fluidity. When the fluid passes through the battery surface, there is a certain temperature difference between the fluid and the battery surface. At this time, the convective heat transfer between the battery and the external environment will occur [
19]. Thus, the boundary condition is expressed as
where
K denotes the thermal conductivity of the battery;
Tamb is the ambient temperature, which is set at 25 °C in this paper; α represents the convective heat transfer coefficient, which is set as 2 W/(m
2·K) because the external boundary condition of the battery pack and external environment are set to natural convection.
Therefore, boundary conditions are summarized as shown in
Table 3.
2.3.6. Simulation Results of Heat Generation Rate
The effective physical parameters of the electrodes calculated by Equations (5) and (6) are applied to the electrochemical thermal coupling model, and then the change curves of the heat generation rate of the battery as shown in
Figure 3 are obtained by simulating under different discharge rates.
As can be seen from
Figure 3, the larger discharge rate, the higher heat generation rate of the battery. When the discharge rate is 3C, the heat generation rate of the battery reaches 120,011 W/m
3. At this time, the internal heat generation rate of the battery is so high that the natural convection is powerless. After the battery is grouped, the natural convection of each battery cannot be guaranteed, and the effect of natural convection is negligible. If the discharge rate continues to increase or the ambient temperature is increased without necessary battery cooling measures, the battery pack is likely to suffer from the risk of thermal runaway explosion, which is reason that the battery thermal management system must be designed to control the battery temperature [
22,
23].
Therefore, under the condition of constant current discharge at the discharge rate of 2C, the thermal management system for heat pipe cooling is designed and studied in this paper.
3. Design of Heat Pipe Cooling System
3.1. Design of Heat Pipes
The heat pipe relies on the phase change of the working fluid to transfer heat. Therefore, the working fluid has an important influence on the working characteristics of the heat pipe. The working temperature of the lithium ion battery is generally below 45 °C, and the working range of the heat pipe with water as internal working fluid is 5~230 °C, so distilled water is chosen as the working fluid. Considering the compatibility between the shell and working fluid of the heat pipe, copper is chosen as the shell material of the heat pipe.
The diameter of the heat pipe directly affects the size of the circulation area, which affects several heat transfer limits of the heat pipe. The two heat transfer limits most affected by the flow area are the speed of the sound limit and the carrying limit. From the safety point of view, the minimum diameter of the heat pipe is designed by the formula of the speed of sound limit (as Equation (23)) and the carrying limit (as Equation (24)) [
24].
where
r is the latent heat of vaporization;
ρL and
ρv represent liquid density and vapor density, respectively;
Pvc is the vapor pressure;
σ denotes the surface tension,
Qc and
Qent are the speed of sound limit and the carrying limit respectively, which are 1.5–2 times of the transmission power of the heat pipe [
24].
The transmission power of the heat pipe increases with the increase of the length of the evaporation section. It is pointed out in the article [
24] that when the length of the evaporation section is less than 500 mm, the transmission power of a single heat pipe is less than 500 W. In this paper, the height of the battery is 180 mm, so the length of the evaporation section of the heat pipe is 180 mm. Therefore, this paper chooses heat pipe with transmission power of 100 W to calculate.
The values of the internal parameters of the heat pipe are shown in
Table 4.
According to the parameters of
Table 3, diameter calculated by the speed of sound limit and the carrying limit of the heat pipe with the working temperature of 50 °C is 2.3 mm and 5.6 mm, respectively. The diameter must be greater than the maximum of both, therefore, the diameter of the heat pipe is designed to be 7 mm. The total length of the heat pipe is 269 mm, the length of the evaporation section, adiabatic section, and condensation section are 180 mm, 30 mm, and 59 mm, respectively. The heat pipe is flattened to 2 mm.
3.2. Design of Cold Plates
When using the heat pipe for cooling the battery system, the contact area between the heat pipe and battery is small; it is not effective to directly use heat pipe to attach power battery for heat dissipation. So, we consider using the cold plate. The heat pipe is embedded into the cold plate made of aluminum alloy, and the cold plate is inserted into the battery gap to increase the heat transfer area. Since there are 45 battery monomers in the battery pack arranged in 15 rows and 3 columns, a 5 mm thick cold plate is placed between each two rows of batteries.
3.3. Design of Fins
Similarly, in the condensation section of the heat pipe, the heat dissipation area is too small and the heat dissipation effect is not good. Increasing the contact area is key to improving the heat dissipation performance. Therefore, the fin structure is added in the condensation section of the heat pipe to increase the heat transfer area. In the heat pipe cooling system, the flat plate fin with simple structure is used for convection heat transfer with air, and the fin material is selected as the aluminum alloy. According to the law of conservation of energy, the heat carried by the heated air flowing through the battery is equal to that carried by the air in the convection heat transfer, which can be expressed as following:
Here, qa and qh are the heat of the air heated by batteries and the heat carried by air convection heat transfer, respectively; Ac is the area of the required fins.
According to the Equation (25), the area of the required fin is calculated to be 1.88 to 2.34 m2. In order to reduce the total number of fins and not increase the space of the battery pack too much, the section area of the fins is set equal to the section area of the battery pack, which requires 35 to 43 section area of the fins, that is, 18~22 fins are needed. Therefore, the number of fins in the preliminary design is 20, and the thickness of the fins is 2 mm.
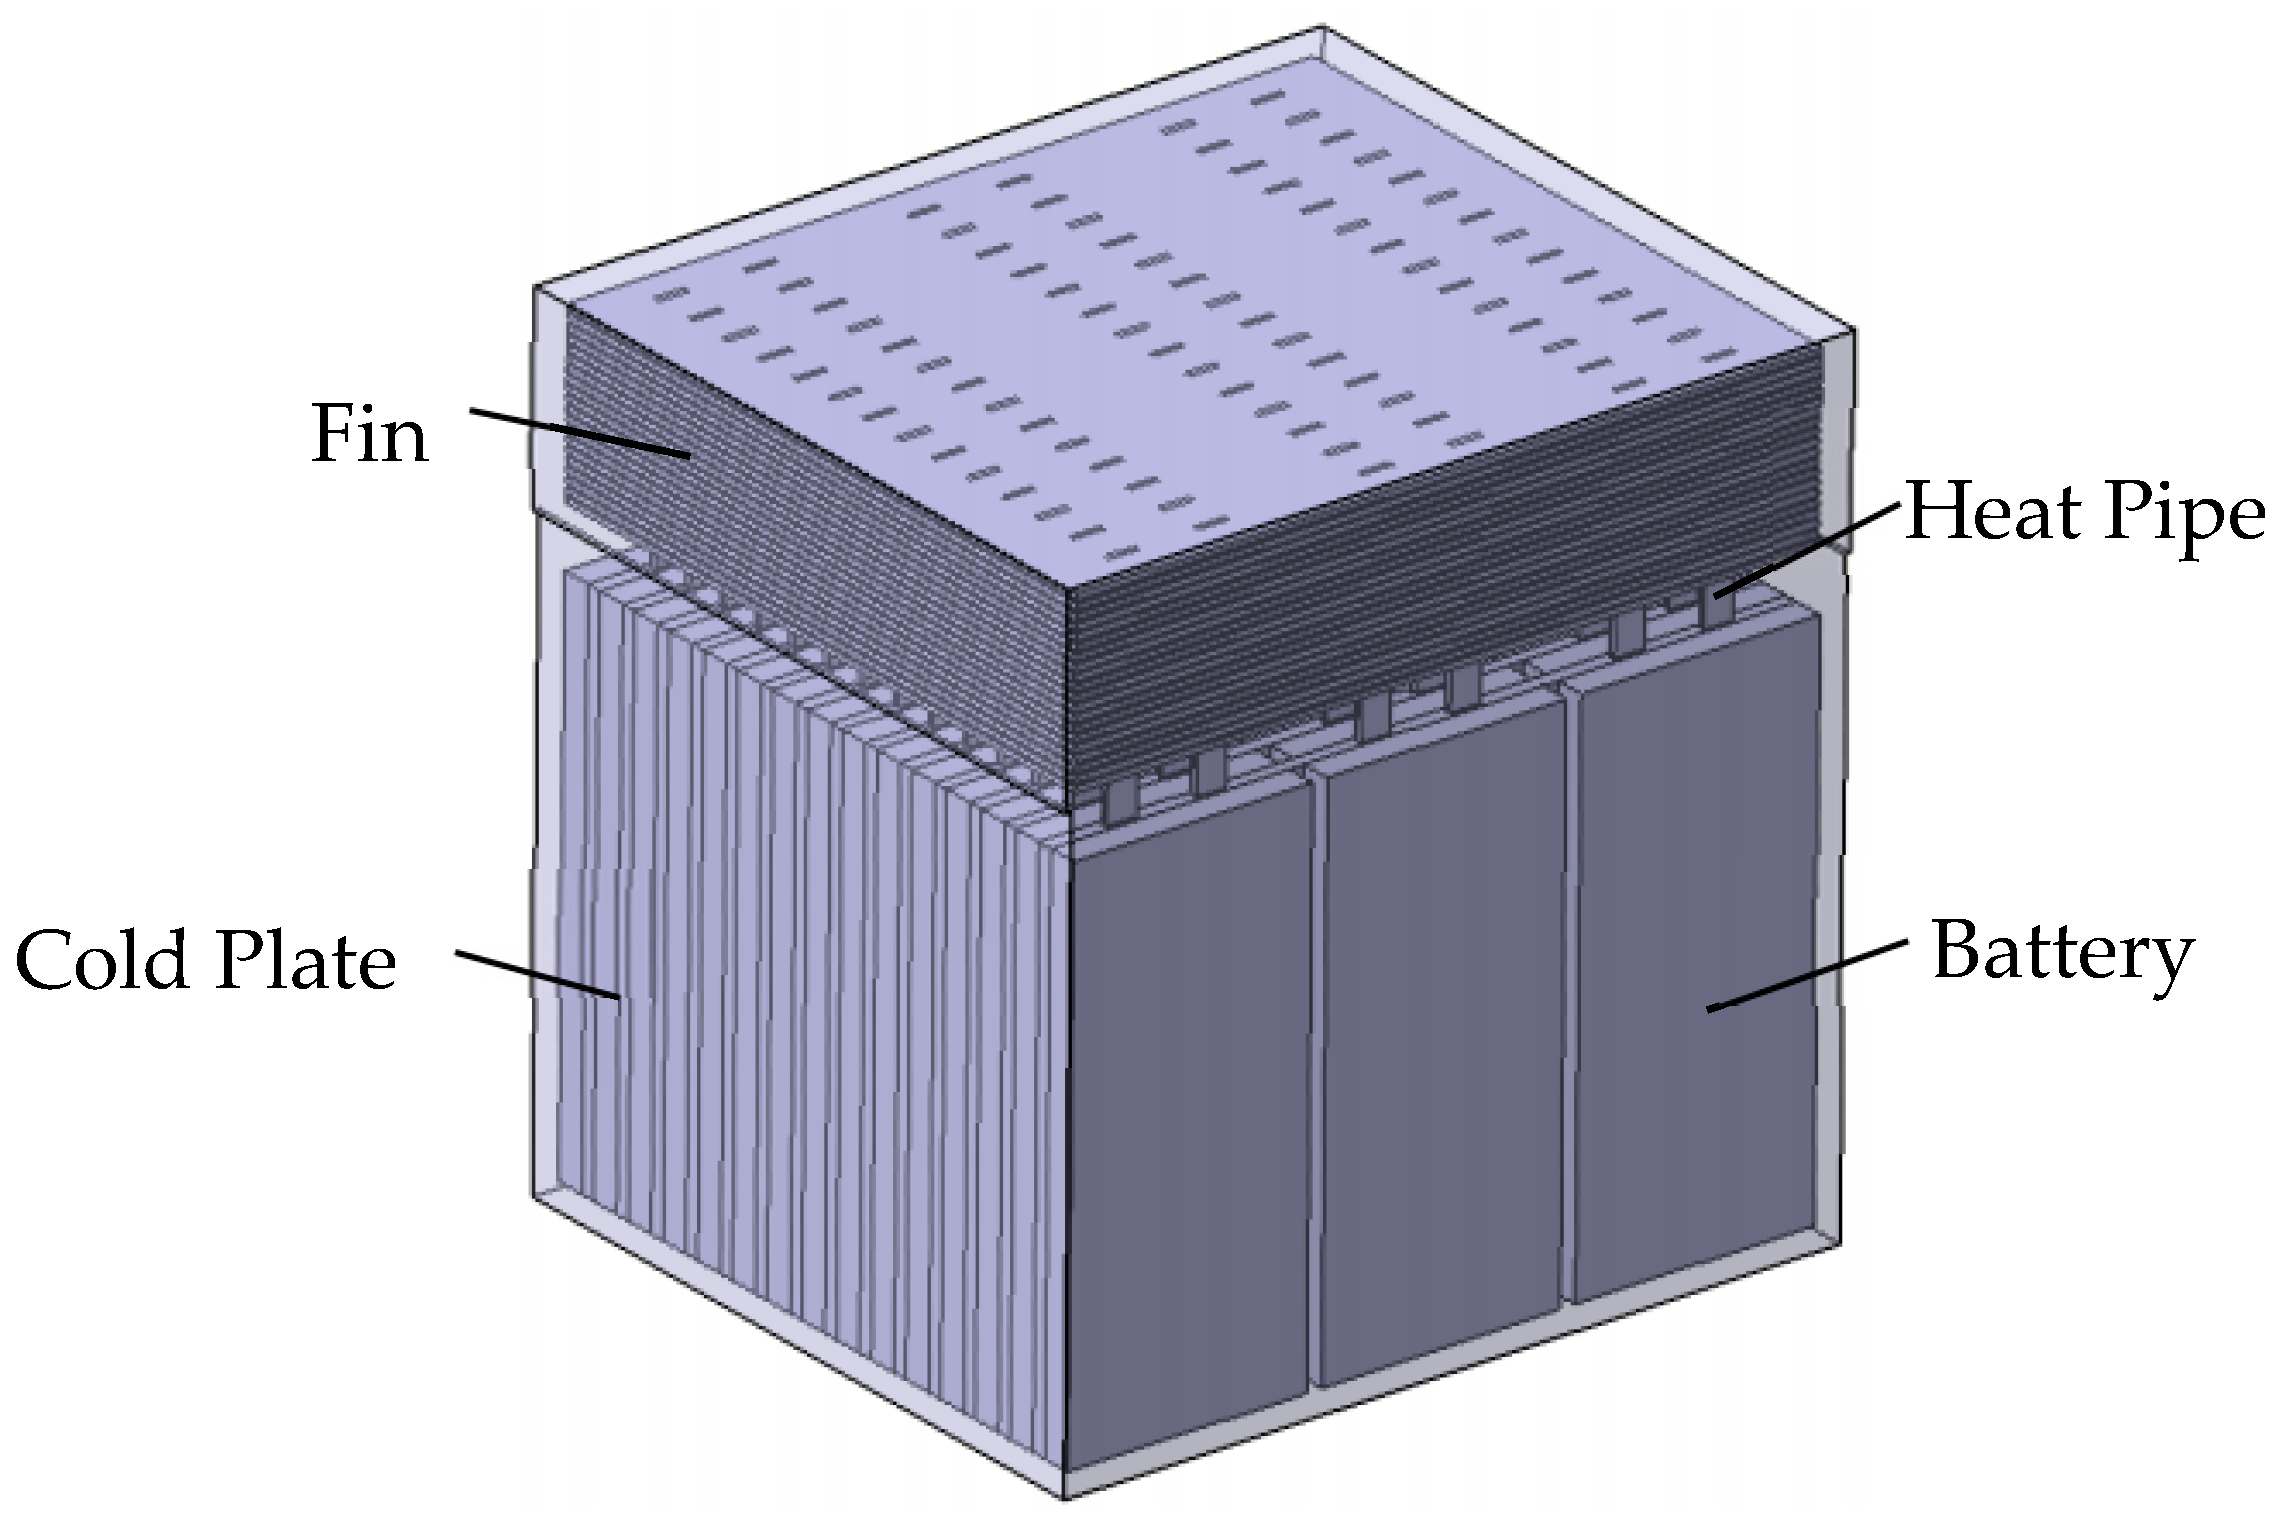
According to the design of the fins, heat pipes and cold plates in the heat pipe cooling system, the structure of the heat pipe system is shown in
Figure 4. A battery pack consists of 45 pieces of 180 mm × 80 mm × 10 mm LFP batteries. Cold plates are inserted into the gap of each row of batteries, and each of the cold plates is embedded with six heat pipes. Twenty 2 mm thick fins are installed at the condensation section of the heat pipe, and convection heat transfer is carried out through the air with a certain flow velocity and fins.
4. Model Description of Heat Pipe Cooling System
The battery pack consisting of 45 LFP batteries, the cold plates between the battery gaps, the heat pipes embedded in the cold plates, the fins at the condensation section of the heat pipe, and the air fluid around the battery pack constitute the solution domain of simulation for the whole battery pack. Since the whole solution domain includes fluid–structure coupling of the fluid region, fins and heat pipes, and there are complex phase transformation processes in the evaporation and condensation section of the heat pipes, it is quite difficult for research to take all these factors into consideration. Therefore, in order to simplify the calculation, the model of the whole battery system is simplified for study.
4.1. Governing Equations
When solving the steady-state temperature field of fluid–solid coupled heat transfer, the fluid region is treated as the steady-state flow field, and the mass conservation equation can be expressed as the following:
The momentum conservation equation is shown as the following:
And the energy conservation can be expressed as the following:
where ρ is the fluid density;
U represents the velocity, which is the vector;
u,
v, and
w are the fractional velocities of the vector velocity
U on the
x,
y, and
z axes, respectively;
μ is the hydrodynamic viscosity;
Su,
Sv,
Sw denotes generalized source terms of momentum conservation;
k is the thermal conductivity of the fluid;
ST is the viscous dissipation.
The solid region in the battery pack follows the energy conservation equation as Equation (12).
The Reynolds number for the air inlet of the battery pack is calculated to be 5427. Therefore, the k-ε model is used for the numerical simulation of the battery pack and the energy equation is turned on.
4.2. Initial and Boundary Conditions
The ambient temperature is set as 25 °C. The air inlet temperature and the initial temperature of the battery pack is the same as the ambient temperature. The inlet and outlet in the cooling channel are set as the velocity-inlet and the pressure-outlet, respectively. The air inlet velocity is set as 5 m/s. As the source of heat, the heat generation rate of the battery is obtained by the multi-field coupling simulation result, which is 44,614 W/m3 when the discharge rate is 2C. The simple algorithm is adopted to adjust the corresponding relaxation factor to solve the calculation.
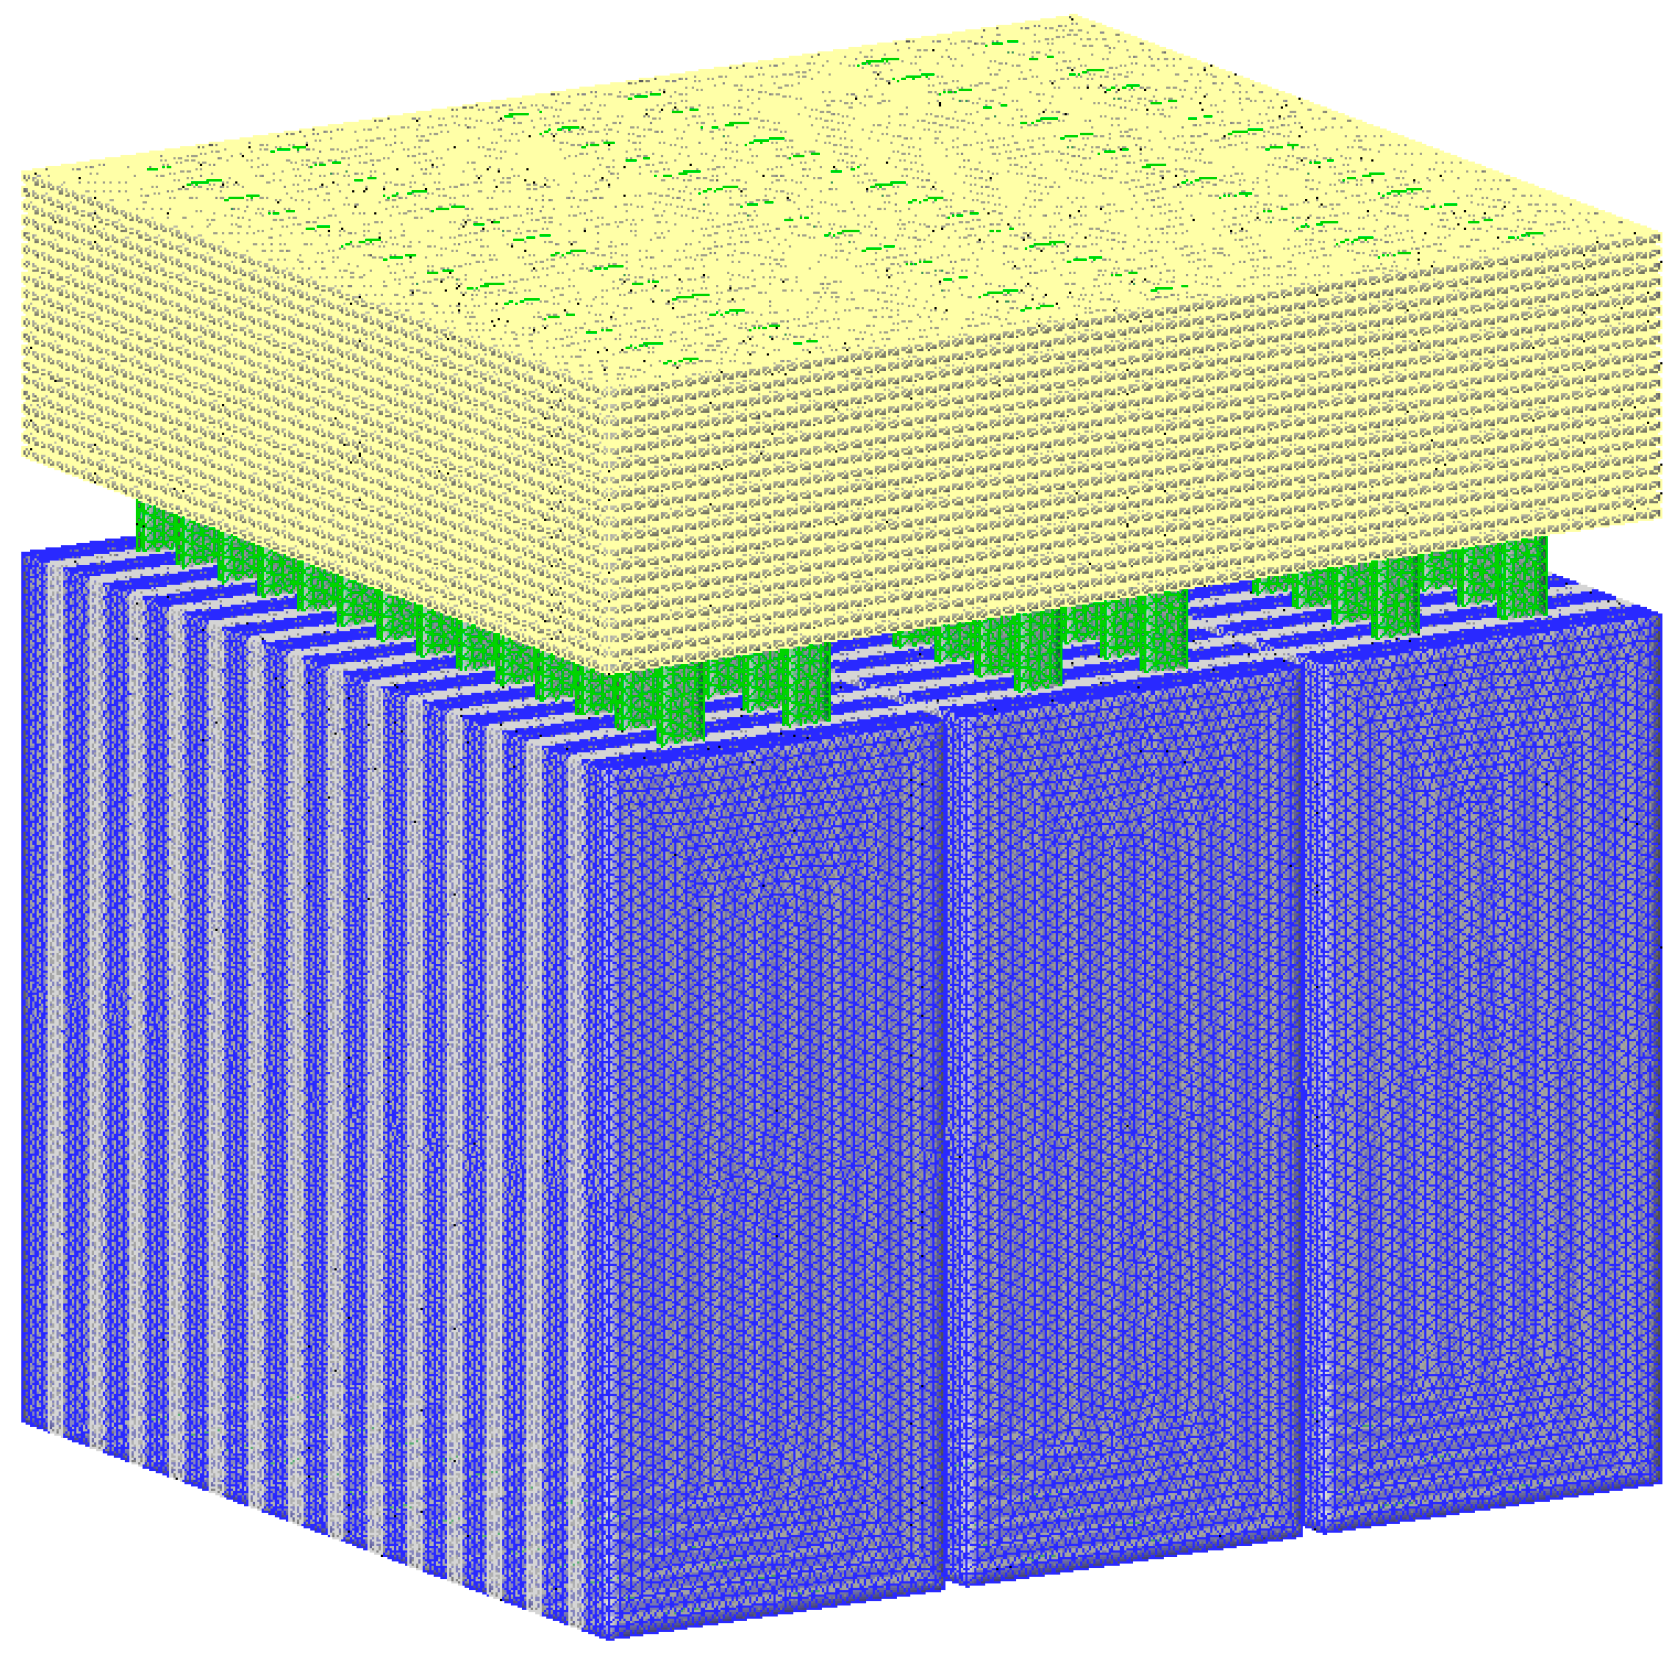
4.3. Grid Model
The heat pipe cooling system was meshed with different sizes. As the grid numbers continue to increase from 498,775, the battery temperature difference did not change much, indicating that the meshing error could be ignored. So, the mesh number of 498,775 is adopted, and the mesh model is shown in
Figure 5.
5. Results and Discussion
The temperature of the heat pipe cooling system combined with the heat pipe and forced air cooling was experimentally tested, and the system was simulated by different equivalent thermal conductivity. The simulation results show that, compared with the experimental results, the heat pipe’s equivalent thermal conductivity of 8000 W/(m∙K) is close to the experimental results. Therefore, in this paper, the equivalent thermal conductivity of the heat pipe is 8000 W/(m∙K). And the temperature distribution of the whole cooling system is shown in
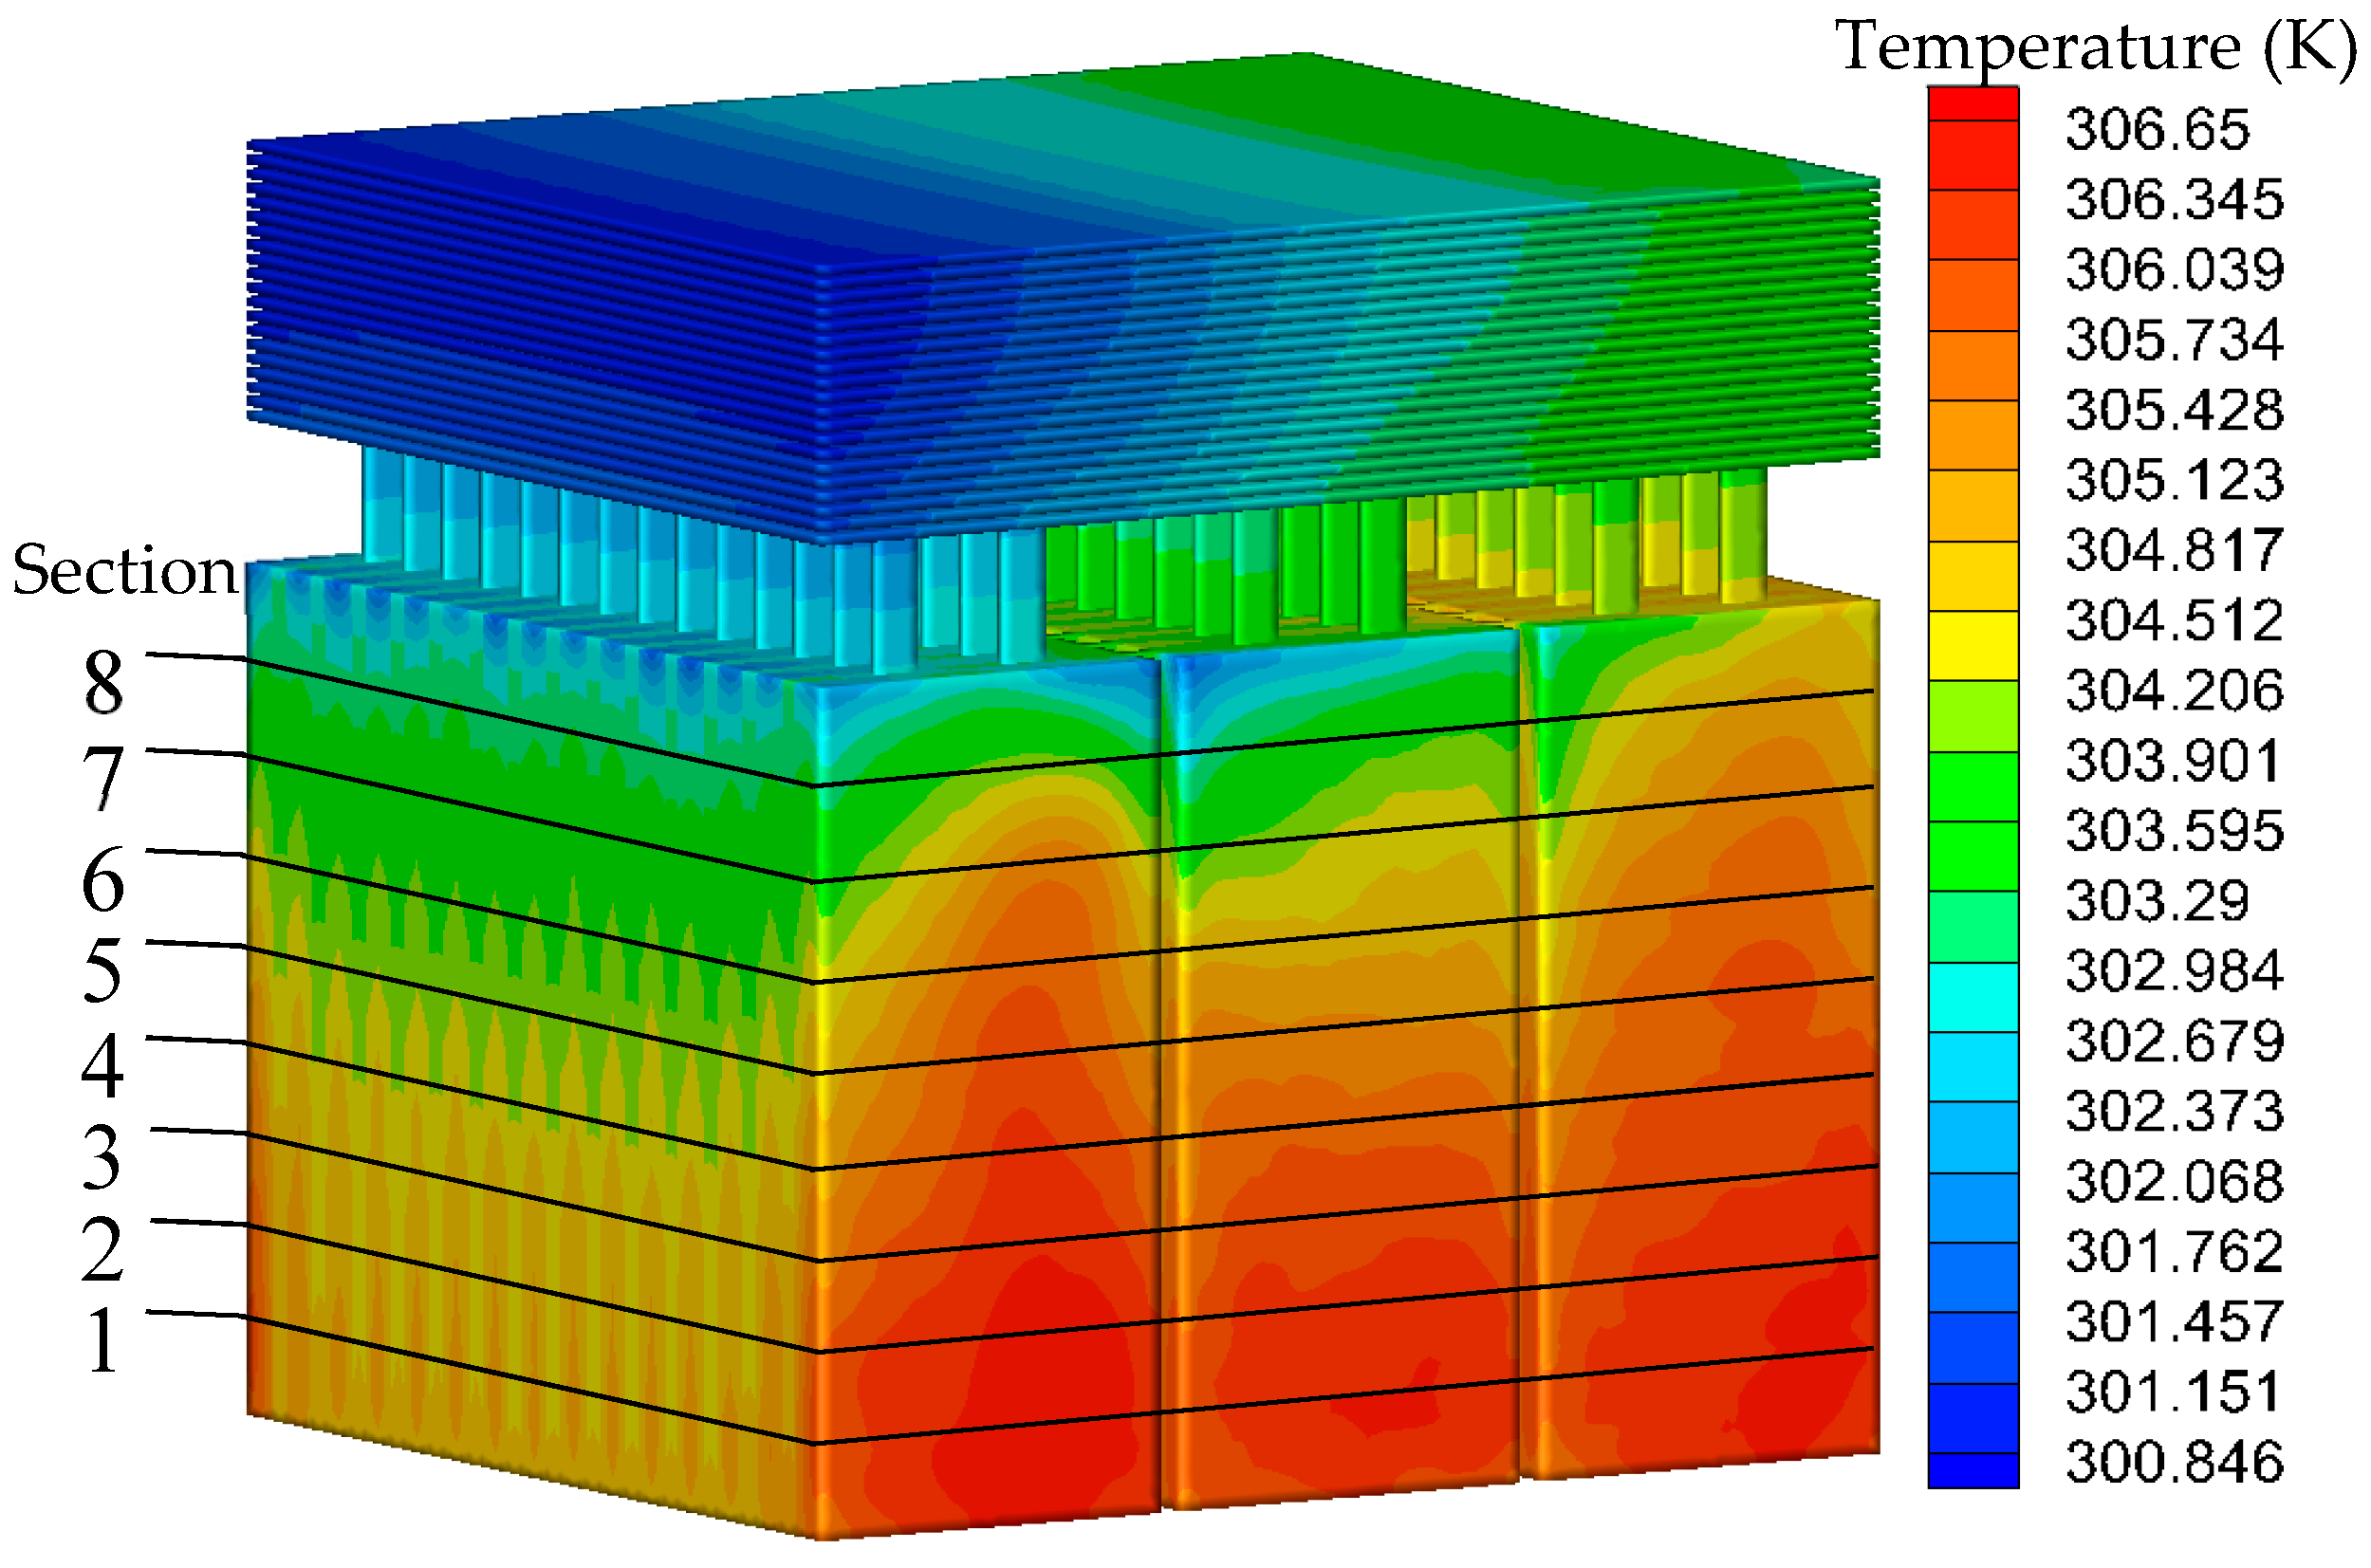
Figure 6.
The left side of the battery pack is the air inlet and the right side is the air outlet. It can be seen from the results that the temperature of the battery and the fin gradually increases from the inlet to the outlet. The temperature of the battery near the fin is higher than that at the bottom, and the temperature range of the cooling system is 300.85 to 306.65 K. Temperature of the battery ranges from 301.35 to 306.65 K, and the temperature difference is 5.3 K.
As shown in
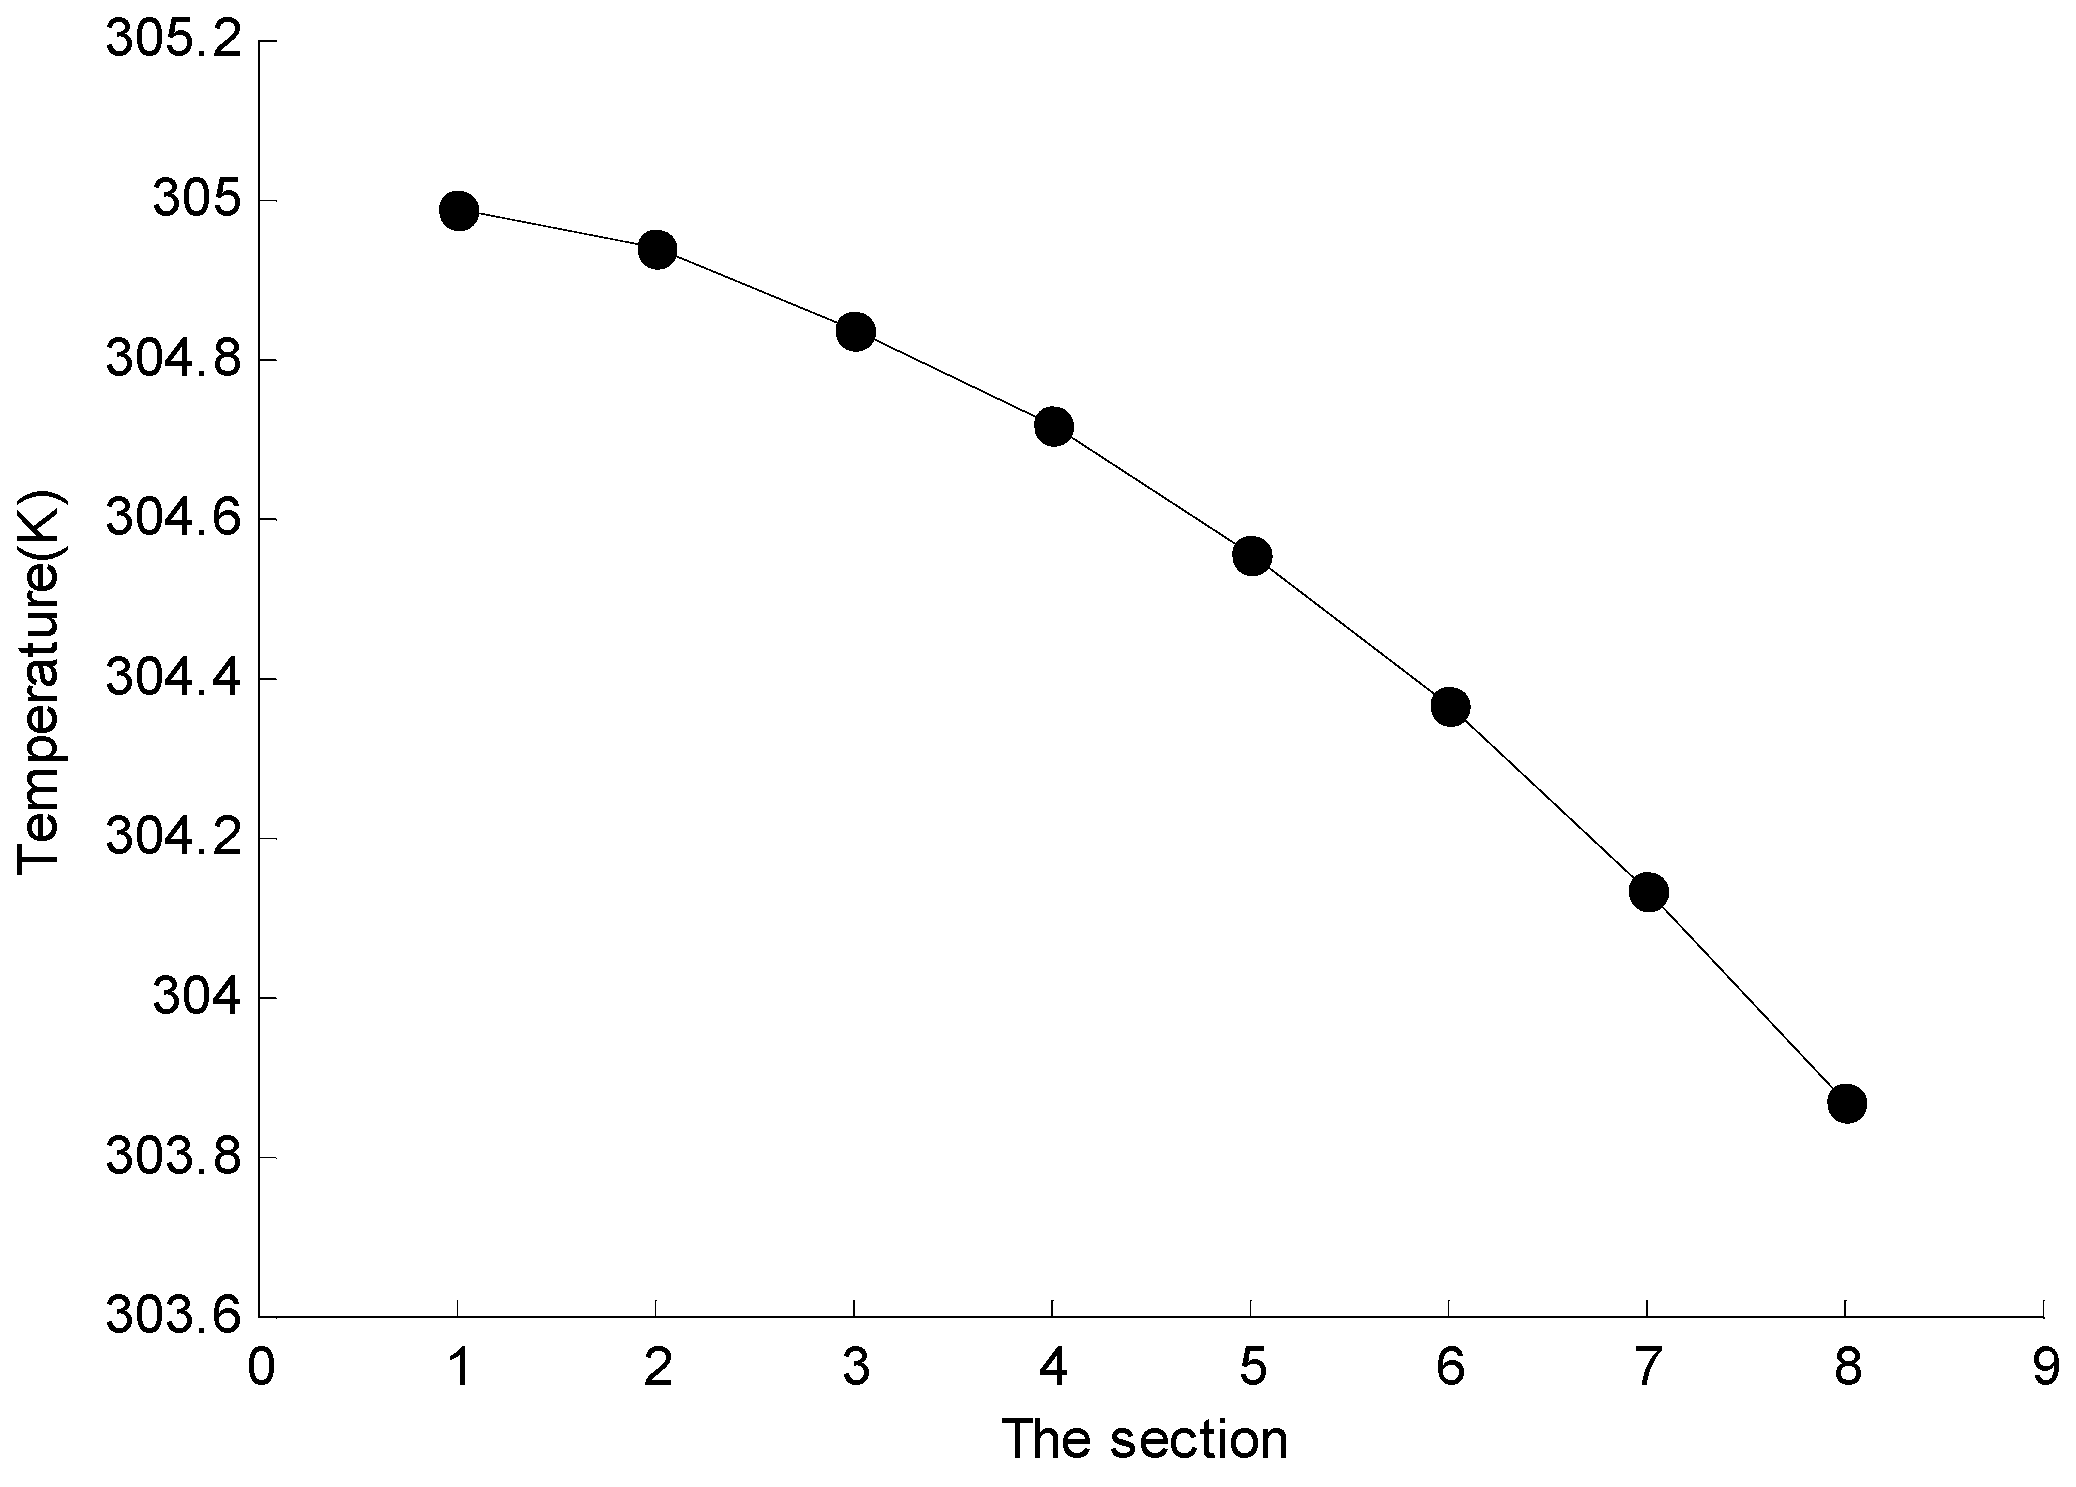
Figure 6, there are 8 sections in the z-axis direction of the battery intercepted with an equal distance of 20 mm. The average temperature of the section is read through FLUENT post-processing, and then the line diagram is drawn as shown in
Figure 7. It can be seen from the results that the battery temperature decreases gradually in the direction close to the fin, and the effect of the heat dissipation is the best at Section 8. Among the 8 sections, the highest average temperature is 304.992 K, the lowest is 303.871 K, and the average temperature difference is only 1.121 K, so the temperature uniformity is good.
However, the whole battery pack does not meet the design requirements of temperature difference within 5 K. Therefore, the influence of changing the fin spacing, discharge rate, air inlet velocity, and air inlet temperature on the heat pipe cooling system is discussed.
5.1. Influence of Fin Spacing on the Temperature Distribution of Battery Pack
In the whole heat pipe cooling system, the heat pipe acts as a heat bridge. The fins directly transfer heat to the air and take it outside the system, which plays an extremely important role. In this paper, the influence of the fin spacing on the temperature of the battery in the package is studied. Considering the interior space, the temperature of the battery pack is studied when the fin spacing increases from 1 mm to 5 mm, as shown in
Table 5.
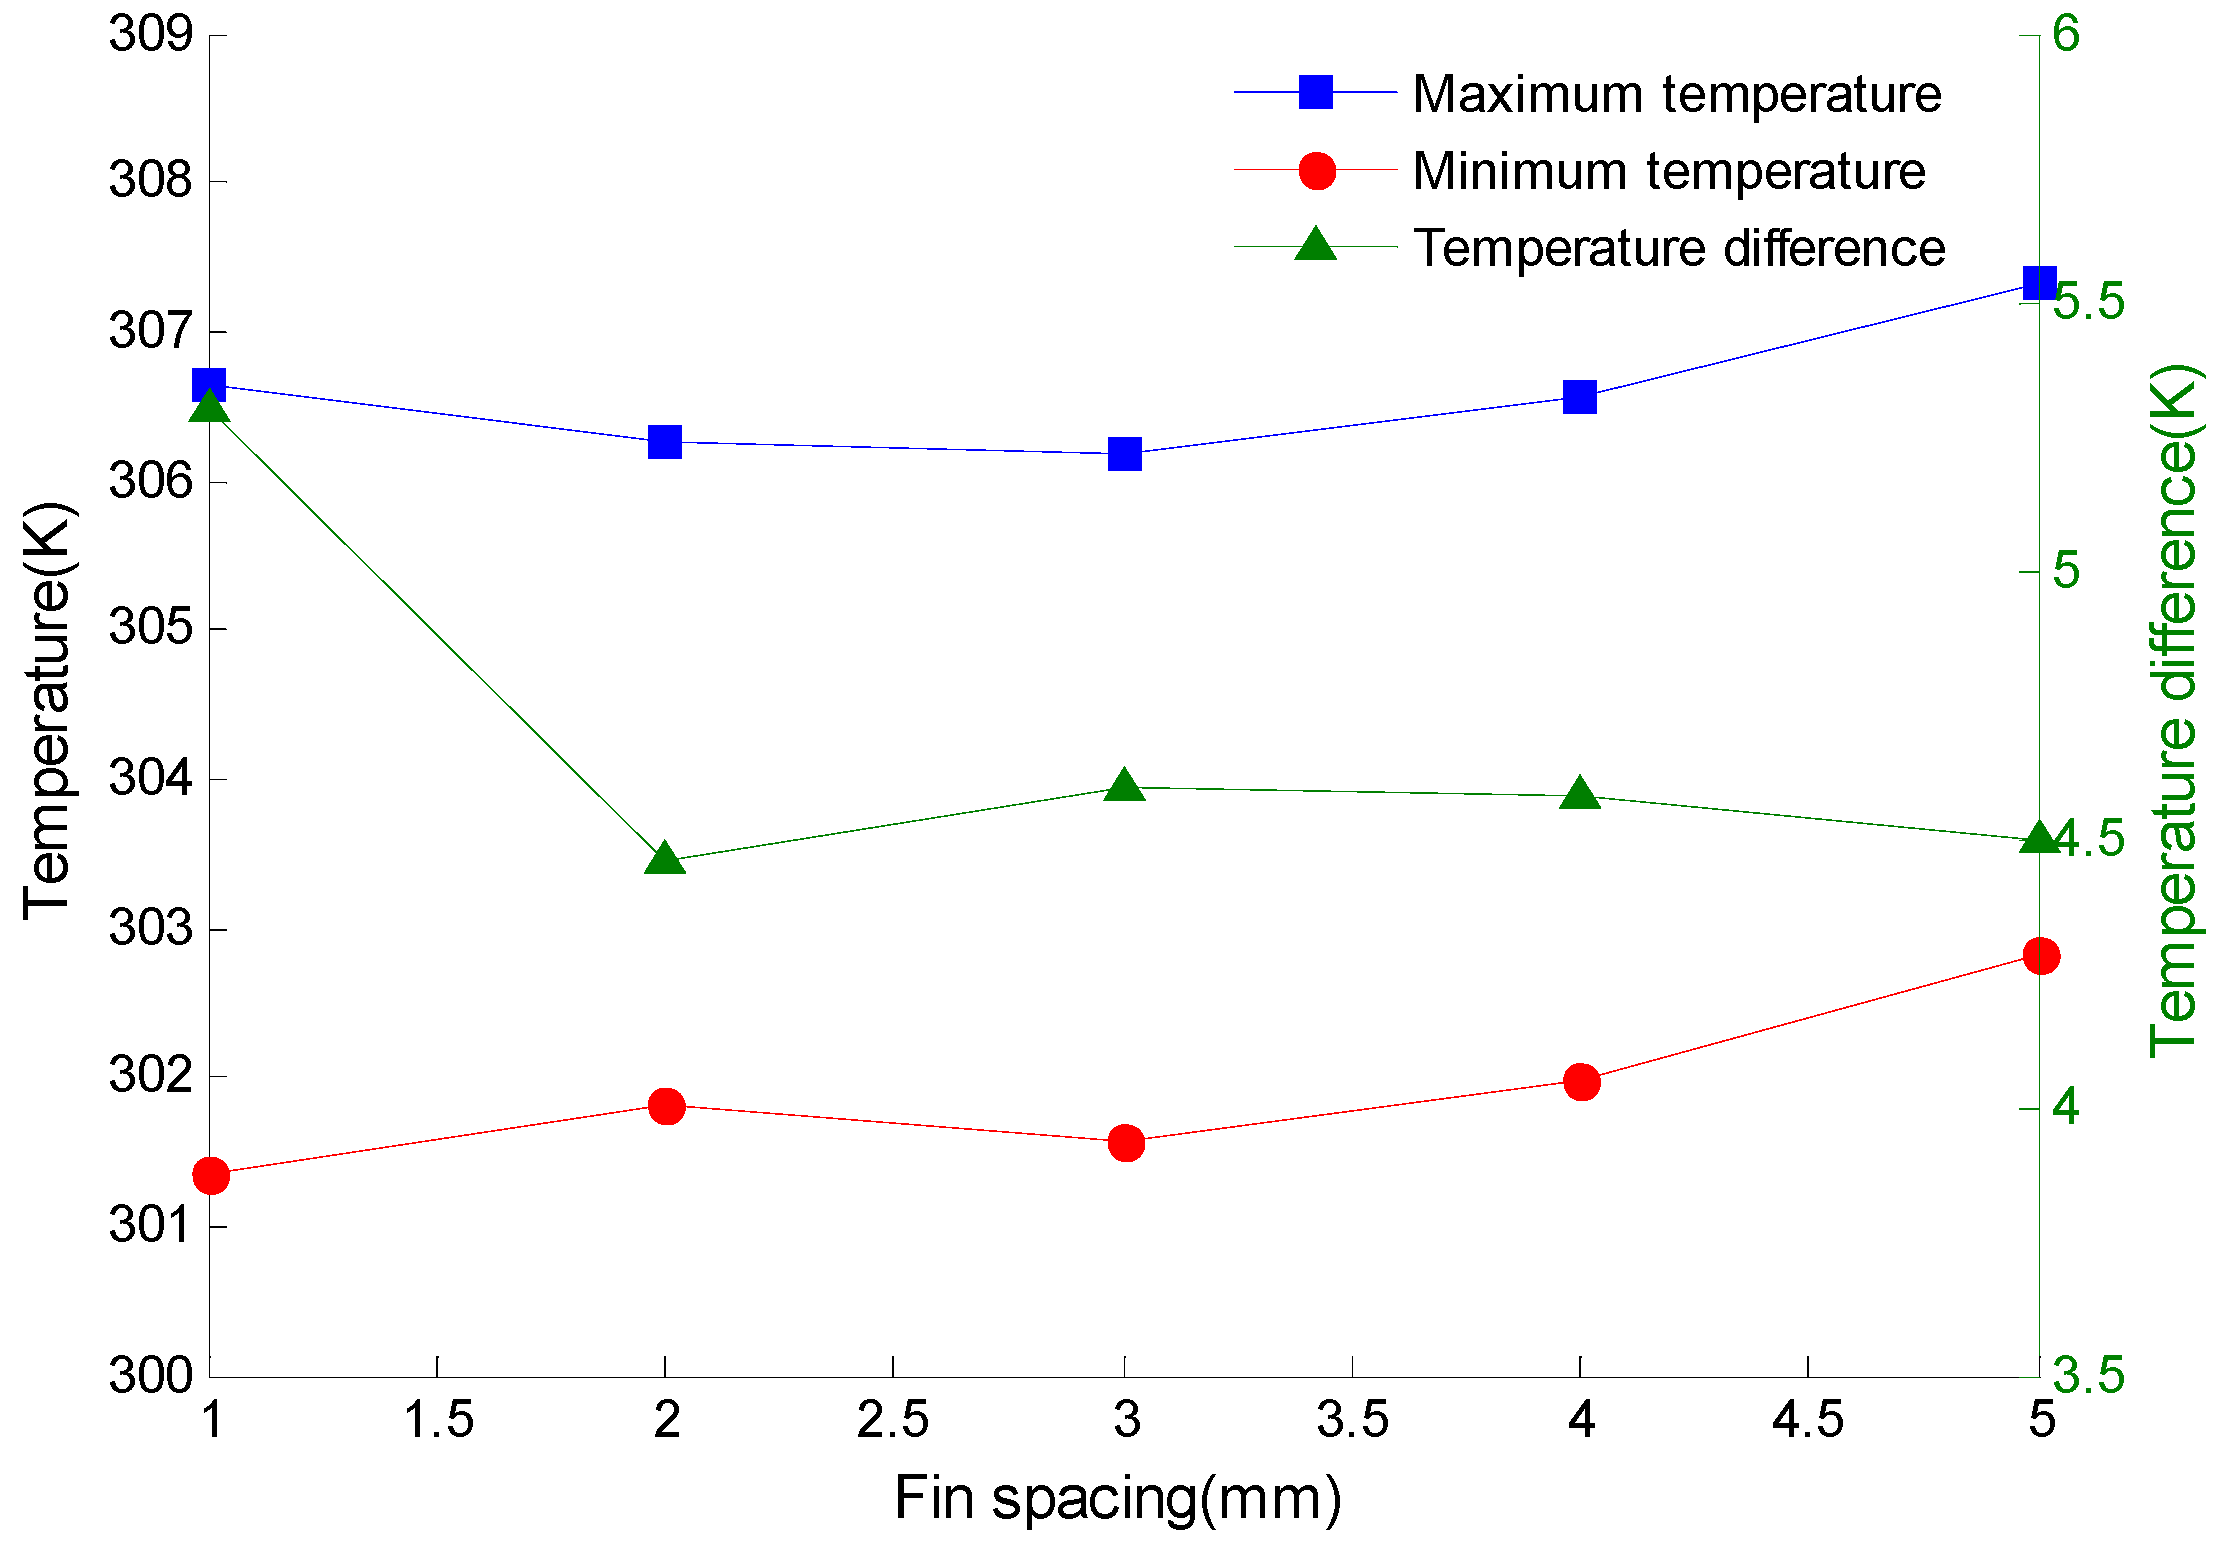
For a clearer understanding of the effect of fin spacing on the temperature of the battery pack, a line diagram is drawn in
Figure 8.
It can be seen from
Figure 8 that with the increase of fin spacing, the maximum and minimum temperatures of the battery pack increase, while the temperature difference of the battery pack decreases first and then increases. When the spacing is 2 mm, the temperature difference of the battery pack is the smallest, which is 4.46 K. As the fin spacing continues to increase, the temperature change rate of the battery pack gradually decreases, and the temperature difference curve tends to be flat. At this time, if the fin spacing is further increased, and the heat dissipation capability of the fins will not be greatly increased.
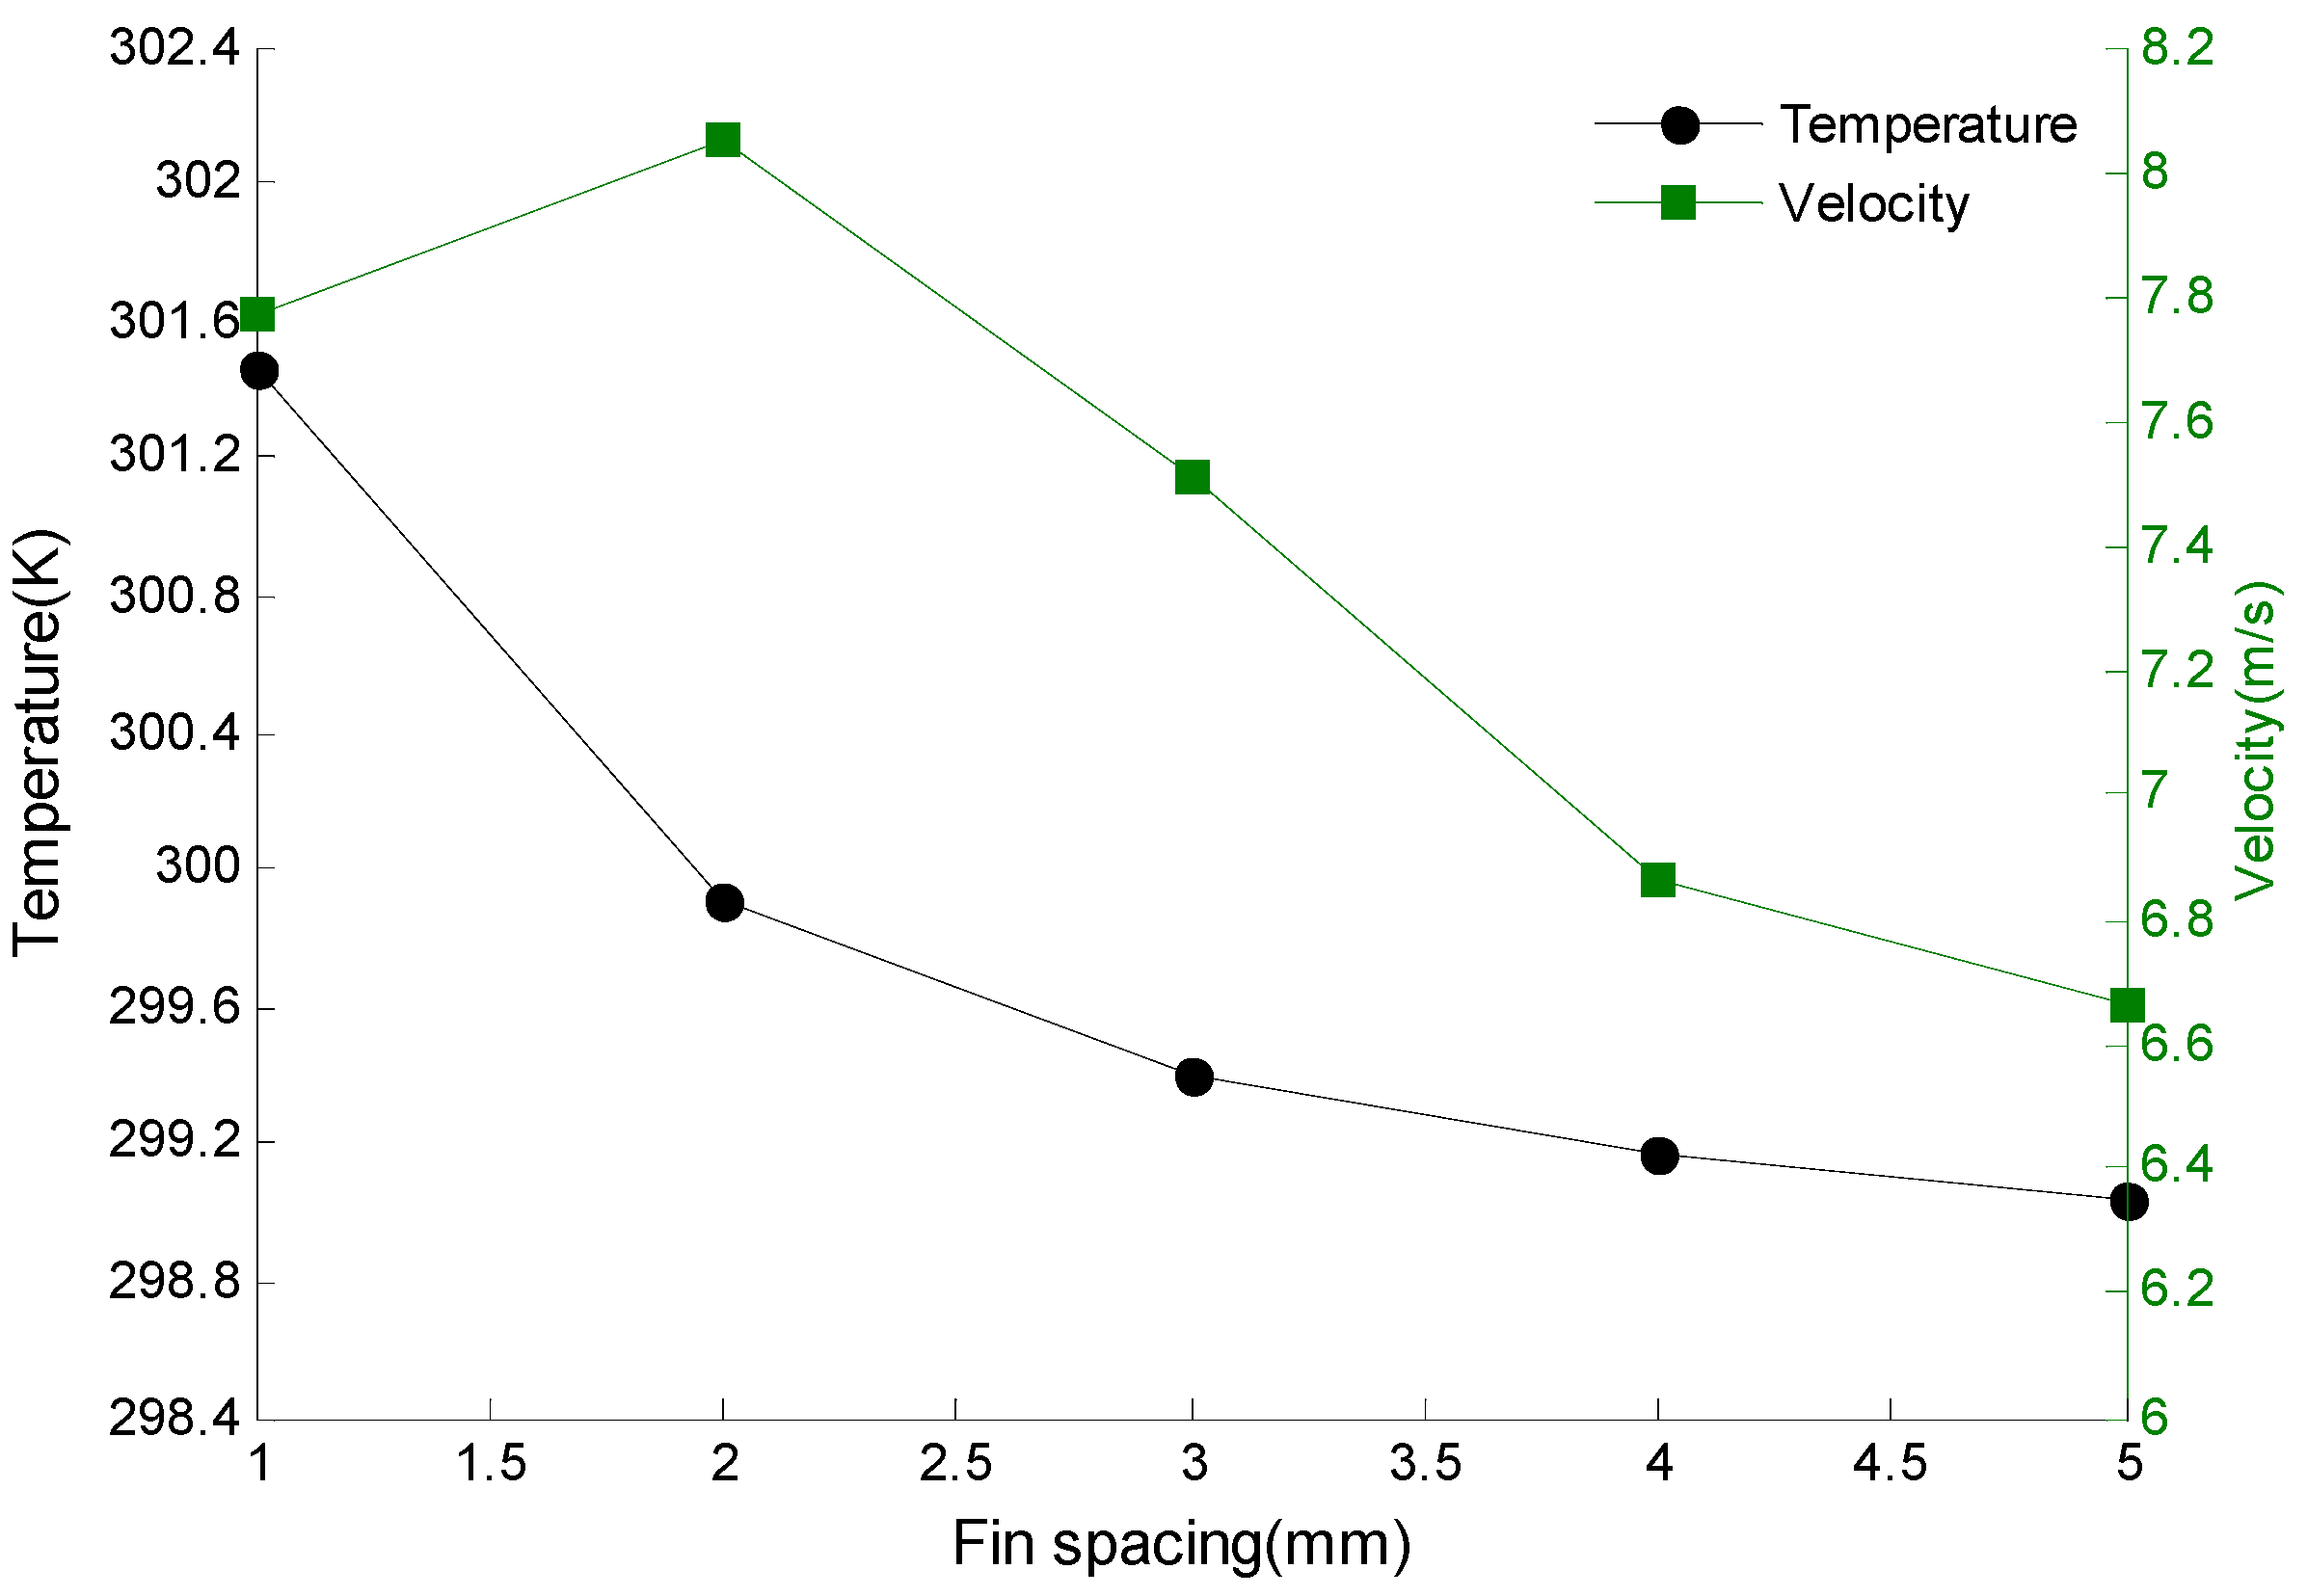
In order to understand the reason for this trend, the section of the middle layer of 20 fins is selected to check the flow velocity and temperature, as shown in
Figure 9.
As can be seen from
Figure 9, when the gap between fins gradually increases, the average temperature of the cross section gradually decreases, that is, the temperature of fins gradually decreases. When the spacing increases from 1 mm to 2 mm, the temperature change rate is the largest, and it tends to be stable when the spacing between fins continues to increase. The decrease of fin temperature represents the decrease of heat that air can take away from the fins by forced convection heat transfer with air. At the same time, it also explains that the maximum and minimum temperature of the battery pack both increase with the increase of fin spacing in
Figure 8. When the fin spacing increases from 1 mm to 5 mm, the average velocity of cross section increases first and then decreases. And when the fin spacing is 2 mm, the flow velocity reaches a maximum value, which is 8.05 m/s. This is because when the fin spacing is 1 mm, it is so small that a lot of resistance must be overcome when air flows through the fin, and when the fin spacing is increased, the resistance that air needs to overcome decreases. As the fin spacing continues to increase, the air velocity decreases when it passes through the fins due to the constant intake flow.
Figure 9 shows that the velocity of the air flowing through the fins is the largest when fin spacing is 2 mm. Since the larger velocity, the higher convection heat transfer coefficient. At this time, the heat carried away by the fin at the condition of forced convection is the largest. When the fin spacing is 2 mm, the temperature difference of the battery pack is the smallest, and thermal uniformity of the battery pack in the package is the best. Therefore, the fin spacing is selected to be 2 mm.
5.2. Influence of Discharge Rate on the Temperature Distribution of Battery Pack
In the previous simulation, only the temperature distribution of the battery pack when the discharge rate is 2C is considered, but the discharge rate of the battery is not constant in the actual working condition. Therefore, in the next section, we simulate the temperature distribution of the battery pack at different discharge rates. And the results are shown in
Table 6.
According to the data in
Table 6, with the increase of discharge rate, the maximum and minimum temperature of the battery pack increase, and the temperature difference increases gradually, which results in the worsening of thermal uniformity. At the condition of the constant current discharge, when the discharge rate is 3C, the maximum temperature of the battery pack exceeds 45 °C and the temperature difference reaches 11.551 K, which far exceeds the design requirement of temperature difference within 5 K. In
Table 6, the change rates of temperature difference are 0.654, 3.021, and 7.091, respectively. When the discharge rate continues to increase, the temperature difference of the battery pack will increase rapidly and the thermal uniformity will become worse and worse. Therefore, the discharge rate has a great influence on the temperature range and thermal uniformity of the battery pack.
5.3. Influence of Air Inlet Velocity on the Temperature Distribution of the Battery Pack
During the running of the electric vehicle, the condensation section of the heat pipe in the battery pack is cooled by the wind speed generated by the relative motion between vehicle and atmosphere. When the vehicle speed reaches 150 km/h, the wind speed can reach 41.67 m/s. However, the air inlet velocity set to 5 m/s is equivalent to the vehicle speed 18 km/h, which is set conservatively. Therefore, the influence of different air inlet velocities on the temperature of the battery pack is discussed at the discharge rate of 2C, and the obtained data are shown in
Table 7.
It can be seen that the minimum temperature and the maximum temperature of the battery pack decrease with the increase of the air inlet velocity. The overall temperature of the battery pack decreases, and the temperature difference decreases gradually, therefore the thermal uniformity of the battery pack is improved. In
Table 7, the temperature difference change rates are 0.315, 0.169, 0.089, and 0.05, respectively. Therefore, when the air inlet velocity continues to increase, the temperature difference of the battery pack decreases, but at the same time, the influence on the thermal uniformity of the battery pack is also decreasing.
5.4. Influence of Air Inlet Temperature on the Temperature Distribution of the Battery Pack
With the change of the air inlet temperature, the temperature distribution of the battery pack will change. By changing the air inlet temperature at the condition of the discharge rate of 2C, the simulation results of the battery pack’s temperature are shown in
Table 8.
Table 8 shows that as the air inlet temperature increases, the minimum and maximum temperatures of the battery pack increase, so the air inlet temperature has a great influence on the range of the battery pack’s temperature. However, compared with the previous group, the rise of minimum and maximum temperature of the battery pack is the difference between the air inlet temperature, and the temperature difference of each group is equal. Therefore, the change of air inlet temperature can only change the range of the battery pack’s temperature, but not the temperature difference of the battery pack.
6. Conclusions
In this paper, the power battery pack is designed according to the parameters of electric vehicles and the battery, then the new approach model to calculate the heat generation rate is detailed. Finally, the thermal management system based on the heat pipe is designed for a battery pack and verifies the feasibility of the design. Several conclusions are given below:
Based on the relationship between micro and macro parameters in the actual microstructure of the battery electrodes, a new approach model of the battery considering multi-scale and multi-field coupling is established and simulated, and the heat generation rate is obtained.
According to the parameters of electric vehicles and the battery, it needs 810 batteries with 90 batteries connected in series and 9 batteries connected in parallel. These batteries are divided into 18 battery packs, and each pack contains 45 batteries. The design is every 3 batteries are connected in parallel into a battery module, and every 15 modules are connected in series into a battery pack.
The temperature difference of the battery pack under the initial heat pipe cooling scheme is 5.3 K, which does not meet the design objectives. When the fin spacing is changed to 2 mm, the temperature difference of the battery pack is the smallest, 4.46 K, and the thermal uniformity is the best.
Increasing the discharge rate makes the temperature difference increase rapidly, which results in poor thermal uniformity. Increasing the air inlet velocity can improve the thermal uniformity of the battery pack, but changing the air inlet temperature can only determine the range of the battery pack’s temperature, and cannot improve the thermal uniformity.
The current of the electric vehicle is changing constantly but not discharging in constant current under the actual working condition. Therefore, the simulation of current discharge under actual changing conditions can be carried out in future studies, which can better reflect the thermogenic characteristics of the battery pack.


