1. Introduction
CO
2 emission is a global problem that affects many countries. Ironmaking processes contribute significantly to CO
2 emission, and this is the case especially with blast furnace process, which produces more than 90% of the world’s pig iron. The blast furnace is a chemical reactor involving counter-current flows of gas and solid [
1,
2,
3]. Iron-bearing materials and coke are charged in turn at the top of the furnace. Hot air, enriched oxygen, and pulverized coal are blown into the furnace through the tuyeres. Iron-bearing materials are reduced by the reducing gas containing CO and H
2, which are generated from the combustion of coke and coal in the cavity around the exit of a tuyere called the raceway [
2,
3,
4]. The hot reducing gas flows upward, heats up the iron-bearing materials, and escapes from the top in the form of CO
2, CO, H
2, H
2O and N
2. Coke has several functions in a blast furnace: a fuel providing the heat for chemical reactions and for the melting of iron and slag; a reducing agent in itself and also providing gases for iron oxide reduction; and a permeable skeleton providing a passage for liquids and gases [
5]. Therefore, it is very important for the efficiency of the blast furnace process and the quality of the hot metal. The carbon solution loss reaction of coke is a main means of coke gasification for the coke consumption in the upper part of the blast furnace. The strength and the size of the coke will deteriorate with the carbon solution loss reaction when the coke moves towards the lower zones of the blast furnace. This greatly affects the permeability of the bed and the efficiency of the process [
1,
5]. Therefore, the carbon solution loss of the coke should be restricted.
By conducting experiments under real blast furnace gas-temperature conditions, Babich et al. [
6] found that the reaction rate of the coke close to the wall of the blast furnace was higher than that in the center of the furnace. By studying the reactivity of cokes charged in an experimental blast furnace, Lundgren et al. [
7] found that the carbon solution loss reaction in the blast furnace was limited by the diffusion rate. Hilding et al. [
5] found that the reactivity of coke increased when coke moved from the thermal reserve zone to the cohesive zone of the experimental blast furnace. Having investigated the transformation of mineral matters of cokes in the blast furnace, Gornostayev et al. [
8] reported that this reduced coke reactivity by covering the pore wall. Loison et al. [
9] stated that the carbon solution loss reaction occurred under a mixed regime in the thermal reserve zone of the blast furnace. When the temperature was raised, the chemical reaction rate increased exponentially and the diffusion rate was limited to the amount of CO
2 gas. Sato et al. [
10] stated that the coke pore structure modified the available carbon surface area for the carbon solution loss. Alkalies have catalytic effects on the solution loss reaction, and they can decrease the threshold temperature to approximately 760 °C [
5,
11,
12]. Fe, CaO and MgO in coke ash are also shown to have a catalytic effect on solution loss [
13,
14]. However, the effects of different operational parameters on the carbon solution loss ratio are seldom studied. Physical experiments and mathematical modelling are common ways of investigating carbon solution loss. Several continuum models have been applied to improve practical operations of the ironmaking process especially in a blast furnace [
15,
16,
17,
18,
19].
Therefore, in the present work, a three dimensional model of carbon solution loss of coke is established based on the actual production data of blast furnace B in Bayi Steel. The model is then used to analyze the effects of oxygen enrichment, coke oven gas injection and steel scrap charging on the carbon solution loss ratio of coke in the blast furnace. The research provides the theoretical reference and technical direction for Bayi Steel to control the carbon loss solution of coke.
2. Model Establishment
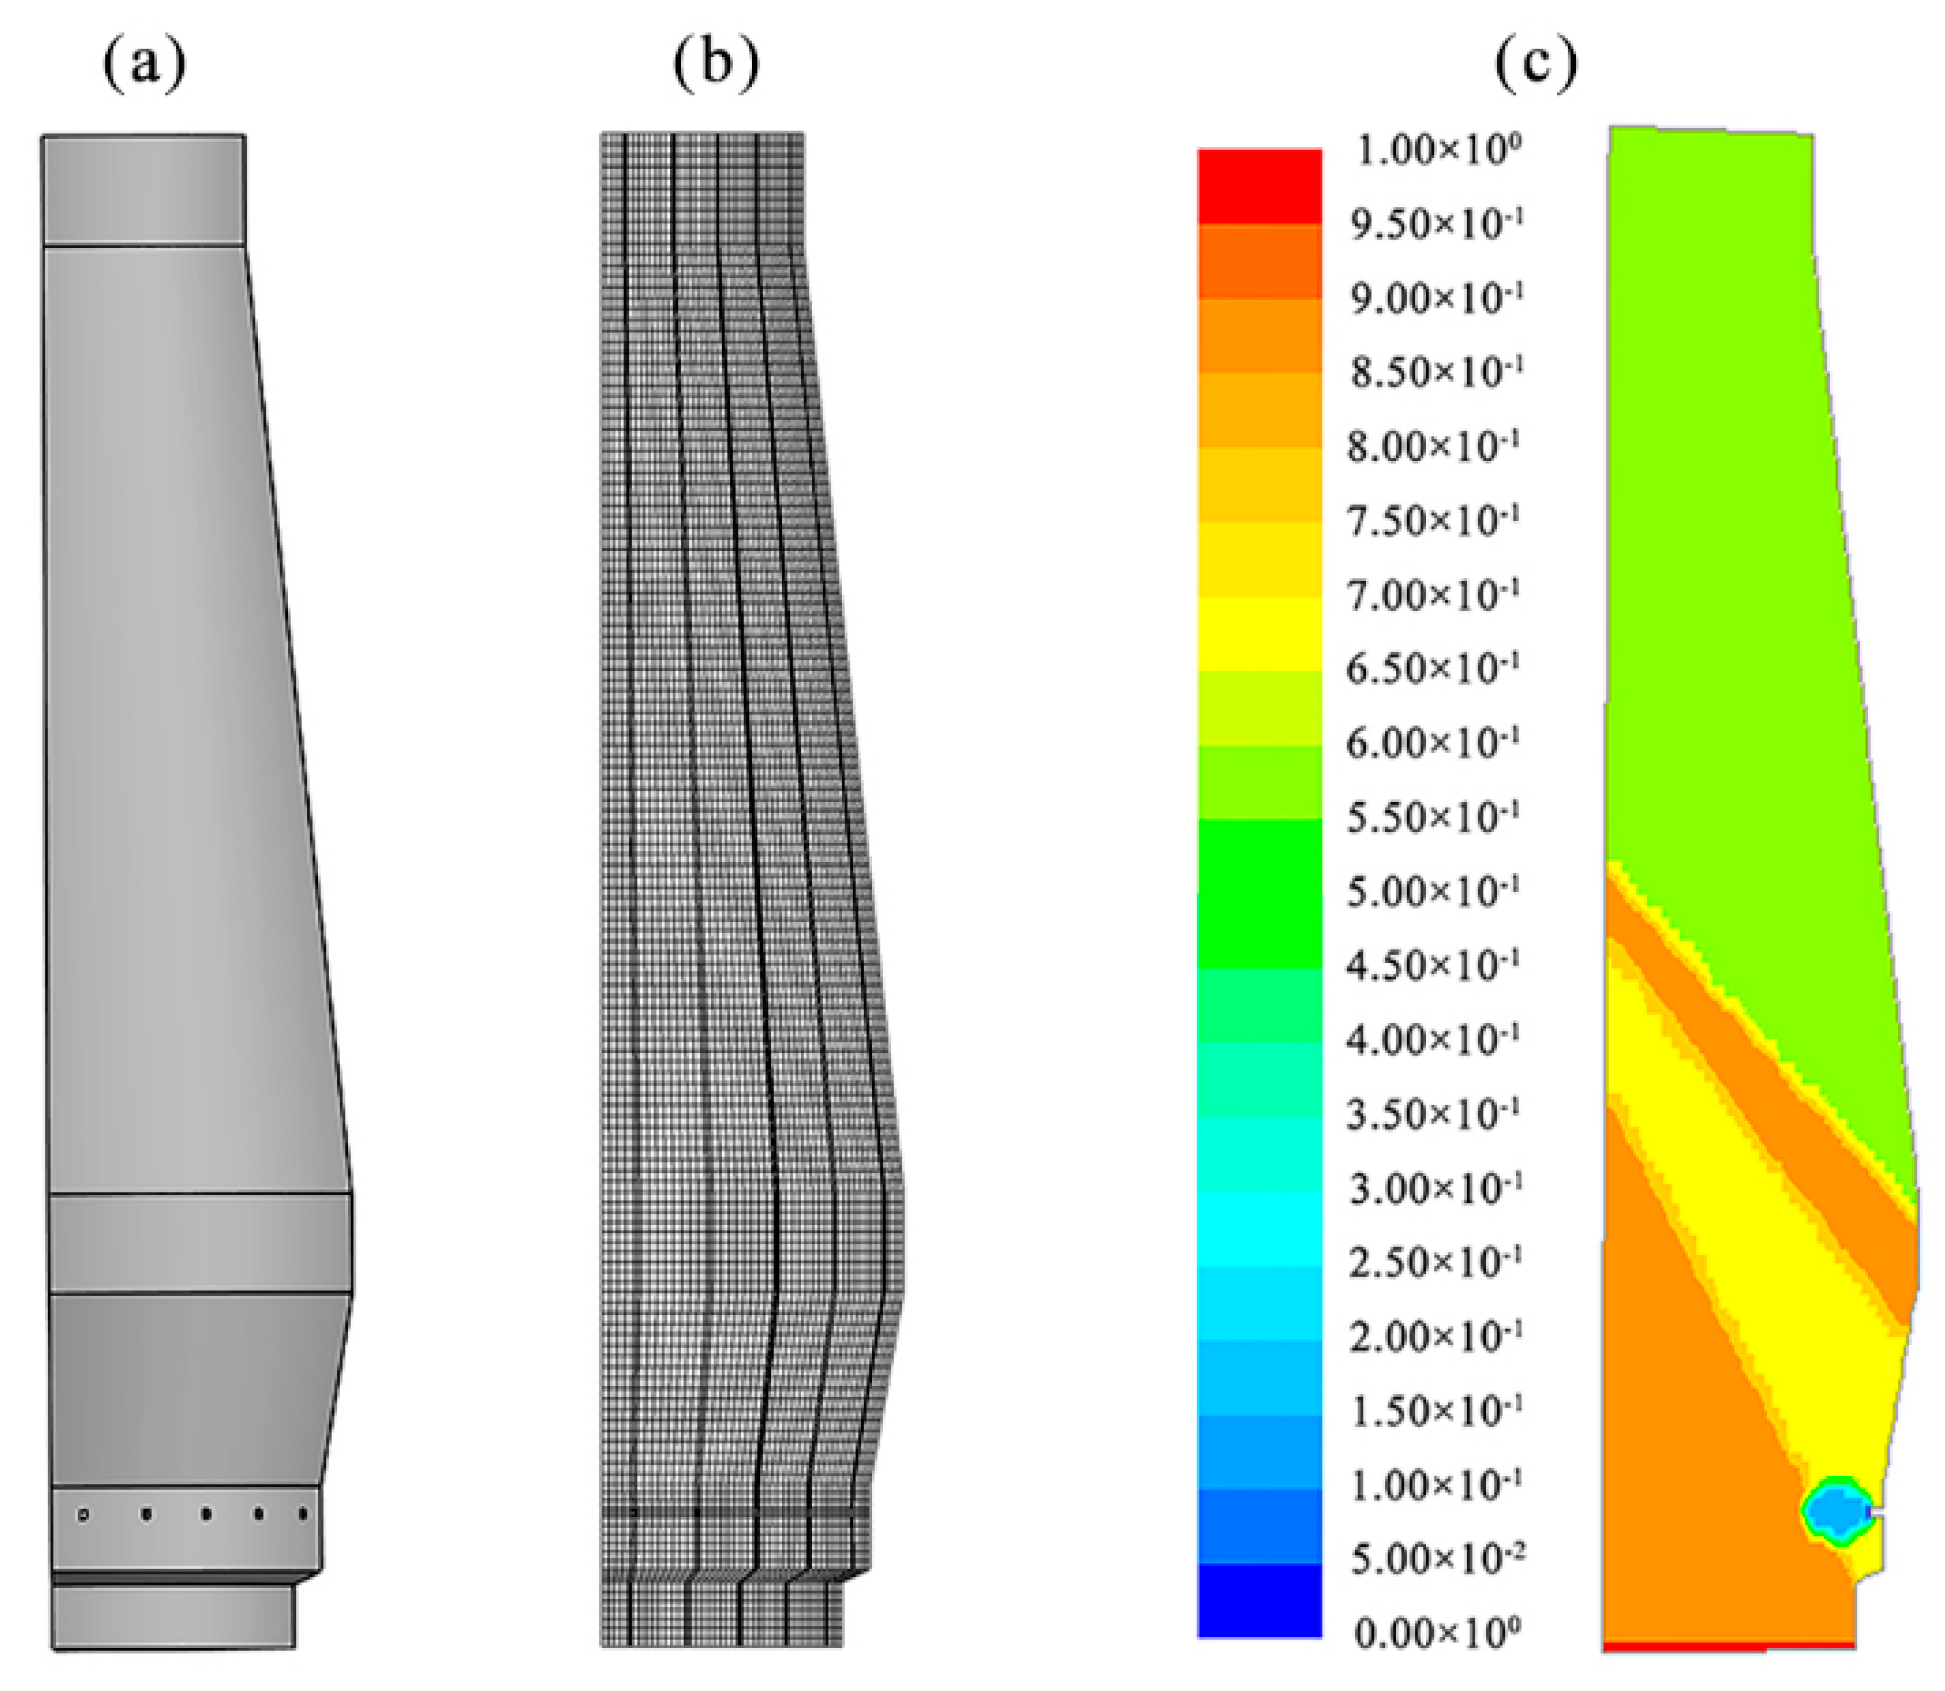
The geometric model of a blast furnace was established based on blast furnace B in Bayi Steel of Baowu Group in China, and it was a one-sixth (60 degree section) sector of the blast furnace. The total height of the model was 27.43 m, as shown in
Figure 1, where, for the sake of simplification, the part below the taphole in the blast furnace hearth is not included.
Both gas and solid phases were considered. The gas phases were the same as those in practice, including CO, CO
2, H
2, H
2O and N
2. The density of gas phase was calculated by the ideal gas law. The solid phase was simplified to include Fe
2O
3, Fe
3O
4, FeO, Fe, and C. Other components were not considered for the sake of simplicity. The density of solid phase was 4190 kg·m
−3, the same as the apparent density of the original solid material. Both gas phase and solid phase were considered as continuous phases using the Eulerian method. The mass, energy, and species transfer can be described by Equation (1) under steady state [
20,
21].
where
is the phase.
and
are the effective diffusivity and the source respectively, varying with respect to the different variables
as listed in
Table 1 [
21,
22,
23,
24,
25].
The chemical reactions between gas phase and solid phase are as follows, including the indirect reduction of iron oxide (Reactions 1–6), carbon solution loss reaction (Reactions 7), water gas reaction (Reaction 8), water gas shift reaction (Reaction 10), combustion reaction of C and H2 (Reaction 9 and 11), and so on.
| Reaction 1 |
| Reaction 2 |
| Reaction 3 |
| Reaction 4 |
| Reaction 5 |
| Reaction 6 |
| Reaction 7 |
| Reaction 8 |
| Reaction 9 |
| Reaction 10 |
| Reaction 11 |
The three-interface unreacted core model was used to calculate the chemical reaction rates, and the physical chemistry data were taken from Perry et al.’s book [
26]. The reaction rate constants of the indirect reduction of iron ore by CO or H
2, carbon solution loss reaction, water gas reaction, combustion of carbon and water gas shift reaction were taken from other work [
27,
28,
29,
30]. The combustion rate of H
2 with O
2 was taken from Kuwabara et al.’s work [
31]. The effective diffusion coefficients were taken from other work [
27,
28,
29,
30]. The viscosity and thermal conductivity of gas were obtained from the literature [
18,
32,
33,
34]. The chemical reaction rates are as follows.
In the numerical solution of the arising differential equations, a structured grid was applied. The average mesh size is 40 mm. The sensitivity study of mesh size was carried out with average size of 100 mm, 80 mm, 60 mm, 40 mm, 30 mm, and 20 mm. The difference of top gas temperature between 60 mm and 40 mm is 4.9% while that between 40 mm and 30 mm is within 0.5%. This suggests that the mesh size of 40 mm is reasonable and confirms the mesh independence. The model contains 261,131 nodes and 248,496 hexahedral cells.
The assumptions for this model were as follows: (1) The powder phase was not considered; (2) Other chemical reactions such as flux decomposition and reduction of non-ferrous compounds were ignored; (3) The melting of solids was ignored.
The main operational parameters of the blast furnace in 2018 are listed in
Table 2, where HM is the abbreviation of hot metal.
The total Fe content in the mixed iron-bearing materials was 56.20%, and the total C contents in the coke and coal were 87.38% and 62.46%. Based on the material and energy balances, Fe in the mixed iron-bearing materials was converted to Fe
2O
3 and only C in the coke was considered. The coal injection and the oxygen of the blast at the tuyere were converted to CO. Therefore, the mass fraction of Fe
2O
3 and C were 77.05% and 22.95% at the top of blast furnace, respectively. The volume fraction of the solid phase was fixed, as shown in
Figure 1c. The burden velocity distribution was firstly calculated with a simple model without taking into account heat and energy transfer. The results of burden velocity were then loaded to the present complex model taking into consideration all the transfers and reactions. The top gas pressure in the blast furnace was 194 kPa. The gas compositions at the tuyere were N
2-74.92 vol%, O
2-15.34 vol%, CO-9.15 vol%, H
2O-0.59 vol%. The conservation equations were solved numerically by the finite volume method with commercial software ANSYS FLUENT (release 17.0) [
35]. The Eulerian multiphase module was used in this model. The first order upwind scheme was used for discretization of density, momentum, volume fraction, energy, gas and solid species, and so on. The Phase Coupled SIMPLE method was applied [
21,
30]. The simulation was considered to have converged when the residuals for each variable were less than 10
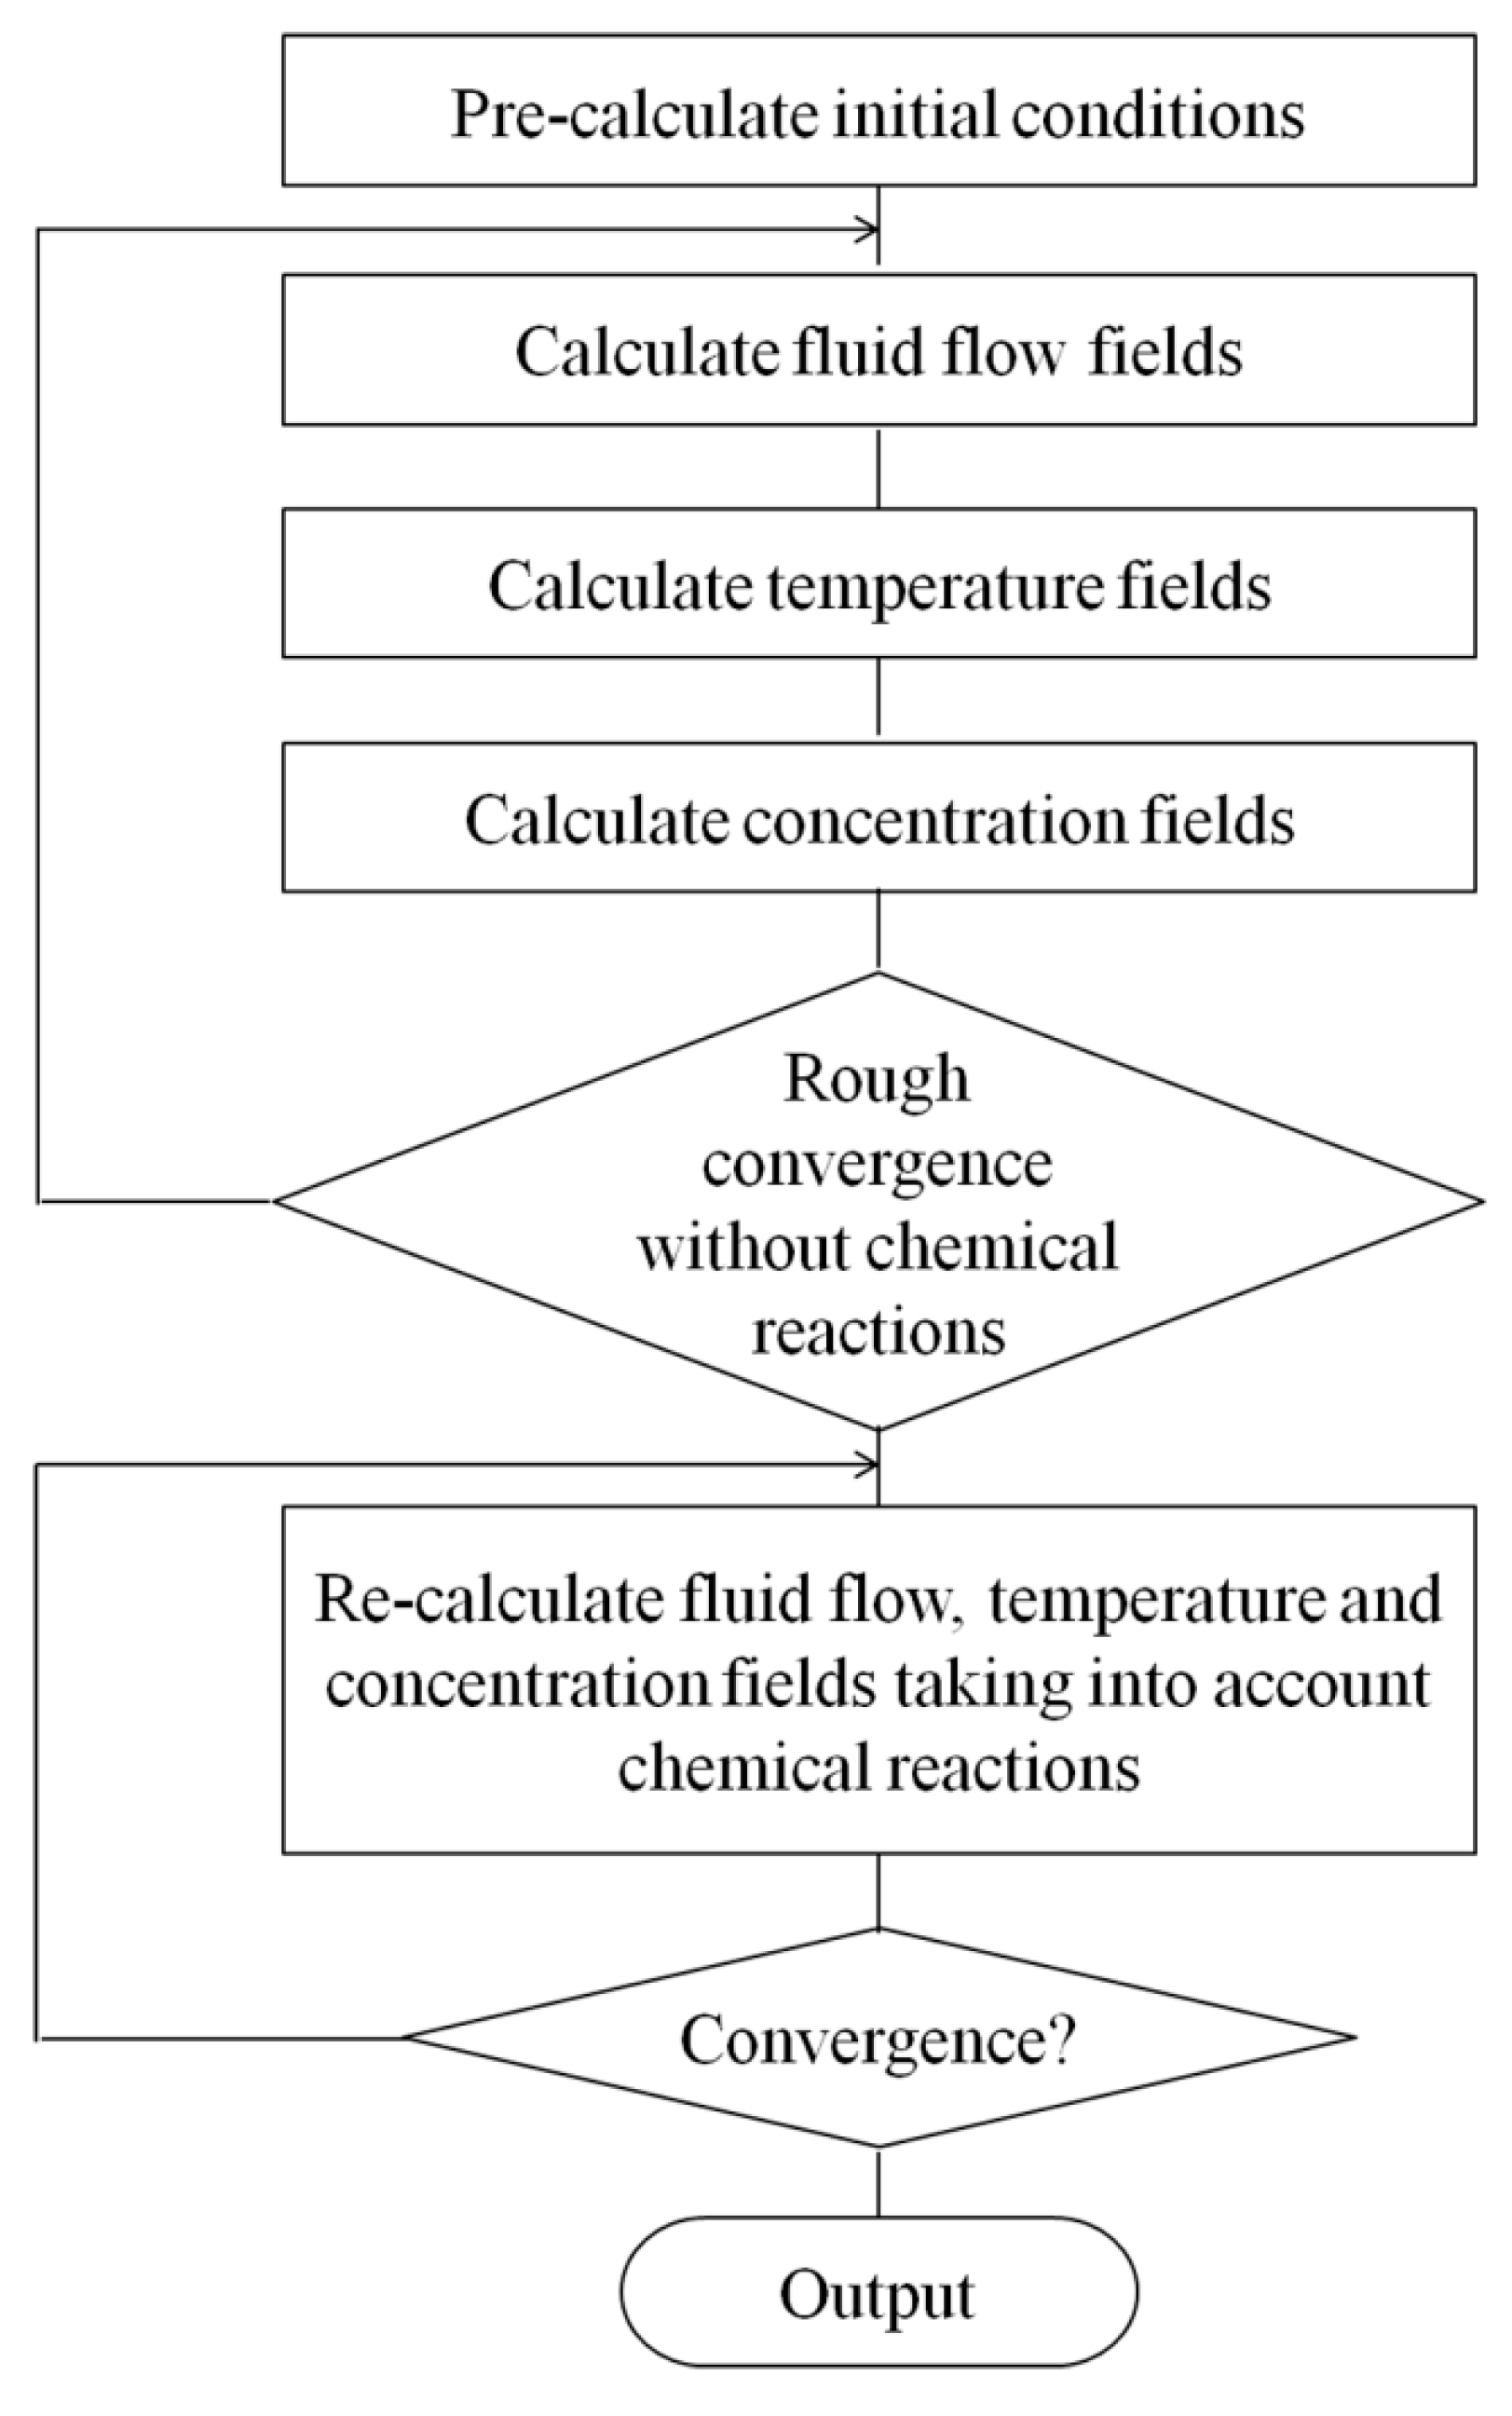
−5. The solution flow chart is shown in
Figure 2.
3. Results and Discussion
3.1. Base Model
The gas compositions at the top of the blast furnace calculated from this model were verified against some measured results of practical production as shown in
Table 3, where H
2O is not listed since it was not measured in the practice. The maximum relative error between the measured and calculated results is 6.3%. Therefore, the present model is considered to be applicable to carry out the further simulation.
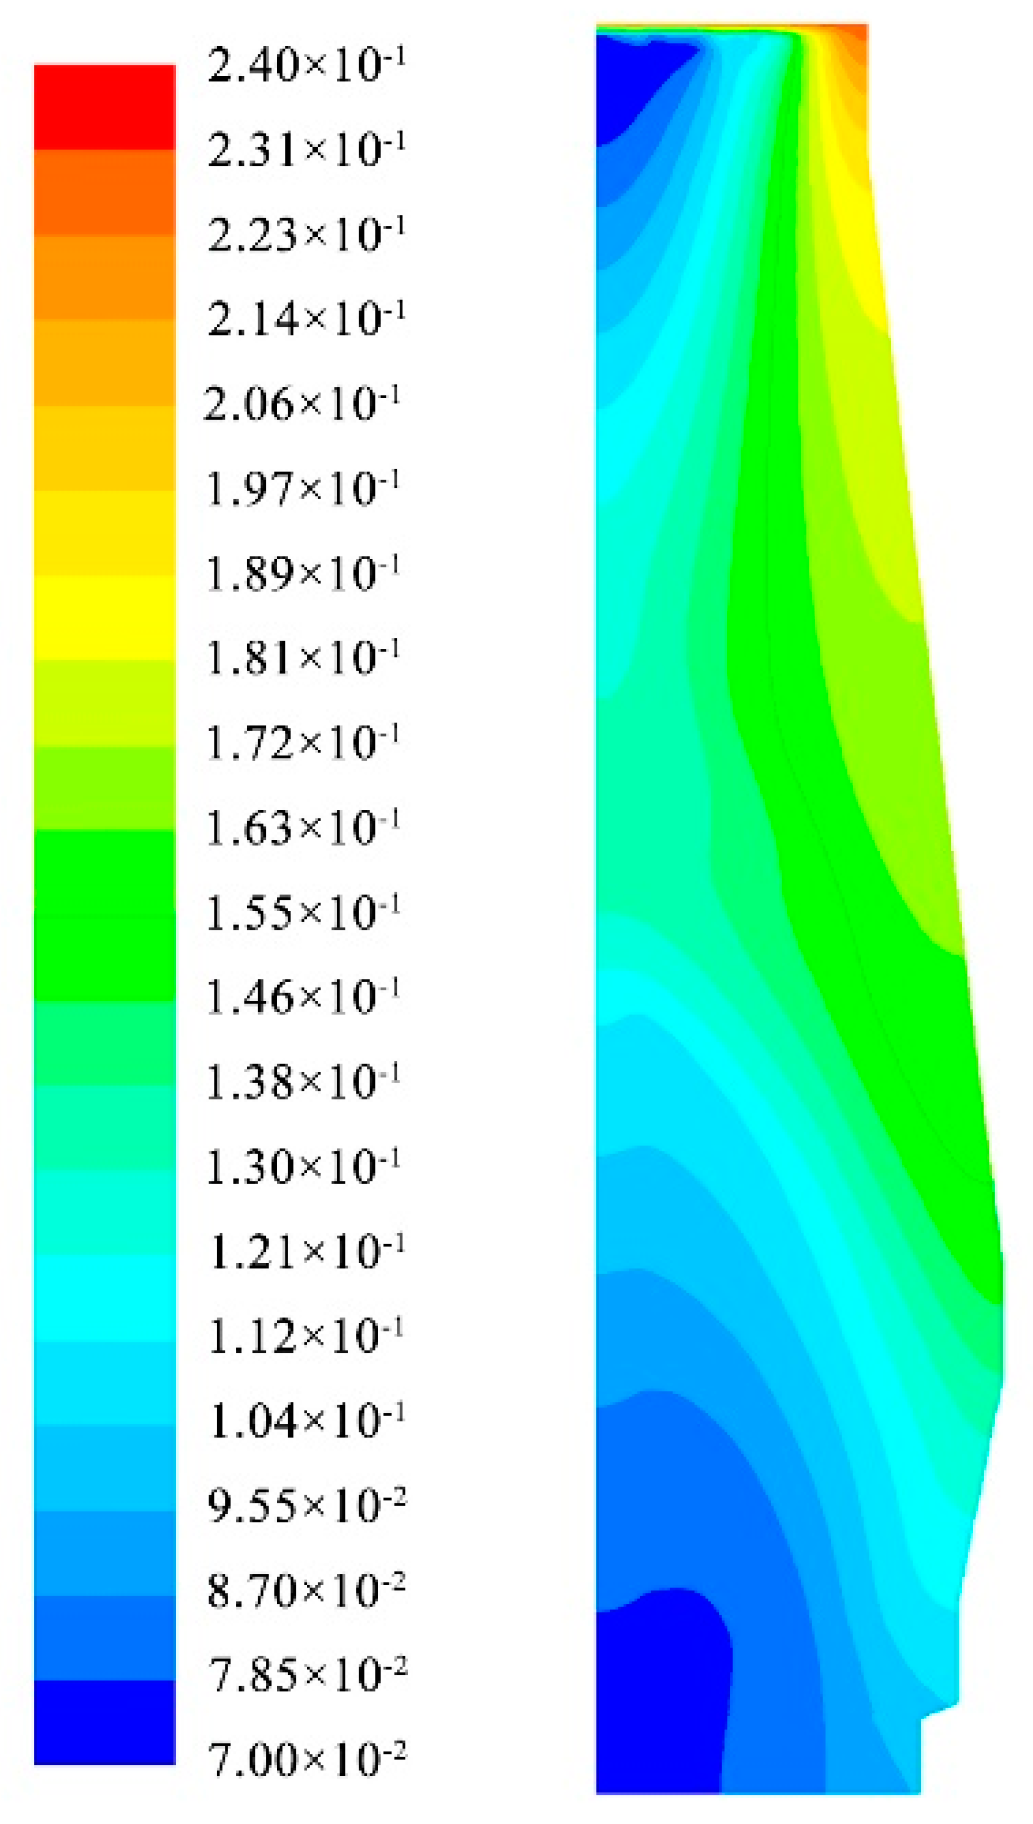
Figure 3 shows the mass fraction distribution of carbon in the blast furnace under base operational condition.
It can be seen from
Figure 3 that the carbon mass fraction in the blast furnace firstly increases, then decreases after reaching a maximum in the middle. The reason for the increase is that the reduction reactions take place in the middle-upper part of blast furnace, and this leads to the decrease of the ferrite oxide mass fraction. The reason for the decrease of the carbon mass fraction is that carbon solution loss takes place in the lower part of the blast furnace.
The absolute consumption amount of carbon at a certain height of the blast furnace can be calculated based on the material balance. The carbon solution loss ratio of coke can be calculated by
where
and
are the amounts of carbon consumed by the carbon solution loss reaction and the total carbon input from the blast furnace top, kg.
The carbon solution loss reaction taking place in the middle-upper part of blast furnace further reduces the quality of the coke and results in the poor performance of the blast furnace. Therefore the mean temperature of the cohesive zone is adopted as the boundary of the carbon solution between the middle-upper part and the lower part of the blast furnace. The average temperature of the boundary is 1300 °C. The yC at this boundary is 18.61%.
3.2. Oxygen Enrichment Ratio
The oxygen enrichment mode in the present work is that the flowrate of the hot blast is constant. Oxygen is added to the blast and forms a mixture of air and oxygen. The amount of coal changes with the oxygen enrichment ratio. Based on the practical data, the coke rate decreases by 5 kg·t
−1 and produced hot metal increases by 3.3% when the oxygen enrichment ratio increases by 1%. As a result, the amounts of gas, coal, coke, and production can be determined, and the compositions of injected gas and top gas are then calculated based on the balances of Fe, C, H and O.
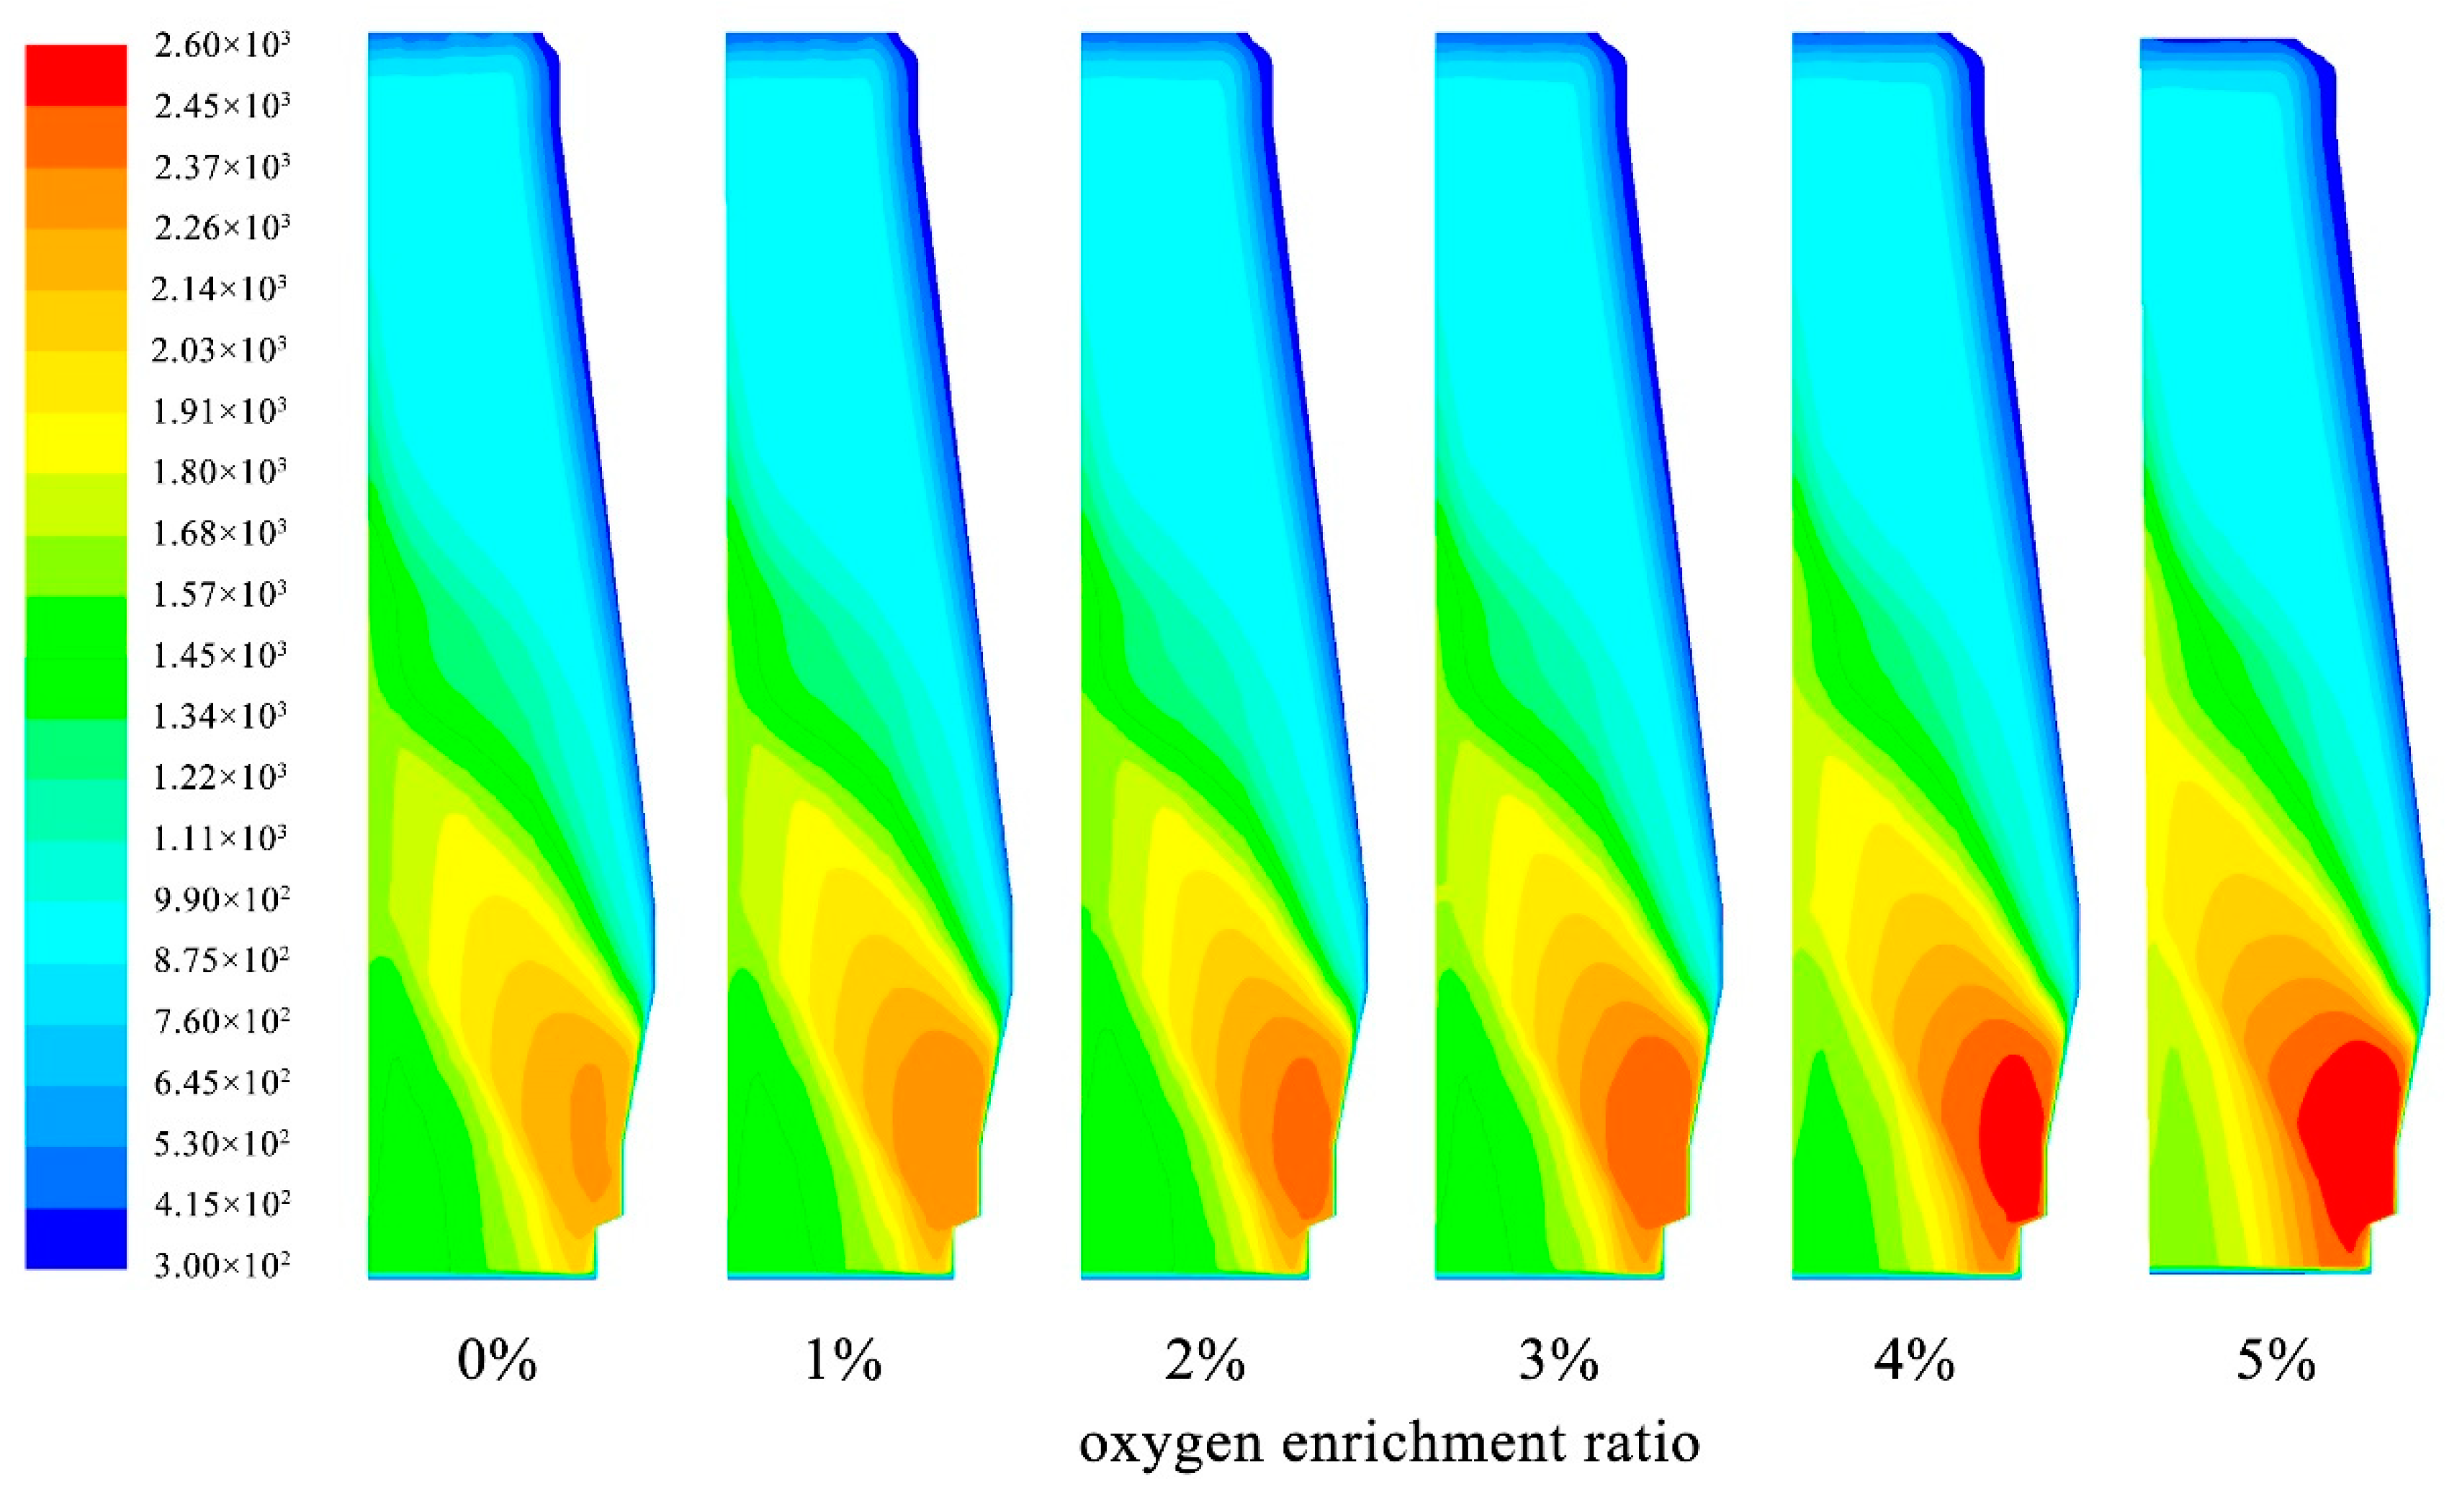
Table 4 presents the typical parameters when the oxygen enrichment ratio varies from 1% to 5% at a step of 1%, where the production, coke rate and coal rate at 1–5% are calculated based on the above balance calculations. The temperature profiles at different oxygen enrichment ratios are shown in
Figure 4. The carbon solution loss ratio is also calculated after simulation, as shown in
Figure 5.
It can be seen from
Figure 4 that the temperature increases in the lower zone of the blast furnace with the increase of oxygen enrichment ratio while decreases a little in the upper zone of the blast furnace. At 5% oxygen enrichment ratio, the facet average temperature at 4 m height (the average temperature of the horizontal plane at 4 m height) increases by 85 °C from the base model. This indicates that the cohesive zone narrows with the increase of oxygen enrichment ratio.
It can be seen from
Figure 5 that the carbon solution loss ratio decreases gradually as the oxygen enrichment ratio increases. For each 1% increase of the oxygen enrichment ratio, the carbon solution loss ratio decreases by about 0.47%. The reason may be as follows. Firstly, productivity increases while the coke feed rate is kept constant after the oxygen enrichment, which reduces the proportion of coke in the solid. This results in less contact between the gas and the coke. Secondly, the increase of coal injected after the oxygen enrichment leads to an increase of CO content in the lower part of the blast furnace, which limits the carbon solution loss reaction. Thirdly, the burden descending velocity increases after the oxygen enrichment, which causes the residence time of burden to decrease. This makes the carbon loss solution less sufficient.
The carbon consumption decreases and blast furnace productivity increases with the increase of oxygen enrichment. Therefore a higher oxygen enrichment ratio is better for preserving carbon saving and increasing production. However, oxygen enrichment has a great impact on the temperature distribution of the blast furnace, and especially increases the theoretical combustion temperature around the raceway. In the present study, when the oxygen enrichment rate increases by 5%, the theoretical combustion temperature increases by 200 °C, which is still within the normal range of the blast furnace of Bayi Steel. The gas temperature in the top decreases by 44 °C, but is still higher than the 150 °C, which is acceptable for normal production. The actual average oxygen enrichment rate in Bayi Steel is about 3%, so it can be increased to 5% based on the above analysis.
3.3. Coke Oven Gas Injection
In order to decrease the CO
2 emissions of the blast furnace, coke oven gas was mixed with hot blast and injected from tuyeres.
Table 5 shows the composition of the coke oven gas in Bayi Steel. The total amount of coke oven gas and blast gas was kept constant when injecting the coke oven gas. The proportion of coke oven gas in the gas mixture was from 3% to 15% at a step of 3%.
The CH
4 and O
2 in coke oven gas were converted to CO and H
2 for simplicity. The replacement ratio of coke oven gas to coke was 0.4 kg·Nm
−3. Therefore, for each 3% increase of coke oven gas, the oxygen enrichment rate increased by 0.55%. The production increased by 246 ton HM and the coke ratio decreases by 16kg·ton HM
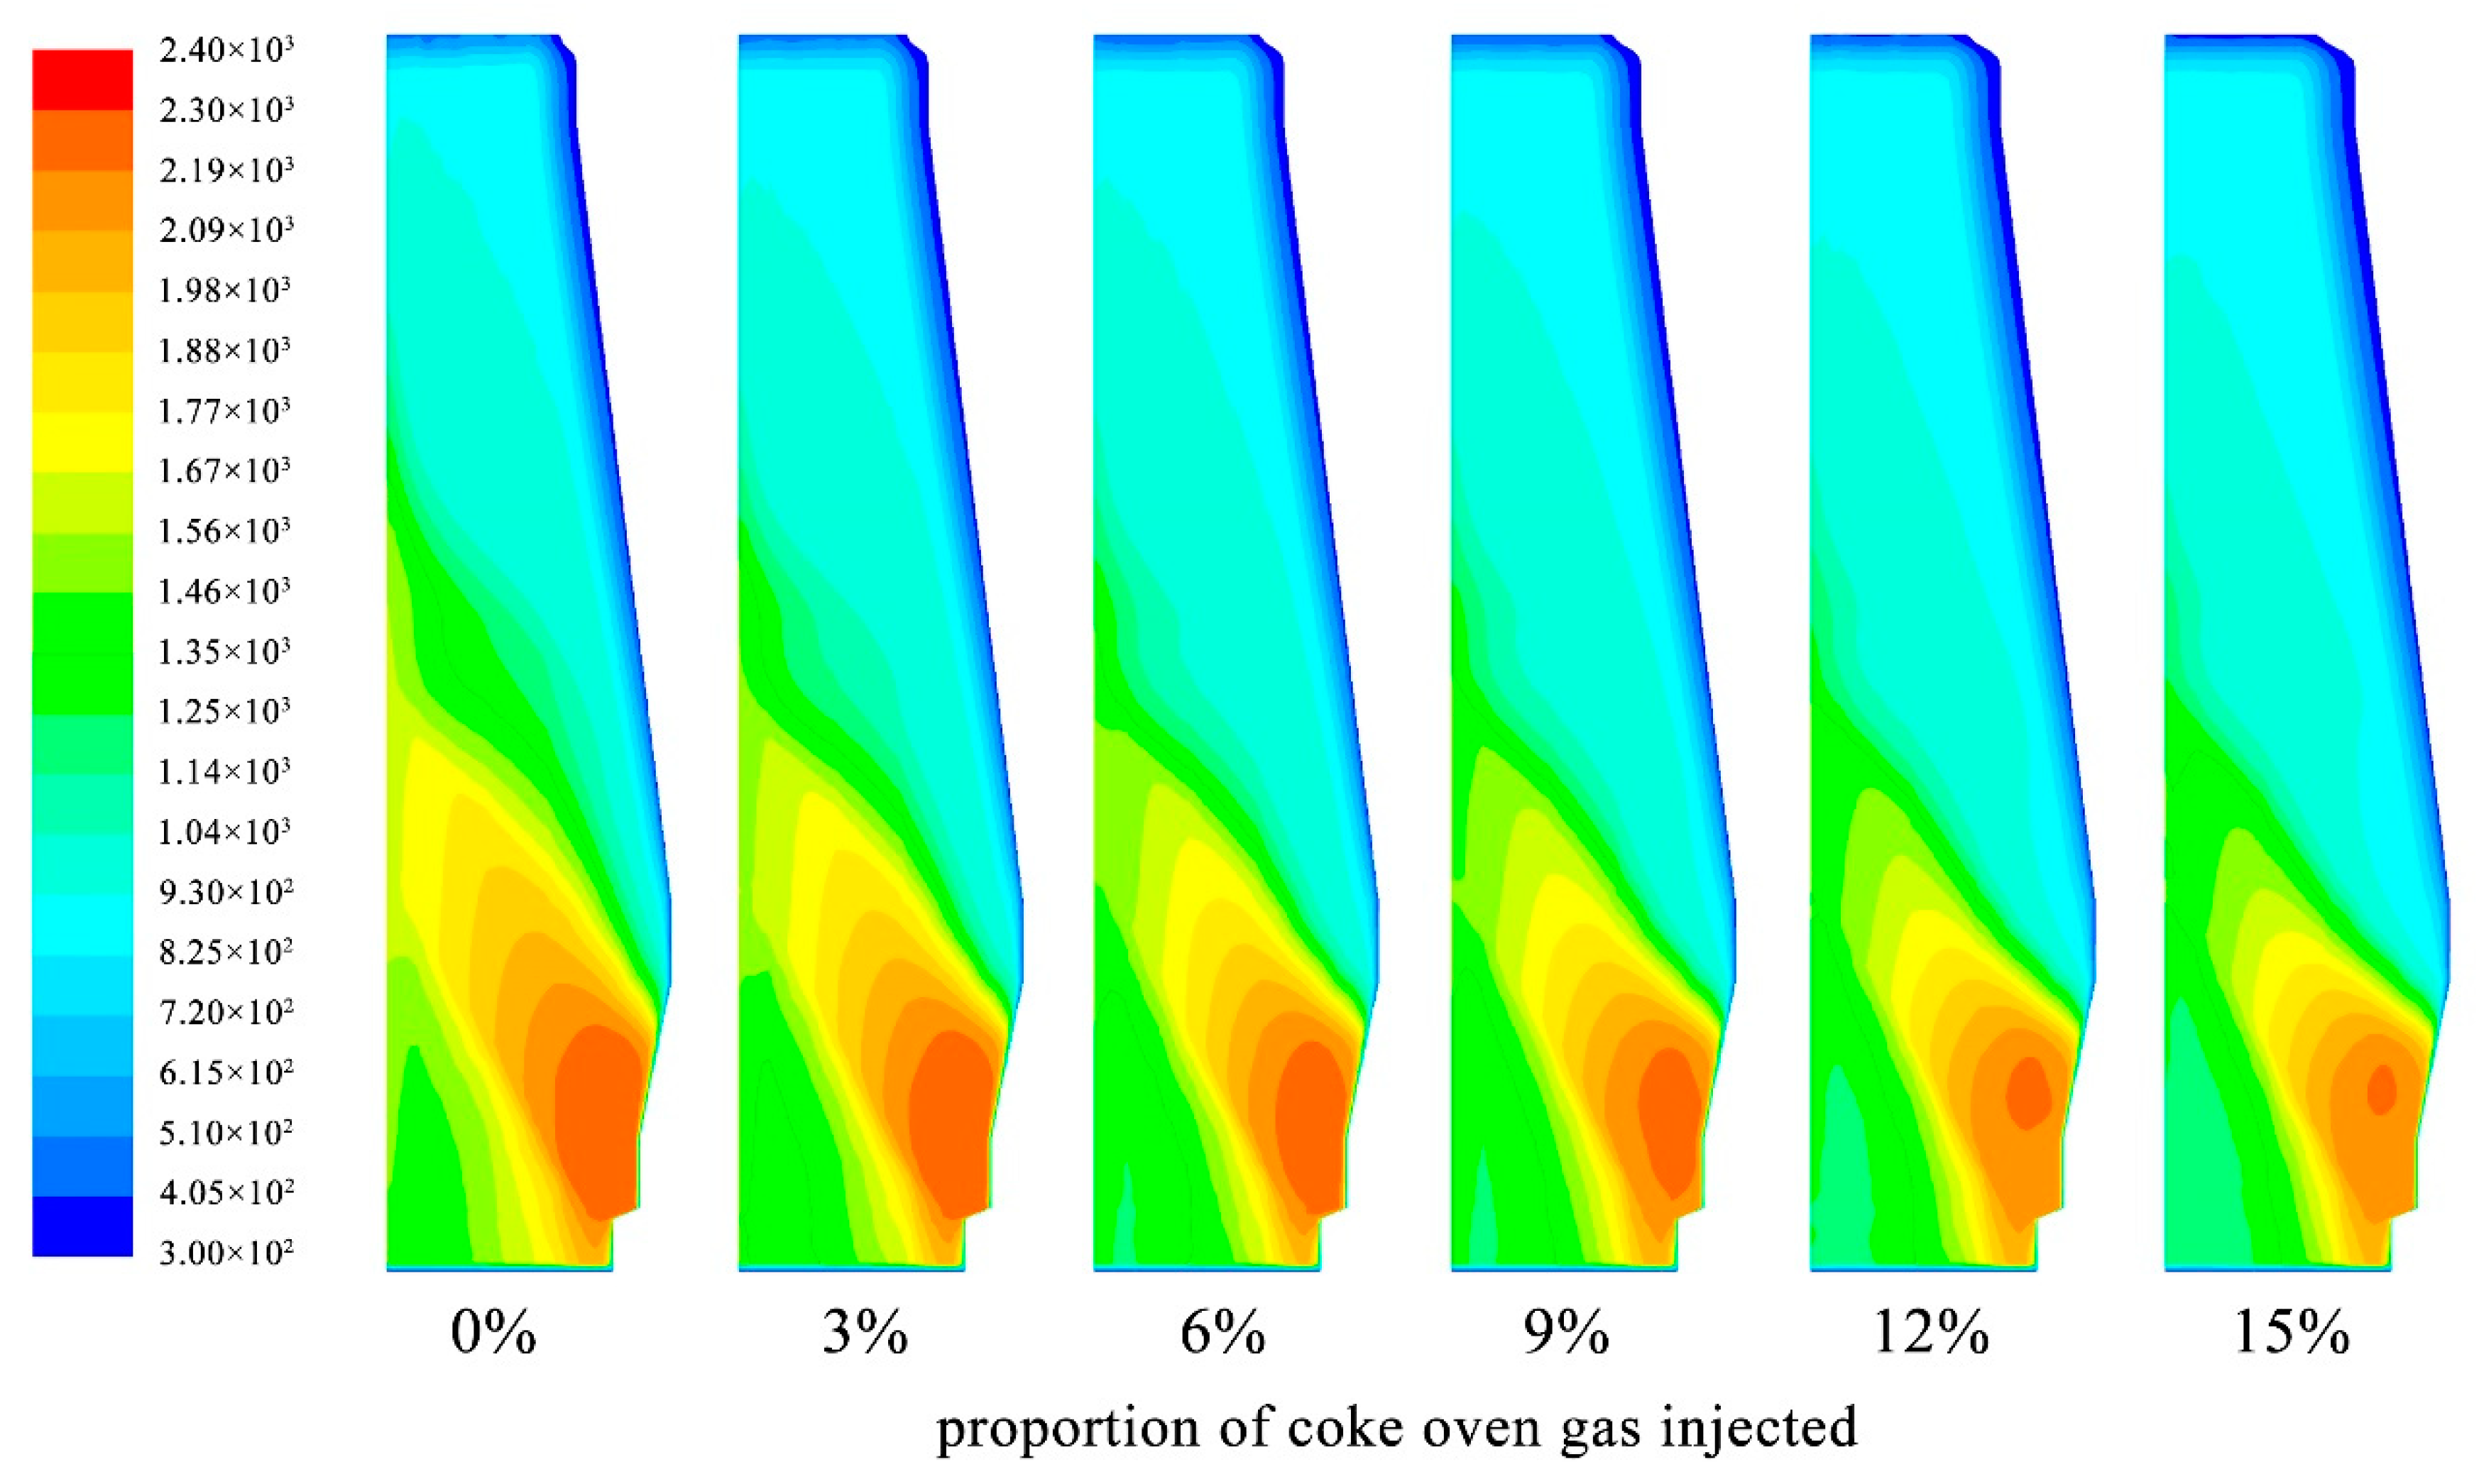
−1. The temperature profiles at different coke oven gas injection ratios are shown in
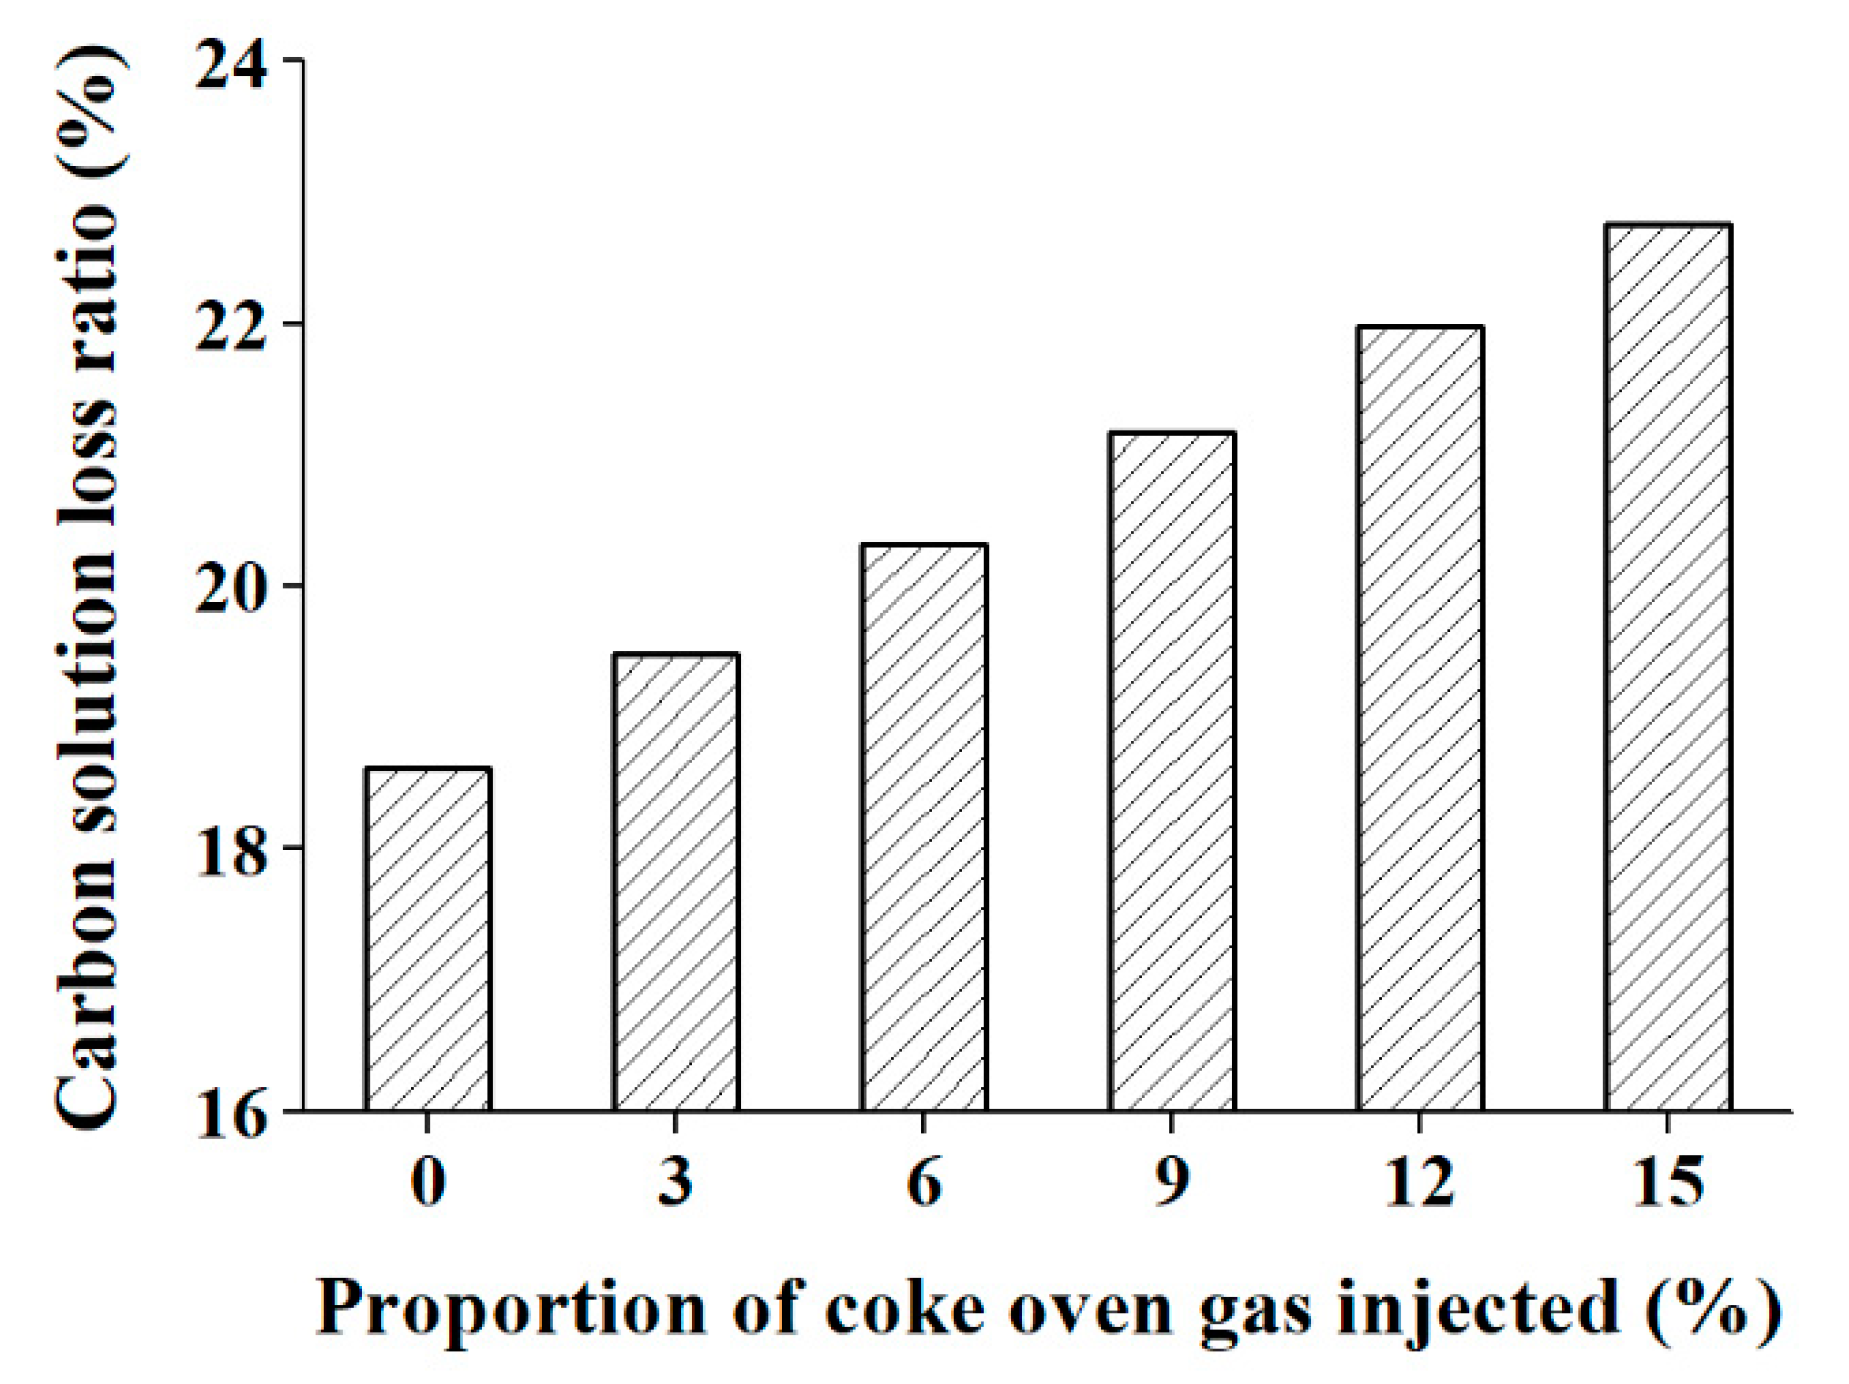
Figure 6. The carbon solution loss ratio under different coke oven gas injection ratios was also calculated after simulation, as shown in
Figure 7.
It can be seen from
Figure 6 that the temperature decreases with the increase of the proportion of coke oven gas injected, and the temperature in the middle zone increase relatively more. When the proportion of coke oven gas injected is 15%, the facet average temperature at 14 m height decreases by 210 °C than the base model. This suggests that the cohesive zone widens with the increase of proportion of coke oven gas injected.
It can be seen from
Figure 7 that the carbon solution loss ratio of the coke increases gradually as the coke oven gas injection increases. For each 3% increase in the coke oven gas injection ratio, the carbon solution loss ratio of coke increases by an average of 0.83%. The carbon solution loss ratio of the coke increases by 4.15% when the coke oven gas injection is 15%.
The reason may be that the replacement of hot blast with coke oven gas leads to an increase of H2 in the gas mixture due to the high H2 content of the coke oven gas. This results in a higher H2O content in the blast furnace due to the reduction reaction of the H2 and iron ore. The higher H2O content may be part in a water gas reaction, which increases the reaction of the carbon solution loss. The temperature of the strong reaction between the coke and the H2O is from 800 to 1300 °C. The average H2O content in the gas in the blast furnace increases from 2.45% to 8.67% when the coke oven gas ratio increases from 0% to 15%. Moreover, the high temperature zone shrinks after the injection of the coke oven gas, which leads to the expansion of the zone for the reaction of the carbon solution loss.
Therefore, on the one hand, coke oven gas can reduce the coke rate and CO2 emission of the blast furnace as a hydrogen-rich gas. On the other hand, the injection of coke oven gas causes the temperature in the lower part of the blast furnace to decrease and the carbon solution loss to increase, which impairs the operation of blast furnace. Therefore, coke oven gas should not be injected into the blast furnace in Bayi Steel in its present condition. Coke oven gas should only be injected only if the carbon solution loss is low enough, and it should be done a higher gas temperature and with better coke quality of a high M40 and a high CSR (coke strength after reaction).
3.4. Steel Scrap Charging
Since the steel market has been strong in China recently, steel scraps are charged so as to increase production. The metallic iron (MFe) of steel scrap is 52.29% and the FeO is 9.07%. The steel scrap is added when the total amount of iron-bearing materials is kept constant. The proportion of steel scrap is from 0% to 10% at a step of 2%, as shown in
Table 6, where the absolute amount is also illustrated. For each 2% increase of steel scrap, the oxygen enrichment ratio increases 0.06%, the coke rate decreases 4 kg·ton HM
−1, and production increases 70 ton HM while the coal rate and the amount of hot blast remain unchanged. The temperature profiles at different proportions of steel scrap added are shown in
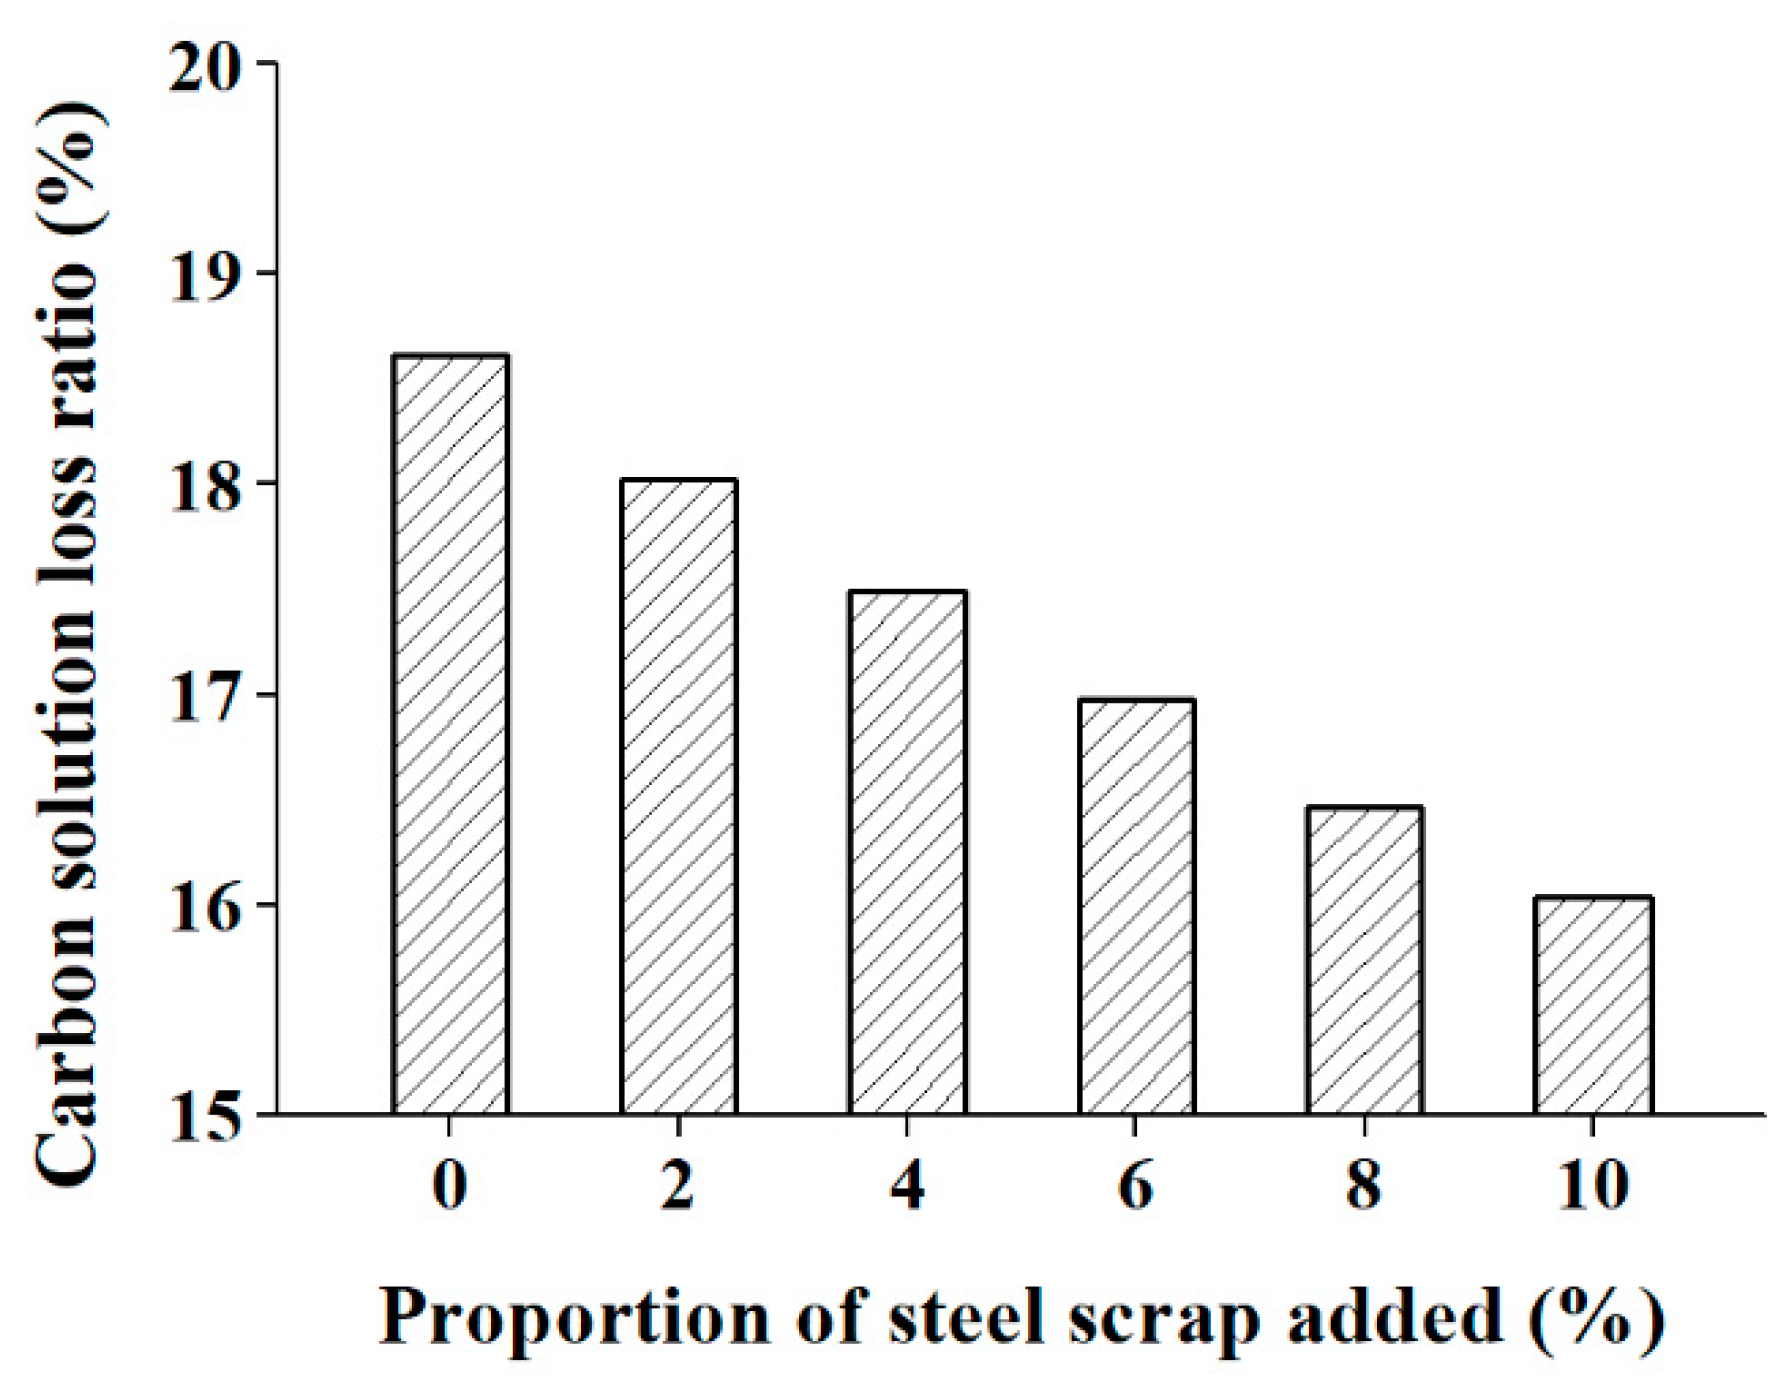
Figure 8. The carbon solution loss ratio is calculated after simulation, as shown in
Figure 9.
It can be seen from
Figure 8 that the temperature increases a little in the lower zone of the blast furnace with the increase of the proportion of steel scrap added, but the degree is very small. When the proportion of steel scrap added is 10%, the facet average temperature at 4 m height increases by 22 °C than the base model. Hardly any difference of temperature in the upper zone of the blast furnace can be found. This indicates that the cohesive zone only narrows a little with the increase of the proportion of steel scrap added.
The carbon solution loss ratio decreases gradually as the proportion of steel scraps added increases; when 10% steel scrap is added, it decreases by 2.6%. The reason may be that the amount of iron ore that needs to be reduced decreases when steel scraps are added in the top of blast furnace since steel scrap provides iron content that does not need reduction. However, this leads the utilization ratio of the gas to decrease. The ratio decreases by 1.32% when the proportion of steel scraps increases to 10%. As a result, the CO content in the gas increases while the CO2 content decreases. This also leads to a decrease of the carbon solution loss ratio.
It should be noticed that the addition of steel scrap reduces the gas utilization ratio, and also the temperature in the upper part of the blast furnace. But the reduction in the gas utilization ratio and the temperature of the upper part of the blast furnace is small and within acceptable limits. Therefore, the addition of steel scrap is beneficial for the operation of blast furnace in the aspect of carbon solution loss. Steel scrap can be added to the blast furnace in appropriate amounts.
4. Conclusions
A three dimensional model was established to analyze the carbon solution loss of coke based on the practical operational parameters of blast furnace B in Bayi Steel. The model was then used to investigate the effects of the oxygen enrichment ratio, the injection of coke oven gas, and the addition of steel scraps on the carbon solution loss ratio of the coke. The conclusions are as follows.
(1) The carbon solution loss ratio of the blast furnace studied is 18.61% when the coke reaches 1300 °C.
(2) The carbon solution loss ratio decreases with the increase of the oxygen enrichment ratio or when a certain proportion of steel scraps is added, while it increases with an increase in the amount of coke oven gas injected.
(3) The oxygen enrichment ratio and the proportion of steel scraps added can be increased to 5% and 10%, respectively in order to reduce the carbon solution loss without affecting the operation of the blast furnace.
(4) The injection of coke oven gas is not recommended given the current condition of blast furnace B of Bayi Steel.

 ,
, 


