Article

Applying a Watershed and Reservoir Model in an Off-Site Reservoir to Establish an Effective Watershed Management Plan

1
Department of Natural Resources, Chinese Culture University, Taipei 11114, Taiwan
2
Department of Civil Engineering, National Taipei University of Technology, Taipei 10608, Taiwan
*
Author to whom correspondence should be addressed.
Processes 2019, 7(8), 484; https://doi.org/10.3390/pr7080484
Submission received: 20 June 2019 / Revised: 18 July 2019 / Accepted: 19 July 2019 / Published: 1 August 2019
(This article belongs to the Special Issue Water Quality Modelling)

Abstract

:
Off-site reservoirs use water from other watersheds to supplement their water quantity. Water quality is usually better in off-site reservoirs than in onsite reservoirs, because in comparison to onsite reservoirs, watershed areas are smaller and fewer pollutants are collected; moreover, cleaner water is introduced. However, in Taiwan, the water quality of some off-site reservoirs can gradually worsen, and this factor needs to be addressed. In this study, the Liyutan reservoir in central Taiwan was used as an example to demonstrate the process of evaluating pollution in an off-site reservoir. Pollution loads from point sources (PSs) and nonpoint sources (NPSs) were carefully estimated. Domestic sewage and tourist wastewater were considered the major PS loads in this study. The NPS load evaluation was dependent on the results of a verified watershed model, the stormwater management model (SWMM). The observed data in 2015 and 2016 and supplementary total phosphorous (TP) samplings in upstream rivers in 2018 were used to validate the model results. Model calibration and verification were implemented during dry weather and wet weather to ensure the accuracy of the PS and NPS simulations. The results of this study showed that the average total phosphorous (TP) load generated from within the watershed was 9013 kg/y, and that the TP load from outside the watershed was 4545 kg/y. The percentages of TP loads from NPSs and PSs in the watershed were 83% and 17%, respectively. Finally, we used a verified Vollenweider model to convert the TP loads to the TP concentration in the reservoir. The pollution reduction measures and the associated predicted water quality values were assessed using the verified models.

1. Introduction

An integrated watershed management plan is essential to maintaining reservoir water quality. In Taiwan, almost 40% of the drinking water is from reservoirs. In addition to improving water treatment methods, improving the health of watersheds in order to provide a high quality of source water has received significant attention; therefore, a watershed conservation policy is needed. Although the process of constructing a watershed management plan has been developed [1,2,3], the various properties of each watershed make each one unique, and the details of each plan are different. For example, the processes of investigating pollution sources and methods to assess water quality are diverse.
Water pollution is conventionally divided into point source (PS) pollution and nonpoint source (NPS) pollution. PS pollution has a fixed emissions outlet and a relatively stable quantity, and therefore PS pollution is generally captured and controlled. However, NPS pollution is a diffuse source with no fixed outlet. NPS is usually driven by rainfall or snowmelt, and the accumulated pollutants on land surfaces are then flushed and carried out. The diffuse and random properties of NPS pollution make it difficult to evaluate and control [4]. Therefore, in addition to onsite investigations, water quality models are helpful for identifying the complexities of NPS pollution in a watershed. An effective water pollution control policy relies heavily on the quantitative analysis of water quality models [5].
This study aims to develop an off-site reservoir watershed management plan. Off-site reservoirs are not located on a streambed; rather, they are supplied by pipelines from other adjacent streams. Therefore, the water quality of off-site reservoirs is influenced, not only by their surrounding watershed, but also by introduced waters. Off-site reservoirs are usually regarded as high-quality reservoirs because large amounts of clean water are introduced from upstream watersheds, diluting the original water. Without a complete understanding of the contributions of pollution from within and outside a watershed, it is difficult to establish an effective pollution control strategy. A comprehensive investigation of PS and NPS pollution should be conducted. In particular, water quality models are necessary to determine the influences of NPS pollution and introduced water. In such cases, a watershed model and a reservoir model are required. We chose a stormwater management model (SWMM) as the watershed model; the version is SWMM 5.1. The SWMM is able to assess runoff, and several studies have used this model for watershed runoff quantity and quality simulations. For example, Temprano et al. [6] applied SWMM to a mixed land use watershed in Spain, Modugno et al. [7] used SWMM for urban areas in southern Italy, Pretorius et al. [8] applied SWMM to an undeveloped watershed in the US, Moynihan and Vasconcelos [9] also applied SWMM to a nonurban watershed in the lower coastal plains of the US, and Talbot et al. [10] used SWMM to optimize a management plan for an agricultural land-based watershed in Ontario, Canada. In Taiwan, the SWMM has been used as a reservoir management plan tool [11,12]. Because the Liyutan reservoir is limited by phosphorous, the total phosphorous (TP) concentration is considered a management target. A mass balance-based model, the Vollenweider model [13,14], was used to simulate the TP concentration changes in the Liyutan reservoir. With a verification process, this simplified model is capable of addressing the TP loads from watersheds and the associated TP concentration in reservoirs.
The performance of the water quality of the Liyutan reservoir implies that the pollution loads are increasing. The objective of this study is to understand the pollution sources and their impacts on the Liyutan reservoir and to provide feasible control measures to improve its water quality. To present the whole picture, the integrated watershed model and reservoir model are required. The TP loads, including those within the watershed and outside the watershed, were added to a reservoir model to convert TP loads into the TP concentration. With the integrated models, scenarios of control measures for water quality improvement can be assessed. This is beneficial for policy makers in order to determine efficient measures. This study presents the integration of the watershed and reservoir models and onsite sampling efforts, which can be applied in other reservoirs.

2. Materials and Methods
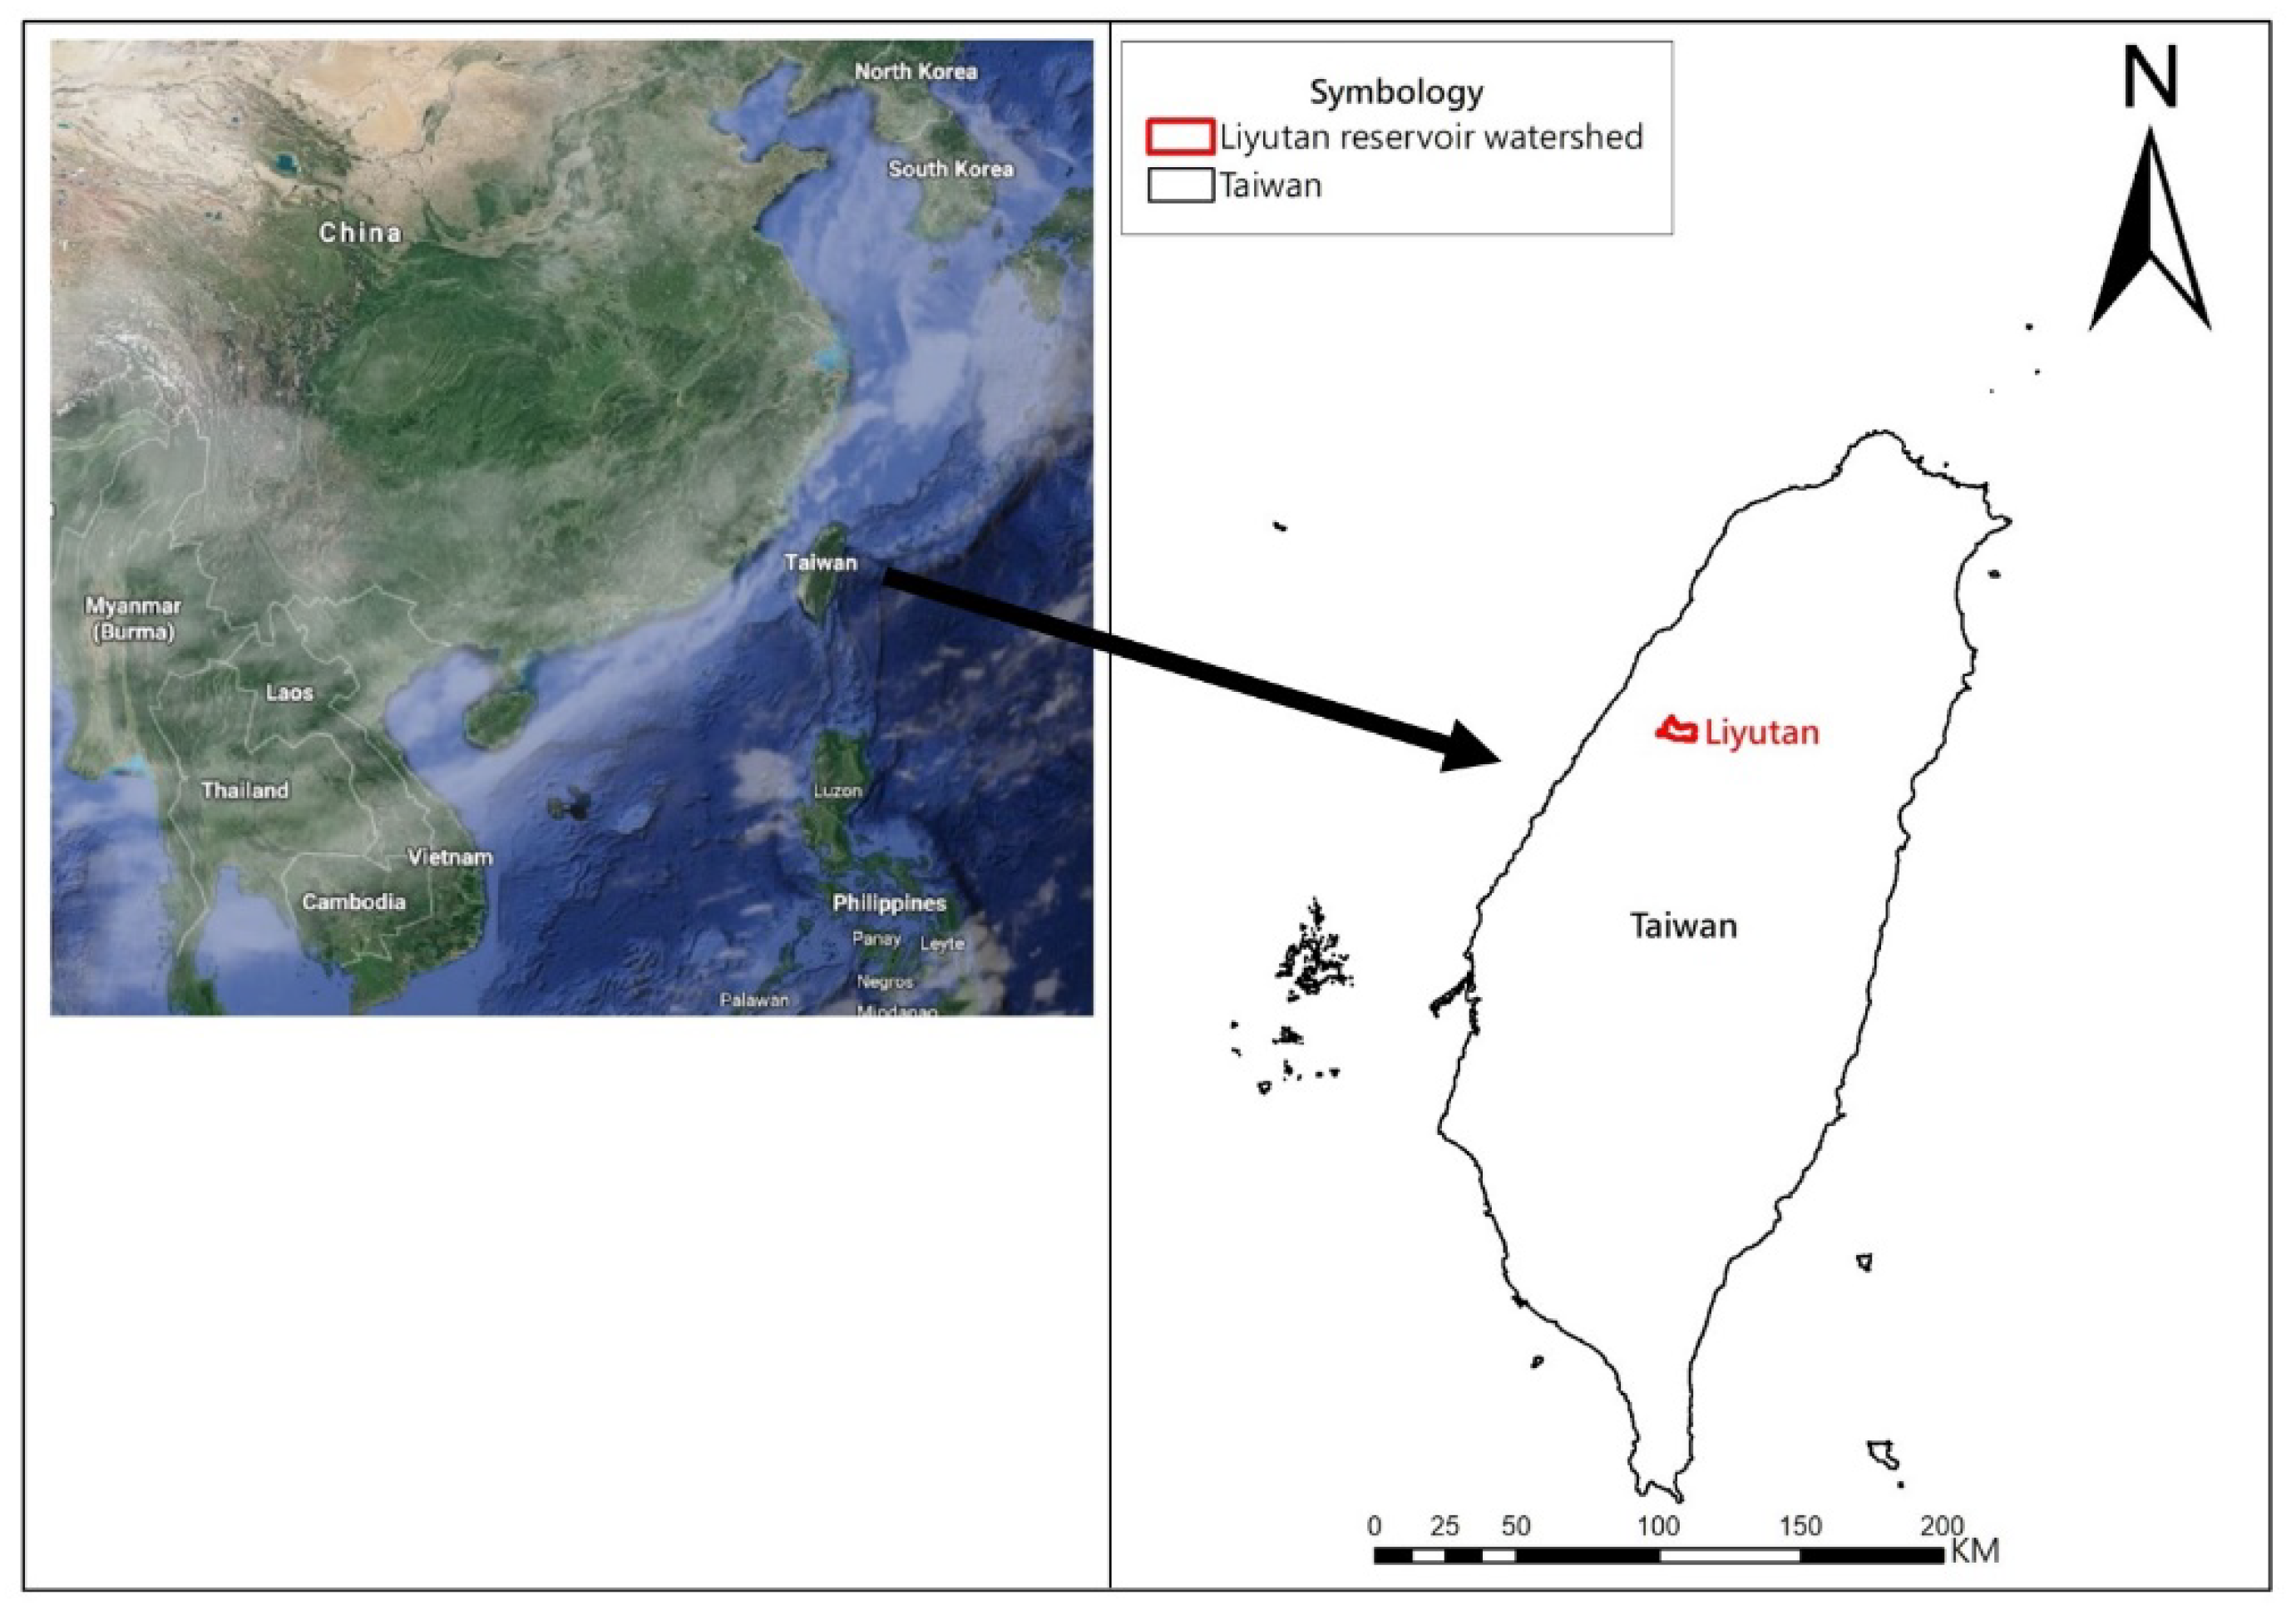
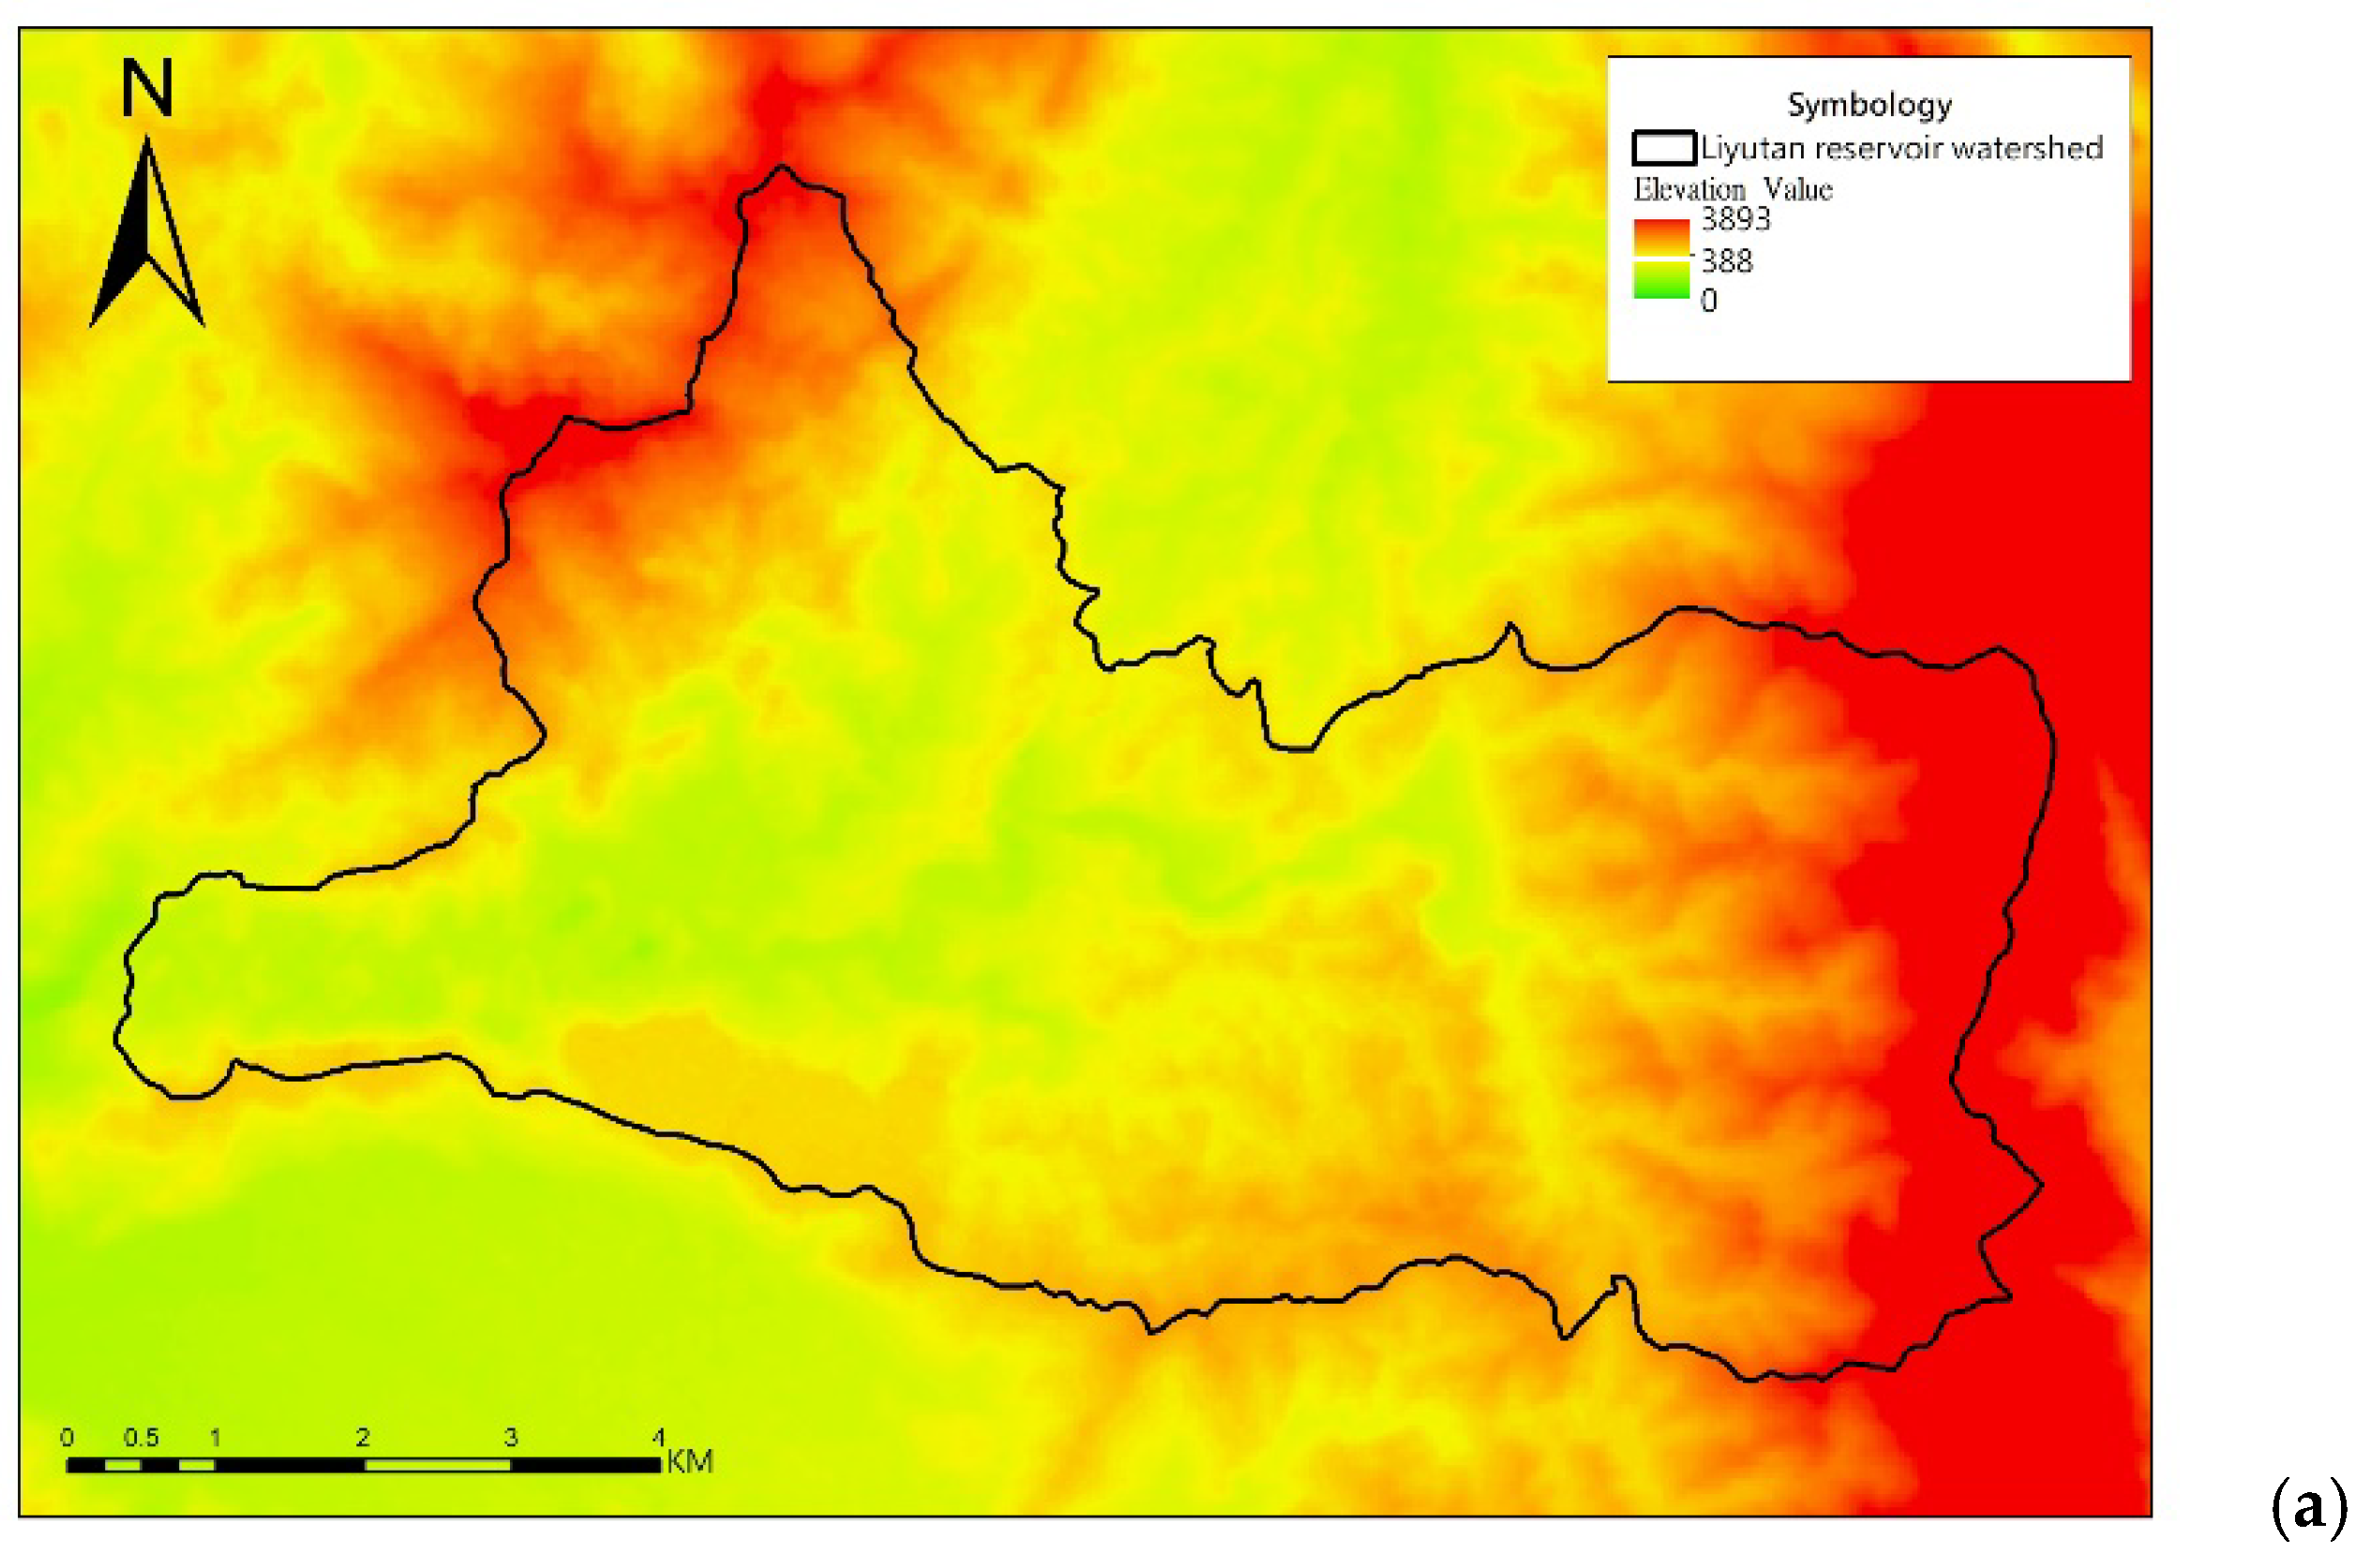
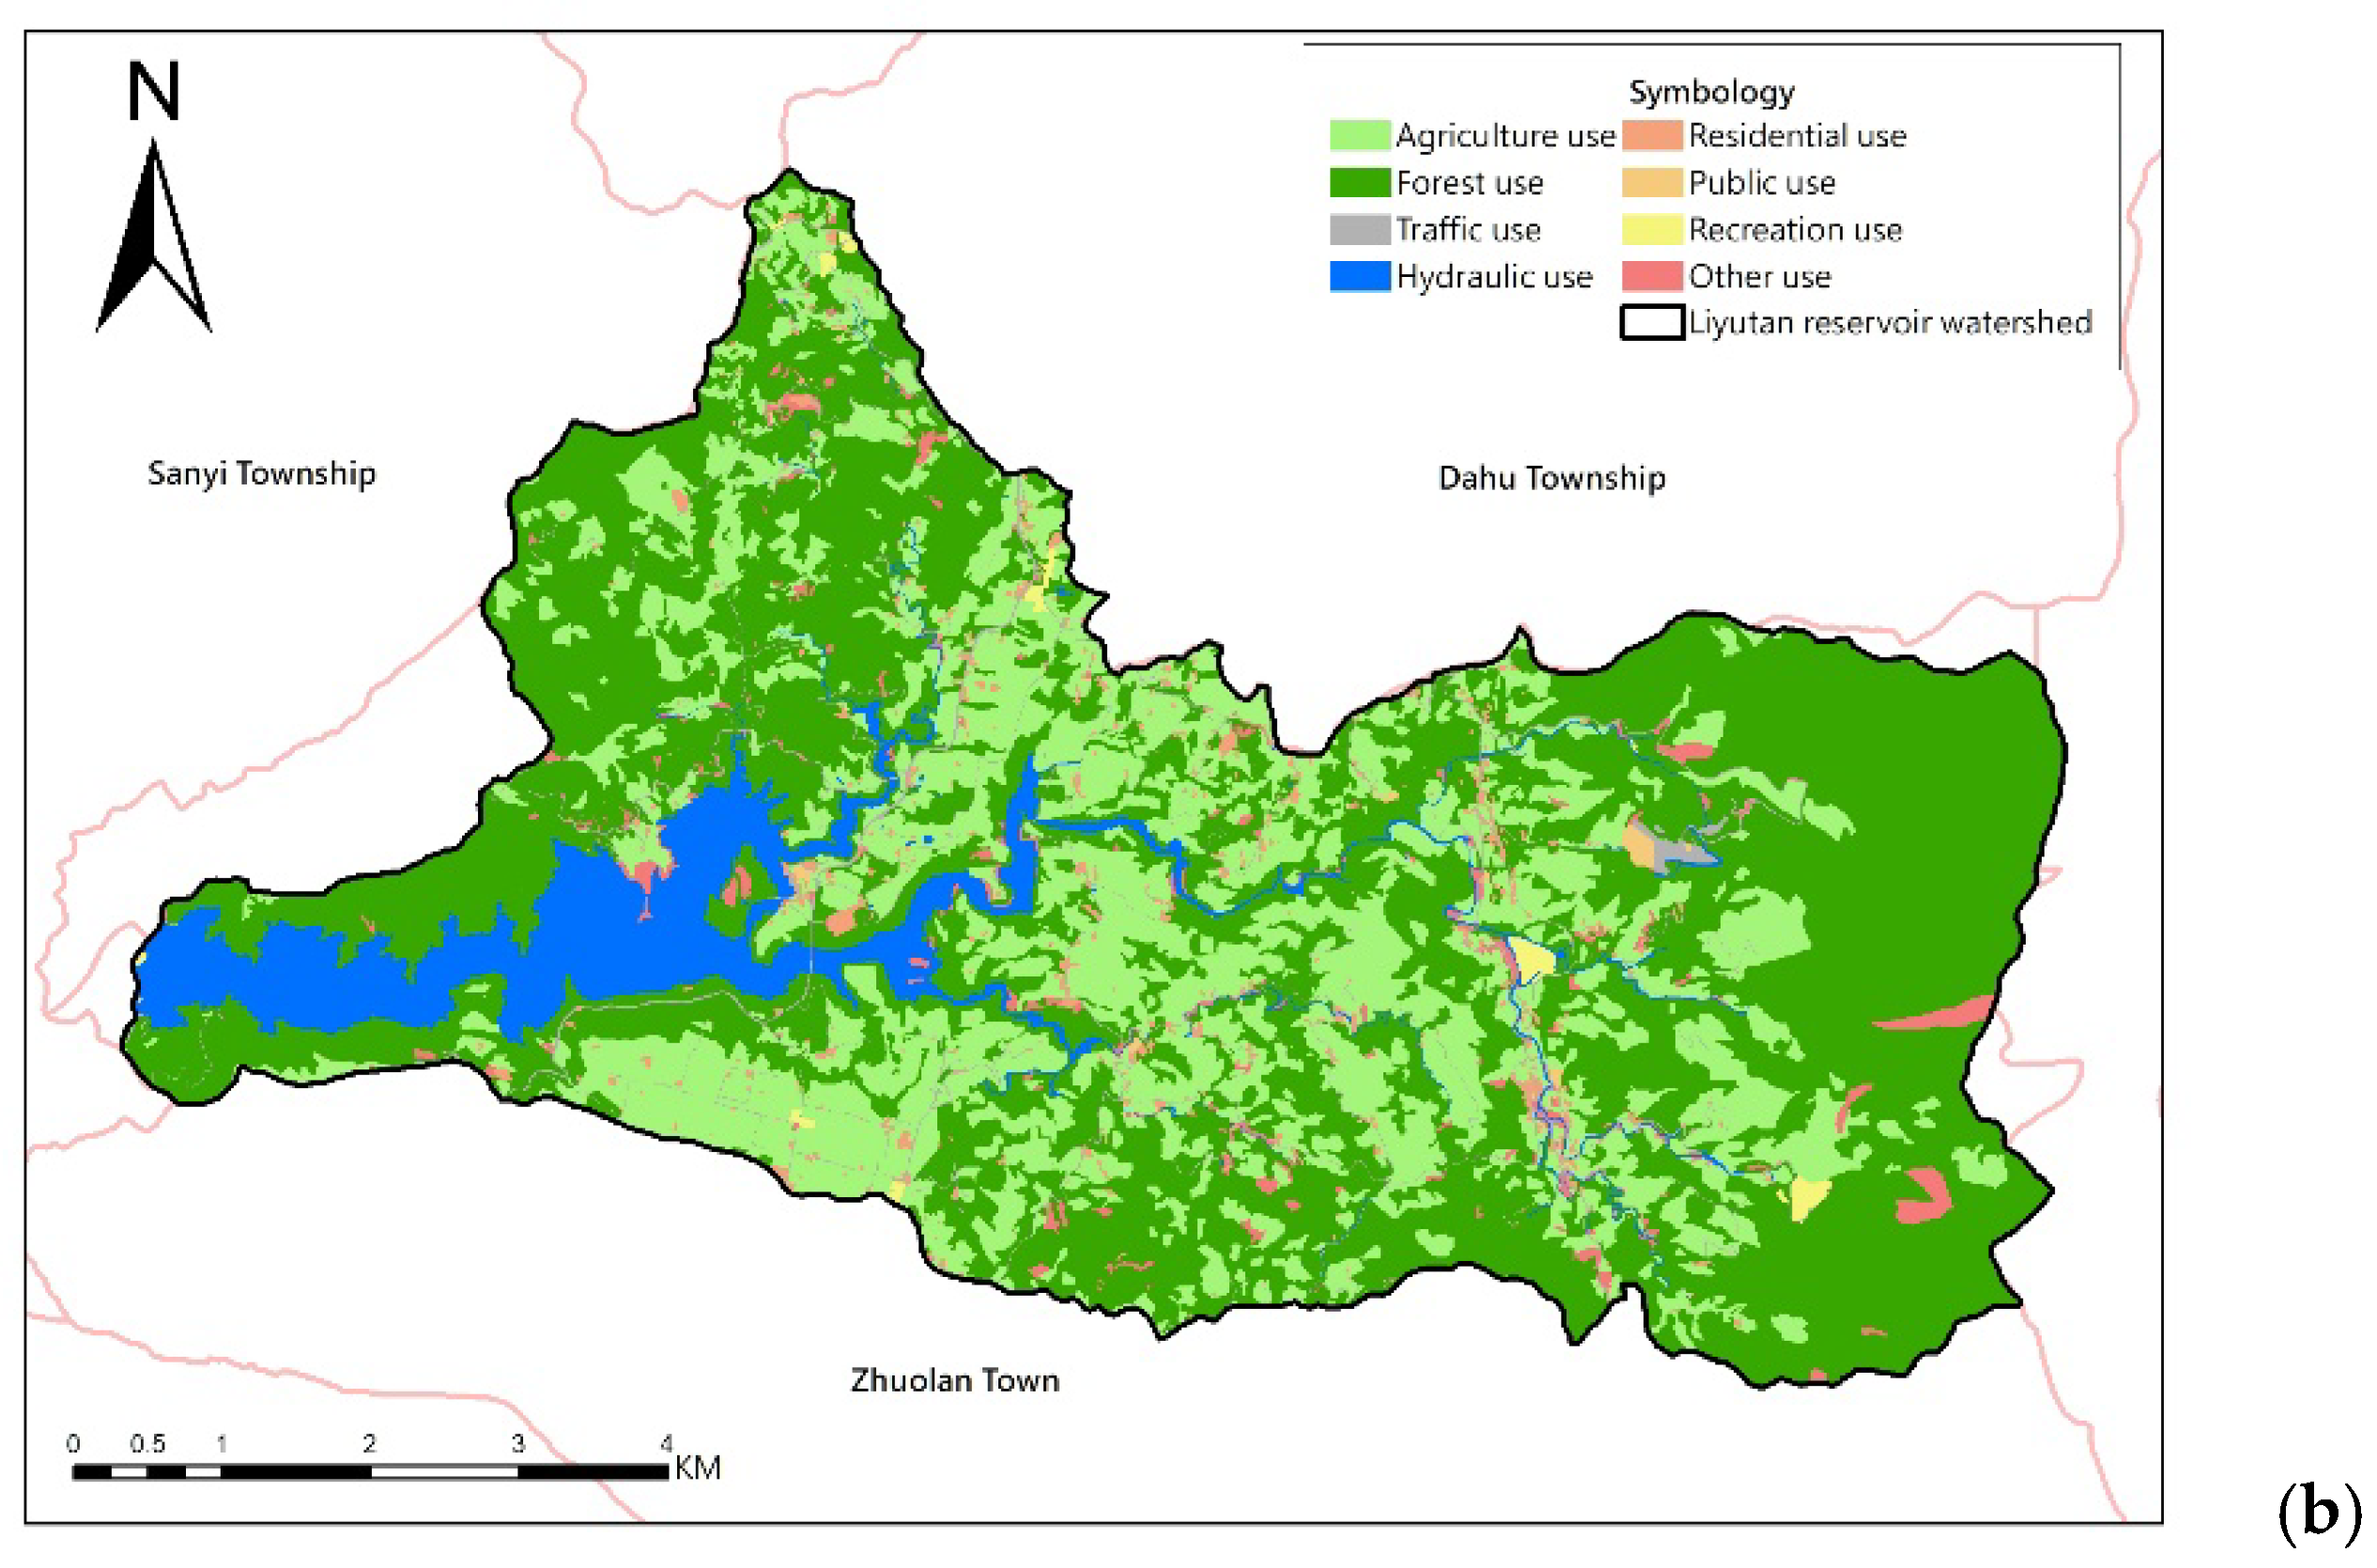
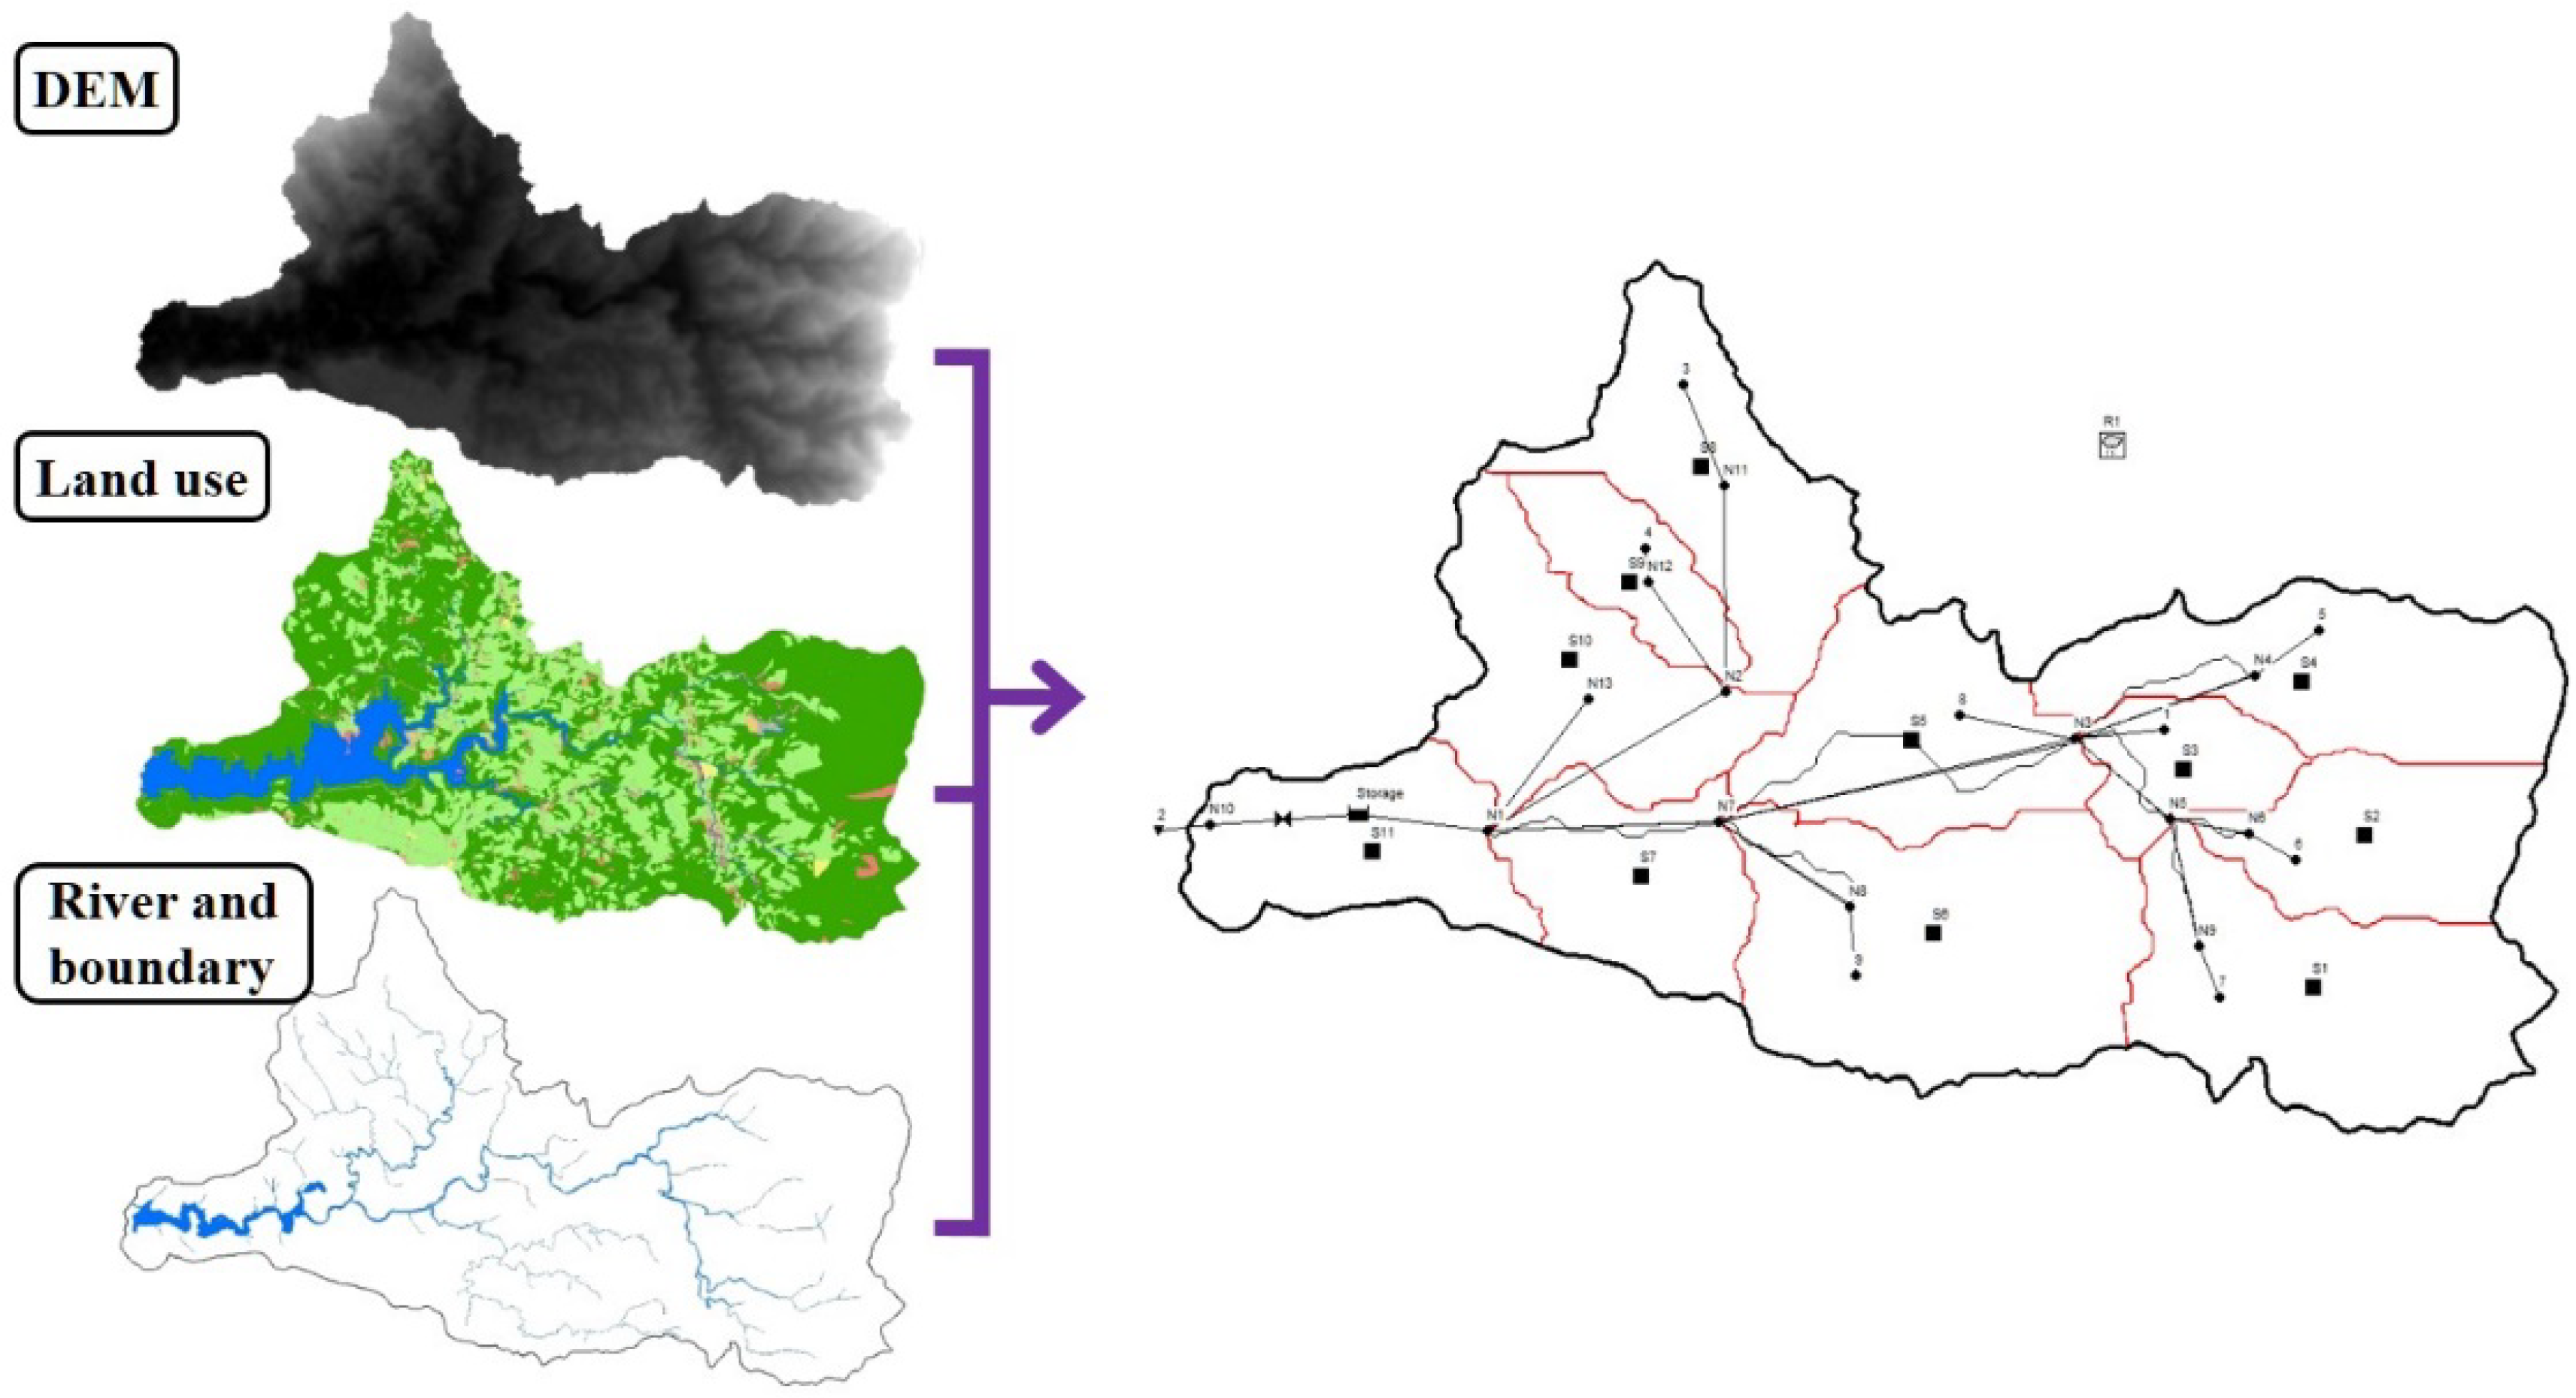
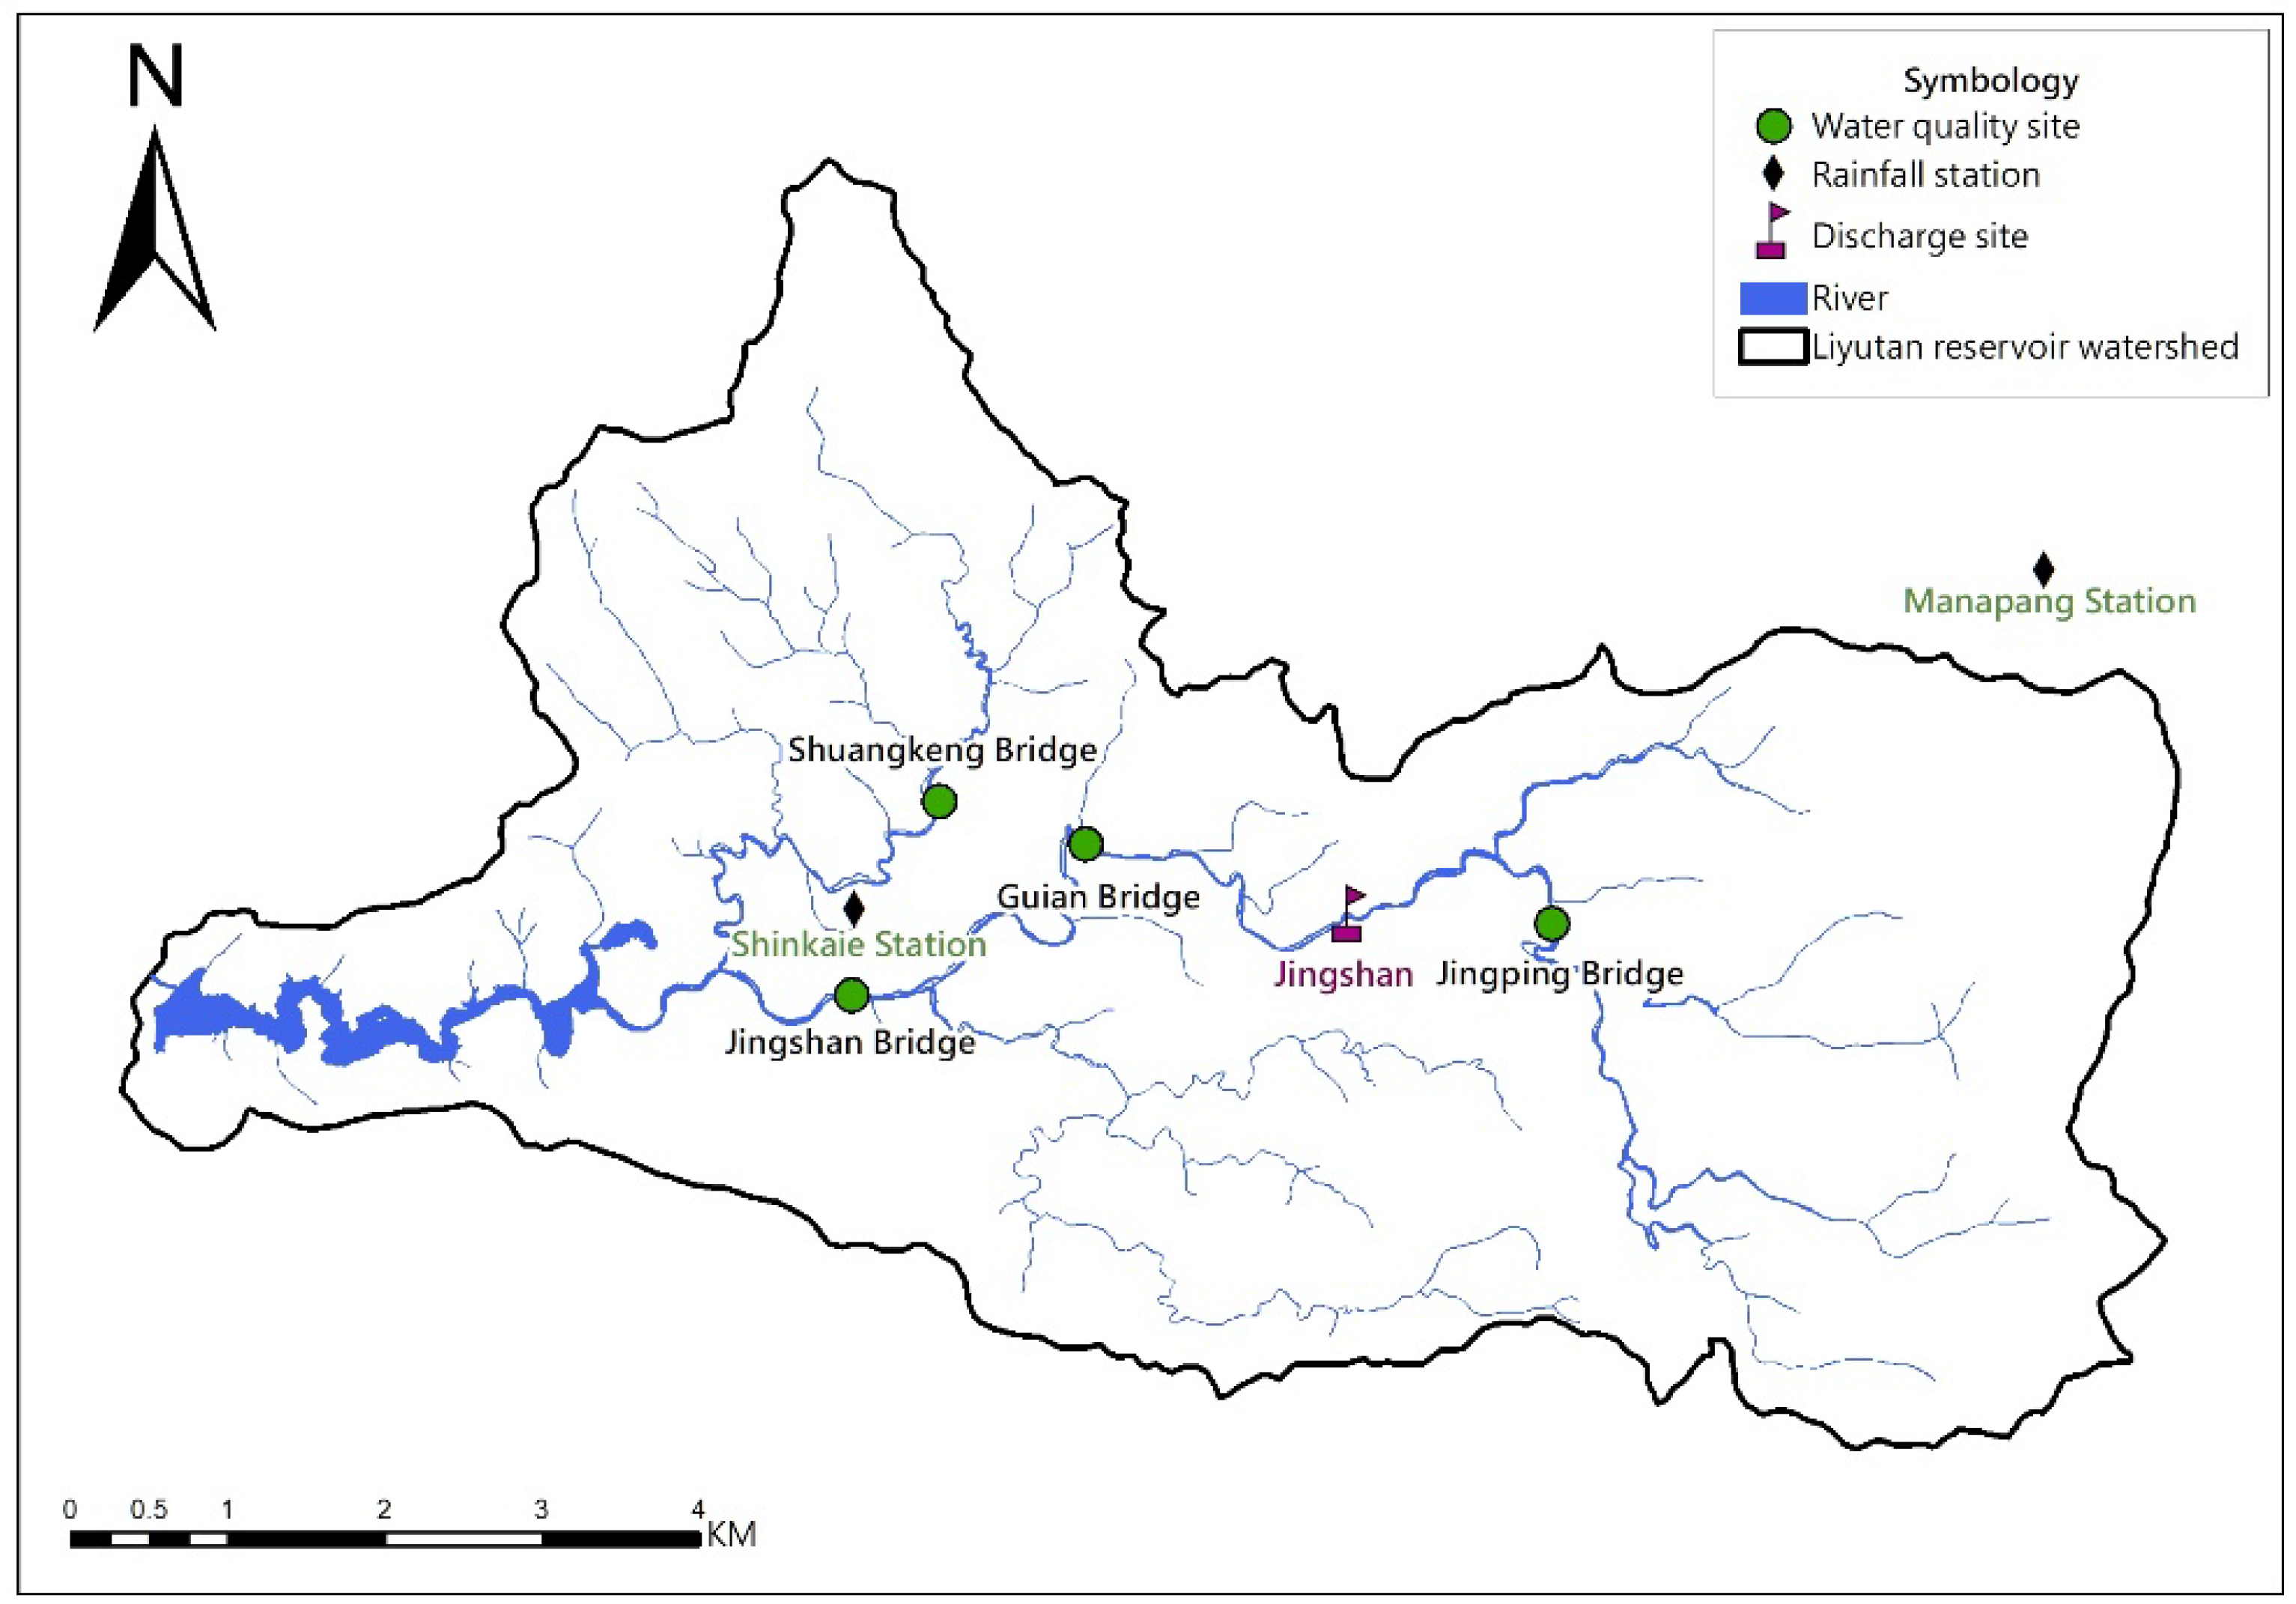
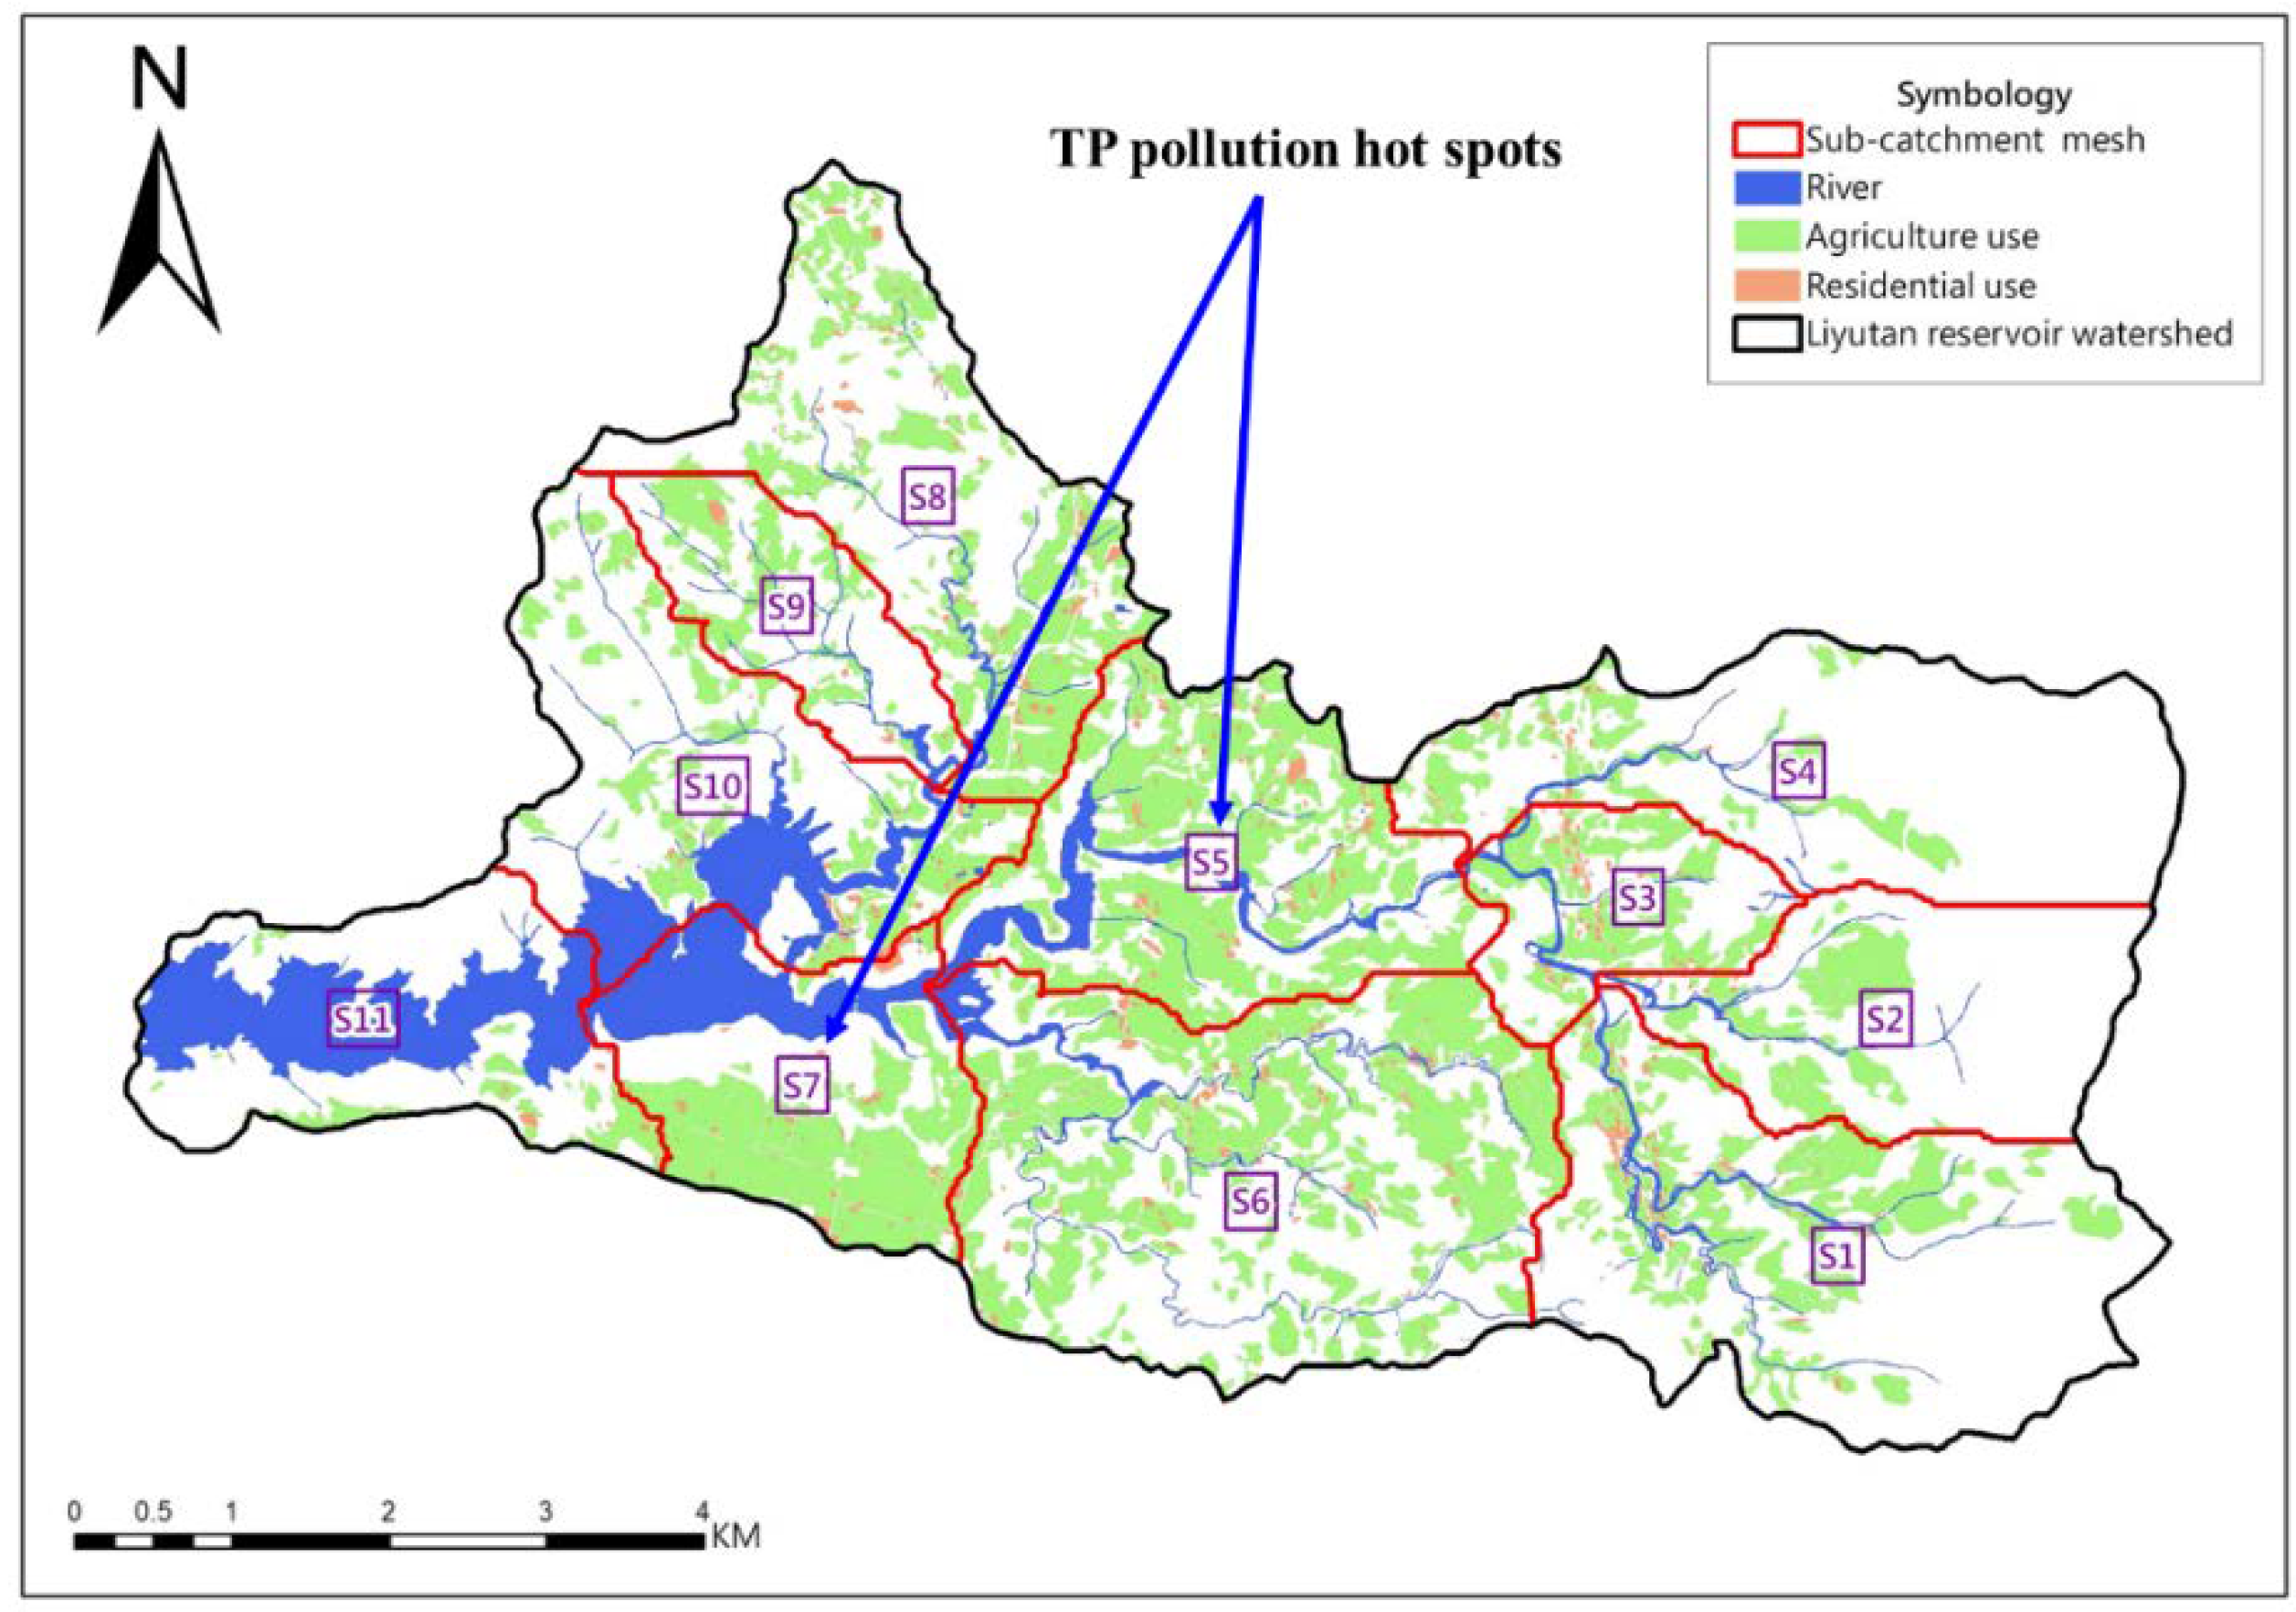
2.1. Study Area

The Liyutan reservoir is the largest off-site reservoir in Taiwan. Figure 1 shows the location of Taiwan and the case area. However, the Liyutan reservoir is not a typical off-site reservoir because its watershed is large, at 53.45 km2. Originally, this reservoir was designed to provide irrigation water for cropping lands in central Taiwan and some water for public use. With population growth and public water demand, the government decided to expand the water supply capacity of this reservoir and built a delivery pipe to introduce water from other upstream basins into the reservoir. In addition, a hydroelectric power plant was built to use the potential energy of the introduced waters. Therefore, the Liyutan reservoir is considered a half off-site reservoir. The inflow introduced from outside the watershed is approximately 80%, and the other 20% of the flow is collected from within the watershed. Even if the reservoir water quality seems good, the water quality of the inflow gradually deteriorates. In particular, the TP concentrations on rainy days are large and beyond the water quality standard. In addition, the Carlson index, which is used to indicate the trophic level of reservoirs, shows that the Liyutan reservoir tends toward eutrophication. Based on monitoring data, the introduced flow has a good and stable quality; therefore, the threats to reservoir water quality are improperly treated wastewater and polluted runoff from within the watershed area. The discharge introduced from outside the watershed is regarded as a background input and is not considered a water quality improvement strategy.
In the Liyutan reservoir watershed, the PSs are domestic wastewater and tourist wastewater. A total of 5,253 people lived in this area in 2018. There is no domestic wastewater treatment plant, and domestic wastewater is treated by a septic tank at each house. Due to the beautiful scenery around the reservoir, the number of tourists visiting the area has increased, with 363,056 tourists in 2018. With regard to the NPSs, the land uses of the watershed are forest at 56.5%, agricultural land at 29.7%, constructed land (including roads) at 12.0%, and other lands at 1.8%. Almost one-third of the lands are cropping lands, meaning that the potential NPS pollution might be significant. Fruit farms, especially strawberry farms, are the primary crop grown in this area. A topographic map and the land uses of the watershed are depicted in Figure 2.

2.2. Water Quality Models

In this study, a watershed model, SWMM, and a mass-balance model of reservoir TP, the Vollenweider model, were combined. The SWMM was developed by the US Environmental Protection Agency (USEPA) and can be freely downloaded. Various geographic data are required to construct a SWMM, such as a digital elevation model (DEM), water boundary, and land use (Figure 2). The details of the SWMM can be found in the manual [15] and are not explained in this study. The major reason for choosing this model is that the SWMM is widely used in Taiwanese reservoirs, such as the Feitsui reservoir [11,16], Shiman reservoir [12], and Mingde reservoir [17]. Although the SWMM was originally developed for urban drainage system design, its applications were expanded through several revisions and were approved as a watershed model to assess NPS pollution. A total of 11 subwatersheds were delineated according to their geographic properties (Figure 3). The characteristics of the subwatersheds used in this SWMM are summarized in Table 1.
The watershed model is essentially a rainfall-runoff model and produces runoff trends. In addition to a watershed model, a reservoir water model is needed to link pollution loads and water quality performance in the receiving reservoir. The reservoir water quality model used in this study is the Vollenweider model, which has been widely used to assess phosphorous (P) concentrations in lakes and reservoirs. The Vollenweider model is a one-dimensional, mass-balance model that assumes that the change in the P concentration over time is equal to the input P concentration minus the output P concentration and the amount of P lost inside the waterbody. The Vollenweider equation is as follows:
∆PV/∆t = M − (P × Q) − (PV × σ)
where PV = total mass of P in the reservoir (g); P = P concentration (g/m3); V = reservoir water volume (m3); t = time; M = annual mass of P input (g/year); Q = annual volume of water outflow (m3/year); σ = settling coefficient (year−1).
In the above equation, the settling coefficient σ is usually substituted by the proportion of P lost to sediment (Rp) and R_p = v/(v + q_s), where v is the settling velocity (m/year) and qs is the areal hydraulic load (m/year). The qs is calculated from the total flow (m3/year) divided by the surface area of the reservoir (m2). When the Vollenweider equation is considered at a steady state and σ is replaced by Rp, Equation (1) is transformed into Equation (2).
P = (M(1 − Rp))/Q
The P concentration is calculated based on the input P loads (M), outflow discharge (Q), and lost proportion (Rp). The M is the sum of PS and NPS loads. Inflow and outflow data and water surface area were provided from official data. Therefore, with a fixed A in the equation, the only unknown parameter was settling velocity (v), and this parameter was also determined via a model calibration and validation process. We used the actual P value and simulated P value to adjust a suitable v value for the case study.

2.3. Data Sources and Monitoring Plan

The GIS data used to build the water quality model are cited from several public databases in different administrative departments of the Taiwan government. The DEM data are 30 m × 30 m and are from the Center for GIS, RCHSS, Academia Sinica. The land use data are from the National Land Surveying and Mapping Center, Ministry of the Interior, and the water boundary data are from the Water Resources Agency, Ministry of Economic Affairs. The Liyutan reservoir data, such as its inflow and outflow, are from the official report of the administration agency. When calculating the pollution loads, the population and tourist industry data are cited from local government data.
Existing monitoring around the watershed is lacking except for an official flow station owned by the reservoir administration agency. There are water quality data for reservoirs, but no data for inflow streams, so we established 4 water quality sampling sites to determine the inflow stream quality. We needed inflow stream data to compare with the results from the SWMM. The observed water quality in a reservoir cannot be used to verify watershed models because they are different waterbody types. The location of the sampling sites is shown in Figure 4. There is 1 flow station, 4 water quality sampling sites, and 2 rainfall stations. Because NPSs might be a substantial source of potential pollution, the water quality sampling was divided into dry and wet weather. Dry weather means sunny days with no rainfall, and wet weather is rainy days regardless of rainfall type and volume. Water samples in dry weather help to verify the PS load calculation, and water quality from wet weather can represent the NPS influence.

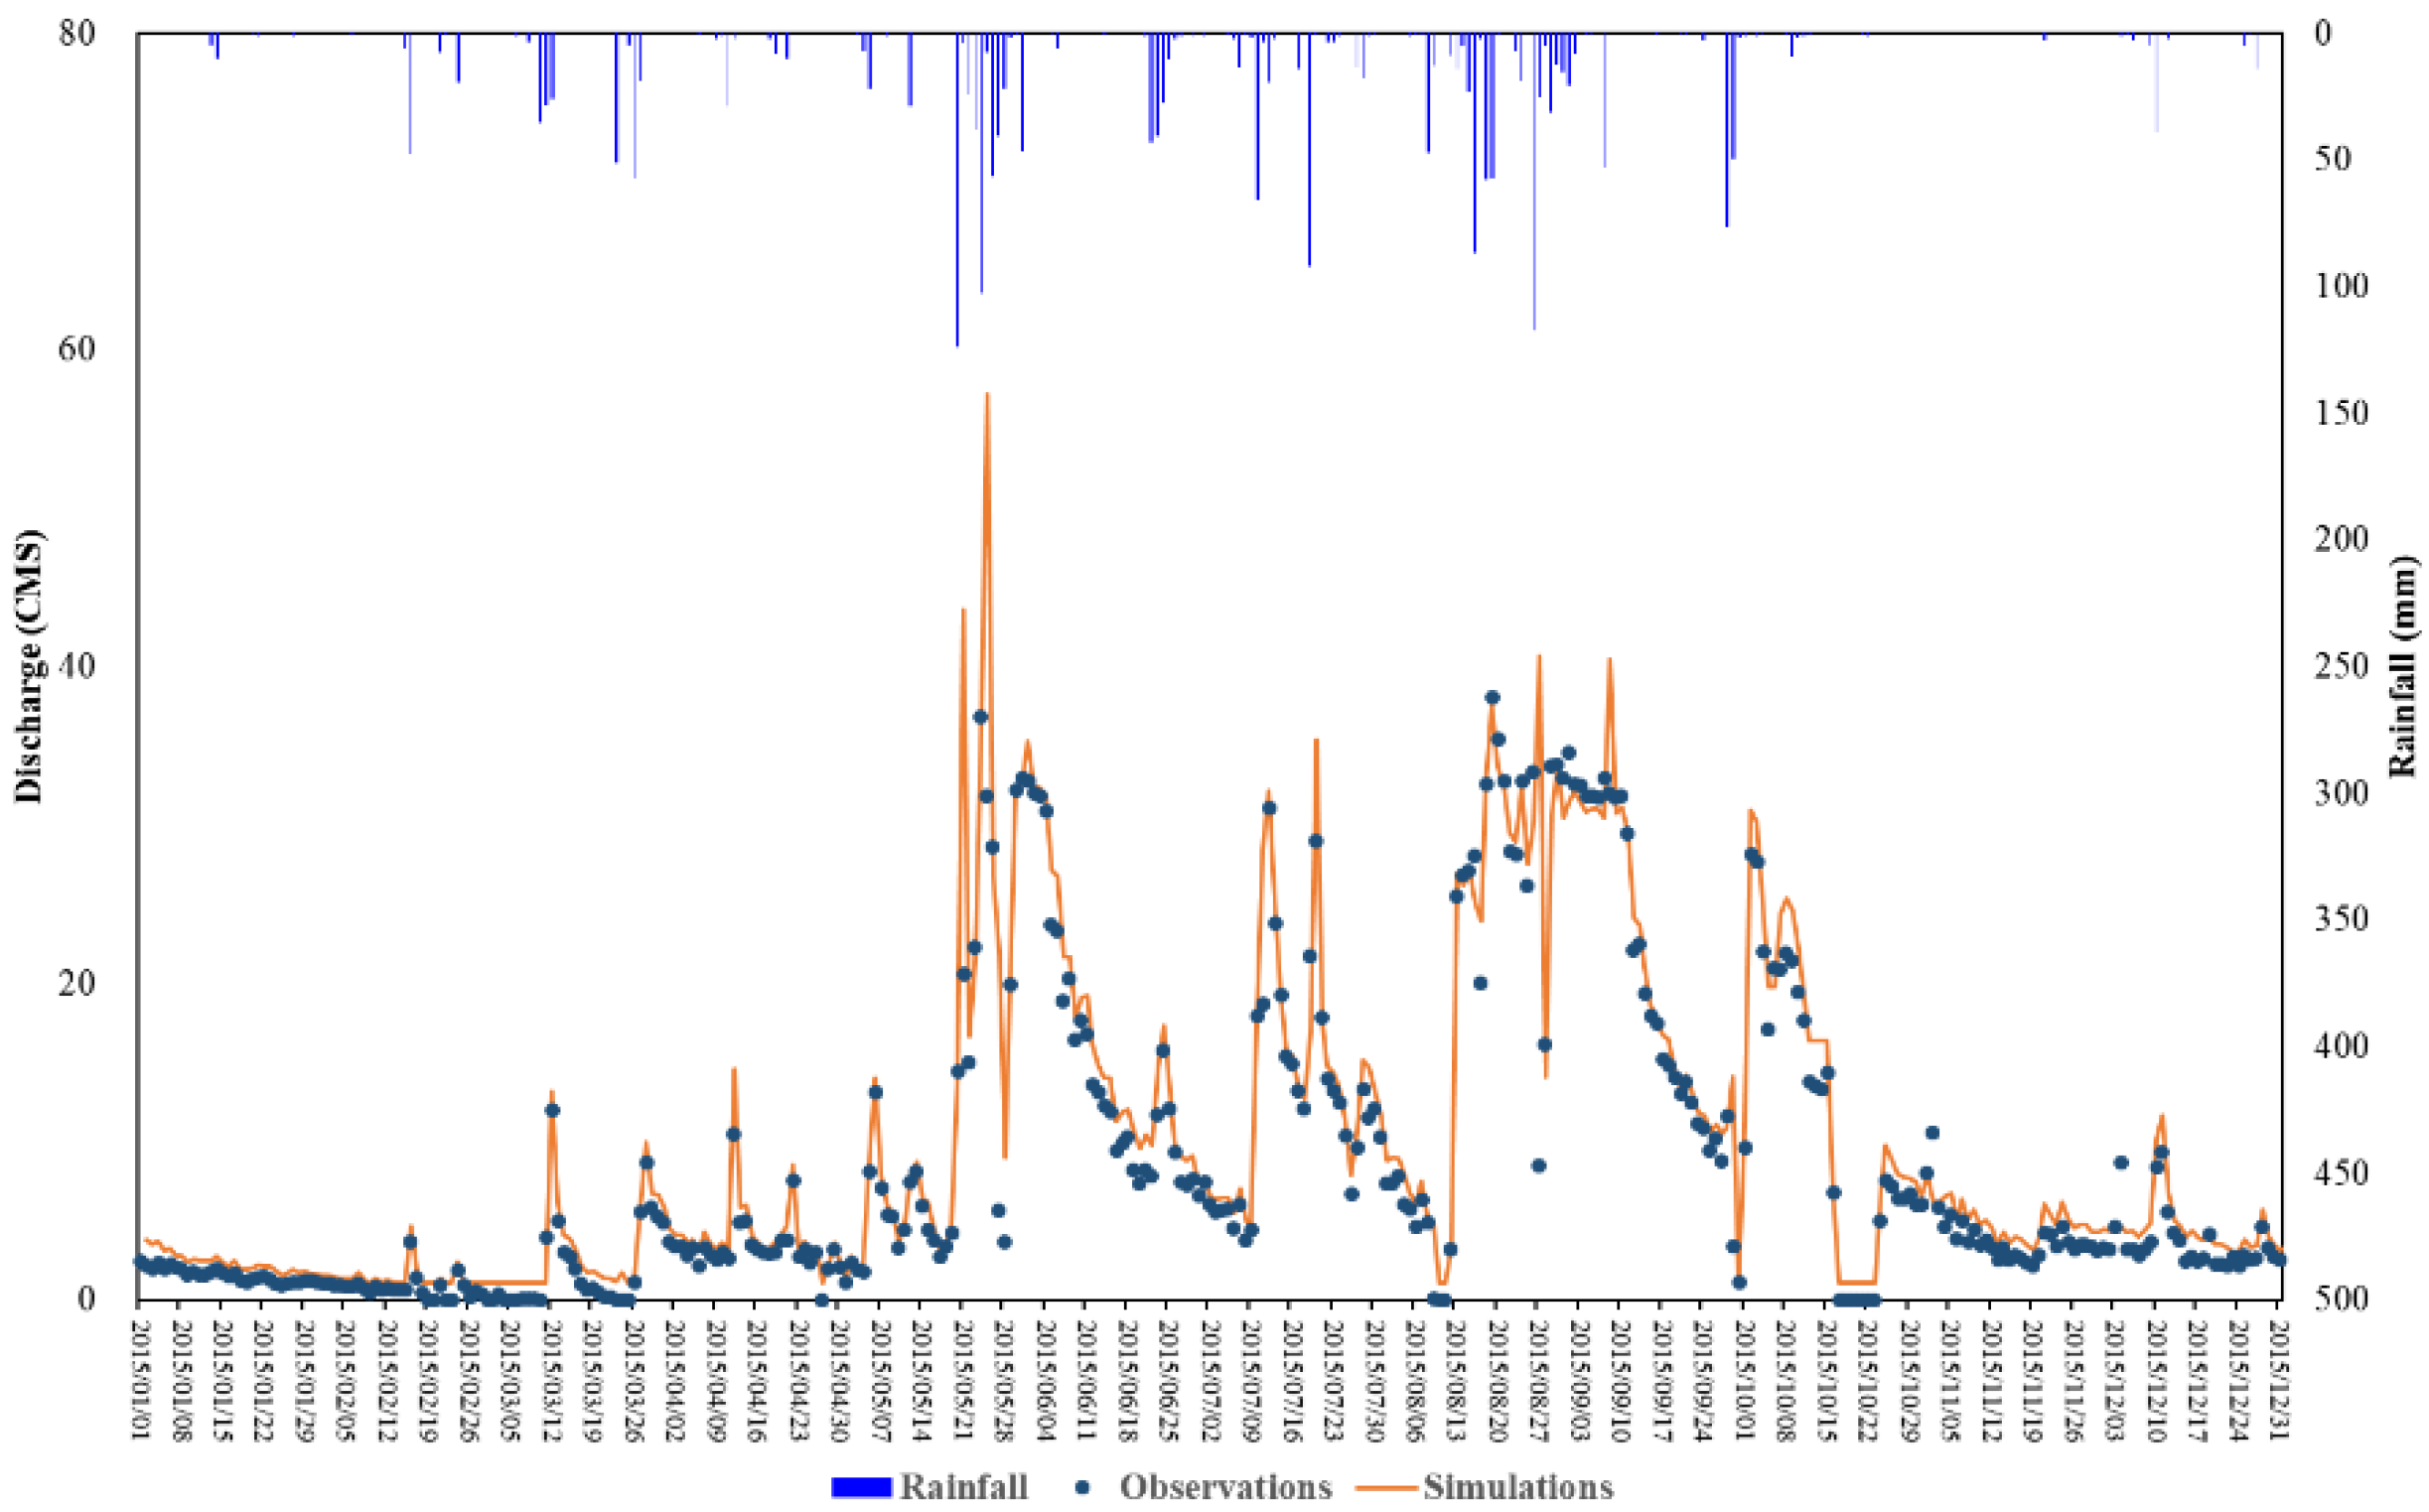
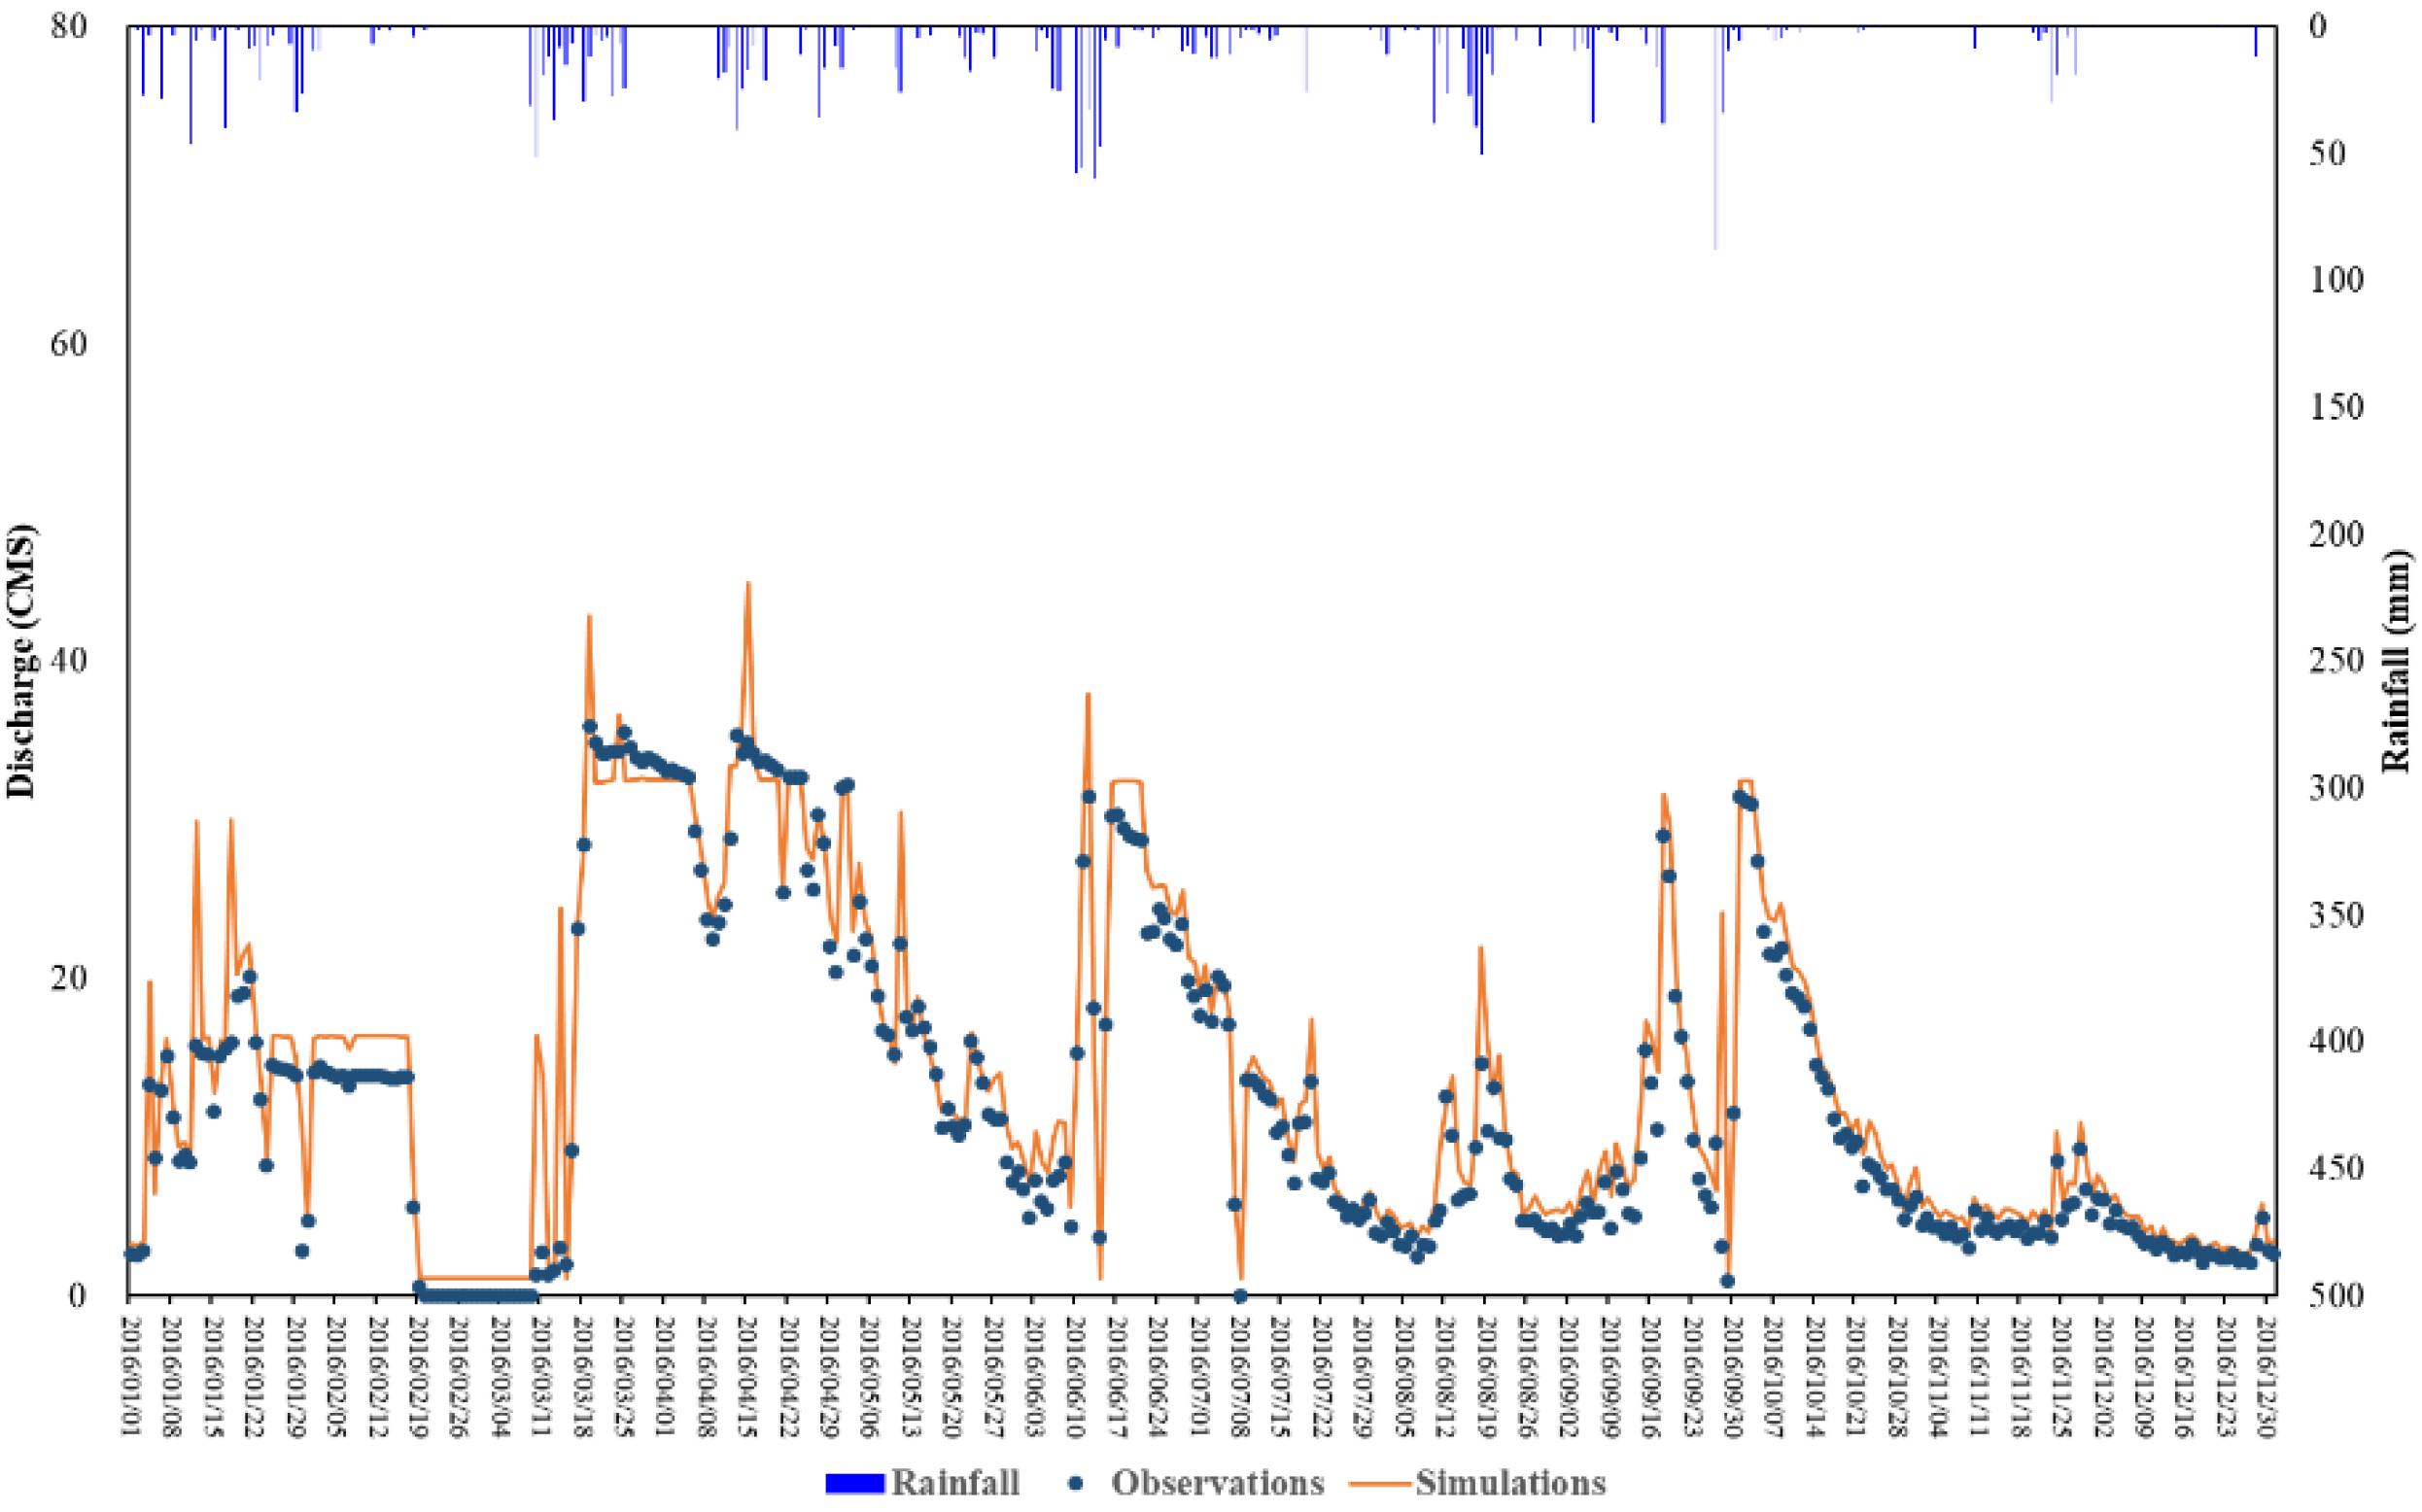
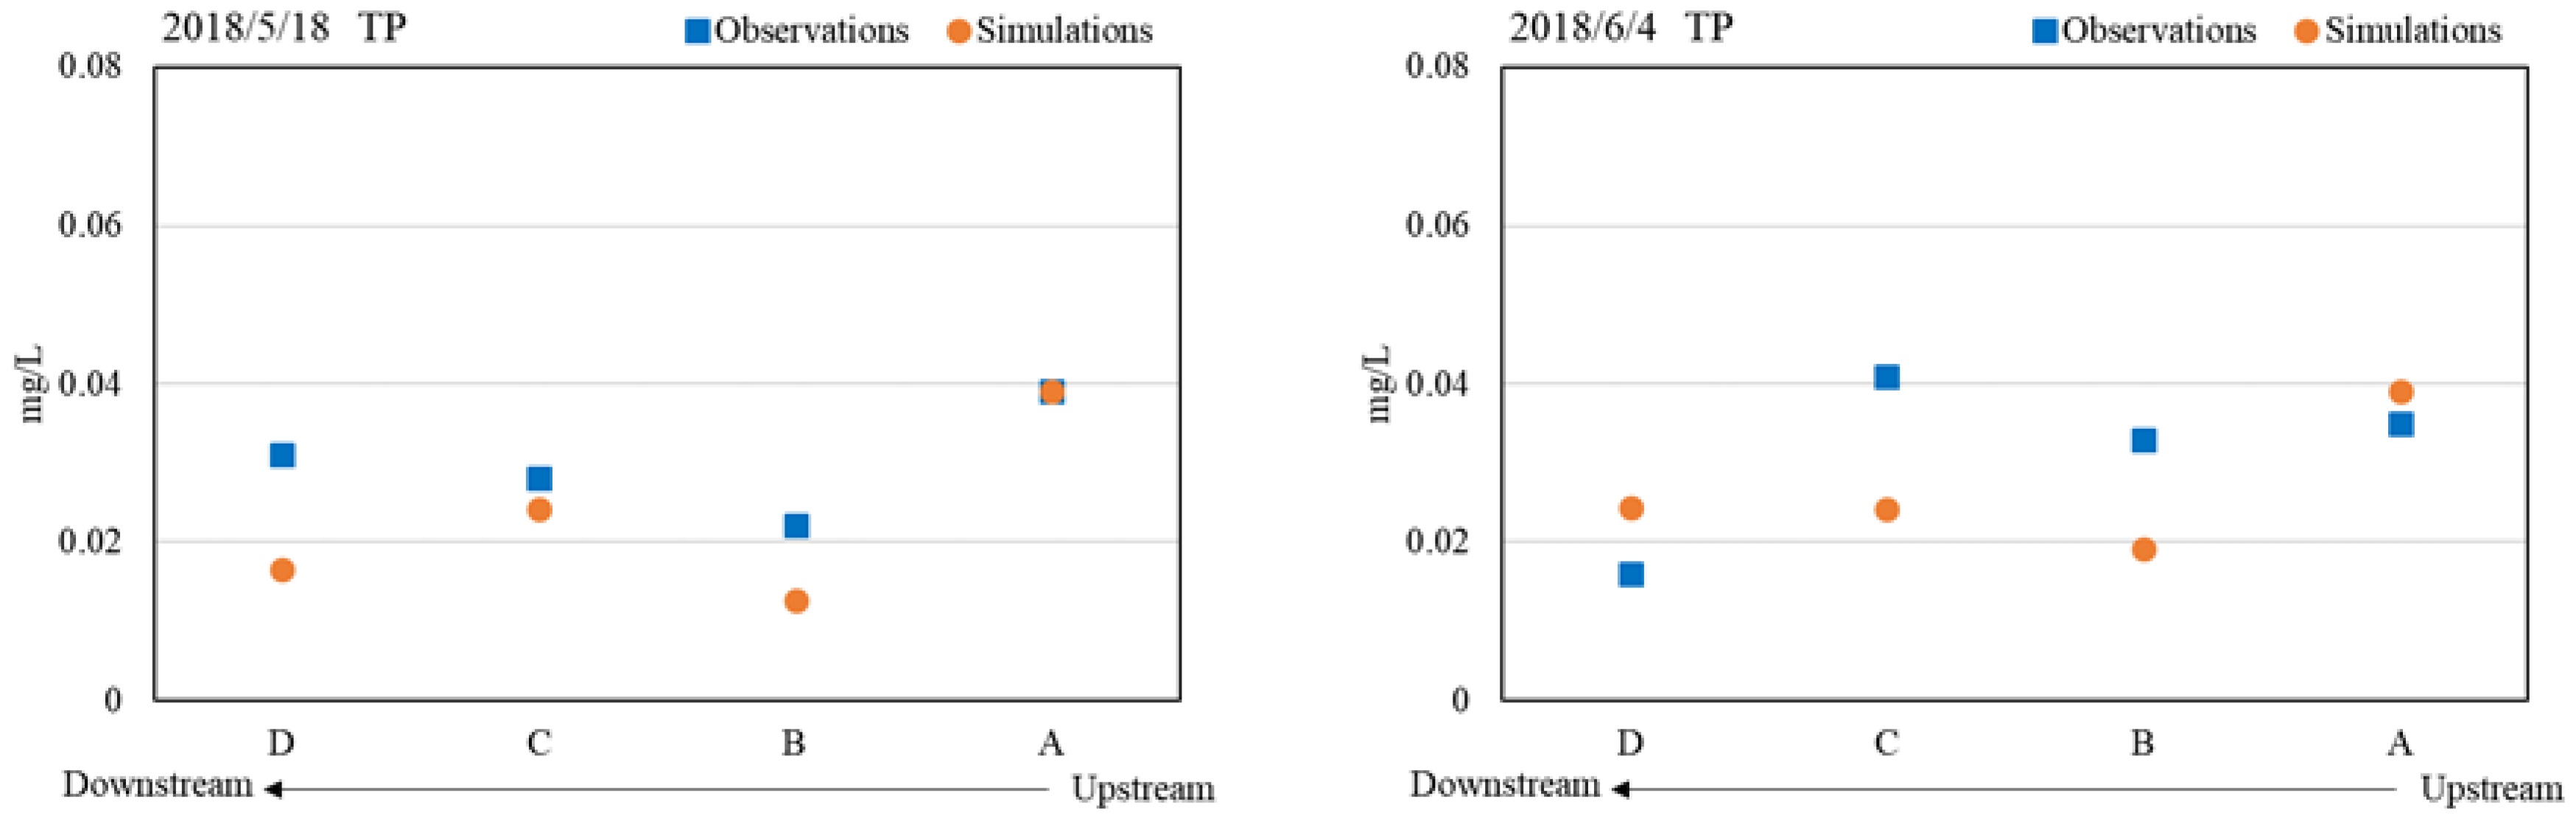
2.4. Model Calibration and Verification Methods

To verify the results of the model simulation, the process of model calibration and verification is important. With regard to the difference between simulation values and observation values, more similarity is better. We used the coefficient of determination (R2) and mean absolute percentage error (MAPE), which are commonly used in Taiwan, to determine the fitness of the model. Moriasi et al. [18] summarized several methods for watershed mode evaluation. Based on Moriasi et al., we chose two indexes for model evaluation in addition to R2 and MAPE: the percent bias (PBIAS), which is an error index, and Nash-Sutcliffe efficiency (NSE), which is a dimensionless index. The details and the general performance ratings can be found in the study. Generally, 0.75 ≤ NSE ≤ 1.00 and PBIAS ≤ ±25% perform well [18]. Duda et al. [19] summarized a general calibration/validation tolerance provided to model users as a reference and suggested that R2 ≥ 0.7 is good for daily flow simulation. If the percent mean errors or differences between simulated and observed values are used, then fair performance for flow is ≤ 25%, and very good performance for flow is ≤ 10%. However, these values are different for water quality simulation. Fair performance for water quality is ≤ 35%, and very good performance is ≤ 15%.

2.5. Uncertainties and Limitations

This study relied on model use. However, modeling mimics reality. The gap between modeling and reality involves the uncertainty that is encountered and efforts to close the gap. When using models as tools, the major uncertainty is the model parameters. Because there are so many parameters in the equations in models, it is impossible to measure all of them in the real world. Therefore, we need to use observations to adjust the values of model parameters and obtain a set of reasonable model parameters for the study case. Many studies, such as Fonseca et al. [20] and Tsai et al. [14], have focused on analyzing the influence of uncertainty. Although uncertainty exists, through model calibration and verification, acceptable parameters can be obtained. However, this is also a limitation. The model parameters used in this study are suitable for Liyutan reservoirs but not for other reservoirs. The flow chart and the concept of this study can be applied to any other cases, but the quantified numbers and model parameters can only be used in this case.

3. Results and Discussion

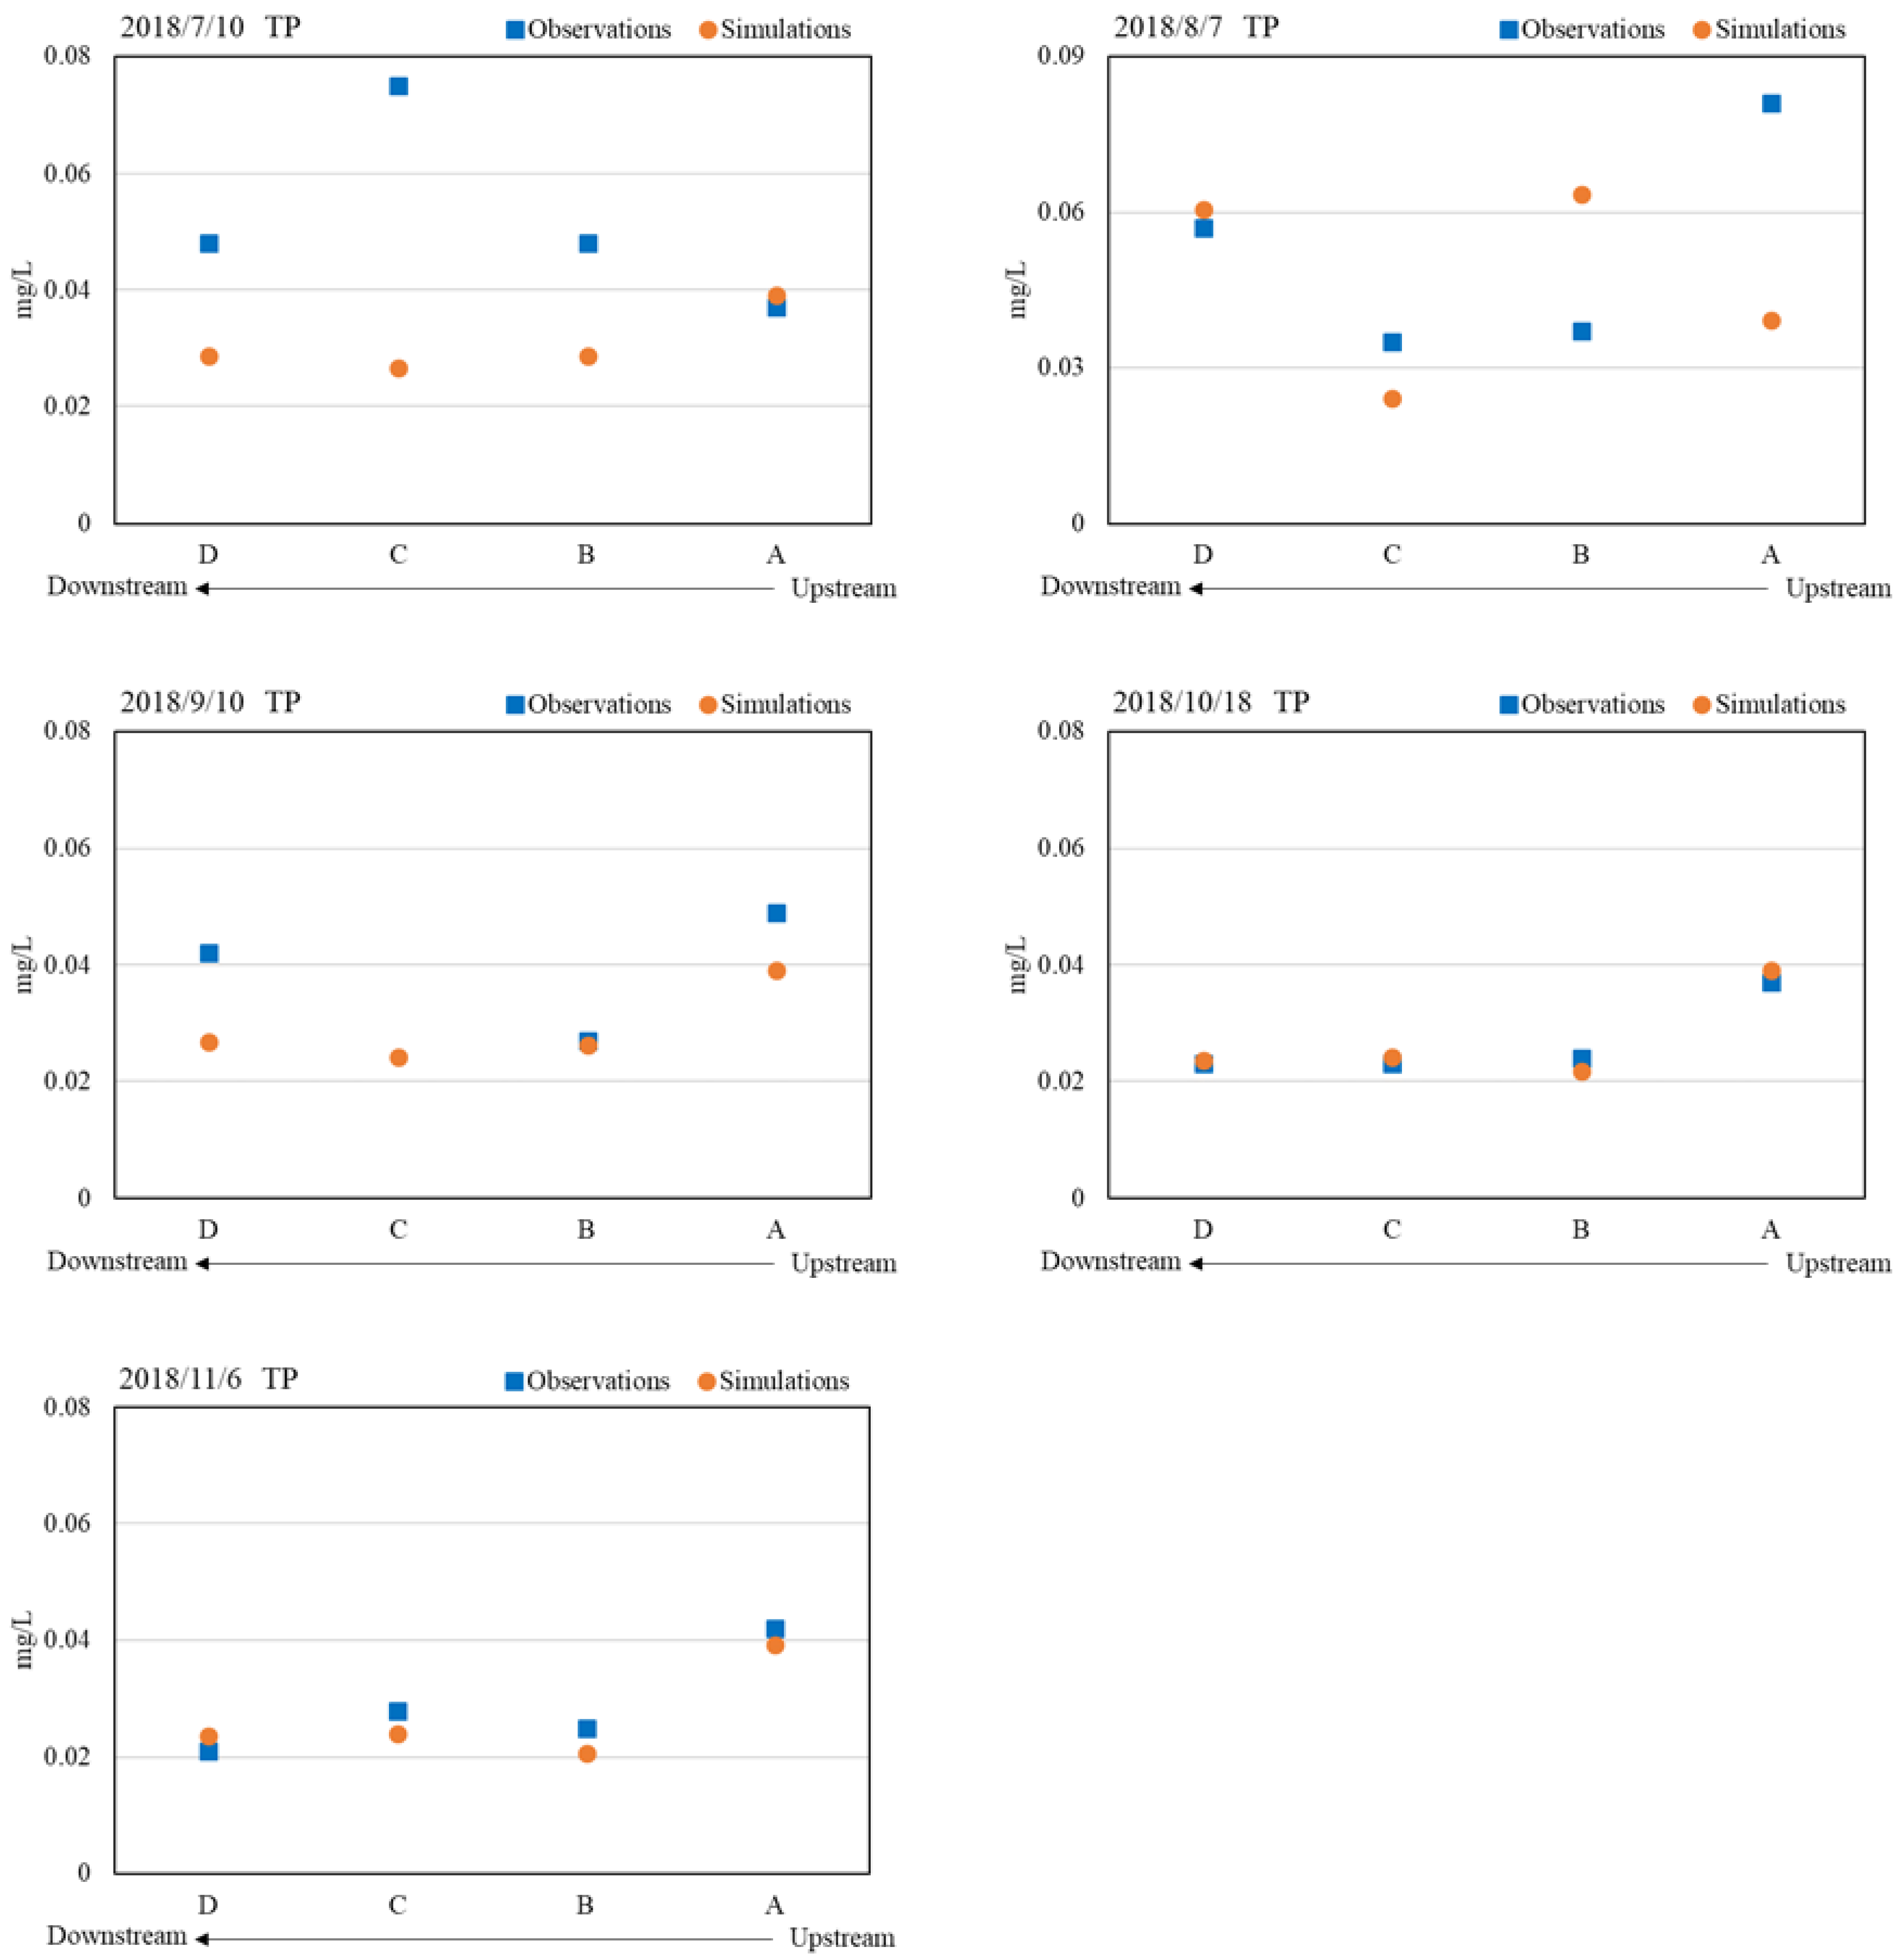
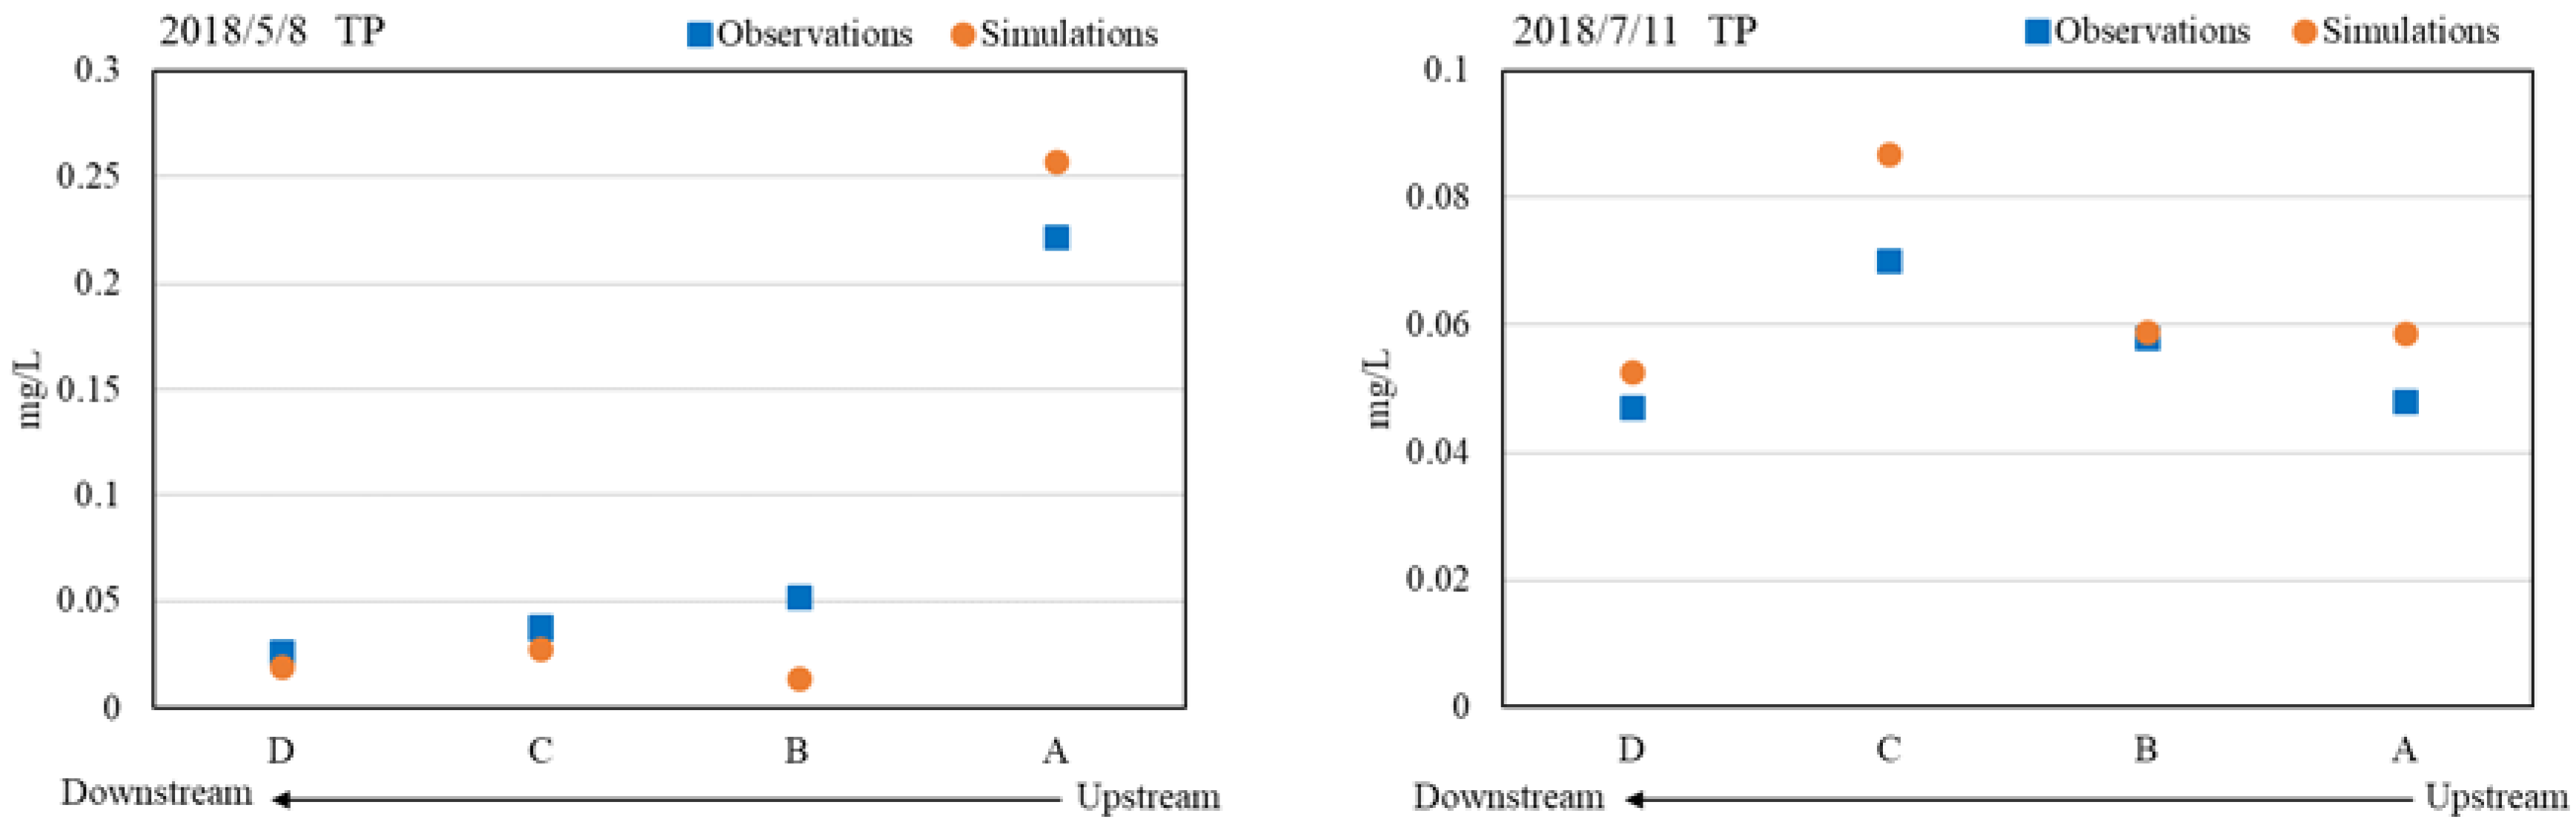
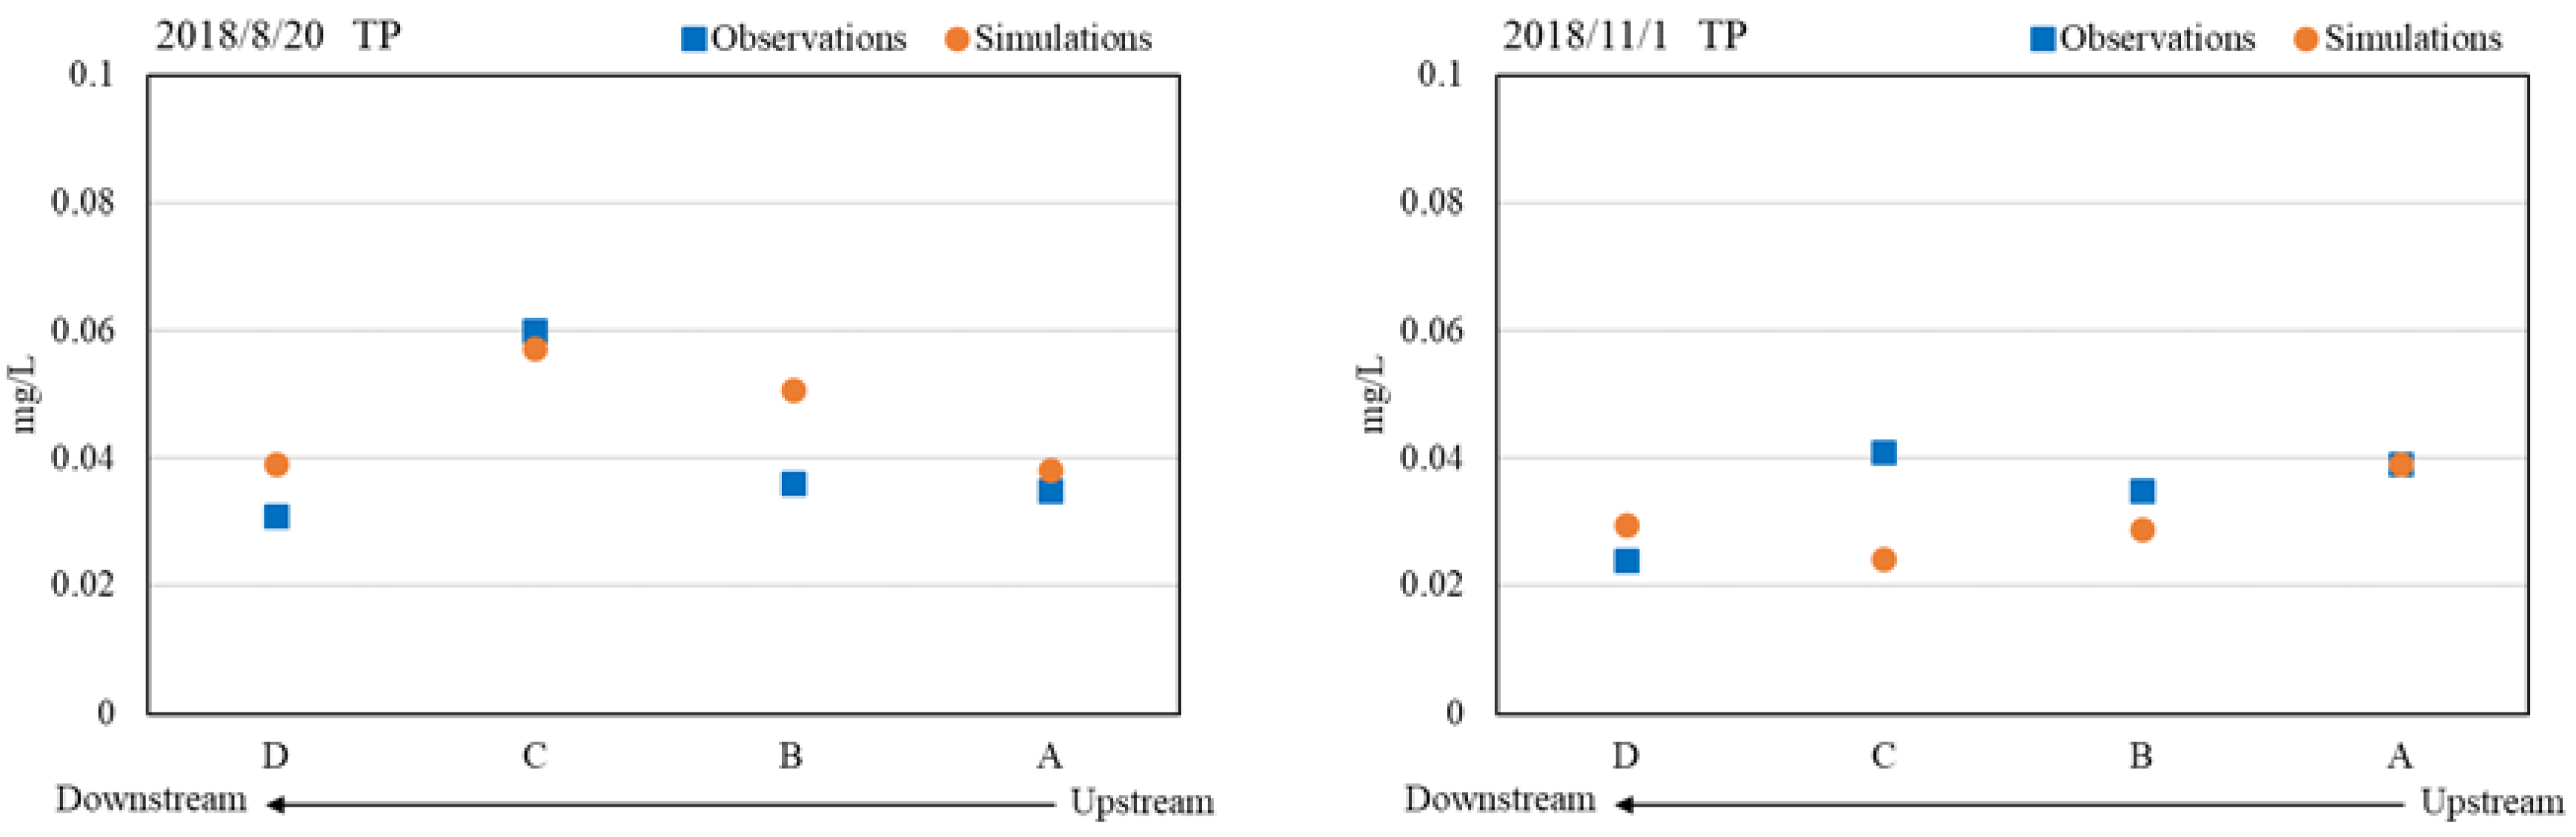
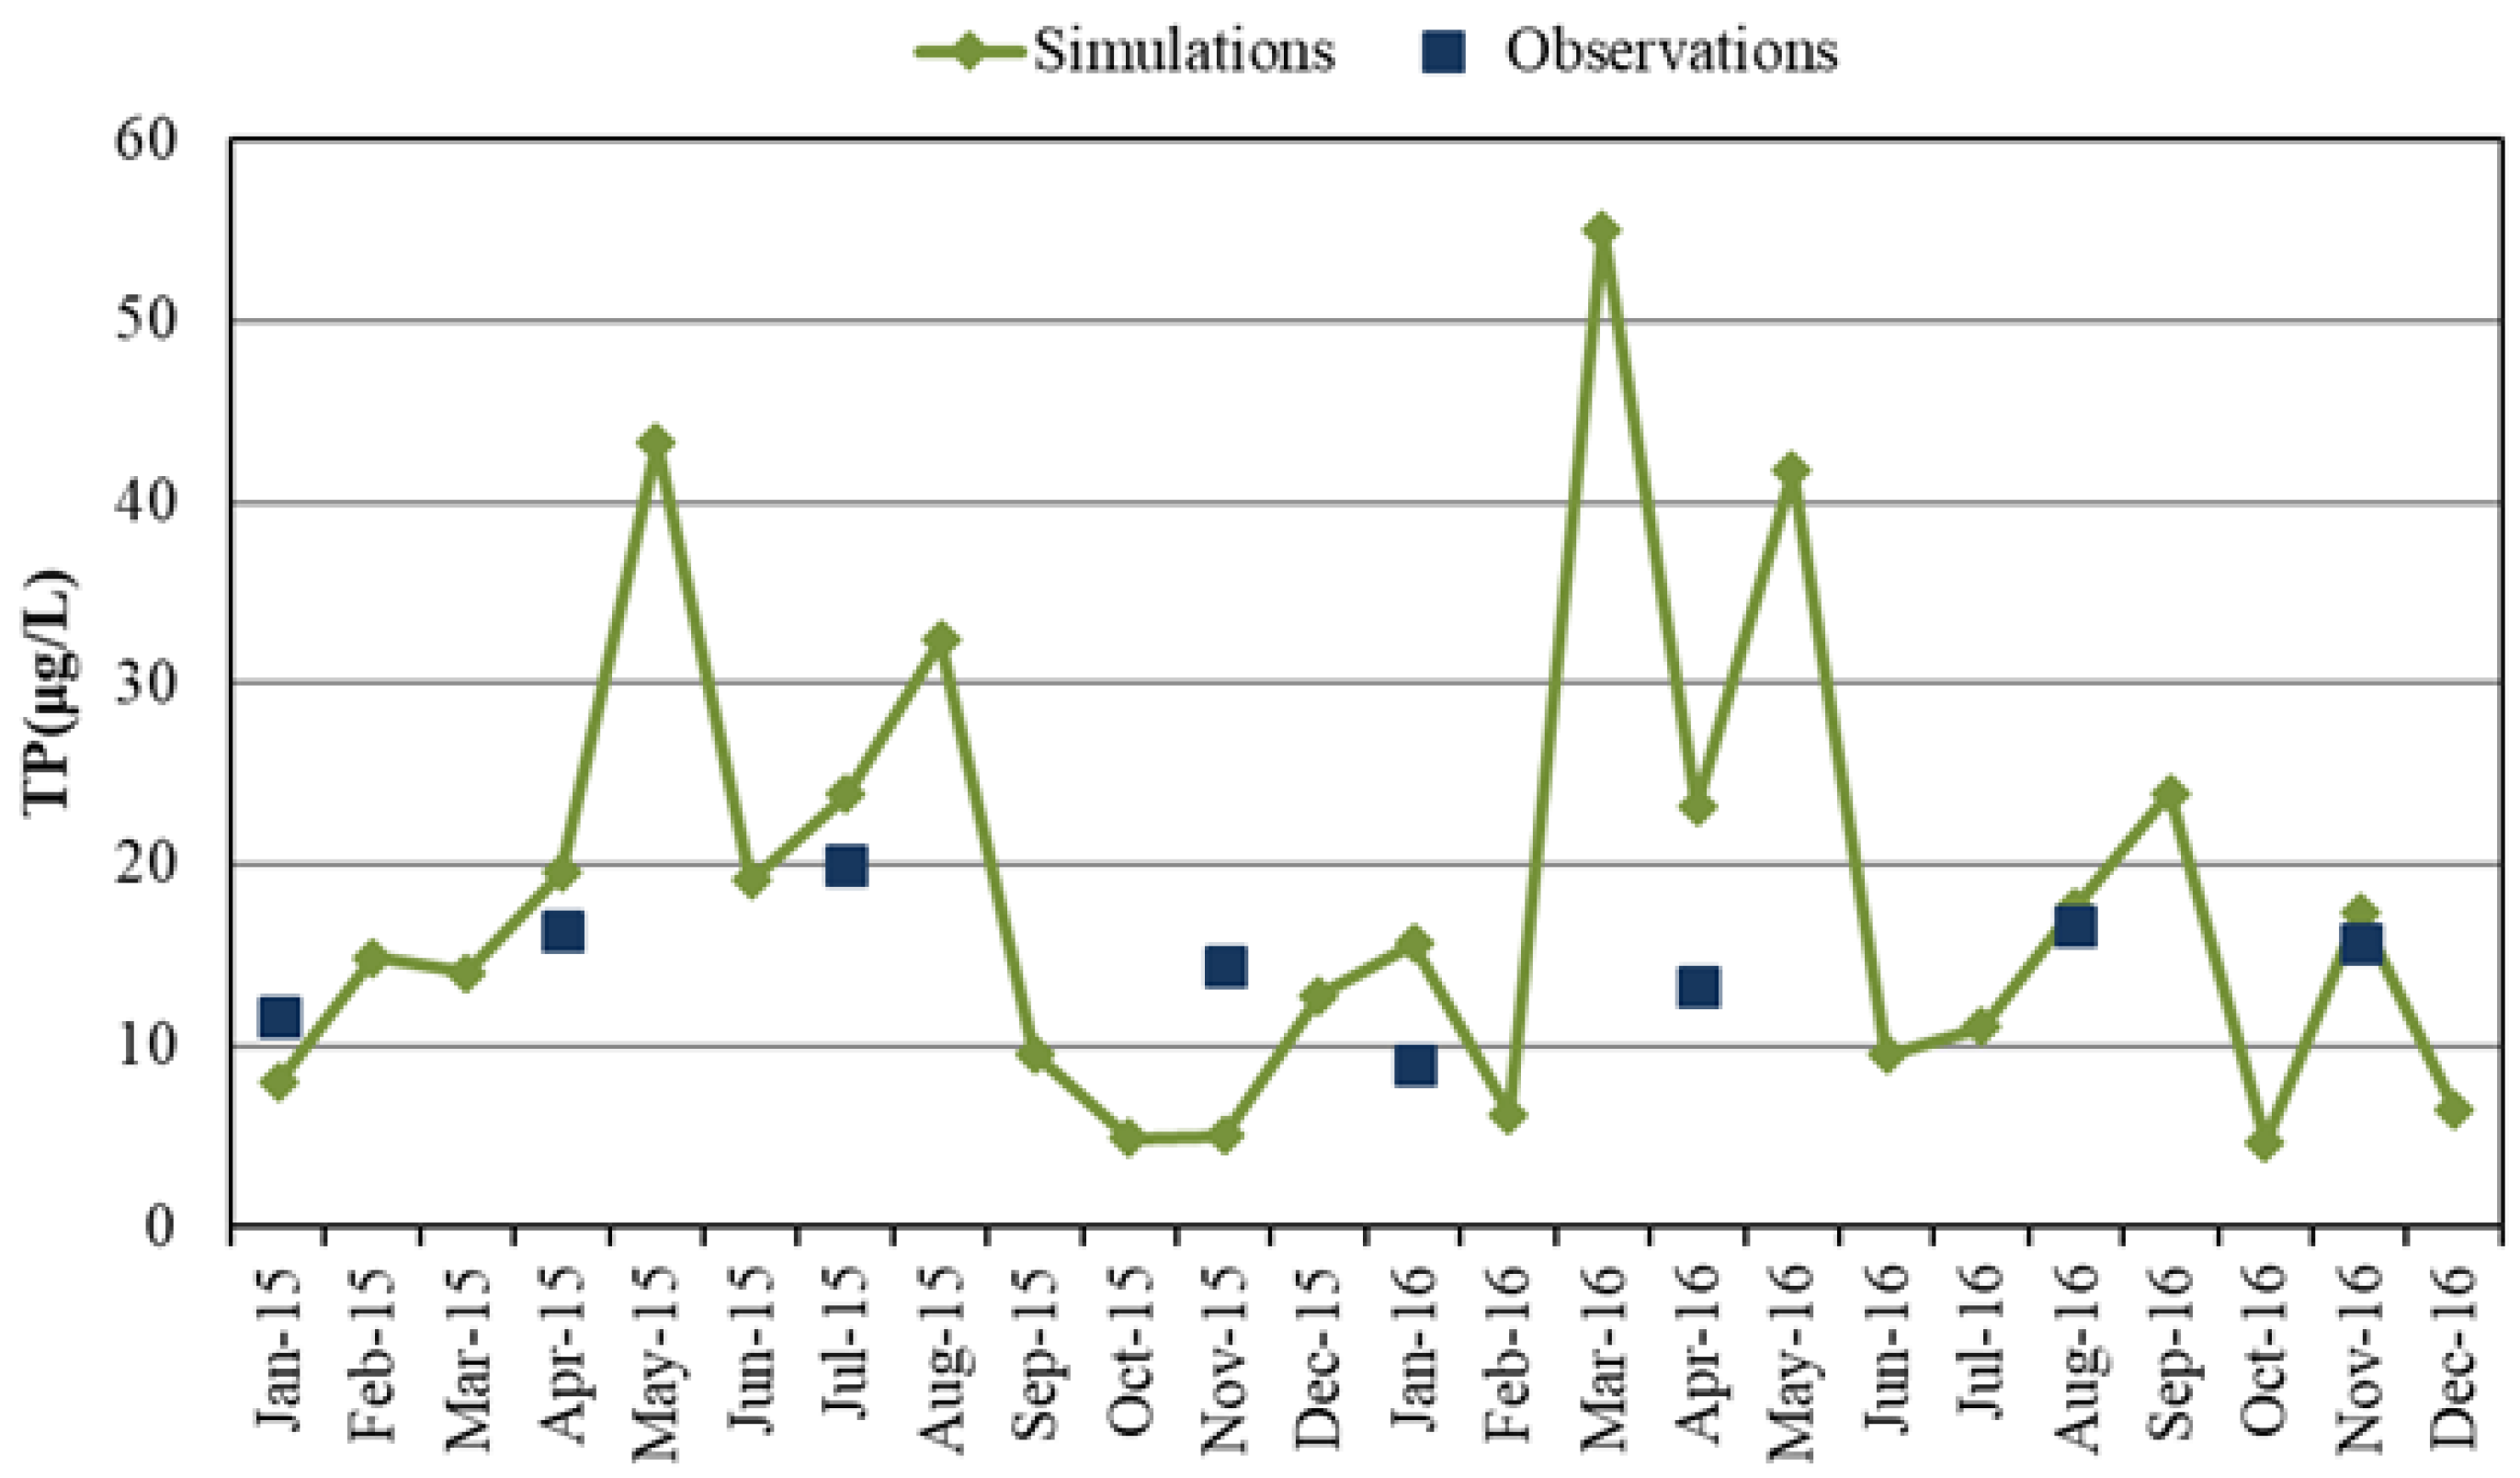
3.1. Model Calibration and Verification

The existing flow monitoring station is located upstream of this watershed and includes the flow introduced from outside the watershed. Because the watershed model only simulated runoff generated from within the watershed, we added the introduced water data as an inflow to the connected junction in the model. Daily flow in 2015 was used for model calibration, and the daily flow in 2016 was used for model verification. The simulation results are shown in Figure 5, and the statistical results of the validation process are summarized in Table 2. The results of R2 are 0.95, at a very good acceptable level. This result is because the introduced flow dominated the total flow and the simulated runoff occupied a small proportion of the total flow, so the simulation results were highly acceptable.
There are no water quality monitoring stations in the watershed, and so we performed onsite sampling in 2018. The daily flow simulations in 2018 were performed and validated before the water quality simulations. Four sampling points from upstream to downstream were surveyed. In addition, we sampled water in dry weather and wet weather to capture the effects of different pollution sources. The PS loads were calculated from reference data. We inputted the calculated PS loads into the model and used the dry weather data to verify the calculated PS value. Wet weather data verified the effects from NPSs. If the simulation results were far from the observations, then the coefficients for calculating the PS loads were adjusted. Similarly, the model parameters of the functions of the build-up and wash-off equations in the SWMM were calibrated by one set of wet weather data and verified by the others. The results of the simulations are shown in Figure 6 and Figure 7. Notably, the introduced water quantity and quality were considered external inputs added to the model, which means the results of the simulations and observations included the effects of introduced water.
There was a total of 7 dry-weather observations and 4 wet-weather observations. The MAPE result of the TP calibration during the dry-weather events was 26%, and the verification for the other 6 event results was 28%, implying that the PS load estimations were acceptable. The simulation results for wet weather were also satisfactory. The MAPE was 35% for the calibration of the 5/8 event and 19% for the verification events. The results of the simulations are summarized in Table 2. The results of R2 for the verification of dry-weather events are not acceptable because the TP is separate sampling events and is not a continuous value like daily flow. The trend relationship presented by R2 is therefore not satisfactory, and the observed values are unstable. The values in the 07/10 and 08/07 events are quite different from other events. However, the results of MAPE and PBIAS are acceptable, providing confidence for the simulation results.
The one-dimensional Vollenweider model was used to assess the TP concentration in the Liyutan reservoir. Before the application of the model, it needs to be verified. Only one parameter, the settling velocity (v), needed to be adjusted; the other parameters, such as inflow and outflow volume of the reservoir, were determined by actual data. In this model, the TP input was required, and we used the verified SWMM results to obtain the input TP mass. The output of the watershed model became the input of the reservoir model, converting TP loads to TP concentration. However, we ensured the reliability of the TP loads and then used them to validate the results of the reservoir model. Following the results of the SWMM, the 2015 data were used for calibration and the 2016 data were used for verification. The results of the Vollenweider model are shown in Figure 8, where the MAPE was 35% and 19% for 2015 and 2016, respectively. The verified settling velocity of TP for the Liyutan Reservoir was 20 m/year.

3.2. Results of Pollution Loads

For PS pollution loads, domestic sewage and tourist wastewater are the two major pollution sources in the Liyutan reservoir watershed. There are no wastewater treatment plants, and wastewater is treated through individual, simple septic tanks. The total number of residents is 5253, and the number of tourists is approximately 360,000. For the PS load estimation, the water usage in the local area was considered at an average of 242 L/day per capita. A coefficient of 0.8 was used to convert the quantity of water usage to wastewater discharge. Therefore, the discharge domestic wastewater was 194 L/day. The TP concentration in septic tanks in this area was approximately 3.6 mg/L. With the population number and wastewater quantity and quality, TP emissions from domestic wastewater were obtained. For tourist wastewater, we divided the tourists into stay and non-stay groups. The number of overnight stay tourists was based on the number of recreational places in the watershed, including hostels and camping sites. The unit quantity and quality of tourist wastewater were the same as that of domestic wastewater. Non-stay tourists were those who did not stay overnight in the watershed, and their wastewater was from restroom use. We assumed that the non-stay tourists used 12 L for flushing a toilet and 1 L for hand washing. Thus, the total PS load from domestic uses and tourists was 1615 kg/y, of which the domestic emissions load was 1336 kg/y and the tourist TP load was 279 kg/y. Although the PS load was obtained from many assumptions, we used model results and observations to verify the PS evaluations.
The NPS loads were obtained from the verified SWMM with acceptable R2 and MAPE results. The model simulations showed that the TP from NPSs averaged 7,677 kg/y in 2015–2017. Therefore, the TP was 9,292 kg/y, and the contributed percentages from PSs and NPSs were 17% and 83%, respectively. Among the NPSs, 82% of the TP loads were from agricultural lands. The details on the TP loads in each subwatershed are summarized in Table 3. The agricultural NPS was regarded as a controllable source, and subwatersheds S5 and S6 generated the most agricultural NPS pollution. Considering the location distances, the PS percentage, and the unit TP loads, the TP pollution hot spots in the Liyutan reservoir watershed were the S5 and S7 areas (Figure 9).
Additionally, the NPS pollution generated from different land uses was divided by the SWMM results. The NPS TP was mostly from agricultural lands, at 82%. The NPS TP from forests was 13%, and that from constructed lands was 5%. The subwatersheds S5 and S6 had high levels of NPS TP from agricultural lands, which exported more than 1000 kg/yr. Subwatershed S1 generated the most NPS TP from forests, and S8 had the most NPS TP from constructed lands. The details of the different NPS sources of the subwatersheds are summarized in Table 4.

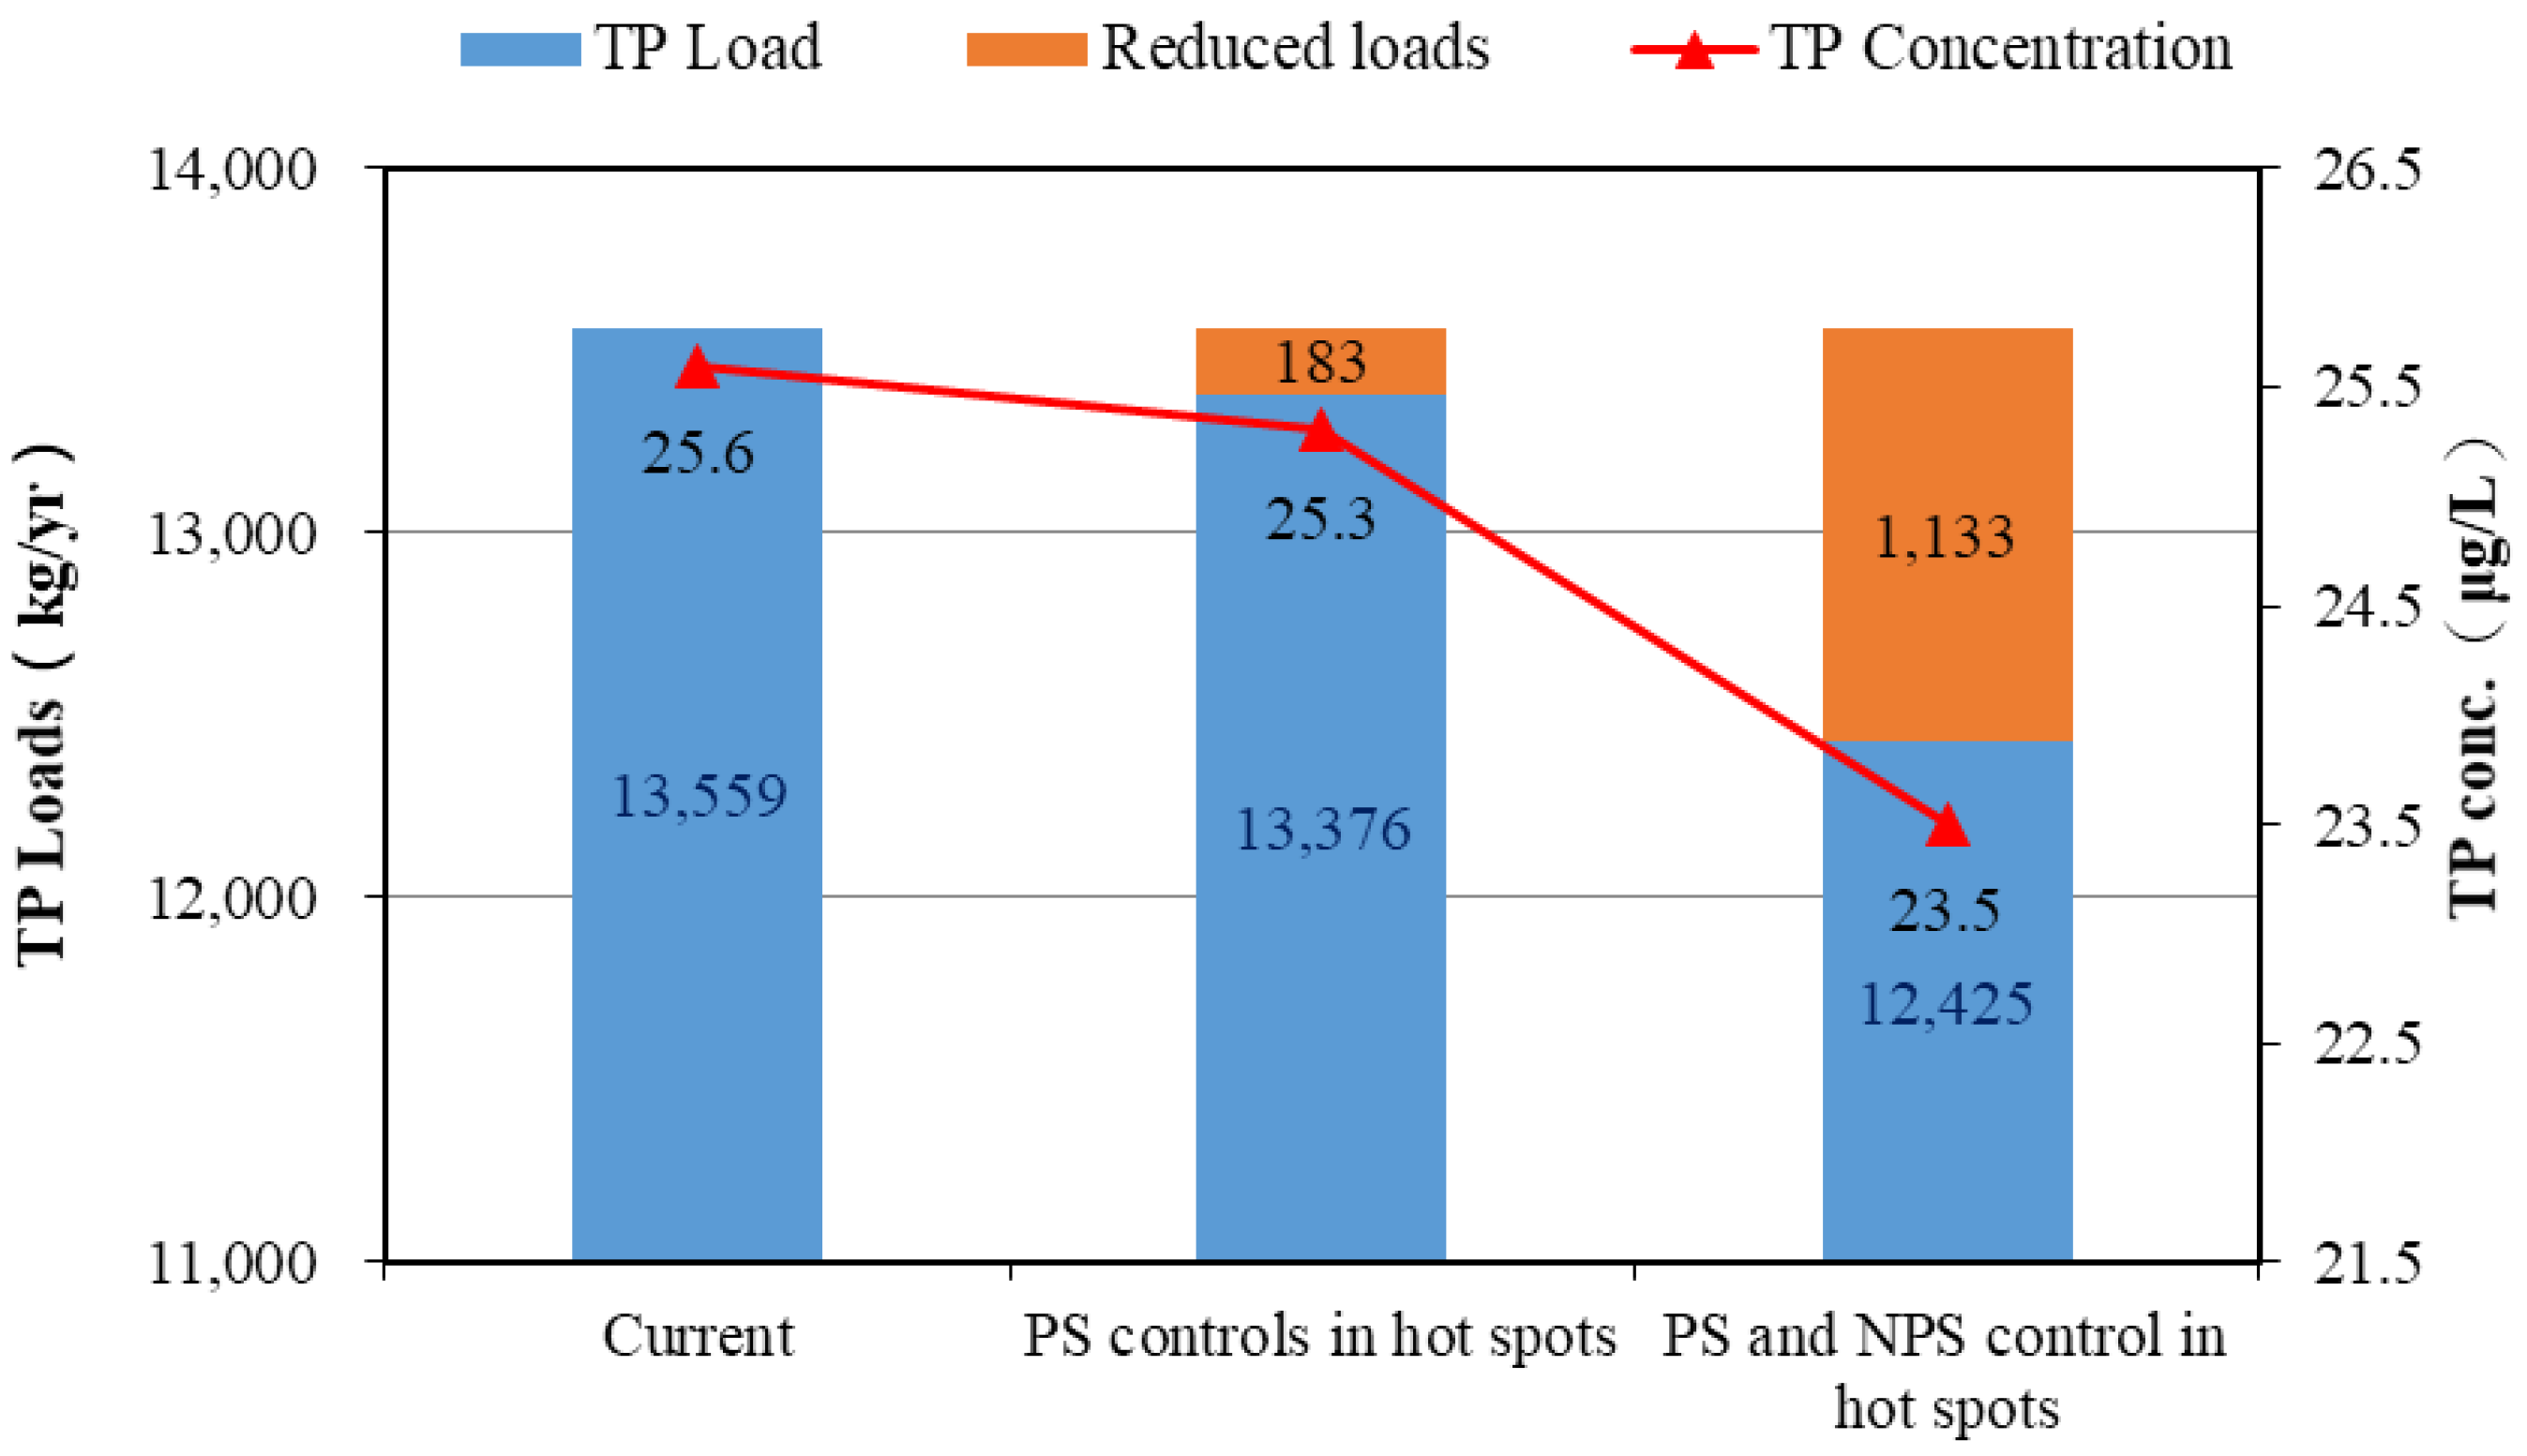
3.3. Linkage of the Watershed TP Loads and Reservoir TP Concentration: Pollution Control Scenarios

The Vollenweider mass-balance model was used to calculate the TP concentration in the reservoir. The average TP load generated by the watershed was 9,013 kg/y, and the TP load from introduced water was 4,545 kg/y. With the model tools, the water quality performance caused by different pollution control measures can be determined. For example, if the emitted TP concentration from the PS wastewater can be treated to 2 mg/L in the S5 and S7 areas, then PS pollution can be reduced by 183 kg/y, and the TP concentration in the reservoir can decrease from the current level of 25.6 μg/L to 25.3 μg/L. If NPS pollution from agricultural lands can be controlled in the S5 and S7 areas and agricultural NPS loads can be reduced 50% with best management practices (BMPs), then the TP can be reduced by 1,133 kg/y. The TP loads are expected to decrease from 13,559 kg/y to 12,425 kg/y, and the predicted TP concentration from the Vollenweider model decreased to 23.5 μg/L (Figure 10). In Taiwan, a rational fertilization policy and onsite polluted runoff treatment facilities are promoted as the major nonstructural and structural BMPs, respectively. With effective BMP measures, 50% TP load reductions from agricultural lands should be achieved.

4. Conclusions

The Liyutan reservoir is an off-site reservoir, but the water quality of the reservoir gradually became eutrophic. The objective of this study was to identify the causes and solve this problem. We collected local monitoring data and applied models to illuminate the potential pollution sources and their impacts on reservoir water quality. A watershed model, SWMM, and a reservoir model, Vollenweider model, were linked. The SWMM provided clear spatial information, and the Vollenweider model linked the TP loads from the watershed and TP concentration in the reservoir. With quantitative tools, decision makers can easily develop pollution reduction strategies based on predicted water quality.
The TP loads from outside the watershed occupied 1/3 of total loads; therefore, the water introduced to this reservoir was considered background data. Pollution control efforts are suggested to be implemented in high pollution potential areas. The pollution control measures are domestic PS control and agricultural NPS control in high pollution potential areas. Although there are 17% TP loads from PS and 83% from NPS, the control of PS is still important and effective because PS is a continuing emission. If all domestic wastewater can be treated to 2 mg/L TP and 50% TP loads are reduced from agricultural lands by BMPs, then the expected TP concentration can be obtained by the integrated models. This is valuable information for administrative agencies. However, the model application has uncertainties and limitations. To increase the model accuracy, we verified a model with dry weather and wet weather events. The dry weather simulations presented the quality of the evaluated PS loads, and the wet weather simulations confirmed the reliability of the simulated runoff quality, which is the NPS load. Four different model evaluation methods were applied. The results showed that the simulations for daily flow and TP in wet weather had good performance, but the TP in dry weather was good in the MAPE and PBIAS results and unsatisfactory in the R2 and NSE values because of the unstable observed values.
This study addresses the establishment of a watershed management plan with integrated watershed and reservoir models, and this concept can be applied in other watersheds. Different scenarios can be designed and compared. It should be noted that the uncertainty of model parameters is unavoidable, but it can be reduced. More monitoring data result in less uncertainty. In this study, there were 4 wet weather sampling events, and they did not present all types of rainfall events. In the future, more wet weather samplings are suggested in order to help explain the properties of NPS.

Author Contributions

C.-F.C. conducted the study flow, investigated the local data, and prepared the original draft. Y.-R.W. ran the model and verified the results. J.-Y.L. reviewed and edited the paper and supervised the study.

Funding

This research was funded by the Environmental Protection Administration, Taiwan, grant number EPA-107-U101-02-A156.

Acknowledgments

The authors thank the Environmental Protection Administration, Taiwan, for providing financial support.

Conflicts of Interest

The authors declare no conflict of interest.

References

  1. Wang, G.; Mang, S.; Cai, H.; Liu, S.; Zhang, Z.; Wang, L.; Innes, J.L. Integrated watershed management: Evolution, development and emerging trends. J. For. Res. 2016, 27, 967–994. [Google Scholar] [CrossRef]
  2. Stewart, J.; Bennett, M. Integrated watershed management in the Bow River basin, Alberta: Experiences, challenges, and lessons learned. Int. J. Water Resour. Dev. 2017, 33, 458–472. [Google Scholar]
  3. Yazdi, J.; Moridi, A. Interactive reservoir-watershed modeling framework for integrated water quality management. Water Resour. Manag. 2017, 31, 2105–2125. [Google Scholar] [CrossRef]
  4. Rong, Q.; Cai, Y.; Chen, B.; Shen, Z.; Yang, Z.; Yue, W.; Lin, X. Field management of a drinking water reservoir basin based on the investigation of multiple agricultural nonpoint source pollution indicators in north China. Ecol. Indic. 2018, 92, 113–123. [Google Scholar] [CrossRef]
  5. Shoemaker, L.; Dai, T.; Koenig, J.; Hantush, M. TMDL Model Evaluation and Research Needs; National Risk Management Research Laboratory, US Environmental Protection Agency: Washington, DC, USA, 2005.
  6. Temprano, J.; Arango, Ó.; Cagiao, J.; Suárez, J.; Tejero, I. Stormwater quality calibration by SWMM: A case study in Northern Spain. Water SA 2005, 32, 55–63. [Google Scholar] [CrossRef]
  7. Di Modugno, M.; Gioia, A.; Gorgoglione, A.; Iacobellis, V.; La Forgia, G.; Piccinni, A.; Ranieri, E. Build-up/wash-off monitoring and assessment for sustainable management of first flush in an urban area. Sustainability 2015, 7, 5050–5070. [Google Scholar] [CrossRef]
  8. Pretorius, H.G.; James, W.H.; Smit, J. A strategy for managing deficiencies of SWMM modeling for large undeveloped semi-arid watersheds. J. Water Manag. Model. 2013. [Google Scholar] [CrossRef]
  9. Moynihan, K.P.; Vasconcelos, J. SWMM modeling of a rural watershed in the lower coastal plains of the United States. J. Water Manag. Model 2014. [Google Scholar] [CrossRef]
  10. Talbot, M.; McGuire, O.; Olivier, C.; Fleming, R. Parameterization and application of agricultural best management practices in a rural Ontario watershed using PCSWMM. J. Water Manag. Model 2016. [Google Scholar] [CrossRef]
  11. Wang, C.; Chen, C.; Lin, J. Effects of buffer strips on reducing nonpoint source pollution and improving water quality in Feitsui Reservoir. J. Chin. Soil Water Conserv. 2014, 45, 207–215. [Google Scholar]
  12. Chen, C.; Tsai, L.; Fan, C.; Lin, J. Using exceedance probability to determine total maximum daily loads for reservoir water quality management. Water 2016, 8, 541. [Google Scholar] [CrossRef]
  13. Vollenweider, R. Scientific Fundamentals of the Eutrophication of Lakes and Flowing Waters, with Particular Reference to Nitrogen and Phosphorus as Factors in Eutrophication; DAS/CSI/68.27; Organisation for Economic Co-Operation and Development (OECD): Paris, France, 1968. [Google Scholar]
  14. Vollenweider, R. Input-Output models with special reference to the phosphorus loading concept in limnology. Schweiz. Z. Hydrol. 1975, 37, 53–83. [Google Scholar]
  15. Rossman, L.A. Storm Water Management Model User’s Manual Version 5.1; U.S. Environmental Protection Agency: Washington, DC, USA, 2015.
  16. Tsai, L.; Chen, C.; Fan, C.; Lin, J. Using the HSPF and SWMM models in a high pervious watershed and estimating their parameter sensitivity. Water 2017, 9, 780. [Google Scholar] [CrossRef]
  17. Environmental Protection Administration. A Study for Nutrients Reduction Strategies for Eutrophication Potential Reservoirs; EPA-105-G103-02-A073; Environmental Protection Administration: Taipei, Taiwan, 2016.
  18. Moriasi, D.N.; Arnold, J.G.; Van Liew, M.W.; Bingner, R.L.; Harmel, R.D.; Veith, T.L. Model evaluation guidelines for systematic quantification of accuracy in watershed simulations. Trans. ASABE 2007, 50, 885–900. [Google Scholar] [CrossRef]
  19. Duda, P.B.; Hummel, P.R.; Donigian, A.S., Jr.; Imhoff, J.C. BASINS/HSPF: Model use, calibration, and validation. Trans. ASABE 2012, 55, 1523–1547. [Google Scholar] [CrossRef]
  20. Fonseca, A.; Ames, D.P.; Yang, P.; Botelho, C.; Boaventura, R.; Vilar, V. Watershed model parameter estimation and uncertainty in data-limited environments. Environ. Modell. Softw. 2014, 51, 84–93. [Google Scholar] [CrossRef]
Figure 1. Location of Taiwan and the Liyutan reservoir.
Processes 07 00484 g001
Figure 2. (a) Topographic map; (b) land-use distribution of the Liyutan reservoir watershed.
Processes 07 00484 g002aProcesses 07 00484 g002b
Figure 3. The GIS data were used to construct the stormwater management model (SWMM). The 11 subwatersheds are delineated for the Liyutan reservoir watershed.
Processes 07 00484 g003
Figure 4. The official flow station and water quality monitoring sites in the watershed.
Processes 07 00484 g004
Figure 5. The model calibration (2015 data) and verification (2016 data) of the flow simulations of the SWMM.
Processes 07 00484 g005aProcesses 07 00484 g005b
Figure 6. The total phosphorous (TP) simulations of dry weather events. The data of the 5/18 event are for calibration, and the other 6 events are for verification.
Processes 07 00484 g006aProcesses 07 00484 g006b
Figure 7. The TP simulations of wet weather events. The data of the 5/8 event are for calibration, and the other 3 events are for verification.
Processes 07 00484 g007aProcesses 07 00484 g007b
Figure 8. The model calibration (2015) and verification (2016) of the Vollenweider model TP simulations.
Processes 07 00484 g008
Figure 9. The pollution hot spots, subwatersheds S5 and S7, were suggested as priority water quality control areas.
Processes 07 00484 g009
Figure 10. The TP control measures and associated predicted water quality in the Liyutan reservoir.
Processes 07 00484 g010
Table 1. The SWMM parameters and their values for the subwatersheds.
ParametersDescriptionsRanges in this StudyUnit
AreaArea of each subwatershed207~855ha
WidthWidth of overland flow (depends on the shape of watershed)4729~9439m
%slopeAverage slope9~21%
%impervPercentage of impervious area9~18%
N-impervManning N coefficient of impervious area0.01none
N-pervManning N coefficient of pervious area0.4none
Dstore-impervDepth of depression in impervious area1mm
Dstore-pervDepth of depression in pervious area5mm
%zero-impervPercentage of zero depression area in impervious area70~95%
InfiltrationInfiltration methodHorton
Table 2. The results of SWMM simulations.
ItemsEventsR2MAPEPBIASNSENumber of Values
Daily flowCalibration (2015 data)0.9230%13.7%0.90365
Verification (2016 data)0.9520%11.9%0.92365
TP
(dry weather)
Calibration
(5/18 sampling data)
0.7826%−23.2%−1.114
Verification
(6 sampling events)
0.0528%−24.2%−0.3124
TP
(wet weather)
Calibration
(5/8 sampling data)
0.9835%−5.8%0.904
Verification
(3 sampling events)
0.7319%7.7%0.6712
Table 3. The results of the TP loads of the point source (PS) and nonpoint source (NPS) pollution in the Liyutan reservoir watershed.
SubwatershedTP (kg/y)
PSNPSTotal
AgriculturalSubtotal
S1234.5704.3974.11208.6
S218.0295.2439.7457.7
S389.8362.2442.8532.6
S445.6288.4482.5528.1
S5203.2925.41012.81216.0
S6231.11523.01713.91945.0
S7208.3658.6726.4934.7
S8288.9768.9890.91179.8
S946.5222.9284.0330.4
S10225.7389.1519.7745.4
S1124.0153.5190.0214.0
Total1615.76291.47676.79292.4
Table 4. The TP loads from different NPSs.
SubwatershedTP Loads from Different NPSs (kg/y)Total
ForestAgricultural LandsConstructed LandsOthers
S1184.48704.2652.5332.87974.14
S2105.78295.2011.0427.63439.65
S333.48362.2345.921.12442.75
S4167.76288.3925.700.66482.52
S538.90925.2948.470.111012.77
S6172.161523.0315.473.231713.90
S736.84658.6230.350.55726.37
S852.89768.8762.746.44890.94
S945.64222.8812.582.84283.95
S10103.26389.0823.214.16519.71
S1111.24153.5423.661.59190.03
Total952.436291.39351.6881.207676.71

