1. Introduction
South Korea’s Four Major Rivers Restoration Project (declared complete in 2011) aimed to secure water resources, improve flood control and water quality, and encourage regional development. As part of this project, 16 multi-functional weirs were constructed in the mainstreams of the four rivers (including the Nakdong River) for flow management. The resulting increase in water levels caused backwater effects in the tributaries, raising concerns about the representativeness of data from existing water-quality monitoring points.
South Korea monitors water quality and sediment using a plan for the water environmental monitoring network first established by the “Water Quality and Aquatic Ecosystem Conversation Act,” Ministry of Environment Notification No. 2017–74 (13 April 2017) [
1]; this is assessed and amended every year. The network provides basic data for formulating and analyzing the effects of major environmental policies by identifying the quality and trends for public waters, including rivers and lakes. Within this process, a total maximum daily load (TMDL) measuring network collects basic data on water quality and flow in relevant watersheds to inform the implementation and enforcement of relevant regulations. It is a system set in place to manage the total quantity of pollutants discharged into rivers to set and achieve target water quality for the stream. In a water-quality management system, the target water quality is the most important factor that influences local allocation loads (environmental capacity) and development plans. It is set considering the characteristics of the region and the possibility of achieving the data of higher quality, the water system and regional equity in the long term. Currently, the target water quality is generally set at either the end of the unit watershed or at the main tributary of the mainstream. The achievement of the target water quality is evaluated based on water-quality data measured at the end of the unit waters every seven to eight days. Thus, it is important to evaluate the water quality at the end points of unit watersheds accurately because the TMDL system evaluates pollutant emissions to establish limits that balance both environmental concerns and development.
There have been other studies on the influence of the backwater on overall river water quality. For example, Lizotte Jr. et al. [
2] assessed the water quality before, during, and after a 30-day artificial flood in a backwater by examining a suite of 14 water quality parameters representing physical, chemical and biological processes. Liro [
3] developed a conceptual guidance for future research on the backwater biogeomorphology of alluvial rivers with a special focus on gravel-bed rivers.
There have also been other studies on water-quality monitoring. For example, Lee et al. [
4] applied information theory to select the optimal sampling stations for effective and representative water quality monitoring in Lake Yongdam, South Korea, where water quality has been observed extensively at several points. Their proposed methods allowed the selection of monitoring points where the best combination of observed data from multiple sampling stations could represent all stations. Abdulraheem [
5] used a surface modeling system to compute the spatial distribution of the variation in total dissolved solids in a marsh and applied spatial analysis in a geographic information system to select the most representative water-quality monitoring stations in their study area. Puri et al. [
6] assessed
E. coli loads in the Guadalupe and San Antonio River basins by optimizing a water-quality monitoring network that used the mean annual
E. coli flux from the spatially referenced regression model on watershed attributes and a genetic algorithm. Finally, Keum et al. [
7] assessed recent applications of entropy theory to the design of water-monitoring networks, concluding that despite several issues, the approach is well-suited for this purpose.
Overall, most studies on the effects of backwater have been based on hydrology; few studies have evaluated the influence of backwater on the water-quality parameters. Most of these have suggested individually selecting representative water-quality measurement points using statistical techniques or modeling. In this study, we present the results of a comprehensive evaluation using a combination of electrical conductivity monitoring, statistical methods, evaluations of load duration curves (LDCs), and numerical modeling to verify the representativeness of water-quality measurement points. We focused on the Wicheon River a primary tributary of the Nakdong River, and recorded spatiotemporal electrical conductivity, investigated riverbed topography, analyzed water-quality patterns using the self-organizing maps (SOMs) method, analyzed water-quality trends using the locally weighted scatter plot smoothing (LOWESS) method, evaluated the target water quality using the LDC, examined the boundary of the maximum backwater effect using the Hydrologic Engineering Center’s River Analysis System (HEC-RAS) model, and analyzed water mixing using the multidimensional environmental fluid dynamics code (EFDC). These methods allowed us to examine water flow and the effects of mainstream water levels on tributary water levels based on current management practices for the multi-functional weirs in the Nakdong River. Our approach can be used as basic data for water level and quality management in rivers and for the unification of water management.
2. Materials and Methods
2.1. Overview
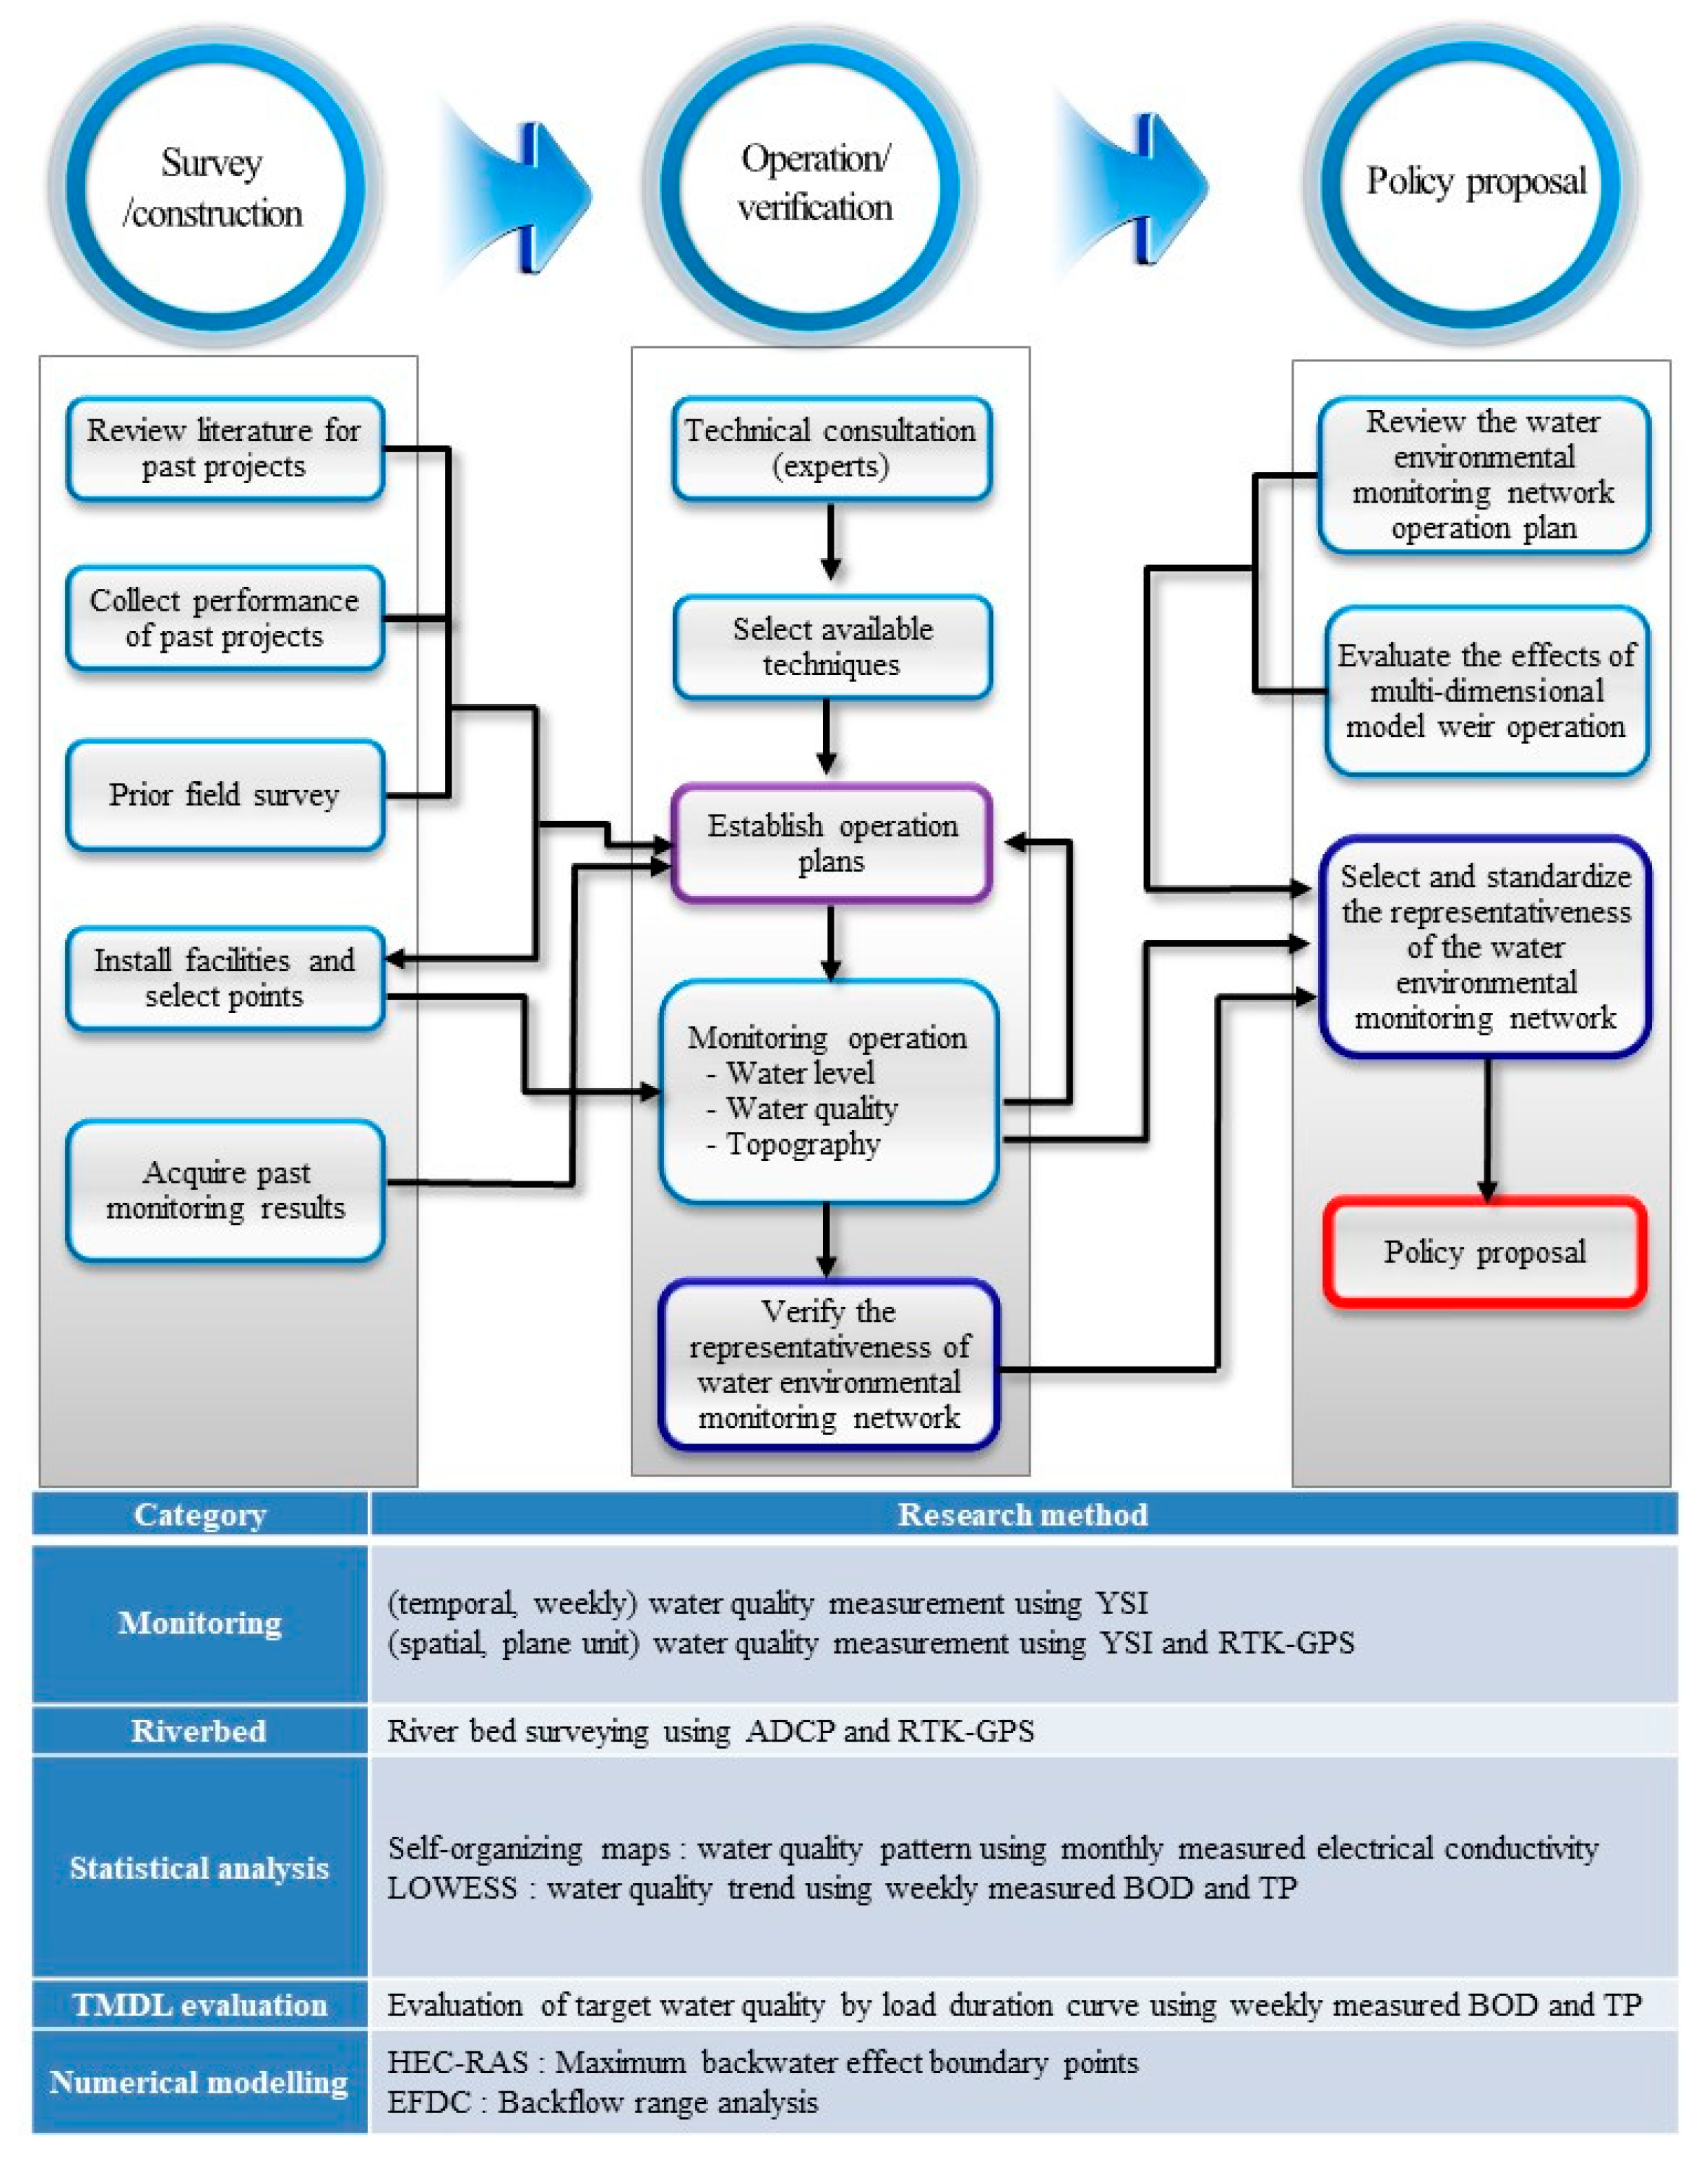
This study used the research procedure illustrated in
Figure 1. In the first step, we reviewed the literature and investigated the performance of sites from past projects before conducting a preliminary field survey. This allowed us to select points for further study and collect the results from existing monitoring operations. We then consulted technical experts, selected analytical techniques, established an operation plan, and collected the necessary data on water level, water quality, and topography. These data provided the basis for our later assessment of the representativeness of the current monitoring network. Next, we analyzed the results, reviewed the operational plan for the monitoring network, and evaluated weir operations using one- and multi-dimensional numerical modeling. Finally, we used all of these results to fully assess and verify the representativeness of the monitoring network and proposed a new policy.
To be able to determine the representativeness of water-quality data from the existing monitoring network, we needed to assess its spatial and temporal characteristics. Therefore, for the former, we measured the mixing of mainstream and tributaries by recording the plane-unit electrical conductivity (EC). For the latter, we measured the EC, water quality, dissolved oxygen (DO), and pH on a weekly basis, using Yellow Springs Instrument (YSI) equipment, at selected points in the mainstream and tributaries. We then analyzed trends and patterns in the data using the LOWESS and SOM methods, respectively, and used the LCD and multidimensional numerical modeling to evaluate the target water quality in the reverse flow of the water in the mainstream, respectively. The representativeness of the existing monitoring network points was verified based on the overall results of the analyses and evaluations. Finally, we prepared the draft of an amendment designed to improve the representativeness and accuracy of the monitoring network notification.
2.2. Study Area
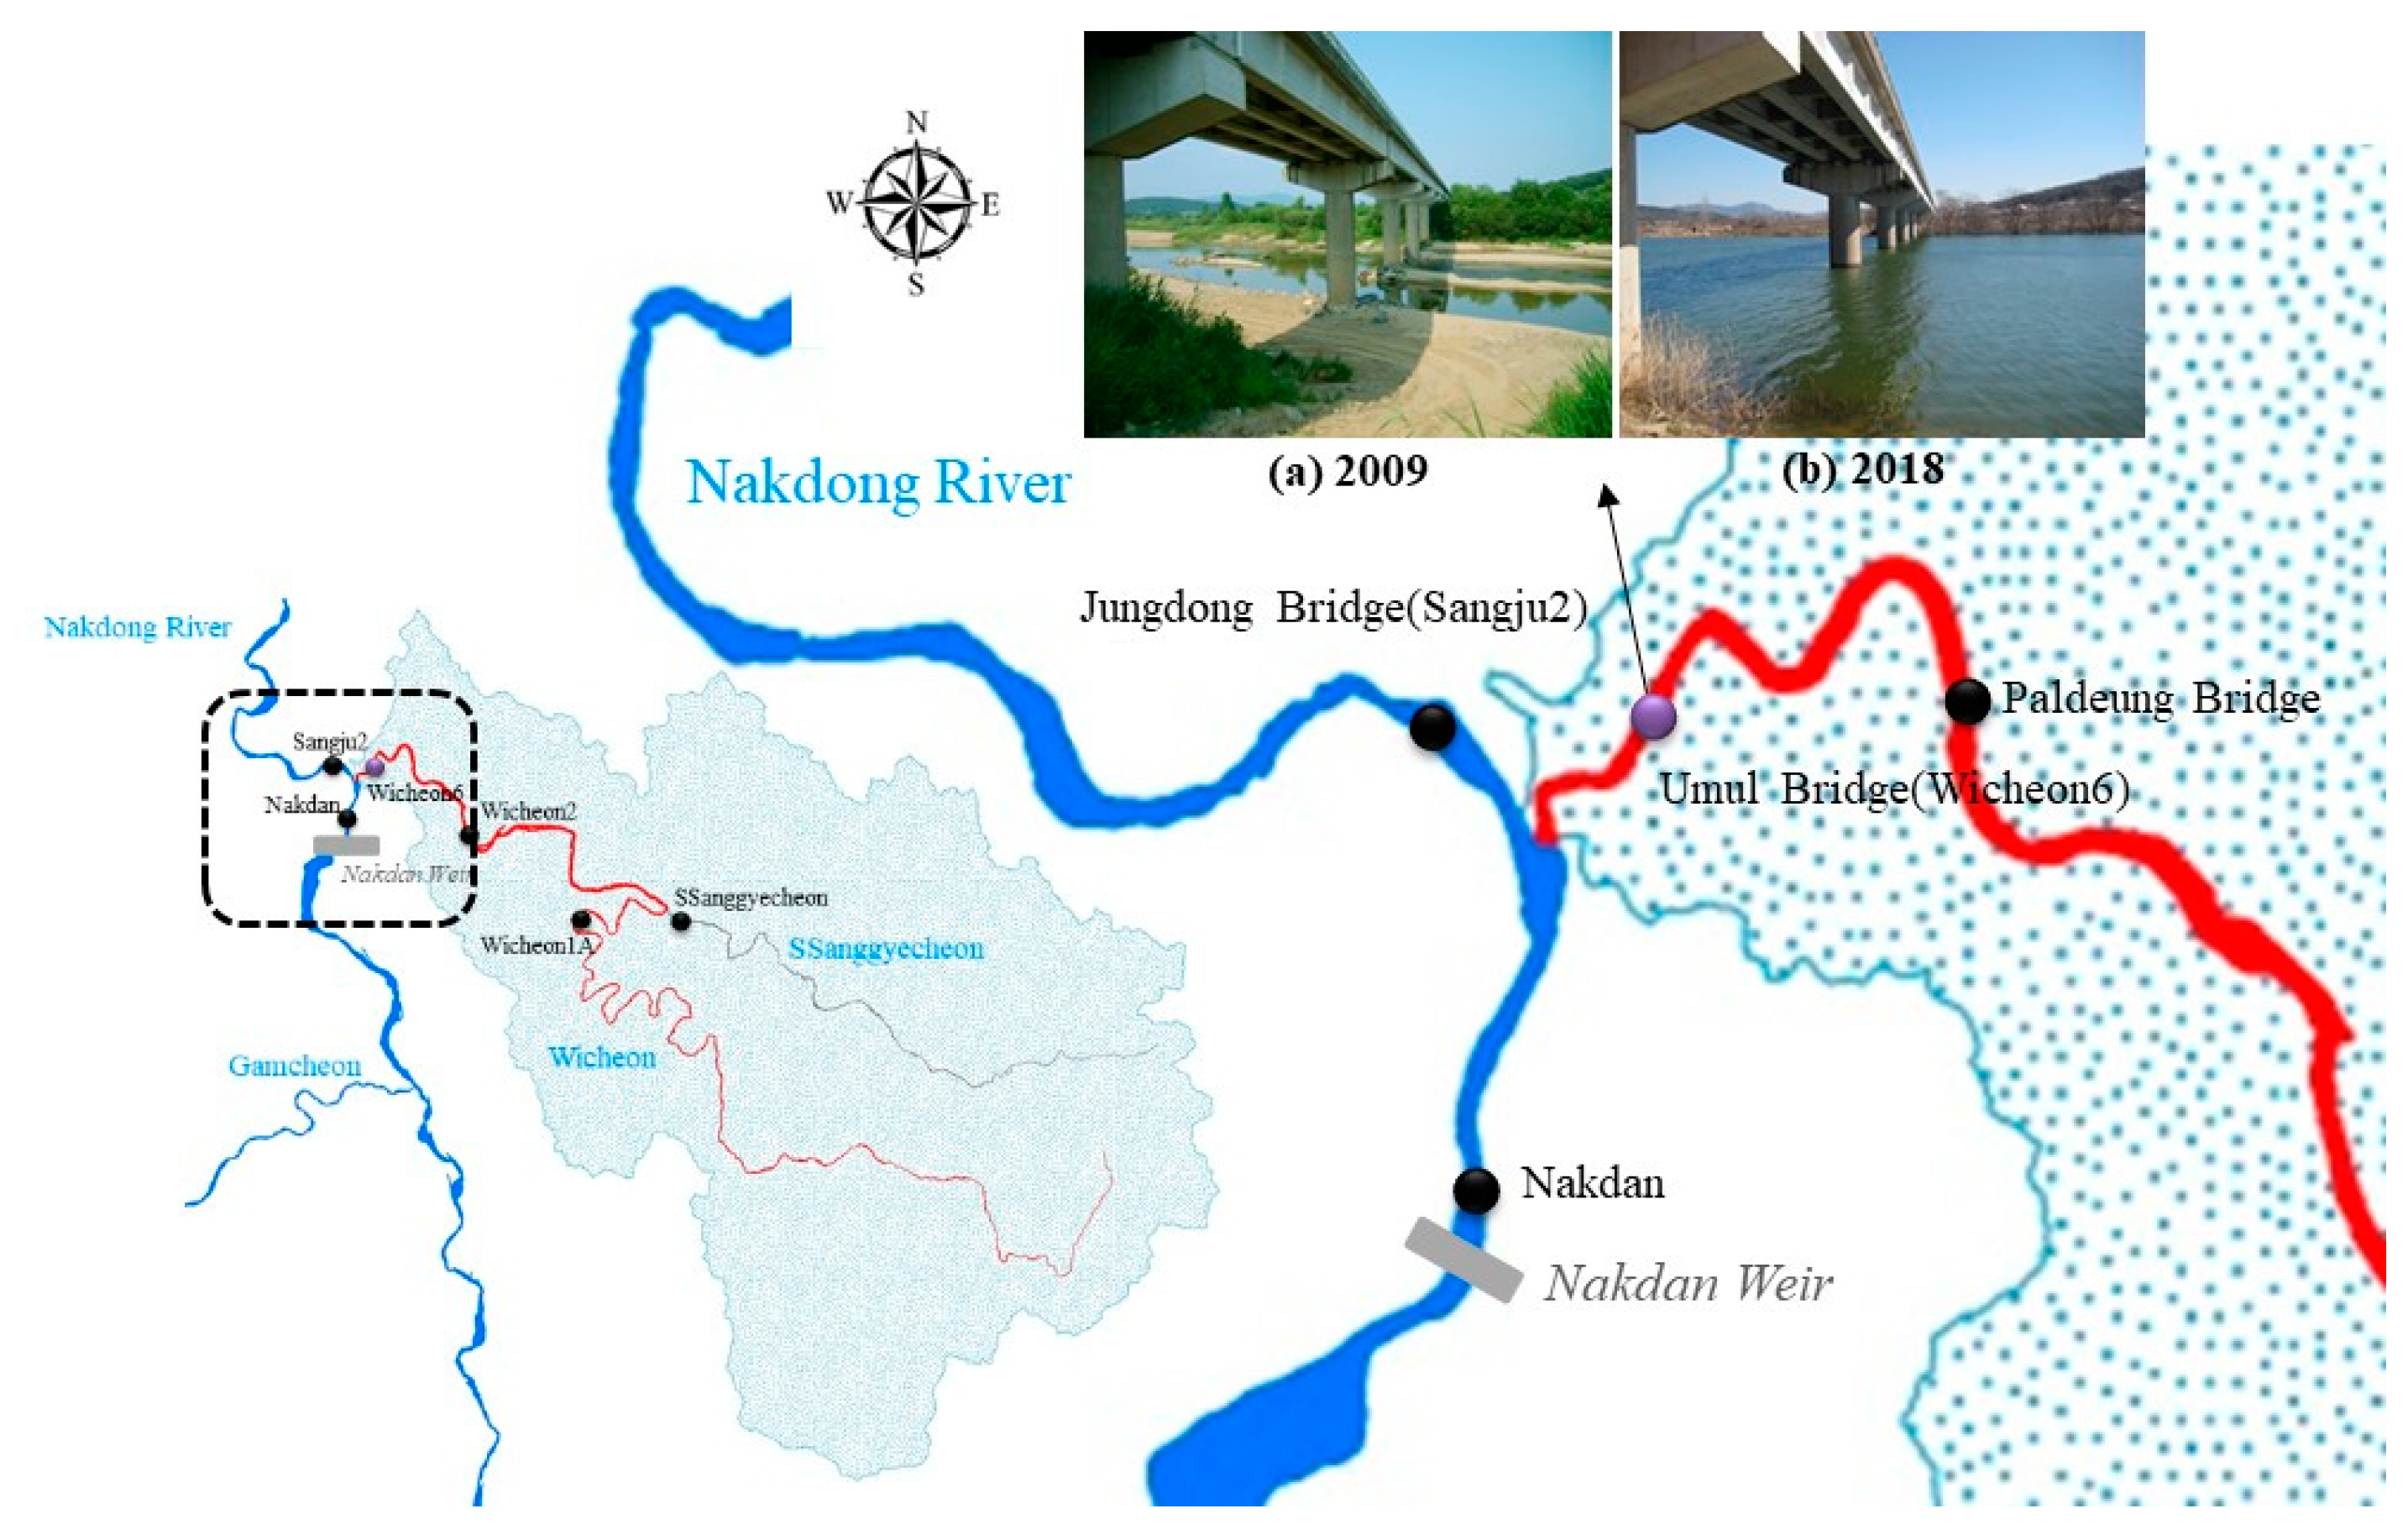
The Wicheon River is a primary tributary of the Nakdong River (
Figure 2) and various monitoring stations have been placed along both. The Sangju 2 water-quality monitoring station is located at the Jungdong Bridge, before the confluence of the Nakdong and the Wicheon; Nakdan water-quality monitoring station is located further downstream, 500 m upstream of the Nakdan Weir. The Wicheon 6 total load monitoring station is located just upstream of the mouth of the Wicheon River and a further three water-quality monitoring stations (Wicheon 2, Wicheon 1A, and Ssanggyecheon) located further upstream.
The water level near the near the mouth of the Wicheon River was much higher in 2018 than it was in 2009, before the installation of the Nakdan Weir in the Nakdong River (
Figure 2). Water from the mainstem may flow in reverse because of water level management operations at the Nakdan Weir and may thus affect data collected at the Wicheon 6 total load measuring station. Target water-quality values used in the measuring network policy are set at the watershed end point; if these values are exceeded, the local government may have to implement administrative measures such as limiting development. The water-quality target at the Wicheon 6 watershed has steadily been exceeded since 2012; some claim that this is an effect of the increase in water level caused by the Nakdan Weir rather than by higher pollution levels in the watershed.
Considerable administrative actions will be required if the water quality target continues to be exceeded. These actions including re-establishment of the TMDL system implementation plan, submission of annual implementation evaluation reports, re-examination of pollution sources and water quality, suspension of consultation on impact assessments for development projects, changes in the evaluation of implementation (if the allocated load is exceeded), and expansion of water-treatment plants and advanced treatment plants. If it is determined that these changes were caused by the Nakdan Weir, unit watershed target for water quality at the Wicheon 6 measuring point will need to be changed.
2.3. Methods
2.3.1. Spatiotemporal Water-Quality Monitoring
In South Korea, water quantity and quality had been managed separately until 2018, when a new law was passed requiring integrated management; this integration is currently in progress. It requires a simple and unified approach to the use of hydraulic, hydrologic, and water-quality equipment, although the results must not fall behind those of more difficult and complex techniques. In addition, we the methodology should be applicable to multiple rivers and stations with variable characteristics; therefore, a standardized approach including measuring equipment that would be available to anyone, was required.
Thus, we adopted EC as a field measurement as it was already being monitored by the existing network. This parameter was recorded weekly from March to November 2018 using YSI equipment and an RTK-GPS (Real-time kinematic - Global Positioning System) unit at four sites: Sangju 2, Nakdan Weir, Wicheon 6, and Paldeung Bridge (
Figure 2). The resulting data were analyzed using Tecplot 360. The EC values of distilled water, rainwater, tap water, and seawater are approximately 0 uS/cm, 10–20 uS/cm, 100 uS/cm, and 50,000 uS/cm, respectively, while that of rivers ranges from 10–1000 uS/cm [
8].
2.3.2. Self-Organizing Maps (SOM) and Locally Weighted Scatterplot Smoothing (LOWESS)
The SOM method is an unsupervised learning neural network model based on artificial neurons; its advantages include the ability to perform non-linear relational analysis, understand relationships with no mathematical knowledge, update data easily and quickly, and integrate multiple variables [
9]. We performed SOM analysis in the Matlab environment using the functions and factors provided by the SOM toolbox [
10];
http://www.cis.hut.fi/projects/somtoolbox). A time series pattern analysis was performed using the monthly average EC values observed at Sangju 2, Nakdan, Wicheon 6, and Wicheon 2 from January 2012 to December 2017.
The LOWESS method use non-parametric smoothing to reflect an appropriate data trend without limiting the shape of the regression to a straight line when there is a change in the trend during a research period. Thus, it can complement the shortcoming of linear trends that only show monotonic variations and analyze the trend in the observed time series data to show general trends and behaviors. Therefore, we used the function embedded in Sigma plot 12.5 to analyze biological oxygen demand (BOD) and total phosphorous (TP) data measured weekly from January 2008 to December 2017 at the Sangju 2 and Wicheon 6 sites.
2.3.3. Load Duration Curve (LDC)
In the United States, an LDC is used to reflect variable water quality correlated with different river flow rates in the preparation of TMDL plans. It is a very useful tool for analyzing water-quality target excesses when searching for appropriate watershed management methods [
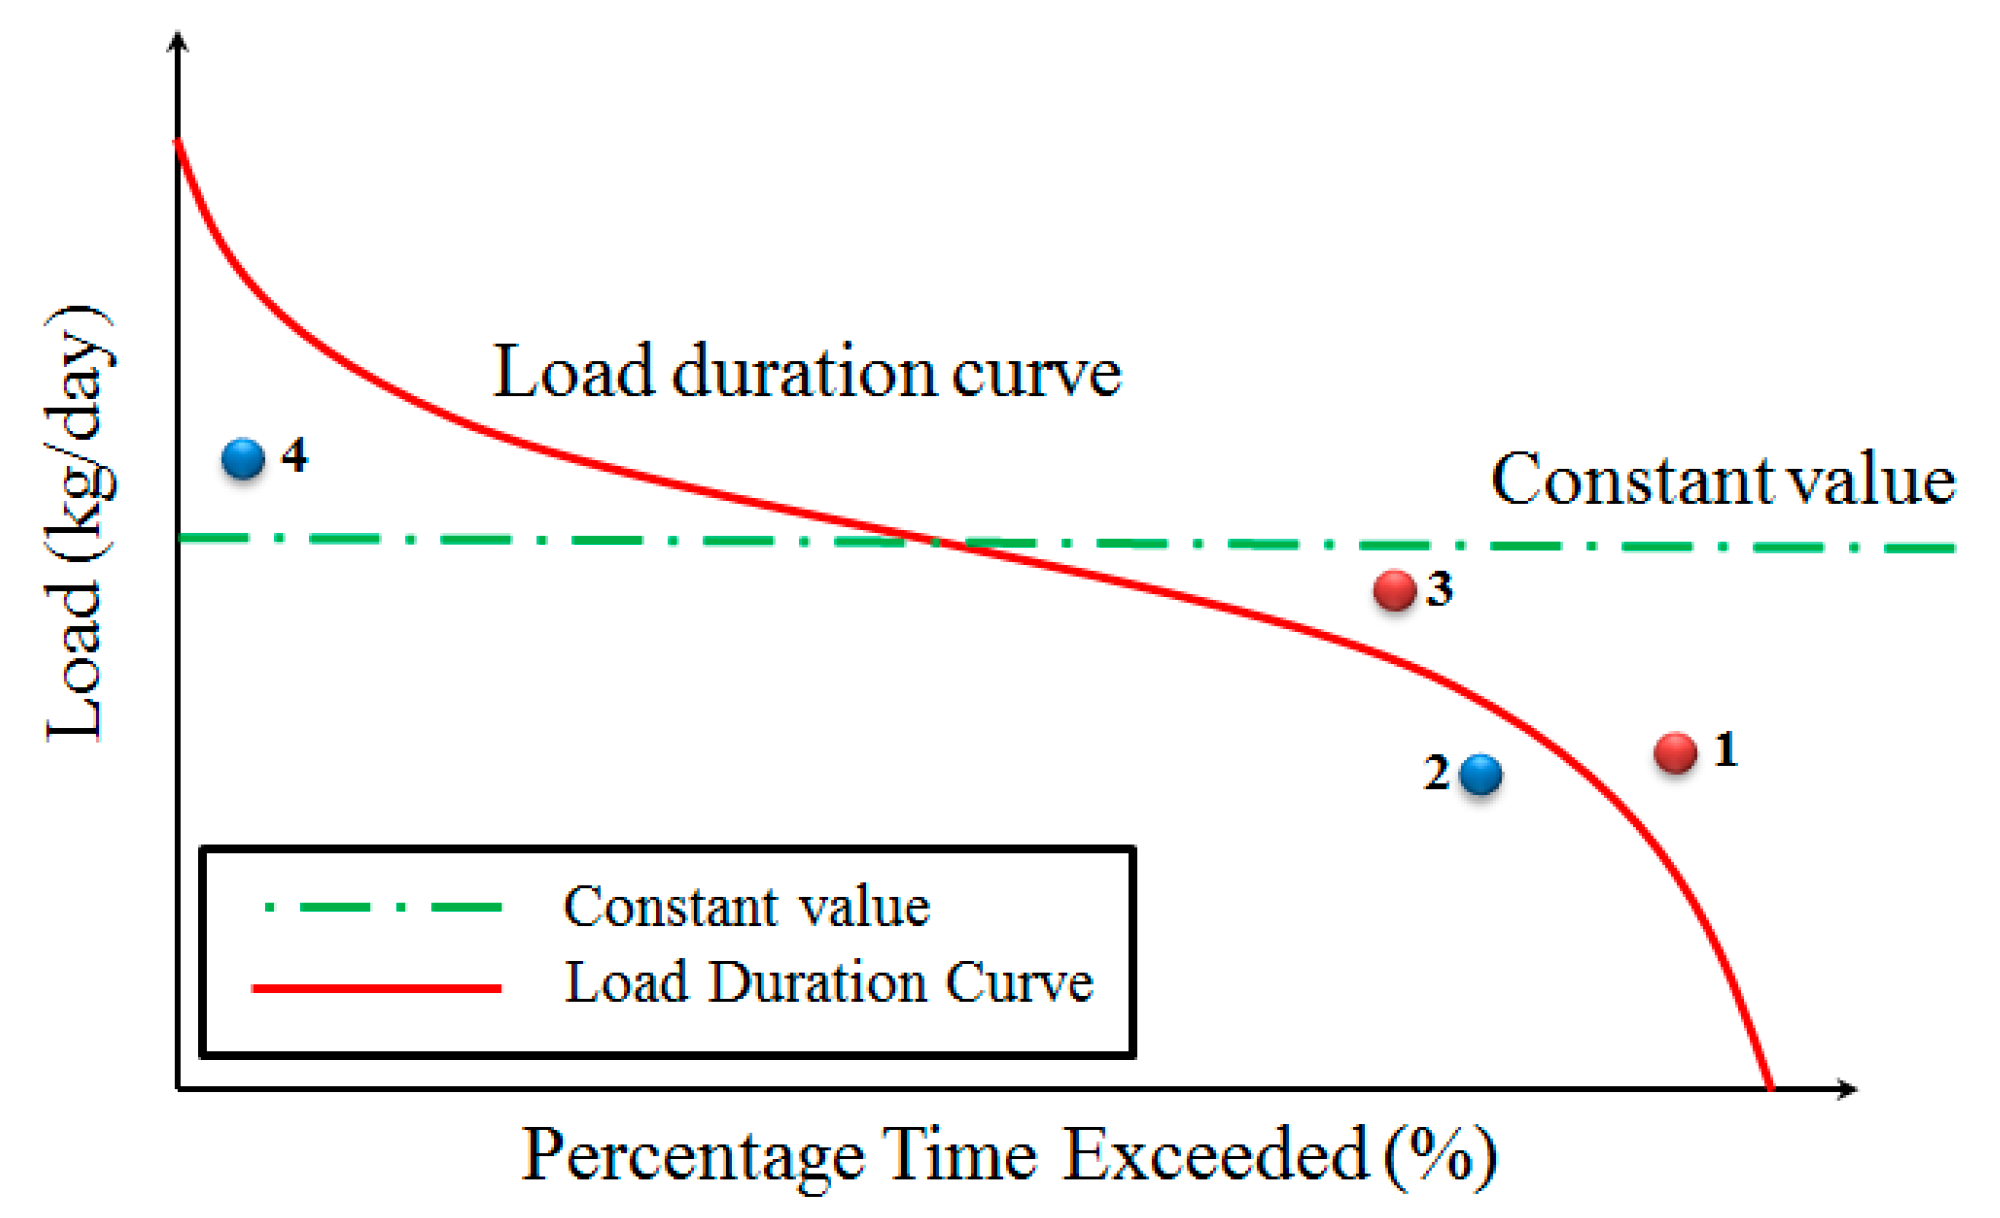
11]. However, South Korea uses the three-year average of water quality values, not flow rates, to evaluate water pollution regulation in middle region watersheds. This approach considers only the concentration of pollutants, and not their load, meaning that it cannot fully capture their effect on a river. This is because a low concentration can have a significant effect on a river if the load is large; similarly, a high concentration can have a minor effect on the river if the load is small. The LDC method reflects this and is, thus, more rational than the three-year average method currently in use in Korea.
As an illustration of this,
Figure 3 shows if the average three-year water quality is used as the monitoring parameter, points 1, 2, and 3 do not exceed the water-quality target while point 4 does. However, if an LDC is used, points 1 and 3 exceed it whereas points 2 and 4 do not. Therefore, an LDC method with BOD and TP as the water quality parameters is being introduced to complement the target water quality assessment for TMDL, and we have chosen to analyze the LDC method as well.
2.3.4. Numerical Modeling
The applicability of the HEC-RAS model, developed by the United States Army Corps of Engineers, has been proven in many settings; therefore, we used this model to analyze the boundary of the maximum tributary backwater effect. A roughness coefficient was used as the numerical simulation parameter, as proposed in the management plans for the Nakdong River [
12] and the Wicheon River [
13]. There can be large differences in the results from numerical simulations for river flow analysis depending on whether the flow is unsteady or steady. Steady flow analysis derives a larger value for the peak flow rate than unsteady flow analysis does because the former does not consider flow variations or reflect flow transitions. Therefore, while it does not cause any problem in terms of safe riverbank design, it can cause problems in terms of the cost of design and efficient river operation. Woo [
14] and the American Society of Civil Engineers (ASCE) [
15] recommend the use of an unsteady flow analysis if a riverbed slope is very gentle and a strong backwater effect appears.
Therefore, to verify the reliability of the roughness coefficient in the situation being studied, we conducted used the HEC-RAS model to an unsteady flow analysis as follows. We used the topographical section suggested in the management plans for the two rivers [
12,
13]. For the one-dimensional channel tracking, the time step was set at 1 min to stabilize the hydraulic model with regard to upstream boundary conditions such as time series rainfall, water level, and flow rate. The minimum flow rate from the upstream was set at 55 m
3/s for the section of the Nakdong River before the confluence with the Wicheon, 62 m
3/s for the section after the confluence, and 7 m
3/s in the Wicheon itself. Flow rates below the minimum were replaced with the minimum. The boundary condition was the situation in which the management level of the Nakdan Weir was temporarily changed from EL 40 m to EL 37 m (EL: elevation).
The multidimensional EFDC model was adopted to analyze the reverse flow range of tributaries of the Nakdong River. This multivariable finite difference model, developed by the Virginia Institute of Marine Science [
16], simulates flow and material transport and is an official model of the United States Environmental Protection Agency. It has many points in common with the model by Blumberg and Mellor [
17], in terms of theory and numerical analysis; the latter has been adopted as the water quality forecast model for the National Institute of Environmental Research and is being improved continually. The model’s grid system uses Cartesian or curvilinear coordinate systems horizontally and a
-coordinate system vertically. One advantage of this model is its ability to process intertidal zones in shallow waters using the mass conservation method, making it easily applicable to the coast and rivers of South Korea. Its equations for continuity and motion are as follows:
where
is the total depth (sum of the depth below (
(m)) and above (
(m)) the reference surface);
u and
v are the horizontal flow velocities (m/s) on the
x- and
y-axes, respectively;
f is the Coriolis parameter;
is the flow velocity;
g is gravitational acceleration (m/s
2);
is the floor friction coefficient;
is the horizontal turbulent viscosity coefficient (m
2/s);
is the inflow/outflow term of fluid from outside (kg m/s);
is density (kg/m
3);
and
are the wind stress on the
x- and
y-axes, respectively;
C is the horizontal mixture constant;
and
are the grid sizes (m) on the
x- and
y-axes, respectively; and
n is Manning’s roughness coefficient.
3. Results and Discussion
3.1. Spatiotemporal Water-Quality Monitoring
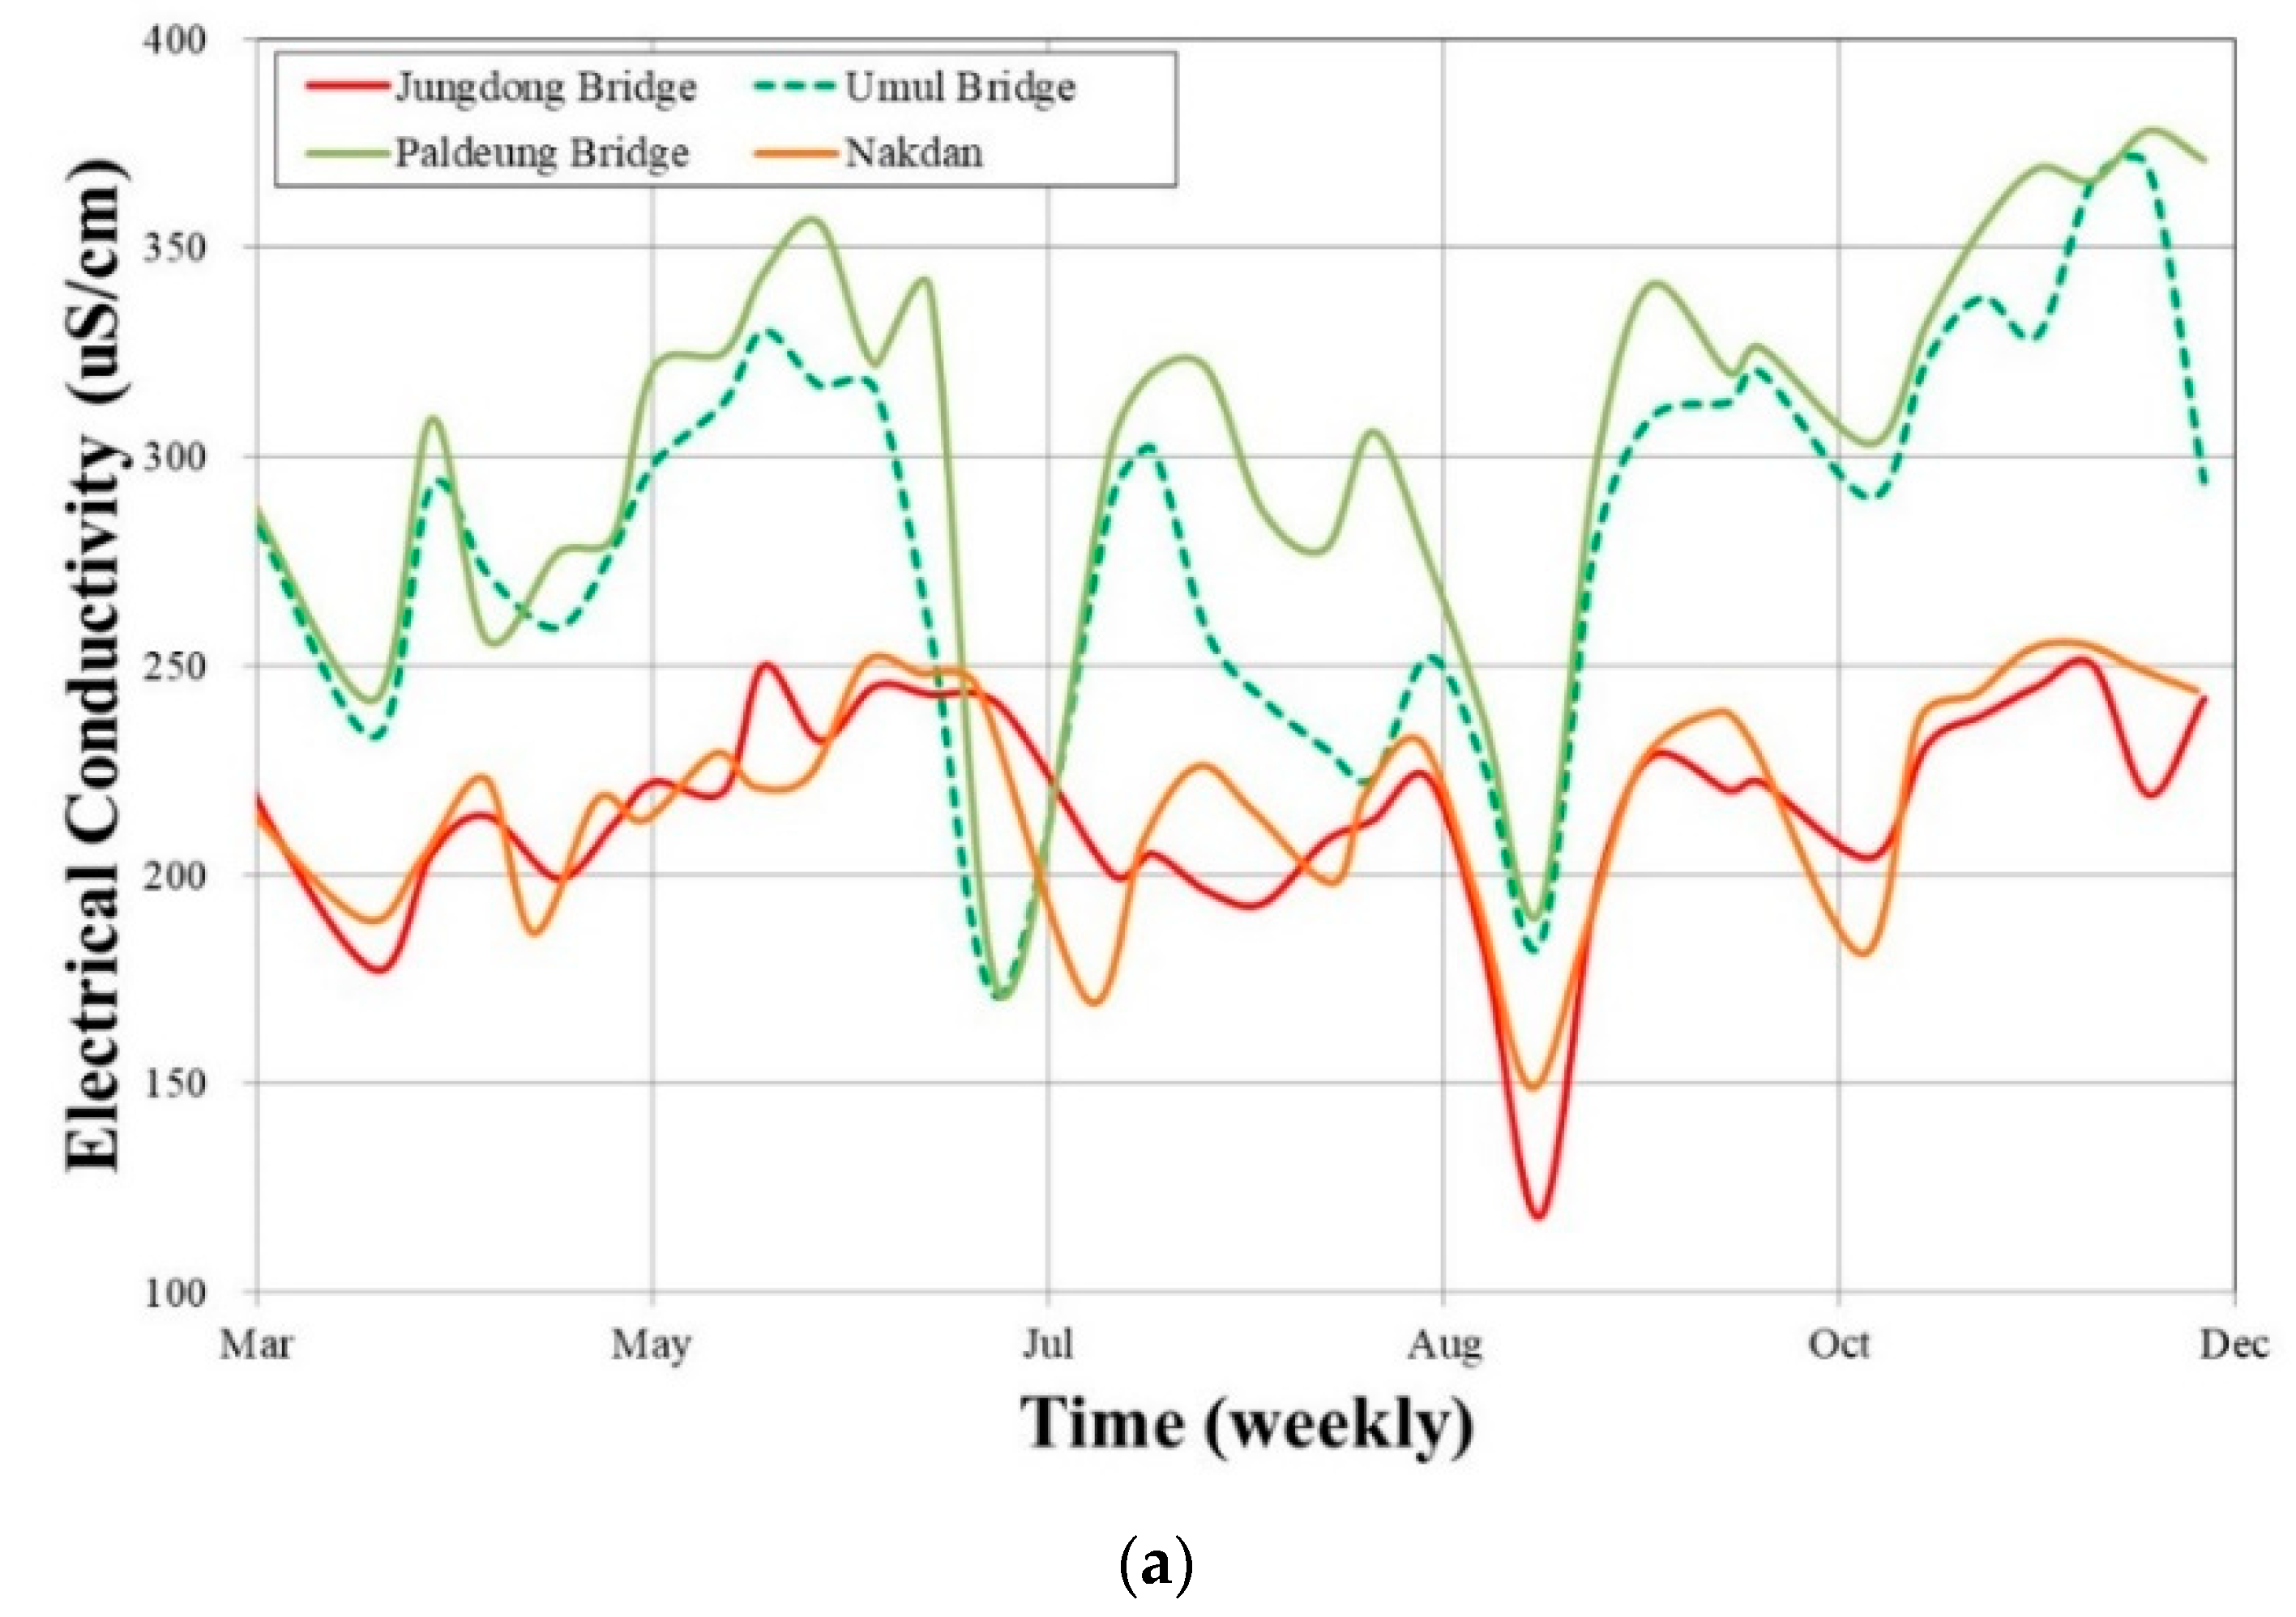
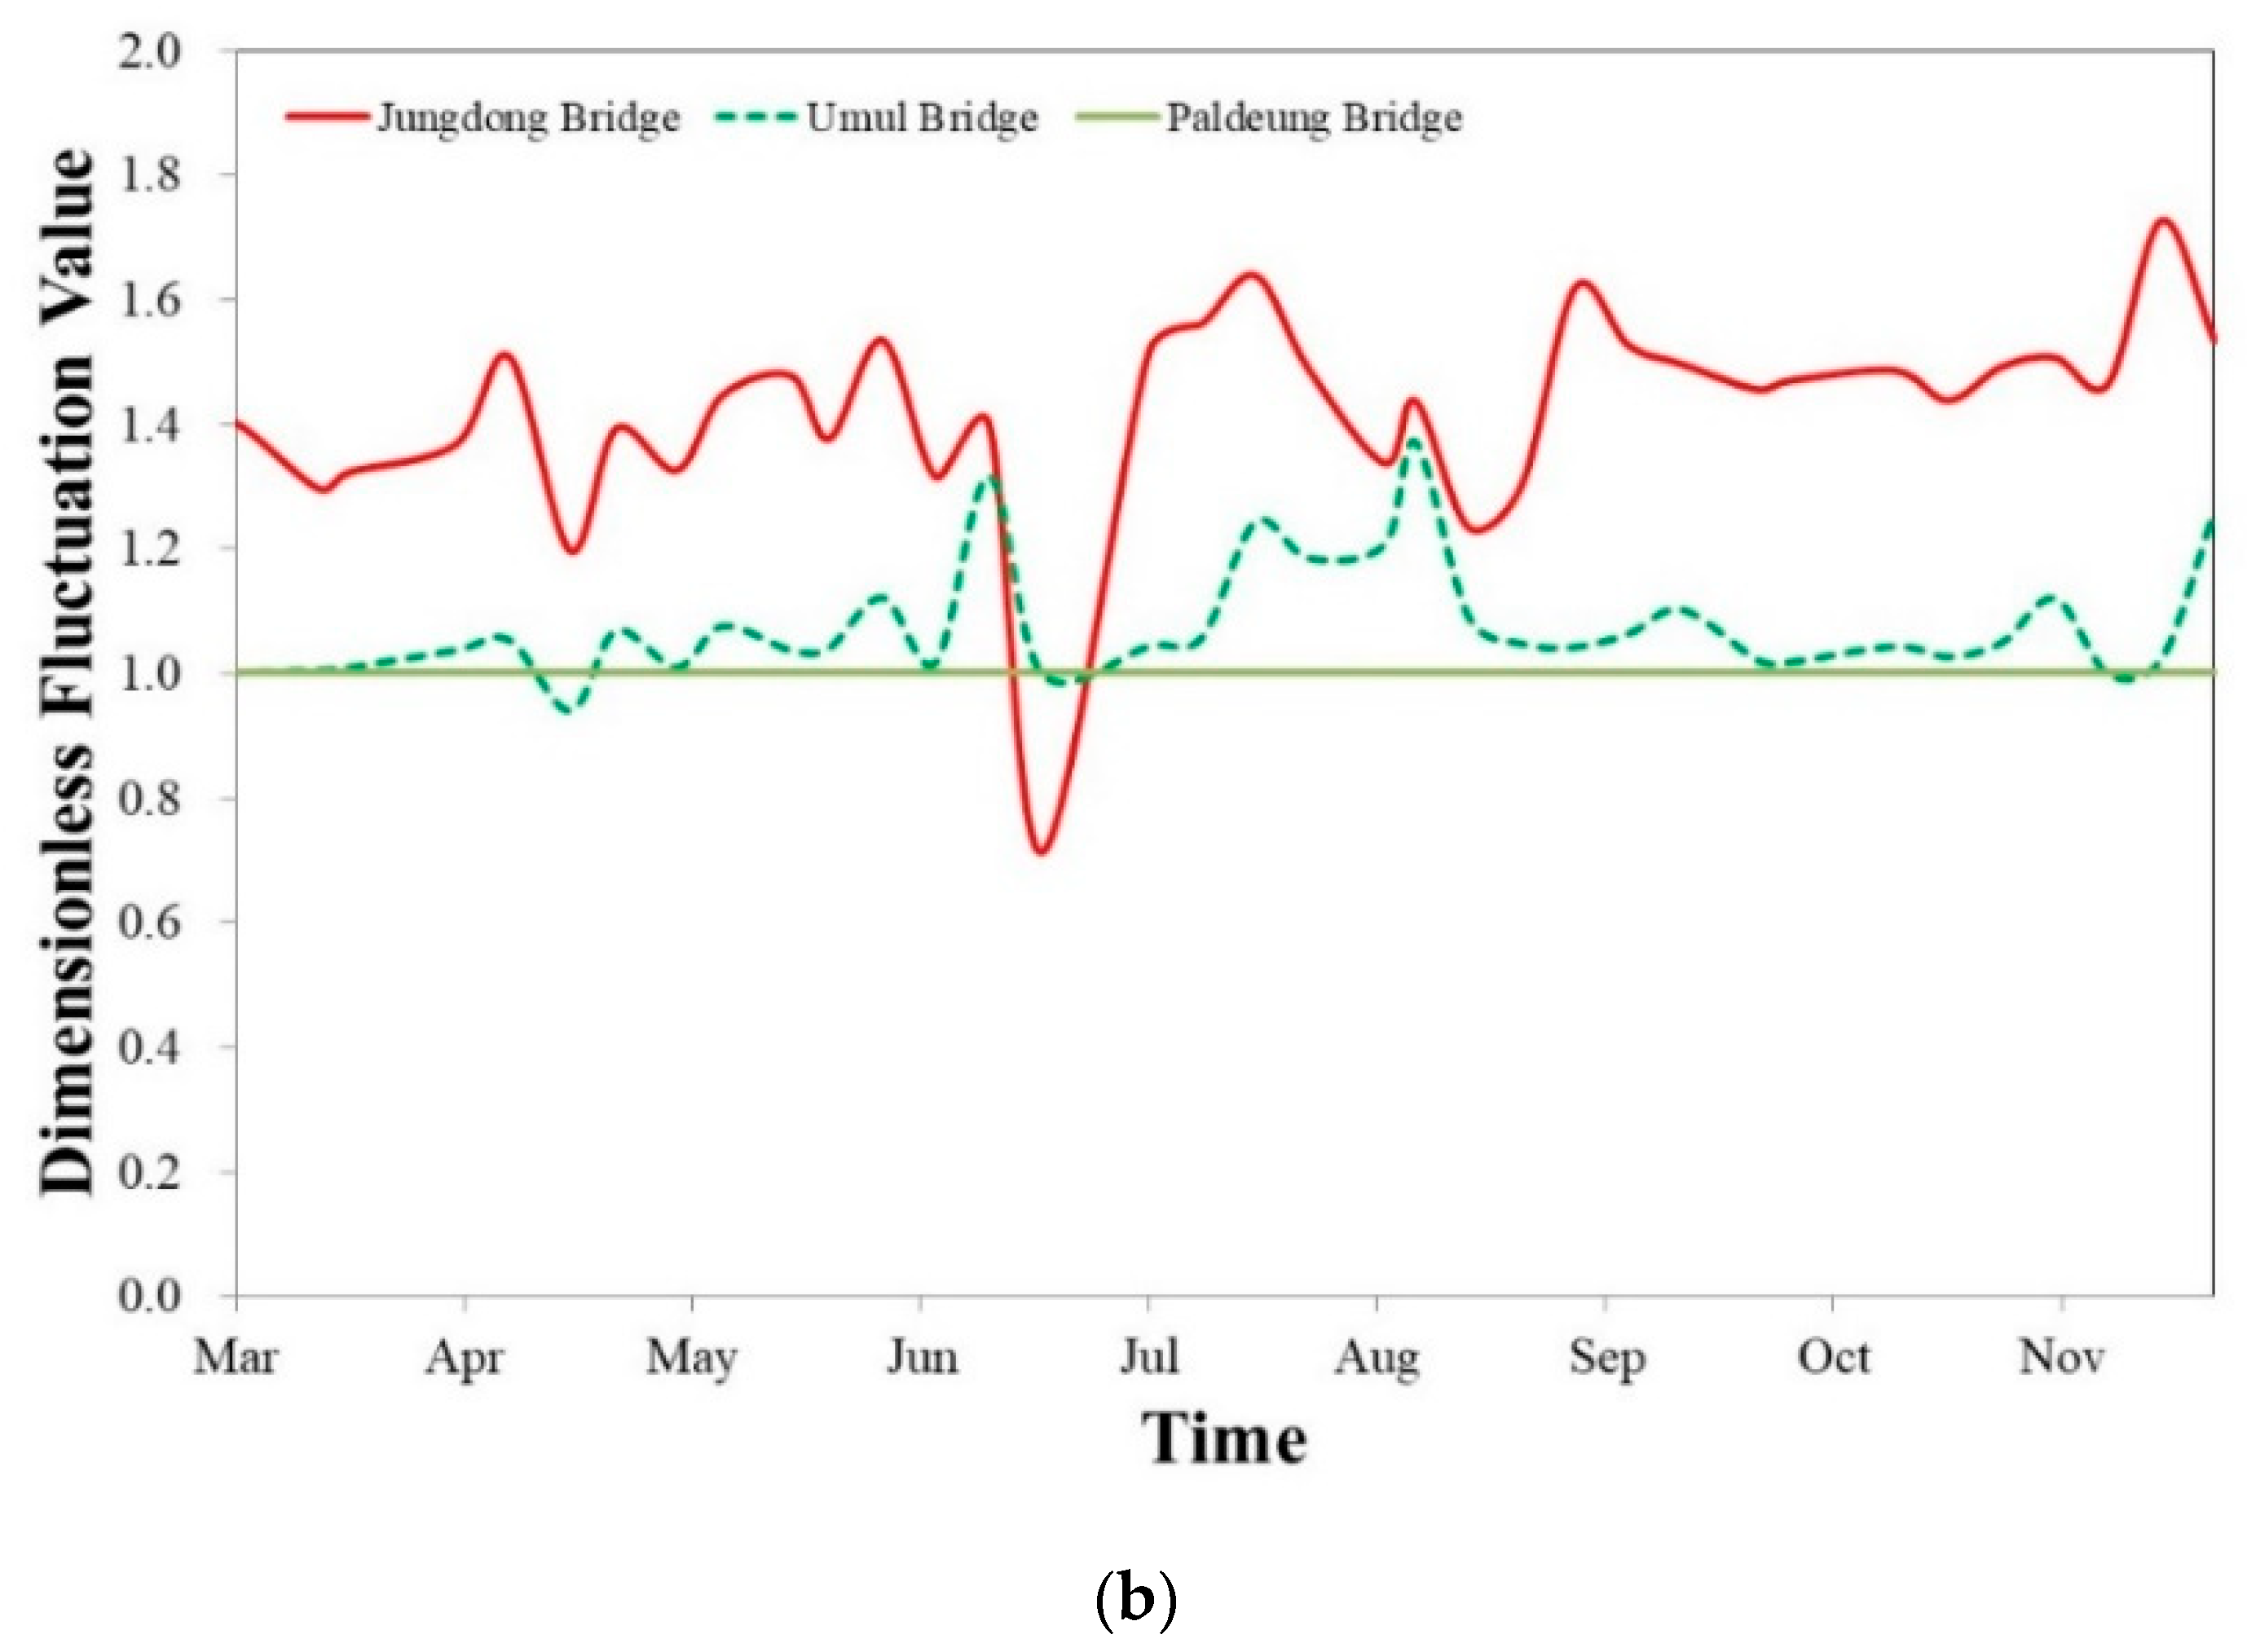
The weekly EC results measured at the four sites are shown in
Figure 4a and their dimensionless trends are shown in in
Figure 4b. Jungdong Bridge and Umul Bridge had similar dimensionless trends until 14 June; however, it is clear that water from the Wicheon affected the Nakdong during the rainy season from late June to July. By August, after the rainy season ended, these trends became similar again.
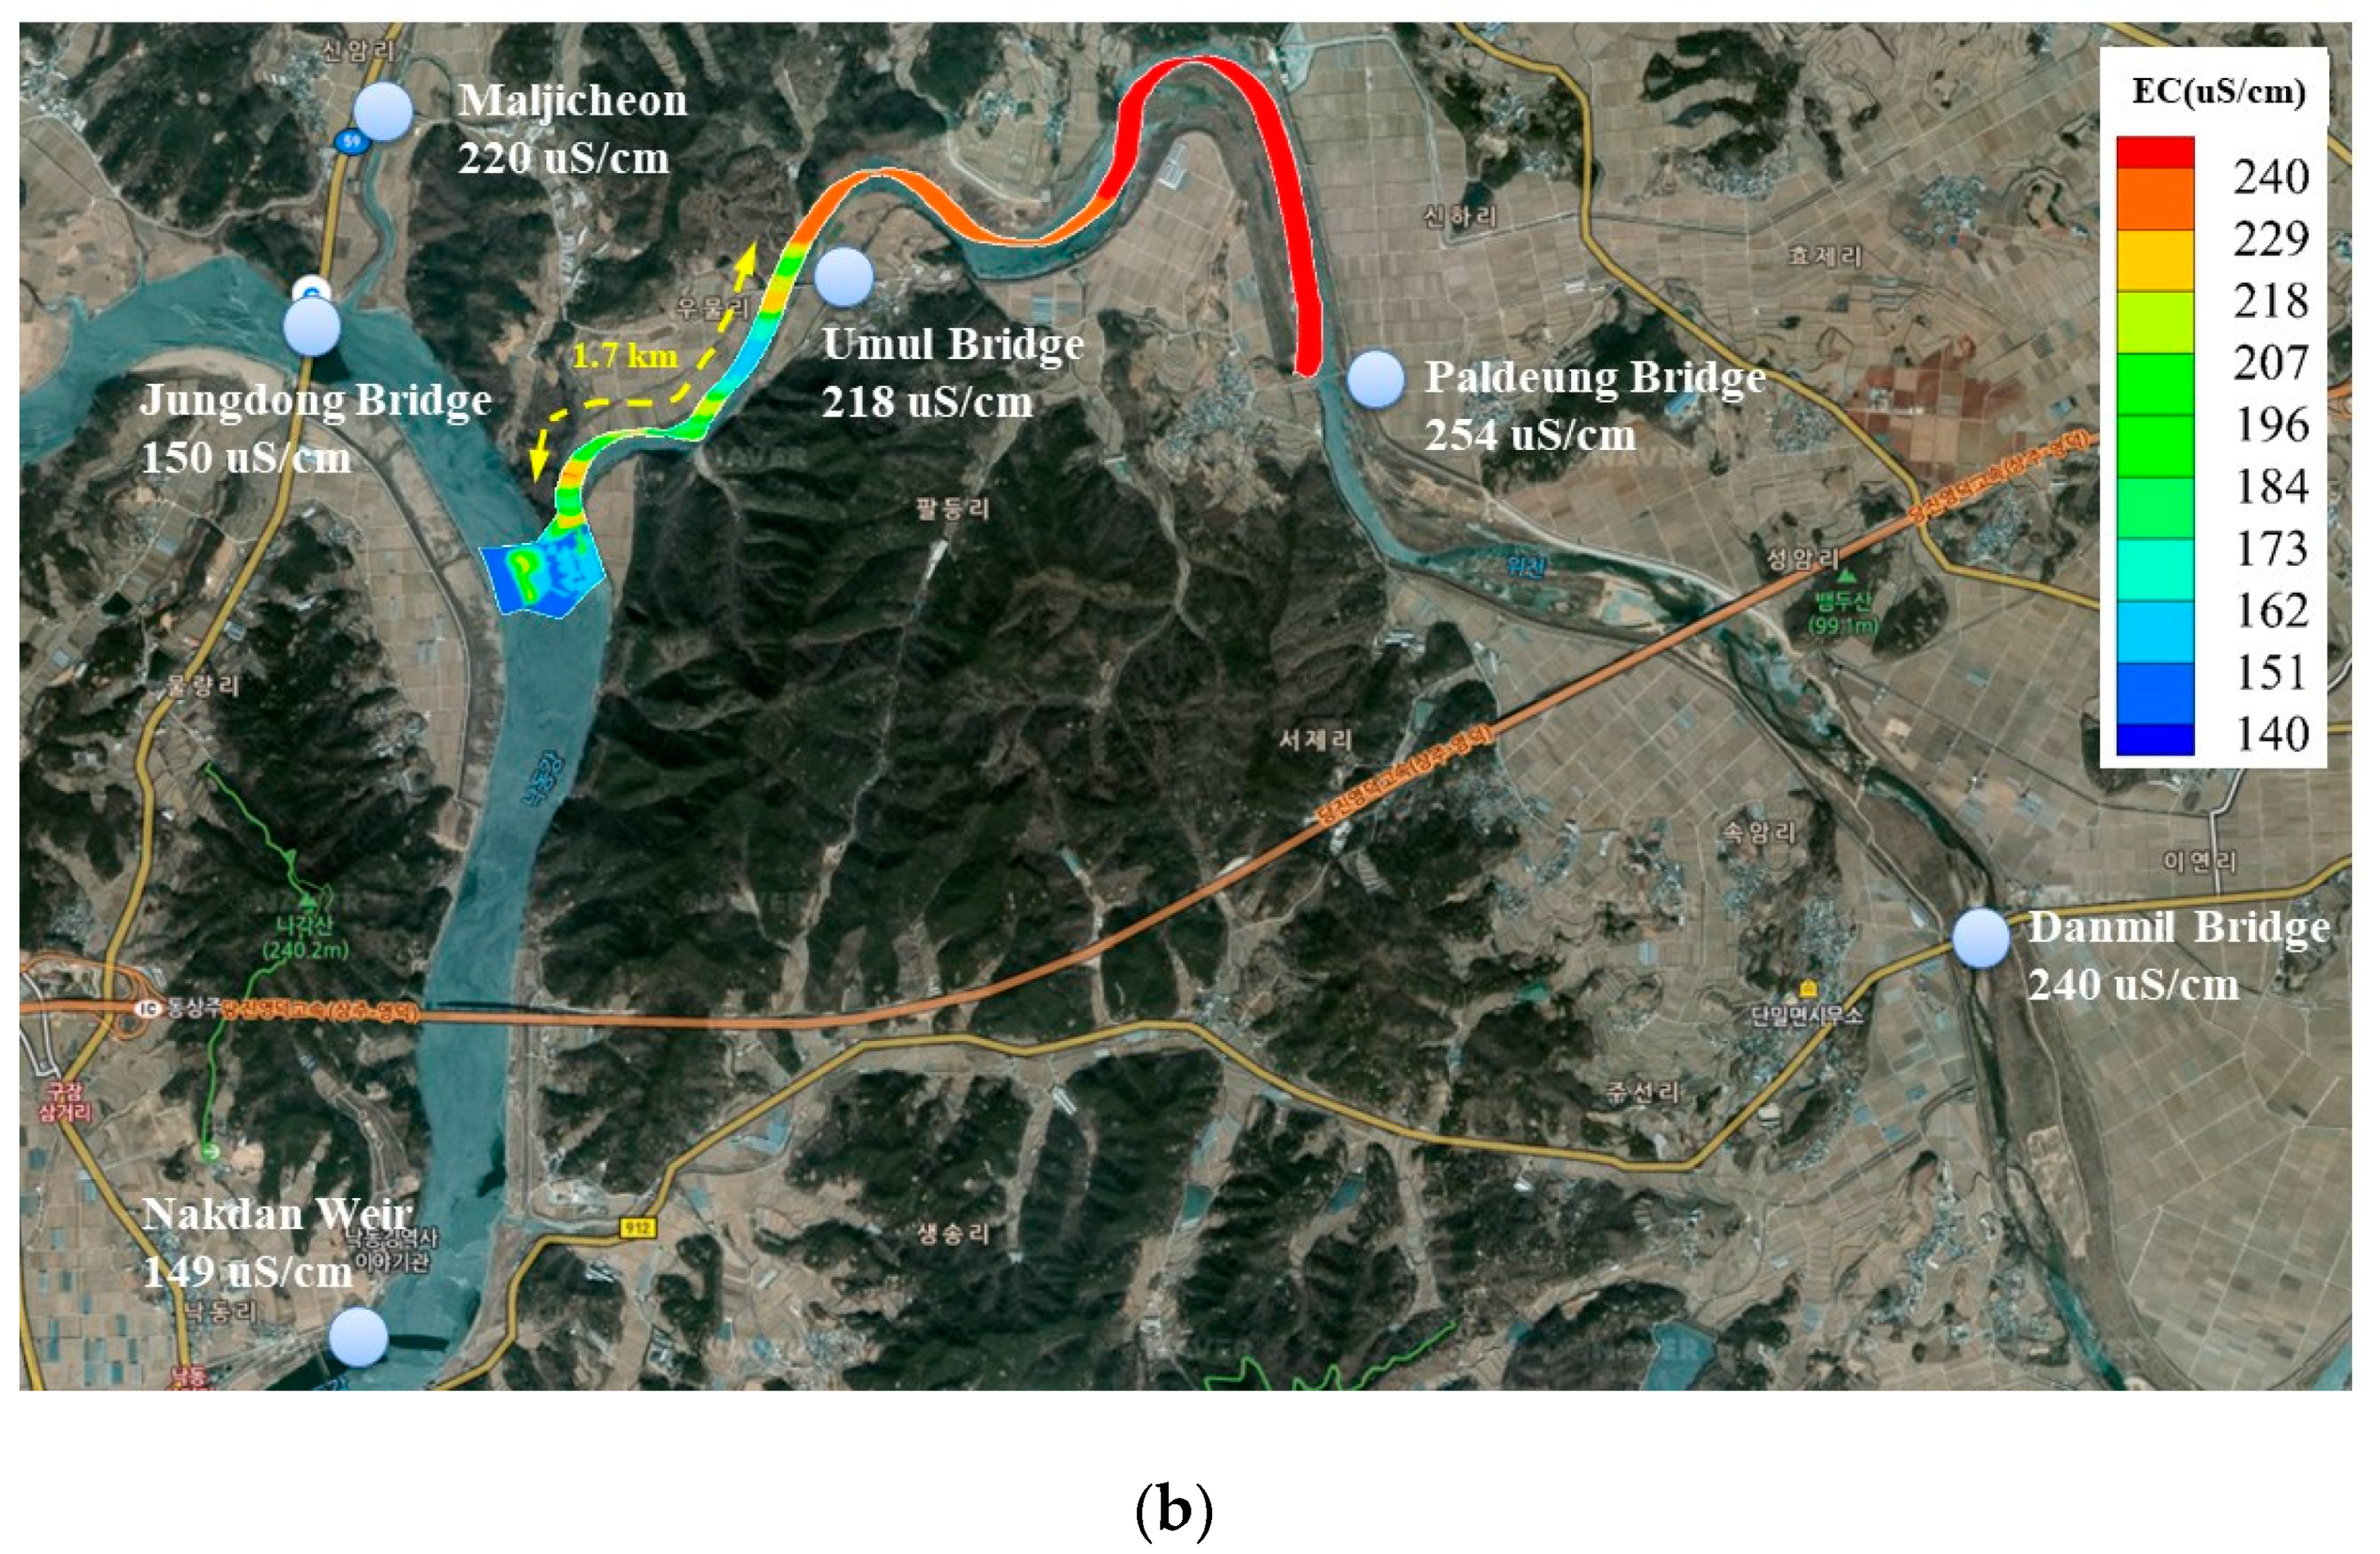
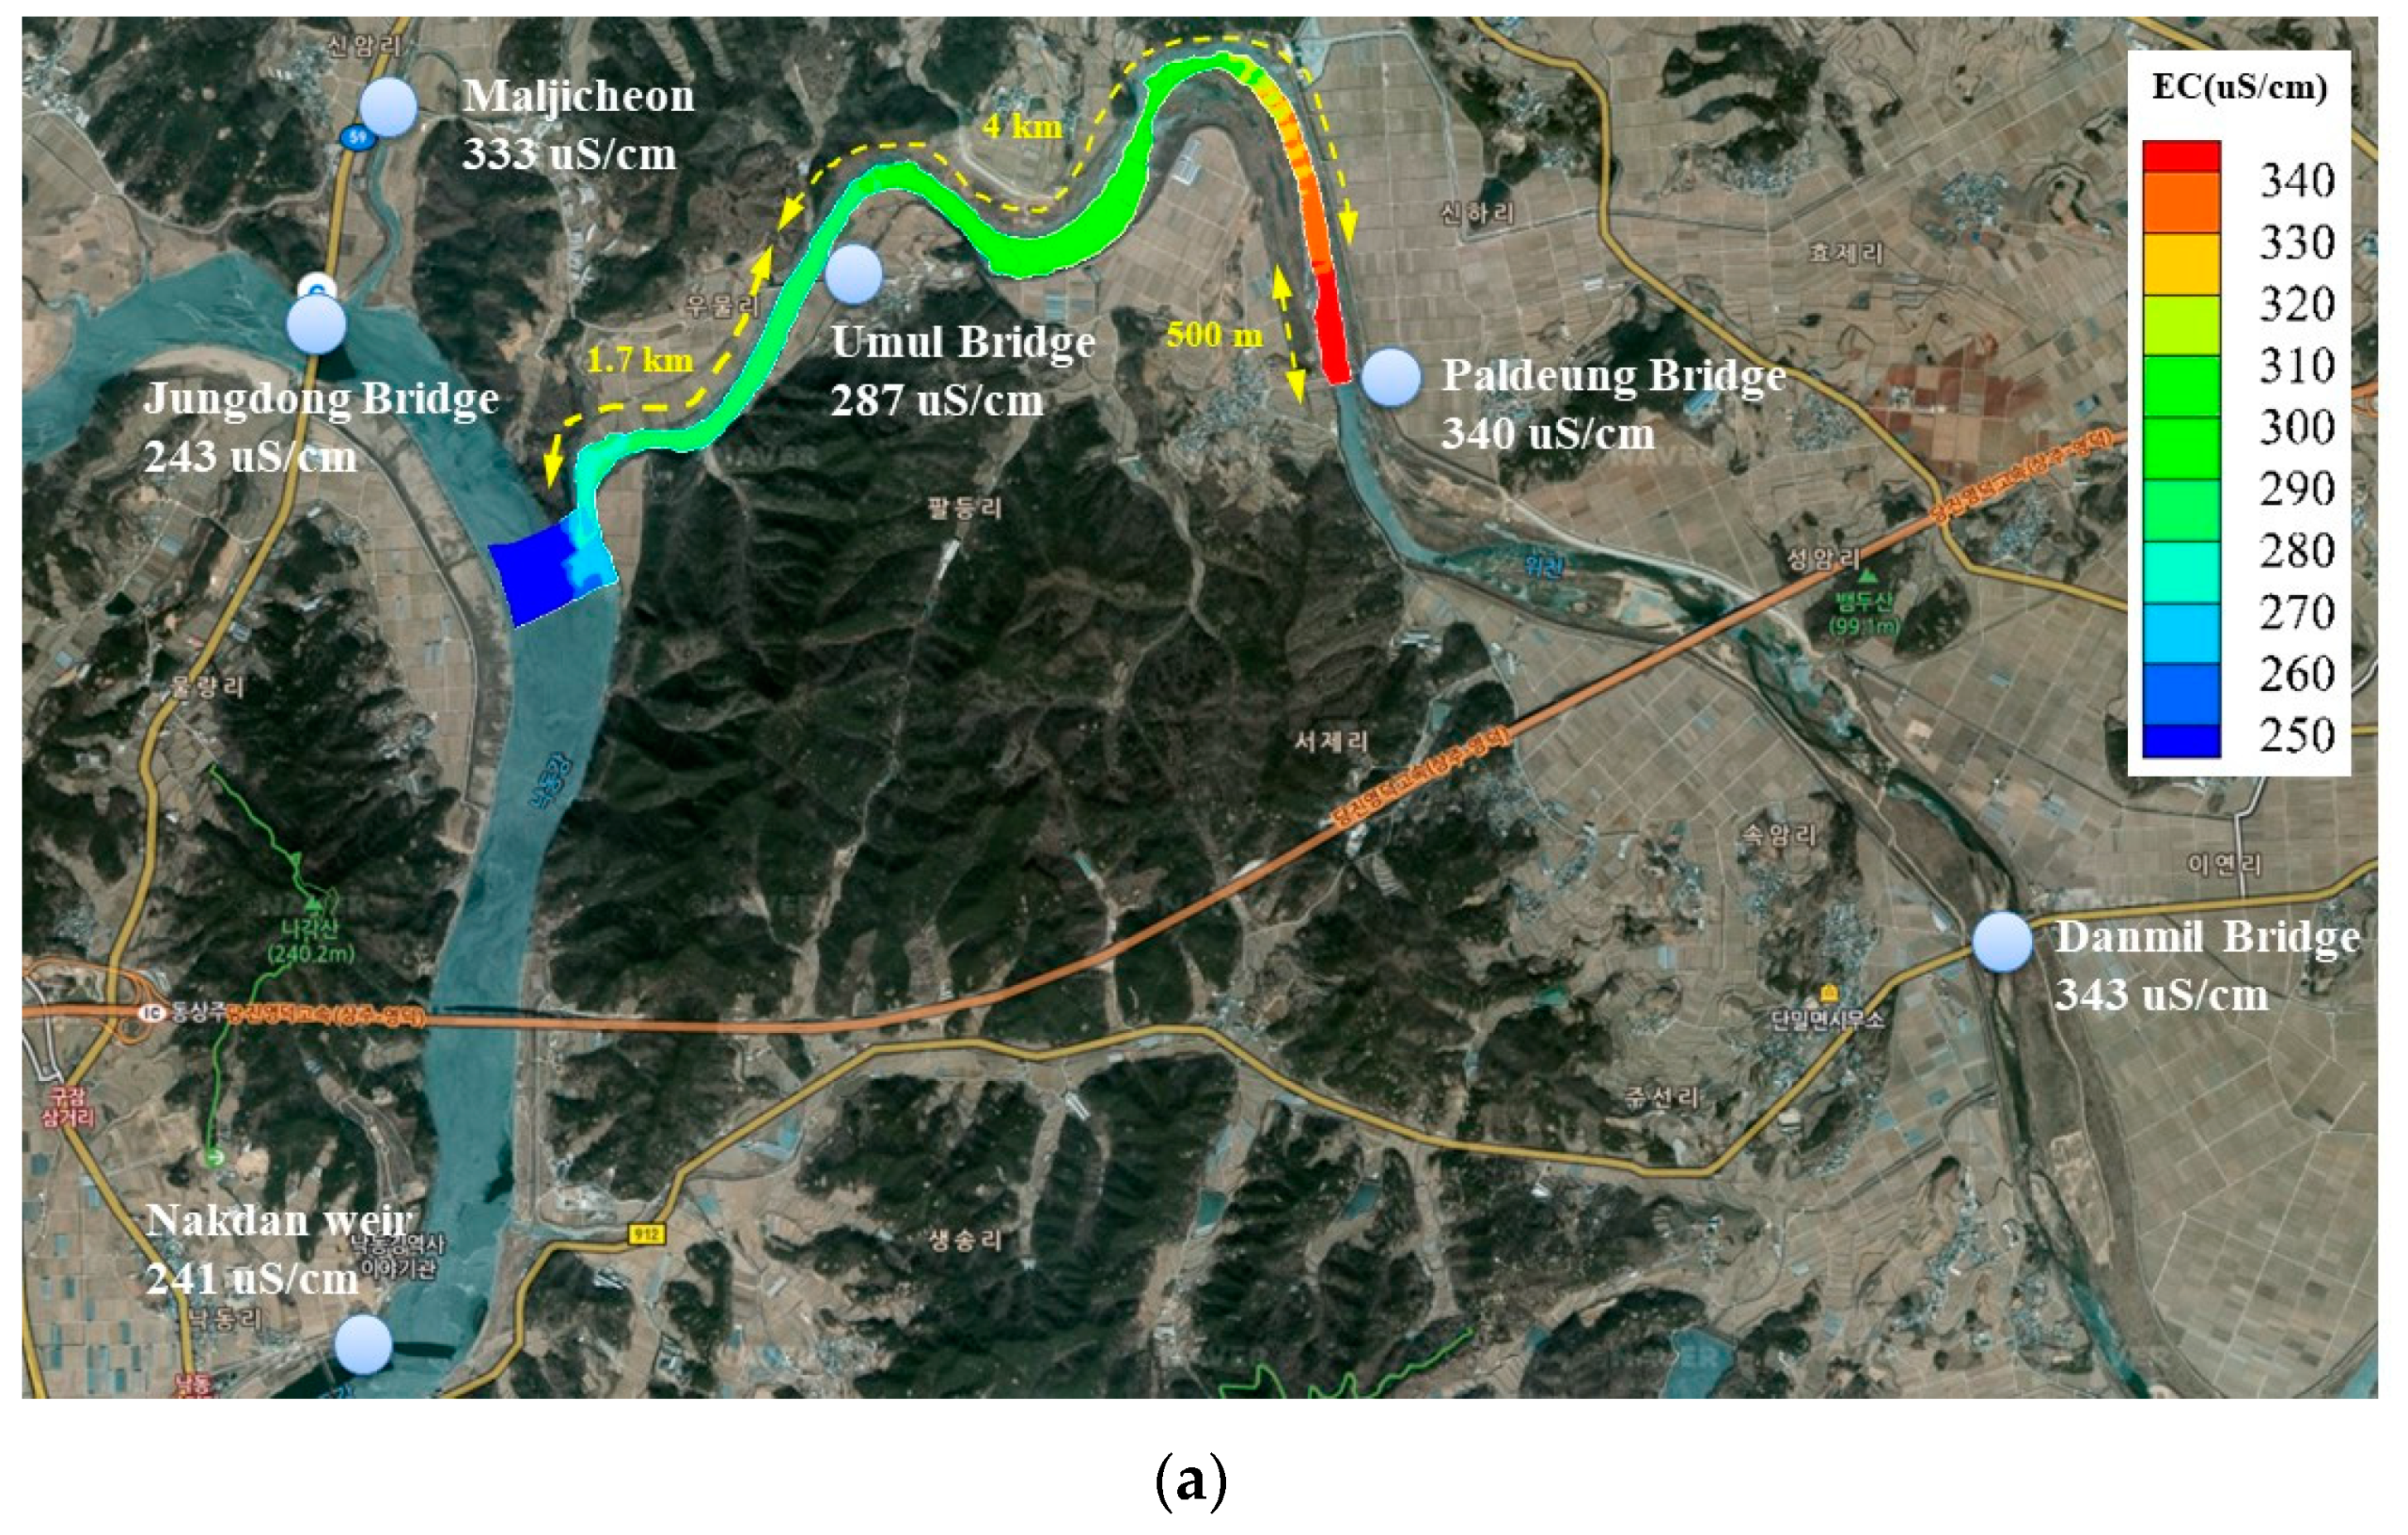
The results of spatial measurement of EC on 21 June 2018 (
Figure 5a) show that the Nakdong River flowed into the Wicheon, mixing the water bodies as far upstream as 500 m downstream of the Paldeung Bridge. The measurements from 10 October 2018 (
Figure 5b) shows similar backflow as far as the Umul Bridge.
3.2. SOM and LOWESS
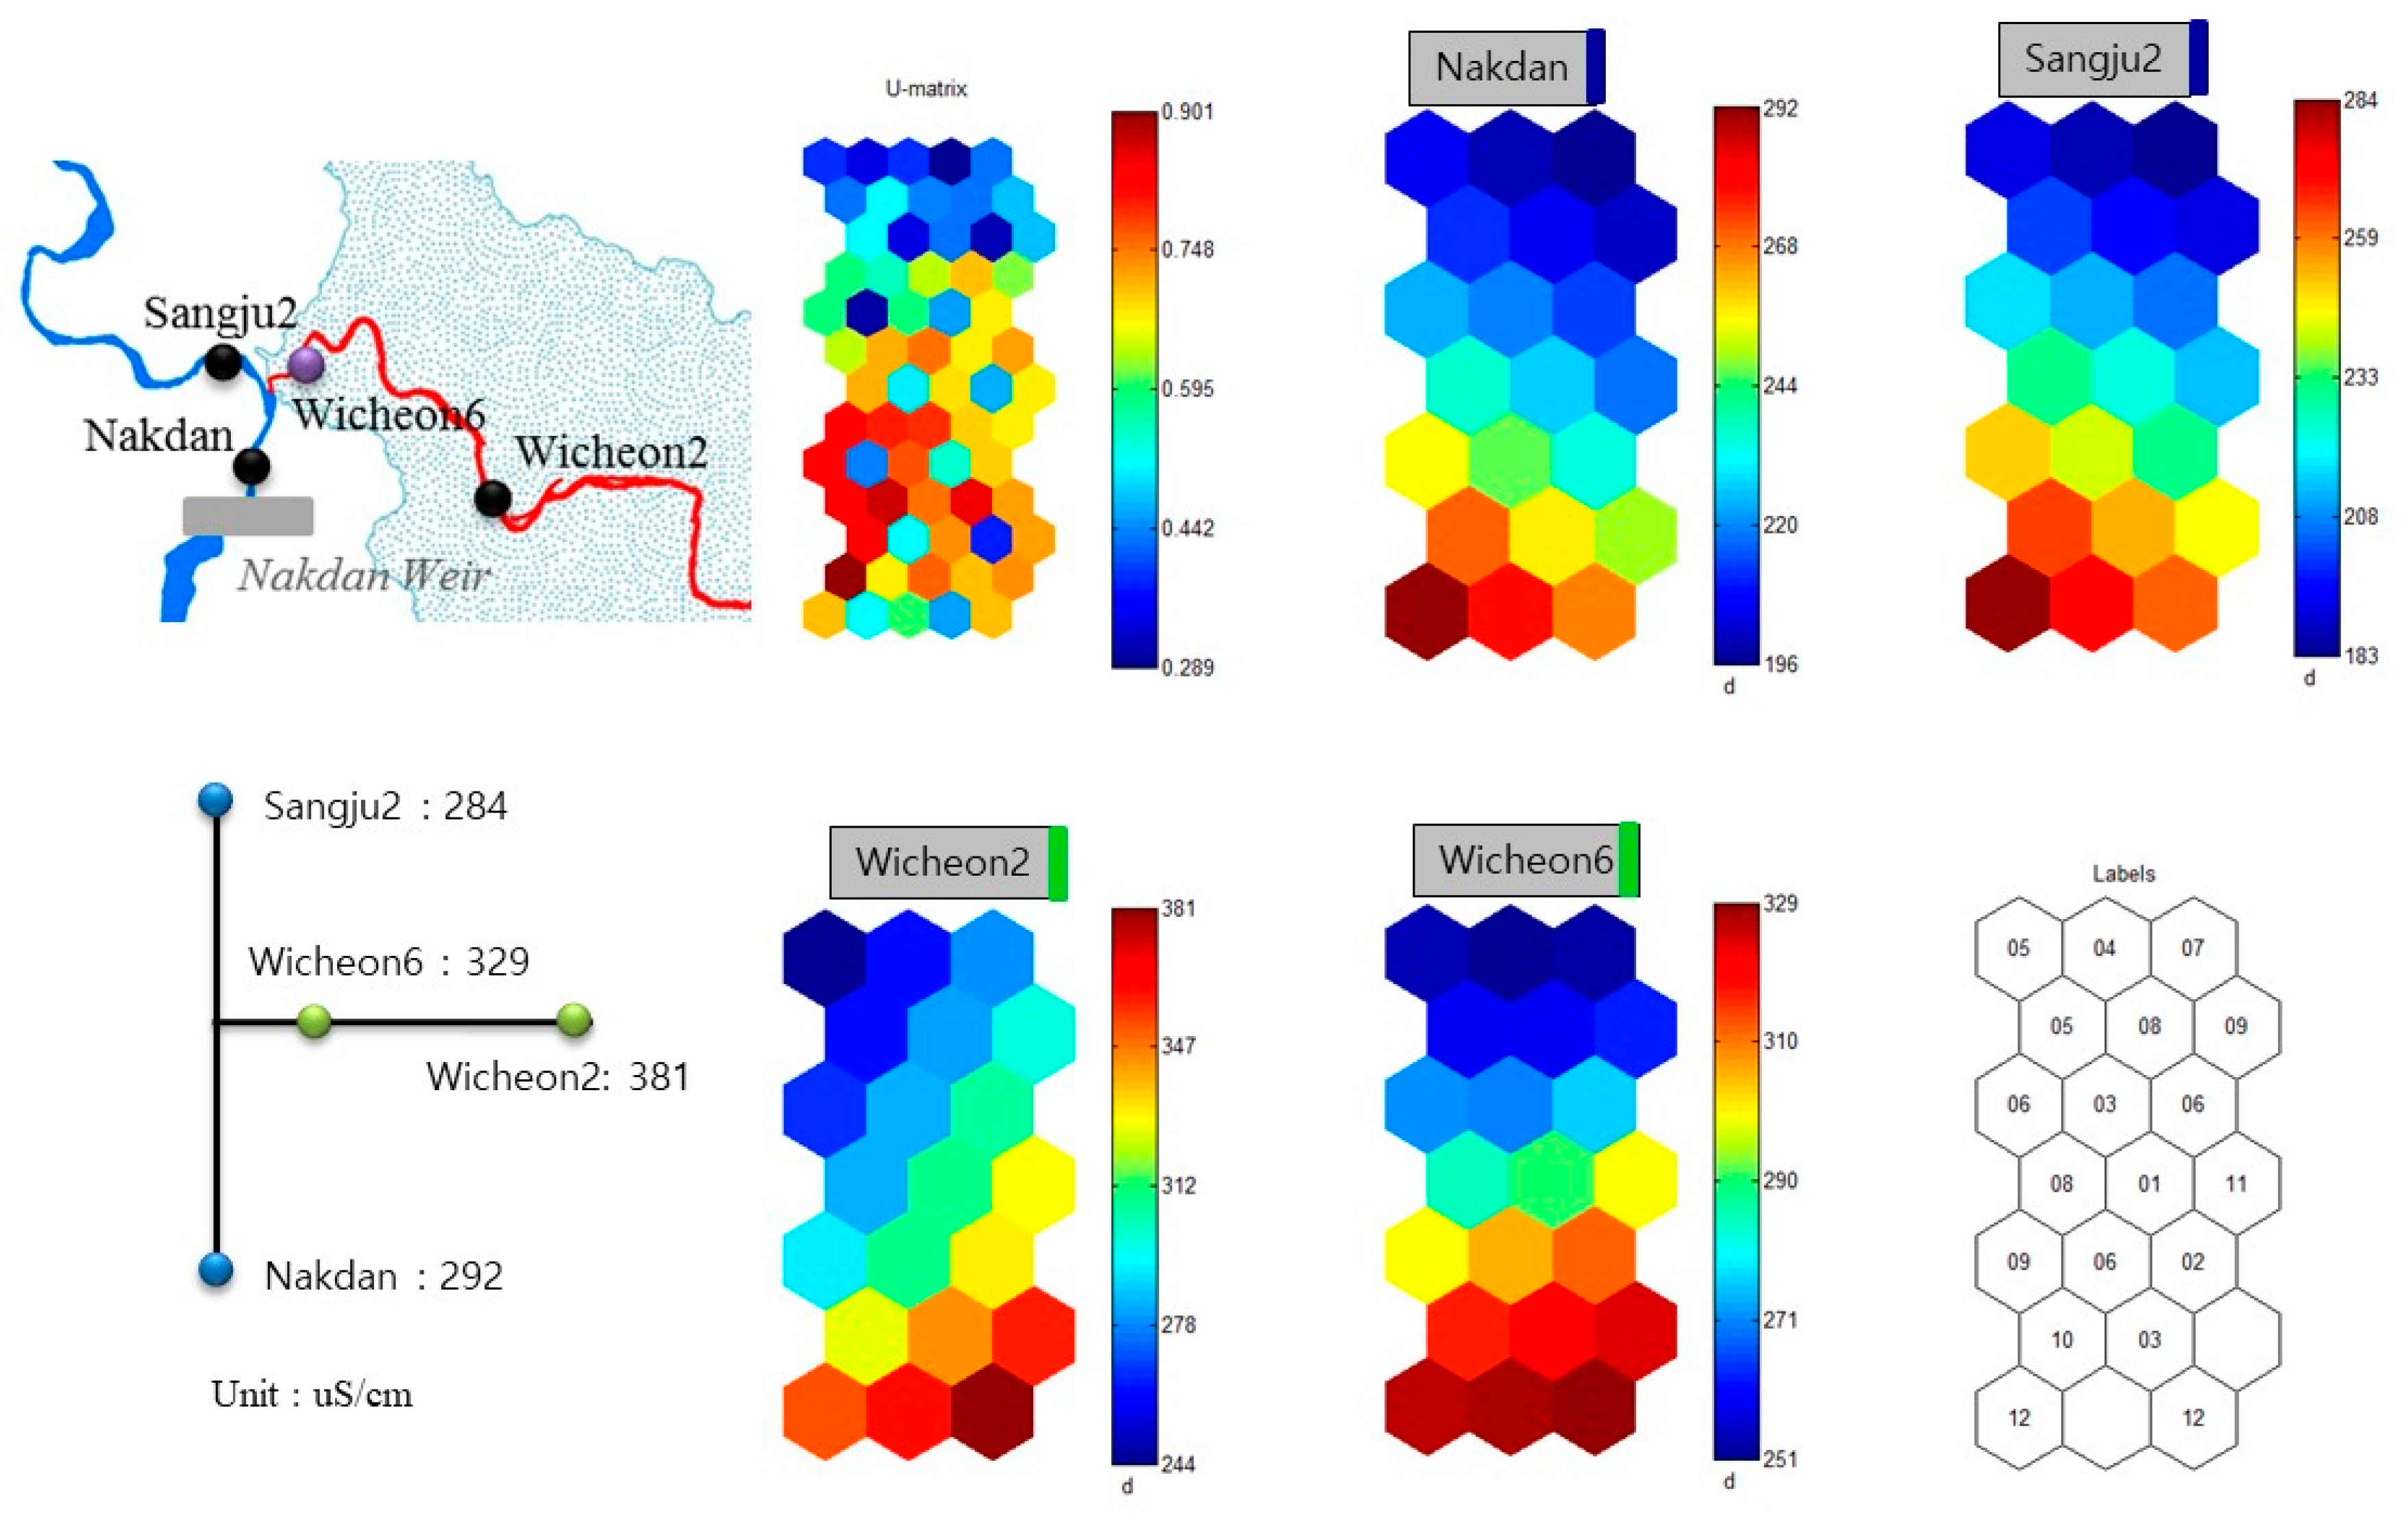
The results of SOM analysis for EC showed distinct patterns in the two rivers (
Figure 6). The EC ranged from 183 uS/cm to 292 uS/cm at both Sangju 2 and Nakdan. The EC at Wicheon 2 and Wicheon 6 ranged from 244 uS/cm to 381 uS/cm and 251 uS/cm to 329 uS/cm, respectively. The EC at Wicheon 6 reflected mixed Nakdong and Wicheon river water. At the two Nakdong River sites (Nakdan and Sangju 2), the bottom left recorded the highest EC values and the top right had the lowest. At Wicheon 2, upstream along the Wicheon River, the pattern was reversed; the bottom right had the highest values and the top left had the lowest. At the mouth of the Wicheon mouth (Wicheon 6), the entire bottom was highest and the entire top was lowest, apparently mixing the two independent patterns. The largest value at Wicheon 6 was lower than the corresponding value at Wicheon 2.
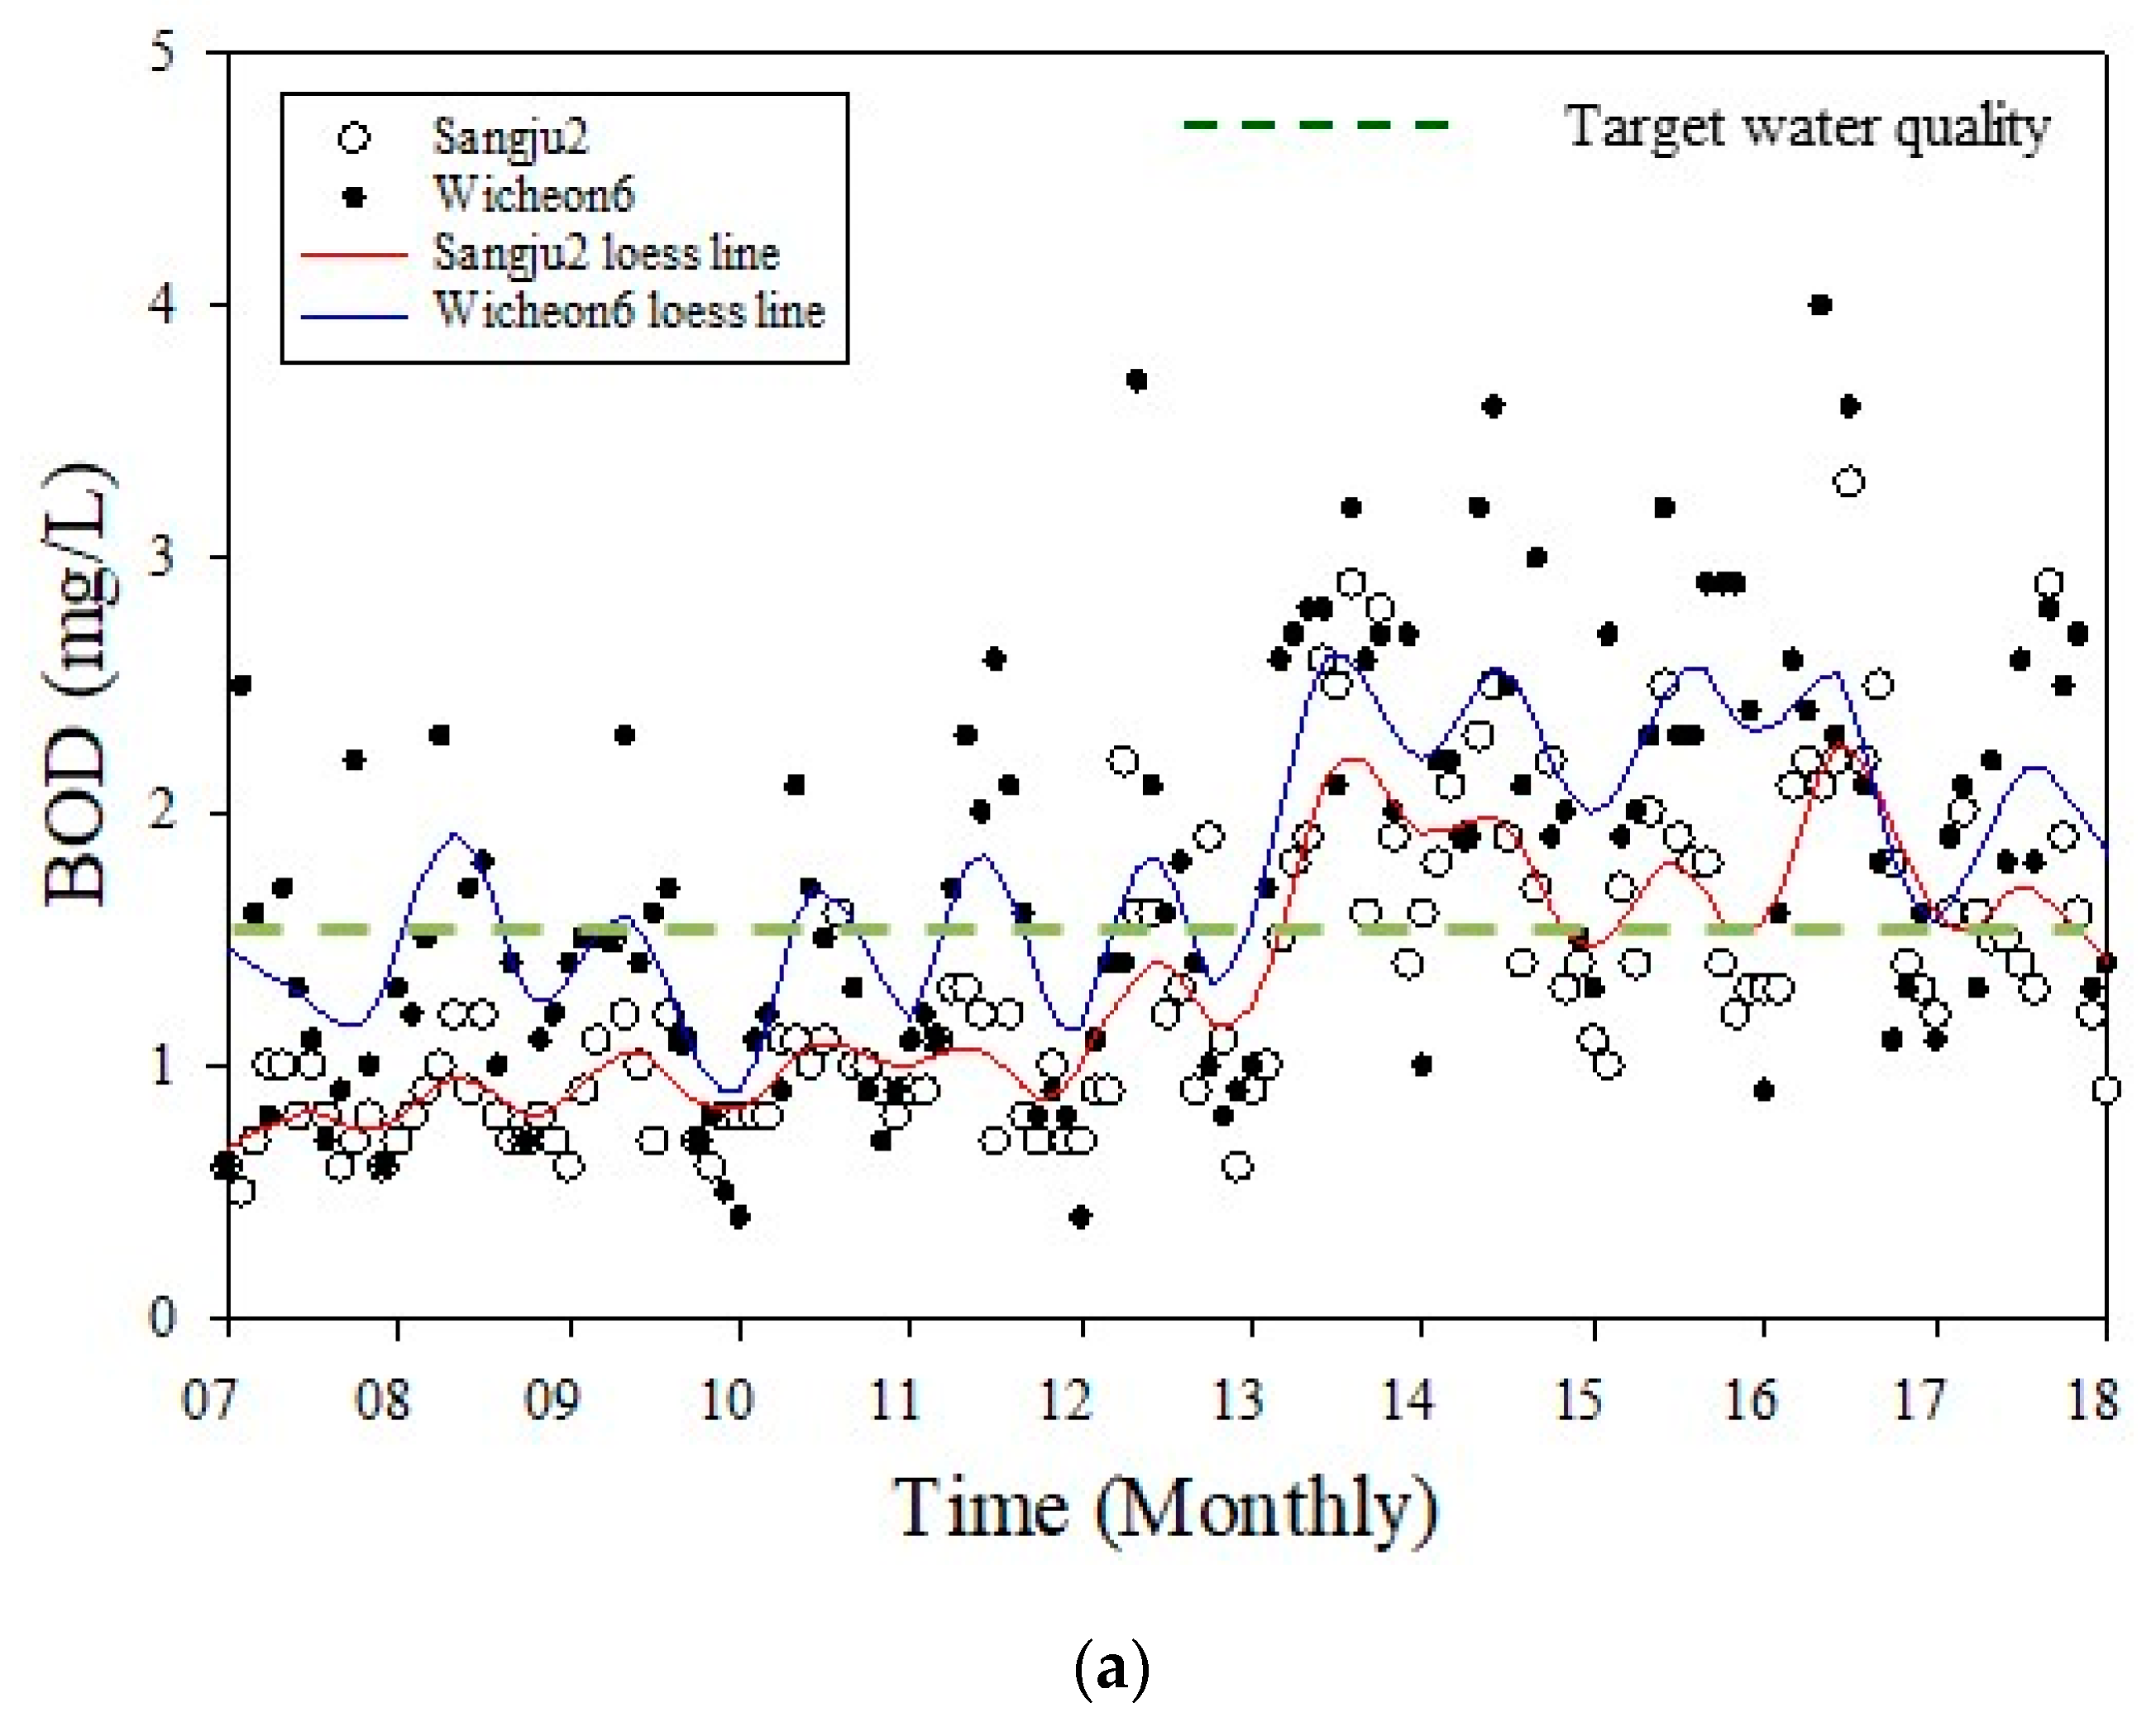
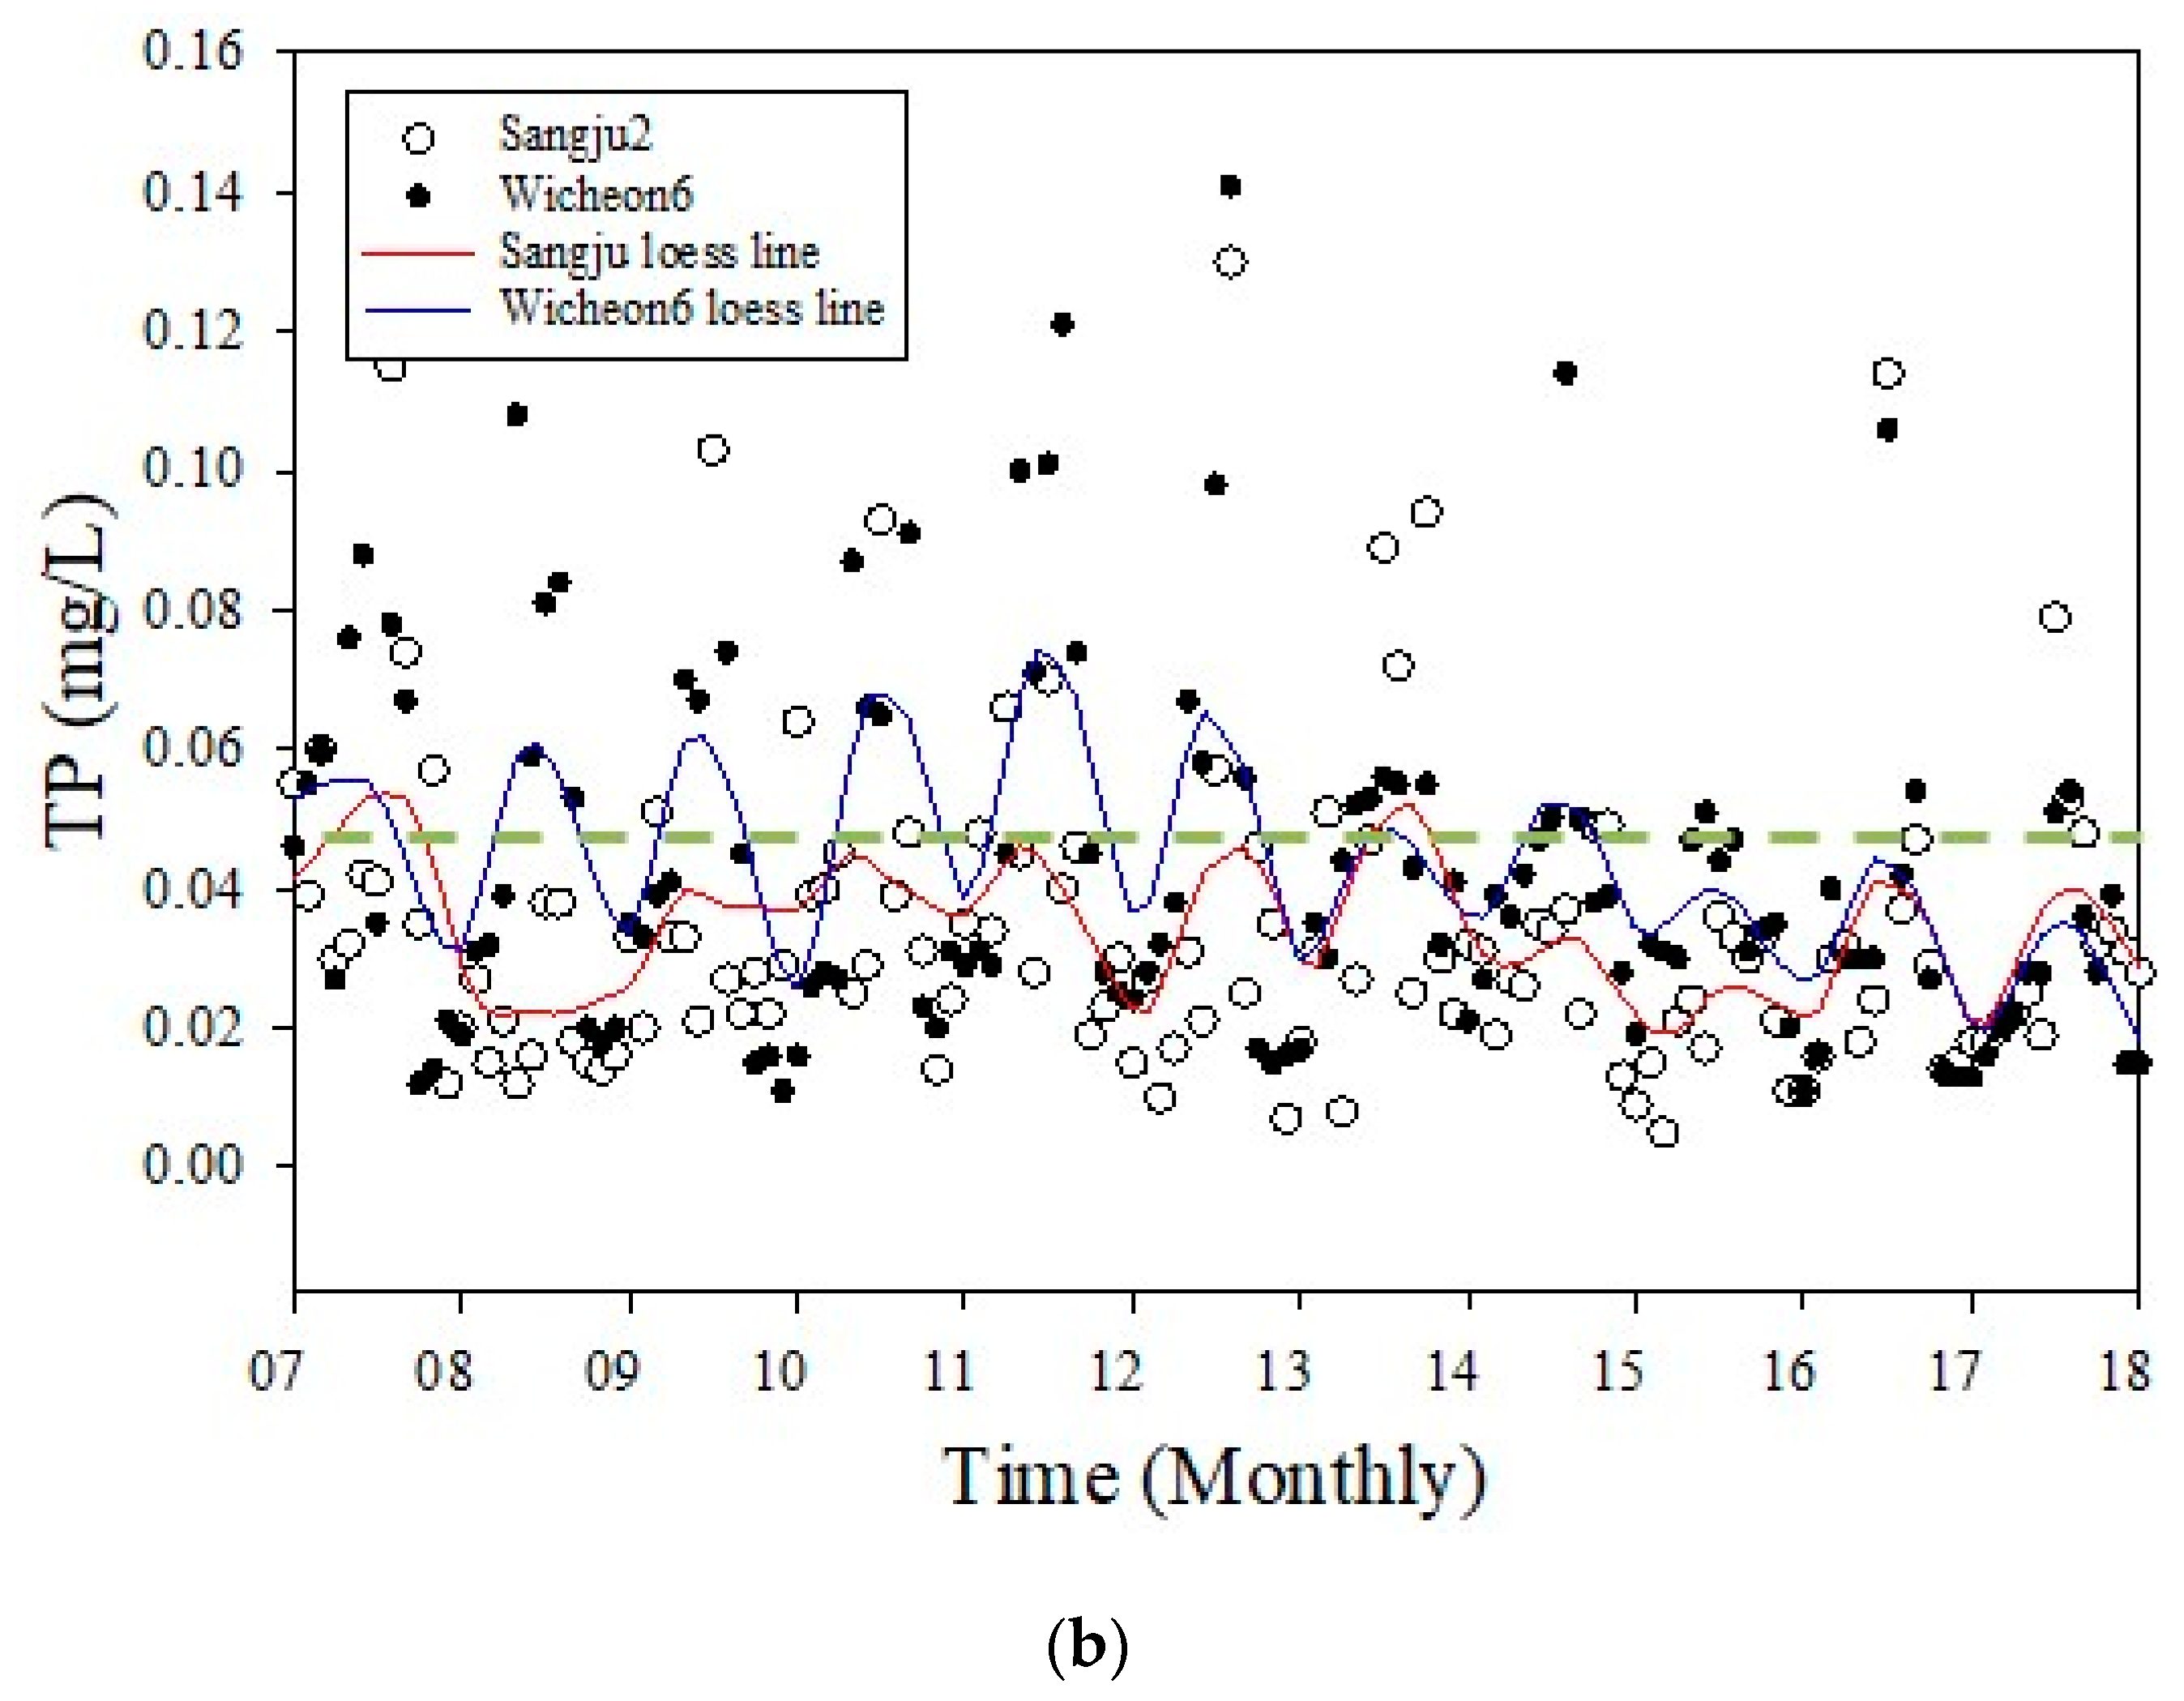
There are no marked changes in the annual average change rates of pollutants on the official list of those present in the Wicheon watershed (measured at Wicheon 6) in the TMDL basic plan that has been approved by the Ministry of Environment. According to the LOWESS trend analyses for data from Wicheon 6 (
Figure 7), BOD exceeded the target water quality from 2013 onwards while TP mostly did not exceed the target in the same period. These variations occurred despite there being no changes in the pollution sources within the watershed. Thus, we conclude that they are associated with the operation of the Nakdan Weir.
The BOD and TP trends at Sangju 2 (Jungdong Bridge) and Wicheon 6 (Umul Bridge) were quite different prior to 2013 but became similar after 2013 (
Figure 7). Even without any change in pollutants, or when variations were slight compared to those in 2012, the BOD exceeded the target water quality (1.5 mg/L) after the construction of the Nakdan Weir. The TP concentration did not exceed the target water quality (0.045 mg/L). These results appear to have been caused by the backflow from the Nakdong River mainstem, suggesting that using water-quality data recorded at Wicheon 6 index for evaluating the TMDL is a problem and that current standard practices require adjustment. Additional analysis information and results related to SOM and LOWESS can be found in the
Supplement File of Supplementary Materials.
3.3. LDC
The results of LDC analysis for BOD showed that the water quality target was exceeded in 27.03%–56.76% of cases from 2010–2012, increasing to 67.57%–91.89% from 2013–2017 (
Table 1). The results for TP showed that the water quality target was exceeded in 32.43%–59.46% of cases from 2010–2012, decreasing to 10.81%–29.73% from 2013–2017 (
Table 1). This matches our previous results which showed that the excess BOD rate increased after 2013 and that the TP excess rate decreased although pollutant sources did not change. This again suggests that the cause is backflow from the Nakdan Weir. Additional analysis information and results related to SOM and LOWESS can be found in the
Supplement File of Supplementary Materials.
3.4. Numerical Modeling
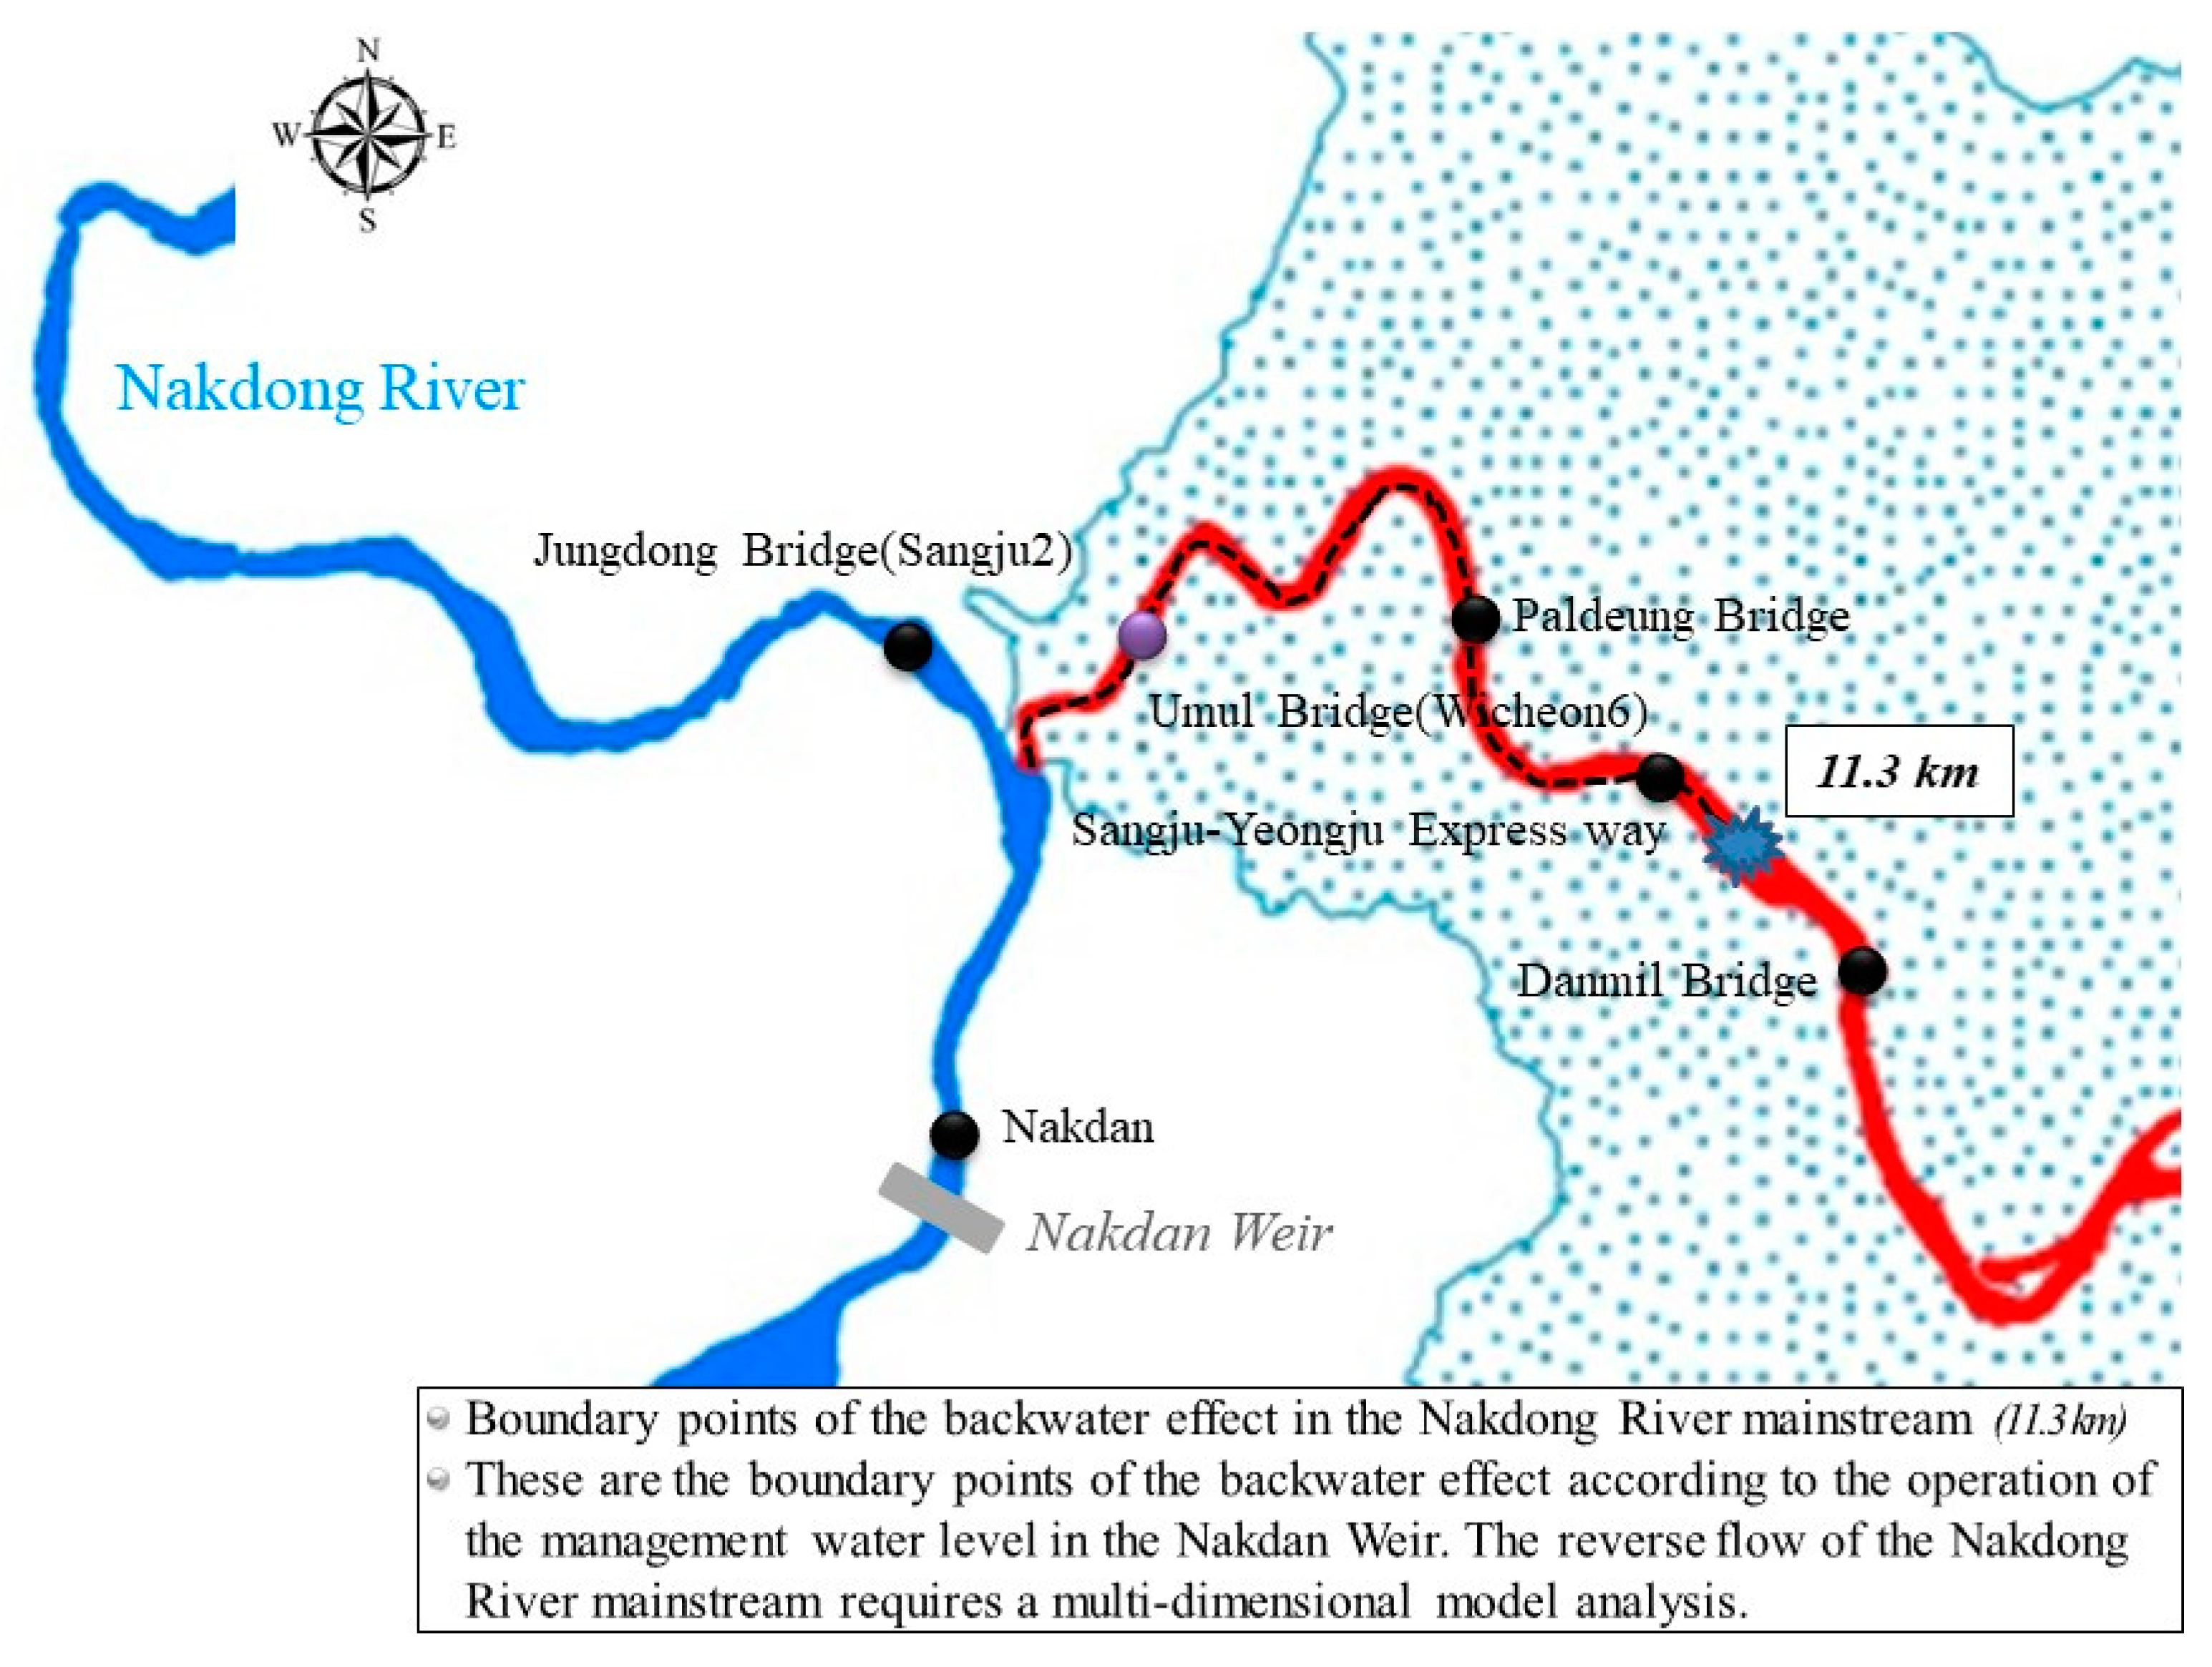
The HEC-RAS model was built using the parameters presented in the Wicheon stream basic maintenance plan [
13] and used to simulate the boundary points of the maximum backwater effect. This effect was analyzed by assuming that the water level in the Nakdong River changed at the Nakdan Weir from the current EL 40 m to a variable EL 37.4 m, which is the lower limit. The backwater effect did not appear until section No. 43 in the Wicheon stream basic maintenance plan and did not appear after section No. 52. The boundary points of the maximum backwater effect based on this result show that the backwater effect was observed from the mouth of the Wicheon River to 11.3 km upstream (
Figure 8). This result can be used as basic data for improved management of multi-functional weirs currently in the planning stage and intended for Wicheon and other places.
The EFDC model was constructed by interpolating three-dimensional topography survey data and the grids constructed for the Nakdong–Wicheon confluence. For the Nakdong River, 21 and 251 grids were constructed horizontally and vertically, respectively; for the Wicheon River, 7 and 191 grids were constructed horizontally and vertically, respectively. Since it is very difficult to measure the roughness height (Zo), the value applied in the EFDC model was set at 0.005 m through parameter calibration. Tetra Tech [
18] applied a roughness height of 0.01 m to the EFDC in the Hanalei Bay area and Yang [
19] applied a roughness height of 0.005 in a study of Billy Chinook Lake in Oregon. For the turbulent analysis model, we applied the method used by Smagorinsky [
20] combined with a Wall slipperiness coefficient of 0.5, a wet/dry condition of 0.04 m, a gravitational acceleration of 9.8 m/s, a von Karman constant of 0.41, and a kinematic coefficient of viscosity of 1.0 × 10
−6 m
2/s.
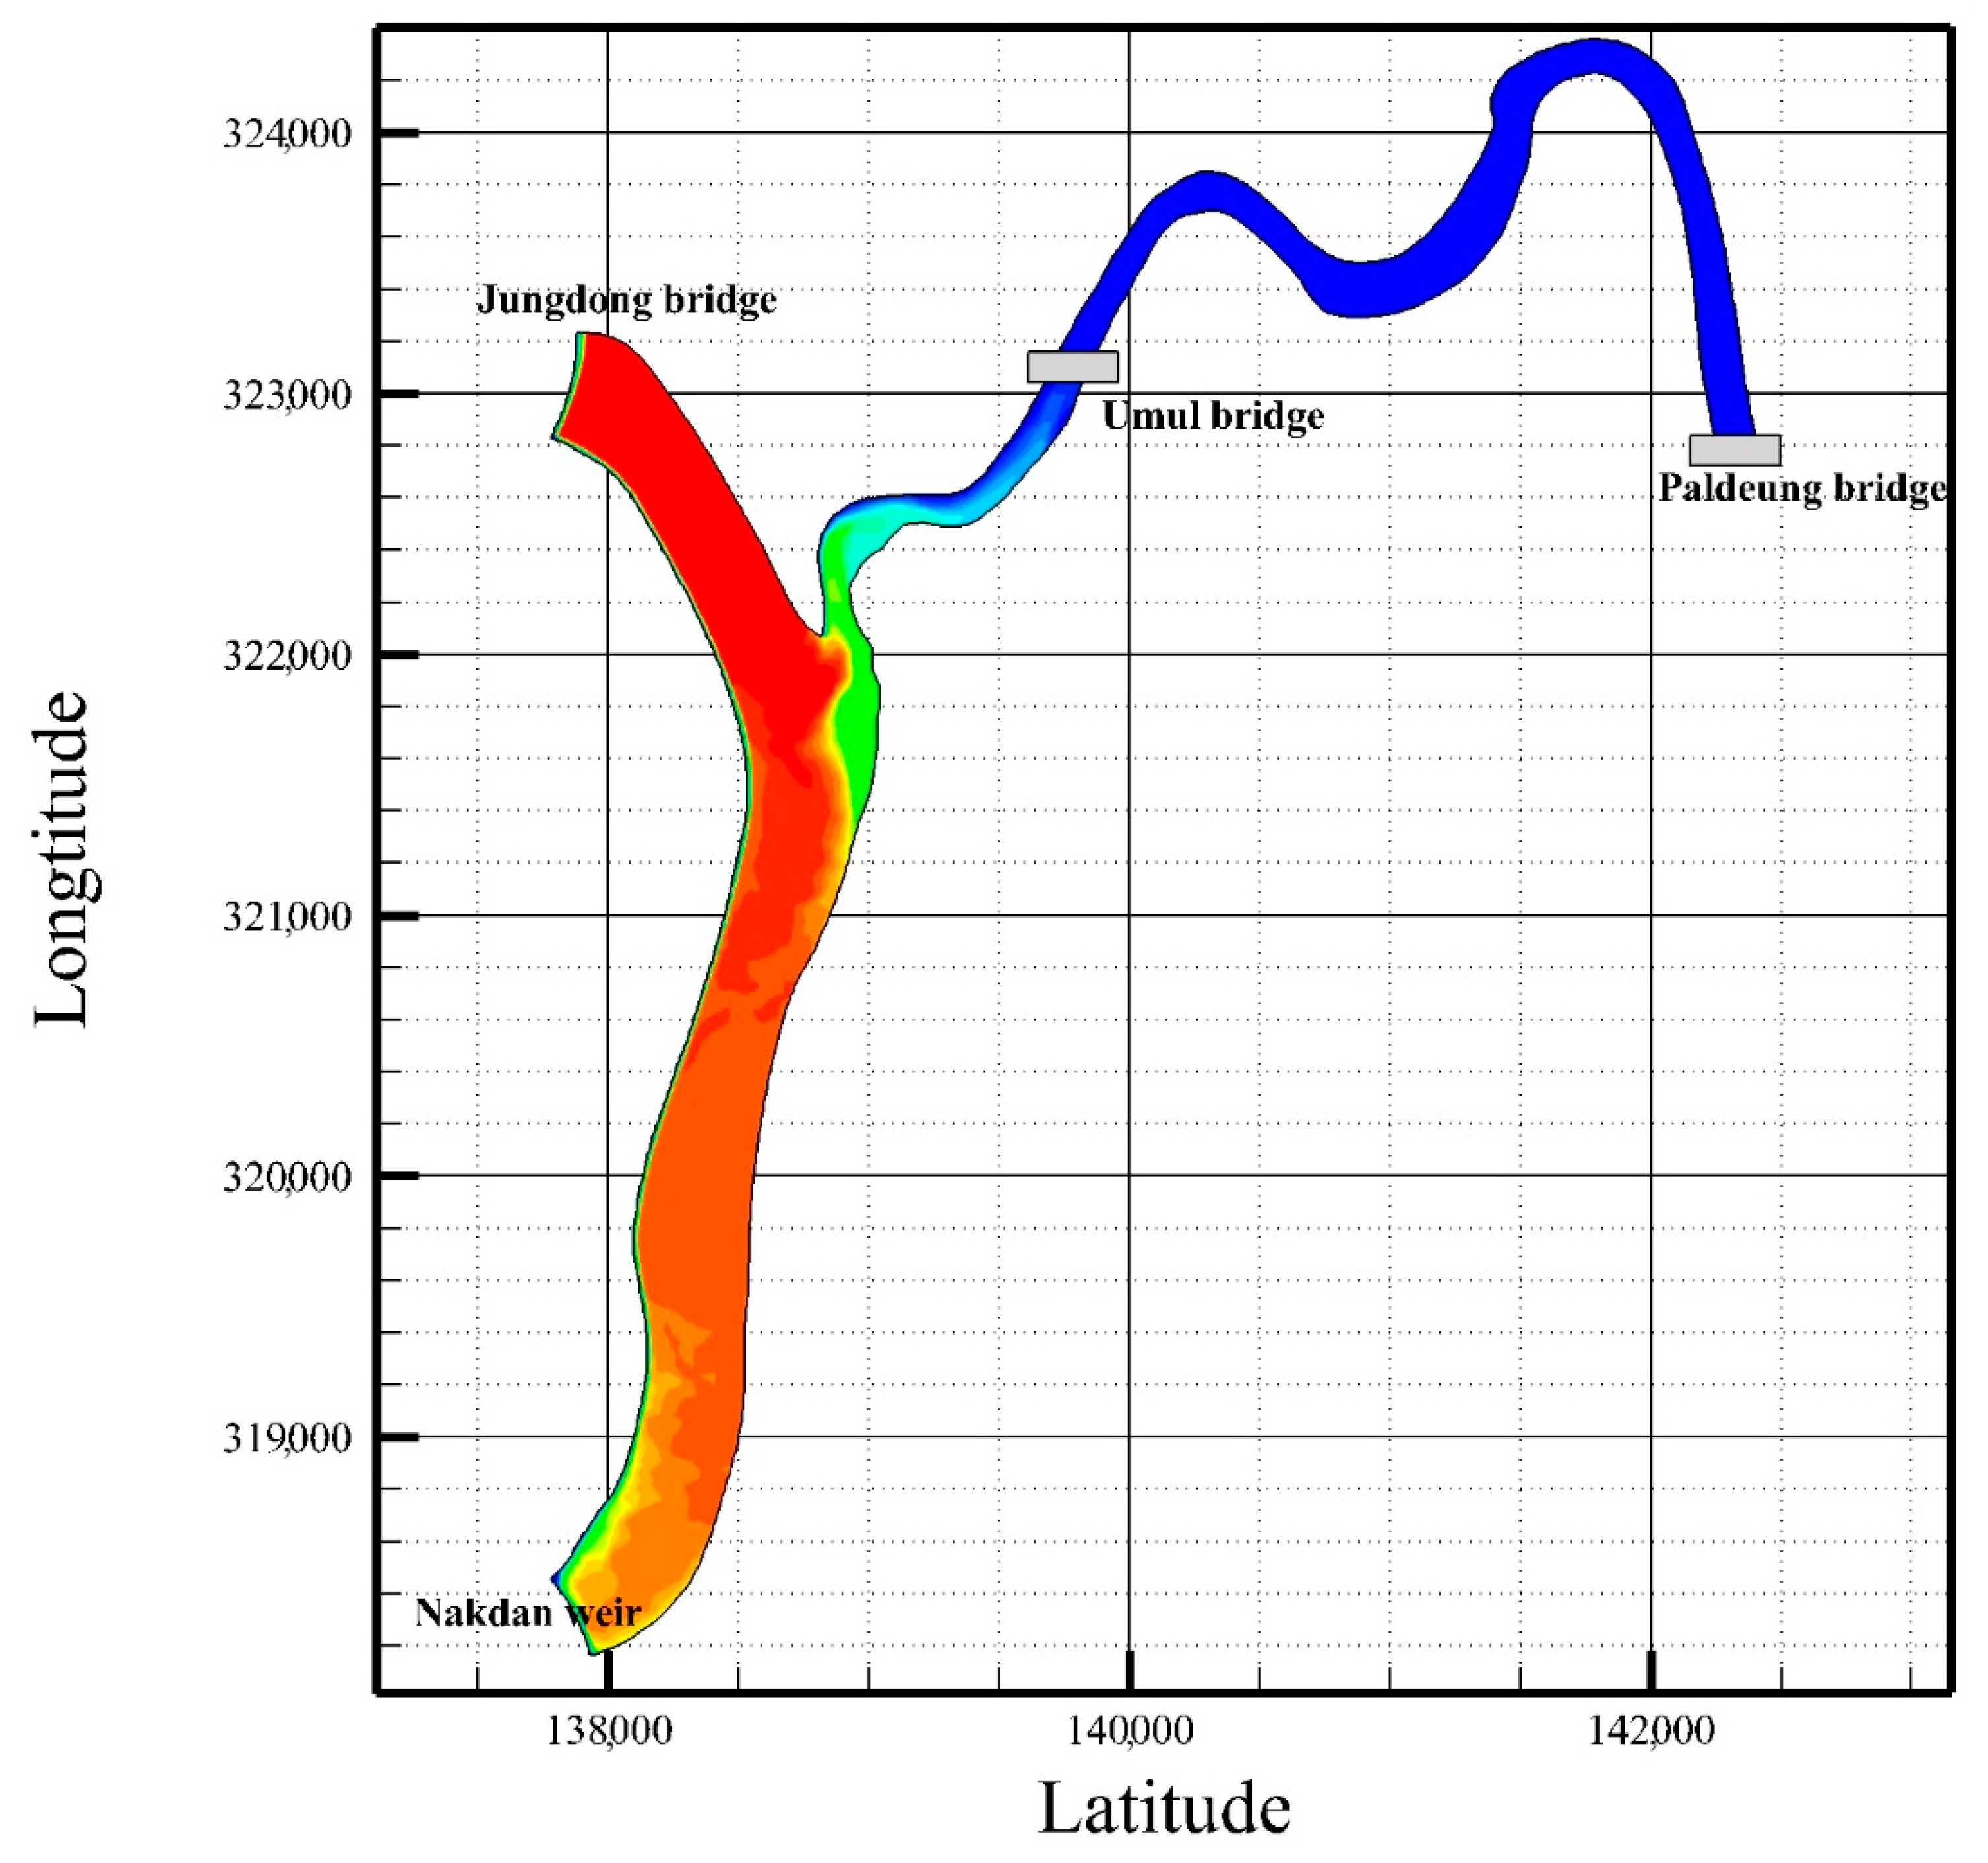
The flow duration analysis for the Nakdong River and the Wicheon 6 site showed that the flow rate ratio between the two was 12:1 in the high-water season, 2.7:1 in the low-water season, and 87.4:1 in the dry season. Therefore, we used the high-water season, which is expected to have the largest backwater effect, as the boundary condition in the EFDC. The results showed that water from the Nakdong River flowed back to Umul Bridge when the managed water level was 40 m asl (
Figure 9). This is consistent with the EC distributions described in
Section 3.1 and
Section 3.2. Therefore, reducing the water level at the weir will decrease the range of the backflow into the tributary. The EFDC model constructed in this study can inform and improve decision-making on future water-level management at this weir and at other locations. Additional analysis information and results related to SOM and LOWESS can be found in the
Supplement File of Supplementary Materials.
4. Conclusions
Representative assessments of river water quality require accurate evaluations of water quality at TMDL monitoring stations within watersheds. In South Korea, the operation of multi-functional weirs as part of the management of river water levels causes backwater effects at tributary end points, introducing effects from the mainstream and that are thus not representative of the tributary. In this study, we developed a new method for assessing this concern using electrical conductivity monitoring, numerical modeling, and SOM, LOWESS, and LDC analyses. We measured the mixing of different water bodies based on EC. At the Wicheon 6 TMDL site (Umul Bridge), spatiotemporal electrical conductivity observations revealed that the Nakdong River flowed backward, mixing water from it and the Wicheon River as far upstream as 500 m downstream of the Paldeung Bridge. Furthermore, SOM analysis indicated that the seasonal pattern of the EC at the Wicheon 6 site was mixed with that from the Nakdong and Wicheon rivers. The LOWESS trend analysis showed that the variations were related to seasonal fluctuations after the construction of the weir and that significant changes occurred because of the reverse flow from the Nakdong after 2012. Next, the LDC analysis showed that after 2013, the excess BOD and TP excess rates decreased although pollutant sources in the watershed did not change. Finally, the results from one- and three-dimensional numerical modeling procedures showed that the main stream of the Nakdong River flowed back to the tributaries and affected water-quality at measurement points.
The applicability of this methodology to assess the representativeness of points on a monitoring network was tested on the Nakdong and Wicheon rivers. The results showed that our methods illustrated that the mainstream of the Nakdong River was backflowing to the tributary. Among the methods we applied, the most obvious evidence of the backflow came from the results of electrical conductivity observations and numerical modeling. The results from SOM, LOWESS, LDC, and numerical modeling methods were used as complementary evidence of the backflowing. Therefore, we proposed the following improvements to current policies in the area based on our results.
The Wicheon 6 site should be relocated further upstream in the Wicheon River because the Nakdong River does flow backward, and the backwater effects from the operation of the Nakdan Weir clearly affect water-quality data at the mouth of the Wicheon. Another alternative would be to establish a new station; we recommend Paldeung Bridge as a suitable site. Furthermore, similar research should be extended to other areas that may be experiencing these issues. We also suggest that the establishment of an improved operation plan for the water environmental monitoring network, as required by law, should be based on the results of similar evaluations results; this will contribute to the effective management of the rivers. Our approach was, overall, able to clearly assess the representativeness of the existing water-quality monitoring network using widely accessible data and methods, thus making this type of assessment applicable to many other situations around the world.
Author Contributions
The manuscript was written by J.M.A., who was mainly responsible for the initial research proposal, field work, consultations, survey and numerical design, and policy analysis; however, all authors contributed to its preparation and review. Y.-S.K. was responsible mainly for designing and implementing the web-based survey and hydrologic modeling portions of the experiment. J.M.A. revised the language of the manuscript, edited the first draft, and did the final overall proofreading.
Acknowledgments
This work was supported by the National Institute of Environment Research (NIER) [grant number NIER-2018-01-01-075], funded by the Ministry of Environment (MOE) of the Republic of Korea.
Conflicts of Interest
The authors declare no conflict of interest.
References
- Ministry of Environment. Water Environmental Monitoring Network Operation Plan; Doum 6-ro; Ministry of Environment: Sejong-si, Korea, 2017.
- Lizotte, R.E., Jr.; Shields, F.D., Jr.; Knight, S.S.; Cooper, C.M.; Testa, S., III; Bryant, C.T. Effects of artificial flooding on water quality of a floodplain backwater. River Res. Appl. 2011, 28. [Google Scholar] [CrossRef]
- Liro, M. Dam reservoir backwater as a field-scale laboratory of human-induced changes in river biogeomorphology: A review focused on gravel-bed rivers. Sci. Total Environ. 2019, 651, 2899–2912. [Google Scholar] [CrossRef] [PubMed]
- Lee, C.; Paik, K.; Lee, Y. Optimal sampling network for monitoring the representative water quality of an entire reservoir on the basis of information theory. J. Water Clim. Chang. 2014, 5, 151–162. [Google Scholar] [CrossRef]
- Abdulraheem, Z.A. Allocating the Best Representative Water Quality Monitoring Station. Master’s Thesis, University of Technology, Iraq, Baghdad, 2015. [Google Scholar] [CrossRef]
- Puri, D.; Borel, K.; Vance, C.; Karthikeyan, R. Optimization of a water quality monitoring network using a spatially referenced water quality model and a genetic algorithm. Water 2017, 9, 704. [Google Scholar] [CrossRef]
- Keum, J.; Kornelsen, K.C.; Leach, J.M.; Coulibaly, P. Entropy applications to water monitoring network design: A review. Entropy 2017, 19, 613. [Google Scholar] [CrossRef]
- Davie, T. Fundamentals of Hydrology, 2nd ed.; Routledge: London, UK; New York, NY, USA, 2002; pp. 1–169. [Google Scholar]
- Kohonen, T. Self-Organizing Maps; Springer: Berlin, Germany, 2002; pp. 1–502. [Google Scholar]
- Alhoniemi, E.; Himberg, J.; Parhankangas, J.; Vesanto, J. SOM Toolbox for Matlab 5; Helsinki University: Helsinki, Finland, 2000; Available online: http://www.cis.hut.fi/somtoolbox/ (accessed on 13 May 2019).
- United States Environmental Protection Agency (USEPA). An Approach for Using Load Duration Curves in the Development of TMDLs; USEPA: Washington, DC, USA, 2007. Available online: https://www.epa.gov/tmdl/approach-using-load-duration-curves-development-tmdls (accessed on 13 May 2019).
- Ministry of Land, Infrastructure, and Transport. Nakdonggang River Maintenance Basic Plan; Ministry of Land, Infrastructure, and Transport: Sejong, Korea, 2009.
- Ministry of Land, Infrastructure, and Transport. Wicheon River Maintenance Basic Plan; Ministry of Land, Infrastructure, and Transport: Sejong, Korea, 2014.
- Woo, H. River Hydraulics; Cheong Moon Gak: Seoul, Korea, 2002. [Google Scholar]
- American Society of Civil Engineers (ASCE). River Hydraulics. Technical Engineering and Design Guide as Adapted from the US Army Corps of Engineers; ASCE: New York, NY, USA, 1996.
- Hamrick, J.M. A Three-Dimensional Environmental Fluid Dynamics Computer Code: Theoretical and Computational Aspects; Special Report; The College of William and Mary, Virginia Institute of Marine Science: Williamsburg, VA, USA, 1992. [Google Scholar] [CrossRef]
- Blumberg, A.F.; Mellor, G.L. A description of a three-dimensional coastal ocean circulation model. In Three-Dimensional Coastal Ocean Models; Heaps, N.S., Ed.; American Geophysical Union: Washington, DC, USA, 1987. [Google Scholar] [CrossRef]
- Tetra Tech. Phase 2 EFDC Model Development and Application for Hanalei Bay, Appendix 1; Tetra Tech: Pasadena, CA, USA, 2010. [Google Scholar]
- Yang, Z.; Khangaonkar, T.; DeGasperi, C.; Marshall, K. Three-dimensional modeling of temperature stratification and density-driven circulation in Lake Billy Chinook, Oregon. In Estuarine and Coastal Modeling; Spaulding, M.L., Ed.; American Society of Civil Engineers: Reston, VA, USA, 1999; pp. 411–425. [Google Scholar]
- Smagorinsky, J. General circulation experiments with the primitive equations: I. The basic experiment. Mon. Weather Rev. 1963, 91, 99–164. [Google Scholar] [CrossRef]
© 2019 by the authors. Licensee MDPI, Basel, Switzerland. This article is an open access article distributed under the terms and conditions of the Creative Commons Attribution (CC BY) license (http://creativecommons.org/licenses/by/4.0/).


