Ultrasound-Assisted Extraction of Pectin from Malus domestica ‘Fălticeni’ Apple Pomace


Abstract
1. Introduction
2. Materials and Methods
2.1. Material and Chemicals
2.2. UAE Experimental Set-Up and Extraction Procedure
2.3. Physicochemical Properties of Pectin
2.3.1. Determination of Galacturonic Acid Content
2.3.2. Determination of Degree of Esterification
2.4. FT-IR Analysis of Pectin
2.5. Thermal Analysis
2.6. Pectin Solutions Rheology
2.6.1. Preparation of Pectin Solutions
2.6.2. Dynamic Viscosity Measurement
2.6.3. Dynamic State
2.6.4. Creep and Recovery Analysis
2.7. Surface Morphology Analysis
2.8. Experimental Design and Statistical Analysis
3. Results and Discussion
3.1. Model Fitting and Statistical Analysis
X1 · X3 + 0.982 · X1 · X4−0.074 · X2 · X3−0.984 · X2 · X4−0.267 · X3 · X4 + 0.676 · X12 + 1.736 ·
X22 + 0.035 · X32 + 0.589 · X42
X1 · X2 + 6.011 · X1 · X3 + 10.499 · X1 · X4 + 0.834 · X2 · X3−0.725 · X2 · X4−2.120 · X3 · X4−8.098 ·
X12−4.495 · X22 + 0.341 · X32−6.150 · X42
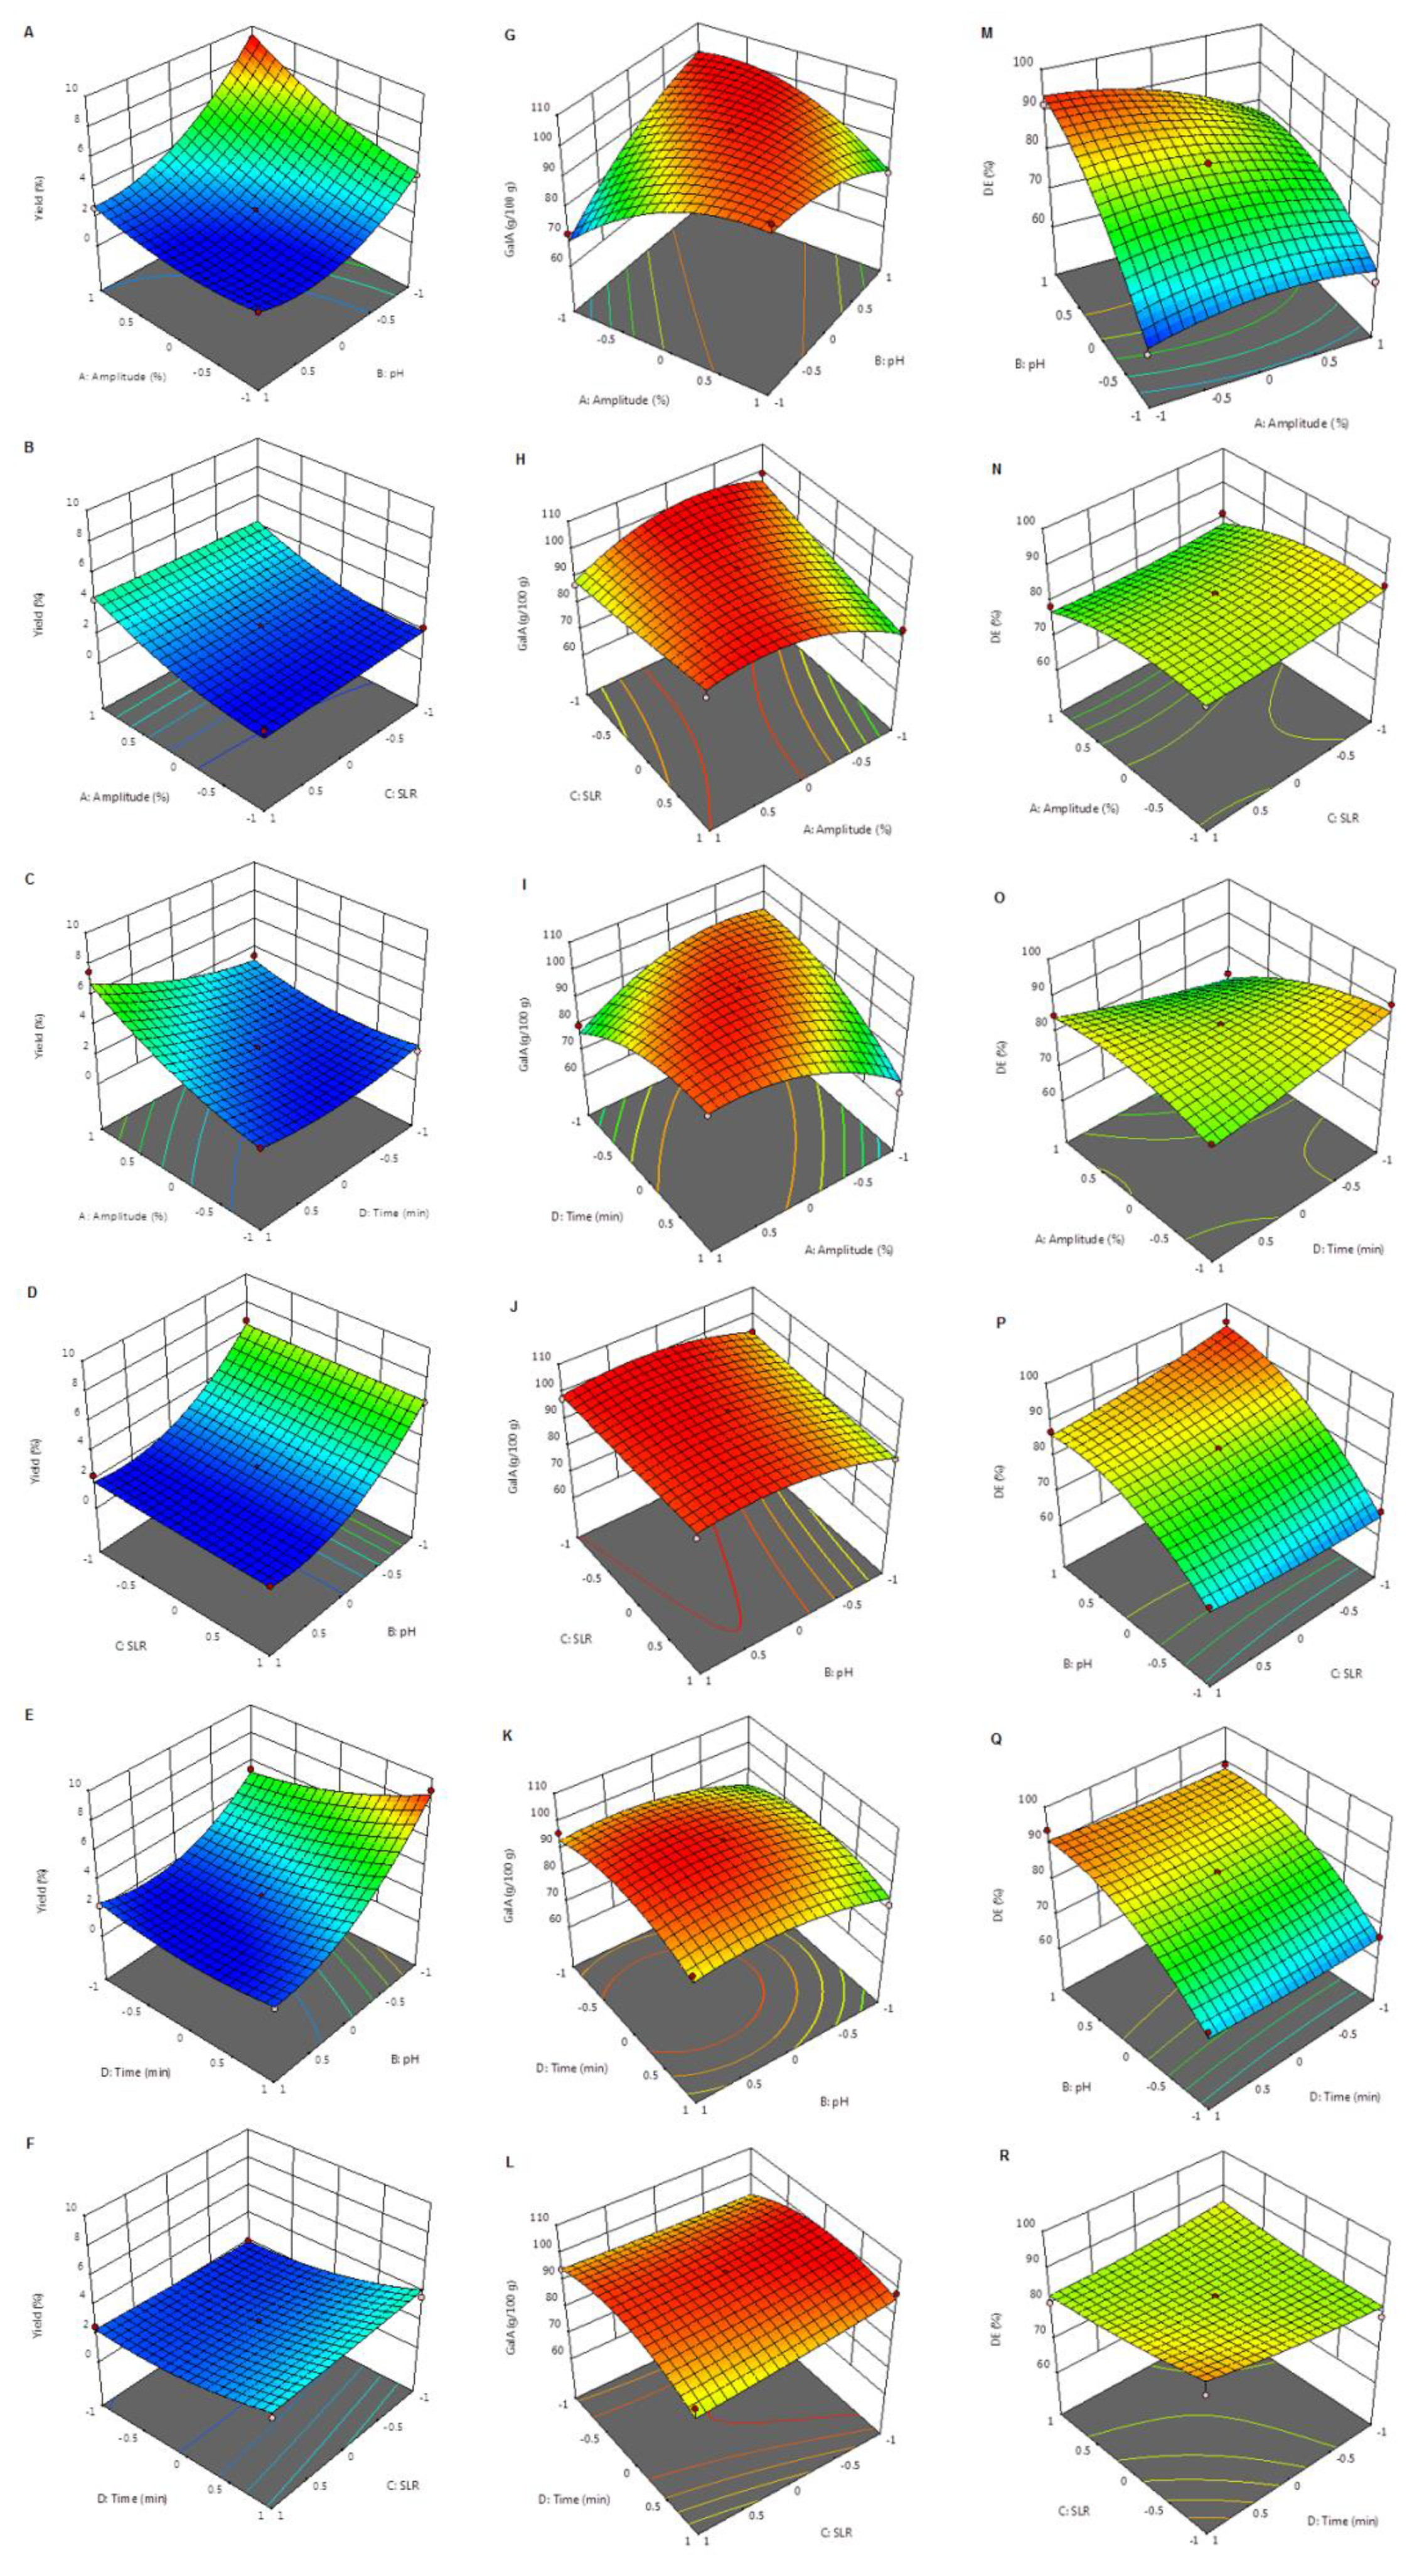
3.2. Effect of Process Variables
3.2.1. Effect on Pectin Yield
3.2.2. Effect of Extraction Parameters on GalA Content
3.2.3. Effect of Process Variables on DE
3.3. Optimization and Validation of Extraction Conditions
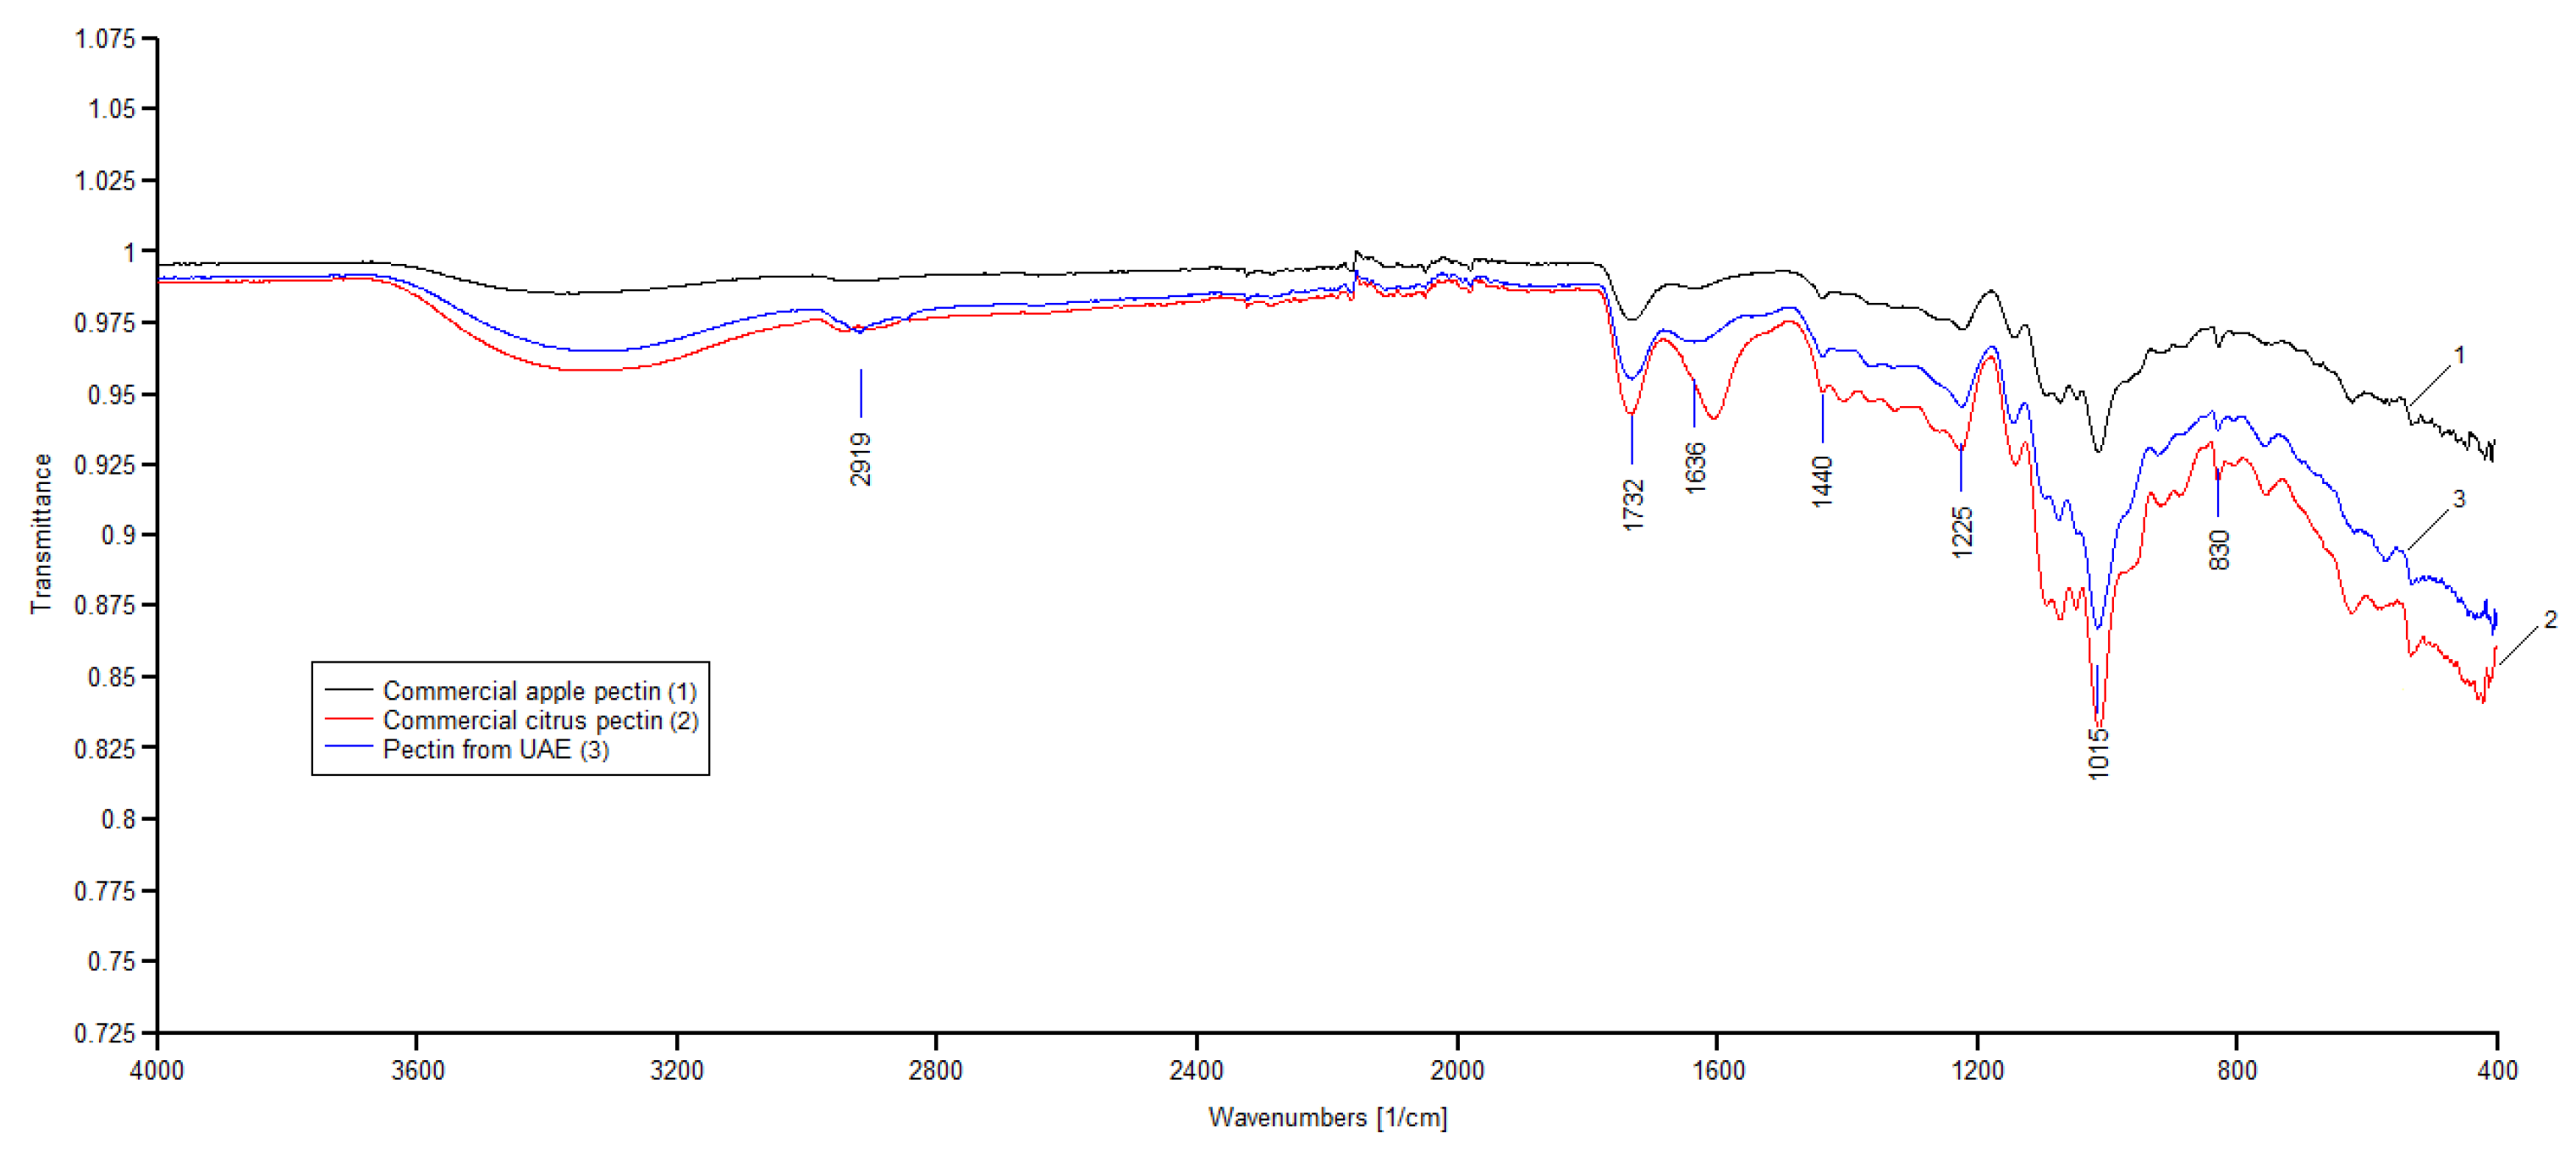
3.4. FT-IR Analysis of Apple Pectin
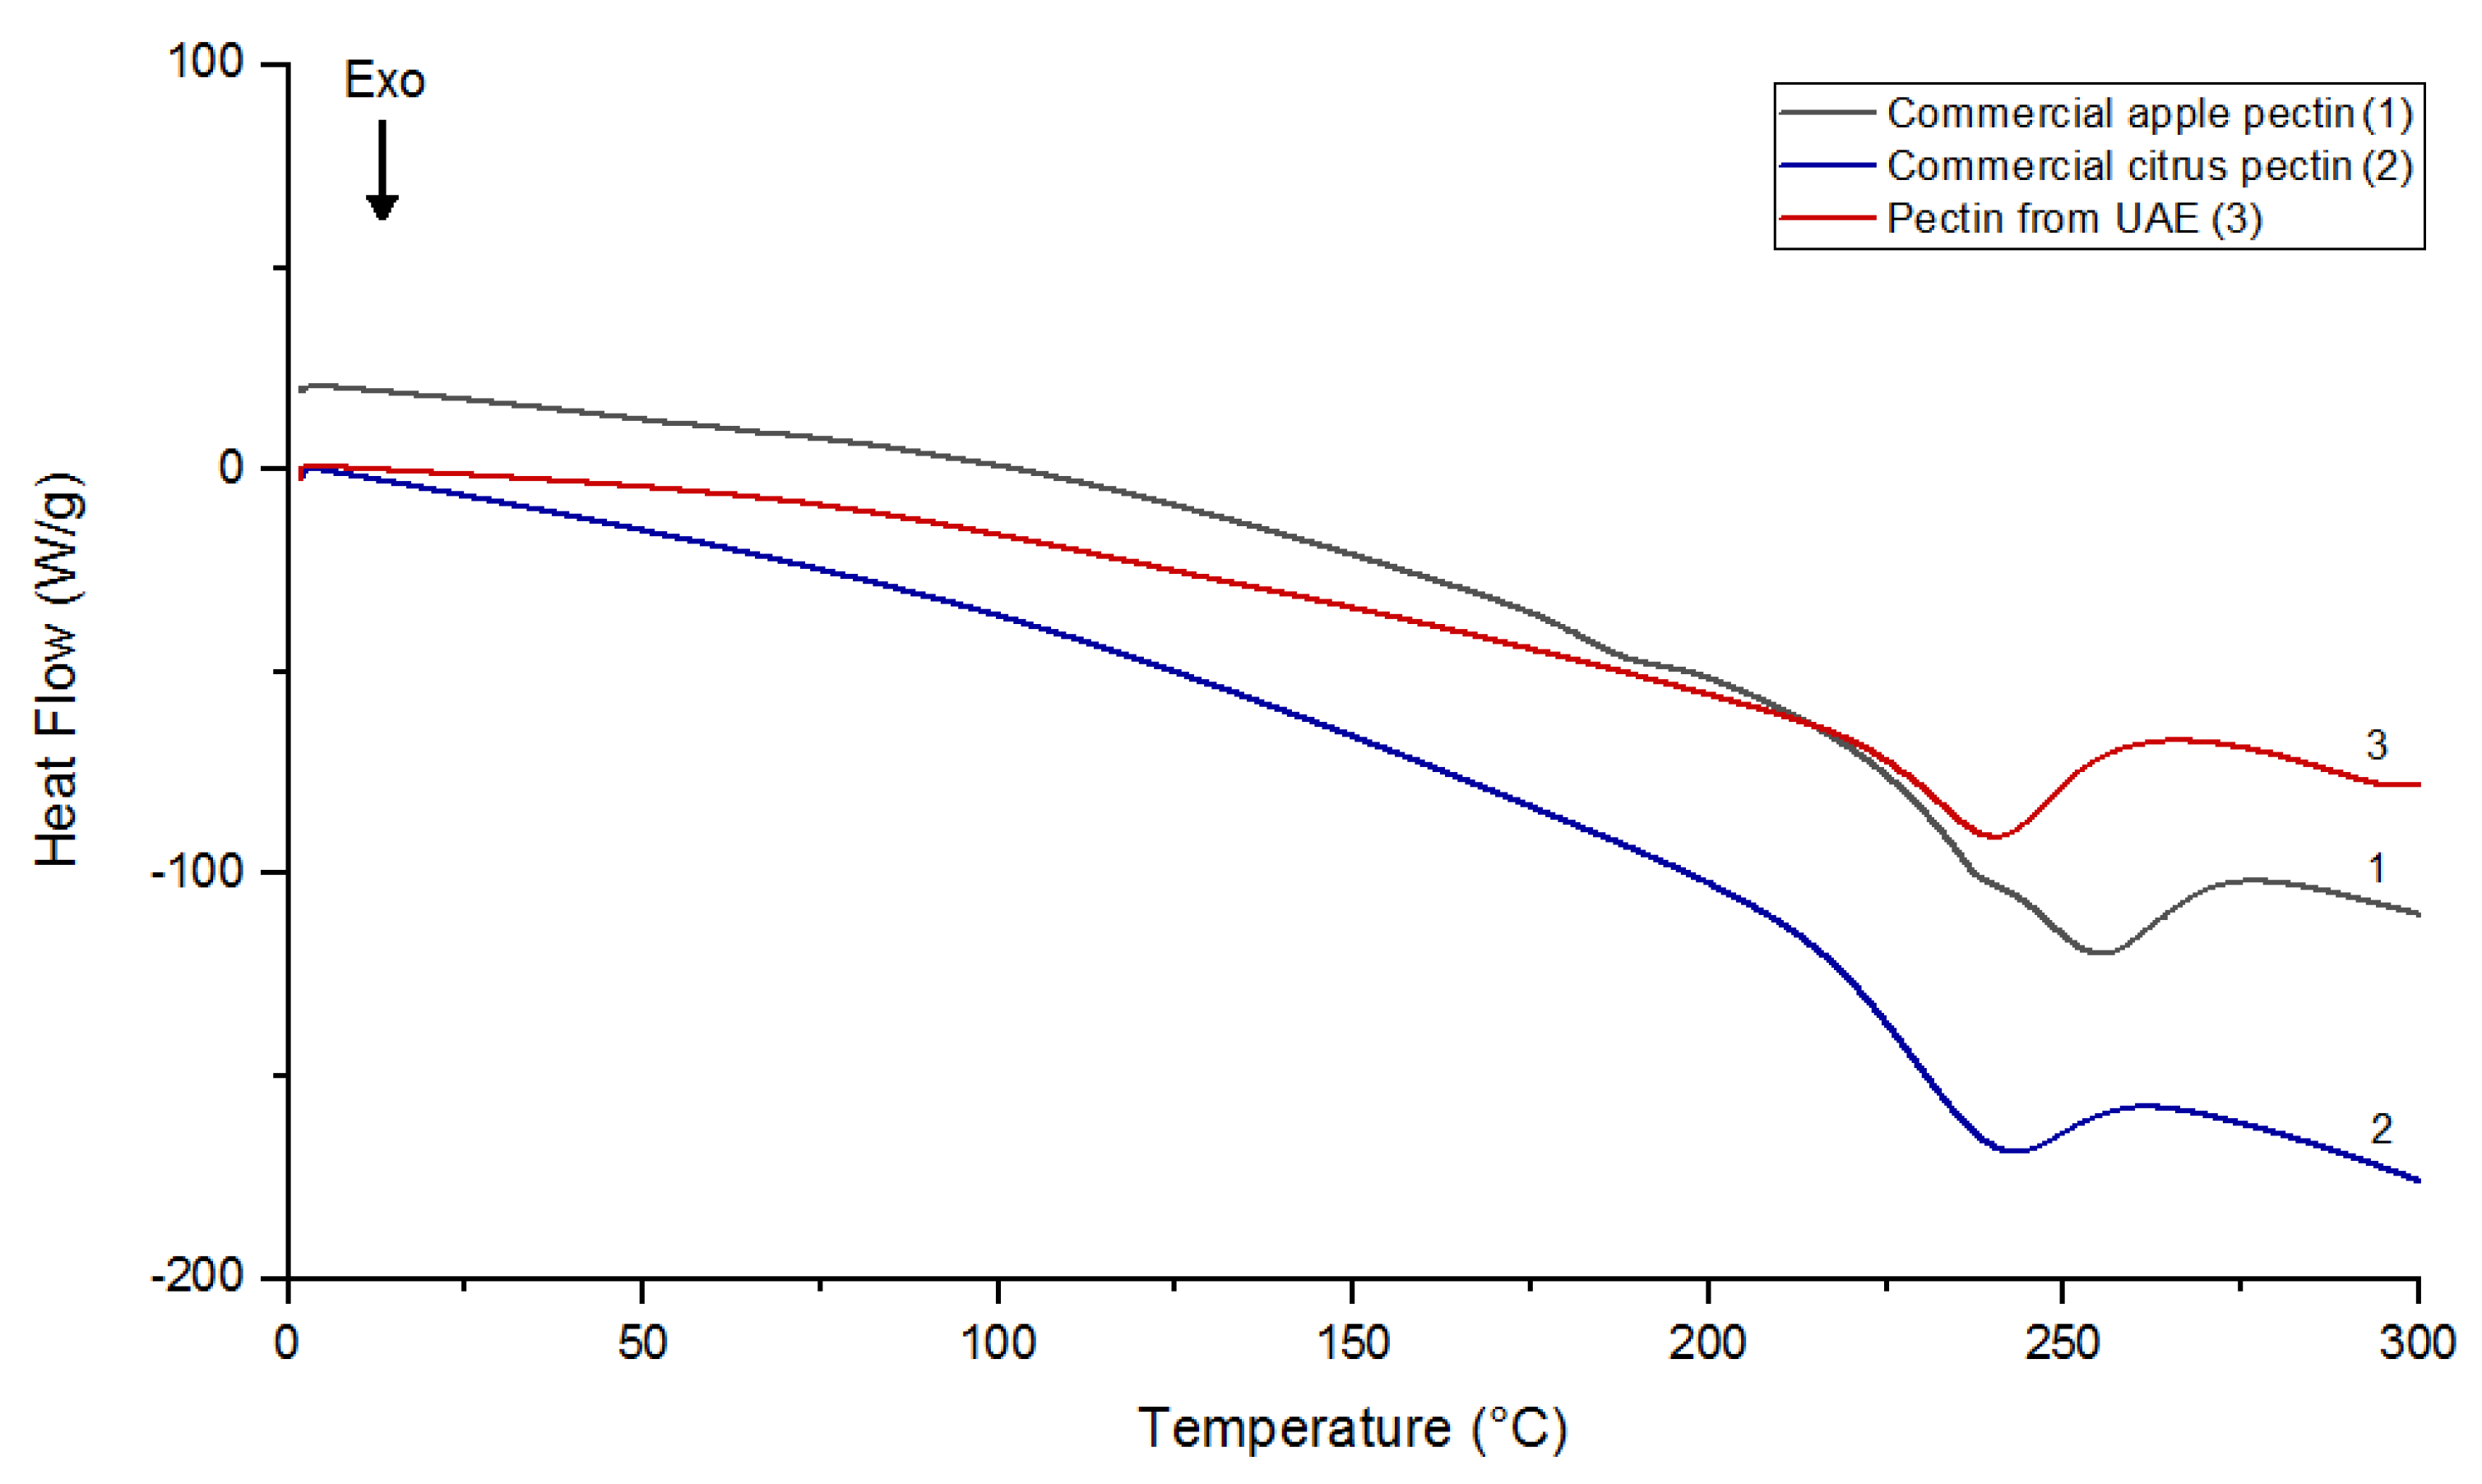
3.5. Thermal Analysis
3.6. Rheological Properties
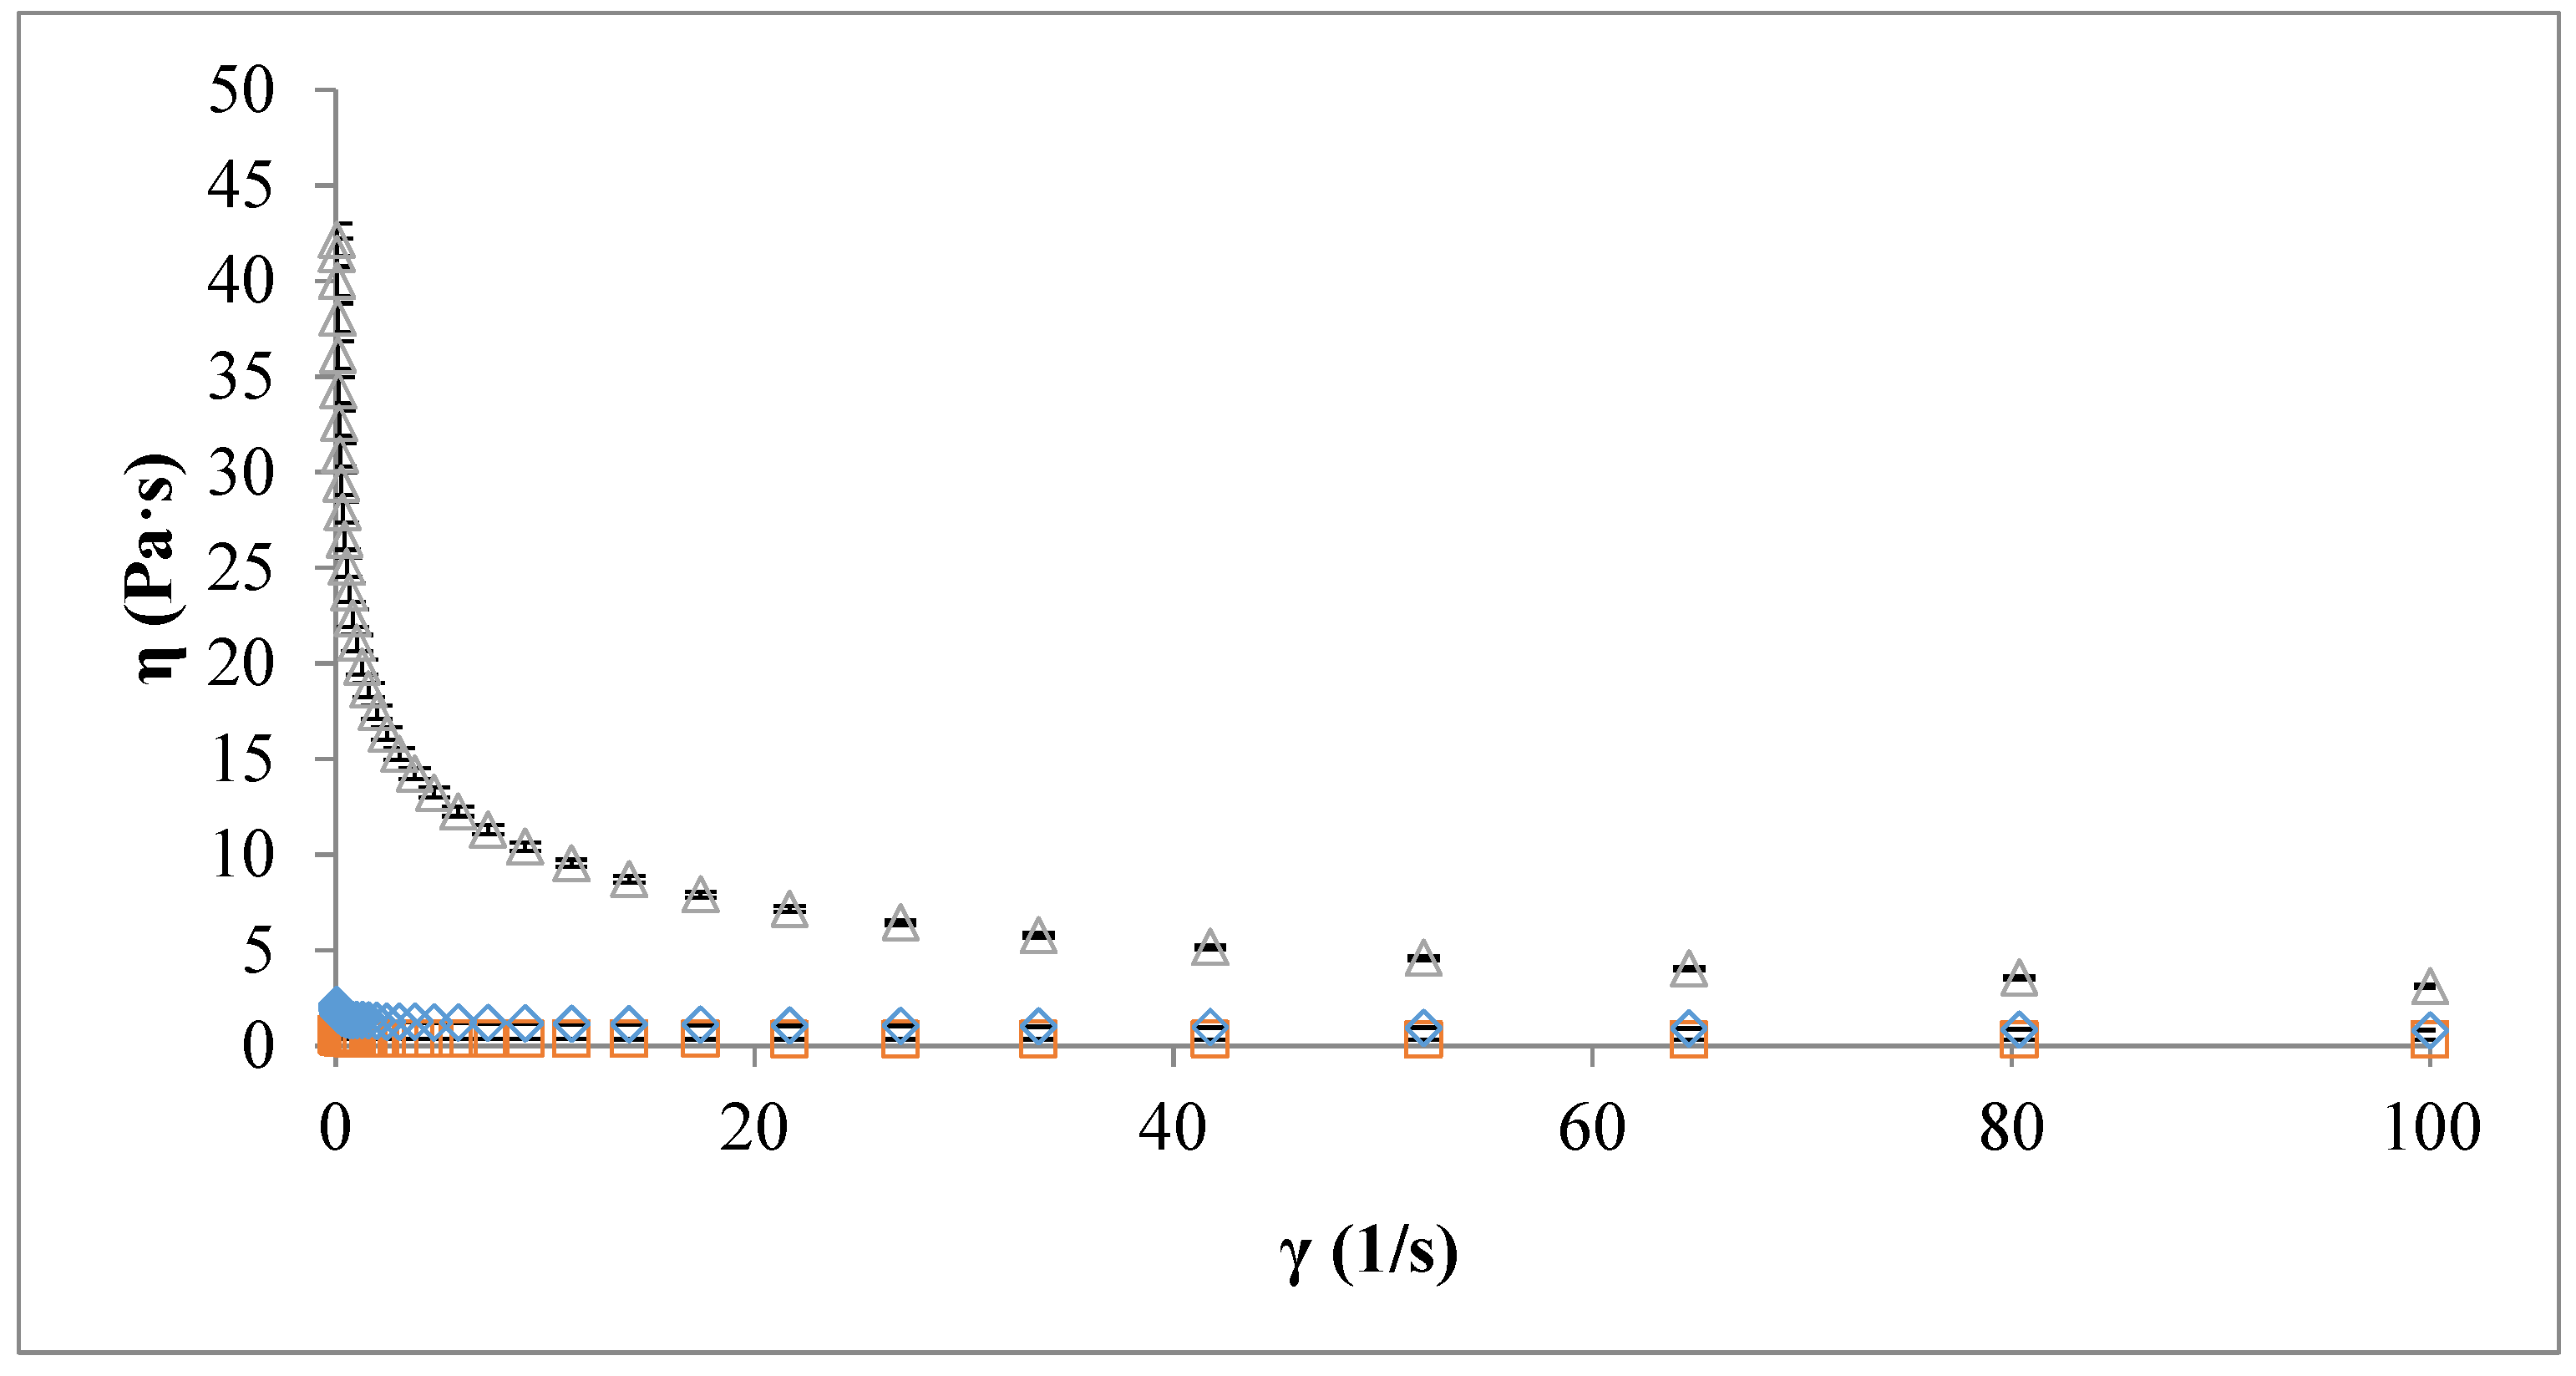
3.6.1. Flow Behaviour of Pectin Solutions
3.6.2. Viscoelastic Properties of Pectin Solutions
3.6.3. Creep and Recovery
Creep
Recovery
3.7. Morphological Characteristics of Pectin Samples
4. Conclusions
Author Contributions
Funding
Conflicts of Interest
References
- Müller-Maatsch, J.; Bencivenni, M.; Caligiani, A.; Tedeschi, T.; Bruggeman, G.; Bosch, M.; Petrusan, J.; Van Droogenbroeck, B.; Elst, K.; Sforza, S. Pectin content and composition from different food waste streams. Food Chem. 2016, 201, 37–45. [Google Scholar] [CrossRef] [PubMed]
- Grassino, A.N.; Brnčić, M.; Vikić-Topić, D.; Roca, S.; Dent, M.; Brnčić, S.R. Ultrasound assisted extraction and characterization of pectin from tomato waste. Food Chem. 2016, 198, 93–100. [Google Scholar] [CrossRef] [PubMed]
- Maneerat, N.; Tangsuphoom, N.; Nitithamyong, A. Effect of extraction condition on properties of pectin from banana peels and its function as fat replacer in salad cream. J. Food Sci. Technol. 2017, 54, 386–397. [Google Scholar] [CrossRef] [PubMed]
- Oliveira, T.Í.S.; Rosa, M.F.; Cavalcante, F.L.; Pereira, P.H.F.; Moates, G.K.; Wellner, N.; Mazzetto, S.E.; Waldron, K.W.; Azeredo, H.M.C. Optimization of pectin extraction from banana peels with citric acid by using response surface methodology. Food Chem. 2016, 198, 113–118. [Google Scholar] [CrossRef] [PubMed]
- Petkowicz, C.L.O.; Vriesmann, L.C.; Williams, P.A. Pectins from food waste: Extraction, characterization and properties of watermelon rind pectin. Food Hydrocoll. 2017, 65, 57–67. [Google Scholar] [CrossRef]
- Guandalini, B.B.V.; Rodrigues, N.P.; Marczak, L.D.F. Sequential extraction of phenolics and pectin from mango peel assisted by ultrasound. Food Res. Int. 2019, 119, 455–461. [Google Scholar] [CrossRef] [PubMed]
- Wang, M.; Huang, B.; Fan, C.; Zhao, K.; Hu, H.; Xu, X.; Pan, S.; Liu, F. Characterization and functional properties of mango peel pectin extracted by ultrasound assisted citric acid. Int. J. Biol. Macromol. 2016, 91, 794–803. [Google Scholar] [CrossRef]
- Yang, Y.; Wang, Z.; Hu, D.; Xiao, K.; Wu, J.-Y. Efficient extraction of pectin from sisal waste by combined enzymatic and ultrasonic process. Food Hydrocoll. 2018, 79, 189–196. [Google Scholar] [CrossRef]
- Muthusamy, S.; Manickam, L.P.; Murugesan, V.; Muthukumaran, C.; Pugazhendhi, A. Pectin extraction from Helianthus annuus (sunflower) heads using RSM and ANN modelling by a genetic algorithm approach. Int. J. Biol. Macromol. 2019, 124, 750–758. [Google Scholar] [CrossRef]
- Chaharbaghi, E.; Khodaiyan, F.; Hosseini, S.S. Optimization of pectin extraction from pistachio green hull as a new source. Carbohydr. Polym. 2017, 173, 107–113. [Google Scholar] [CrossRef]
- Dranca, F.; Oroian, M. Extraction, purification and characterization of pectin from alternative sources with potential technological applications. Food Res. Int. 2018, 113, 327–350. [Google Scholar] [CrossRef] [PubMed]
- Santiago, J.S.J.; Kyomugasho, C.; Maheshwari, S.; Jamsazzadeh Kermani, Z.; Van de Walle, D.; Van Loey, A.M.; Dewettinck, K.; Hendrickx, M.E. Unravelling the structure of serum pectin originating from thermally and mechanically processed carrot-based suspensions. Food Hydrocoll. 2018, 77, 482–493. [Google Scholar] [CrossRef]
- Voragen, A.G.J.; Coenen, G.J.; Verhoef, R.P.; Schols, H.A. Pectin, a versatile polysaccharide present in plant cell walls. Struct. Chem. 2009, 20, 263–275. [Google Scholar] [CrossRef]
- Broxterman, S.E.; Schols, H.A. Characterisation of pectin-xylan complexes in tomato primary plant cell walls. Carbohydr. Polym. 2018, 197, 269–276. [Google Scholar] [CrossRef] [PubMed]
- Ai, L.; Chung, Y.-C.; Lin, S.-Y.; Lee, K.-C.; Lai, P.F.-H.; Xia, Y.; Wang, G.; Cui, S.W. Active pectin fragments of high in vitro antiproliferation activities toward human colon adenocarcinoma cells: Rhamnogalacturonan II. Food Hydrocoll. 2018, 83, 239–245. [Google Scholar] [CrossRef]
- Adetunji, L.R.; Adekunle, A.; Orsat, V.; Raghavan, V. Advances in the pectin production process using novel extraction techniques: A review. Food Hydrocoll. 2017, 62, 239–250. [Google Scholar] [CrossRef]
- Freitas de Oliveira, C.; Giordani, D.; Lutckemier, R.; Gurak, P.D.; Cladera-Olivera, F.; Ferreira Marczak, L.D. Extraction of pectin from passion fruit peel assisted by ultrasound. LWT Food Sci. Technol. 2016, 71, 110–115. [Google Scholar] [CrossRef]
- Marić, M.; Grassino, A.N.; Zhu, Z.; Barba, F.J.; Brnčić, M.; Rimac Brnčić, S. An overview of the traditional and innovative approaches for pectin extraction from plant food wastes and by-products: Ultrasound-, microwaves-, and enzyme-assisted extraction. Trends Food Sci. Technol. 2018, 76, 28–37. [Google Scholar] [CrossRef]
- Chemat, F.; Rombaut, N.; Meullemiestre, A.; Turk, M.; Perino, S.; Fabiano-Tixier, A.-S.; Abert-Vian, M. Review of Green Food Processing techniques. Preservation, transformation, and extraction. Innov. Food Sci. Emerg. Technol. 2017, 41, 357–377. [Google Scholar] [CrossRef]
- Moorthy, I.G.; Maran, J.P.; Ilakya, S.; Anitha, S.L.; Sabarima, S.P.; Priya, B. Ultrasound assisted extraction of pectin from waste Artocarpus heterophyllus fruit peel. Ultrason. Sonochem. 2017, 34, 525–530. [Google Scholar] [CrossRef] [PubMed]
- Dranca, F.; Oroian, M. Optimization of ultrasound-assisted extraction of total monomeric anthocyanin (TMA) and total phenolic content (TPC) from eggplant (Solanum melongena L.) peel. Ultrason. Sonochem. 2016, 31, 637–646. [Google Scholar] [CrossRef] [PubMed]
- Wang, W.; Ma, X.; Jiang, P.; Hu, L.; Zhi, Z.; Chen, J.; Ding, T.; Ye, X.; Liu, D. Characterization of pectin from grapefruit peel: A comparison of ultrasound-assisted and conventional heating extractions. Food Hydrocoll. 2016, 61, 730–739. [Google Scholar] [CrossRef]
- Hosseini, S.S.; Khodaiyan, F.; Kazemi, M.; Najari, Z. Optimization and characterization of pectin extracted from sour orange peel by ultrasound assisted method. Int. J. Biol. Macromol. 2019, 125, 621–629. [Google Scholar] [CrossRef] [PubMed]
- Maran, J.P.; Priya, B. Ultrasound-assisted extraction of pectin from sisal waste. Carbohydr. Polym. 2015, 115, 732–738. [Google Scholar] [CrossRef]
- Ponmurugan, K.; Al-Dhabi, N.A.; Maran, J.P.; Karthikeyan, K.; Moothy, I.G.; Sivarajasekar, N.; Manoj, J.J.B. Ultrasound assisted pectic polysaccharide extraction and its characterization from waste heads of Helianthus annus. Carbohydr. Polym. 2017, 173, 707–713. [Google Scholar] [CrossRef]
- Liew, S.Q.; Ngoh, G.C.; Yusoff, R.; Teoh, W.H. Sequential ultrasound-microwave assisted acid extraction (UMAE) of pectin from pomelo peels. Int. J. Biol. Macromol. 2016, 93, 426–435. [Google Scholar] [CrossRef] [PubMed]
- Xu, S.-Y.; Liu, J.-P.; Huang, X.; Du, L.-P.; Shi, F.-L.; Dong, R.; Huang, X.-T.; Zheng, K.; Liu, Y.; Cheong, K.-L. Ultrasonic-microwave assisted extraction, characterization and biological activity of pectin from jackfruit peel. LWT 2018, 90, 577–582. [Google Scholar] [CrossRef]
- Dranca, F.; Oroian, M. Effect of acid type and particle size on the yield and purity of apple (Malus domestica ‘Fălticeni’) pomace pectin. Food Environ. Saf. J. 2018, 17, 246–251. [Google Scholar]
- Melton, L.D.; Smith, B.G. Determination of the Uronic Acid Content of Plant Cell Walls Using a Colorimetric Assay. Curr. Protoc. Food Anal. Chem. 2001, E3.3.1–E3.3.4. [Google Scholar] [CrossRef]
- Miceli-Garcia, L.G. Pectin from Apple Pomace: Extraction, Characterization, and Utilization in Encapsulating Alpha-Tocopherol Acetate. Master’s Thesis, Student Research in Food Science and Technology, University of Nebraska-Lincoln, Lincoln, Nebraska, 2014. [Google Scholar]
- Franchi, M.L.; Marzialetti, M.B.; Pose, G.N.; Cavalitto, S.F. Evaluation of Enzymatic Pectin Extraction by a Recombinant Polygalacturonase (PGI) from Apples and Pears Pomace of Argentinean Production and Characterization of the Extracted Pectin. J. Food Process. Technol. 2014, 5, 8–11. [Google Scholar] [CrossRef]
- Yilmaz, M.T.; Tatlisu, N.B.; Toker, O.S.; Karaman, S.; Dertli, E.; Sagdic, O.; Arici, M. Steady, dynamic and creep rheological analysis as a novel approach to detect honey adulteration by fructose and saccharose syrups: Correlations with HPLC-RID results. Food Res. Int. 2014, 64, 634–646. [Google Scholar] [CrossRef] [PubMed]
- Maran, J.P.; Priya, B.; Al-Dhabi, N.A.; Ponmurugan, K.; Moorthy, I.G.; Sivarajasekar, N. Ultrasound assisted citric acid mediated pectin extraction from industrial waste of Musa balbisiana. Ultrason. Sonochem. 2017, 35, 204–209. [Google Scholar] [CrossRef] [PubMed]
- Xu, Y.; Zhang, L.; Bailina, Y.; Ge, Z.; Ding, T.; Ye, X.; Liu, D. Effects of ultrasound and/or heating on the extraction of pectin from grapefruit peel. J. Food Eng. 2014, 126, 72–81. [Google Scholar] [CrossRef]
- Filgueiras, A.; Capelo, J.; Lavilla, I.; Bendicho, C. Comparison of ultrasound-assisted extraction and microwave-assisted digestion for determination of magnesium, manganese and zinc in plant samples by flame atomic absorption spectrometry. Talanta 2000, 53, 433–441. [Google Scholar] [CrossRef]
- Pereira, P.H.F.; Oliveira, T.Í.S.; Rosa, M.F.; Cavalcante, F.L.; Moates, G.K.; Wellner, N.; Waldron, K.W.; Azeredo, H.M.C. Pectin extraction from pomegranate peels with citric acid. Int. J. Biol. Macromol. 2016, 88, 373–379. [Google Scholar] [CrossRef]
- Moorthy, I.G.; Maran, J.P.; Muneeswari, S.; Naganyashree, S.; Shivamathi, C.S. Response surface optimization of ultrasound assisted extraction of pectin from pomegranate peel. Int. J. Biol. Macromol. 2015, 72, 1323–1328. [Google Scholar] [CrossRef] [PubMed]
- Al-Dhabi, N.A.; Ponmurugan, K.; Maran Jeganathan, P. Development and validation of ultrasound-assisted solid-liquid extraction of phenolic compounds from waste spent coffee grounds. Ultrason. Sonochem. 2017, 34, 206–213. [Google Scholar] [CrossRef]
- Wang, X.; Chen, Q.; Lü, X. Pectin extracted from apple pomace and citrus peel by subcritical water. Food Hydrocoll. 2014, 38, 129–137. [Google Scholar] [CrossRef]
- Kumar, A.; Chauhan, G.S. Extraction and characterization of pectin from apple pomace and its evaluation as lipase (steapsin) inhibitor. Carbohydr. Polym. 2010, 82, 454–459. [Google Scholar] [CrossRef]
- Constenla, D.; Ponce, A.G.; Lozano, J.E. Effect of Pomace Drying on Apple Pectin. LWT Food Sci. Technol. 2002, 35, 216–221. [Google Scholar] [CrossRef]
- Kaya, M.; Sousa, A.G.; Crépeau, M.J.; Sørensen, S.O.; Ralet, M.C. Characterization of citrus pectin samples extracted under different conditions: Influence of acid type and pH of extraction. Ann. Bot. 2014, 114, 1319–1326. [Google Scholar] [CrossRef]
- Lutz, R.; Aserin, A.; Wicker, L.; Garti, N. Structure and physical properties of pectins with block-wise distribution of carboxylic acid groups. Food Hydrocoll. 2009, 23, 786–794. [Google Scholar] [CrossRef]
- De Oliveira, C.F.; Giordani, D.; Gurak, P.D.; Cladera-Olivera, F.; Marczak, L.D.F. Extraction of pectin from passion fruit peel using moderate electric field and conventional heating extraction methods. Innov. Food Sci. Emerg. Technol. 2015, 29, 201–208. [Google Scholar] [CrossRef]
- Zhang, L.; Ye, X.; Ding, T.; Sun, X.; Xu, Y.; Liu, D. Ultrasound effects on the degradation kinetics, structure and rheological properties of apple pectin. Ultrason. Sonochem. 2013, 20, 222–231. [Google Scholar] [CrossRef]
- Hosseini, S.S.; Khodaiyan, F.; Yarmand, M.S. Optimization of microwave assisted extraction of pectin from sour orange peel and its physicochemical properties. Carbohydr. Polym. 2016, 140, 59–65. [Google Scholar] [CrossRef]
- Muñoz-Almagro, N.; Montilla, A.; Moreno, F.J.; Villamiel, M. Modification of citrus and apple pectin by power ultrasound: Effects of acid and enzymatic treatment. Ultrason. Sonochem. 2017, 38, 807–819. [Google Scholar] [CrossRef]
- Montgomery, D.C. Design and Analysis of Experiments, 6th ed.; John Wiley & Sons, Ltd.: Hoboken, NJ, USA, 2005. [Google Scholar]
- Wang, W.; Ma, X.; Xu, Y.; Cao, Y.; Jiang, Z.; Ding, T.; Ye, X.; Liu, D. Ultrasound-assisted heating extraction of pectin from grapefruit peel: Optimization and comparison with the conventional method. Food Chem. 2015, 178, 106–114. [Google Scholar] [CrossRef]
- Pappas, C.S.; Malovikova, A.; Hromadkova, Z.; Tarantilis, P.A.; Ebringerova, A.; Polissiou, M.G. Determination of the degree of esterification of pectinates with decyl and benzyl ester groups by diffuse reflectance infrared Fourier transform spectroscopy (DRIFTS) and curve-fitting deconvolution method. Carbohydr. Polym. 2004, 56, 465–469. [Google Scholar] [CrossRef]
- Urias-Orona, V.; Rascón-Chu, A.; Lizardi-Mendoza, J.; Carvajal-Millán, E.; Gardea, A.A.; Ramírez-Wong, B. A novel pectin material: Extraction, characterization and gelling properties. Int. J. Mol. Sci. 2010, 11, 3686–3695. [Google Scholar] [CrossRef]
- Ninan, N.; Muthiah, M.; Park, I.-K.; Elain, A.; Thomas, S.; Grohens, Y. Pectin/carboxymethyl cellulose/microfibrillated cellulose composite scaffolds for tissue engineering. Carbohydr. Polym. 2013, 98, 877–885. [Google Scholar] [CrossRef]
- Acikgoz, C. Extraction and characterization of pectin obtained from quince fruits (Cydonia vulgaris pers) grown in Turkey. Asian J. Chem. 2011, 23, 149–152. [Google Scholar]
- Jiang, Y.; Du, J.; Zhang, L.; Li, W. Properties of pectin extracted from fermented and steeped hawthorn wine pomace: A comparison. Carbohydr. Polym. 2018, 197, 174–182. [Google Scholar] [CrossRef]
- Lewandowska, K.; Dąbrowska, A.; Kaczmarek, H. Rheological properties of pectin, poly(vinyl alcohol) and their blends in aqueous solutions. e-Polymers 2012, 12. [Google Scholar] [CrossRef]
- Rodsamran, P.; Sothornvit, R. Microwave heating extraction of pectin from lime peel: Characterization and properties compared with the conventional heating method. Food Chem. 2019, 278, 364–372. [Google Scholar] [CrossRef]
- Barbieri, S.F.; da Costa Amaral, S.; Ruthes, A.C.; de Oliveira Petkowicz, C.L.; Kerkhoven, N.C.; da Silva, E.R.A.; Silveira, J.L.M. Pectins from the pulp of gabiroba (Campomanesia xanthocarpa Berg): Structural characterization and rheological behavior. Carbohydr. Polym. 2019, 214, 250–258. [Google Scholar] [CrossRef]
- Vriesmann, L.C.; Petkowicz, C.L.O. Highly acetylated pectin from cacao pod husks (Theobroma cacao L.) forms gel. Food Hydrocoll. 2013, 33, 58–65. [Google Scholar] [CrossRef]
- Min, B.; Lim, J.; Ko, S.; Lee, K.-G.; Lee, S.H.; Lee, S. Environmentally friendly preparation of pectins from agricultural byproducts and their structural/rheological characterization. Bioresour. Technol. 2011, 102, 3855–3860. [Google Scholar] [CrossRef]
- Hua, X.; Wang, K.; Yang, R.; Kang, J.; Yang, H. Edible coatings from sunflower head pectin to reduce lipid uptake in fried potato chips. LWT Food Sci. Technol. 2015, 62, 1220–1225. [Google Scholar] [CrossRef]
- Padmanabhan, P.A.; Kim, D.-S.; Pak, D.; Sim, S.J. Rheology and gelation of water-insoluble dextran from Leuconostoc mesenteroides NRRL B-523. Carbohydr. Polym. 2003, 53, 459–468. [Google Scholar] [CrossRef]
- Toker, O.S.; Karaman, S.; Yuksel, F.; Dogan, M.; Kayacier, A.; Yilmaz, M.T. Temperature dependency of steady, dynamic, and creep-recovery rheological properties of ice cream mix. Food Bioprocess Technol. 2013, 6, 2974–2985. [Google Scholar] [CrossRef]
- Huang, J.; Zeng, S.; Xiong, S.; Huang, Q. Steady, dynamic, and creep-recovery rheological properties of myofibrillar protein from grass carp muscle. Food Hydrocoll. 2016, 61, 48–56. [Google Scholar] [CrossRef]
- Fracasso, A.F.; Perussello, C.A.; Carpiné, D.; de Oliveira Petkowicz, C.L.; Haminiuk, C.W.I. Chemical modification of citrus pectin: Structural, physical and rheologial implications. Int. J. Biol. Macromol. 2018, 109, 784–792. [Google Scholar] [CrossRef]
- Einhorn-Stoll, U.; Benthin, A.; Zimathies, A.; Görke, O.; Drusch, S. Pectin-water interactions: Comparison of different analytical methods and influence of storage. Food Hydrocoll. 2015, 43, 577–583. [Google Scholar] [CrossRef]


 ), commercial apple pectin (
 ), and ultrasound extracted apple pectin (
 ); η—dynamic viscosity, γ—shear rate.
), commercial apple pectin (), and ultrasound extracted apple pectin (); η—dynamic viscosity, γ—shear rate.
); η—dynamic viscosity, γ—shear rate.
), commercial apple pectin (), and ultrasound extracted apple pectin (); η—dynamic viscosity, γ—shear rate.
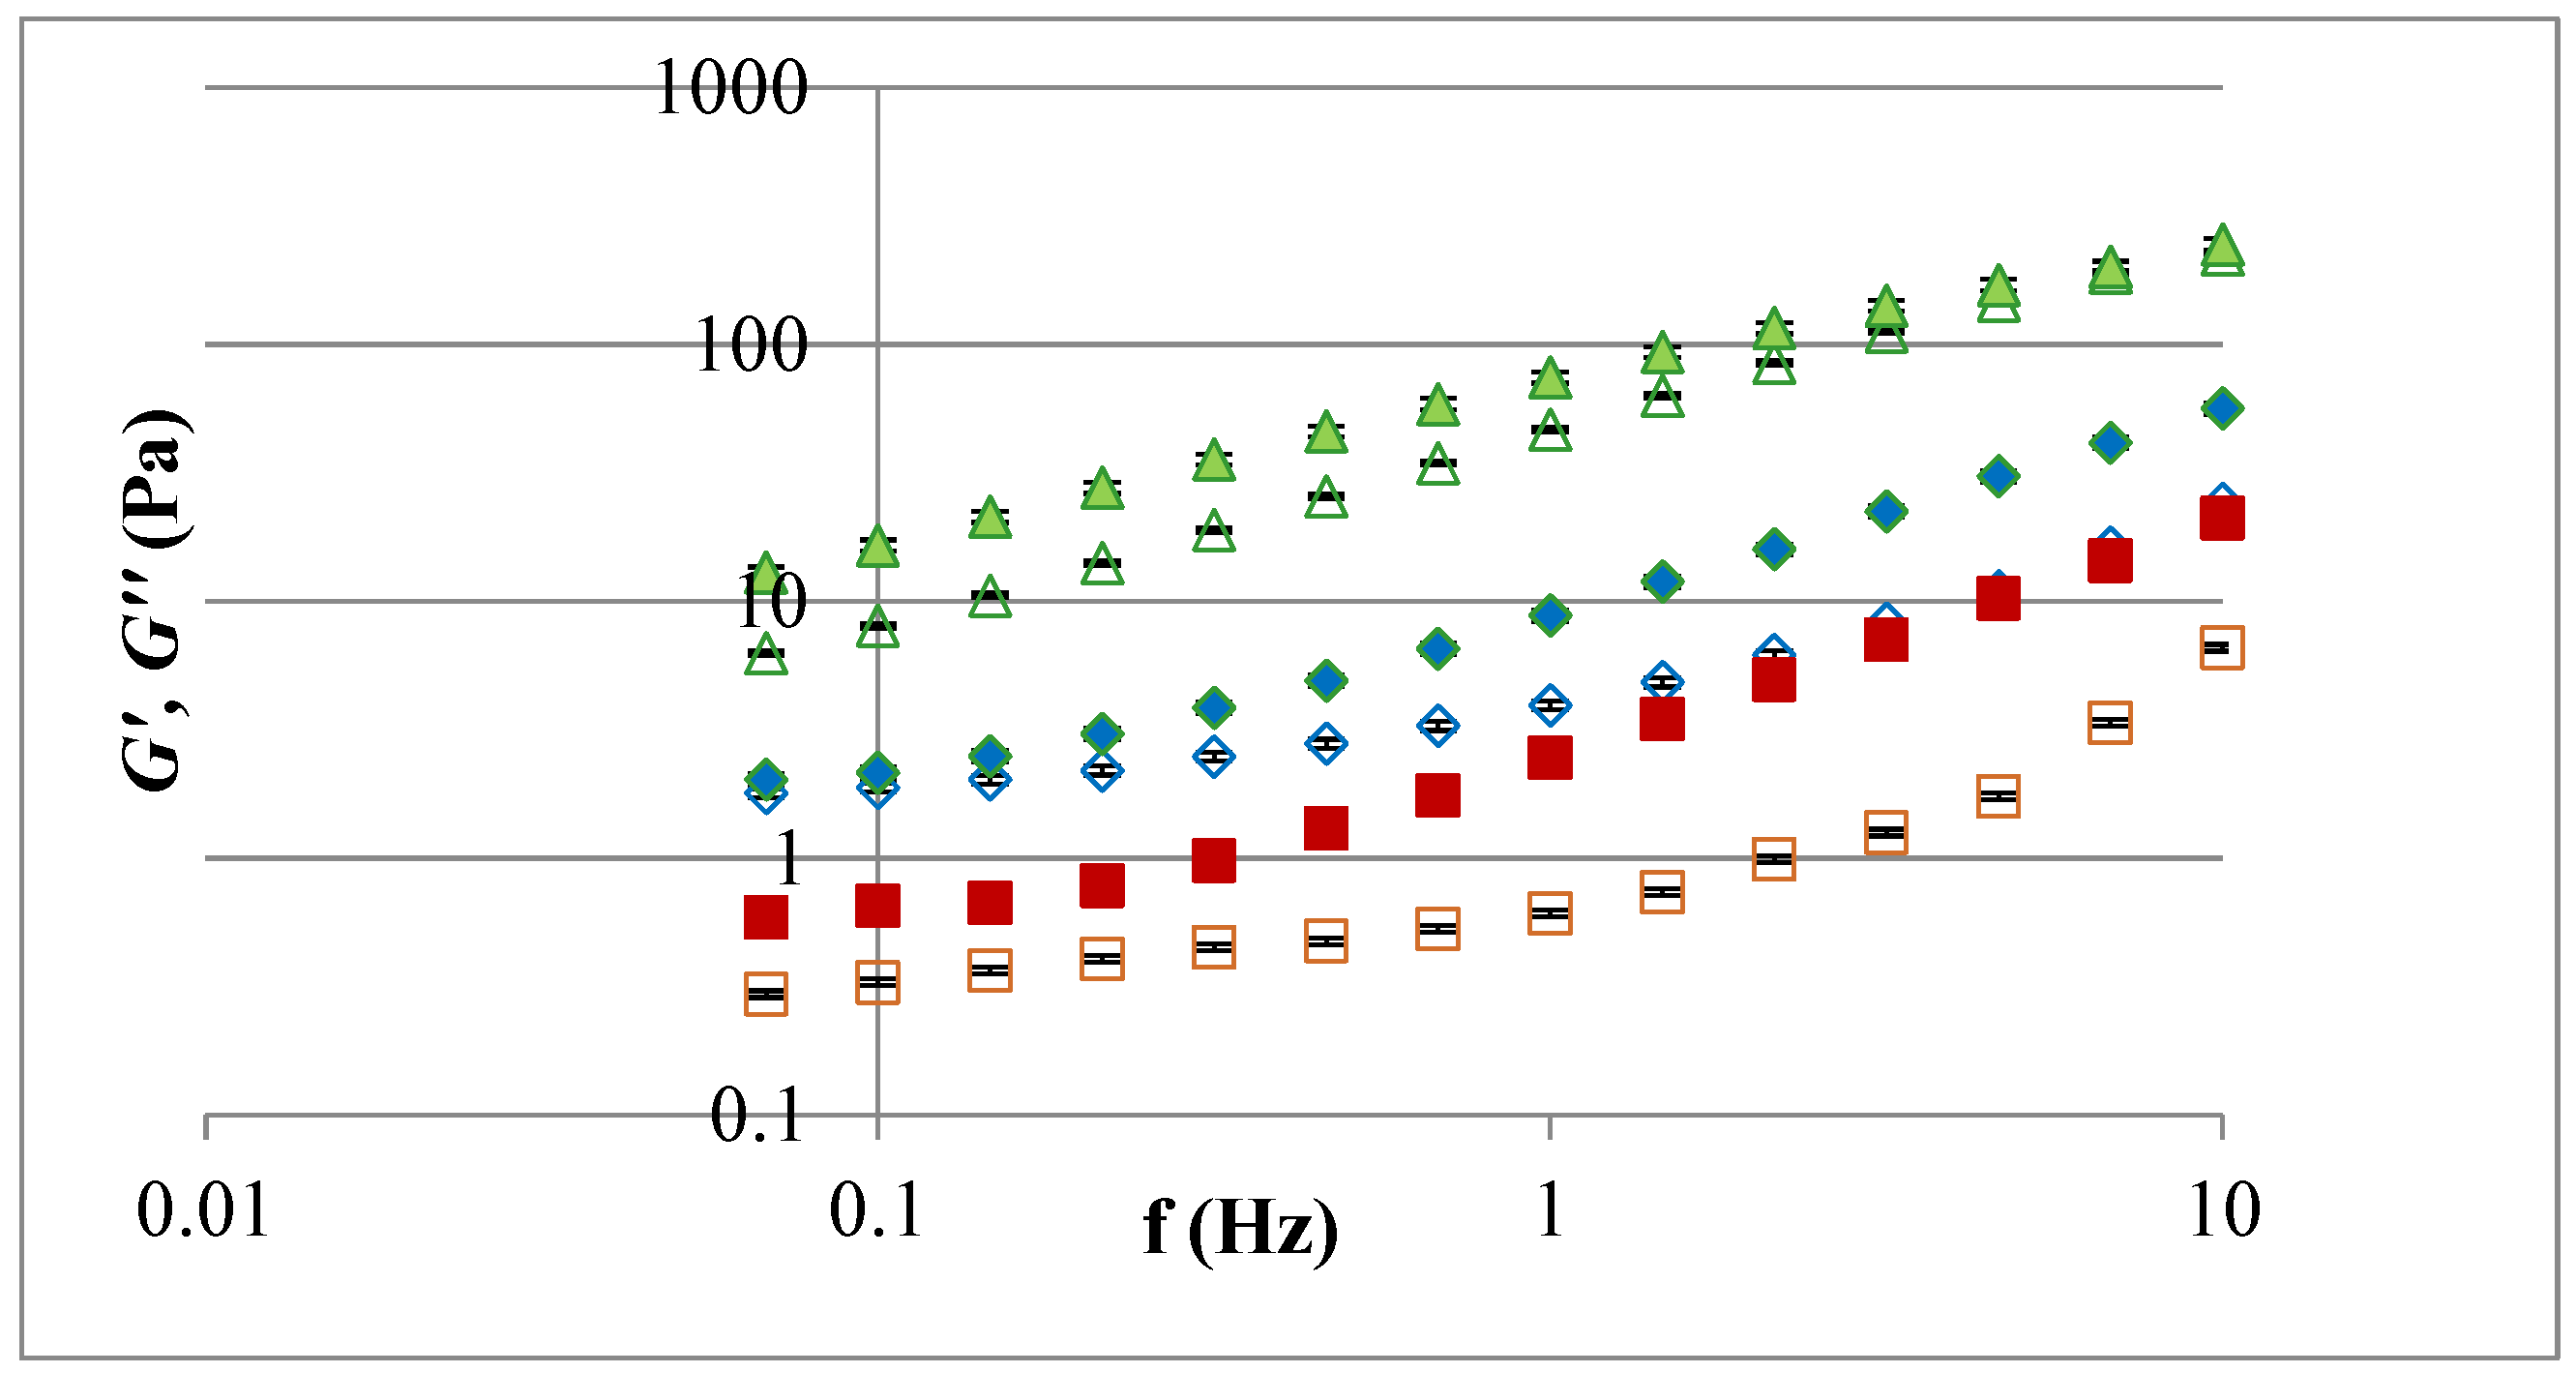
 ,
, ), commercial apple pectin (
 ,
, ) and ultrasound extracted apple pectin (
 ,
, ); G′—elastic modulus, G″—loss modulus, f—frequency.
,), commercial apple pectin (,) and ultrasound extracted apple pectin (,); G′—elastic modulus, G″—loss modulus, f—frequency.
); G′—elastic modulus, G″—loss modulus, f—frequency.
,), commercial apple pectin (,) and ultrasound extracted apple pectin (,); G′—elastic modulus, G″—loss modulus, f—frequency.
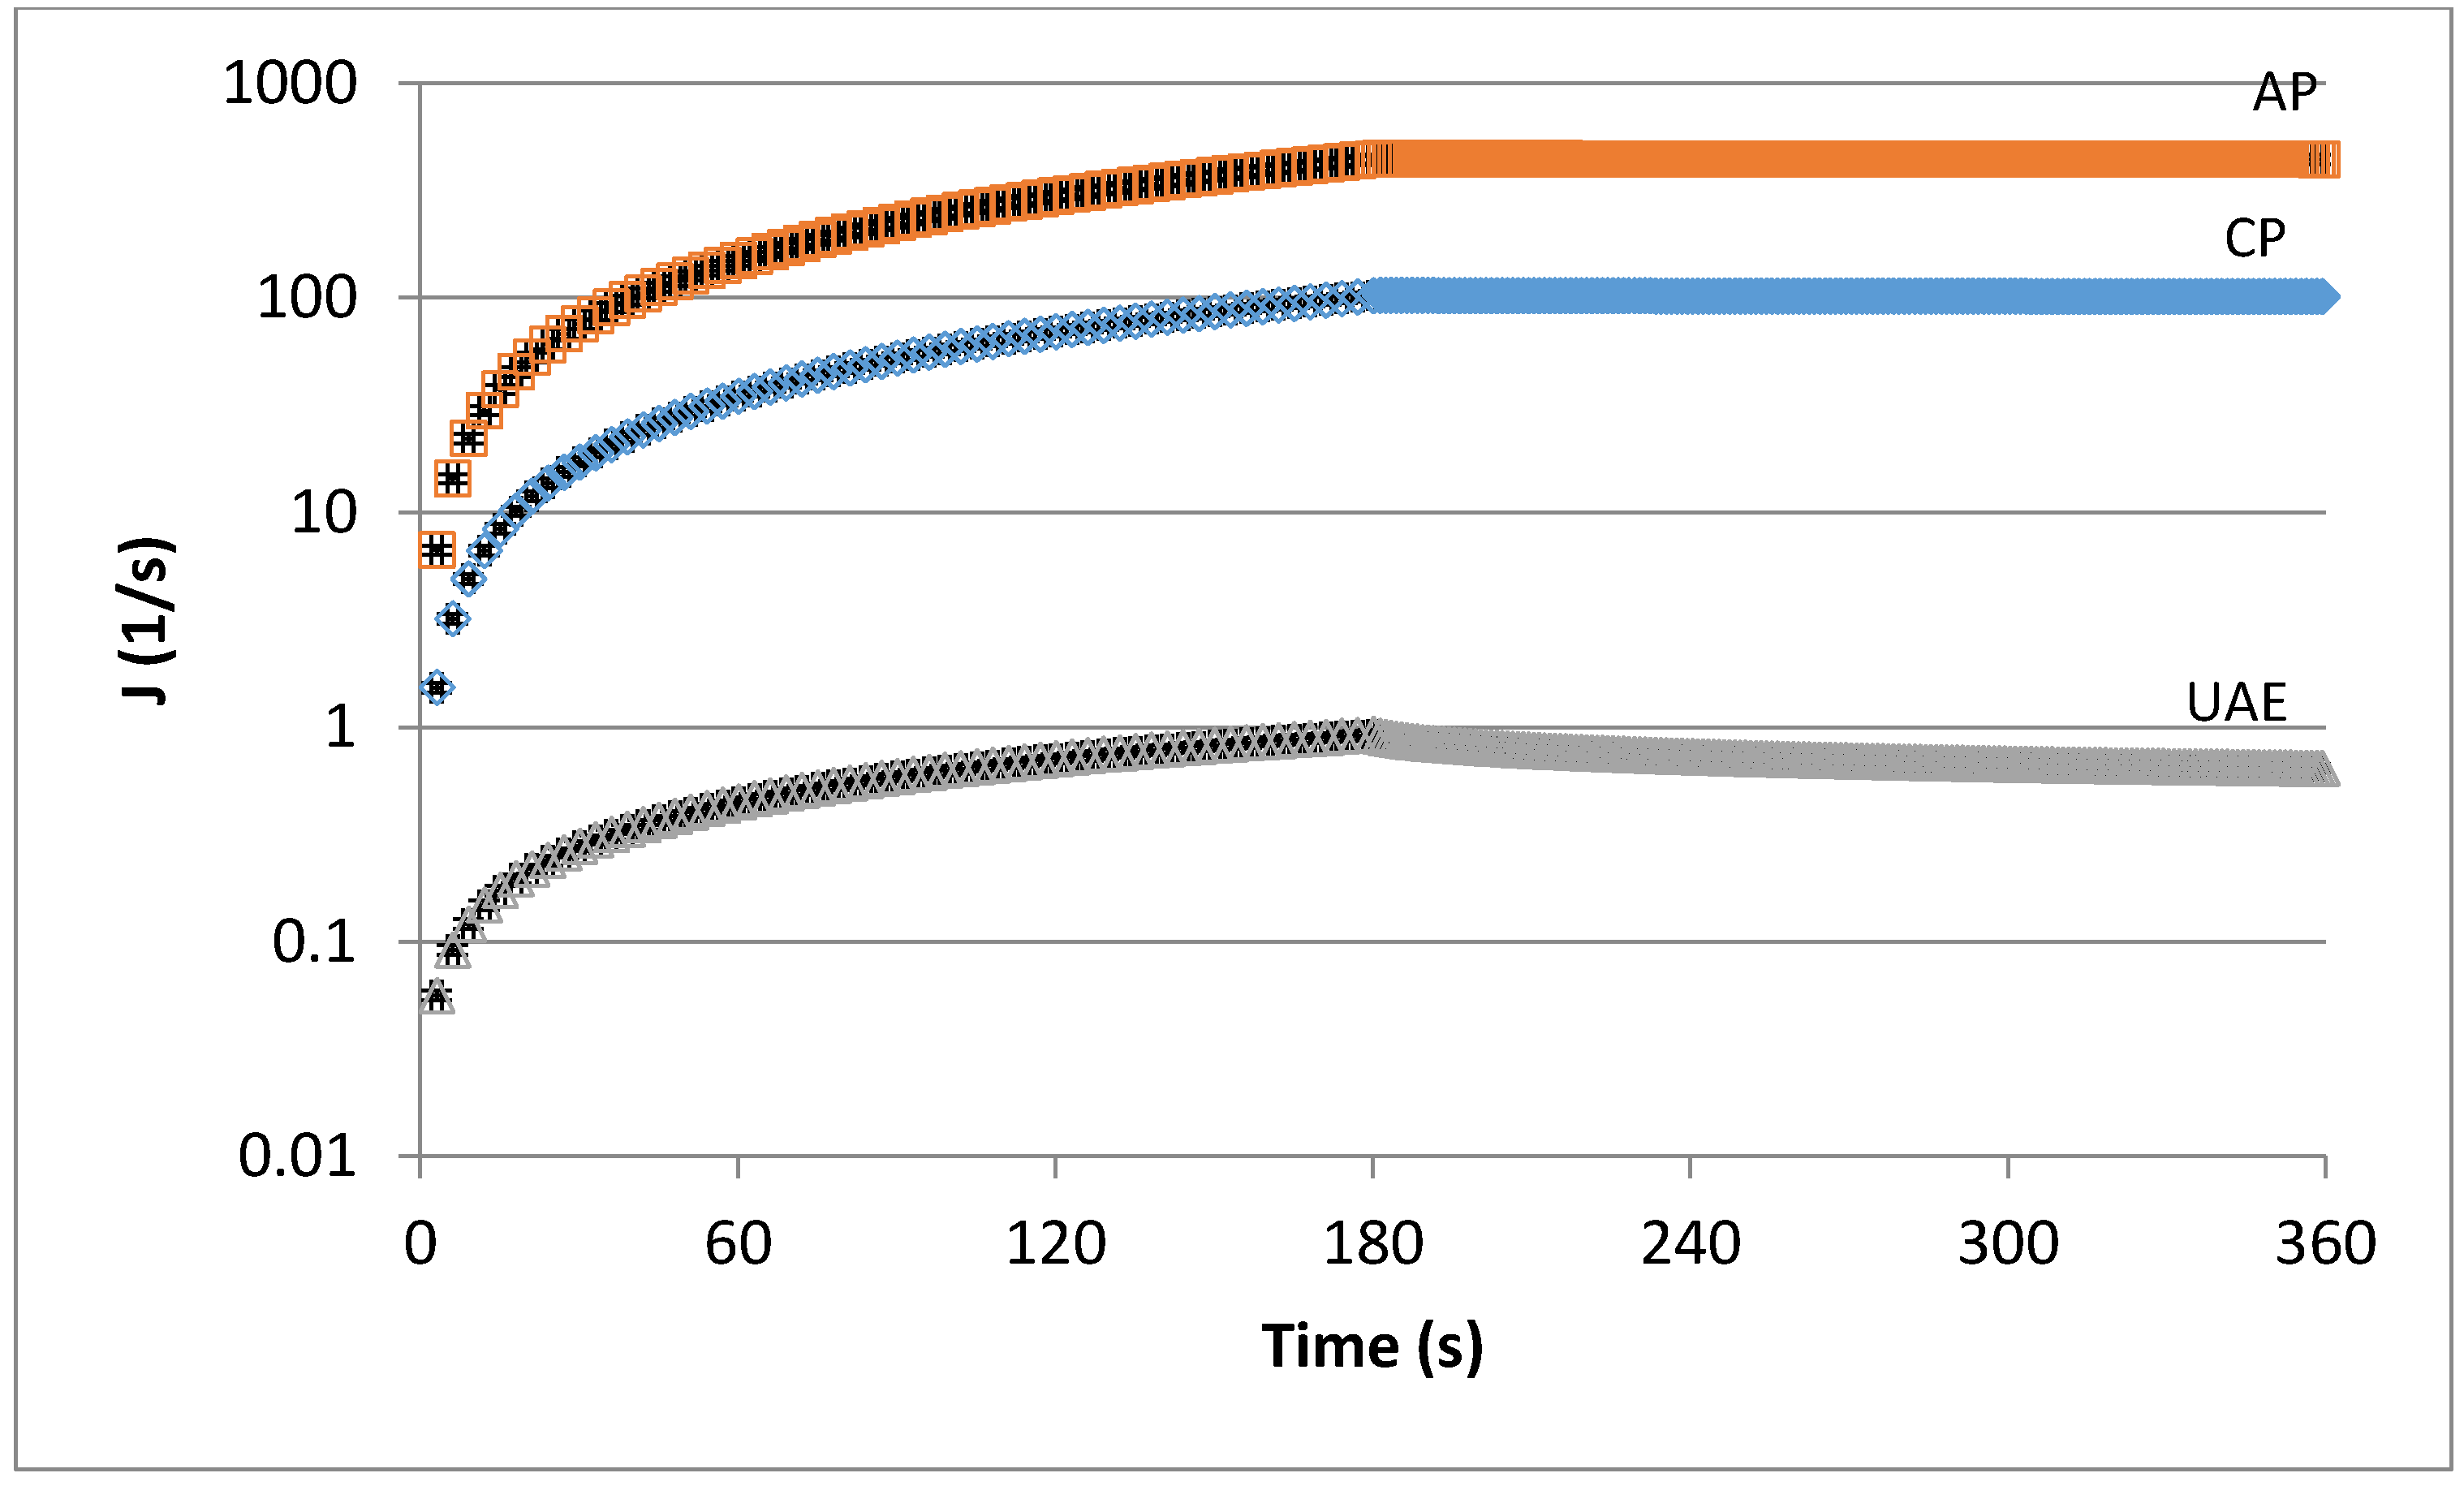
 ), commercial apple pectin (AP,
 ), and ultrasound extracted apple pectin (UAE,
 ), J—compliance.
), commercial apple pectin (AP,), and ultrasound extracted apple pectin (UAE,), J—compliance.
), J—compliance.
), commercial apple pectin (AP,), and ultrasound extracted apple pectin (UAE,), J—compliance.


| Variables | Levels | ||
|---|---|---|---|
| −1 | 0 | 1 | |
| Amplitude (%) | 20 | 60 | 100 |
| pH | 1.5 | 2 | 2.5 |
| Solid-to-liquid ratio (g/mL) | 1:10 | 1:15 | 1:20 |
| Time (min) | 10 | 20 | 30 |
| Run | Independent Variables | Measured Response | Predicted Response | |||||||
|---|---|---|---|---|---|---|---|---|---|---|
| Amplitude (%) | pH | SLR (g/mL) | Time (min) | Y (%) | GalA (g/100 g) | DE(%) | Y (%) | GalA (g/100 g) | DE(%) | |
| 1 | 100 | 2 | 1:10 | 20 | 3.94 | 87.23 | 81.35 | 4.34 | 88.71 | 78.39 |
| 2 | 100 | 2.5 | 1:15 | 20 | 2.62 | 79.02 | 74.12 | 2.74 | 79.94 | 77.67 |
| 3 | 100 | 2 | 1:15 | 30 | 7.53 | 96.19 | 84.80 | 6.78 | 96.77 | 84.28 |
| 4 | 60 | 2 | 1:15 | 20 | 2.37 | 99.08 | 83.73 | 2.37 | 99.09 | 83.73 |
| 5 | 60 | 1.5 | 1:15 | 30 | 9.18 | 82.37 | 69.86 | 8.92 | 85.01 | 68.13 |
| 6 | 60 | 1.5 | 1:15 | 10 | 5.44 | 82.46 | 66.37 | 5.28 | 84.72 | 66.24 |
| 7 | 20 | 2.5 | 1:15 | 20 | 2.03 | 99.04 | 91.48 | 2.03 | 99.18 | 93.63 |
| 8 | 60 | 2 | 1:20 | 30 | 3.15 | 92.75 | 80.55 | 3.51 | 89.20 | 82.68 |
| 9 | 20 | 2 | 1:15 | 30 | 2.19 | 67.17 | 81.05 | 2.17 | 71.74 | 80.15 |
| 10 | 20 | 1.5 | 1:15 | 20 | 4.68 | 71.35 | 60.34 | 4.90 | 68.77 | 61.92 |
| 11 | 60 | 2 | 1:10 | 30 | 3.65 | 98.07 | 86.62 | 4.17 | 96.19 | 90.25 |
| 12 | 60 | 2 | 1:15 | 20 | 2.37 | 99.08 | 83.73 | 2.37 | 99.09 | 83.73 |
| 13 | 20 | 2 | 1:10 | 20 | 2.17 | 99.44 | 87.24 | 1.96 | 96.70 | 86.06 |
| 14 | 60 | 2.5 | 1:15 | 10 | 2.19 | 96.08 | 89.29 | 2.44 | 93.32 | 88.26 |
| 15 | 60 | 2 | 1:10 | 10 | 1.97 | 91.22 | 79.34 | 1.95 | 93.11 | 82.34 |
| 16 | 20 | 2 | 1:15 | 10 | 2.03 | 92.70 | 90.52 | 2.46 | 93.90 | 88.67 |
| 17 | 60 | 2.5 | 1:20 | 20 | 1.68 | 96.16 | 87.08 | 1.60 | 97.96 | 86.12 |
| 18 | 100 | 1.5 | 1:15 | 20 | 9.14 | 99.86 | 61.32 | 9.48 | 97.07 | 64.30 |
| 19 | 60 | 1.5 | 1:20 | 20 | 6.45 | 88.64 | 70.36 | 6.56 | 89.15 | 69.07 |
| 20 | 20 | 2 | 1:20 | 20 | 1.98 | 83.52 | 82.91 | 1.57 | 81.93 | 83.11 |
| 21 | 60 | 1.5 | 1:10 | 20 | 6.78 | 93.59 | 67.06 | 6.53 | 93.57 | 65.65 |
| 22 | 60 | 2 | 1:15 | 20 | 2.37 | 99.08 | 83.73 | 2.37 | 99.09 | 83.73 |
| 23 | 60 | 2 | 1:15 | 20 | 2.37 | 99.08 | 83.73 | 2.37 | 99.09 | 83.73 |
| 24 | 100 | 2 | 1:15 | 10 | 3.45 | 79.73 | 72.42 | 3.14 | 76.93 | 70.95 |
| 25 | 60 | 2 | 1:15 | 20 | 2.37 | 99.08 | 83.73 | 2.37 | 99.09 | 83.73 |
| 26 | 60 | 2.5 | 1:10 | 20 | 2.31 | 97.77 | 94.75 | 1.88 | 99.04 | 93.67 |
| 27 | 60 | 2.5 | 1:15 | 30 | 2.00 | 93.09 | 93.81 | 2.15 | 90.71 | 91.18 |
| 28 | 60 | 2 | 1:20 | 10 | 2.54 | 94.39 | 84.28 | 2.36 | 94.60 | 85.77 |
| 29 | 100 | 2 | 1:20 | 20 | 4.27 | 95.36 | 78.77 | 4.48 | 97.98 | 77.19 |
| Source | Sum of Squares | Degree of Freedom | Mean Square | F-Value | p-Value |
|---|---|---|---|---|---|
| (A) Pectin Yield % | |||||
| Model | 132.28 | 14 | 9.45 | 57.40 | <0.0001 |
| Amplitude | 20.99 | 1 | 20.99 | 127.52 | <0.0001 |
| pH | 69.28 | 1 | 69.28 | 420.90 | <0.0001 |
| SLR | 0.04 | 1 | 0.04 | 0.28 | 0.6033 |
| Time | 8.45 | 1 | 8.45 | 51.36 | <0.0001 |
| Amplitude× pH | 3.73 | 1 | 3.73 | 22.68 | 0.0003 |
| Amplitude× SLR | 0.06 | 1 | 0.06 | 0.42 | 0.5251 |
| Amplitude× time | 3.86 | 1 | 3.86 | 23.44 | 0.0003 |
| pH× SLR | 0.02 | 1 | 0.02 | 0.13 | 0.7204 |
| pH× time | 3.88 | 1 | 3.88 | 23.54 | 0.0003 |
| SLR× time | 0.28 | 1 | 0.28 | 1.74 | 0.2081 |
| R2 | 0.9829 | ||||
| Adjusted R2 | 0.9658 | ||||
| (B) Galacturonic Acid Content g/100 g | |||||
| Model | 2088.87 | 14 | 149.20 | 17.93 | <0.0001 |
| Amplitude | 48.68 | 1 | 48.68 | 5.85 | 0.0298 |
| pH | 153.16 | 1 | 153.16 | 18.40 | 0.0007 |
| SLR | 22.68 | 1 | 22.68 | 2.73 | 0.1210 |
| Time | 4.01 | 1 | 4.01 | 0.48 | 0.4991 |
| Amplitude× pH | 589.02 | 1 | 589.02 | 70.78 | <0.0001 |
| Amplitude× SLR | 144.56 | 1 | 144.56 | 17.37 | 0.0009 |
| Amplitude× time | 440.97 | 1 | 440.97 | 52.99 | <0.0001 |
| pH× SLR | 2.78 | 1 | 2.78 | 0.33 | 0.5723 |
| pH× time | 2.11 | 1 | 2.11 | 0.25 | 0.6227 |
| SLR× time | 17.99 | 1 | 17.99 | 2.16 | 0.1636 |
| R2 | 0.9472 | ||||
| Adjusted R2 | 0.8943 | ||||
| (C) Degree of Esterification % | |||||
| Model | 2283.74 | 14 | 163.12 | 24.40 | <0.0001 |
| Amplitude | 138.45 | 1 | 138.45 | 20.71 | 0.0005 |
| pH | 1523.70 | 1 | 1523.70 | 227.89 | <0.0001 |
| SLR | 12.83 | 1 | 12.83 | 1.92 | 0.1876 |
| Time | 17.45 | 1 | 17.45 | 2.61 | 0.1285 |
| Amplitude× pH | 84.09 | 1 | 84.09 | 12.58 | 0.0032 |
| Amplitude× SLR | 0.76 | 1 | 0.76 | 0.11 | 0.7401 |
| Amplitude× time | 119.36 | 1 | 119.36 | 17.85 | 0.0008 |
| pH× SLR | 30.09 | 1 | 30.09 | 4.50 | 0.0522 |
| pH× time | 0.26 | 1 | 0.26 | 0.03 | 0.8450 |
| SLR× time | 30.31 | 1 | 30.31 | 4.53 | 0.0515 |
| R2 | 0.9606 | ||||
| Adjusted R2 | 0.9213 | ||||
| Sample | Galacturonic Acid Content g/100 g a | DE % b |
|---|---|---|
| UAE pectin | 94.491 | 76.715 |
| Commercial citrus pectin | 87.601 | 50.584 |
| Commercialapple pectin | 88.835 | 88.526 |
| Sample | Burger Model Parameters | ||||
|---|---|---|---|---|---|
| G0 | G1 | η1 | η0 | R2 | |
| UAE pectin | 10.200 | 0.001 | 1.328 | 1.294 | 0.956 |
| Commercial citrus pectin | 0.197 | 4.700·10−6 | 0.040 | 0.039 | 0.979 |
| Commercial apple pectin | 0.043 | 9.600·10−7 | 0.090 | 0.090 | 0.980 |
© 2019 by the authors. Licensee MDPI, Basel, Switzerland. This article is an open access article distributed under the terms and conditions of the Creative Commons Attribution (CC BY) license (http://creativecommons.org/licenses/by/4.0/).
Share and Cite
Dranca, F.; Oroian, M. Ultrasound-Assisted Extraction of Pectin from Malus domestica ‘Fălticeni’ Apple Pomace. Processes 2019, 7, 488. https://doi.org/10.3390/pr7080488
Dranca F, Oroian M. Ultrasound-Assisted Extraction of Pectin from Malus domestica ‘Fălticeni’ Apple Pomace. Processes. 2019; 7(8):488. https://doi.org/10.3390/pr7080488
Chicago/Turabian StyleDranca, Florina, and Mircea Oroian. 2019. "Ultrasound-Assisted Extraction of Pectin from Malus domestica ‘Fălticeni’ Apple Pomace" Processes 7, no. 8: 488. https://doi.org/10.3390/pr7080488
APA StyleDranca, F., & Oroian, M. (2019). Ultrasound-Assisted Extraction of Pectin from Malus domestica ‘Fălticeni’ Apple Pomace. Processes, 7(8), 488. https://doi.org/10.3390/pr7080488