Article

Development and Application of a Data-Driven System for Sensor Fault Diagnosis in an Oil Processing Plant

1
Programa de Engenharia Química/COPPE, Universidade Federal do Rio de Janeiro, Cidade Universitária, CP 68502, CEP 21941-972 Rio de Janeiro, Brazil
2
OptimaTech Ltd., CEP 21941-614 Rio de Janeiro, Brazil
3
Centro de Pesquisas Leopoldo Americo Miguez de Mello—CENPES, Petrobras—Petróleo Brasileiro SA, CEP 21941-915, Rio de Janeiro, Brazil
*
Author to whom correspondence should be addressed.
Processes 2019, 7(7), 436; https://doi.org/10.3390/pr7070436
Submission received: 30 April 2019 / Revised: 11 June 2019 / Accepted: 14 June 2019 / Published: 10 July 2019
(This article belongs to the Special Issue Modeling, Simulation and Control of Chemical Processes)

Abstract

:
Predictive analytics is usually cited as one of the most important pillars of the digital transformation. For the oil industry, specifically, it is a common belief that issues like integrity and maintenance could benefit from predictive analytics. This paper presents the development and the application of a process-monitoring tool in a real process facility. The PMA (Predictive Maintenance Application) system is a data-driven application that uses a multivariate analysis in order to predict the system behavior. Results show that the use of a multivariate approach for process monitoring could not only detect an early failure at a metering system days before the operation crew, but could also successfully identify, among hundreds of variables, the root cause of the abnormal situation. By applying such an approach, a better performance of the monitored equipment is expected, decreasing its downtime.

1. Introduction

During the last few decades, the chemical industry has been constantly challenged to improve production efficiency with increasing demand for energy savings, environmental protections, minimization of product rejection, and efficient use of sources involved in the production processes. To satisfy higher standards, modern processes are including sophisticated and more accurate monitoring technologies in order to detect abnormalities at the early stages. These technologies allow for the identification and mitigation of harmful conditions, making industrial processes safer.
A large variety of process monitoring approaches has been developed. Russell et al. [1] classified them into data-driven, analytic, and knowledge-based methods. Data-driven methods are derived directly from collected process operation data and fault detection and diagnosis. While data-driven methods do not use first principle models, analytic approaches apply methodologies that employ first principle models developed from physical-chemical principles involved during the process operation [2,3,4,5].
Knowledge-based approaches are more used in systems that are poorly instrumented and hardly represented by phenomenological first principle models. The main purpose of these methods is to reconstruct the cause-effect relation [6,7,8,9], pattern recognition [10], and capture human diagnostic associations that are not easily represented by first principle models [11,12,13,14,15].
First principle models suffer several drawbacks. First, the complexity of modern industrial processes makes the development of highly-reliable first principle models harder. Thus, the advancement in data collection technologies reinforces the implementation of monitoring systems based on data-driven methods. Many works and research related to Fault Detection and Diagnosis (FDD) have used data-driven approaches during the past three decades. Many of them were summarized and reviewed by [4,16,17,18,19,20,21,22,23,24,25].
In addition, some studies of fault detection, diagnosis, and prognosis monitoring systems applied in real case scenarios were presented by Wong et al. [26], where a real-time fault diagnosis procedure was proposed for a gas turbine generator system. Namburu et al. [27] applied data-driven techniques based on pattern recognition and support vector machines for an automotive engine case. Patan and Parisini [28] used a neural network system to detect and isolate faults applied in a sugar evaporation process. Hu and Tse [29] used Relevant Vector Machines (RVM) for fault prognostics in oil sand pumps. Other works with real cases containing fault detection and diagnosis implementation were presented in [30,31,32]. Furthermore, some representative simulated cases were presented in [33,34,35,36,37,38,39,40].
The monitoring, detection, and diagnosis of faults in highly-capital-intensive industries such as oil and gas plants should be operated with high reliability and high levels of availability since the faults have a significant influence on the manufacturing activity and the safety condition of the operation. As the complexity of offshore plants has increased, considerable costs and numerous efforts are required in the operation and maintenance phase of these plants. Natarajan and Srinivasan [39] showed the statistics of economic losses in the major accidents of offshore oil and gas platforms. Some of the most common process-related incidents on offshore platforms are due to leaks and blockage in flow lines, sudden changes in temperature and pressure, and failures in safety valves and the controller. Hwang et al. [41] also discussed the economic impact of operation and maintenance cost on offshore platforms.
However, in the last few decades, offshore plants have used conservative maintenance methods derived from time-based preventive maintenance and breakdown maintenance strategies. Nevertheless, the growing incorporation of Industry 4.0 paradigms has led to an intensive modernization and adoption of intelligent monitoring techniques with data fusion strategies. Thus, more proactive and sophisticated methodologies such as conditional-based monitoring (CBM) methods have been more frequently implemented in the petrochemical industry. Recent advances in Condition-Based Maintenance and Prognostics and Health Management (CBM/PHM) have prompted the development of new and innovative algorithms for fault, or incipient failure, diagnosis, and failure prognosis aimed at improving the performance of critical systems. Hwang et al. [42] summarized the results of some CBM implemented systems related to the oil and gas industry. In the offshore application field, there were some studies reviewed in [43,44,45]. In addition, Cibulka et al. [46] described some approaches for Conditional-Based Maintenance (CBM) of induction machines and drive trains in offshore applications. A few works showing the economic impact of CBM strategies’ implementation on real industries have been developed. Gowid et al. [47] presented a profitability study of CBM strategies in LNG platforms.
Despite that, the development and performance of CBM strategies, fault detection-diagnosis, and monitoring methods applied to a real plant environment are still a challenging area to researchers. Detailed implementations and architecture systems of CBM strategies were presented in a few works [14,42,43].
Therefore, this work presents a monitoring and fault prognosis strategy applied to a Petrobras facility aiming at the detection of abnormalities along the operation. We present the system architecture, the main components of the strategy, and the theoretical techniques employed. This work is organized as follows: Section 2 consists of a description of the monitoring strategy, the system architecture, and the main components. Furthermore, a theoretical background of the principles used by the method are summarized. Section 3 describes the oil-gas fiscal metering station where the monitoring strategy was implemented. Furthermore, the process diagram, measured variables description, and fault description are also presented. Section 4 introduces the subjects to be considered when implementing the monitoring system. Finally, this study is concluded with a summary and discussion of its contributions.

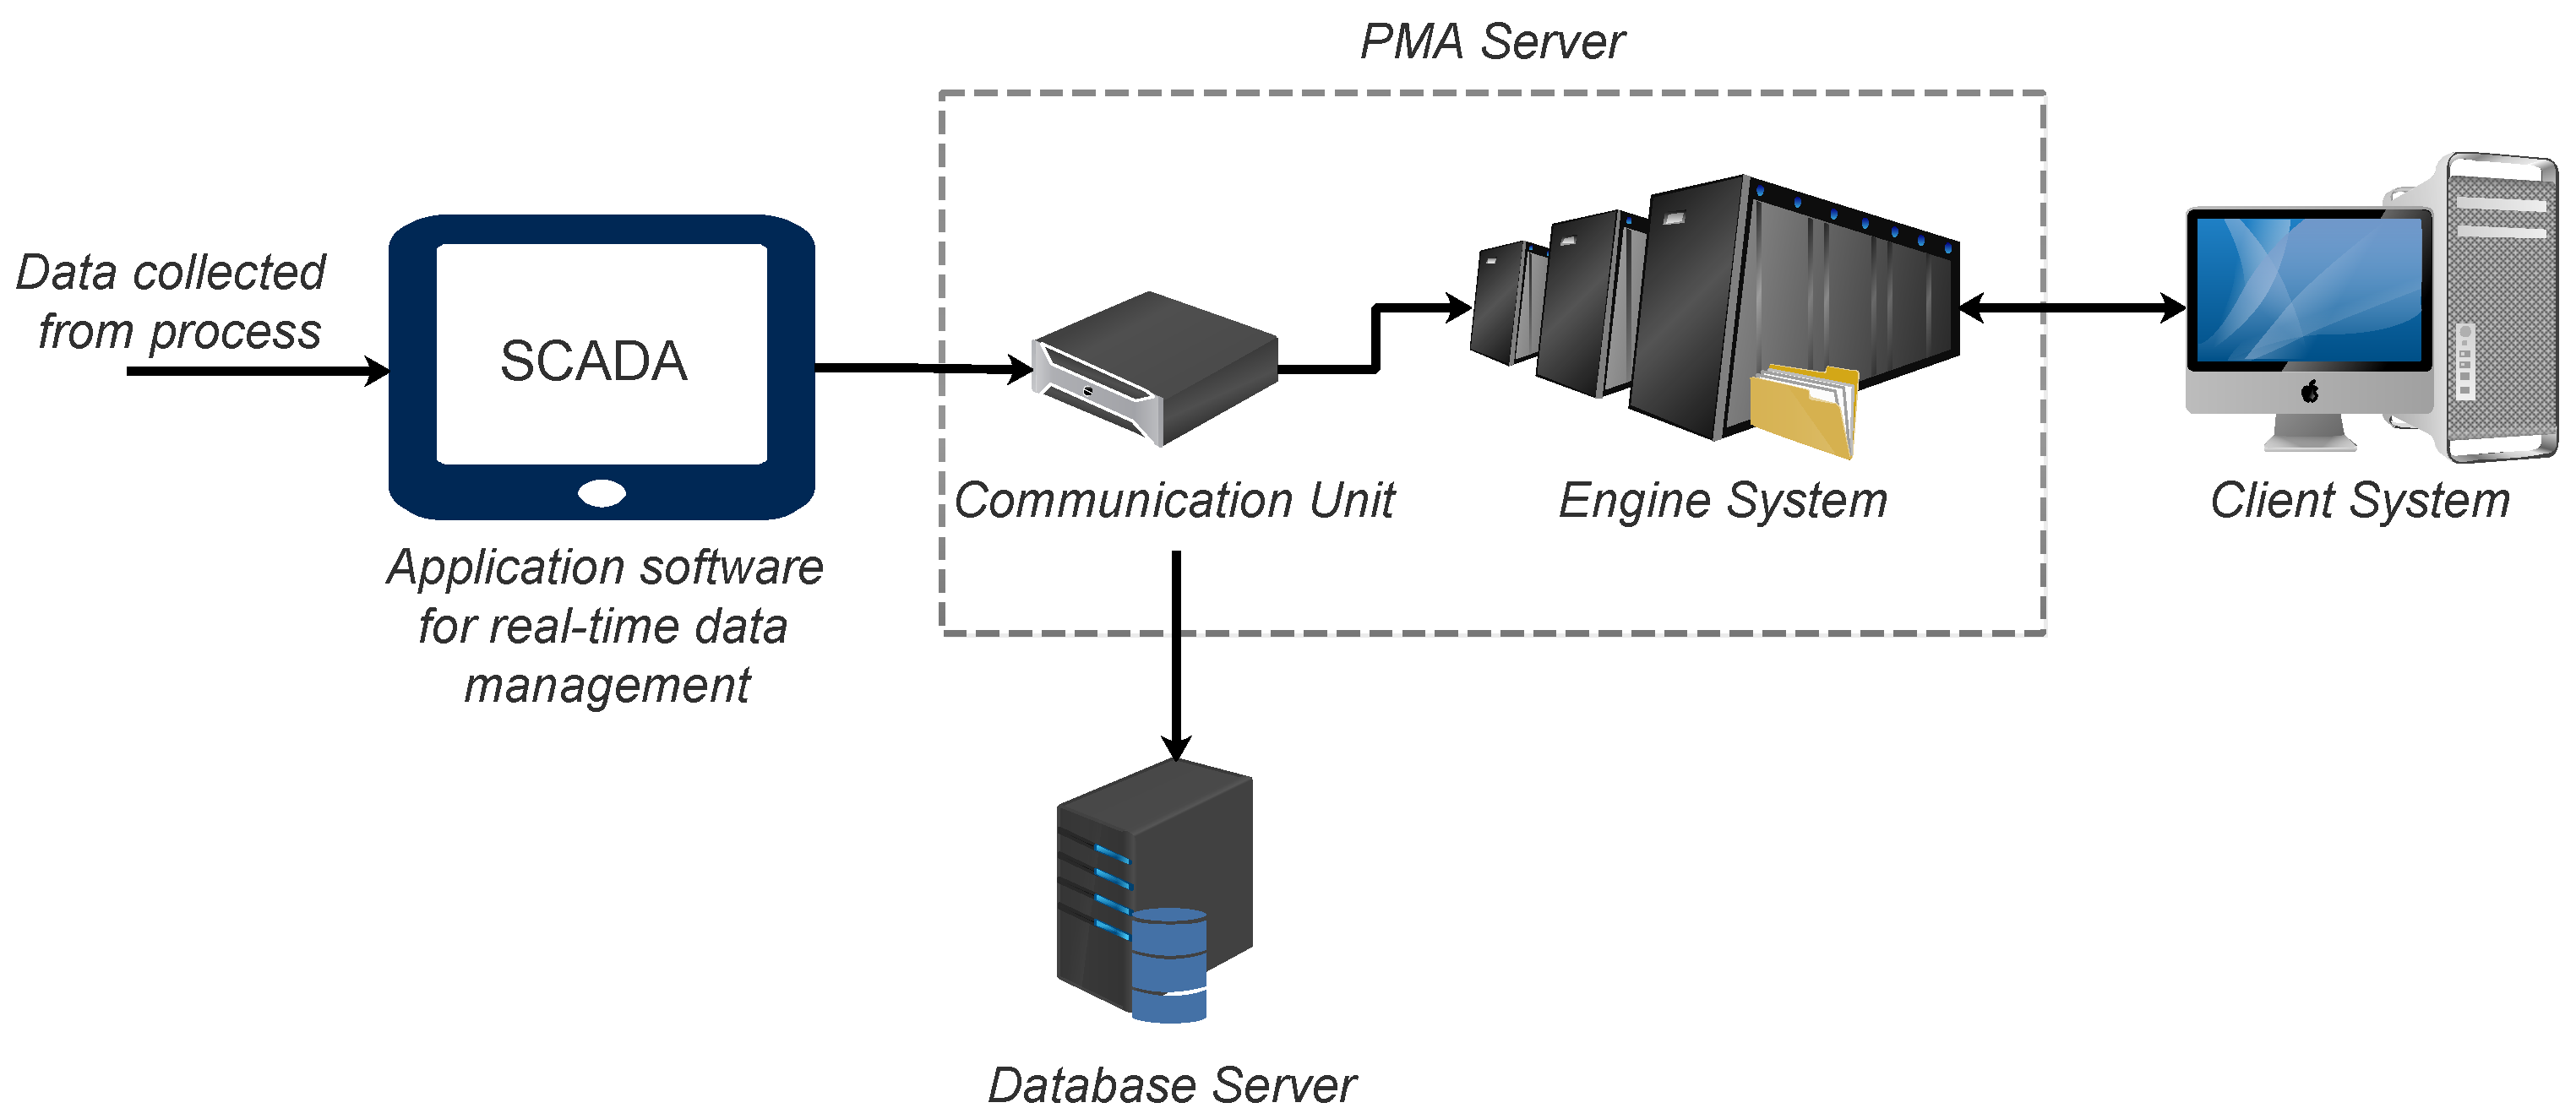
2. PMA: A System for Process Monitoring

The proposed CBM system for fiscal meter monitoring, named PMA (Predictive Maintenance Application), is defined by (a) gathering the measure’s status data and detecting the abnormalities, (b) diagnosing the sensor status, (c) establishing with high precision the failure time, and (d) performing the appropriate procedures for fiscal meter maintenance. In this section are summarized the main features of the PMA system.
The PMA system is a web application operating on a server, and it is built on the management and prognostic framework. The overall structure is illustrated in Figure 1 where it is possible to identify its five main components: data acquisition unit, denoted as SCADA (Supervisory Control and Data Acquisition), communication unit, engine system, database, and client system.

2.1. Online PMA System and Remote PMA System

The flow of information can be described as follows. Initially, the SCADA unit collects online data from the process using peripheral devices such as Programmable Logic Controllers (PLCs) and Remote Terminal Units (RTUs), which interfaces with the plant actuators and sensors. Then, the process data are managed by the communication unit, which is implemented in the PMA server, and it is the central hub of the entire system. The communication unit is responsible for storing, gathering, and transmitting data among each component. It stores and manages information and scheduled activities registered by the user, serves the engine system with data, triggers the execution of activities by the engine system, as well as stores all the results calculated by the engine system. Subsequently, the ordered data are processed by the engine system, which does the calculations registered by the user, and it is also implemented in the PMA server, being capable of doing online process monitoring and online warning, fault diagnosis, and fault prediction. The engine system is also designed to conduct various offline and complex functions, such as offline modeling for fault-detection, process assessment, prognostic assessment, advisory generation, and operation management supporting by a variety of databases, including the sensor data database, simulation database, fault history database, online test database, and operation and maintenance database. Finally, the results can be visualized and accessed by means of the client system, which gives an interface to create models, schedule analyses, register online monitoring activities, manage permissions, etc.

2.2. Theoretical Background

Several multivariate methods for fault detection in multivariate systems have been developed along the last few decades. Reis and Gins [48] reviewed and provided a historical evolution analysis of these methods in the industrial process monitoring and emphasized the new challenges framed in the Big Data/Industry 4.0 era. Particularly, the so-called the dimensionality reduction techniques such as Principal Component Analysis (PCA) [49], Dynamical Principal Component Analysis (DPCA) [50,51], Partial Least Squares (PLS) [52], and Canonical Variate Analysis (CVA) [1] are highly interesting for a monitoring process of high dimensionality due to their capacity to abstract structures from data, characterizing normal operating conditions and detecting abnormal situations in the process dynamics. The most commonly-used statistical technique for process monitoring is PCA [53], which is a multivariate technique that generates a non-causal process model. PCA is more appropriate to apply in a plant-wide manner, when there are integrated processes acting as a huge complex industrial plant to be monitored. On the other hand, CVA is more appropriate to apply in a single process, when it is clear what are the input variables and the output variables. In addition, CVA is able to increase the detectability of a specific fault, if the choice of process variables to be modeled is suitable.
The technique CVA was chosen due to the following reasons: (i) it is a well-known, simple, and easy to understand multivariate technique [54]; (ii) it is based on Singular-Value Decomposition (SVD), which is a very robust numerical method and presents fast calculations; (iii) it permits the development of a mathematical model in an input-output form, i.e., a group of independent predictor variables causes an effect in another group of dependent predictant variables; and (iv) it reveals the underlying latent structure of the process data, which may be important for fundamental analysis and to gain knowledge about the correlations between process variables.
The purpose of the CVA is to extract, from the input and output datasets, X and Y, respectively, pairs of latent variables that have maximum correlation in each pair and no correlation to another pair. Such latent variables are obtained by a linear transformation of the correlated input or output data. Equation (1a) shows the input latent variables, T X , whilst Equation (1b) shows the output latent variables, T Y . Equation (1c) presents the correlation coefficients, r 1 , . . . , r N , among these N latent variables.
T x = X P
T y = Y Q
R = T x T T Y = r 1 0 0 r N
For example, in a storage tank, input variables such as the feed flow and valve opening can be described as a unique latent variable, feed. Likewise, output variables like the level and bottom pressure can be described as another latent variable, storage. Feed and storage have a very high correlation among each other. CVA can recognize this structure automatically within historical data, which is the training task, and can evaluate if this structure is still present in the current data, which is the monitoring task. More specifically, matrices P and Q are obtained through the SVD algorithm applied to a combination of covariance matrices of input and output data, in order to identify a subspace model. Then, new data points can be used in this model to check if the data correlation has changed (due to an abnormal event) or not.
CVA is also used to model the dynamic behavior of the process [55]. Since the argument for the input dataset is generic in terms of variables, it can encompass time-lagged variables, which deal with time delay between variables and/or great retained volumes that act as filters. This is particularly important to model large industrial processes, due to the strong influence of the dynamics on the process data. In this configuration, CVA ends up with two meta-parameters, the number of principal component pairs and the number of time-lagged variables, which are the ones that need tuning. Besides these, there are those obtained automatically, pondering the original variables to generate the latent variables. Despite the presence of lag variables or not, the inference for the original output variables can be made according to Equation (2) for both the static and dynamic cases.
y ^ = P R Q T x
Equation (2) is very important for the condition monitoring task, since it enables the residual calculation, presented in Equation (3a), the Square Prediction Error (SPE), presented in Equation (3b), which is the fault detection index used in control charts for hypothesis tests (normal or abnormal process condition), and finally, the fault contribution index (PDC), which is a proposal to measure the involvement of each input variable with the detected fault. PDC stands for Partial Decomposition Contribution, according to the definitions presented in [56].
e = y - y ^
S P E = e T e
P D C i = e T x i
CVA has great advantages, but also some disadvantages. For instance, it is well known that some chemical process variables have a non-linear relationship and a linear model, such as the ones generated by CVA, yielding a poor result. Likewise, process dynamics are much more complex than the time-lagged structure, due to the retained volumes in vessel tanks, which may produce a filter with more or less information about the past, ruining the constant time-lagged structure. Nevertheless, despite such flaws, CVA is still a good technique to start generating a process model for process monitoring. We believe that the process operators have to gain experience and sensibility with a simple technique first in order to move on to more complex techniques.

2.3. Alarm System

In the context of the modeling described above, the detection indices were defined for the prediction error e, for the variable y, and for the selected independent variables x. These detection indices were included in the monitoring with the objective of improving assertiveness in the distinction between events that alter the state of the process (outliers) and random fluctuations present in the system.

Outlier Alarm

This index aims to identify if the signal is very different from the average observed in the dataset used in the model construction, i.e., to evaluate if the process signals correspond to the normal dataset. The index is calculated at each sampling instant k, being defined as:
  • Index for prediction error: a measure of model prediction accuracy.
    I o , e = e < c o , e
  • Index for the y variable: a measure of the relevance of the response variable versus the model construction data.
    I o , y = y - y ¯ < c o , y
  • Index for the x variable: a measure of the relevance of the selected input variables versus the model construction data.
    I o , x = x i - x i ¯ < c o , x
where y ¯ is the average of outputs in the training set and x i ¯ is the average of outputs of the selected variable in the training set. Control limits c o , e , c o , y , and c o , x are the confidence limits for each index, generally determined by the statistical properties of the historical data used in the model construction, for example c o , x = ± 3 σ x .
The alarms described above were implemented in the PMA system and were inspired by the process control methods first published in [57] and adapted in [58].

3. Real Case Application

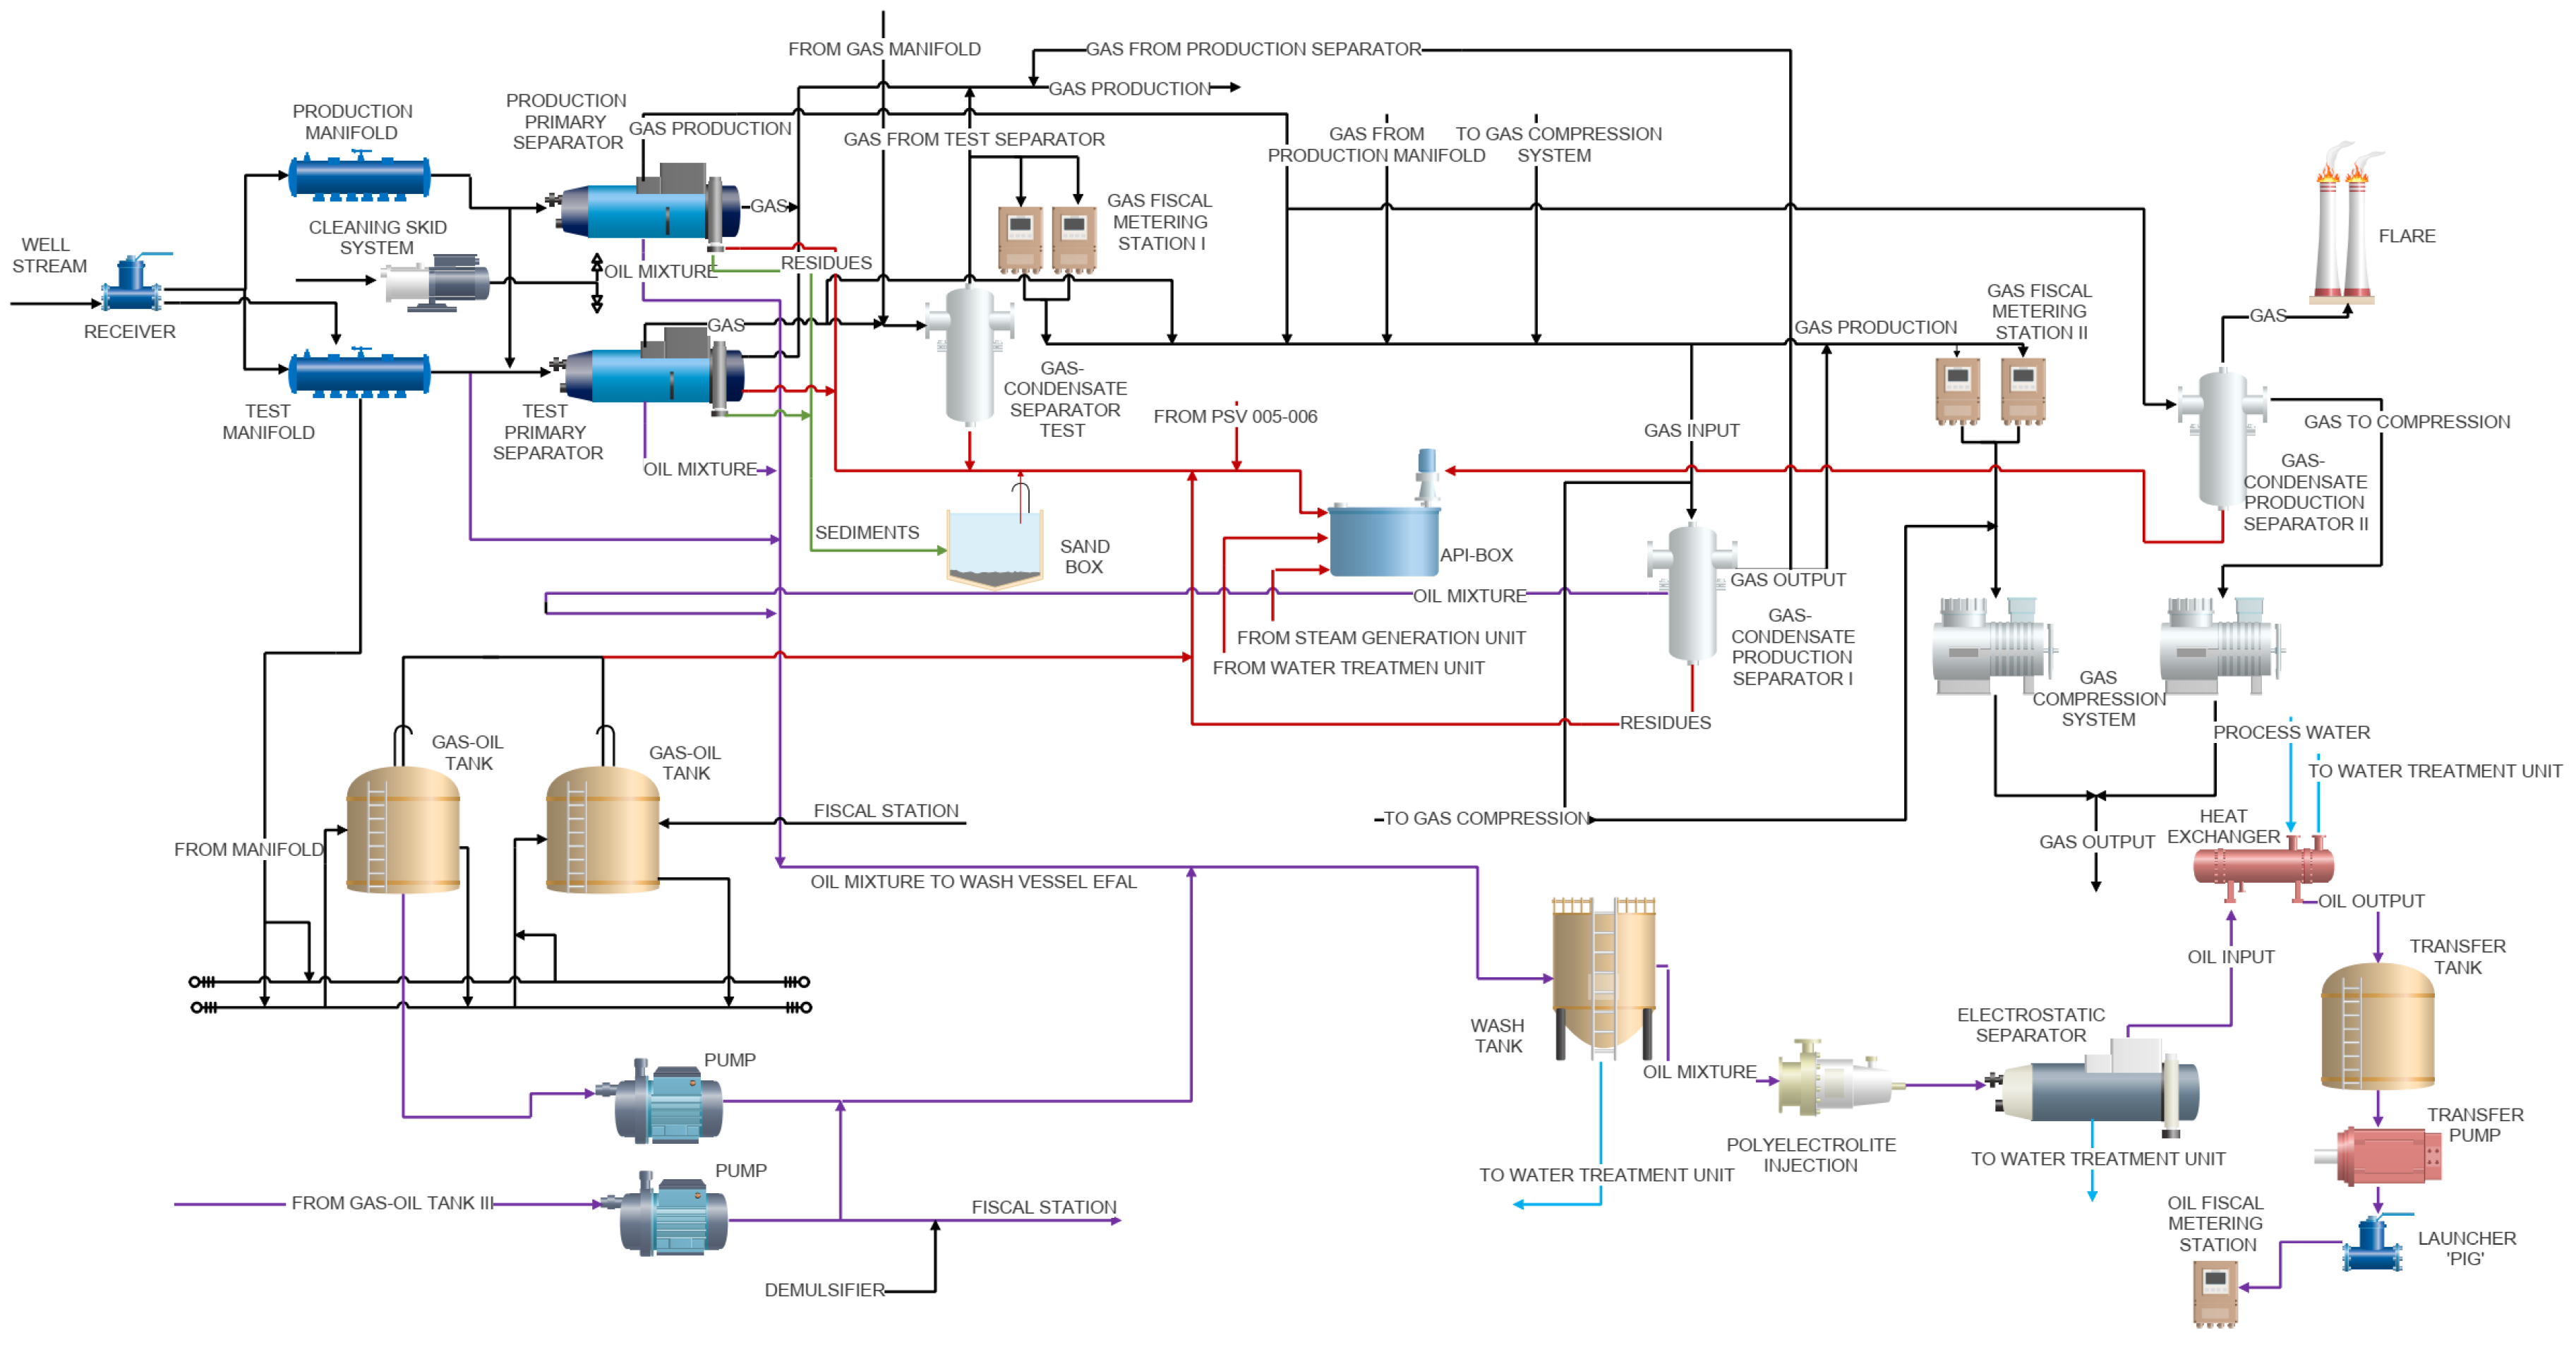
3.1. Oil and Gas Fiscal Metering Station

The metering station used in this work is located in an onshore field of Petrobras and is composed by four satellite stations distributed along the field. The metering station receives the gas and oil from these satellite stations.
The process is described in Figure 2, where three fiscal metering stations (two gas metering stations and an oil metering station) are constantly working. Both gas meters monitored are orifice plate device, whereas the oil meter is based on the Coriolis principle.
Online measures are taken constantly and the data are collected and stored in the PI system. Since PMA allows input-output relationships, it is possible to establish a correlation between the variables of interest and other process measurements. In the present work, a total of 112 measured variables were used during the monitoring period, as presented in Table 1.

3.2. Fault Description
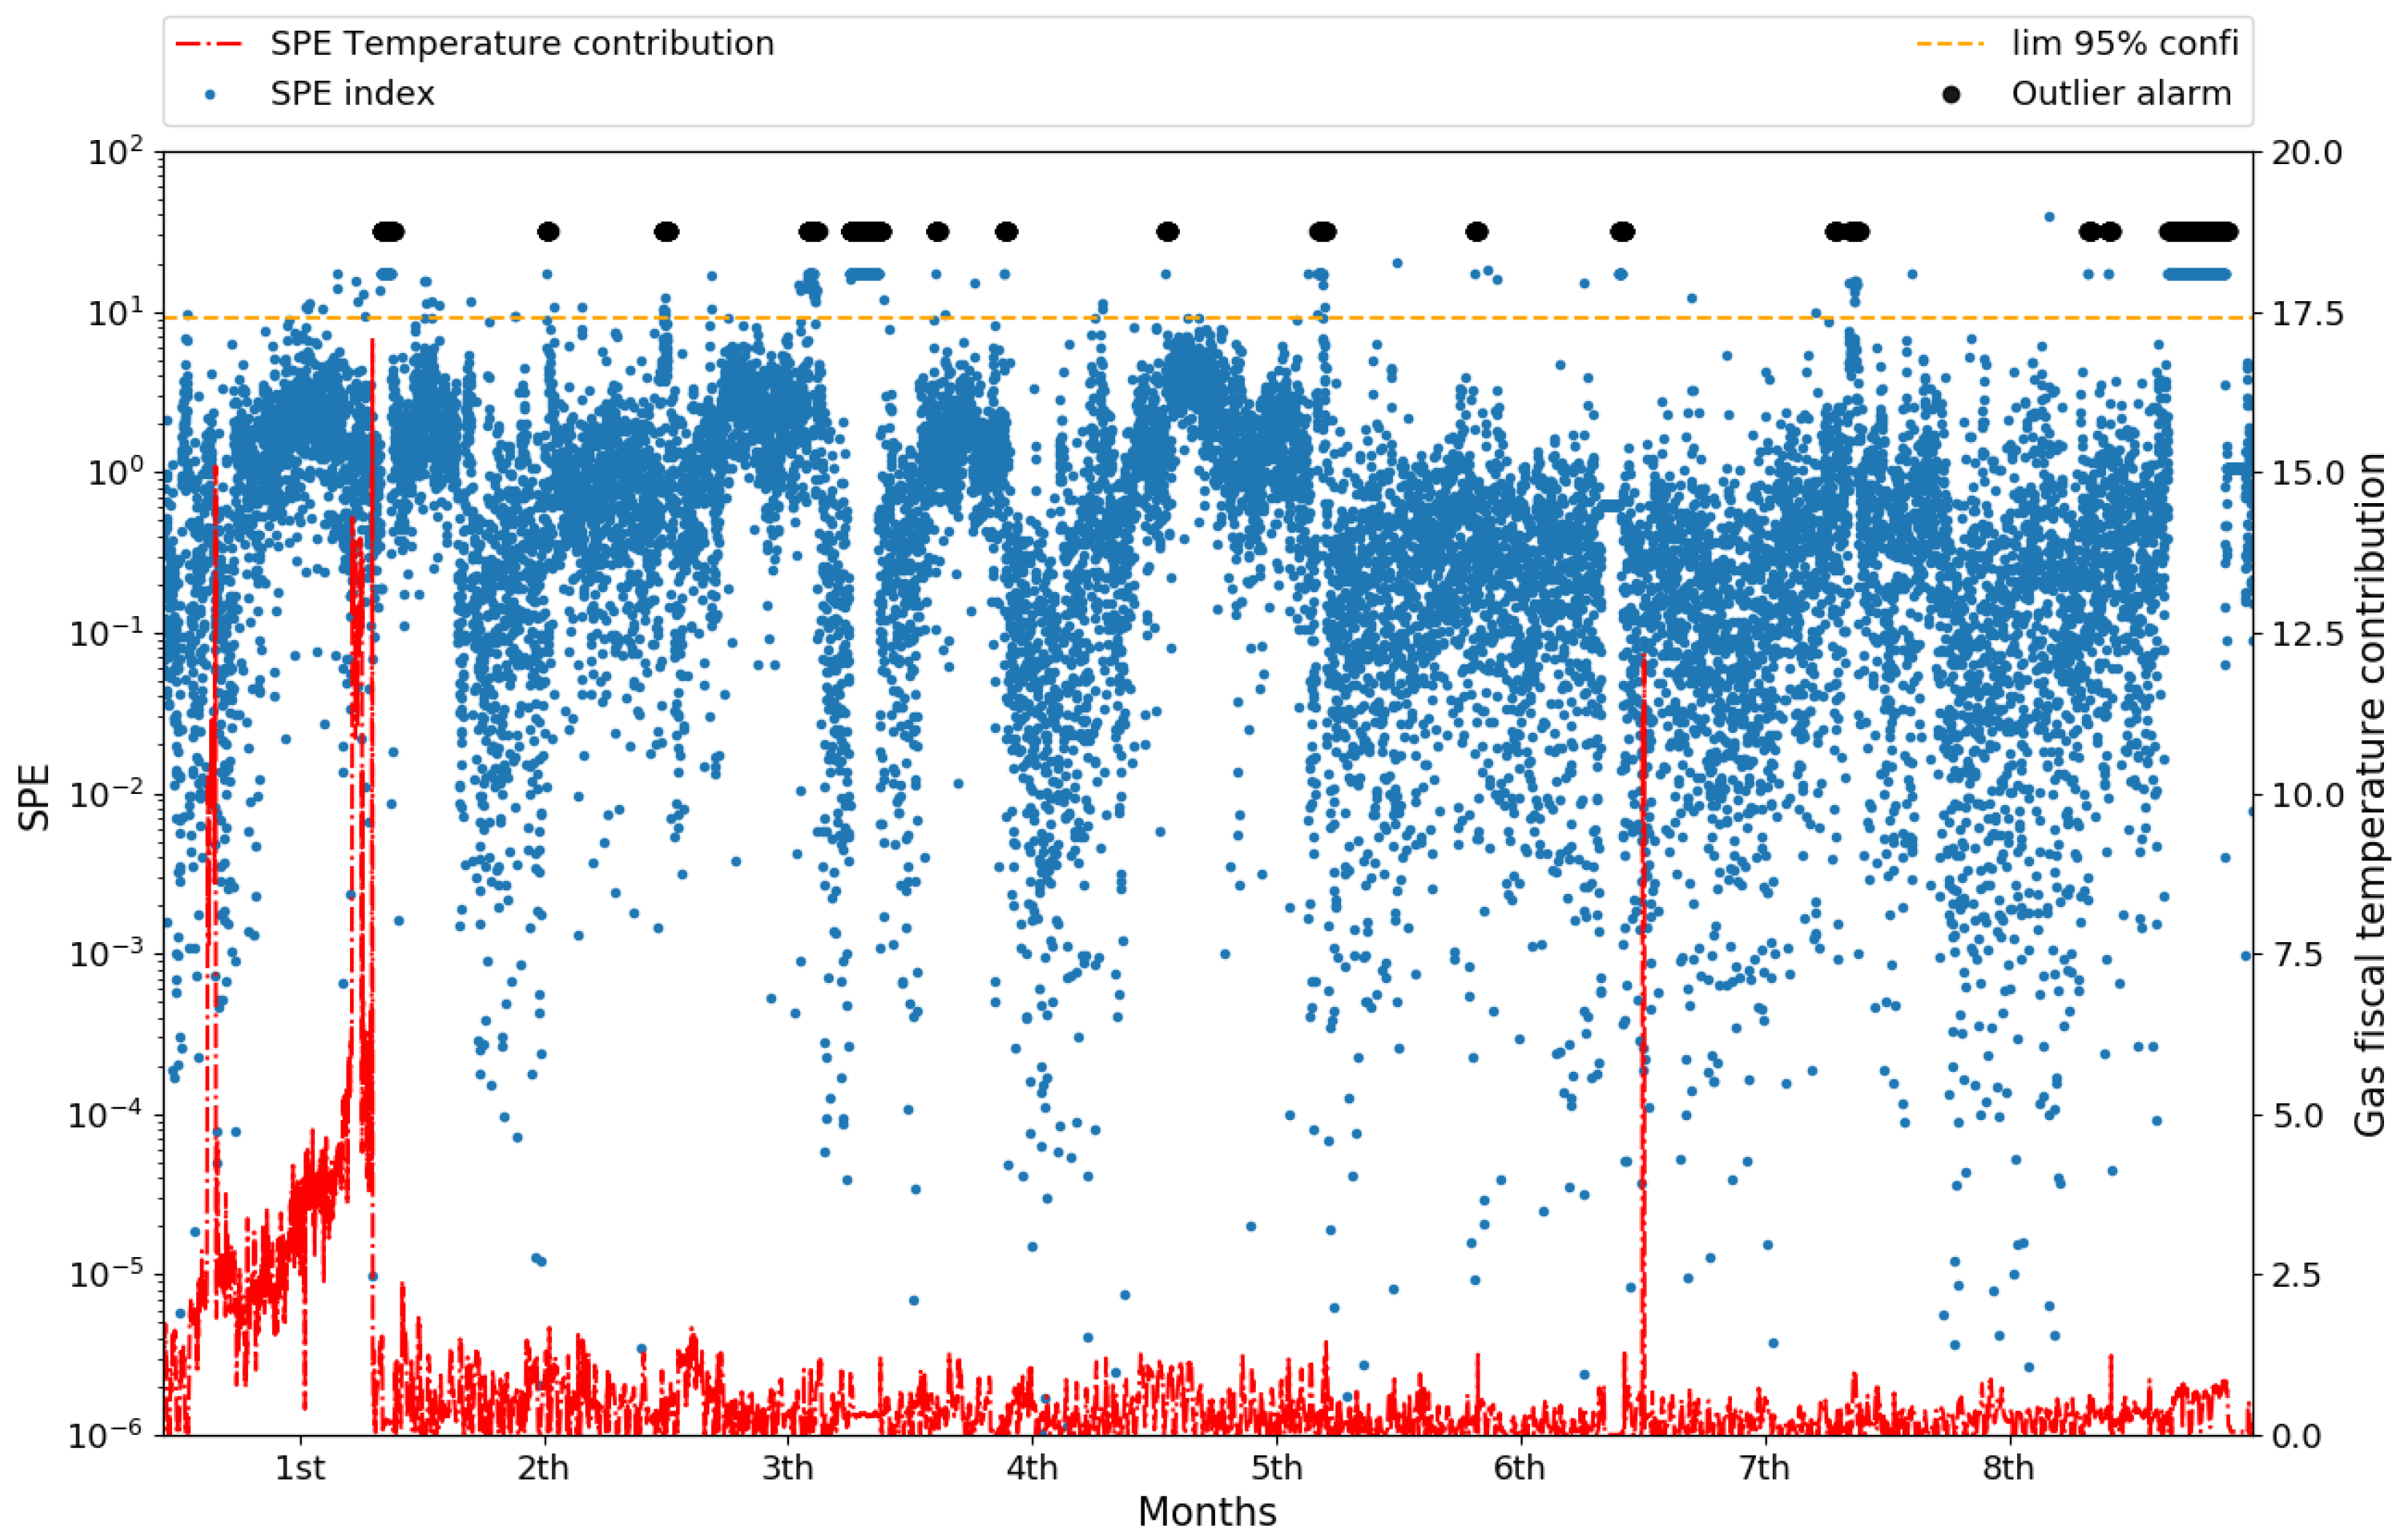
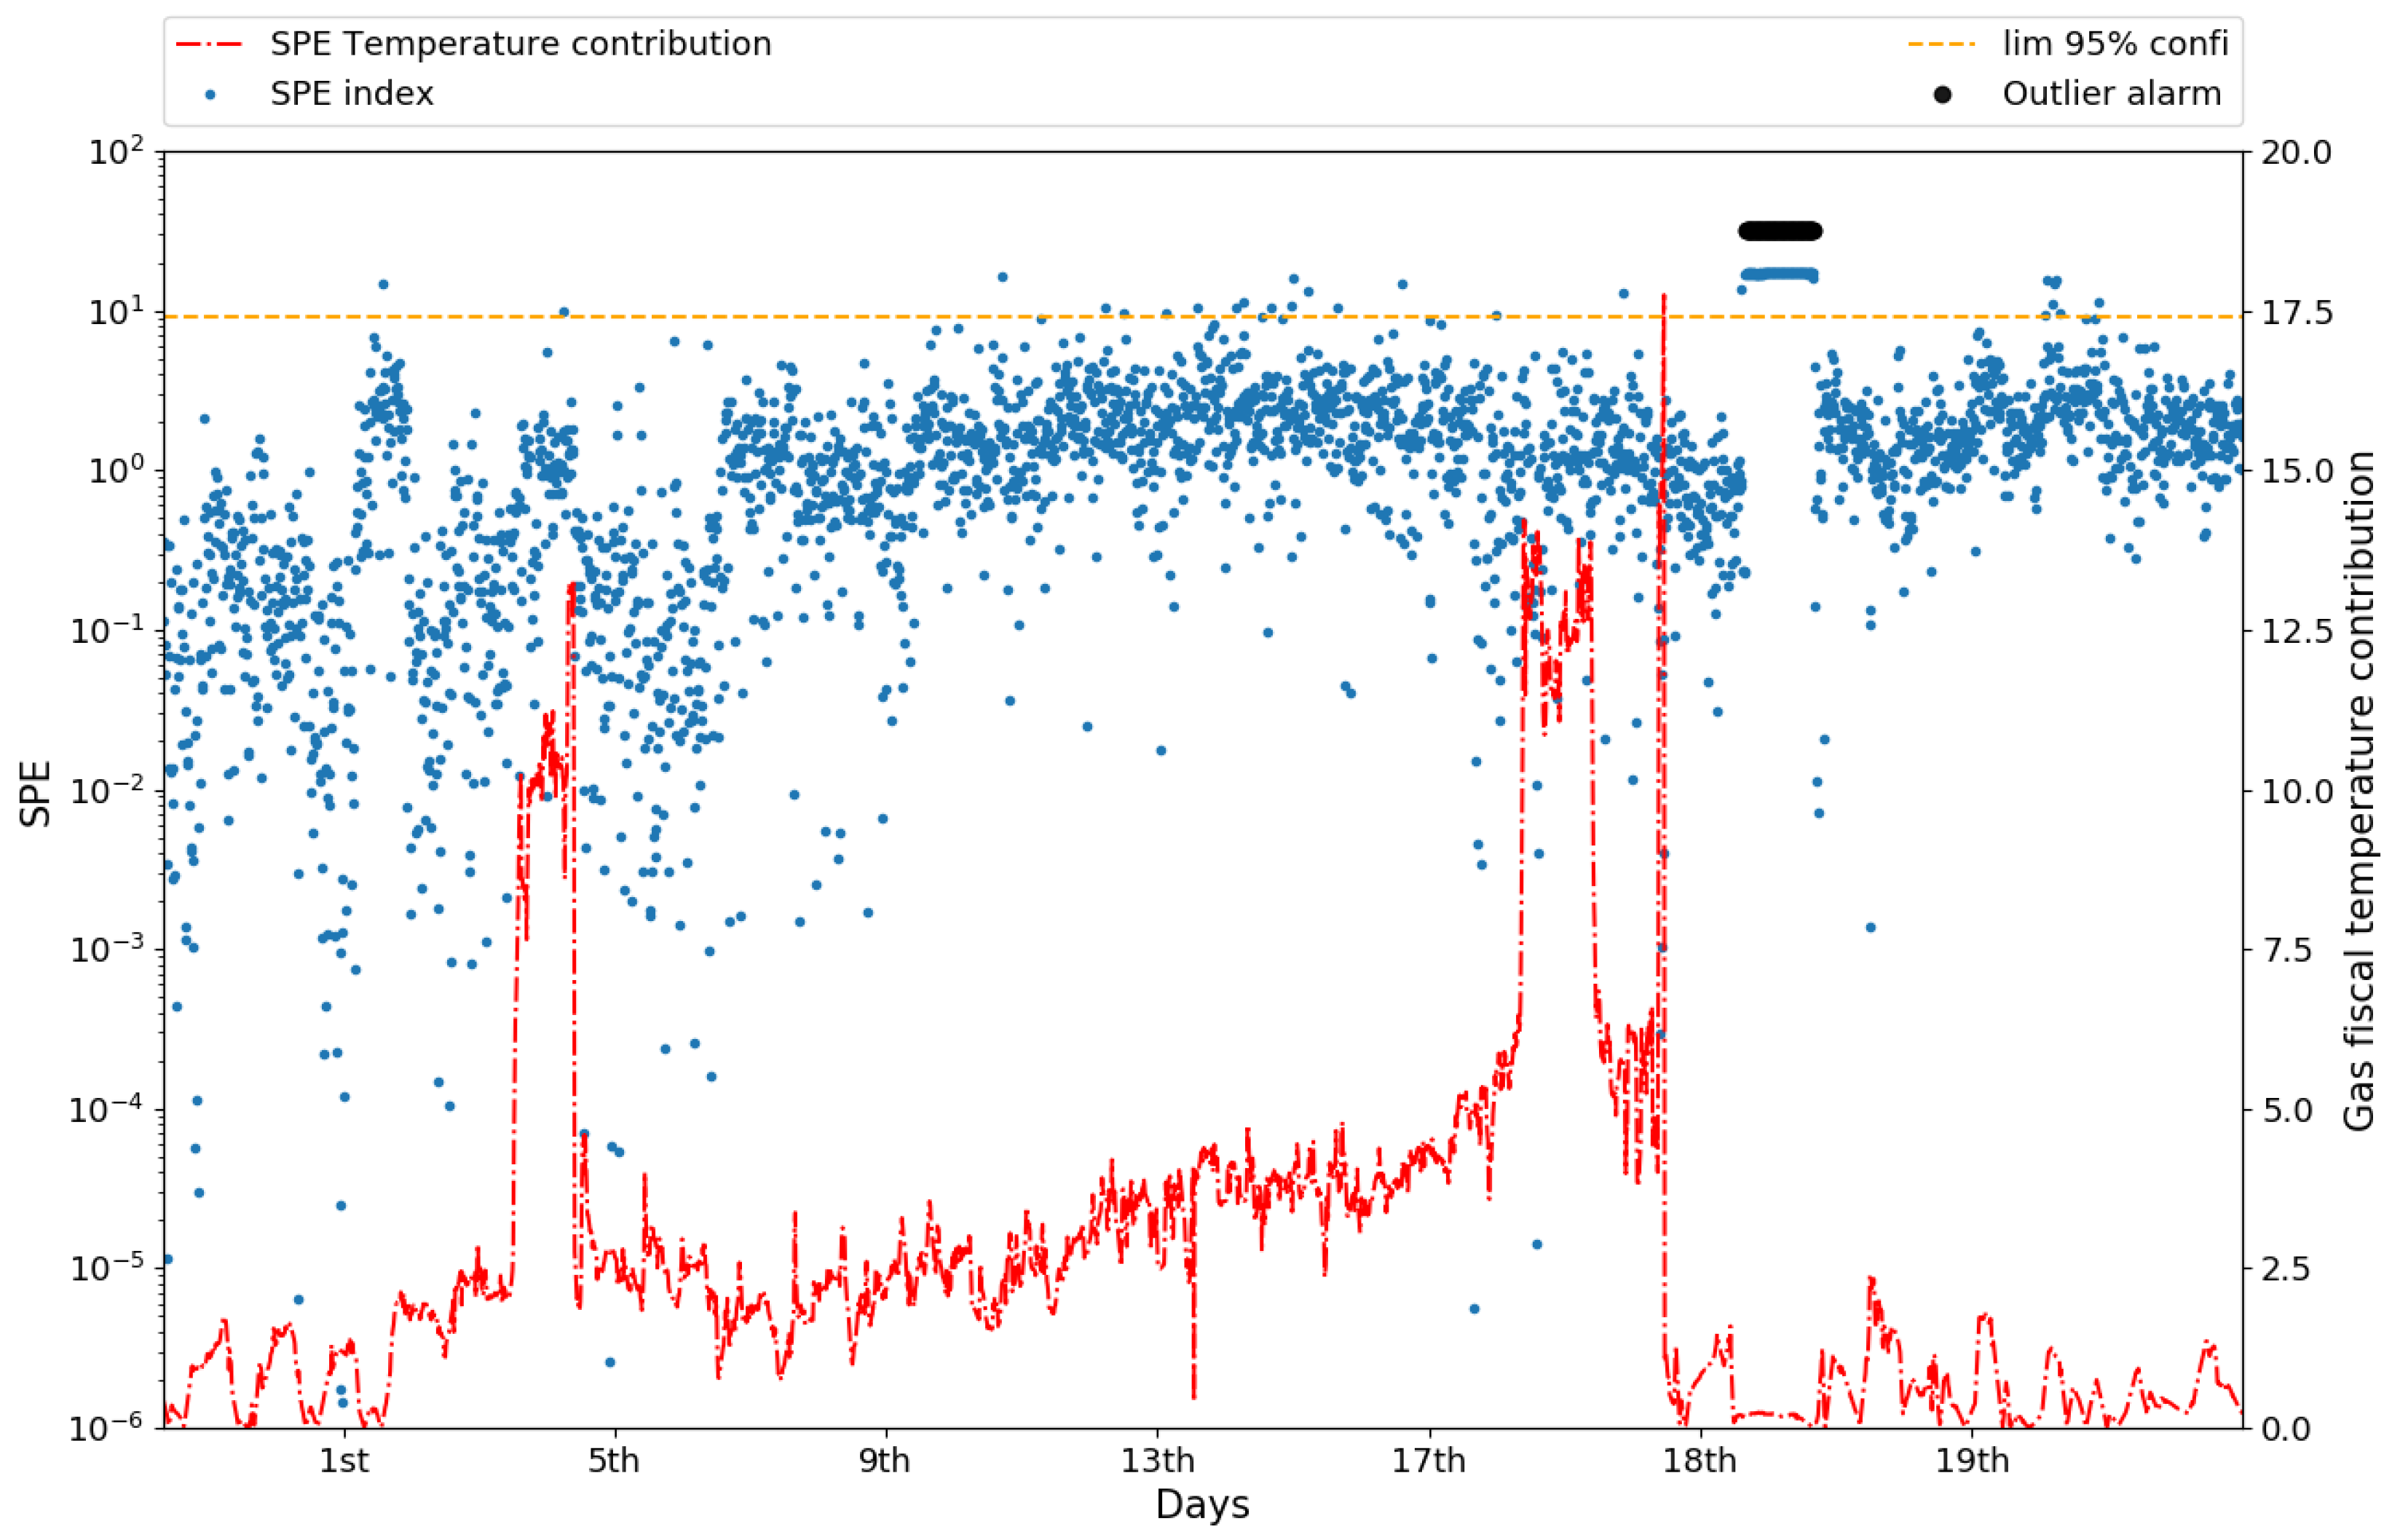
In the context of a process plant, fiscal meters are one of the most crucial pieces of equipment, since it is on them that the values related to royalties, allocation, and custody transfer depend. For that reason, flow measurements are constantly supervised by a governmental regulatory agency, in order to ensure the accurate value of these royalty-bearing volumes. The regulatory agency’s policies concerning faults in the fiscal metering system provide procedures and protocols that must be followed in order to notify about abnormalities such as incorrect or the absence of measurement and configuration errors, among others.
Once the fault is identified, an official notification must be sent to the regulatory agency within a 72-h period, and the problem fixed in a 240-h limit. After that, according to the regulatory agency regulations [59], the fiscal meter could be put out of operation. It is important to note the impact of this in terms of production. For instance, if an ultrasonic meter that measures the amount of gas sent to flare surpasses the ten-day limit, the whole unit, in this particular case, would have to be shutdown.
Besides that, since the detection of a fault usually does not match its true beginning (taking into consideration that the majority of units do not have expert systems such as PMA to provide early detections), past values of production that were, somehow, affected by the fault presence must be corrected. The regulatory agency establishes a methodology, as shown in Figure 3, to perform these estimations based on the fault event duration.
As can be seen, the longer the fault takes to be detected, the higher are the probabilities that the production and, therefore, the royalties’ costs are overestimated. For this reason, the time interval between the fault event and its detection can also be considered as a measurement of the monitoring system efficiency. A fast and robust detection associated with the capacity to perform high-multivariable time series monitoring is an important requirement to be achieved by the fault diagnosis system, in order to reduce the detection response time, avoiding, therefore, faults with periods longer than the ones allowed by the regulatory agency.

4. Results

This section presents the main results of the PMA system obtained during the monitoring of the process described above. For validation purposes, a time range with a higher presence of reported faults was selected. These events included periods with the absence of measurement and others with incorrect values of flow.
Figure 4 presents the temperature and pressure differential behavior during a period of time with the presence of fault. The construction of this control chart used the sliding window methodology with the window size fixed at 100 points, and the statistical limits were computed along the time window as X ¯ ± 3 σ . Here, it is possible to observe that the univariate approach is insufficient to detect faults in systems like this, where the high presence of coupling effects between the variables is present.

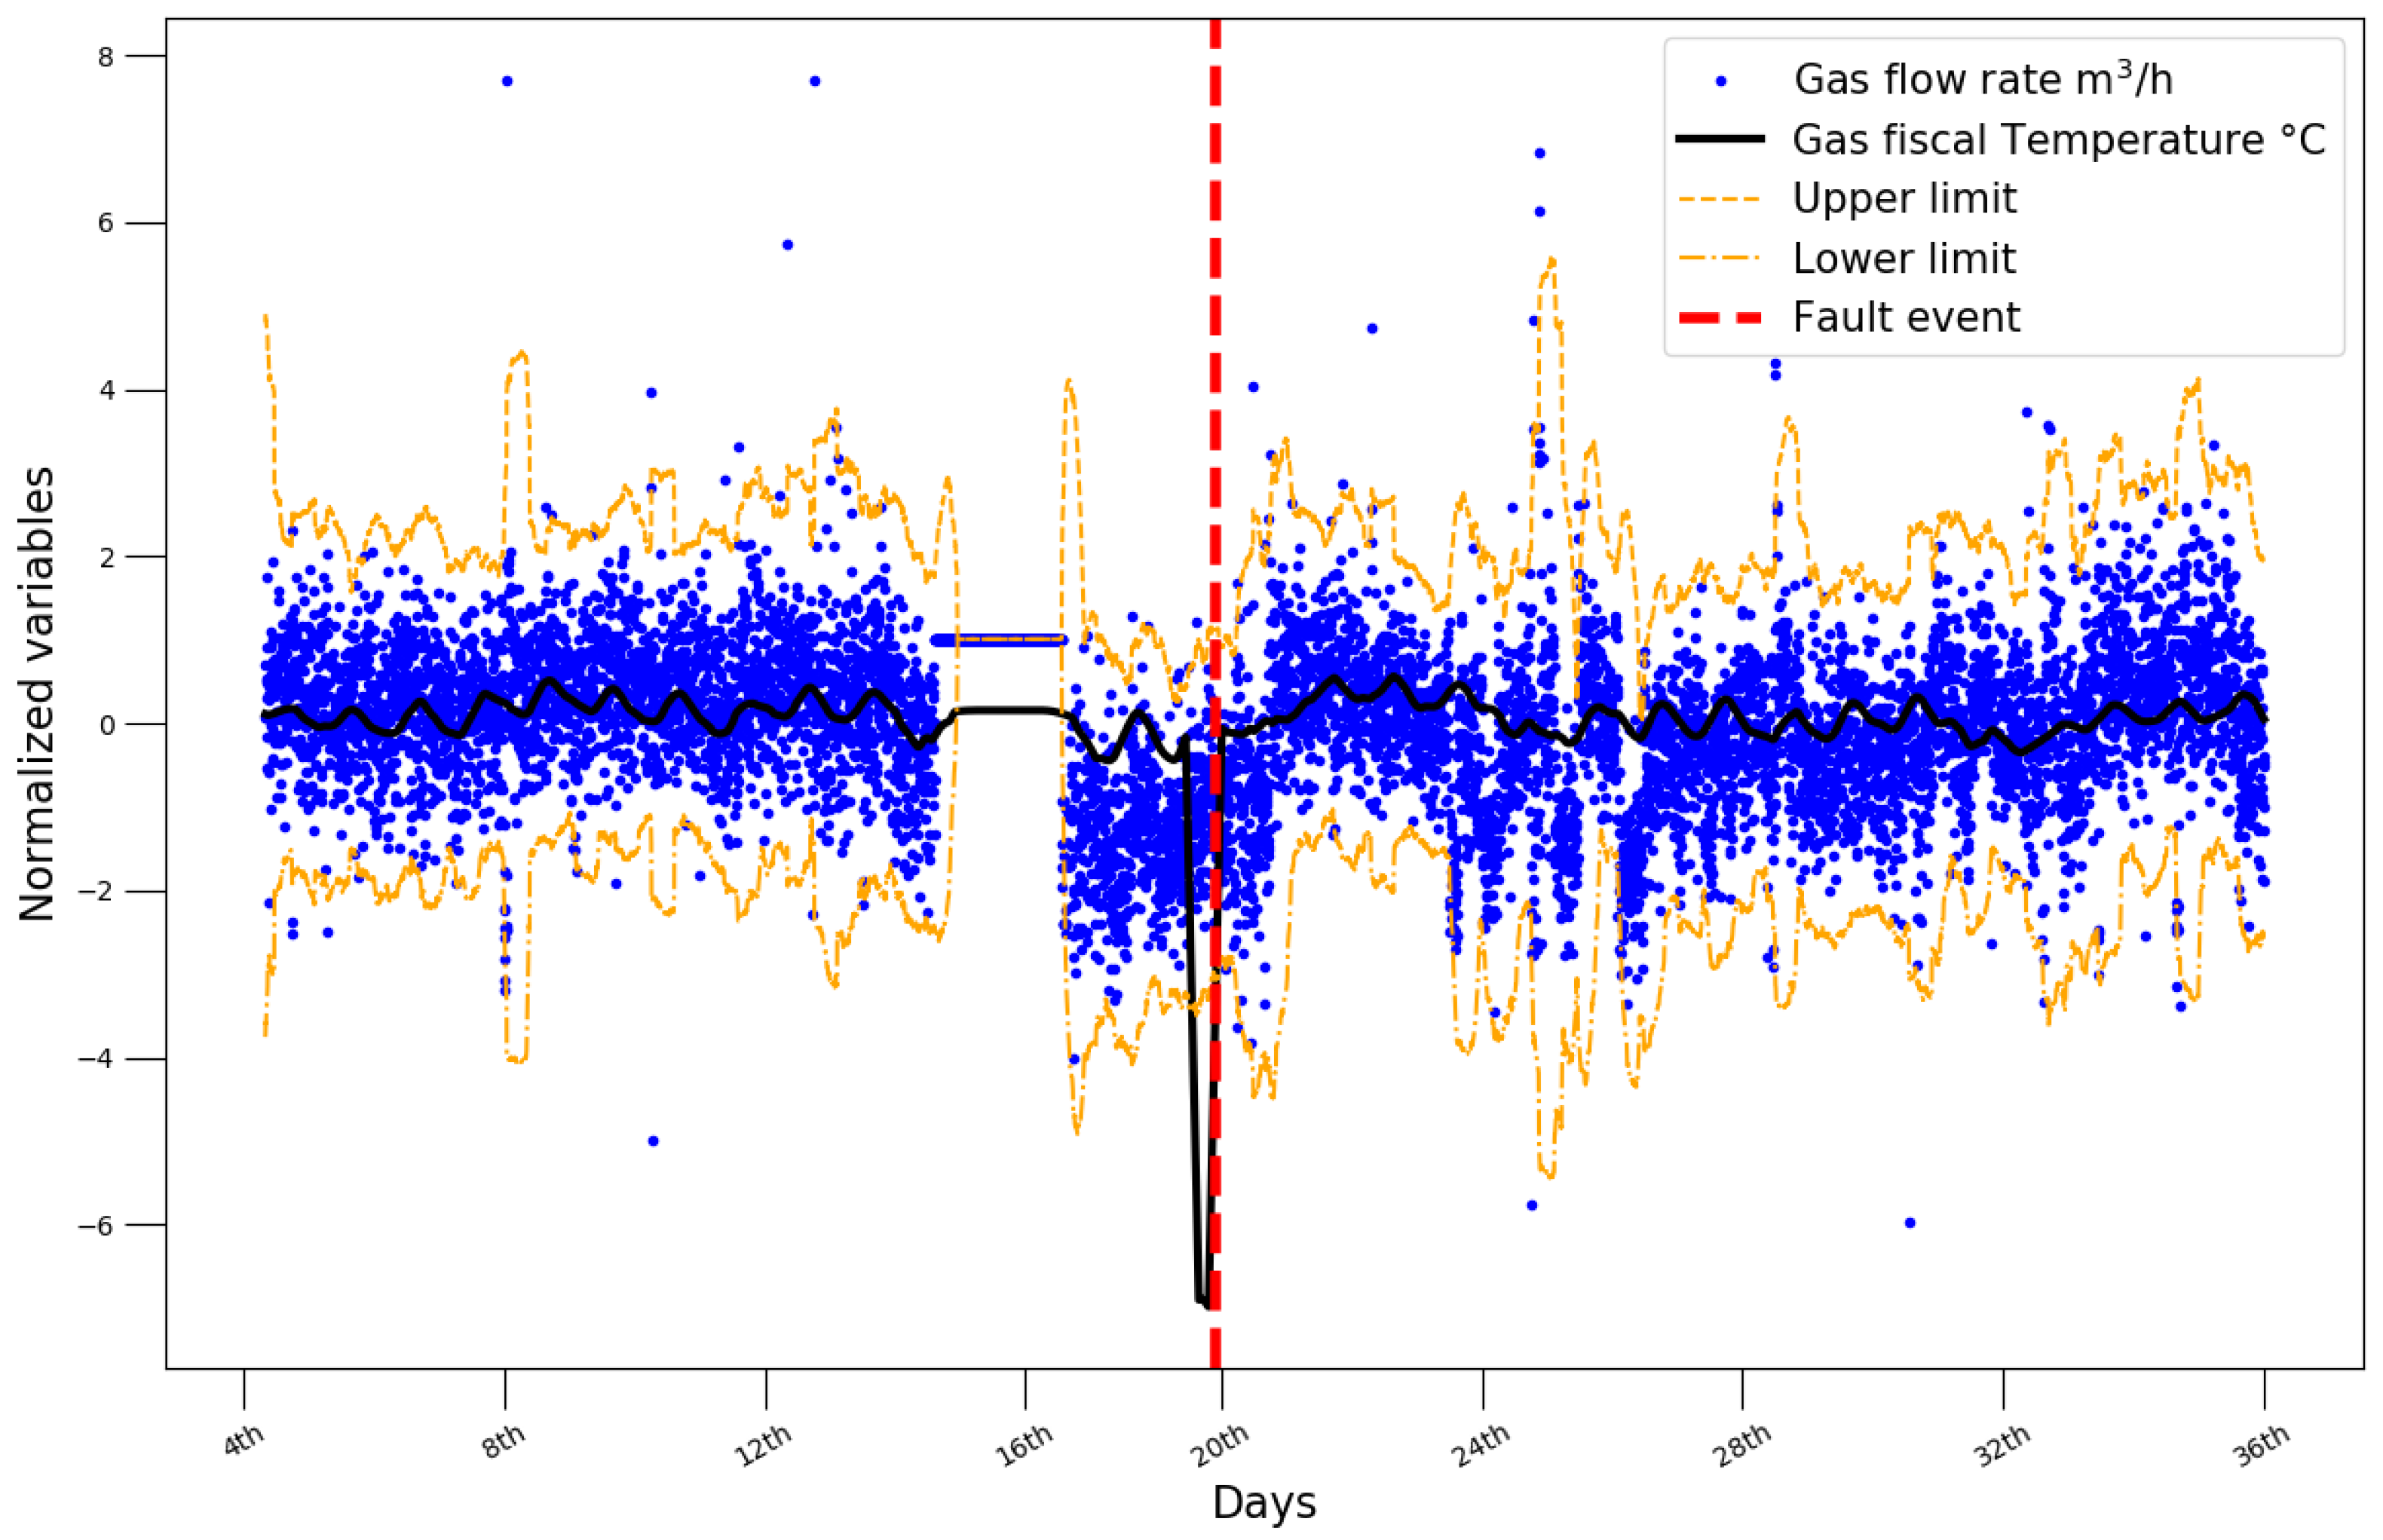
4.1. Monitoring and Fault Diagnosis Results
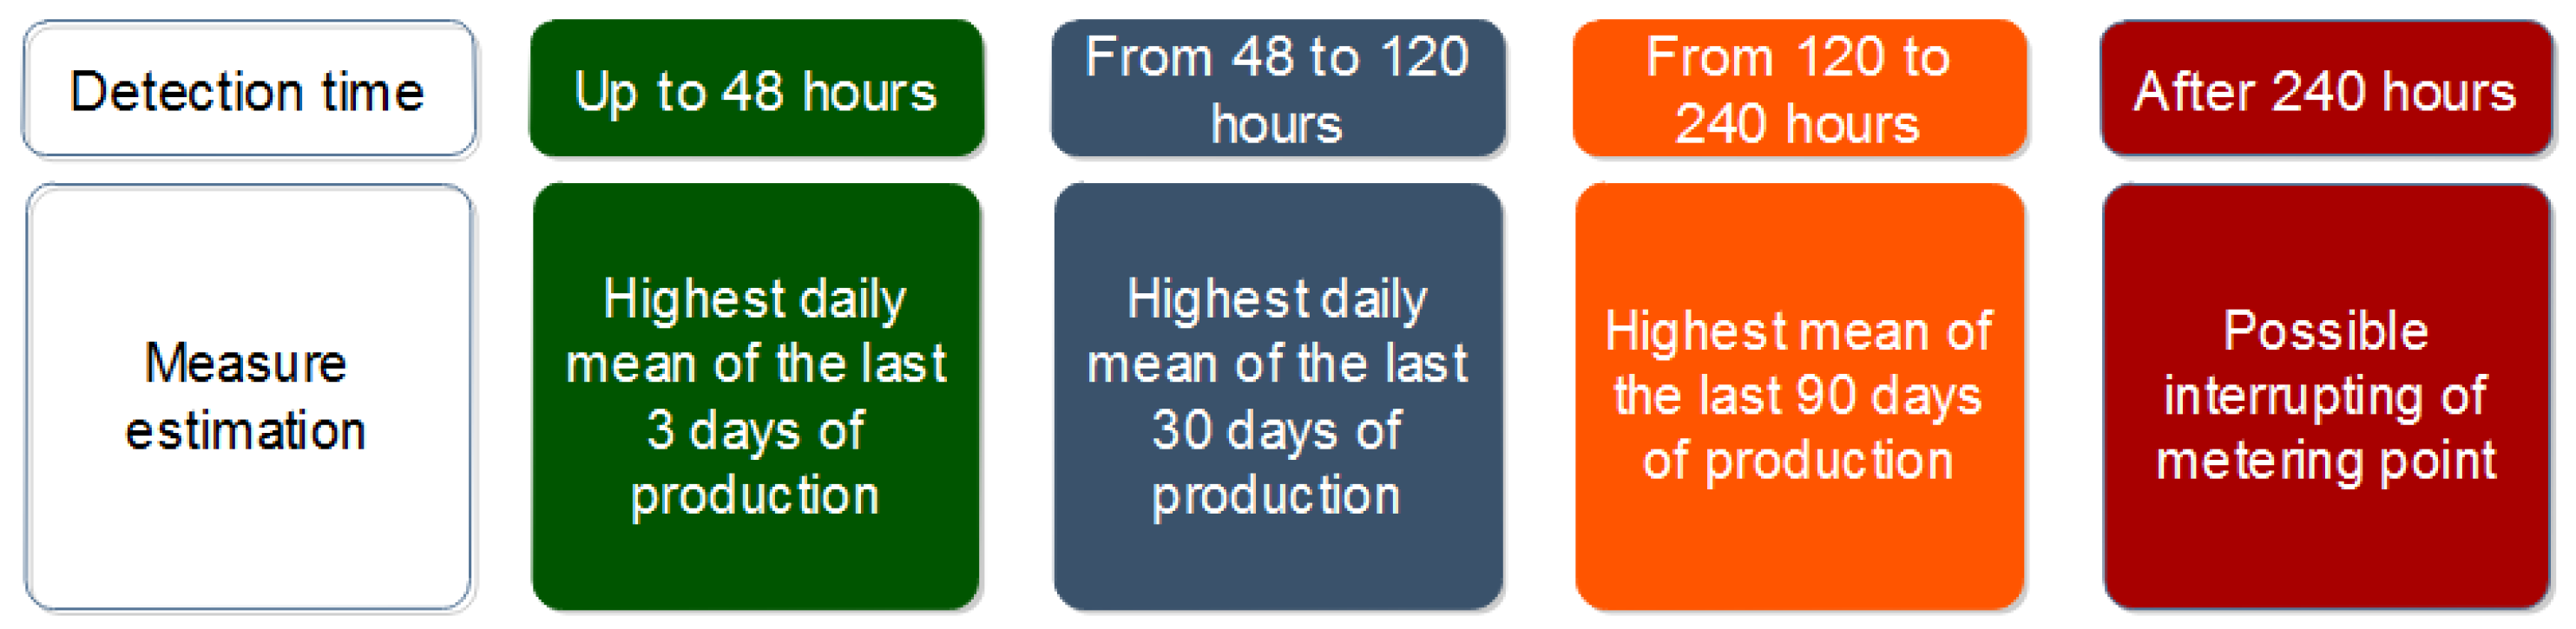
The fault diagnosis was performed using a multivariate SPE statistics and employing the methods explained in Section 2. The alarm system is described in Section 2.3 and considered the outlier as an alarm.
Figure 5 shows the results of PMA applied to the dataset of the test. The SPE index plot shows an oscillating behavior during the first half of the time, and the control limit was exceeded several times, being consecutive in some cases. In such cases, the alarm indicated an abnormal situation, which was corroborated by the fault reported by the operation. A smaller number of control limit violations were exhibited during the second half of the time studied; also, the SPE index behavior presented a more constant behavior. Since the model generated by CVA describes the relations of inputs-outputs, it is possible to not only detect the failure itself, but also to identify the main inputs associated with this event. This can be done by quantifying the contribution of each one of the N variables in X (used to explain the variable Y) to the final value of SPE.
It is interesting to note that the SPE contribution associated with the gas fiscal temperature time series presented sudden peaks in dates close to the fault events, when its contribution was the highest among all the other variables. This is particularly important since the main cause for this fault, as reported by the operation team, was a malfunction of the temperature sensor associated with the orifice plate meter.
The broken sensor was then replaced, but only 25 days after the occurrence, when the main cause of the problem was detected. It becomes clear that the use of a system such as PMA could anticipate this event, indicating the most probable variable to cause it.
In this case, the alarm was activated five times, before the fault event reported by the operation. This shows a slight predictive capacity of the implemented monitoring system, which can be confirmed by observing the trend presented by the gas temperature contribution in Figure 6. While the value for contributions reached peaks as high as 15% during the fault propagation, it did not get higher than 5% after the proper identification and sensor replacement. The longer sequence of points violating the control limit triggered the most prolonged alarm, constituting a strong indication of a fault in progress. Additionally, the emergence of this alarm matched with the second fault event notified. The SPE contribution to the behavior of the gas temperature time series exhibited sudden changes during the fault events, gaining more participation in the SPE index, while during periods without faults, this behavior tended to be constant and its participation was less relevant. In fact, during periods of normal operating conditions, the contribution values for all variables tended to show fairly even values.
In this way, the methodology of the regulatory agency responds successfully to the process monitoring requirements, reducing the fault detection times, achieving a robust analysis along with a multivariable set and with an appropriate computation performance according to the application demand.

4.2. Current Status

Finally, after the offline validation stage, the PMA system was prepared to run online and in real time, monitoring four different meters in the station and generating multivariate indexes that can support decisions and analysis by the operating team.
The PMA implemented system had other methodologies that allowed it to expand the monitoring analysis to other equipment like pumps and compressors. Important remarks are the stability and robustness of this monitoring system, which can keep performing the computation of metrics with an intensive multivariable process.

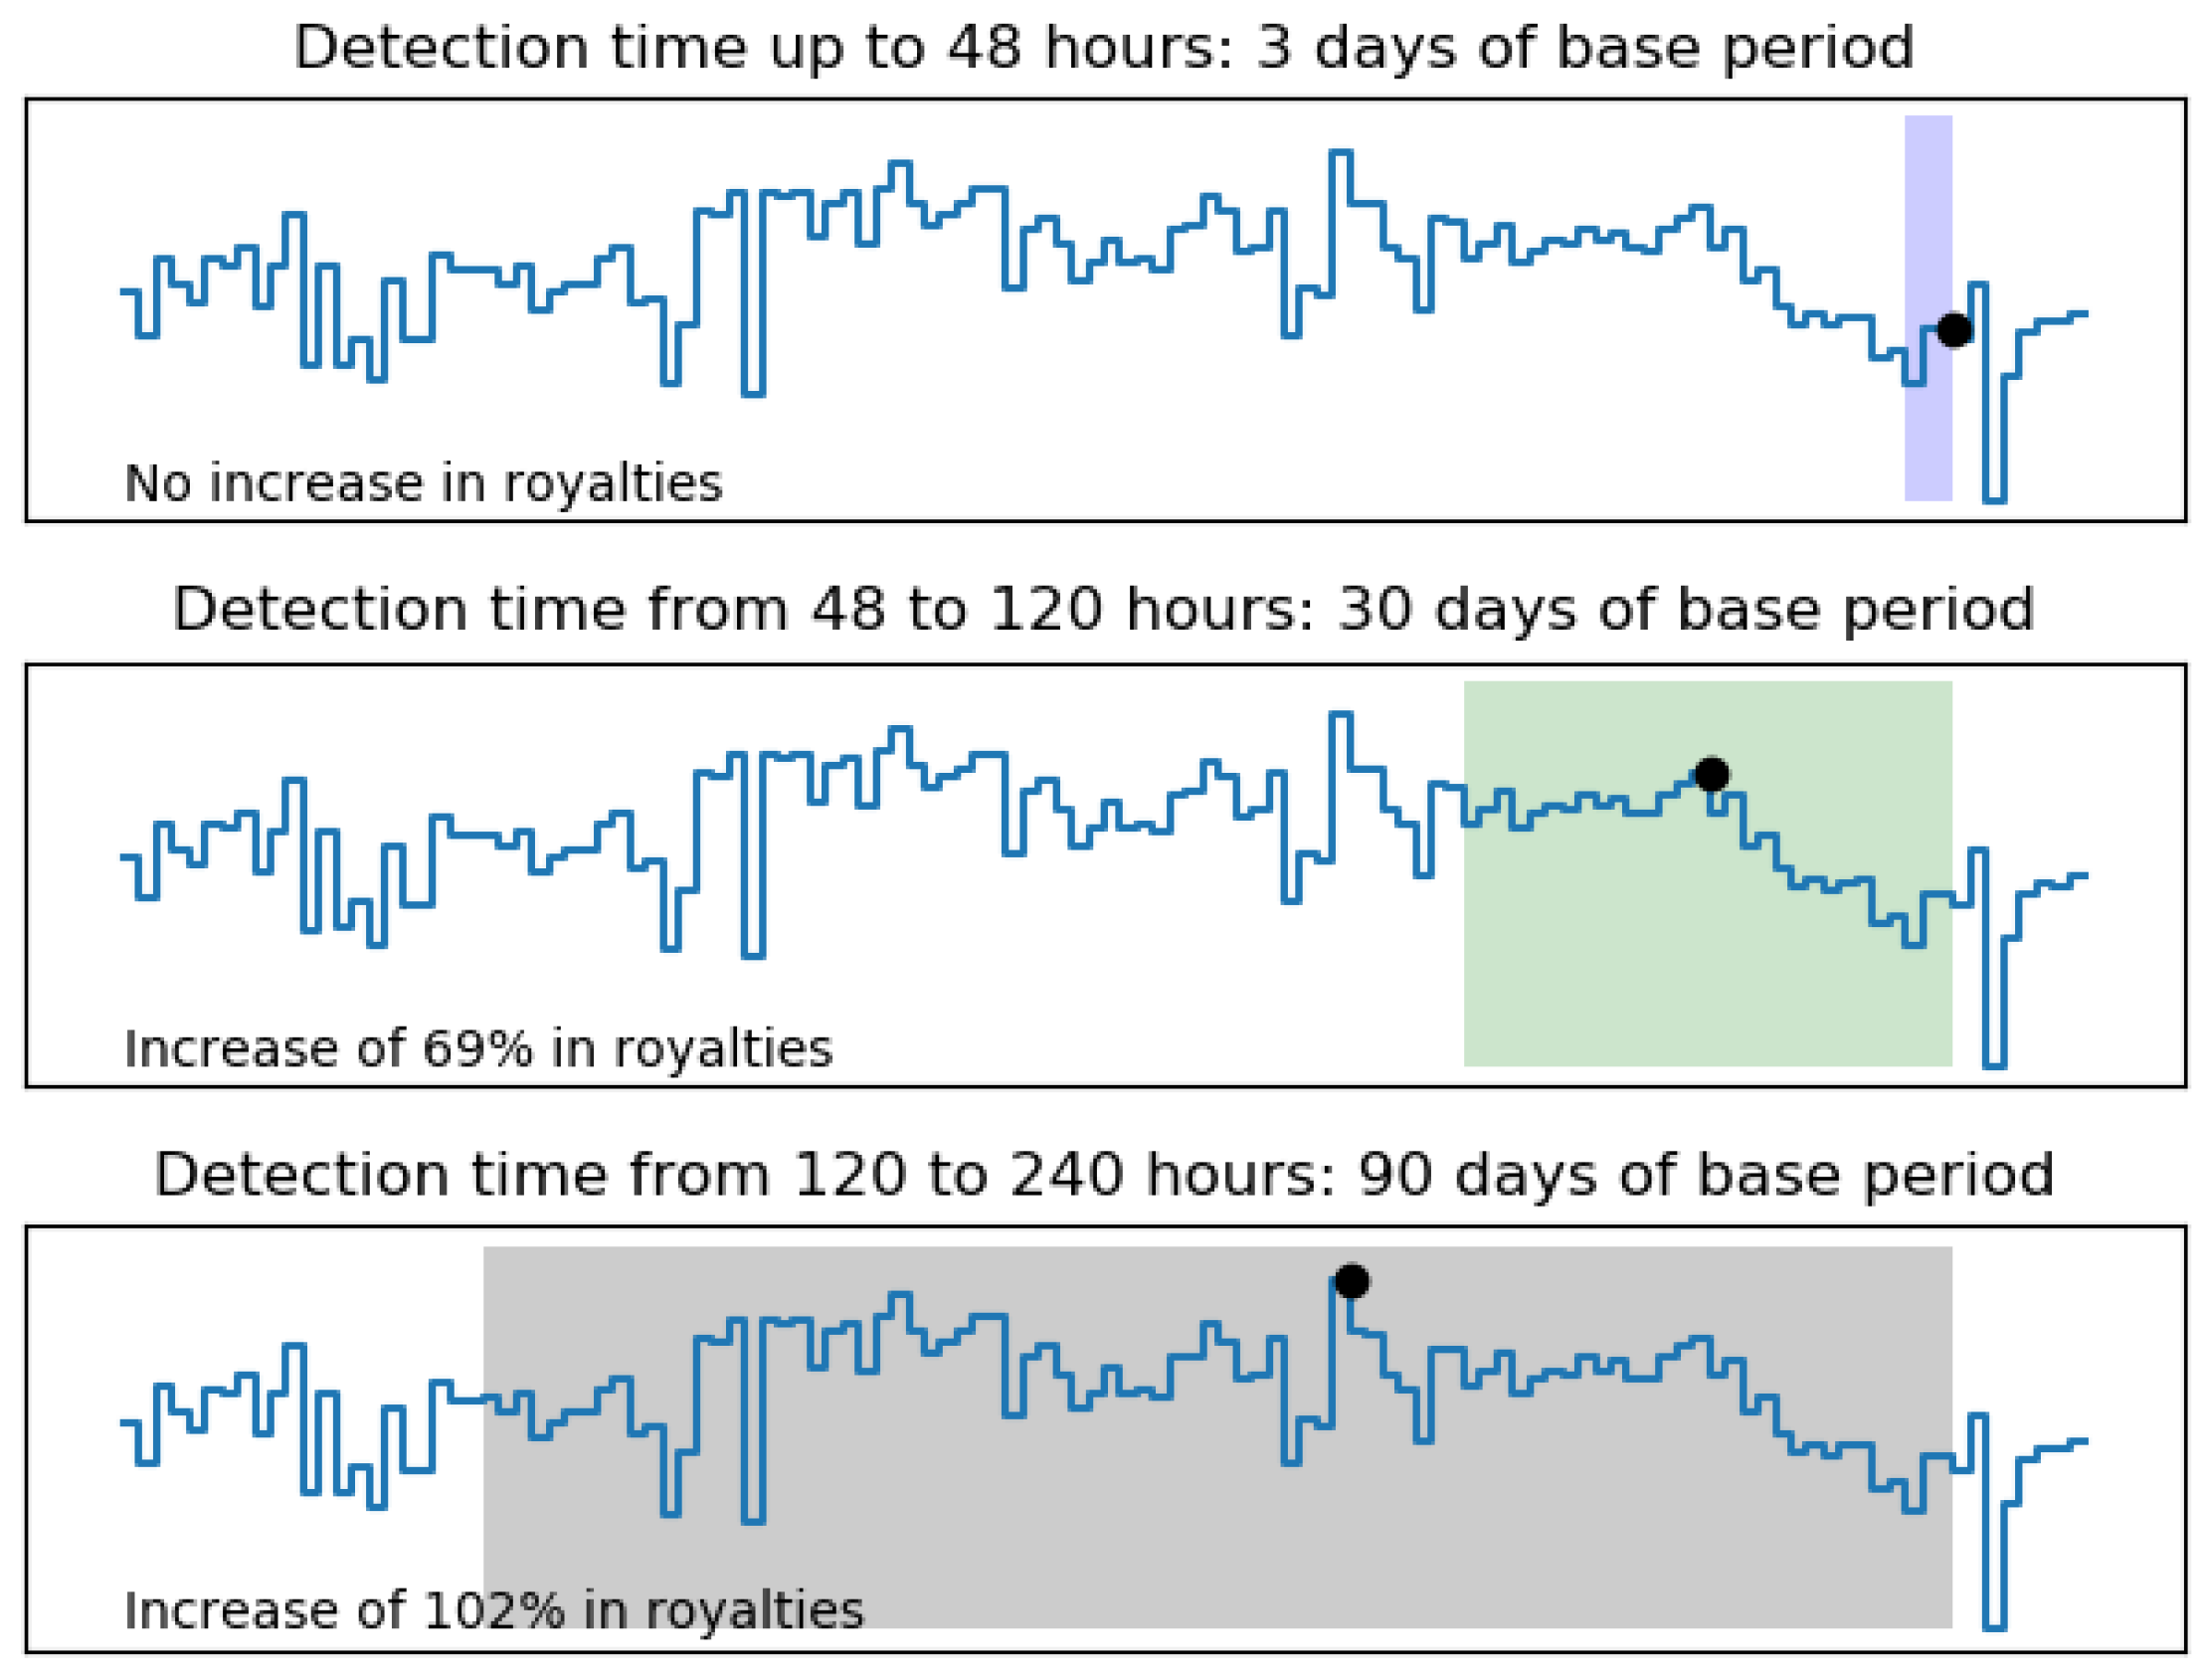
4.3. Economic Analysis Remarks

In the period of test studied, the fault event was a typical case of sensor malfunctioning leading to erroneous measurements. As discussed above, the regulatory agency states that the longer this period in fault, the larger is the base period in order to correct the production. Figure 7 shows the daily mean of production in the period of the fault.
As can be seen, in the first case (detection time up to 48 h), there was no significant increase in oil production, or consequently, in royalty costs, assuming that the latter is directly proportional to the former, due to the small base period. On the other hand, for the second and third cases, the increases were around 70% and 100%, respectively. In other words, the calibration of fiscal metering can compromise a great amount of extra money of the company. Besides that, there are other economic impacts of the fault for the company, such as fines and, in the extreme case, the shutdown of the process section. These factors impose very accurate sensors in the fiscal metering area and a continuous surveillance, which can be achieved by the proposed process condition monitoring system, PMA. In terms of costs and benefits, a similar system can be made in a couple of months with a small team of programmers and engineers. On the other hand, the order of magnitude of the economic impact of a single fault can easily exceed these costs, depending on the production size of the platform.

5. Conclusions

In this paper, a data-driven system for monitoring was developed and implemented in a real oil process plant. The system, called PMA, used the CVA method to generate data-driven models and control charts to statistically monitor the condition of the process. PMA was applied to fiscal metering in order to improve the reliability of the related operations. The results showed that the system could not only correctly detect the anomaly at the moments of its occurrence, but also identify its main cause, among several other pieces of equipment operating at the facility. This fast response, associated with the large amount of oil and gas constantly being measured by these meters, shows the economic impact that a system such as PMA can provide to the oil and gas industry.

Author Contributions

Conceptualization, T.F., T.K.A., and J.C.P.; data curation, A.M., M.M.C., T.F., T.K.A., and P.H.T.; funding acquisition, T.K.A. and J.C.P.; methodology, T.F.; project administration, T.F., T.K.A., and P.H.T.; resources, T.K.A., P.H.T., and F.C.D.; software, A.M., M.M.C., T.F., and P.H.T.; supervision, J.C.P.; writing, original draft, N.C., T.F., and T.K.A.; writing, review and editing, N.C., M.M.C., T.F., and T.K.A.

Funding

This study was financed in part by the Coordenação de Aperfeiçoamento de Pessoal de Nível Superior-Brasil (CAPES)-Finance Code 001. The authors also thank CNPq-Conselho Nacional de Desenvolvimento Científico e Tecnológico, and Petrobras (Petróleo Brasileiro SA), for the financial support of this work, as well as for covering the costs to publish in open access.

Conflicts of Interest

The authors declare no conflict of interest. The funders had no role in the design of the study; in the collection, analyses, or interpretation of data; in the writing of the manuscript; nor in the decision to publish the results.

Abbreviations

The following abbreviations are used in this manuscript:
CVACanonical Variate Analysis
CBMConditional-Based Maintenance
FDDFault Detection and Diagnosis
PMAPredictive Maintenance Application
RVMRelevant Vector Machines
SVDSingular-Value Decomposition
SPESquare Prediction Error
PDCPartial Decomposition Contribution
PFDProcess Flow Diagram
PCAPrincipal Components Analysis

References

  1. Russell, E.L.; Chiang, L.; Braatz, R. Data-Driven Methods for Fault Detection and Diagnosis in Chemical Processes; Springer: Berlin/Heidelberg, Germany, 2000. [Google Scholar]
  2. Gao, Z.; Cecati, C.; Ding, S.X. A Survey of Fault Diagnosis and Fault-Tolerant Techniques—Part I: Fault Diagnosis With Model-Based and Signal-Based Approaches. IEEE Trans. Ind. Electron. 2015, 62, 3757–3767. [Google Scholar] [CrossRef]
  3. Liu, J.; Luo, W.; Yang, X.; Wu, L. Robust Model-Based Fault Diagnosis for PEM Fuel Cell Air-Feed System. IEEE Trans. Ind. Electron. 2016, 63, 3261–3270. [Google Scholar] [CrossRef] [Green Version]
  4. Isermann, R. Model-based fault-detection and diagnosis: Status and applications. Annu. Rev. Control 2005, 29, 71–85. [Google Scholar] [CrossRef]
  5. Venkatasubramanian, V.; Rengaswamy, R.; Yin, K.; Kavuri, S.N. A review of process fault detection and diagnosis: Part I: Quantitative model-based methods. Comput. Chem. Eng. 2003, 27, 293–311. [Google Scholar] [CrossRef]
  6. Gharahbagheri, H.; Imtiaz, S.A.; Khan, F.I. Application of Bayesian network for root cause diagnosis of chemical process fault. In Proceedings of the 2017 Indian Control Conference (ICC), Guwahati, India, 4–6 January 2017; pp. 188–193. [Google Scholar] [CrossRef]
  7. Yuan, T.; Qin, S.J. Root cause diagnosis of plant-wide oscillations using Granger causality. J. Process Control 2014, 24, 450–459. [Google Scholar] [CrossRef]
  8. Chen, H.S.; Zhao, C.; Yan, Z.; Yao, Y. Root Cause Diagnosis of Oscillation-Type Plant Faults Using Nonlinear Causality Analysis. IFAC-PapersOnLine 2017, 50, 13898–13903. [Google Scholar] [CrossRef]
  9. Li, G.; Qin, S.J.; Yuan, T. Data-driven root cause diagnosis of faults in process industries. Chemom. Intell. Lab. Syst. 2016, 159, 1–11. [Google Scholar] [CrossRef]
  10. Ragab, A.; El-Koujok, M.; Poulin, B.; Amazouz, M.; Yacout, S. Fault diagnosis in industrial chemical processes using interpretable patterns based on Logical Analysis of Data. Expert Syst. Appl. 2018, 95, 368–383. [Google Scholar] [CrossRef]
  11. Trunzer, E.; Wu, C.; Guo, K.; Vermum, C.; Vogel-Heuser, B. Data-Driven Approach to Support Experts in the Identification of Operational States in Industrial Process Plants. In Proceedings of the IECON 2018 44th Annual Conference of the IEEE Industrial Electronics Society, Washington, DC, USA, 21–23 October 2018; pp. 3096–3101. [Google Scholar] [CrossRef]
  12. Askarian, M.; Benítez, R.; Graells, M.; Zarghami, R. Data-based fault detection in chemical processes: Managing records with operator intervention and uncertain labels. Expert Syst. Appl. 2016, 63, 35–48. [Google Scholar] [CrossRef] [Green Version]
  13. Lv, F.; Wen, C.; Bao, Z.; Liu, M. Fault diagnosis based on deep learning. In Proceedings of the 2016 American Control Conference (ACC), Boston, MA, USA, 6–8 July 2016; pp. 6851–6856. [Google Scholar] [CrossRef]
  14. Qian, Y.; Li, X.; Jiang, Y.; Wen, Y. An expert system for real-time fault diagnosis of complex chemical processes. Expert Syst. Appl. 2003, 24, 425–432. [Google Scholar] [CrossRef]
  15. Venkatasubramanian, V.; Rengaswamy, R.; Kavuri, S.N.; Yin, K. A review of process fault detection and diagnosis: Part III: Process history based methods. Comput. Chem. Eng. 2003, 27, 327–346. [Google Scholar] [CrossRef]
  16. Isermann, R. Process fault detection based on modeling and estimation methods—A survey. Automatica 1984, 20, 387–404. [Google Scholar] [CrossRef]
  17. Gertler, J.J. Survey of model-based failure detection and isolation in complex plants. IEEE Control Syst. Mag. 1988, 8, 3–11. [Google Scholar] [CrossRef]
  18. Frank, P.M. Fault diagnosis in dynamic systems using analytical and knowledge-based redundancy: A survey and some new results. Automatica 1990, 26, 459–474. [Google Scholar] [CrossRef]
  19. Isermann, R. Supervision, fault-detection and fault-diagnosis methods—An introduction. Control Eng. Pract. 1997, 5, 639–652. [Google Scholar] [CrossRef]
  20. Maurya, M.R.; Paritosh, P.K.; Rengaswamy, R.; Venkatasubramanian, V. A framework for on-line trend extraction and fault diagnosis. Eng. Appl. Artif. Intell. 2010, 23, 950–960. [Google Scholar] [CrossRef]
  21. Venkatasubramanian, V.; Rengaswamy, R.; Kavuri, S.N. A review of process fault detection and diagnosis: Part II: Qualitative models and search strategies. Comput. Chem. Eng. 2003, 27, 313–326. [Google Scholar] [CrossRef]
  22. Ge, Z.; Song, Z.; Gao, F. Review of Recent Research on Data-Based Process Monitoring. Ind. Eng. Chem. Res. 2013, 52, 3543–3562. [Google Scholar] [CrossRef]
  23. Qin, S.J. Survey on data-driven industrial process monitoring and diagnosis. Annu. Rev. Control 2012, 36, 220–234. [Google Scholar] [CrossRef]
  24. Yin, S.; Ding, S.X.; Haghani, A.; Hao, H.; Zhang, P. A comparison study of basic data-driven fault diagnosis and process monitoring methods on the benchmark Tennessee Eastman process. J. Process Control 2012, 22, 1567–1581. [Google Scholar] [CrossRef]
  25. Nor, N.M.; Hassan, C.R.C.; Hussain, M.A. A review of data-driven fault detection and diagnosis methods: Applications in chemical process systems. Rev. Chem. Eng. 2019, 1–40. [Google Scholar] [CrossRef]
  26. Wong, P.K.; Yang, Z.; Vong, C.M.; Zhong, J. Real-time fault diagnosis for gas turbine generator systems using extreme learning machine. Neurocomputing 2014, 128, 249–257. [Google Scholar] [CrossRef]
  27. Namburu, S.M.; Chigusa, S.; Prokhorov, D.; Qiao, L.; Choi, K.; Pattipati, K. Application of an Effective Data-Driven Approach to Real-time time Fault Diagnosis in Automotive Engines. In Proceedings of the 2007 IEEE Aerospace Conference, Big Sky, MT, USA, 3–10 March 2007; pp. 1–9. [Google Scholar] [CrossRef]
  28. Patan, K.; Parisini, T. Identification of neural dynamic models for fault detection and isolation: The case of a real sugar evaporation process. J. Process Control 2005, 15, 67–79. [Google Scholar] [CrossRef]
  29. Hu, J.; Tse, P.W. A Relevance Vector Machine-Based Approach with Application to Oil Sand Pump Prognostics. Sensors 2013, 13, 12663–12686. [Google Scholar] [CrossRef] [PubMed] [Green Version]
  30. Bang, M.; Engelsgaard, S.S.; Alexandersen, E.K.; Skydt, M.R.; Shaker, H.R.; Jradi, M. Novel real-time model-based fault detection method for automatic identification of abnormal energy performance in building ventilation units. Energy Build. 2019, 183, 238–251. [Google Scholar] [CrossRef]
  31. Lei, J.; Liu, C.; Jiang, D. Fault diagnosis of wind turbine based on Long Short-term memory networks. Renew. Energy 2019, 133, 422–432. [Google Scholar] [CrossRef]
  32. Chen, K.; Laghrouche, S.; Djerdir, A. Fuel cell health prognosis using Unscented Kalman Filter: Postal fuel cell electric vehicles case study. Int. J. Hydrogen Energy 2019, 44, 1930–1939. [Google Scholar] [CrossRef]
  33. Fuente, M.; Vega, P. Neural networks applied to fault detection of a biotechnological process. Eng. Appl. Artif. Intell. 1999, 12, 569–584. [Google Scholar] [CrossRef]
  34. Li, L.; Luo, H.; Ding, S.X.; Yang, Y.; Peng, K. Performance-based fault detection and fault-tolerant control for automatic control systems. Automatica 2019, 99, 308–316. [Google Scholar] [CrossRef]
  35. Li, C.; Zhao, D.; Mu, S.; Zhang, W.; Shi, N.; Li, L. Fault diagnosis for distillation process based on CNN-DAE. Chin. J. Chem. Eng. 2019, 27, 598–604. [Google Scholar] [CrossRef]
  36. Marseguerra, M.; Ricotti, M.E.; Zio, E. Neural Network-Based Fault Detections in a Pressurized Water Reactor Pressurizer. Nucl. Sci. Eng. 1996, 124, 339–348. [Google Scholar] [CrossRef]
  37. Persin, S.; Tovornik, B. Real-time implementation of fault diagnosis to a heat exchanger. Control Eng. Pract. 2005, 13, 1061–1069. [Google Scholar] [CrossRef]
  38. Choi, K.; Namburu, S.M.; Azam, M.S.; Luo, J.; Pattipati, K.R.; Patterson-Hine, A. Fault diagnosis in HVAC chillers. IEEE Instrum. Meas. Mag. 2005, 8, 24–32. [Google Scholar] [CrossRef]
  39. Natarajan, S.; Srinivasan, R. Multi-model based process condition monitoring of offshore oil and gas production process. Chem. Eng. Res. Des. 2010, 88, 572–591. [Google Scholar] [CrossRef]
  40. Li, G.; Qin, S.J.; Ji, Y.; Zhou, D. Reconstruction based fault prognosis for continuous processes. Control Eng. Pract. 2010, 18, 1211–1219. [Google Scholar] [CrossRef]
  41. Hwang, H.J. Introduction to a Condition-based Maintenance Solution for Offshore Platforms. In Proceedings of the Twenty-Fifth International Ocean and Polar Engineering Conference, Kona, HI, USA, 21–26 June 2015; International Society of Offshore and Polar Engineers: Mountain View, CA, USA, 2015. [Google Scholar]
  42. Hwang, H.; Lee, J.; Hwang, J.; Jun, H. A study of the development of a condition-based maintenance system for an LNG FPSO. Ocean Eng. 2018, 164, 604–615. [Google Scholar] [CrossRef]
  43. Ly, C.; Tom, K.; Byington, C.S.; Patrick, R.; Vachtsevanos, G.J. Fault diagnosis and failure prognosis for engineering systems: A global perspective. In Proceedings of the 2009 IEEE International Conference on Automation Science and Engineering, Bangalore, India, 22–25 August 2009; pp. 108–115. [Google Scholar] [CrossRef]
  44. Thorsen, O.V.; Dalva, M. A survey of faults on induction motors in offshore oil industry, petrochemical industry, gas terminals, and oil refineries. IEEE Trans. Ind. Appl. 1995, 31, 1186–1196. [Google Scholar] [CrossRef]
  45. Zhang, L.; Hu, J. Safety prognostic technology in complex petroleum engineering systemsf: Progress, challenges and emerging trends. Pet. Sci. 2013, 10, 486–493. [Google Scholar] [CrossRef]
  46. Cibulka, J.; Ebbesen, M.K.; Hovland, G.; Robbersmyr, K.G.; Hansen, M.R. A Review on Approaches for Condition Based Maintenance in Applications with Induction Machines Located Offshore. Model. Identif. Control 2012, 33, 69–86. [Google Scholar] [CrossRef]
  47. Gowid, S.; Dixon, R.; Ghani, S. Profitability, reliability and condition based monitoring of LNG floating platforms: A review. J. Nat. Gas Sci. Eng. 2015, 27, 1495–1511. [Google Scholar] [CrossRef] [Green Version]
  48. Reis, M.S.; Gins, G. Industrial Process Monitoring in the Big Data/Industry 4.0 Era: From Detection, to Diagnosis, to Prognosis. Processes 2017, 5, 35. [Google Scholar] [CrossRef]
  49. Jackson, J.E.; Mudholkar, G.S. Control Procedures for Residuals Associated with Principal Component Analysis. Technometrics 1979, 21, 341–349. [Google Scholar] [CrossRef]
  50. Ku, W.; Storer, R.H.; Georgakis, C. Disturbance detection and isolation by dynamic principal component analysis. Chemom. Intell. Lab. Syst. 1995, 30, 179–196. [Google Scholar] [CrossRef]
  51. Rato, T.; Reis, M. Advantage of Using Decorrelated Residuals in Dynamic Principal Component Analysis for Monitoring Large-Scale Systems. Ind. Eng. Chem. Res. 2013, 52, 13685–13698. [Google Scholar] [CrossRef]
  52. Negiz, A.; Çinar, A. PLS, balanced, and canonical variate realization techniques for identifying VARMA models in state space. Chemom. Intell. Lab. Syst. 1997, 38, 209–221. [Google Scholar] [CrossRef]
  53. Jolliffe, I. Principal component analysis. Technometrics 2002, 45, 276. [Google Scholar] [CrossRef]
  54. Röhr, M.; Gittins, R. Canonical Analysis—A Review with Applications in Ecology (Biomathematics, vol. 12), Springer-Verlag, Berlin–Heidelberg– New York –Tokyo 1985, 351 S., 16 Abb., DM 128,–. Biom. J. 1988, 30, 249–250. [Google Scholar] [CrossRef]
  55. Schaper, C.; Larimore, W.; Seborg, D.; Mellichamp, D. Identification of chemical processes using canonical variate analysis. Comput. Chem. Eng. 1994, 18, 55–69. [Google Scholar] [CrossRef]
  56. Alcala, C.; Qin, S.J. Analysis and generalization of fault diagnosis methods for process monitoring. J. Process Control 2011, 21, 322–330. [Google Scholar] [CrossRef]
  57. Nelson, L.S. The Shewhart Control Chart-Tests for Special Causes. J. Qual. Technol. 1984, 16, 237–239. [Google Scholar] [CrossRef]
  58. Câmara, M.M. Técnicas de Identificação Voltadas Para a Otimização de Processos em Tempo Real. Ph.D. Thesis, Universidade Federal do Rio de Janeiro/COPPE/Programa de Engenharia Química, Rio de Janeiro, Brazil, 2018. (In Portuguese). [Google Scholar]
  59. Diretora Geral da Agência Nacional do Petróleo, Gás Natural e Biocombustíveis. Resolução ANP Nº 18 DE 27/03/2014. 2014. Available online: http://legislacao.anp.gov.br/?path=legislacao-anp/resol-anp/2014/marco&item=ranp-18–2014 (accessed on 8 April 2019).
Figure 1. Description diagram of the PMA system.
Processes 07 00436 g001
Figure 2. Oil and gas metering station PFD.
Processes 07 00436 g002
Figure 3. Measure estimation methodology used by the regulatory agency.
Processes 07 00436 g003
Figure 4. Control chart using a univariate monitoring approach.
Processes 07 00436 g004
Figure 5. SPE statistic for sensor fault in Fiscal Metering Station II during eight months. In red, the dynamic behavior of the gas fiscal temperature contribution to SPE. Dots represent fault alarm activation. The orange dashed line is the detection limit.
Processes 07 00436 g005
Figure 6. SPE statistic for the sensor fault in Fiscal Metering Station II during one month. In red, the dynamic behavior of the gas fiscal temperature contribution to SPE. Black dots represent fault alarm activation. The orange dashed line is the detection limit.
Processes 07 00436 g006
Figure 7. Three scenarios for the calculation of the royalty-bearings. The black point is the maximum daily mean of production in each hatched period.
Processes 07 00436 g007
Table 1. Variable types measured in the gas-oil metering station.
Variable TypeNumber of VariablesUnits
Flow rate40m 3 /h
Temperature11 C
Controller output2%
Pressure differential8kPa
Pressures21kPa
Levels2m
Relative density9-
Basic Sediment and water6%
Electric current9mA
Valve aperture4%

