1. Introduction
Usually, the most important areas that affect evaporation systems in typical sugar mills are milling and crystallization. The first area is responsible for milling of the harvested cane and the entire plant depends on this activity. The second area is responsible for transforming juice into sugar crystals. In these sugar milling sites, multi-effect evaporation (MEE) units play a key role, as they are primarily responsible for concentrating the juice, but they also provide low-pressure steam for many areas of the plant, such as the crystallization units. As a matter of fact, energetic integration constitutes a very common practice in sugar-cane based processes. In spite of that, many practical challenges hamper the wide application of advanced control and optimization techniques in milling sites to ensure the high performance operation of MEE units. In the absence of advanced control techniques, many decisions are normally taken by supervisory personnel, that keeps constant communication with operation personnel to adapt the evaporation process to plant requirements. Thus, production operation counts mainly on the accumulated technical experiences and personal feelings of plant crew to make the necessary complex operation decisions. In many cases, these decisions are driven by different abstract criteria, converging to simple and trivial actions that may lack the desired technical and methodological foundations and can consequently be biased. In this context, there certainly are many opportunities to improve process performance and market competitiveness in the sugar-energy industry, which may be accomplished through application of advanced process engineering tools, such as digital twins.
Many efforts have been made to build process models to represent industrial MEE units. Evaporation steady-state models were developed to represent the process in simulation and optimization contexts, but with lack of validation with actual industrial data [
1,
2,
3]. On the other hand, some authors developed steady-state models that could provide good fits of industrial data [
4,
5,
6,
7], but these tools have been used so far for off-line applications. Thus, in these cases model and process are disconnected. Additionally, dynamic modeling of MEE units is scarce [
8,
9,
10,
11], and industrial validation has been provided by a single application [
10]. Only one published work took into account the link between model and plant to propose performance indicators based on steady-state model outputs in order to guide the energy integration in real time [
12]. Based on the available literature, one can conclude that dynamic MEE models have not been implemented so far for real time analyses of actual industrial processes.
Some practical challenges are critical for development and application of model-based tools. In general, operation crews dedicate most of their time to solution of routine problems, causing process models to become outdated. Besides, optimization initiatives frequently face the lack of appropriate instrumentation and the lack of confidence that the obtained solutions will provide the desired return of the investment. While academia is unanimous about the benefits that process operation can obtain with the implementation of advanced optimization and control tools, it is not easy to prove the value of advanced technologies in real industrial sites [
13,
14,
15]. In spite of this, the value of technological innovation is widely recognized in the industrial environment and there certainly are many opportunities to apply advanced tools that combine process engineering tools, engineering intelligence and simple usability in industrial plants, such as
digital twins.
The term “Digital Twin” is relatively new and generally regards the virtual and accurate representation of a system, which can range from pieces of equipment to the entire industrial process, and has been used often by mainstream solution providers of industrial technology [
16,
17]. Digital twins have attracted an increasing interest due to their claimed capacity of providing good quality information about the system in real time [
18,
19].
In this context, this paper focuses on the dynamic modeling of a real MEE system. More specifically, this work presents the development and implementation of a customized digital twin to assist the production MEE operation in real time, connecting and synchronizing model and plant to build an integrated tool for process monitoring in real time. After industrial validation, the model can be used in many applications, including operator training, fault identification, advanced process control and optimization.
2. Process Description
This work deals with an industrial Robert type evaporation train with four effects [
20].
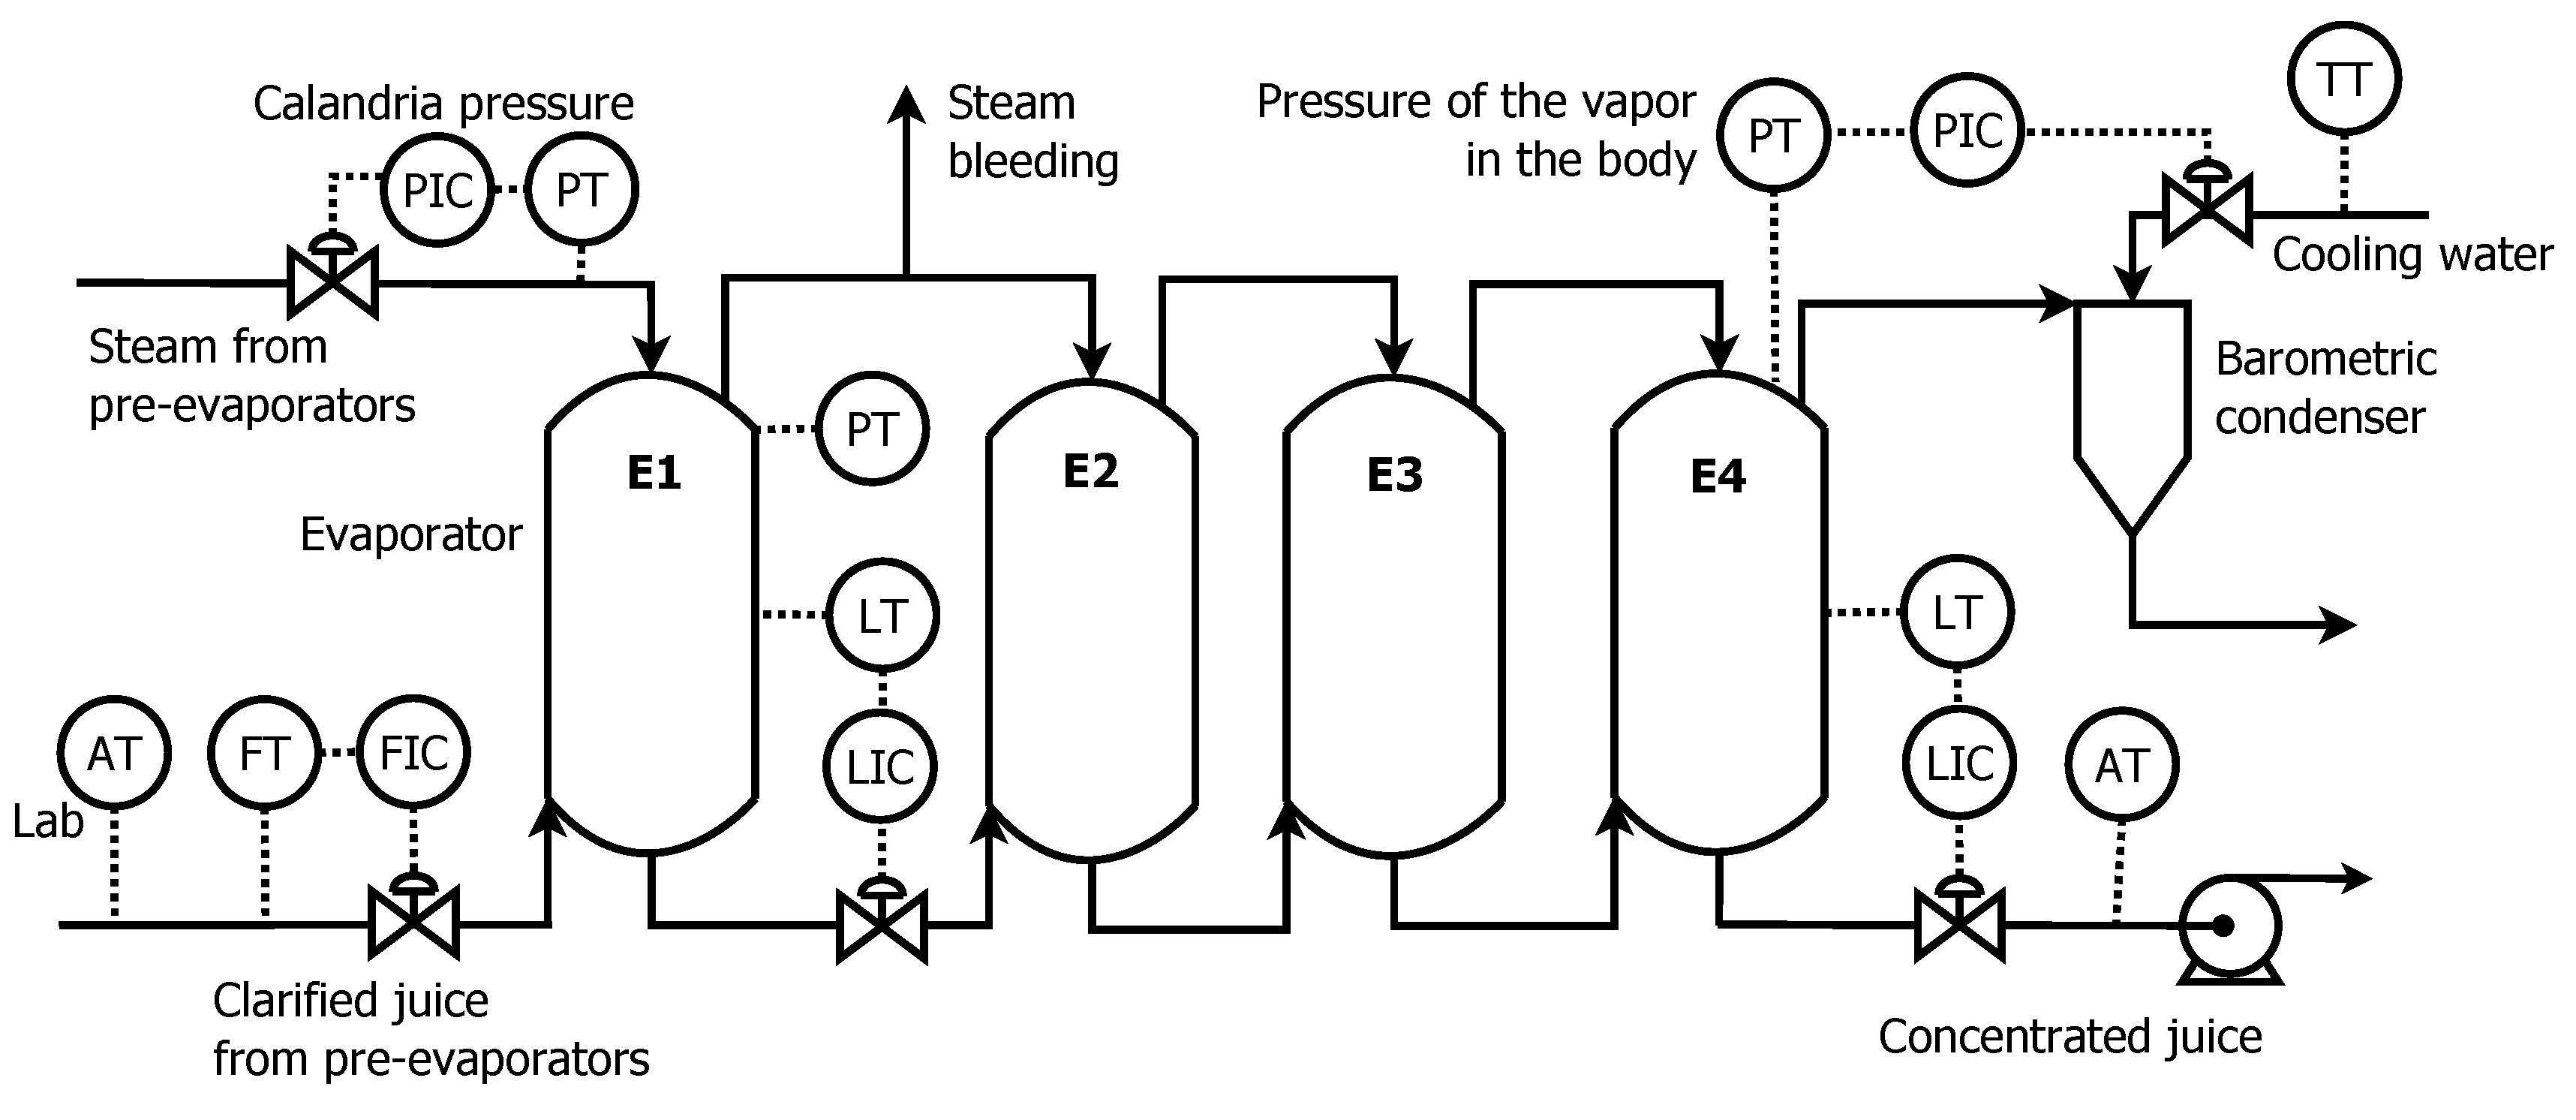
Figure 1 shows a simplified flowchart of the process and
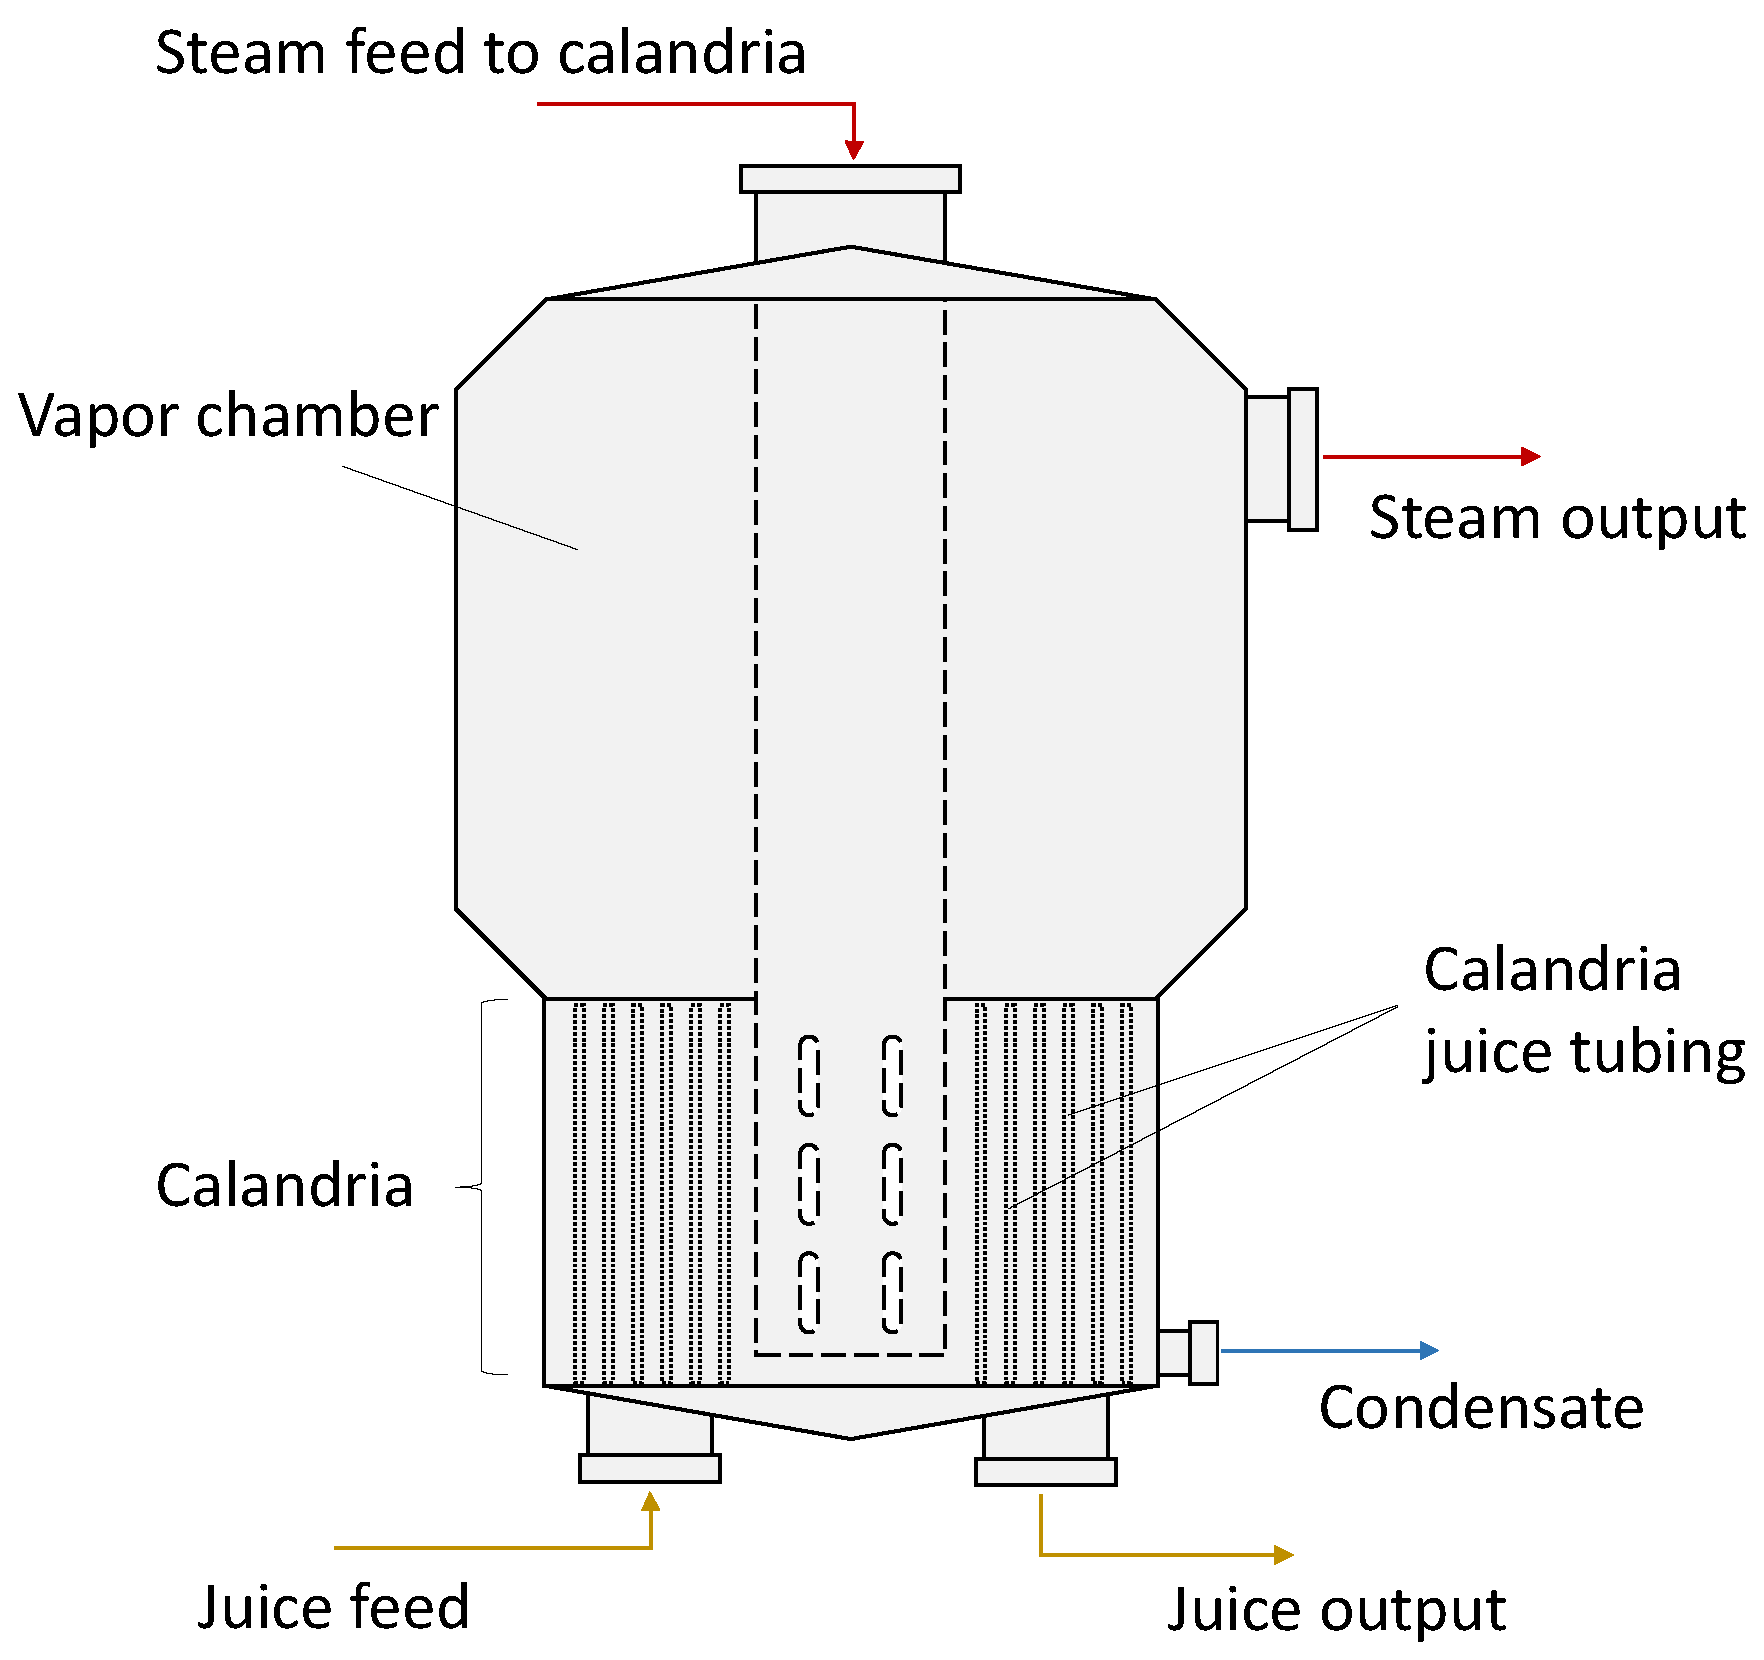
Figure 2 presents a simplified scheme of each evaporator. Analyses of evaporation trains can be particularly challenging due to the low level of instrumentation and lack of automatic control loops in most industrial sites.
Available measurements in the analyzed case are listed in
Table 1. The system counts essentially on seven sensors: two level indicators, three pressure indicators, one feed flow meter and one brix sensor. Pressure and level are measured only in the first and last evaporators of the train. Other measurements are available from peripheral areas, such as pre-evaporation, utilities, and quality control analyses. It is important to emphasize that available signals are acquired with different sampling rates.
Control loops for level and pressure are also available in tanks 1 and 4 of the train. Set points are based on the operators’ experience and empirical knowledge, and typically serve for stabilizing levels and product brix due to the absence of advanced control schemes. Inner tanks are controlled manually without any explicit information about pressures and with the aid of inspection windows installed in the evaporator body, which can indicate the high level of fluid. There are no indications of calandria pressures, except for the first tank, which counts on a control loop for pressure control and a visual pressure indicator for assistance of operators. As a consequence of the lack of instrumentation, each of the three teams of operators can follow their own operating criteria, based on the particular experiences accumulated by the teams, while respecting the brix setpoints.
3. The Digital Twin Framework
As discussed in the previous sections, the studied MEE system counts on a limited set of instruments and control devices. As a consequence, level can vary significantly over time, making the use of dynamic models necessary to represent the process with the desired accuracy. The model assumptions are summarized as follows:
Independent hold up is considered for all effects;
Perfect mixing is considered in the juice chamber, so that the juice that leaves the evaporator has the same properties of the juice present in the chamber;
Steam does not accumulate within the calandria;
The boiling-point of the juice is affected by brix, temperature and pressure;
Thermodynamic parameters and densities vary with temperature and brix;
Only the latent heat of the steam is transferred within the calandria;
Energy loss is negligible as steam passes across a restriction, such as a steam valve;
The evaporation process produces superheated steam as an effect of boiling-point elevation;
The amount of heat stored in the chamber walls is negligible;
Variations of ambient temperature can be ignored.
3.1. Mass and Energy Balances
The model comprises a set of ordinary differential equations for each tank, including energy balances and material balances for juice, sugar, and steam. Several auxiliary equations are also needed for determination of thermodynamic and fluid dynamic properties.
The mass balance for juice, Equation (
1), accounts for feeding and draining of liquid flows and also for vapor production through evaporation.
The mass balance of sugar, Equation (
2), is written under the hypothesis that all dissolved solids leave the tank through the liquid stream. The concentration of soluble solids, represented as degrees brix (
X), is calculated as the fraction
.
Only generation and leaving terms are included in the mass balance of vapor, Equation (
3). Two output streams are considered here: one that feeds the calandria of the next tank and another that feeds other processes, referred to as steam bleeding. In the present case, steam bleeding is only present in the output vapor stream of tank 1.
Finally, the energy balance, Equation (
4), is written in terms of phase change enthalpy together with heat provided by heating steam, and energy lost to the environment.
3.2. Empirical Model Equations
The vapor pressure of aqueous sugar solutions is known to depend on temperature, sugar content and sugar composition. Particularly, in presence of sugars the boiling temperature of the aqueous solution increases and can be calculated with Equation (
5) [
21]:
where
is the mass of sugar in the evaporator,
is the mass of juice,
is the saturation temperature of pure water,
is the sugar purity and
is the boiling point elevation.
The global heat transfer coefficient (
U) was modeled according to Equation (
6), which includes effects for the sugar content and temperature of the juice [
20]. The digital twin uses this equation as a reference with some corrections induced by the brix difference between the calculated and the reference values, for purposes of real time adaptation of the model performance.
where
is the juice brix,
is the juice temperature,
is the observer gain and
is the reference brix, as measured in the outlet stream of the fourth tank
. As desired brix values for each tank are defined by the operation crew, these values were used as references for calculation of the initial conditions and for corrections performed by the numerical state observer (Equation (
7)).
The specific gravity and thermodynamic properties of the juice were calculated as described by Llano-Restrepo (2005) [
22], Rein (2016) [
20] and Hugot (1986) [
23], considering effects of sugar content, sugar purity and temperature. The thermodynamic properties of vapor streams, such as specific weight and enthalpies, were calculated as described by Smith et al. (2001) [
24].
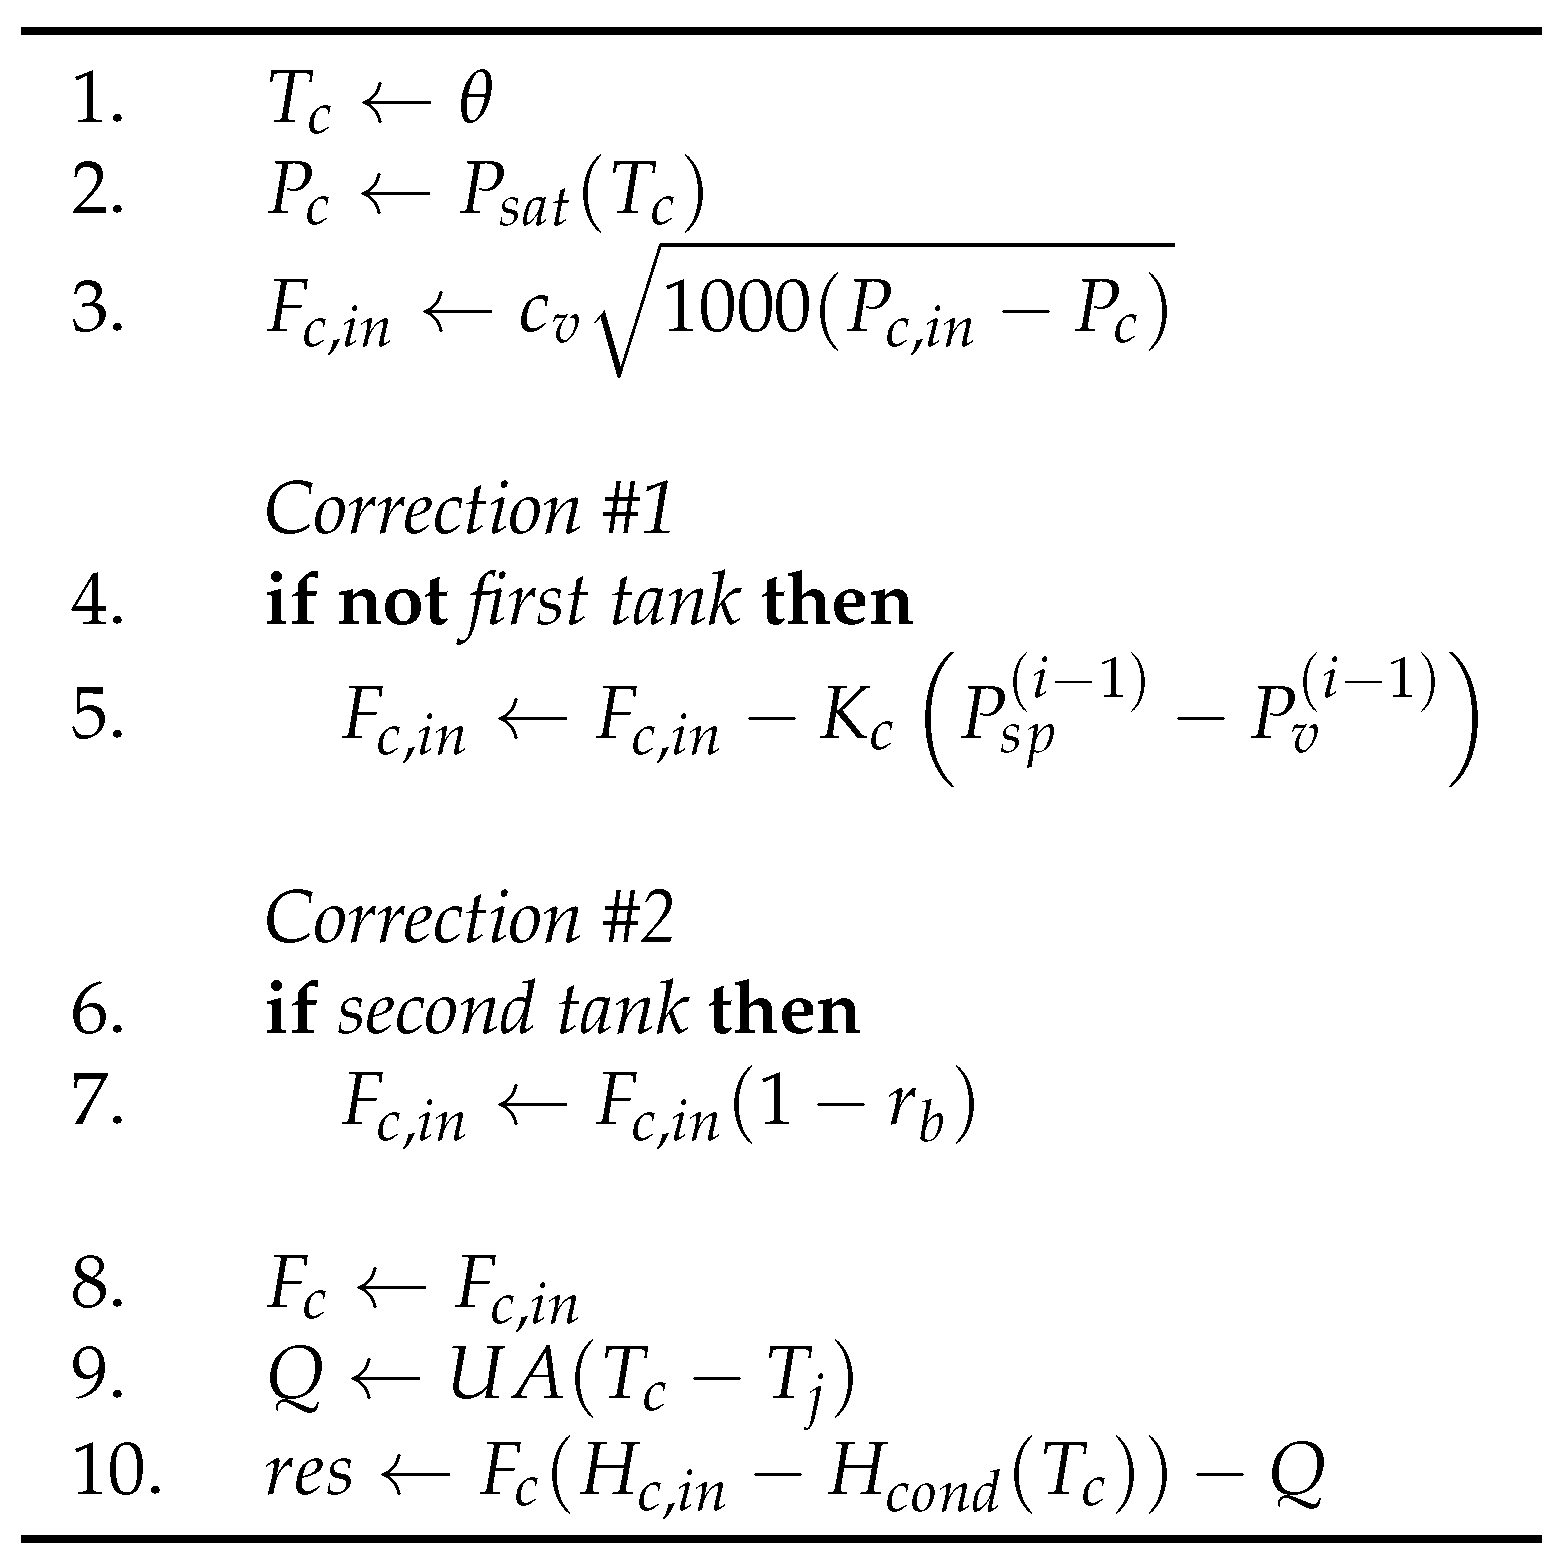
3.3. Computation of
The proposed model comprises a system of nonlinear algebraic equations that must be solved for calculation of the equilibrium temperatures in the calandrias (
). The proposed solving procedure is described in
Figure 3.
The proposed procedure searches the value
that satisfies the energy balance equation for the calandria,
, considering simultaneously the heat transfer effect and the steam condensation effect. In order to calculate the heat involved in these events, the flow of steam must be estimated. Using an initial guess (
) for
, the algorithm starts with the calculation of the saturation pressures at the calandrias of each tank. In all vessels, with exception of the first evaporator,
values are corrected with help of a state observer equation, where the vapor pressure (
) is compared to the reference value (
), as discussed in Equation (
7) for
. Subsequently, the bleed flow must be subtracted from the vapor stream that feeds the following tank, considering that the accumulation of vapor in the calandria is null. Then, the heat flow is calculated considering the heat transfer coefficient to the wall, which depends on the temperature and brix of the juice. The heat exchanged should be equal to the latent heat of condensed water at the calandria temperature. Convergence is achieved when energy balance equation for the calandria (
) is satisfied within a given tolerance. In the final step, equilibrium temperature
must be smaller than or equal to the temperature of feed vapor in order to satisfy the physics of the system.
3.4. Connection between Evaporators
The juice flowing between evaporators (
) is estimated with a state observer, as shown in Equation (
8), which corrects the flows with help of the expected level fluctuations, using references
. Reference
values are measured or reported by operation crews and were used for calculating the initial conditions in the form
where
a is the cross-section area of the tube,
v is the discharge flow velocity, calculated using the Bernoulli equation, Equation (
9), and
is the observer gain.
is the difference between tanks for pressure (
P) and liquid height (
h), and
is the juice specific weight at process conditions.
The vapor flow rate generated during evaporation (
) can also be estimated through a state observer, Equation (
10), based on the temperature driving force effect.
where
is the observer gain,
is the juice temperature,
is the saturation temperature for pure water, and
is the boiling point elevation. This term represents the temperature difference between the juice and the superheated vapor generated during evaporation.
3.5. Barometric Condenser
The barometric condenser plays an important role in the process, removing vapor from tank 4 and generating the low pressure values that promote evaporation and fluid flowing. Mass balances and energy balances are written for this system and allow for determination of the steam that is removed from the system. Equations were written under the hypothesis that steam is mixed with cooling water, increasing the stream temperature from
to
, while the vapor condensates to subcooled liquid conditions.
where
corresponds to the flow of steam that is removed from tank 4 to the barometric condenser,
and
the specific weight and heat capacity of water, respectively.
and
are the input and output temperatures of cooling water, respectively.
The temperature of the output stream is not measured, so that a reference value that is expected for normal operations must be set to satisfy the balances. A state observer was used once more to estimate the water flow rates, based on the difference between measured pressure and the respective reference value.
3.6. Infrastructure and Data Acquisition
The proposed digital twin framework can be installed in standard personal or process computers available in the plant network. The current application is connected to the available PI Server to acquire measured data from the process and store calculated results in a local data base. Selected variables are returned to the PI Server and displayed in real time with help of the graphical interface that can be accessed by logged users. The raw data taken from the process and provided by the PI server are initially filtered with a moving average filter before running the model. This procedure removes unexpected measurement variations and improve the reliability of the proposed numerical solution.
3.7. Model Parameters
As the use of proposed digital twin is not restricted to simulation mode, some observers were introduced to capture the variations of unmeasured process information, allowing for real time correction of the simulation results. Adjustable parameters included the size of the sampling windows used for computation of moving averages and the state observer gains. The main effects of these numerical parameters can be described as follows:
Size of sampling windows
This parameter controls the variability of the measured input data.
Observer gain of generated vapor ()
This parameter controls the correction of vapor generation due to evaporation.
Observer gain of global heat transfer coefficient ()
It controls the correction of U, which affects the heat promoting evaporation.
Observer gain of calandria feed steam ()
This parameter controls the steam feed flow rate to each calandria, which affects vapor equilibrium inside the tank and the balance of vapor.
Observer gain of juice flow between evaporators ()
This parameter controls the flow rate of juice that leaves the evaporator, which affects the level of the tanks.
Observer gain of barometric condenser cooling water ()
This parameter controls the flow rate of water that feeds the barometric condenser, which affects the pressure in tank 4.
4. Results
This section presents results and procedures used for model tuning. Validation was performed with actual industrial data obtained at different periods of time. The performance of the validated model during transient operations is also discussed, and its ability for identifying sensor miscalibration is illustrated.
4.1. Model Tuning and Validation
The proposed system of ordinary differential equations was solved with a suitable numerical method and some model parameters were adjusted in order to fit the simulation results to plant behavior. As the use of the digital twin is not restricted to simulation mode, some observers were introduced to capture unmeasured process information, as described previously.
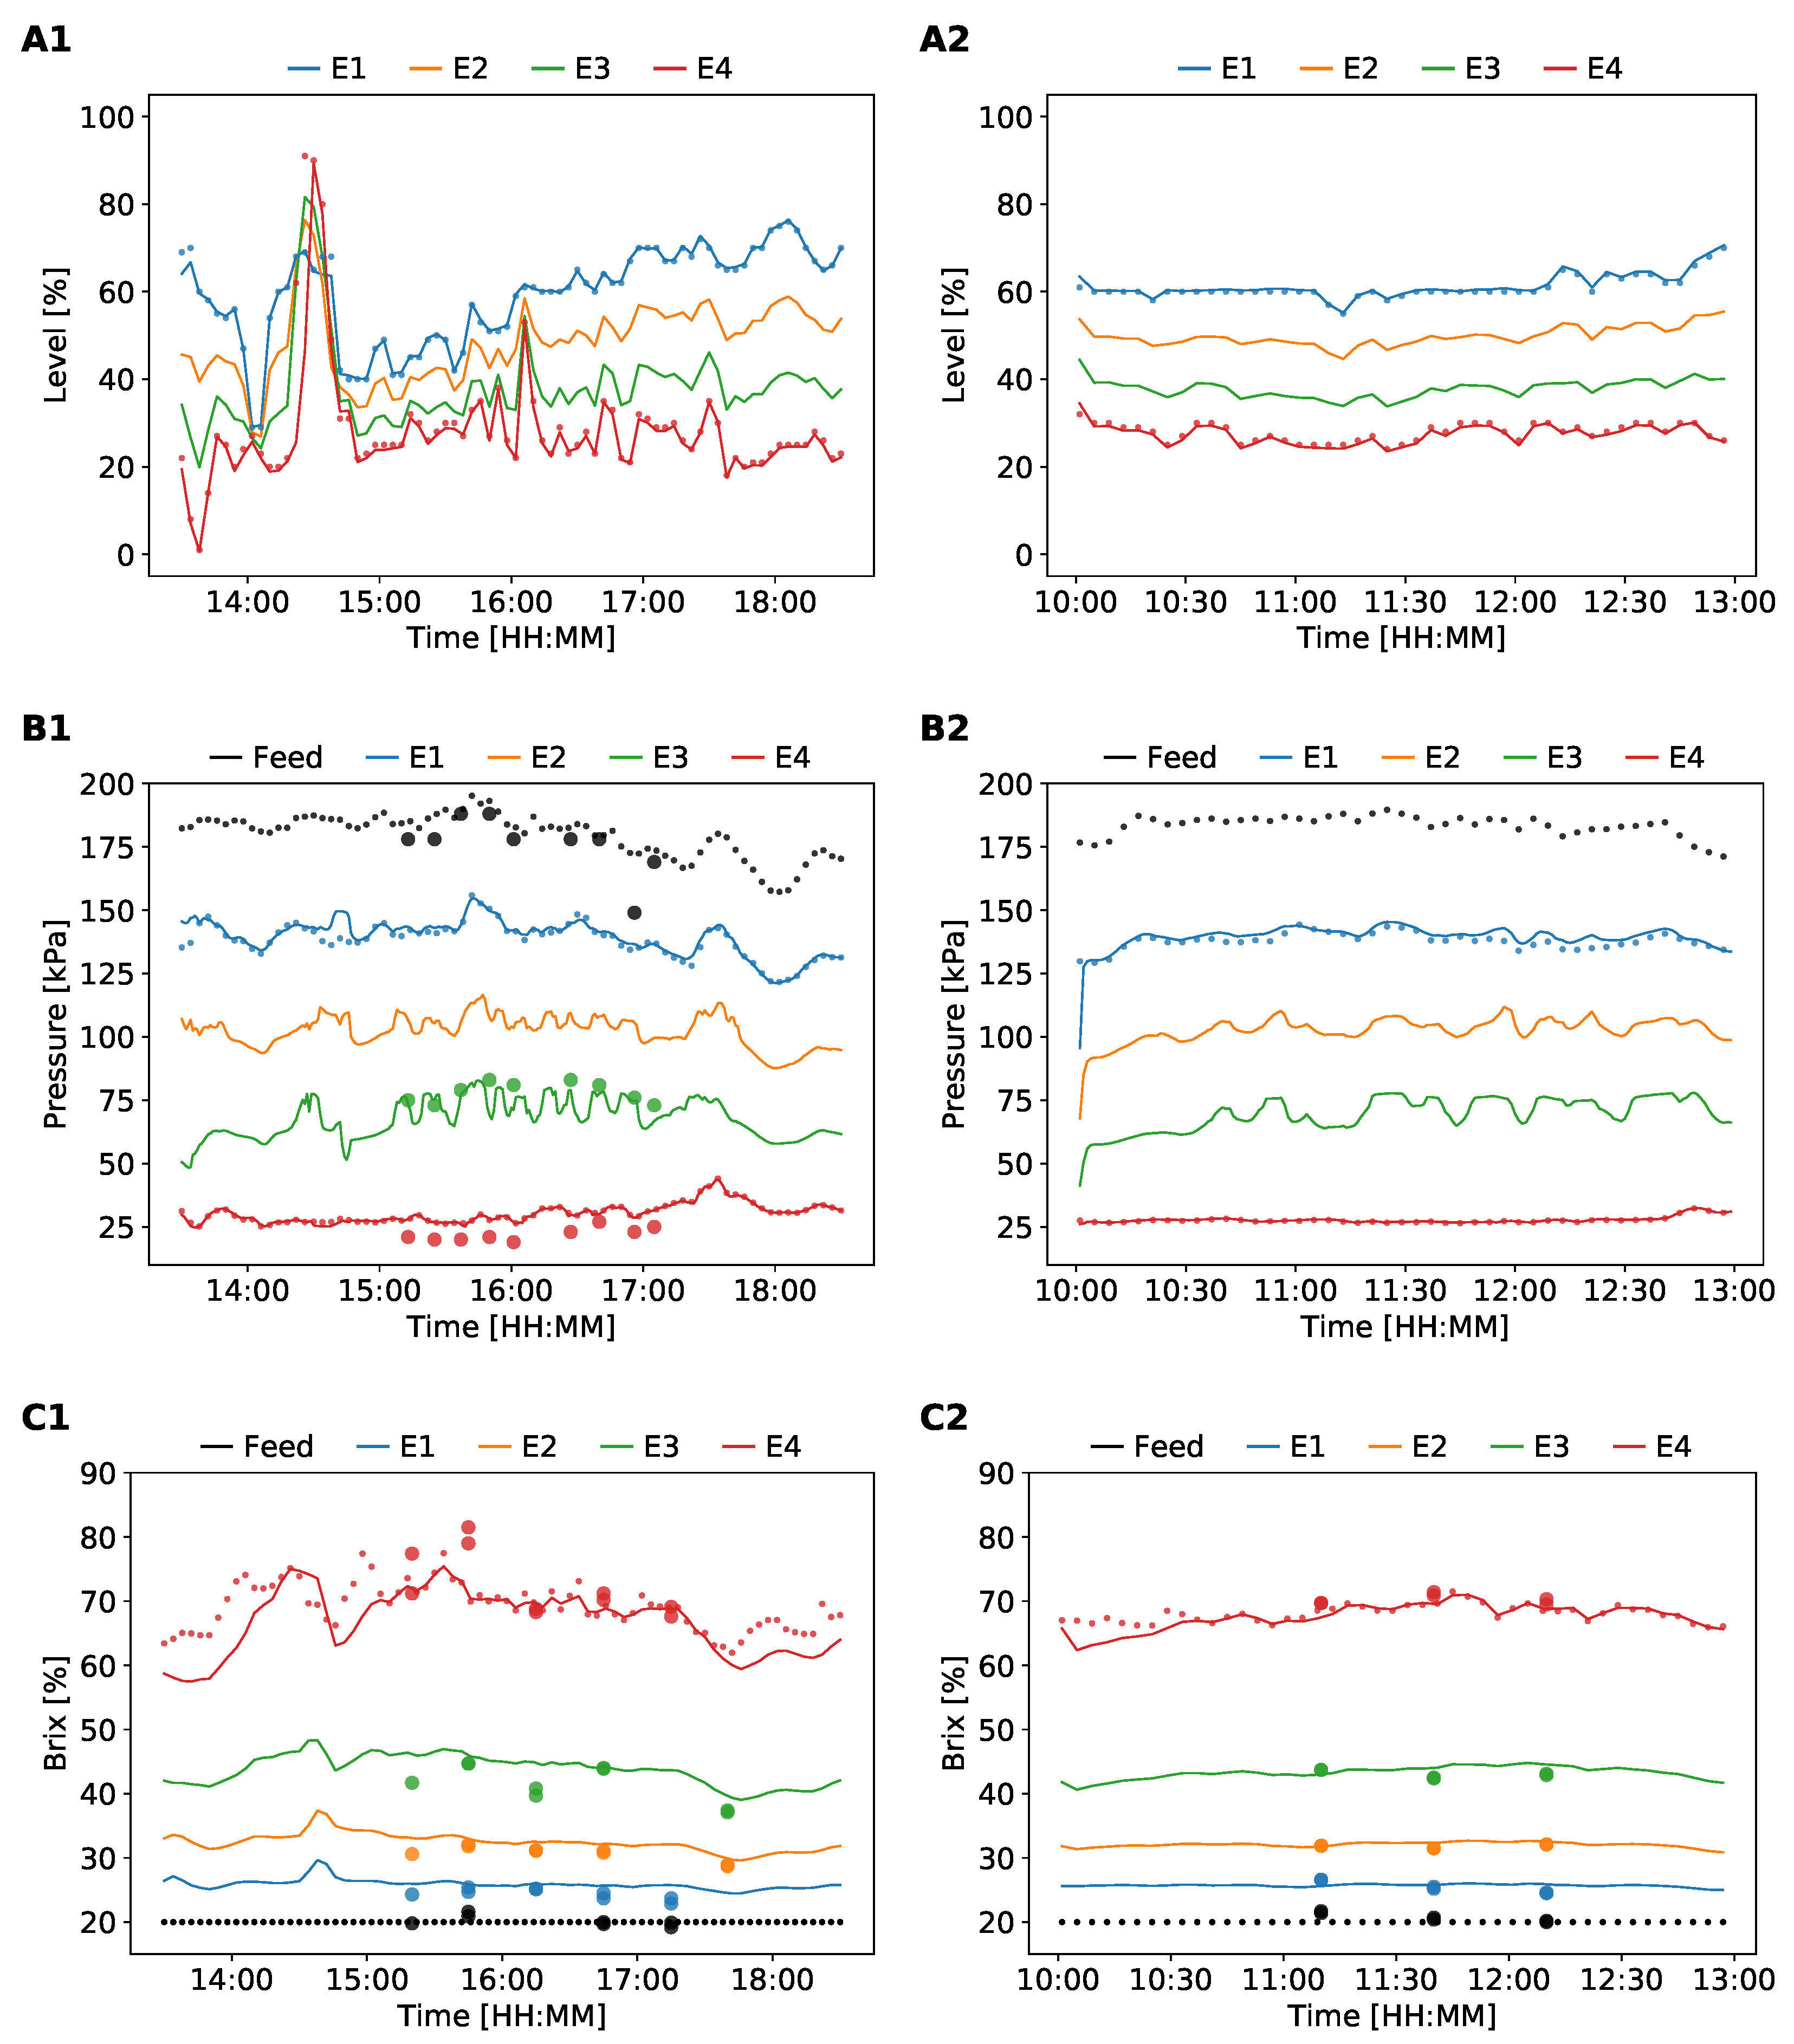
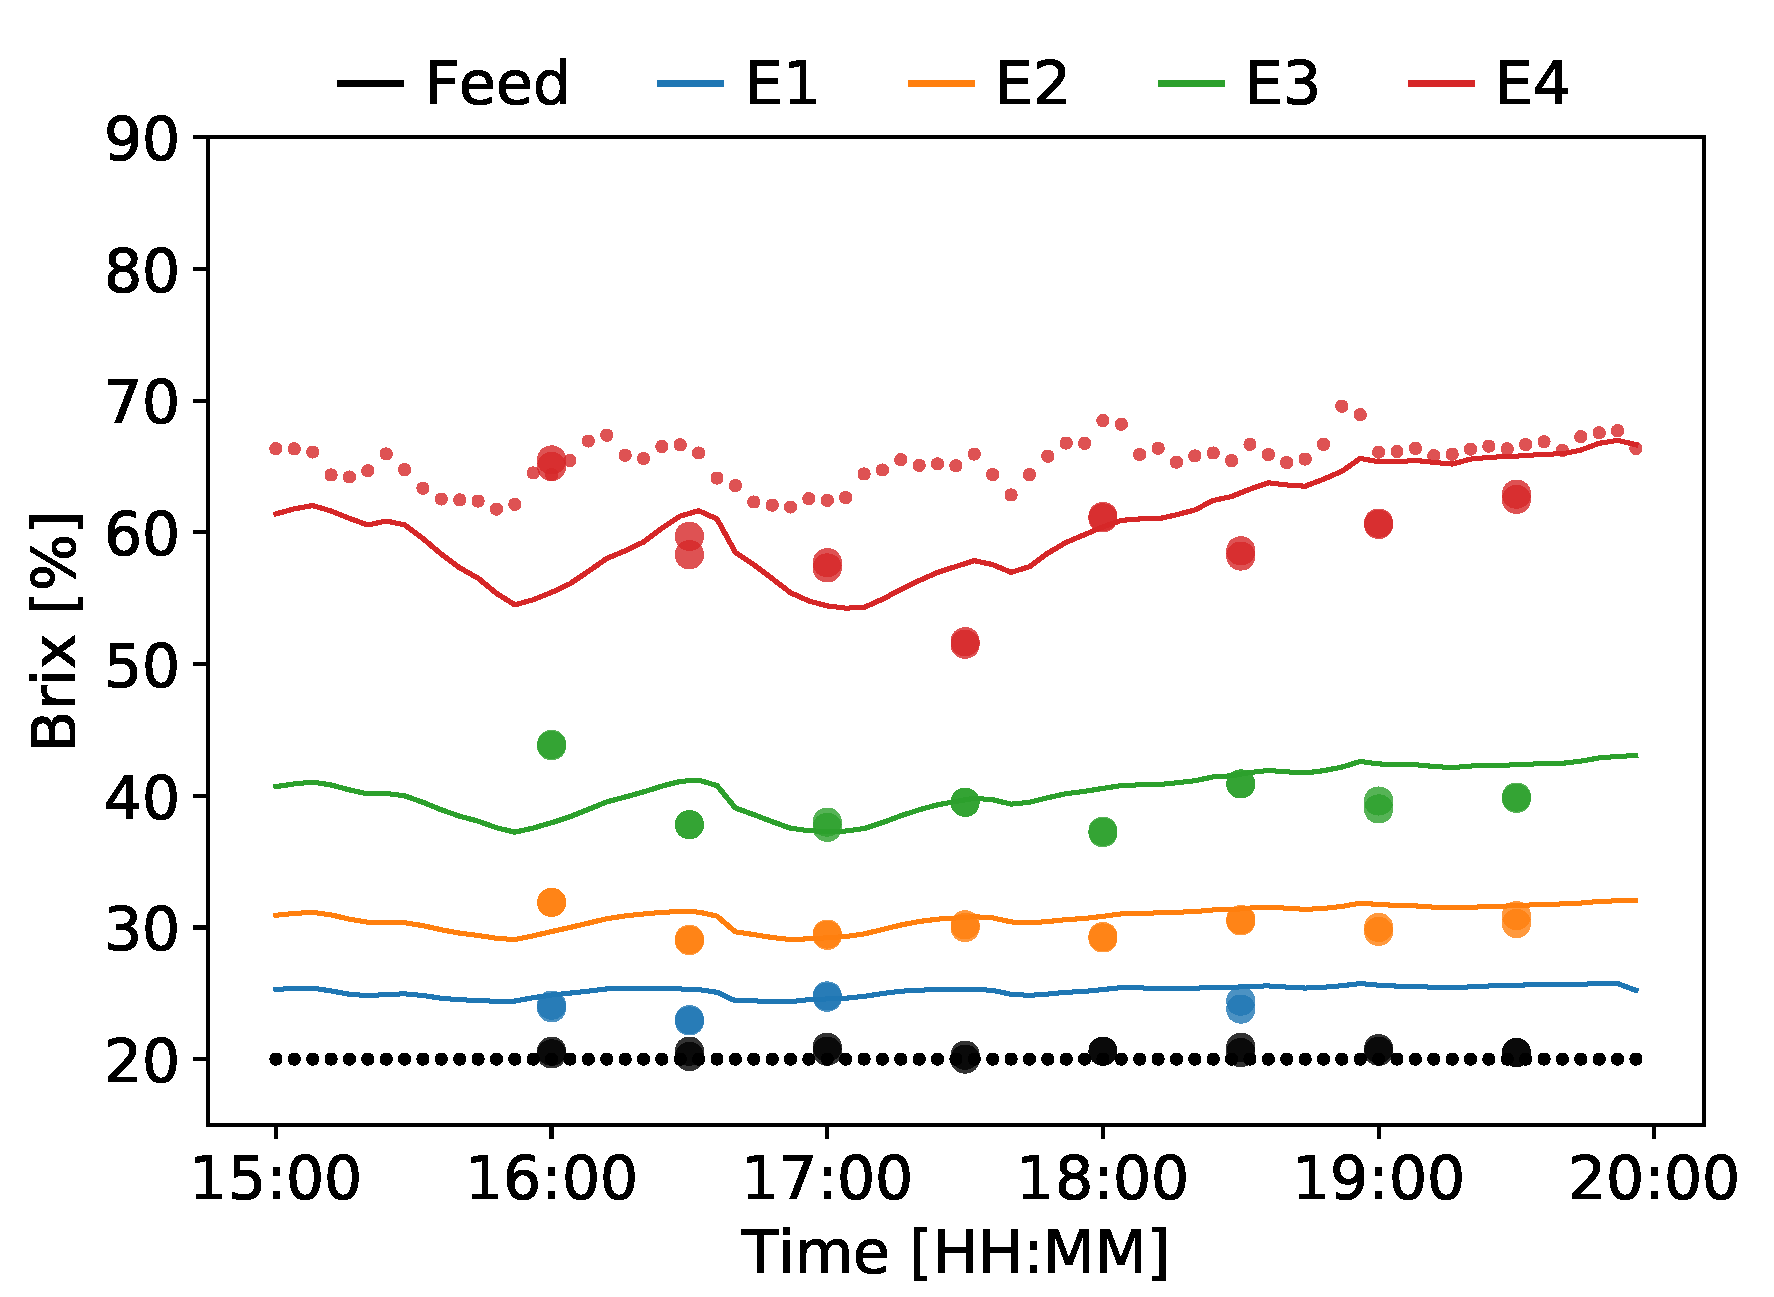
Two sets of real industrial data, corresponding to two consecutive days of plant operation, were selected for illustration of model tuning and validation procedures. In both cases, juice samples were collected from each tank and the respective sugar contents were measured using a digital refractometer. The sensor accuracy was tested for synthetic samples with different brix levels and very small errors (<1%) were observed. For this reason, error bars were omitted from the plots. The information of the brix profile in the evaporation train is very important to validate material balances. In parallel to brix sampling, pressure data were collected from available field sensors. All parameters were adjusted through empirical inspection, without using numerical solvers for minimization of objective functions that evaluate differences between calculated and observed values, due to the high computational costs of using these minimization procedures at plant site, which can lead to infeasible real time applications. In spite of that, very good results could be obtained, as summarized in
Figure 4, where the left side is related to the tuning phase, and the right side corresponds to the monitoring performance after model adjustments.
In spite of the level instability during the first two hours of operation as observed in
Figure 4(A1), the digital twin followed the process satisfactorily. That fluctuation was caused by an operational procedure to handle disturbances in the steam feed flow supply. The obtained results illustrate the good numerical stability of the proposed numerical implementation even in transient periods. The measurements available for tanks 1 and 4 support the calculations of the intermediate tanks of the train and, consequently, play key roles for the solution of material balances. Similarly, pressure predictions were very close to available process data (
Figure 4(B1)). Additional measurements obtained from analog manometers presented low quality due to calibration problems. As one can see, analog pressures from tank 4 (big red dots) were a little biased in comparison with the values measured by the online sensor (small red dots). In the absence of another reference, efforts were made to minimize the distance between model and available data for tank 3. A smooth behavior of the pressure in tank 3 could not be achieved due to thermodynamic and fluid dynamic constraints, but without exerting significant effect on the overall monitoring performance. The most important result regards the good agreement achieved between calculated and measured brix values, which clearly shows that the digital twin captures relevant information about the material balances throughout the evaporation train (
Figure 4(C1)). For this reason, in the absence of online measurements, the digital twin predictions may help the operation in several applications, including operator training and monitoring of evaporation performance indicators.
The evaluation of process monitoring carried out by the digital twin was performed online during the plant operation on the day after model tuning. Results are shown in
Figure 4 (right), where the accurate performance and appropriate synchronization with the plant operation can be seen. The most important result regards again the adequate fitting of available brix measurements, which makes possible the improved understanding of the material balances of the entire train (
Figure 4(C2)). In this test, analogical pressures were omitted to avoid doubtful comparisons due to the unreliable calibration of these sensors.
It is important to observe that the proposed digital twin provides tens of variables that are very difficult to measure. These additional variables can be monitored virtually and combined to generate additional Key Performance Indicators—KPIs for the plant. Some examples that can be proposed to integrate distinct operational routines are:
Evaporation rate
This KPI brings information about the real rates of water evaporation at each evaporator of the train, considering the effective area (instead of the total available area) of heat exchange, and can be used for optimization of steam generation and cleaning routines of internal heat exchange surfaces.
Produced steam/Consumed steam
This KPI brings information about the efficiency of energy usage. Low values can indicate the excess of feed steam (which can then be reduced) or poor evaporation efficiency (which must then be increased, through maximization of heat transfer areas, for instance).
Bled steam/Produced steam
This KPI brings information about the relative bleeding, when compared to the total steam produced in the process. This KPI can be related to the efficiency of water and energy usage in the plant.
Concentrated juice flow/Juice feed flow
This KPI brings information about the evaporation efficiencies in each vessel of the train, indicating the opportunities for improvement of the evaporation efficiencies and manipulation of feed flow rates.
4.2. Performance of the Digital Twin in Transient Operations
Real time monitoring of chemical processes demands numerical stability to handle process variabilities, including process start-up and shutdown. These operational procedures may occur frequently when the production planning focuses on ethanol production. In these cases, sugar production can be reduced significantly, as the demand for concentrated juice, leading to shutdown of some vessels of the evaporation train or shutdown of evaporation trains (when multiple evaporation trains are available at plant site). As shown in
Figure 5, the proposed digital twin is able to identify both start-up and shutdown procedures and to mimic the plant behavior in terms of juice flow rates, steam flow rates, cooling water flow rates and calandria pressures.
In
Figure 5, the operation of the evaporation train was interrupted between 21:00 and 22:00 and restarted around 22:30. The results provided by the digital twin during the idling period must be neglected. After restarting the operation, numerical solution converged quickly to fit the plant. At 2:30, a new plant shutdown occurred, followed by a new plant startup one hour later. This procedure was repeated around 4:20 and 6:00. One must observe that the flows converged to zero, that levels converged to values between 20–40%, and that pressures converged to atmospheric conditions after shutdowns, indicating the appropriate performance of the numerical tool.
4.3. Identification of Sensor Miscalibration
Other important feature provided by the proposed digital twin is the ability to indicate calibration problems in sensors. Many sensors present some sensibility to operational conditions and often may fail. During a second validation period (
Figure 6), in which new juice samples were collected, an interesting behavior was observed. Excluding the first manual sampling, one can see that model brix predictions consistently deviated from online sensor values over a period of two hours. In spite of that, juice samples presented concentration values that were in accordance with the model predictions, leading one to believe that the digital twin had neglected the measurements to close the material balances. As the online brix sensor demands periodic cleaning and calibration, the observed behavior probably indicates sensor miscalibration. Therefore, the digital twin can also be used to provide information about maintenance demands of process equipment and sensors in the plant.
5. Conclusions
A digital twin for a multi-effect evaporation unit was developed and implemented in a real industrial plant for the first time. Using a dynamic model, the application was shown to be suitable to handle plant fluctuations, including plant start-up and shutdown. Online measurements from the plant were transferred to the model in real time through direct communication with the PI Server of the plant. Tuning and validation were carried out at different periods of time using juice brix samples and analog pressures as quality indicators. The procedure provided good fits between the model and the process data. Similarly, good results were obtained during transient operations, where the digital twin remained stable operation after a sequence of process disturbances. In addition, information about the quality of sensor calibrations could be obtained through comparisons of calculated and observed plant values, which can contribute to maintenance management. Other important feature is the possibility to monitor customized KPIs, designed specifically to meet the company interests. Finally, the obtained results indicate the successful application of the proposed digital twin, which operates with simple real automation infrastructure and does not require significant capital expenditures for implementation, providing important process predictions and expanding the process monitoring capabilities to improve operational performance.
A digital twin for a multi-effect evaporation unit was developed and implemented in a real plant. Using a dynamic model, the application is suitable to handle plant fluctuations such as start-up and shutdown. Online measurements from the plant were parsed to the model in real time through a direct communication with PI Server. Tuning and validation were carried out at different periods of time using juice brix samples and analog pressures as quality indicators. The procedure have shown good fit between the model and process data. On the same way, good results were obtained during transient operation, where the digital twin keeps stable after a sequence of hard process disturbances. In addition, information about sensor calibration may contribute to maintenance management, but new studies are necessary to ensure its real accuracy. Other important feature is the possibility to monitor custom KPIs, designed specifically to meet the company interests. Finally, results indicate a successful application of the proposed digital twin, which operates under existent automation infrastructure and does not require capital expenditures for implementation, providing important process predictions and expanding the process monitoring capacities to improve operational performance.
Author Contributions
Conceptualization, T.F. and J.C.P.; methodology, M.M.C., T.F. and J.C.P.; software, M.M.C. and T.F.; validation, R.M.S., M.M.C. and T.F.; formal analysis, R.M.S., M.M.C. and T.F.; investigation, R.M.S. and M.M.C.; resources, J.C.P. and São Martinho S.A.; data curation, R.M.S., M.M.C. and T.F.; writing—original draft preparation, R.M.S.; writing—review and editing, R.M.S., M.M.C., T.F. and J.C.P.; visualization, R.M.S.; supervision, J.C.P. and T.F.; project administration, J.C.P. and T.F.; funding acquisition, J.C.P.
Funding
This study was partially funded by Coordenação de Aperfeiçoamento de Pessoal de Nível Superior—Brasil (CAPES)—Finance Code 001 and by Conselho Nacional de Desenvolvimento Científico e Tecnológico (CNPq).
Acknowledgments
The authors acknowledge financial support provided by CAPES and CNPQ and technical collaboration of São Martinho S.A. for supporting this work and encouraging digital transformation.
Conflicts of Interest
The funders had no role in the design of the study; in the collection, analyses, or interpretation of data; in the writing of the manuscript, or in the decision to publish the results.
Nomenclature
| A | Area of heat exchange (wet) | |
| F | Flow | |
| H | Enthalpy | |
| K | Observer gain | |
| L | Level | % |
| M | Mass of juice | |
| P | Pressure | |
| Q | Heat flow | |
| T | Temperature | |
| V | Volume of liquid | |
| X | Concentration of soluble solids | % |
| Purity | fraction |
| U | Global heat transfer coefficient | |
| a | Cross section area of the piping | |
| c | Specific heat | |
| Valve constant | |
| h | Height | |
| r | Flow ratio | fraction |
| v | Average velocity | |
| | | |
| Greek symbols |
| Specific weight | |
| | | |
| Subscripts |
| boiling point elevation | |
| b | bleed | |
| c | calandria | |
| condensate | |
| cooling water | |
| input | |
| j | juice | |
| s | steam | |
| saturation | |
| setpoint | |
| sugar | |
| v | vapor | |
| w | water | |
References
- Balkan, F.; Colak, N.; Hepbasli, A. Performance evaluation of a triple-effect evaporator with forward feed using exergy analysis. Int. J. Energy Res. 2005, 29, 455–470. [Google Scholar] [CrossRef]
- Jyoti, G.; Khanam, S. Simulation of heat integrated multiple effect evaporator system. Int. J. Therm. Sci. 2014, 76, 110–117. [Google Scholar] [CrossRef]
- Chantasiriwan, S. Optimum surface area distribution in co-current multiple-effect evaporator. J. Food Eng. 2015, 161, 48–54. [Google Scholar] [CrossRef]
- Bhargava, R.; Khanam, S.; Mohanty, B.; Ray, A.K. Mathematical model for a multiple effect evaporator system with condensate- , feed- and product- flash and steam splitting. Indian J. Chem. Technol. 2008, 15, 118–129. [Google Scholar]
- Bhargava, R.; Khanam, S.; Mohanty, B.; Ray, A.K. Selection of optimal feed flow sequence for a multiple effect evaporator system. Comput. Chem. Eng. 2008, 32, 2203–2216. [Google Scholar] [CrossRef]
- Srivastava, D.; Mohanty, B.; Bhargava, R. Modeling and simulation of MEE system used in the sugar industry. Chem. Eng. Commun. 2013, 200, 1089–1101. [Google Scholar] [CrossRef]
- Xie, S.; Yang, C.; Wang, X.; Xie, Y. Data reconciliation strategy with time registration for the evaporation process in alumina production. Can. J. Chem. Eng. 2017, 96, 189–204. [Google Scholar] [CrossRef]
- Miranda, V.; Simpson, R. Modelling and simulation of an industrial multiple effect evaporator: Tomato concentrate. J. Food Eng. 2005, 66, 203–210. [Google Scholar] [CrossRef]
- Kumar, D.; Kumar, V.; Singh, V.P. Modeling and dynamic simulation of mixed feed multi-effect evaporators in paper industry. Appl. Math. Model. 2013, 37, 384–397. [Google Scholar] [CrossRef][Green Version]
- Bojnourd, F.M.; Fanaei, M.A.; Zohreie, H. Mathematical modelling and dynamic simulation of multi-effect falling-film evaporator for milk powder production. Math. Comput. Model. Dyn. Syst. 2014, 21, 336–358. [Google Scholar] [CrossRef]
- Ben-ali, S. Modeling of a double effect evaporator: Bond graph. Chem. Eng. Res. Des. 2018, 138, 554–567. [Google Scholar] [CrossRef]
- Merino, A.; Acebes, L.F.; Alves, R.; de Prada, C. Real Time Optimization for steam management in an evaporation section. Control Eng. Pract. 2018, 79, 91–104. [Google Scholar] [CrossRef]
- Câmara, M.M.; Quelhas, A.D.; Pinto, J.C. Performance Evaluation of Real Industrial RTO Systems. Processes 2016, 4, 44. [Google Scholar] [CrossRef]
- Ge, Z. Review on data-driven modeling and monitoring for plant-wide industrial processes. Chemom. Intell. Lab. Syst. 2017, 171, 16–25. [Google Scholar] [CrossRef]
- Venkatasubramanian, V. The promise of artificial intelligence in chemical engineering: Is it here, finally? AIChE J. 2019, 65, 466–478. [Google Scholar] [CrossRef]
- Berutti, M. Understanding the Digital Twin. 2019. Available online: https://www.chemengonline.com/understanding-the-digital-twin (accessed on 15 June 2019).
- Tsay, C.; Pattison, R.C.; Piana, M.R.; Baldea, M. A survey of optimal process design capabilities and practices in the chemical and petrochemical industries. Comput. Chem. Eng. 2018, 112, 180–189. [Google Scholar] [CrossRef]
- Rosen, R.; von Wichert, G.; Lo, G.; Bettenhausen, K.D. About the importance of autonomy and digital twins for the future of manufacturing. IFAC-PapersOnLine 2015, 48, 567–572. [Google Scholar] [CrossRef]
- Boschert, S.; Rosen, R. Digital Twin: The simulation aspect. In Mechatronic Futures; Springer International Publishing: Basel, Switzerland, 2016; pp. 59–74. [Google Scholar]
- Rein, P. Cane Sugar Engineering; Verlag Dr. Albert Bartens KG: Berlin, Germany, 2016. [Google Scholar]
- Saska, M. Boiling point elevation of technical sugarcane solutions and its use in automatic pan boiling. Int. Sugar J. 2002, 104, 500–507. [Google Scholar]
- Llano-Restrepo, M. Modeling and Simulation of Vertical Continuous Cooling Crystallizers for the Sugar Industry. Ind. Eng. Chem. Res. 2005, 44, 9244–9263. [Google Scholar] [CrossRef]
- Hugot, E. Handbook of Cane Sugar Engineering; Elsevier: Amsterdam, The Netherlands, 1986. [Google Scholar]
- Smith, J.M.; van Ness, H.C.; Abbott, M.M. Introduction to Chemical Engineering Thermodynamic; McGraw Hill: New York, NY, USA, 2001. [Google Scholar]
© 2019 by the authors. Licensee MDPI, Basel, Switzerland. This article is an open access article distributed under the terms and conditions of the Creative Commons Attribution (CC BY) license (http://creativecommons.org/licenses/by/4.0/).


