Article

A Scenario-Based Optimization Model for Planning Sustainable Water-Resources Process Management under Uncertainty

1
Henan Water & Power Engineering Consulting Co., Ltd., Zhengzhou 450016, China
2
School of Water Conservancy & Environment, Zhengzhou University, Zhengzhou 450001, China
3
Zhengzhou Key Laboratory of Water Resource and Environment, Zhengzhou 450001, China
*
Authors to whom correspondence should be addressed.
Processes 2019, 7(5), 312; https://doi.org/10.3390/pr7050312
Submission received: 4 April 2019 / Revised: 14 May 2019 / Accepted: 20 May 2019 / Published: 24 May 2019
(This article belongs to the Special Issue Energy, Economic and Environment for Industrial Production Processes)

Abstract

:
Discrepancies between water demand and supply are intensifying and creating a need for sustainable water resource process management associated with rapid economic development, population growth, and urban expansion. In this study, a scenario-based interval fuzzy-credibility constrained programming (SIFCP) method is developed for planning a water resource management system (WRMS) that can handle uncertain information by using interval values, fuzzy sets, and scenario analysis. The SIFCP-WRMS model is then applied to plan the middle route of the South-to-North Water Diversion Project (SNWDP) in Henan Province, China. Solutions of different water distribution proportion scenarios and varied credibility levels are considered. Results reveal that different water-distribution proportion scenarios and uncertainties used in the SIFCP-WRMS model can lead to changed water allocations, sewage discharges, chemical oxygen demand (COD) emissions, and system benefits. Results also indicate that the variation of scenarios (i.e., from S2 to S3) can result in a change of 9% over the planning horizon for water allocation in the industrial sector. Findings can help decision-makers resolve conflicts among economic objective, water resource demand, and sewage discharge, as well as COD emissions.

1. Introduction

1.1. Motivation

A safe and reliable water supply is a basic condition for human settlements, standard of living, economic growth and ecological environment improvement. Global water resource issues are becoming increasingly serious owing to rapid economic development, population growth, and urban expansion [1]. Disparities between increased demand and limited water supply are, thus, intensifying and putting great pressure on sustainable water resource management [2,3]. When water shortages occur, residents’ living standards, economic development, and the ecological environment may be affected [4,5]. Any individual water-related activity may affect processes within a water resource system [6,7]. These issues have forced decision-makers to take great efforts to improve water resource utilization efficiency and alleviate the pressure on the water supply, such as the Global Water Partnership (GWP), International Hydrological Programme (IHP), and International Water Resources Association (IWRA), as well as the Water Diversion Project (WDP) [8]. The WDP is indispensable in relieving excessive pressure on water resources and promoting the sustainable increase of the local economy and has been widely used in China for projects that include the South-to-North Water Diversion Project (SNWDP) [9,10]. However, the water resource management system (WRMS) is a large, complex, dynamic, and nonlinear system that involves multiple water-receiving areas and multiple water users [11,12]. Each water-receiving area includes diverse elements from hydrogeological, economic, social, and environmental aspects. Any water user (e.g., agricultural, industrial, domestic, and ecological) in each water-receiving area has different water resource requirements and competes for resources in every planning period [13]. Therefore, effective system analysis methods are desired for planning WRMS and raising water utilization efficiency corresponding to such complexities and uncertainties.

1.2. Literature Review

Previously, many works were introduced for planning WRMS problems, such as linear programming, dynamic programming, and artificial intelligence-based algorithms (abbreviated as LP, DP, and AI, respectively) [14,15,16,17,18]. For example, Castelletti et al. [14] proposed artificial neural networks (ANNs) for addressing the dynamic problems of the reservoir network’s management problems in a real-world case study of the River Piave. Bi et al. [15] utilized genetic algorithms (GAs) for optimizing water distribution systems, in which the efficiency of GAs was increased by using heuristic domain knowledge in the sampling of the initial population. Veintimilla-Reyes et al. [16] employed a mixed integer linear programming (MILP) approach to distribute water resources under different temporal and spatial variations. Abdulbaki et al. [17] presented an integer linear programming (ILP) model to optimize the allocation of water resources, in which conventional water treatment costs, wastewater costs, desalination costs, and pumping and transportation costs were represented with an integer variable. Robert et al. [18] introduced a DP approach that embedded different year and season decision stages to optimize an irrigation water system. Generally, the above studies mainly focused on dealing with WRMS problems when their system components were deterministic. However, some coefficients are not deterministic because of various uncertainties existing in WRMS, such as the randomness of available water (e.g., stream flow, precipitation, and climate change), the imprecision in modeling parameters (e.g., uncertainty of data acquisition and data utilization), and the fuzziness of system objectives and constraints [19,20,21,22]. Therefore, robust optimization techniques are indispensable for planning WRMS problems in response to the associated complexities and uncertainties.
Over the past decades, research has focused on WRMS for handling complexities and uncertainties such as interval-parameters programming (IPP), fuzzy programming (FP), and scenario analysis (SA) methods [23,24,25,26,27,28]. For instance, Maqsood et al. [23] used an IPP method for planning WRMS, in which agricultural and industrial water demands presented as interval numbers were solved. Safavi et al. [25] analyzed various water demand-supply scenarios in the Zayandehrud River basin in Iran using an existing and calibrated model. Autovino et al. [26] presented a SA approach to optimize the irrigation scheme for orchards by testing various irrigation water amounts and systems. Zhang et al. [28] introduced a fuzzy-confidence constraint programming method to evaluate various monthly inflows and rainfall amounts and optimize crop water resources.

1.3. Research Gap

Generally, the IPP approach proposed by Maqsood et al. [23] can deal with inconclusive coefficients that are presented as interval numbers, while it can hardly reflect the subjective attitudes toward the decision-makers owing to unknown membership distribution functions [29]. The FP method formulated by Zhang et al. [28] can effectively address precise parameters using fuzzy sets; however, it is incapable of handling different scenarios [30]. SA proposed by Safavi et al. [25] and Autovino et al. [26] can handle uncertainties using various modeled scenarios, while many scenarios are required for accurate modeling of any uncertainty [27,31]. Moreover, in practical WRMS planning issues, some parameters, such as water resource demand for each water user, are based on the experts’ and stakeholders’ subjective inference, and the predicted results may be changed by the meteorological, social, economic, and human conditions. These parameters may be presented as dual uncertainties, which results in a dilemma for the optimization approaches to solve such WRMS issues. Thus, robust optimization techniques are indispensable because they integrate the advantages of IPP, FP, and SA into one approach for jointly addressing the associated complexities and uncertainties in WRMS management problems.

1.4. Innovation and Organization

The purpose of this study is to develop a scenario-based interval fuzzy-credibility constrained programming (SIFCP) approach for multi-uncertainty reflection in the WRMS. SIFCP combines the advantages of fuzzy-credibility constrained programming (FCP), IPP, and SA into one framework. Compared to IPP, FCP, and SA, SIFCP can handle single uncertainties presented as interval, fuzzy, and modeled information, and cope with dual uncertainties presented as interval-fuzzy parameters or interval-scenarios. A SIFCP-WRMS model is formulated to plan the middle route of SNWDP in Henan Province, China. In SIFCP-WRMS, four scenarios with different water distribution proportions were considered for examining the variations of water resources allocation schemes. Summarily, SIFCP-WRMS model has advantages of: (a) reflecting dual uncertainties expressed as interval-fuzzy parameters and interval-scenarios; and (b) balancing adjustment of the conflict among system benefit, water resource demand-supply balance, and sewage discharge, as well as chemical oxygen demand (COD) emission. Results can provide decision support for achieving effective schemes of water resource allocation with a cost-efficient and uncertainty-averse manner.
The paper’s organization is as follows: Section 1 is the introductory section, which includes the study’s motivation, literature review, and research gap, as well as the innovation and contribution; Section 2 shows the whole process for formulating the SIFCP-WRMS model that consists of the two subsections (SIFCP method development and SIFCP-WRMS modelling formulation); Section 3 depicts the application of SIFCP-WRMS model into a real case of the middle route of the SNWDP in China, wherein three subsections, ‘Statement of problems’, ‘Data collection’, and ‘Result analysis’ are included; and, finally, Section 4 illustrates the conclusions and outlook of this study.

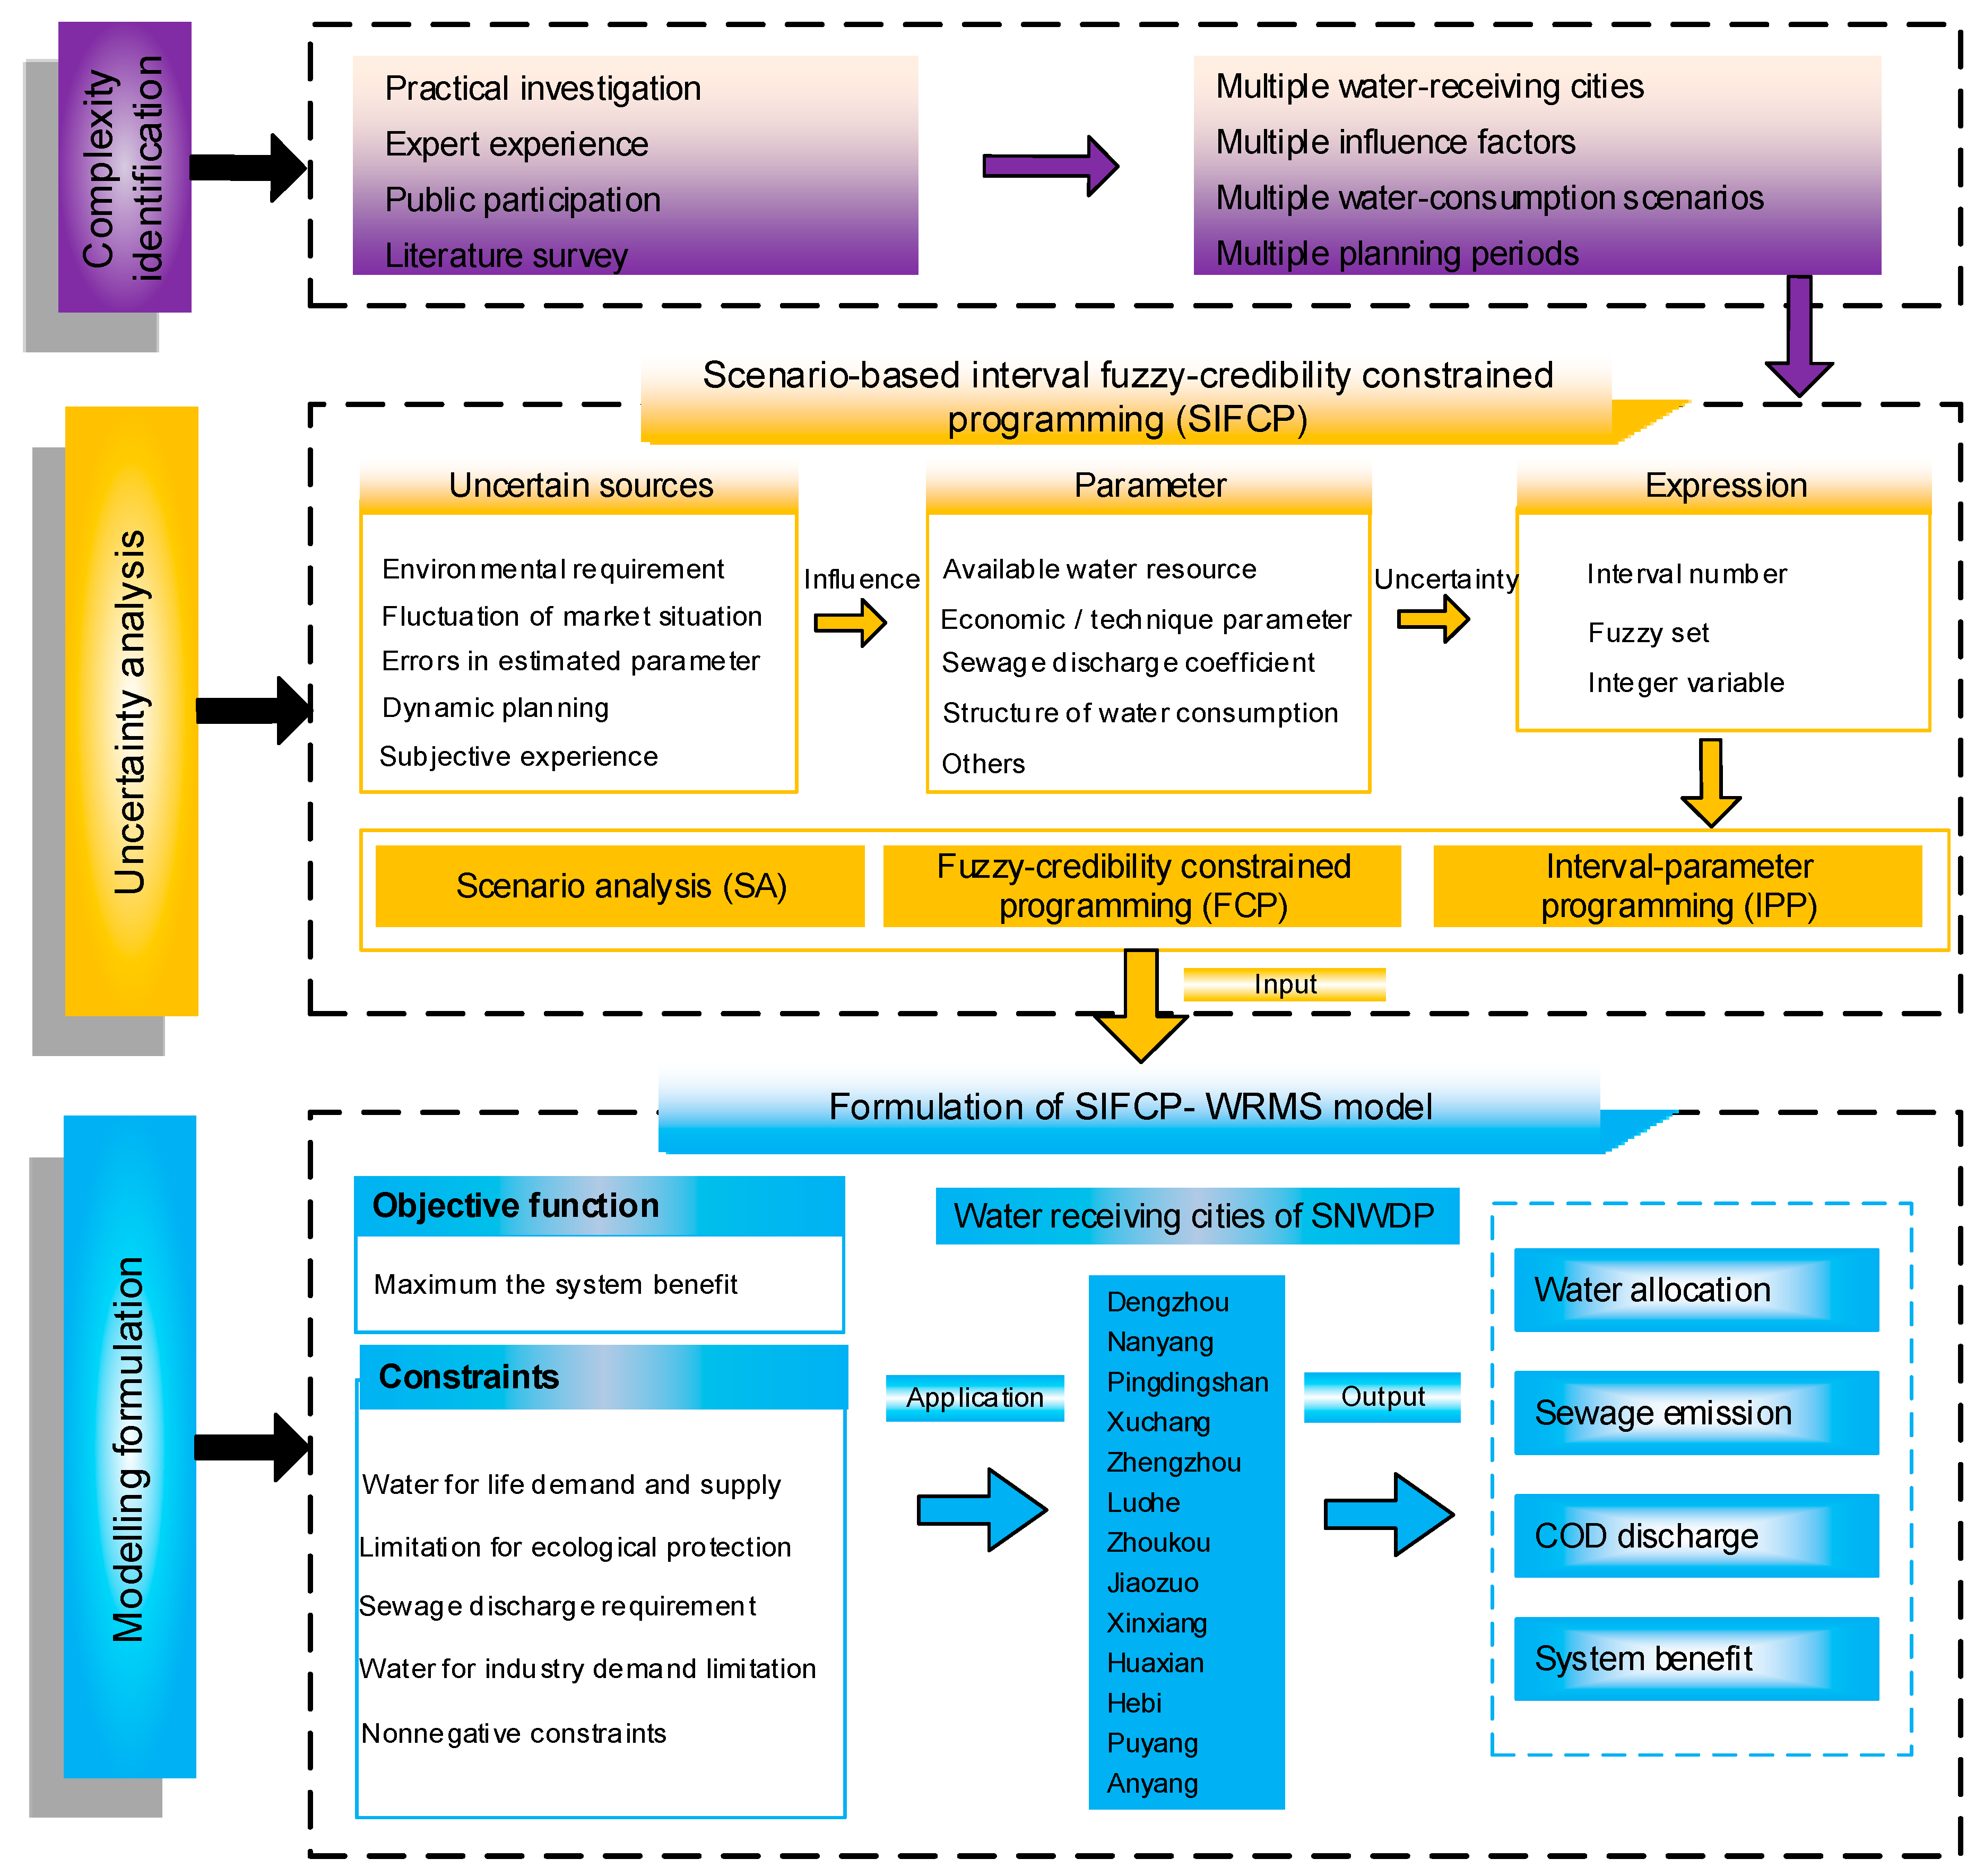
2. Development of SIFCP-WRMS Model

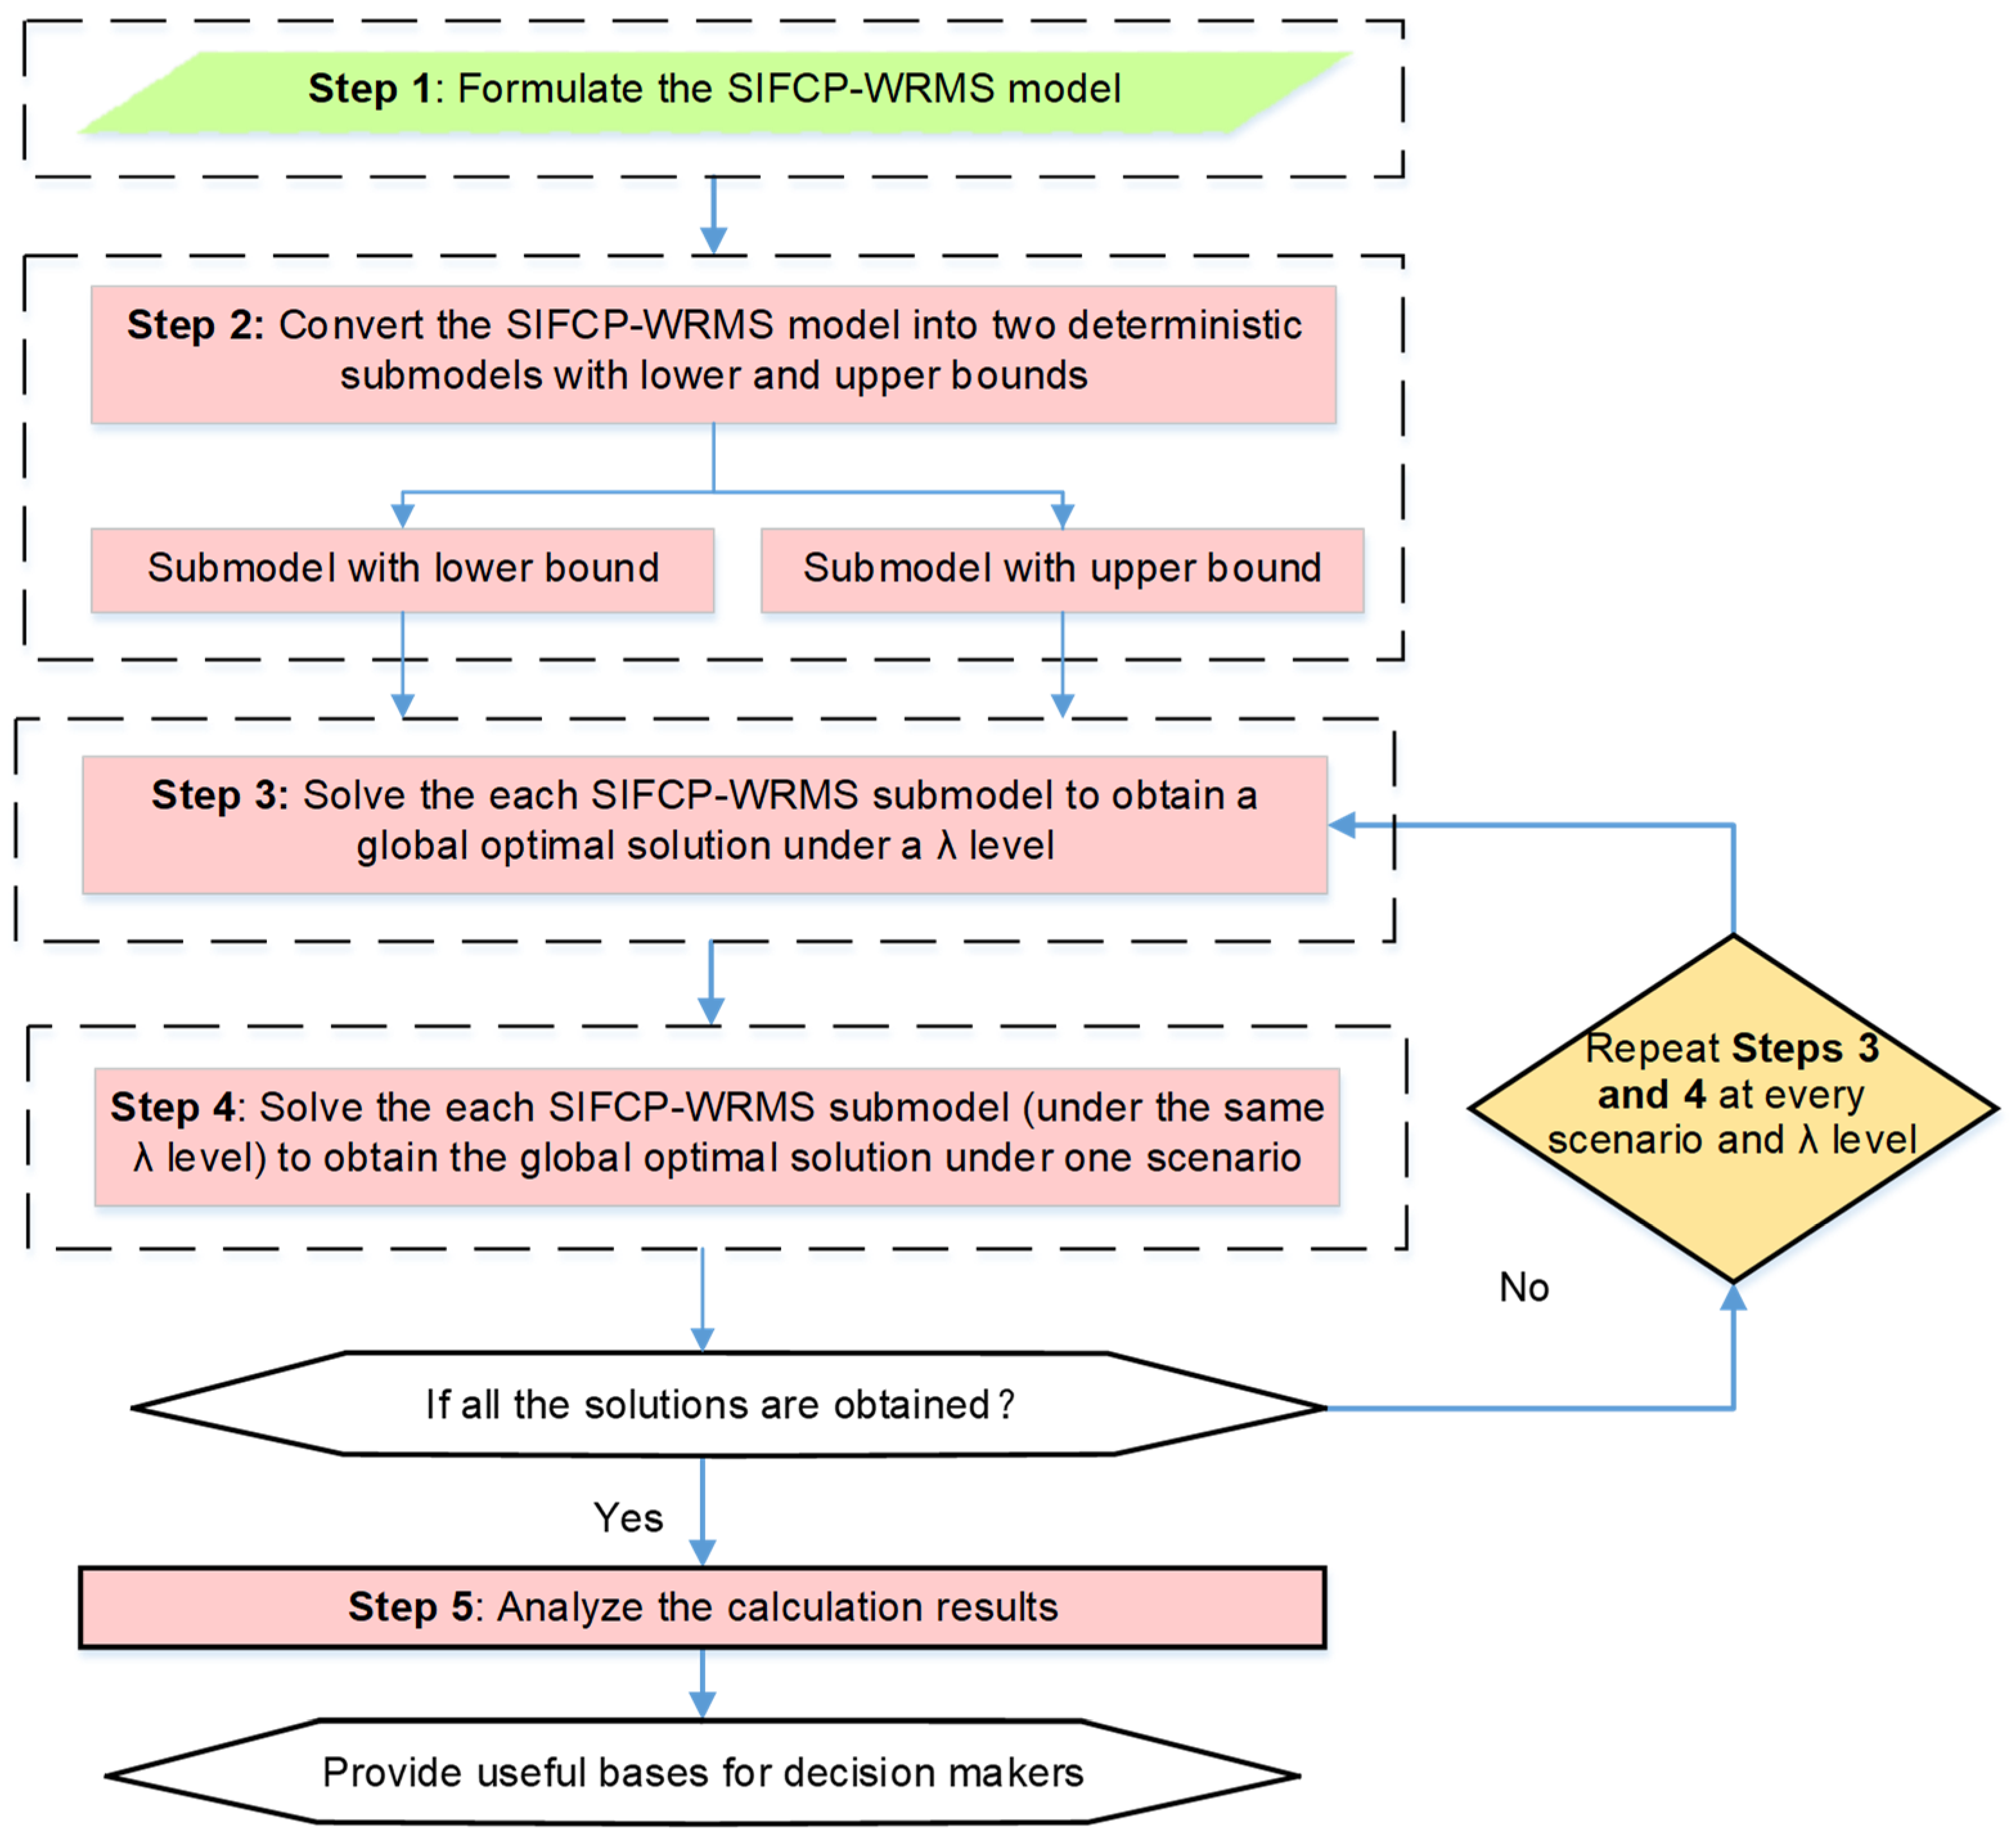
2.1. SIFCP Method Development

A decision-maker has a responsibility to allocate water resources within a maximum system benefit and a minimum sewage discharge in a long-term planning period [32]. In practical water resource management (WRM) problems, the water resources’ demand may be different from each sector in every period, and the proportion of each water-user sector may be previously unknown. Such uncertainties could bring about complexities in WRM related to the system satisfaction. FCP has advantages of reflecting tradeoffs between system performance and failure risk related to the credibility constraints (i.e., constraints of water resource demand in each water-user) through using fuzzy sets [33]. Additionally, various scenarios can also be modeled by the SA approach. Integrating SA into FCP, a general scenario-based fuzzy-credibility constrained programming (SFCP) model can be presented as:
Min E = j = 1 n c j x j
subject to:
C r { j = 1 n a i j x j b ˜ i } λ i , i = 1 , 2 , , m
x j 0 , j = 1 , 2 , , n
where x j are decision variables; c j and a i j are coefficients; and b ˜ i are right-hand side coefficients. C r is the credibility measure which was extensively used in many research fields [34,35,36]. Let ξ be a fuzzy variable with membership function u and let r be real numbers [32]. The credibility of r ξ is expressed by the followed fuzzy sets:
C r ( r ξ ) = { 1 if r t _ 2 t t _ r 2 × ( t t _ ) if t _ r t r t _ 2 × ( t t _ ) if t r t _ 0 if r t _
Let j = 1 n a i j ± x j ± = s i ± . Thus, Equation (1b) can be represented as:
C r { s i b ˜ i } λ i , i = 1 , 2 , , m
Normally, a significant credibility level should be greater than 0.5 [37]. Therefore, based on the definition of credibility, we have the following for each 1 u t i ˜ λ i 0.5 :
2 b i b _ i s i 2 × ( b i b _ i ) λ i
In practical WRM problems, some economic parameters are affected by the socio-economic, political, legislation, and technical factors, which can be difficult to achieve as modeled scenarios or fuzzy sets, but can be presented as interval values using the IPP technique [38]. Through introducing IPP into SFCP, a SIFCP model can be formulated as follows:
Min E ± = j = 1 n c j ± x j ±
subject to:
C r { j = 1 n a i j ± x j ± b ˜ i ± } λ i ± , i = 1 , 2 , , m
j = 1 n a i j ± x j ± b i ± , i = m + 1 , m + 2 , , K
x j 0 , j = 1 , 2 , , n
According to Equation (4) and the transformation of j = 1 n a i j ± x j ± = s i ± , the SIFCP model can be converted into:
Min E ± = j = 1 n c j ± x j ±
subject to:
j = 1 n a i j ± x j ± b i + ( 1 2 λ i ± ) × ( b i b _ i ) , i = 1 , 2 , , m
j = 1 n a i j ± x j ± b i ± , i = m + 1 , m + 2 , , K
x j 0 , j = 1 , 2 , , n
where a i j ± { R ± } m × n , c j ± { R ± } 1 × n , and x j ± { R ± } n × 1 ; R ± represents interval numbers, where superscripts ‘−’ and ‘+’ represent the lower and upper bounds of the interval values, respectively. In this study, the two-step method (TSM) is used for obtaining the lower and upper bounds of the SIFCP model (i.e., f o p t ± = [ f o p t , f o p t + ] and x o p t ± = [ x o p t , x o p t + ] ) under each scenario and each λ level [39].

2.2. SIFCP-WRMS Modelling Formulation

In this study, the incomplete economic parameters expressed as interval values can be tackled by IPP. Water resource demand for each water user based on subjective experience of experts and stakeholders can be solved by FCP. The scenarios of various future water distribution proportions are handled by SA. Based on the SIFCP method, a SIFCP-WRMS model can be formulated (see Figure 1). The framework of the SIFCP-WRMS model is divided into three parts: Section 1 is the identification of complexity and uncertainty in SIFCP-WRMS model; Section 2 is the entire development of SIFCP method; Section 3 describes the formulation and application of SIFCP-WRMS model, as well as strategies for decision-makers. The objective of SIFCP-WRMS model is to achieve the maximum system benefit within a series of constraints. The objective function is:
Max f ± = c = 1 13 u = 1 3 t = 1 3 ( R c , u , t ± C c , u , t ± ) × W c , u , t ±
Constraints mainly consist of water for urban life demand and supply, minimum proportion of ecology and environment water usage, as well as sewage discharge requirements. They can be depicted as follows:
(1)
The constraint of total water resources availability:
c = 1 13 u = 1 3 W c , u , t ± T t ±
(2)
The constraint of water resources for urban life demand:
C r { W c , 1 , t ± D e m a n d ˜ c , 1 , t ± } λ ± W c , 1 , t ± D e m a n d c , 1 , t ± + ( 1 2 λ ± ) × ( D e m a n d c , 1 , t ± D e m a n d _ c , 1 , t ± )
(3)
The constraint of minimum proportion for ecology and environment water usage:
C r { W c , 3 , t ± u = 1 3 W c , u , t ± × α ˜ c , t ± } λ ± W c , 3 , t ± u = 1 3 W c , u , t ± × α c , t ± + ( 1 2 λ ± ) × ( α c , t ± α _ c , t ± )
(4)
The constraint of sewage discharge requirements:
c = 1 13 u = 1 3 W c , u , t ± × P c , u , t ± S e w t ±
(5)
The constraint of COD emission limitation:
c = 1 13 u = 1 3 W c , u , t ± × P c , u , t ± ( 1 η t ± ) C O D t ±
(6)
The constraint of water resources limitations for industry:
C r { c = 1 3 W c , u , t ± × ( β ˜ l b ) c , t ± W c , 3 , t ± } λ ± u = 1 3 W c , u , t ± × ( ( β l b ) c , t ± + ( 1 2 λ ± ) × ( ( β l b ) c , t ± ( β _ l b ) c , t ± ) ) W c , 3 , t ±
C r { u = 1 3 W c , u , t ± × ( β ˜ u b ) c , t ± W c , 3 , t ± } λ ± u = 1 3 W c , u , t ± × ( ( β u b ) c , t ± + ( 1 2 λ ± ) × ( ( β u b ) c , t ± ( β _ u b ) c , t ± ) ) W c , 3 , t ±
(7)
Nonnegative constraint:
W c , u , t ± 0
The specific nomenclature and abbreviation are shown in Nomenclature and Abbreviations. The detailed solution process of handling the SIFCP-WRMS model is depicted in Figure 2.

3. Application

3.1. Statement of Problems

Henan province, which is in Central China, covers an area of 167 × 103 km2 (110°21′ E–116°39′ E, 31°23′ N–36°22′ N) (see Figure 3). The province includes 18 cities and is densely populated with a total population of 107.22 million. In addition, Henan Province is an important transportation and communication hub and material distribution center in China. It is also the most important province for agricultural and food production in China. In 2018, the GDP of the province was 48,05.586 billion RMB. There are more than 1500 rivers in this territory, which receive an average annual precipitation of 500–900 mm, and the amount of annual average water resource is 40.35 billion m3. However, the per capita water resource is about 383 m3, which is far lower than the international standard for extreme water shortage (500 m3 per capita). The lack of water resources in Henan directly restricts the sustainable development of the local economy and society, as well as ecological protection. Thus, it is of great importance to encourage developing WDP to satisfy the local water shortage.
The middle route of the SNWDP in China originates from the Danjiangkou Reservoir Taoyuan Canal in Xichuan County (Henan Province) and arrives at Tuancheng Lake in Beijing, covering a total length of 1267 km. As a water-receiving area, the total water distribution of the main canal of the province is 2.994 billion m3, excluding the allocated water in Danjiangkou Irrigation District and the total dry channel water loss. The water-receiving area of SNWDP in Henan includes 13 cities from south to north, including Dengzhou, Nanyang, Pingdingshan, Xuchang, Luohe, Zhoukou, Zhengzhou, Jiaozuo, Xinxiang, Hebi, Huaxian, Puyang, and Anyang. Water use department consumption is shown in Figure 1, which includes urban life water, industrial water, and ecological environment water. As the economy continues to grow and productivity levels continue to improve, water demand continues to increase, which aggravates the contradiction between water demand and supply.

3.2. Data Collection

The planning horizon includes three periods with each having one year (i.e., t = 1 represents the year 2020, t = 2 represents the year 2025, and t = 3 represents the year 2030). In this study, the system parameters from economic, technical, subjective, and observed or estimated aspects were collected from the Statistical Yearbook of Henan Province, survey questionnaires and expert consultations, Henan government official reports, as well as the Henan Province Water Resources Bulletin [40,41,42]. For instance, the future water resource demand for urban life are based on the water quota in terms of survey questionnaires and expert consultations; the future water resource demand for the industry are dependent on the water consumption per unit of output by means of the Statistical Yearbook of Henan Province. Additionally, four scenarios in relation to different water distribution proportions were considered. In detail, scenario 1 (S1) represents the basic scenario without any particular regulatory or political barriers; scenario 2 (S2) represents equal departmental water distribution proportion for each sector (i.e., 33% of urban life, 33% of industry, and 33% of ecology and environment); scenario 3 (S3) represents different departmental water distribution proportions for each sector (i.e., 50% of urban life, 25% of industry, and 25% of ecology and environment); and scenario 4 (S4) represents different departmental water distribution proportion for each sector (i.e., 25% of urban life, 50% of industry, and 25% of ecology and environment). Table 1 and Table 2 present the water supply situations in the South-to-North Water Transfer Middle Line Project within the scope of Henan Province.

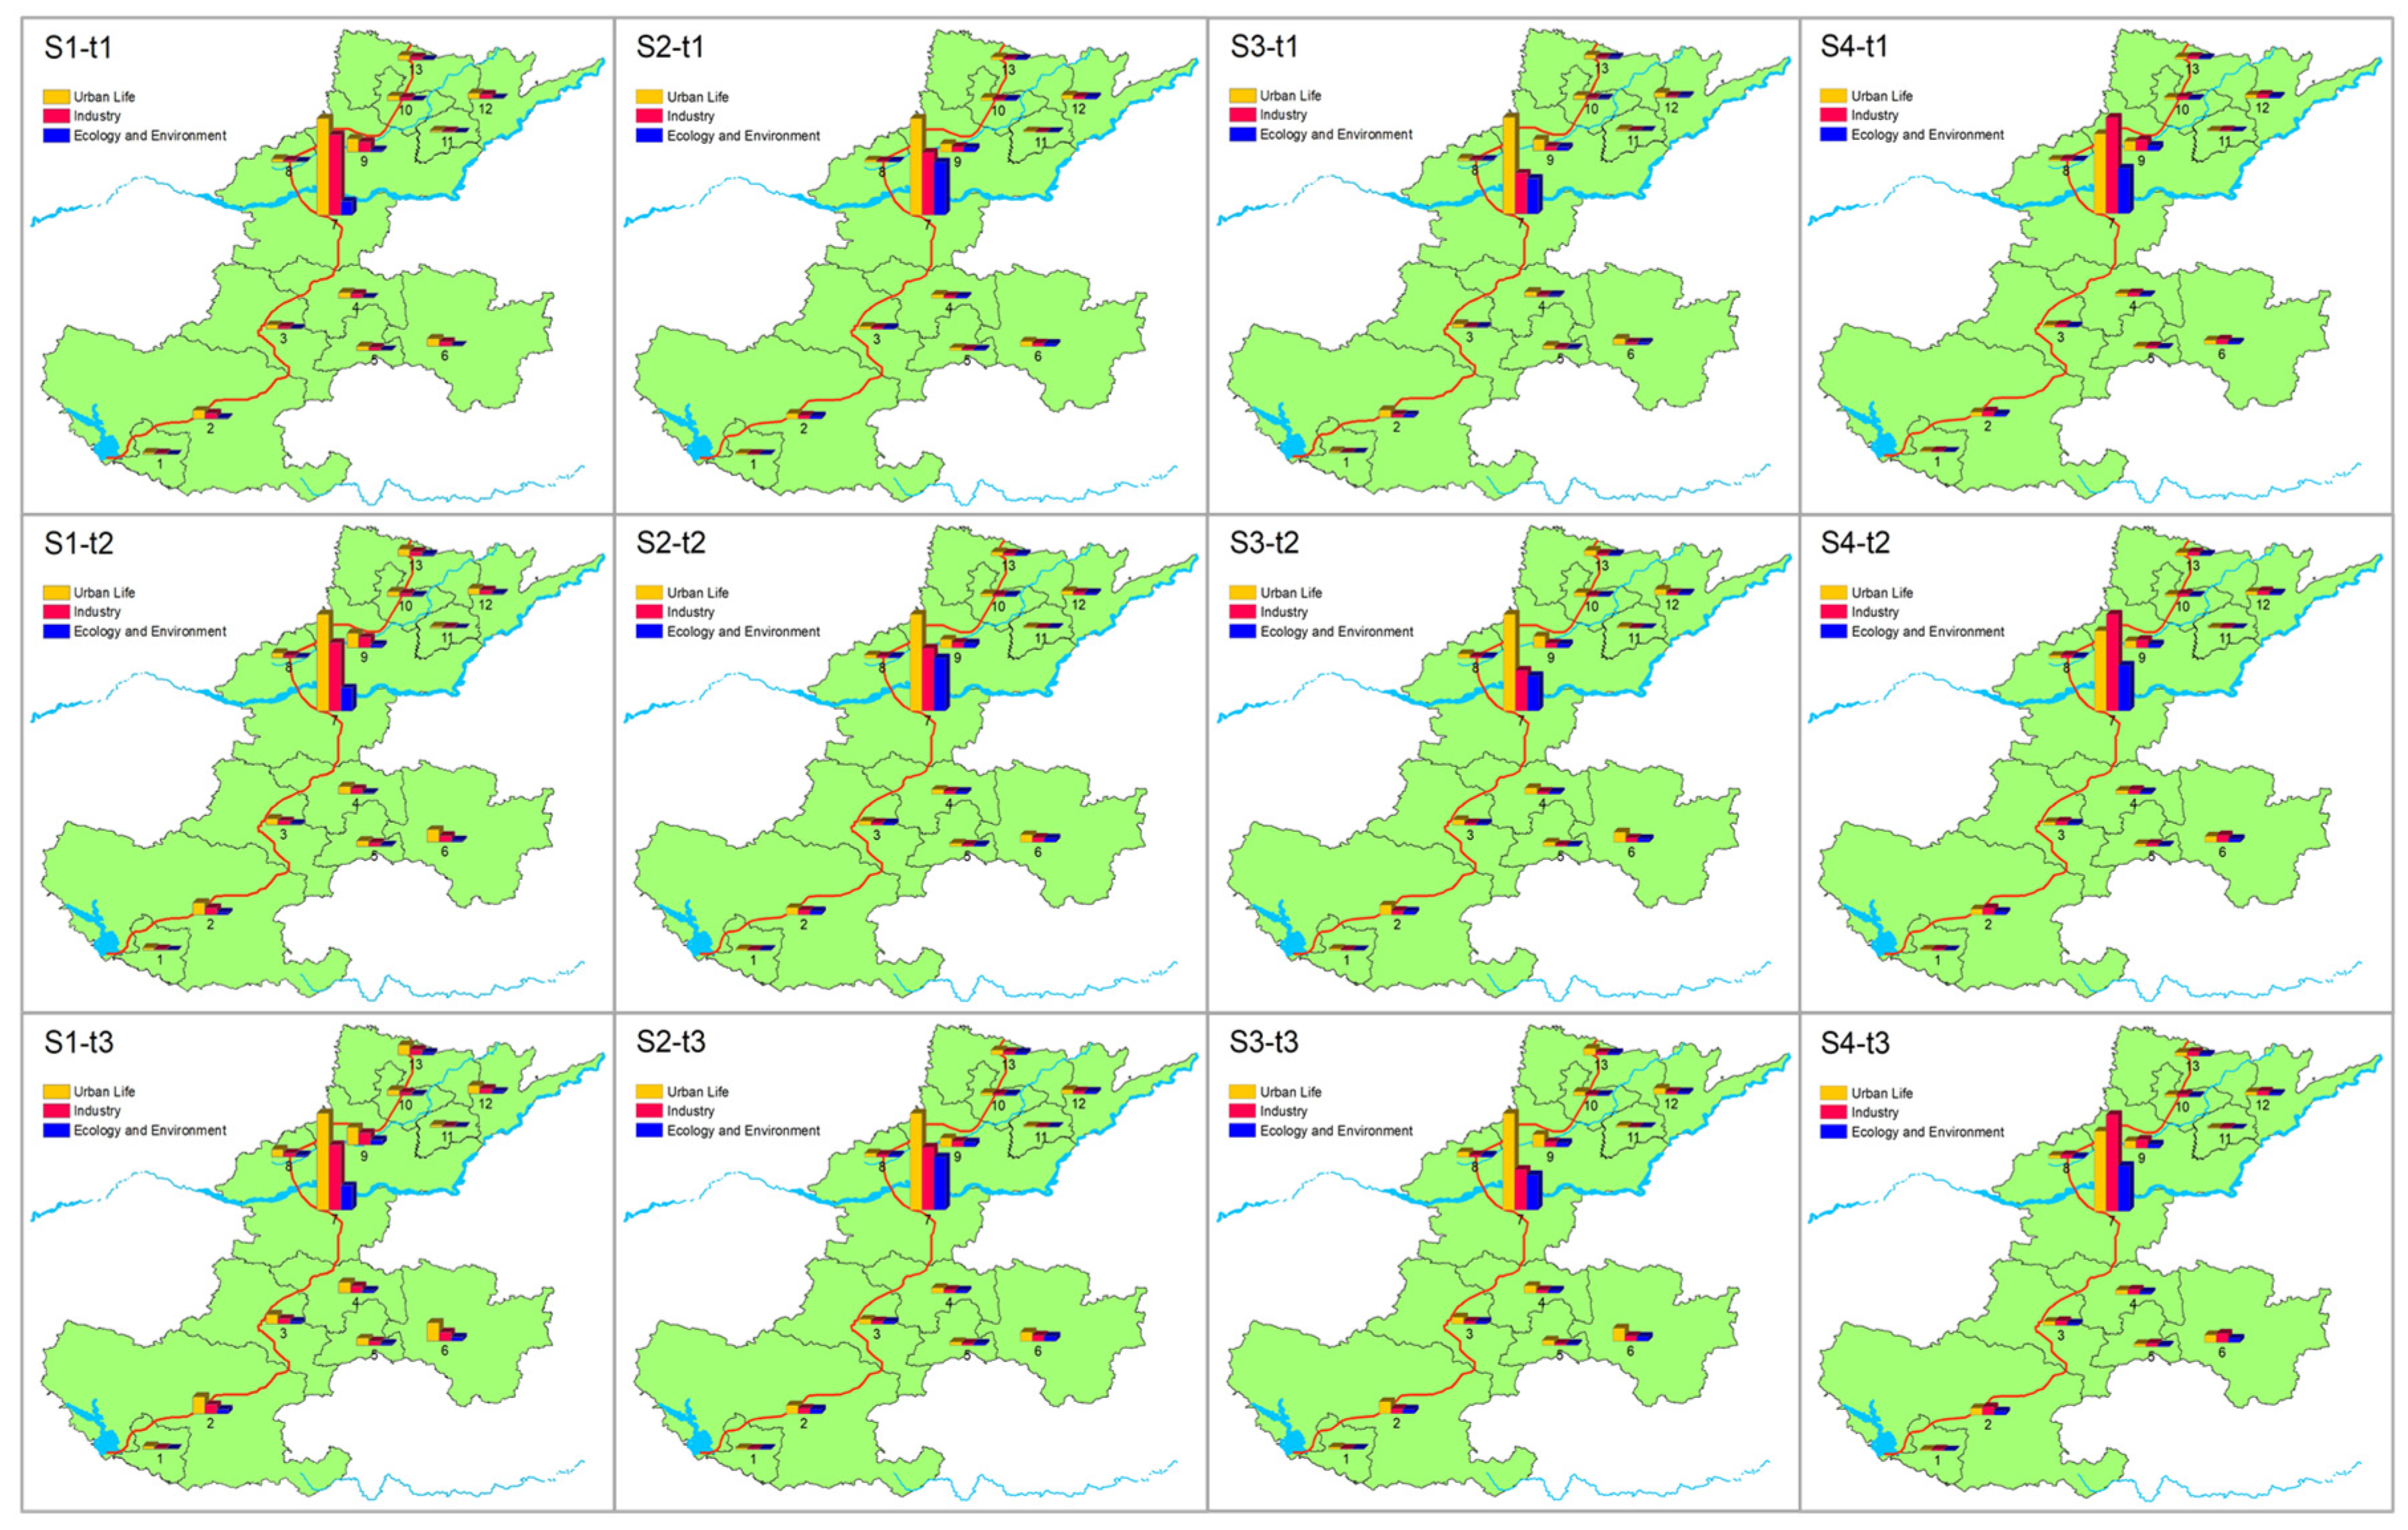
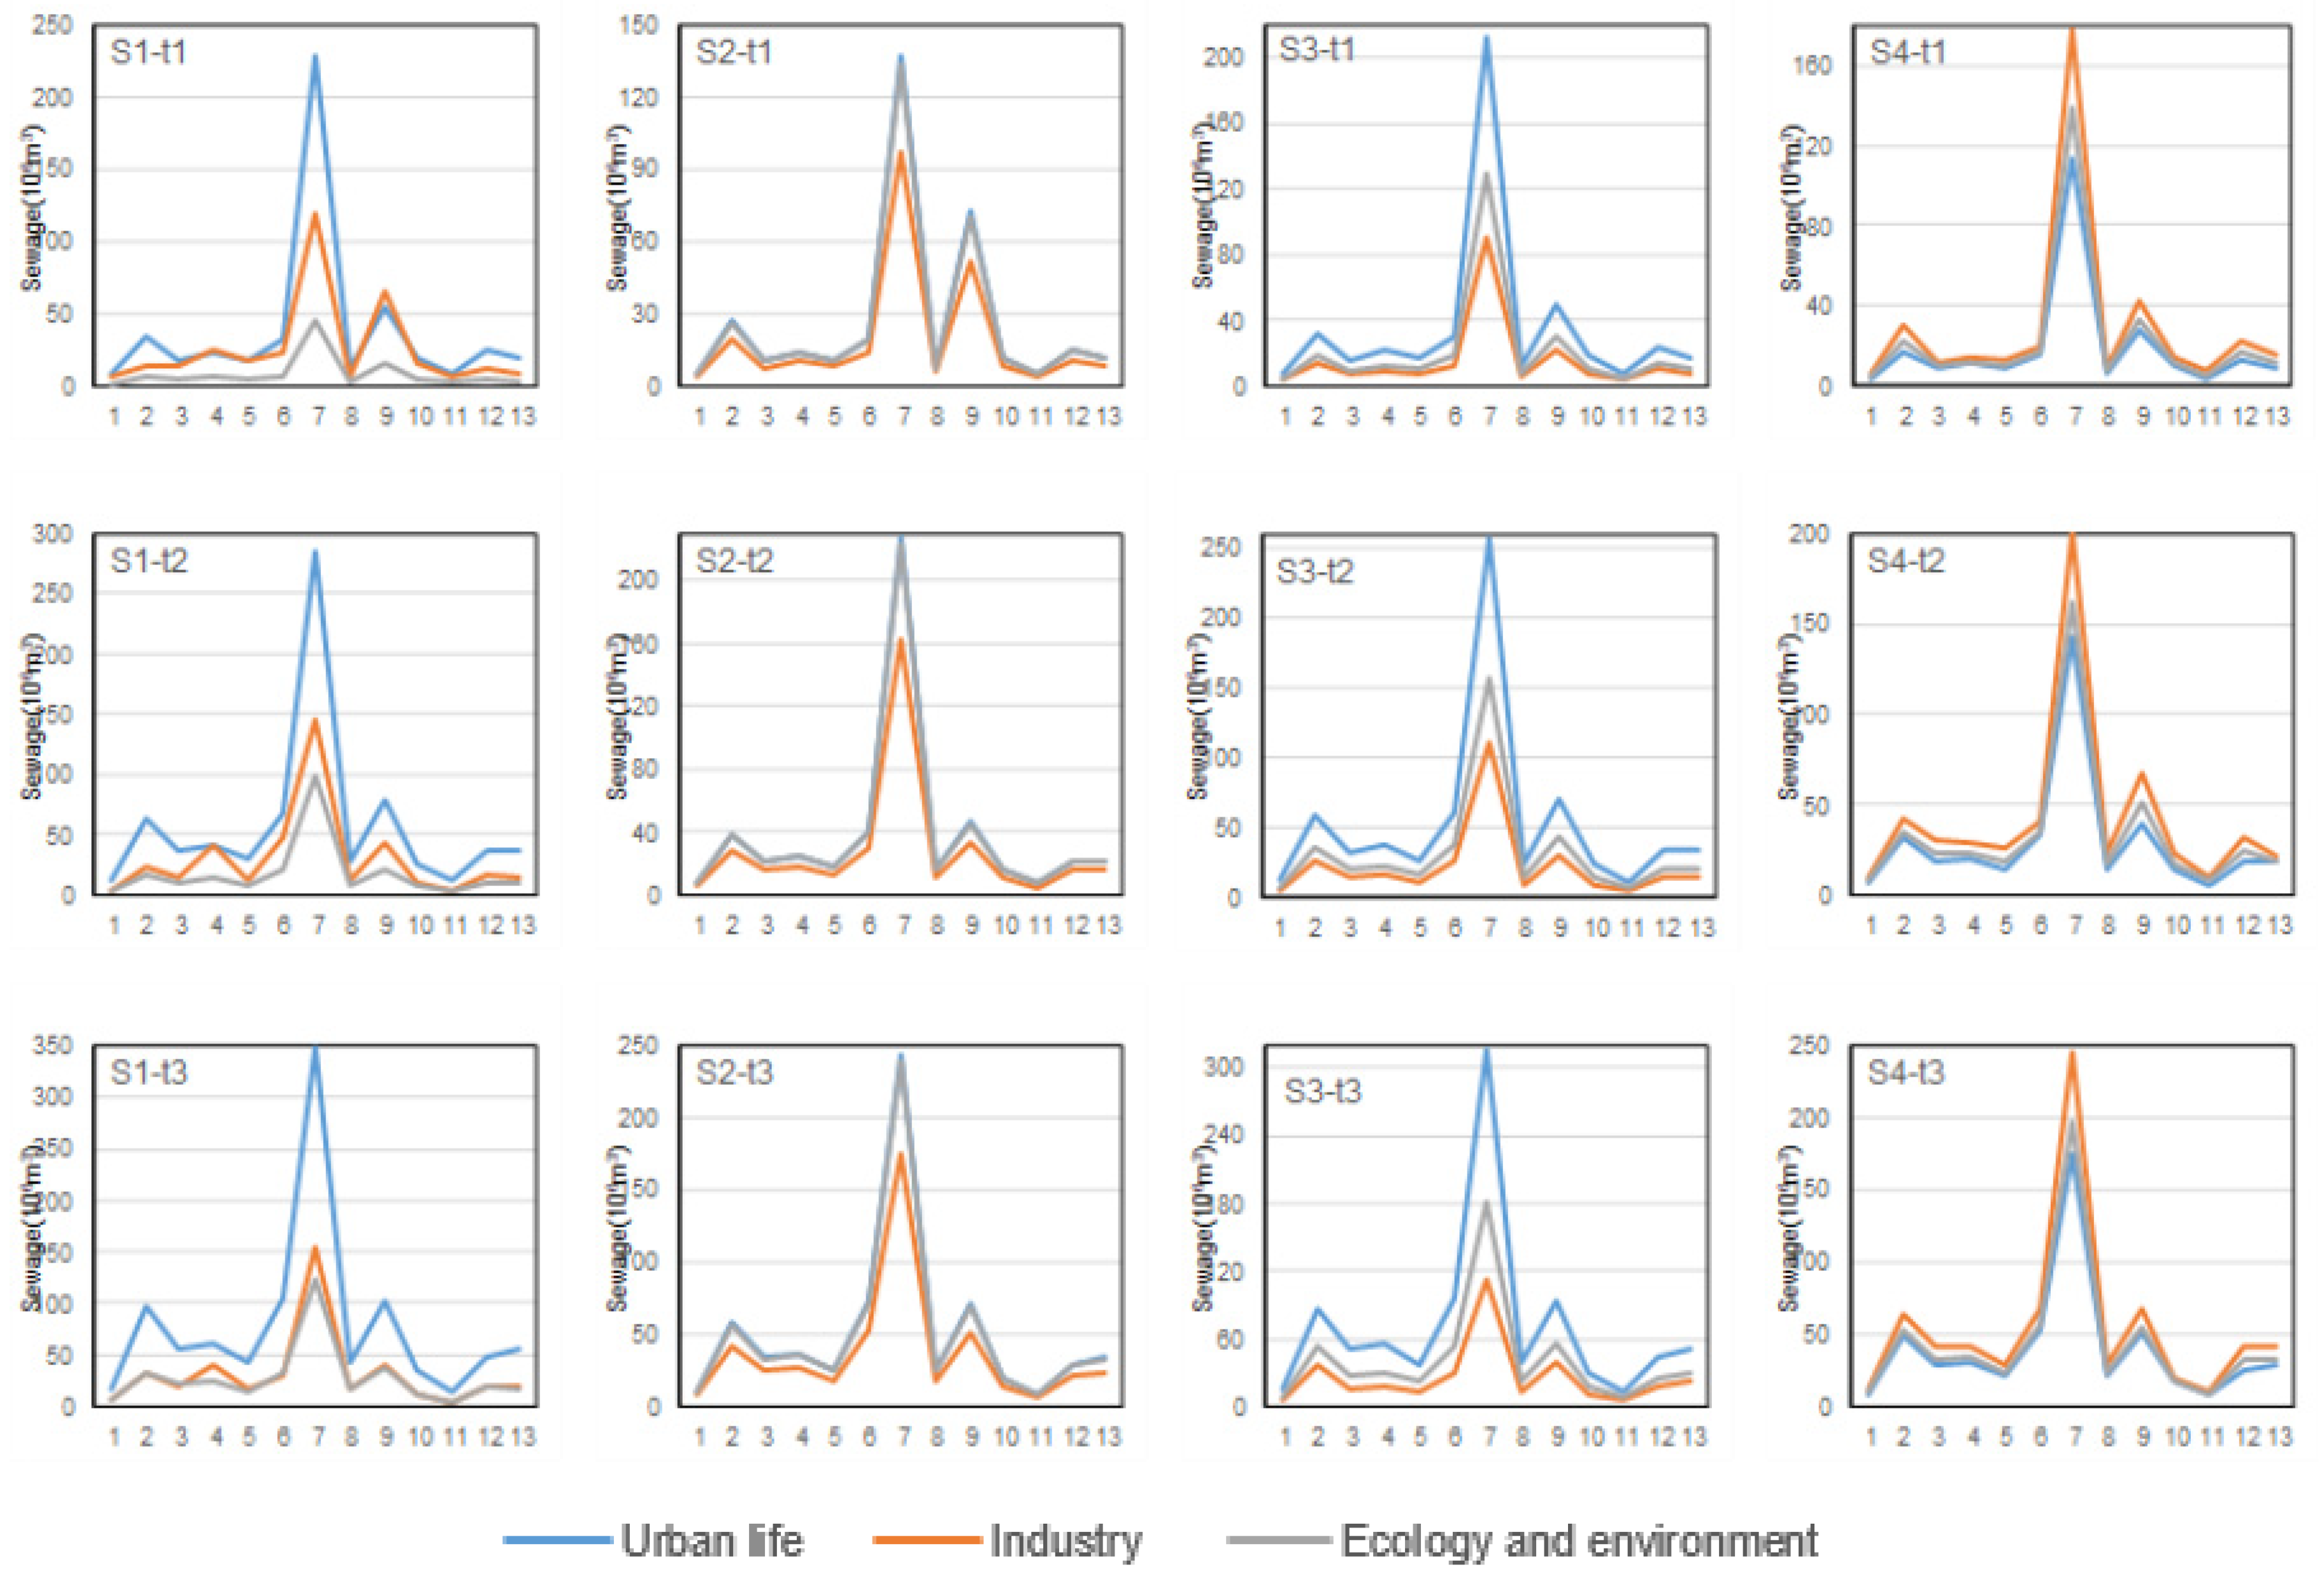
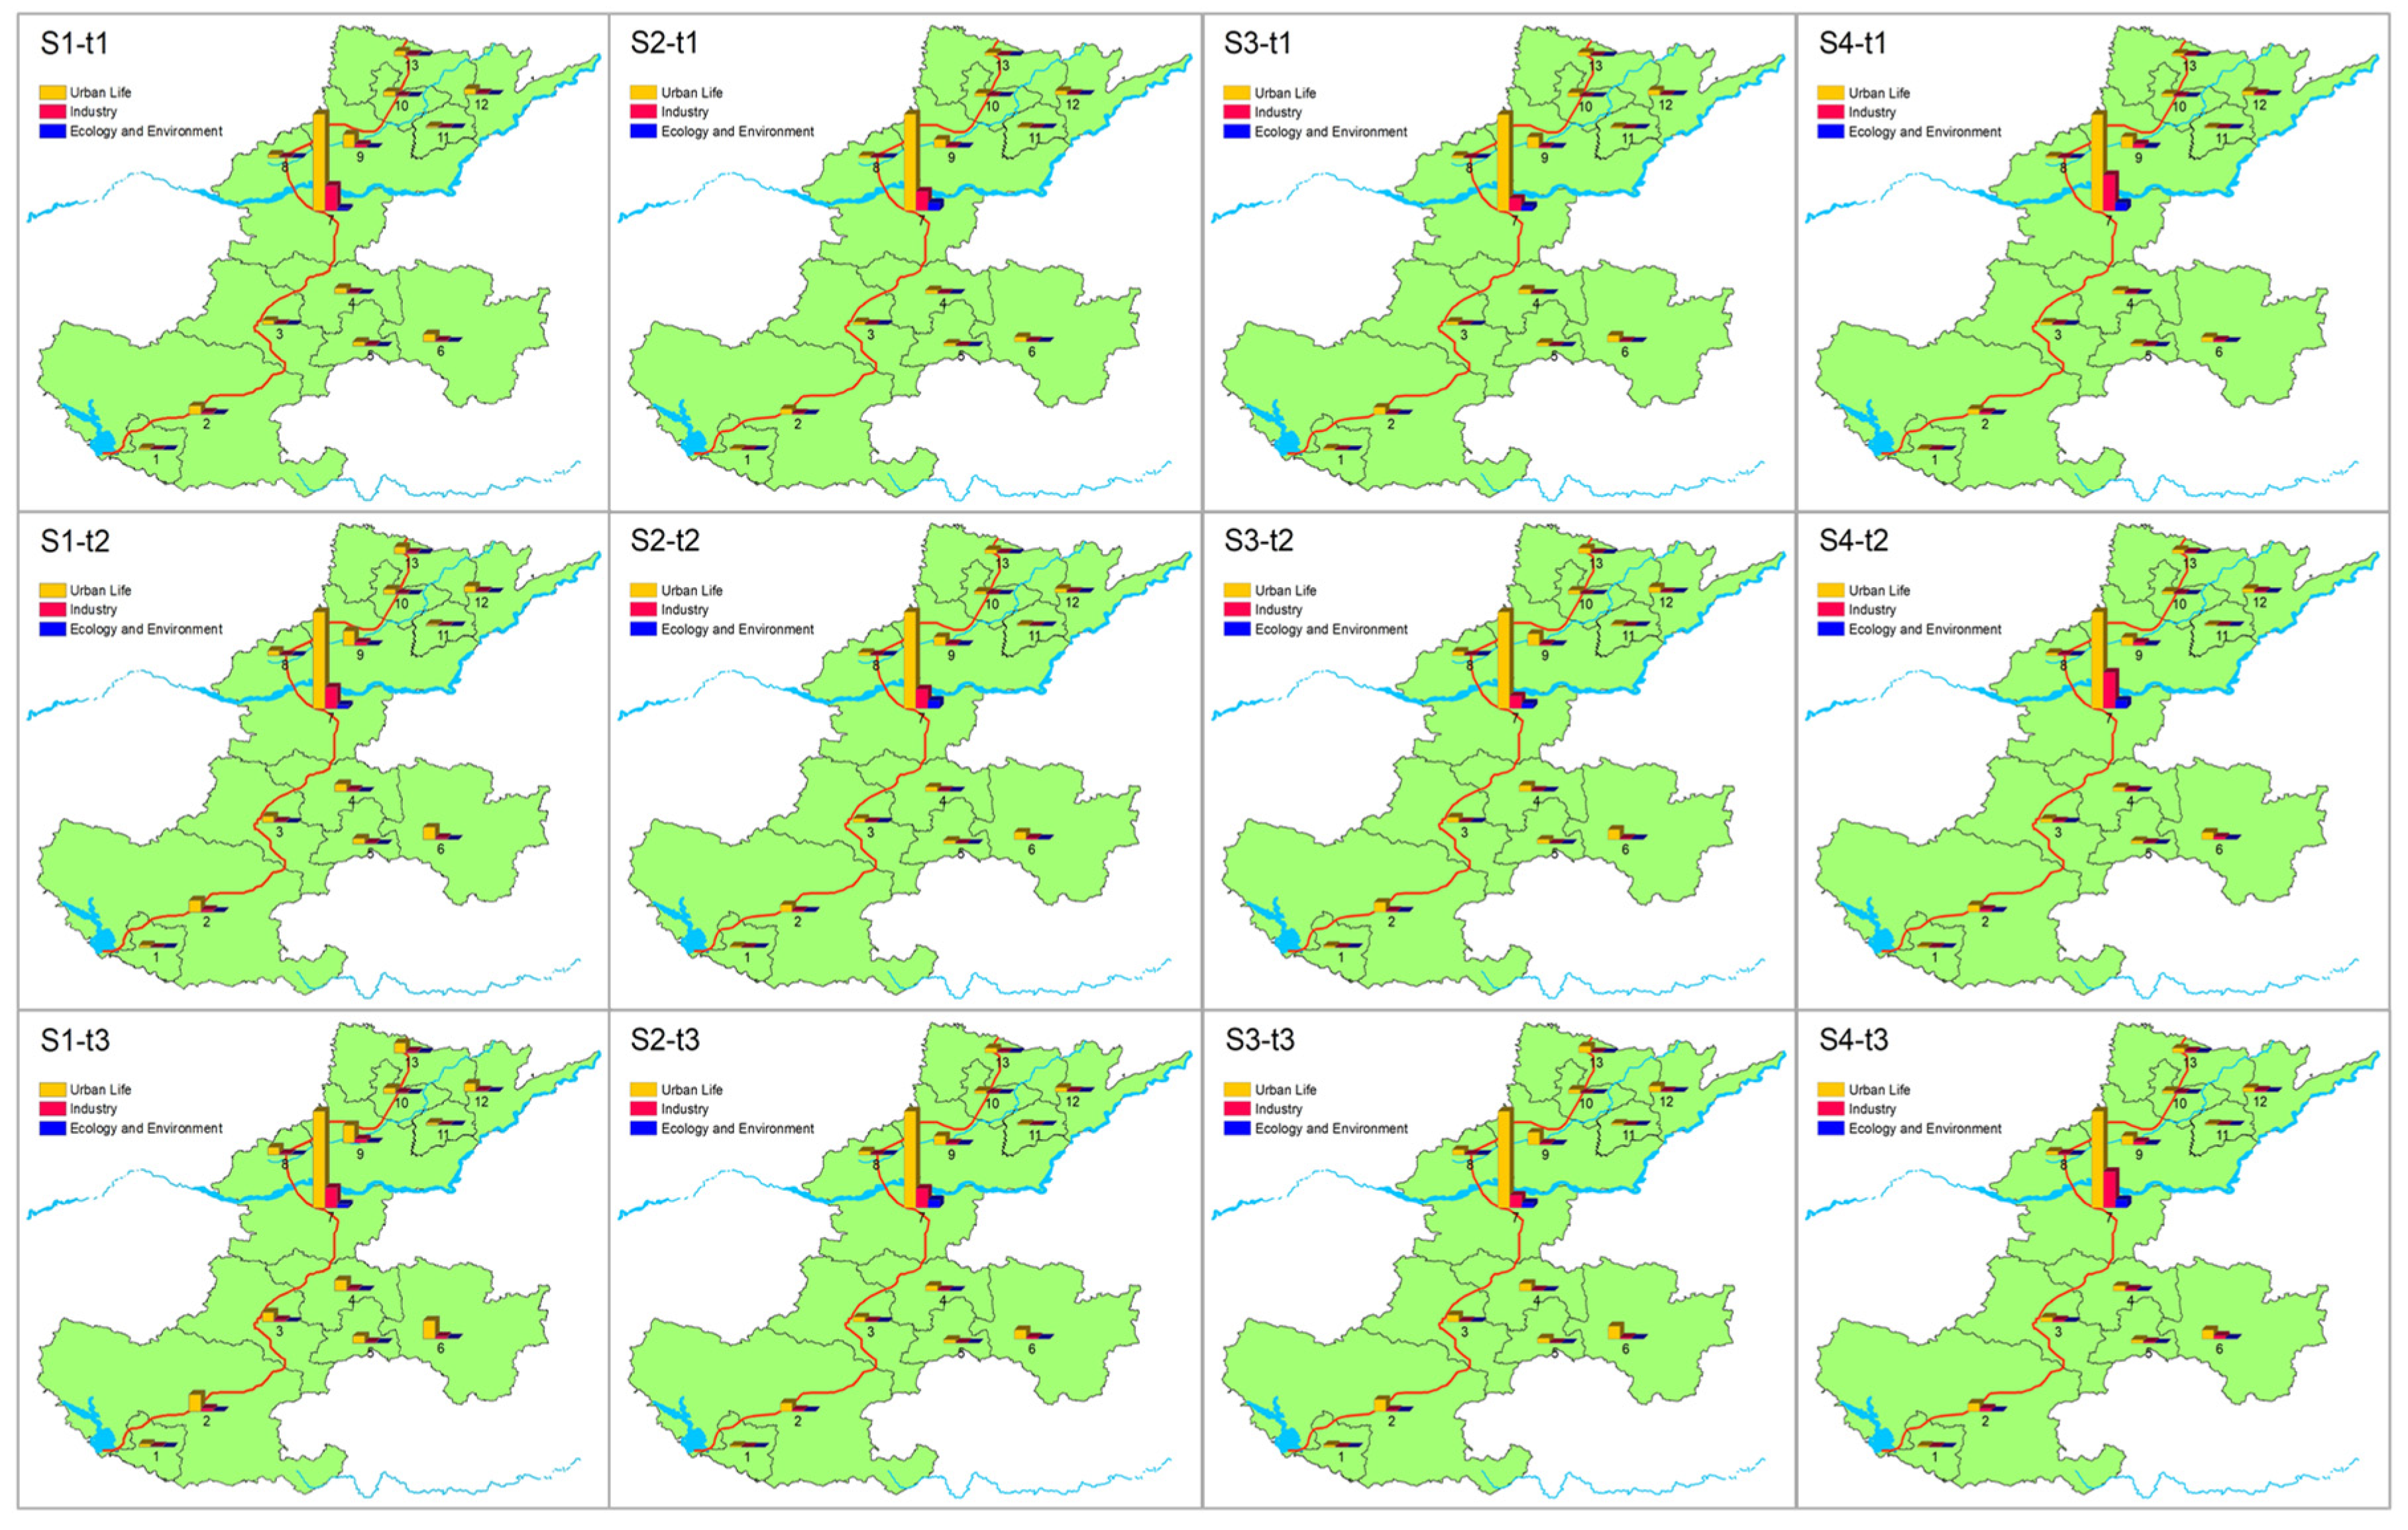
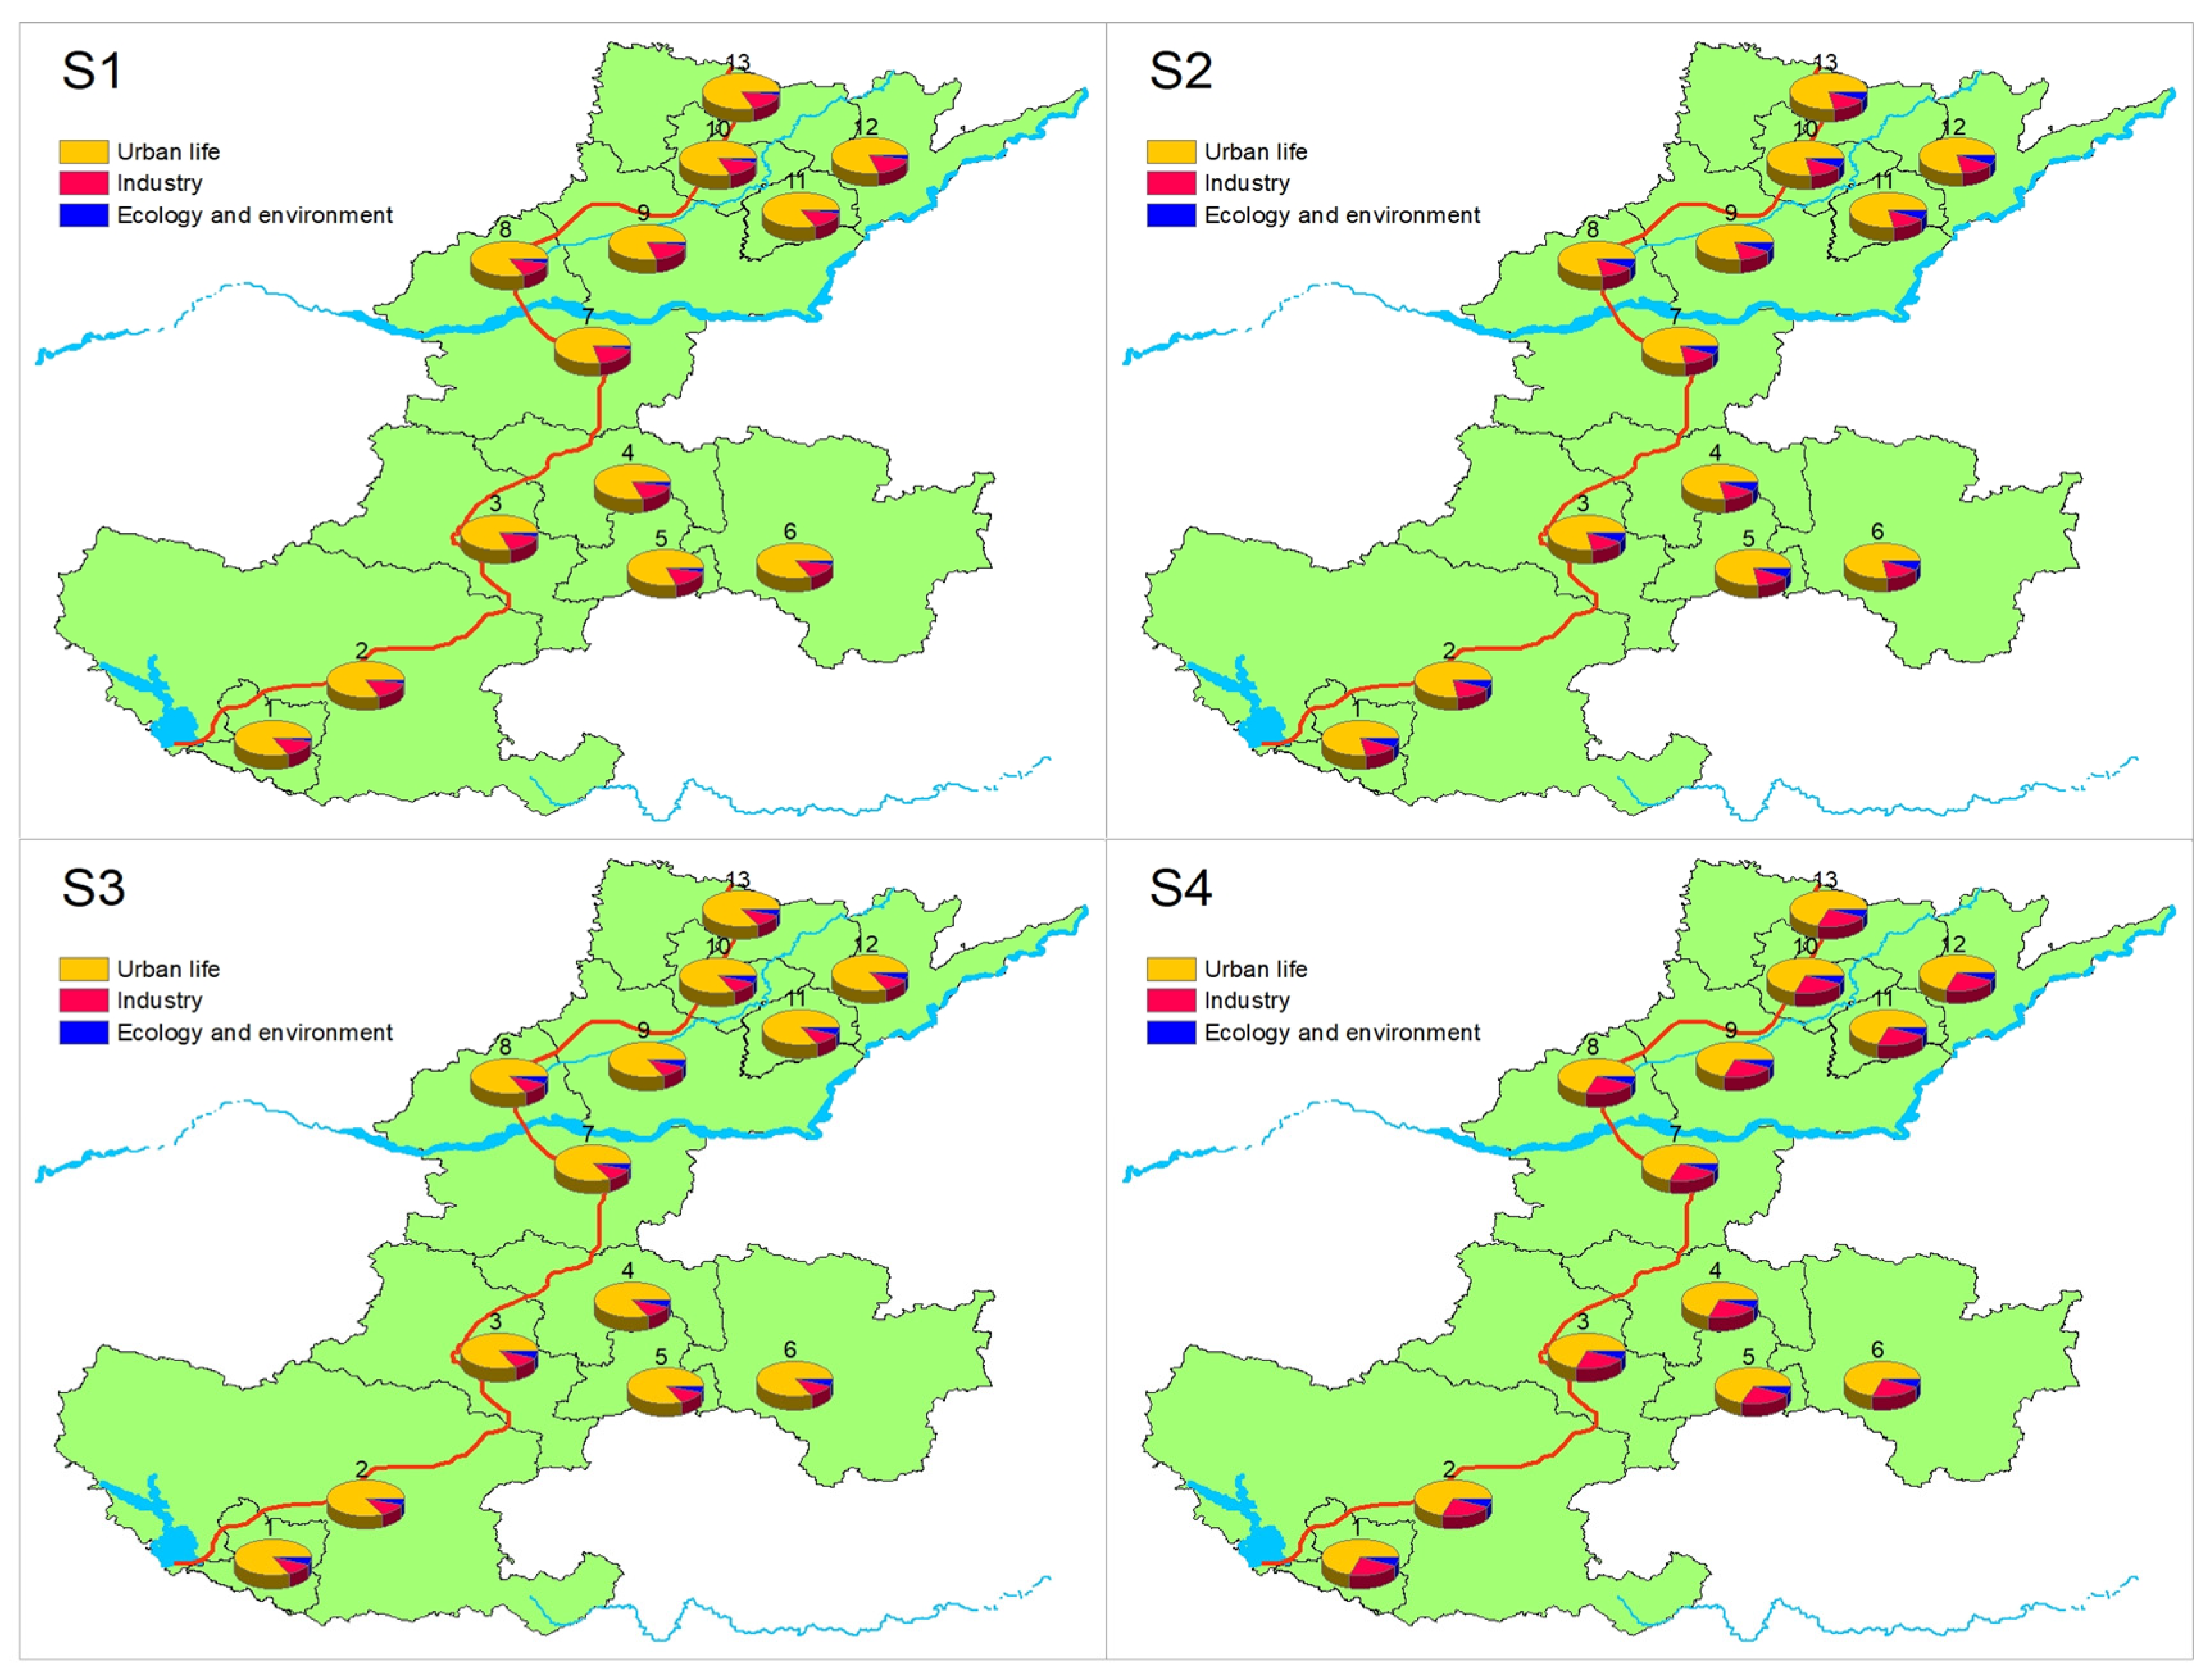
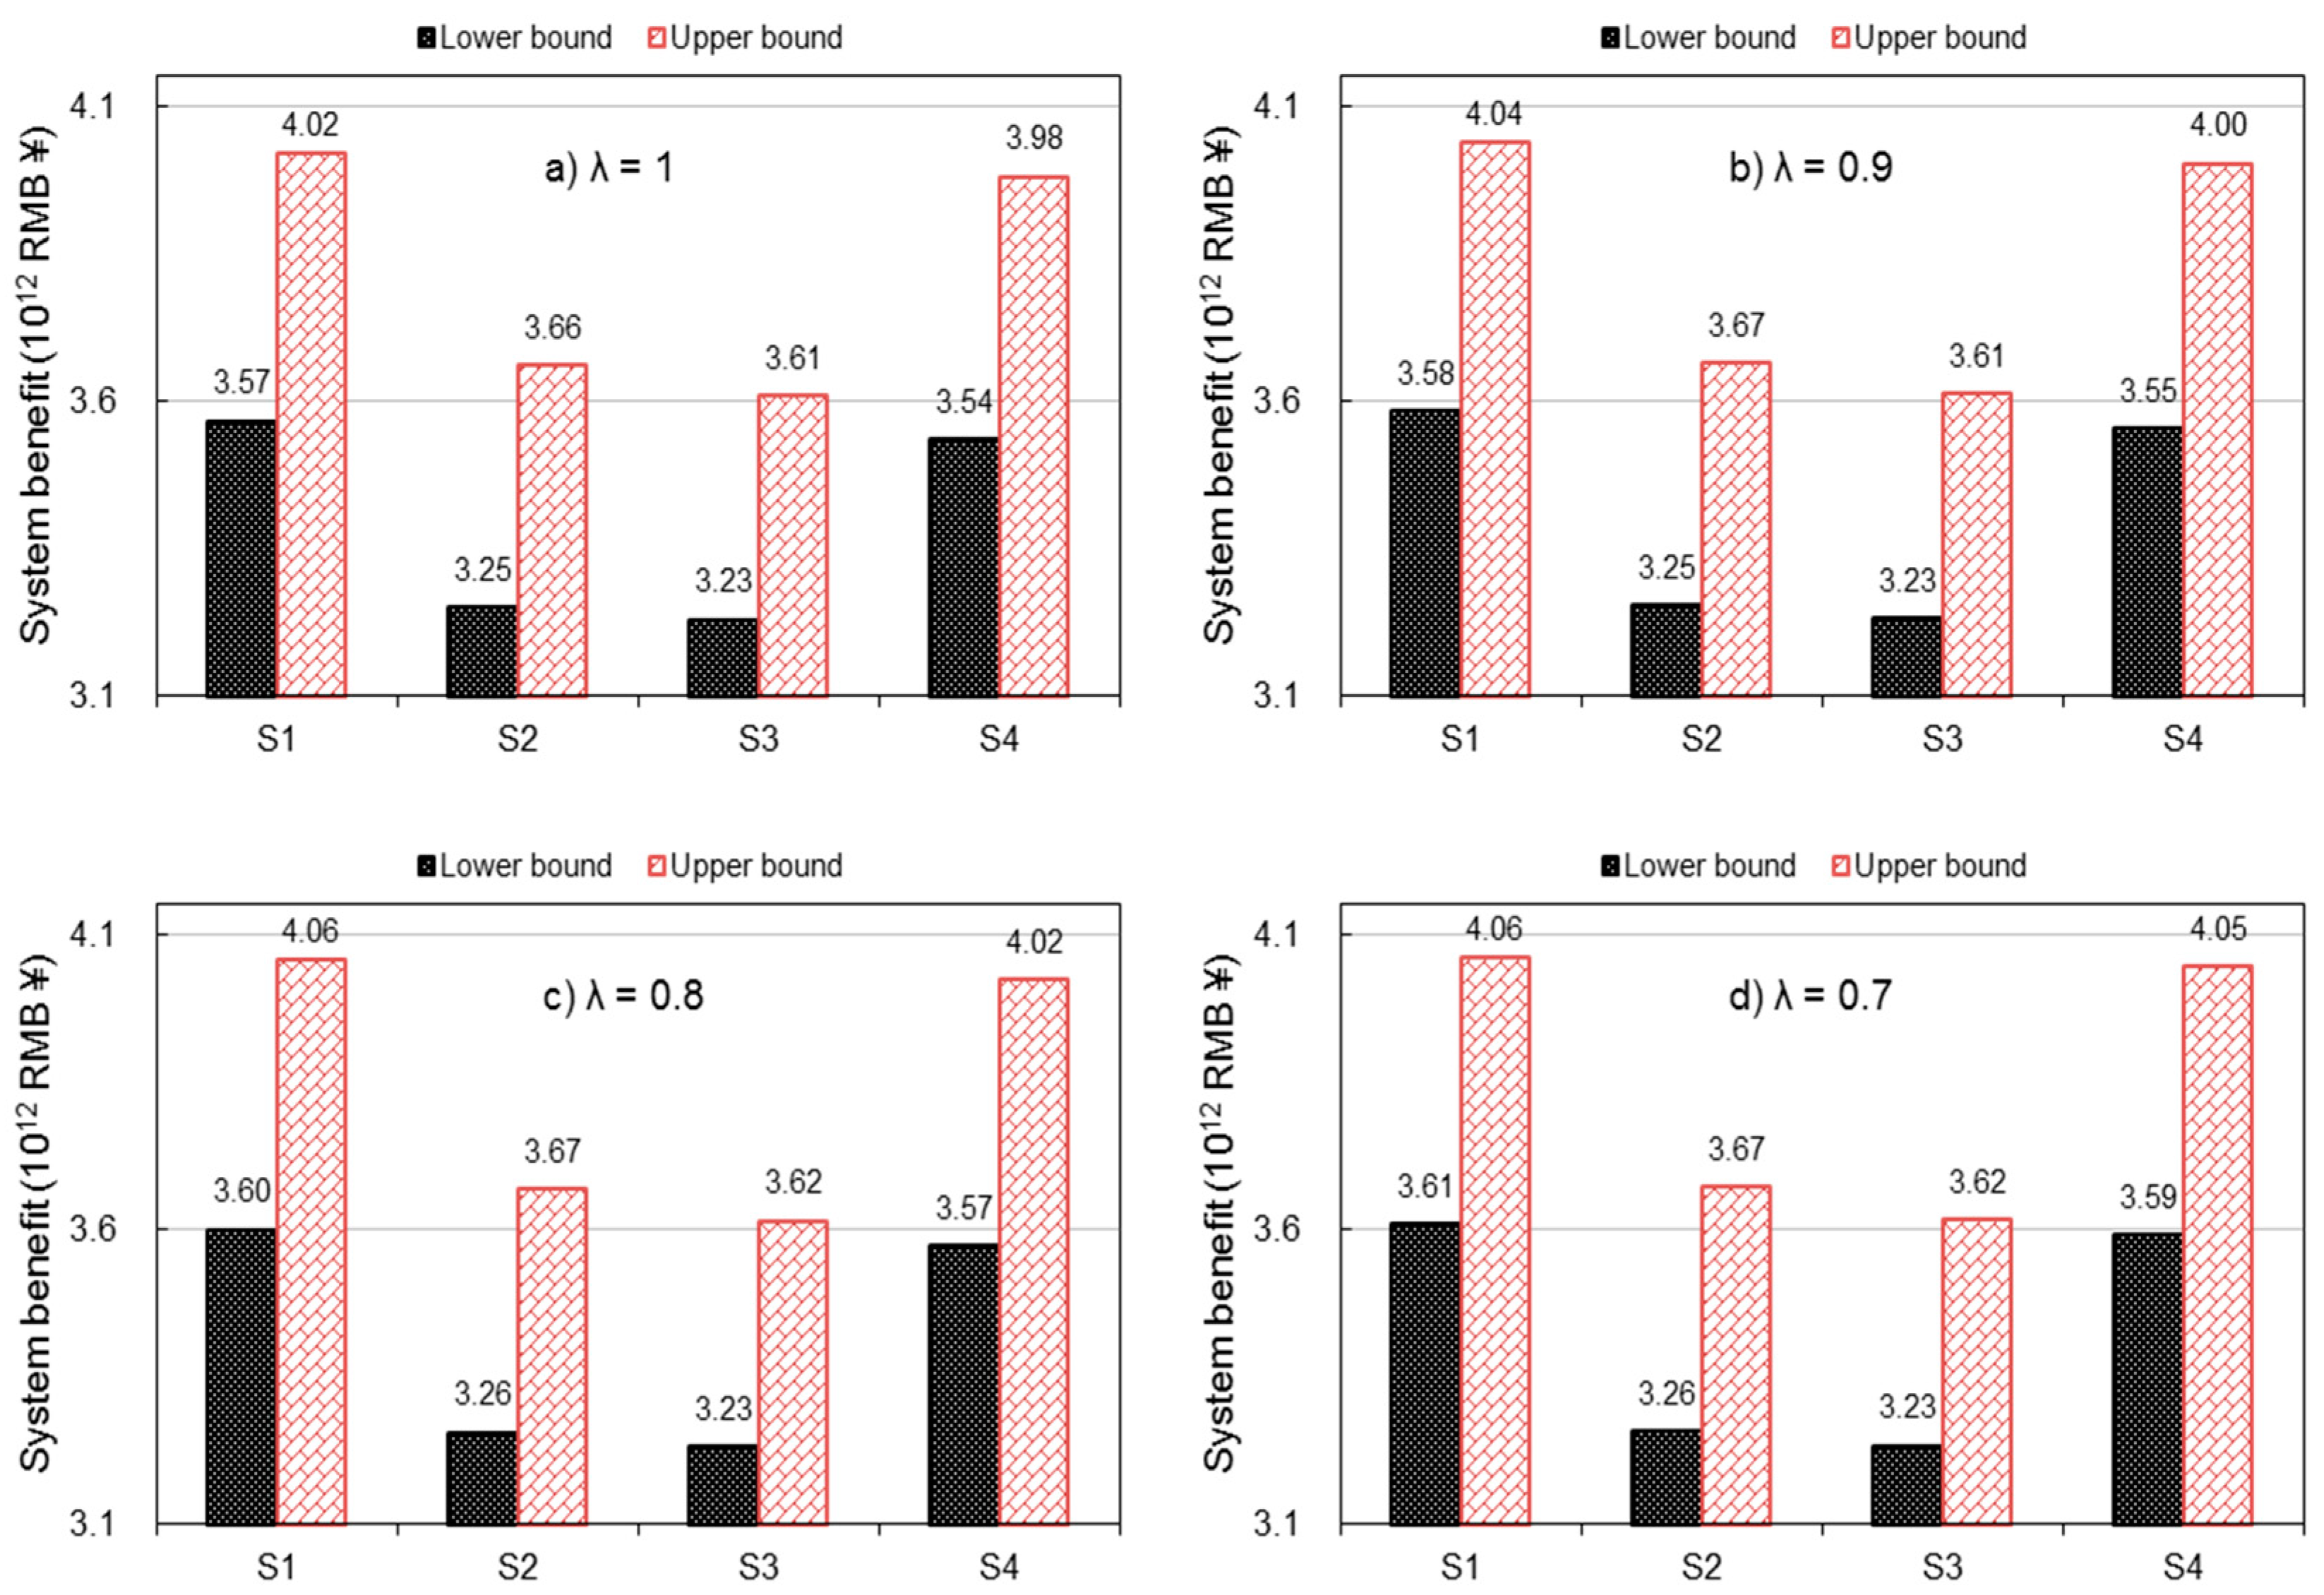
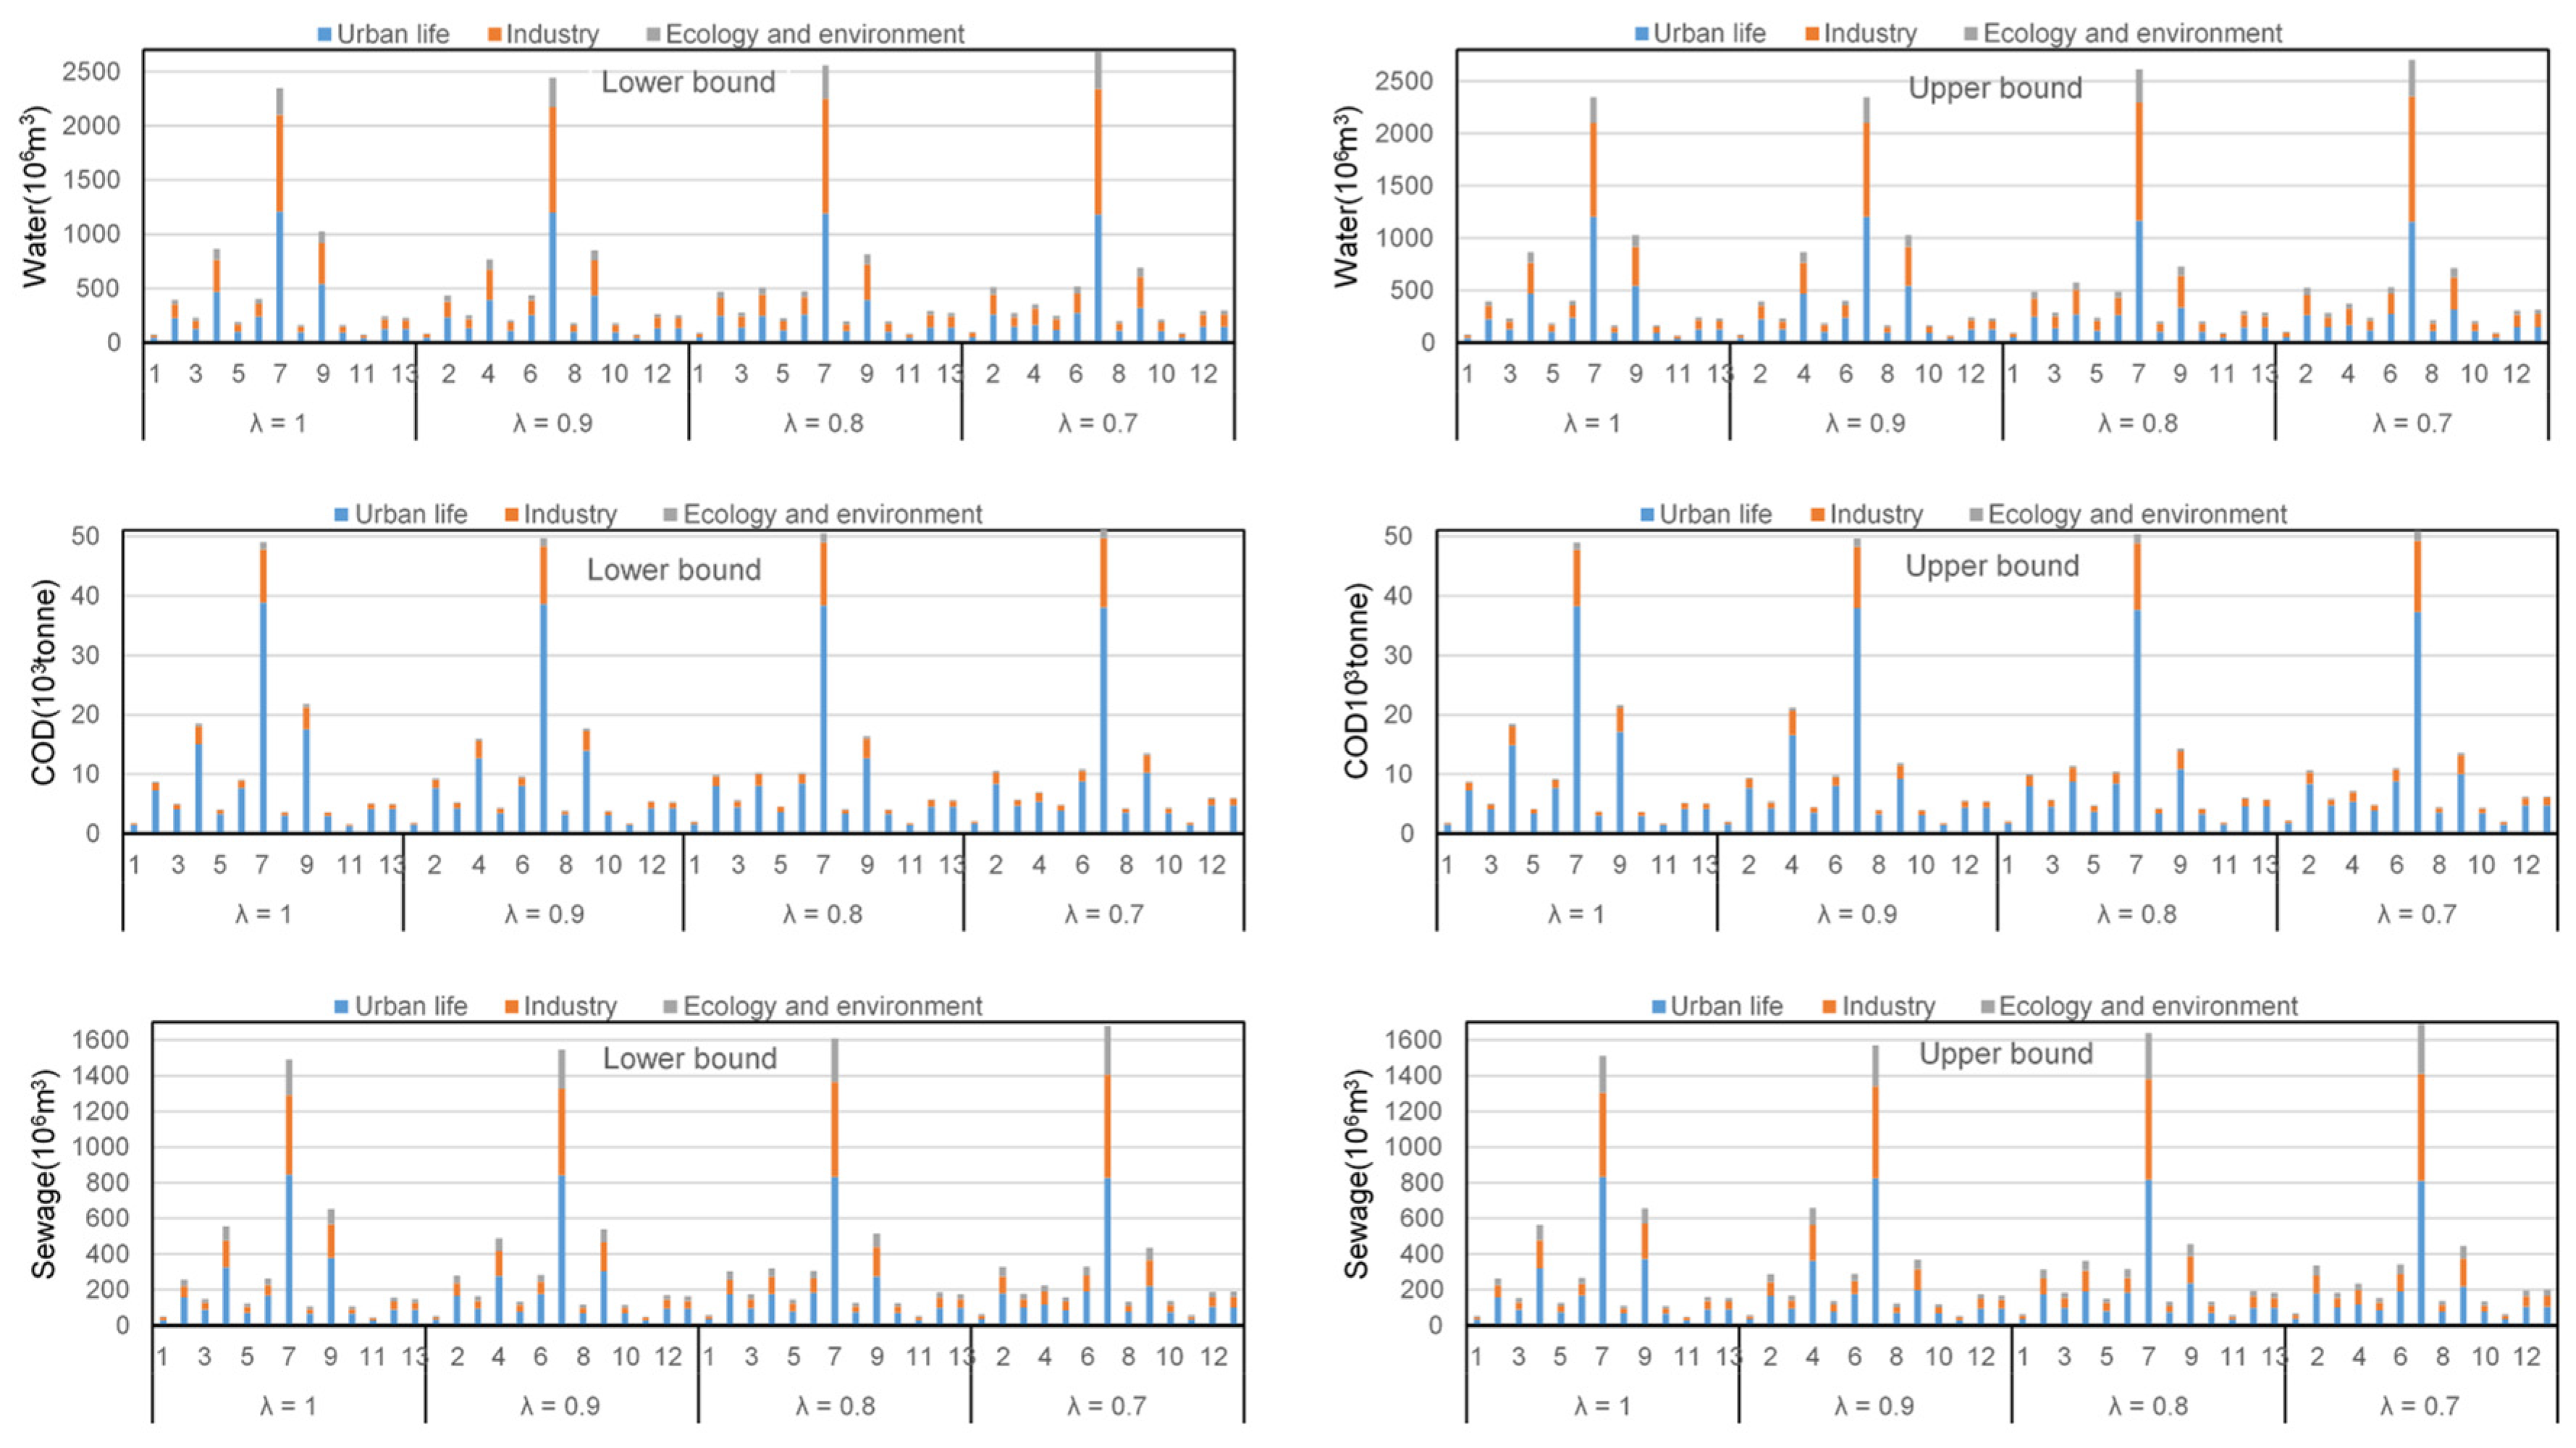
3.3. Result Analysis

The results of allocated water of SNWDP under each period and scenario are shown in Figure 4. Allocated water resources for cities and departments would vary with time. For example, in period 1 under S1 the allocated water for urban life, industry, ecology, and environment in Zhengzhou would be 325.27 × 10⁶ m3, 237.46 × 10⁶ m3, and 55.56 × 10⁶ m3, respectively; while the allocated water in period 2 would be 408.38 × 10⁶ m3, 288.65 × 10⁶ m3, and 123.01 × 10⁶ m3, respectively. This is because the proportion of urban life and industrial water distribution would change with the improvement of water-saving technology. Along with the awareness of the ecological environment protection of the whole society, the water consumption of the ecological environment would also increase. Results also indicated that scenarios would lead to changed allocation of water resources corresponding to departmental water distribution proportion for each sector. Figure 5 shows the proportion of allocated water for each sector under various scenarios. In detail, the proportion of allocated water for industry would decrease 9% from S2 to S3. That is because S2 mainly simulates the same proportion of water demand for each department. However, under S3, the proportion of allocated water for urban life and ecology and environment is 75%.
Figure 6 shows the sewage discharge for each sector during various periods. Sewage emissions from the urban life of Zhengzhou would increase to 227.69 × 10⁶ m3, 285.86 × 10⁶ m3, and 350.23 × 10⁶ m3 from periods 1–3 under S1. The increasing volume of sewage emission is mainly because of the rapid development of the urban population. Conversely, the sewage emissions from the urban life of Xinxiang would decrease by 46.35 × 10⁶ m3 from S1–S2 in 2020. This is mainly because constraints are imposed on the water distribution proportion of each department. Eventually, sewage emissions from each department would change.
Figure 7 shows COD from the sewage of various departments under different periods and scenarios. Generally, the emission of COD would change as the scenario changed. For instance, in period 1 under S2 the COD from the sewage of allocated water for urban life, industry, ecology, and environment in Zhengzhou would be 6.28 × 10³ tonnes, 1.95 × 10³ tonnes, and 0.80 × 10³ tonnes, respectively; while the COD from sewage of allocated water resources under S3 would be 9.75 × 10³ tonnes, 1.81 × 10³ tonnes, and 0.77 × 10³ tonnes, respectively. Variations in COD emission are mainly because constraints would be imposed on the water distribution proportion of each department while there is a changing demand for water resources in various departments. It was demonstrated that the COD from the sewage of allocated water resources for different cities and departments would vary with time. For instance, COD of the sewage from the ecology and environment of Zhengzhou would increase by 471.81 tonnes under S1. Awareness of a need for protection of the ecological environment protection will occur, but in addition, water consumption of the ecological environment would also increase. Figure 8 shows the proportion of COD emission from each department under different scenarios. For example, under S1, the COD emission from urban life, industry, ecology and environment of Zhengzhou would contribute 79.86%, 18.10%, and 2.04%, respectively, in period 1, while they would account for 79.08%, 17.36%, and 3.56% COD emission, respectively, in period 2. In summary, the proportion of COD emission for each department is dependent on the needs of various departments for water resources under different scenarios.
Figure 9 shows the system benefits under different credibility (λ = 1, 0.9, 0.8, 0.7) levels and different scenarios. Generally, the system benefits would decrease with rising λ levels and change with different scenarios. For instance, when λ = 0.9, the system cost would be [3.55, 4.00] × 1012 RMB¥ under S4 and [3.23, 3.61] × 1012 RMB¥ under S3. This is because different scenarios would correspond to the water allocation proportion of different departments, thus leading to different benefits of the overall system. Additionally, different credibility levels would generate reactions for the proportion of the allocation water for each department. For instance, the system benefits in S1 would be [3.57, 4.02] × 1012 RMB¥ under λ = 1, while it would be [3.61, 4.06] × 1012 RMB¥ under λ = 0.7. This is because higher λ levels would be imposed on the price factors. Figure 10 shows the proportion of the allocated water, sewage and COD from urban life, industry, ecology, and environment under each credibility and scenario. Generally, the allocated water, sewage and COD would increase with decreased λ levels. This is mainly because the constraints would impose on the water distribution proportion and lead to changes in sewage and COD emissions from each department.

4. Conclusions and Outlook

In this study, a scenario-based interval fuzzy-credibility constrained programming (SIFCP) method has been developed by integrating fuzzy-credibility constrained programming (FCP), interval-parameter programming (IPP), and scenario analysis (SA). SIFCP can handle uncertain information by using interval values, fuzzy sets and scenario analysis. Then, a SIFCP-WRMS model is formulated. The method was applied to the optimal allocation of water resources in the South-to-North Water Transfer Project within the scope of the Henan province. Different scenarios associated with varied water-allocation proportions have also been examined. SIFCP-WRMS model has advantages of: (a) tackling multi-uncertainty presented as interval-fuzzy parameters and interval-scenarios; (b) identifying the desired water-allocation strategies under different water-distribution proportion scenarios; and (c) making adjustments to the tradeoffs among system cost, water resource demand, and sewage discharge, as well as COD emission.
Several findings in association with water allocation, sewage discharge, COD emission, and system benefit are achieved. Firstly, results disclose that different water -distribution proportion scenarios can lead to changed water allocations, sewage discharges, COD emissions, and system benefits, and the proportion of allocated water for the industry would decrease 9% from S2 to S3 over the planning horizon. Secondly, results also reveal that uncertainties associated with different λ levels can result in varied solutions of allocated water and system benefits. Summarily, the achieved system benefit would change 20.44% based on the joint impacts of scenarios and uncertainties.
Although SIFCP-WRMS has its effectiveness in solving dual uncertainties presented as interval-fuzzy parameters or interval-scenarios, and the results can provide useful strategies for planning the WRMS under the conflict of economic objective, water demand, and sewage discharge, in this study, only one water source (i.e., water from the Water Diversion Project) was considered, and the other water sources, such as surface water, groundwater, and reclaimed water would be further considered to improve the applicability of the SIFCP-WRMS model [43,44]. Moreover, the flow of natural surface water is affected by a variety of factors from climate, topographic, and other aspects, thus, the stochastic programming should be integrated into the SIFCP-WRMS model [45,46,47,48].

Author Contributions

H.M. and D.L. conceived and designed the model; H.M. and Q.Z. performed the experiments; X.F. and L.H. contributed modelling calculation; L.Y. and Q.Z. analyzed the results; and D.L. and L.Y. wrote the paper.

Funding

This research was supported by the Natural Sciences Foundation of China (no. U1803241 and no. 51779230), and the Open Research Fund Program of Key Laboratory of High-efficient and Safe Utilization of Agriculture Water Resources (2019AA01).

Acknowledgments

The authors are grateful to the editors and the anonymous reviewers for their insightful comments and suggestions

Conflicts of Interest

The authors declare no conflict of interest.

Nomenclature

±The interval value with lower and upper bounds
Fuzzy sets
cCity, with c = 1 for Dengzhou City, 2 for Nanyang City, 3 for Pingdingshan City, 4 for Xuchang City, 5 for Luohe City, 6 for Zhoukou City, 7 for Zhengzhou City, 8 for Jiaozuo City, 9 for Xinxiang City, 10 for Hebi City, 11 for Huaxian County, 12 for Puyang City, 13 for Anyang City
tPlanning period, t = 1 is 2020, 2 is 2025, 3 is 2030
uDepartment, with u = 1 for urban life, 2 for industry, 3 for ecology and environment
f ± System benefits in planning periods (1012 RMB¥)
R c , u , t ± Benefit coefficient (RMB¥/m3)
C c , u , t ± Cost coefficient (RMB¥/m3)
W c , u , t ± The amount of water allocated to u users in s cities in planning period (106 m3)
T t ± The total amount of available water (106 m3)
D e m a n d c , 1 , t ± Water for urban life (106 m3)
α c , t ± The minimum proportion of ecology and environment water usage
P c , u , t ± The sewage discharge coefficient
S e w t ± The maximum sewage discharge (106 m3)
η t ± COD removal rate
C O D t ± The allocation total of COD (tonnes)
( β l b ) c , t ± The minimum proportion of industry water usage
( β u b ) c , t ± The maximum proportion of industry water usage

Abbreviations

AIArtificial intelligence
ANNsArtificial neural networks
CODChemical oxygen demand
DPDynamic programming
FCPFuzzy-confidence constraint programming
FPFuzzy programming
GAsGenetic algorithms
GWPGlobal water partnership
IHPInternational Center for Integrated Water resource management
ILPInteger linear programming
IPPInterval-parameters programming
IWRAInternational water resources association
LPLinear programming
MILPMixed integer linear programming
S1Scenario 1
S2Scenario 2
S3Scenario 3
S4Scenario 4
SAScenario analysis
SFCPScenario-based fuzzy-credibility constrained programming
SIFCPScenario-based interval fuzzy-credibility constrained programming
SNWDPSouth-to-North Water Diversion Project
TSMTwo-step method
WDPWater Diversion Project
WRMwater resource management
WRMSwater resource management system

References

  1. Zomorodian, M.; Lai, S.H.; Homayounfar, M.; Ibrahim, S.; Fatemi, S.E.; EI-Shafie, A. The state-of-the-art systems dynamics application in integrated water resources modeling. J. Environ. Manag. 2018, 227, 294–304. [Google Scholar] [CrossRef]
  2. Fleifle, A.; Saavedra, O.; Yoshimura, C.; Elzeir, M.; Tawfik, A. Optimization of integrated water quality management for agricultural efficiency and environmental conservation. Environ. Sci. Pollut. Res. 2014, 21, 8095–8111. [Google Scholar] [CrossRef] [PubMed]
  3. Wang, Y.Y.; Huang, G.H.; Wang, S.; Li, W.; Guan, P.B. A risk-based interactive multi-stage stochastic programming approach for water resources planning under dual uncertainties. Adv. Water Resour. 2016, 94, 217–230. [Google Scholar] [CrossRef]
  4. Habibi Davijani, M.; Banihabib, M.E.; Nadjafzadeh Anvar, A.; Hashemi, S.R. Optimization model for the allocation of water resources based on the maximization of employment in the agriculture and industry sectors. J. Hydrol. 2016, 533, 430–438. [Google Scholar] [CrossRef]
  5. Liu, J.; Li, Y.P.; Huang, G.H.; Fan, Y.R. A semi-infinite interval-stochastic risk management model for river water pollution control under uncertainty. Water 2017, 9, 351. [Google Scholar] [CrossRef]
  6. Watkins, D.W.; McKinney, D.C.; Lasdon, L.S.; Nielsen, S.S.; Martin, Q.W. A scenario-based stochastic programming model for water supplies from the highland lakes. Int. Trans. Oper. Res. 2000, 7, 211–230. [Google Scholar] [CrossRef]
  7. Singh, A.; Panda, S.N. Development and application of an optimization model for the maximization of net agricultural return. Agric. Water Manag. 2012, 115, 267–275. [Google Scholar] [CrossRef]
  8. Tu, Y.; Zhou, X.Y.; Gang, J.; Liechty, M.; Xu, J.P.; Lev, B. Administrative and market-based allocation mechanism for regional water resources planning. Resour. Conserv. Recycl. 2015, 95, 156–173. [Google Scholar] [CrossRef]
  9. Li, Y.Y.; Cui, Q.; Li, C.H.; Wang, X.; Cai, Y.P.; Cui, G.; Yang, Z.F. An improved multi-objective optimization model for supporting reservoir operation of china’s South-to-North Water Diversion Project. Sci. Total Environ. 2016, 575, 970–981. [Google Scholar] [CrossRef]
  10. Office of the South-to-North Water Diversion Project Construction Committee, State Council, PRC. The South-to-North Water Diversion Project. Engineering 2016, 2, 265–267. [Google Scholar] [CrossRef] [Green Version]
  11. Li, Y.P.; Huang, G.H.; Nie, S.L. An interval-parameter multi-stage stochastic programming model for water resource management under uncertainty. Adv. Water Resour. 2006, 29, 776–789. [Google Scholar] [CrossRef]
  12. Rad, S.; Gan, L.; Chen, X.; You, S.; Huang, L.; Su, S.; Taha, M.R. Sustainable Water Resources Using Corner Pivot Lateral, A Novel Sprinkler Irrigation System Layout for Small Scale Farms. Appl. Sci. 2018, 8, 2601. [Google Scholar] [CrossRef]
  13. Fu, Z.H.; Zhao, H.J.; Wang, H.; Lu, W.T.; Wang, J.; Guo, H.C. Integrated planning for regional development planning and water resource management under uncertainty: A case study of Xining, China. J. Hydrol. 2017, 554, 623–634. [Google Scholar] [CrossRef]
  14. Castelletti, A.; De-Rigo, D.; Rizzoli, A.E.; Soncini-Sessa, R.; Weber, E. Neuro-dynamic programming for designing water reservoir network management policies. Control Eng. Pract. 2007, 15, 1031–1038. [Google Scholar] [CrossRef]
  15. Bi, W.; Dandy, G.C.; Maier, H.R. Improved genetic algorithm optimization of water distribution system design by incorporating domain knowledge. Environ. Model. Softw. 2015, 69, 370–381. [Google Scholar] [CrossRef]
  16. Veintimilla-Reyes, J.; Cattrysse, D.; Meyer, A.D.; Orshoven, J.V. Mixed integer linear programming (MILP) approach to deal with spatio-temporal water allocation. Procedia Eng. 2016, 162, 221–229. [Google Scholar] [CrossRef]
  17. Abdulbaki, D.; Al-Hindi, M.; Yassinea, A.; Najmc, M.A. An optimization model for the allocation of water resources. J. Clean. Prod. 2017, 164, 994–1006. [Google Scholar] [CrossRef]
  18. Robert, M.; Bergez, J.E.; Thomas, A. A stochastic dynamic programming approach to analyze adaptation to climate change-application to groundwater irrigation in India. Eur. J. Oper. Res. 2018, 265, 1033–1045. [Google Scholar] [CrossRef]
  19. Li, C.C.; Cai, Y.P.; Qian, J.P. A multi-stage fuzzy stochastic programming method for water resource management with the consideration of ecological water demand. Ecol. Indic. 2018, 95, 930–938. [Google Scholar] [CrossRef]
  20. Du, P.; Li, Y.P.; Huang, G.H. Inexact chance-constrained waste-load allocation model for water quality management of Xiangxihe River. J. Environ. Eng. 2013, 139, 1178–1197. [Google Scholar] [CrossRef]
  21. Cai, W.; Lai, K.; Liu, C.; Wei, F.F.; Ma, M.; Jia, S.; Jiang, Z.; Lv, L. Promoting sustainability of manufacturing industry through the lean energy-saving and emission-reduction strategy. Sci. Total Environ. 2019, 665, 23–32. [Google Scholar] [CrossRef]
  22. Yu, L.; Li, Y.P. A flexible-possibilistic stochastic programming method for planning municipal-scale energy system through introducing renewable energies and electric vehicles. J. Clean. Prod. 2019, 207, 772–787. [Google Scholar] [CrossRef]
  23. Maqsood, I.; Huang, G.H.; Yeomans, J.S. An interval-parameter fuzzy two-stage stochastic program for water resource management under uncertainty. Eur. J. Oper. Res. 2005, 167, 208–225. [Google Scholar] [CrossRef]
  24. Li, X.M.; Lu, H.W.; Li, J.; Du, P.; Xu, M.; He, L. A modified fuzzy credibility constrained programming approach for agricultural water resource management—A case study in Urumqi, China. Agric. Water Manag. 2015, 156, 79–89. [Google Scholar] [CrossRef]
  25. Safavi, H.R.; Golmohammadi, M.H.; Sandoval-Solis, S. Expert knowledge based modeling for integrated water resources planning and management in the zayandehrud river basin. J. Hydrol. 2015, 528, 773–789. [Google Scholar] [CrossRef]
  26. Autovino, D.; Rallo, G.; Provenzano, G. Predicting soil and plant water status dynamic in olive orchards under different irrigation systems with Hydrus-2D: Model performance and scenario analysis. Agric. Water Manag. 2018, 203, 225–235. [Google Scholar] [CrossRef]
  27. Wu, C.B.; Huang, G.H.; Xin, B.G.; Chen, J.K. Scenario analysis of carbon emissions’ anti-driving effect on Qingdao’s energy structure adjustment with an optimization model, Part I: Carbon emissions peak value prediction. J. Clean. Prod. 2018, 172, 466–474. [Google Scholar] [CrossRef]
  28. Zhang, F.; Zhang, C.L.; Yan, Z.H.; Guo, S.S.; Wang, Y.Z.; Guo, P. An interval nonlinear multiobjective programming model with fuzzy-interval credibility constraint for crop monthly water allocation. Agric. Water Manag. 2018, 209, 123–133. [Google Scholar] [CrossRef]
  29. Yu, L.; Li, Y.P.; Huang, G.H. Planning municipal-scale mixed energy system for stimulating renewable energy under multiple uncertainties—The City of Qingdao in Shandong Province, China. Energy 2019, 166, 1120–1133. [Google Scholar] [CrossRef]
  30. Milan, S.G.; Roozbahani, A.; Banihabib, M.E. Fuzzy optimization model and fuzzy inference system for conjunctive use of surface and groundwater resources. J. Hydrol. 2018, 566, 421–434. [Google Scholar] [CrossRef]
  31. Zhang, J.L.; Li, Y.P.; Huang, G.H. A robust simulation-optimization modeling system for effluent trading—A case study of nonpoint source pollution control. Environ. Sci. Pollut. Res. 2014, 21, 5036–5053. [Google Scholar] [CrossRef]
  32. Li, Z.; Huang, G.; Zhang, Y.M.; Li, Y.P. Inexact two-stage stochastic credibility constrained programming for water quality management. Resour. Conserv. Recycl. 2013, 7, 122–132. [Google Scholar] [CrossRef]
  33. Zhang, Y.M.; Huang, G.H. Inexact credibility constrained programming for environmental system management. Resour. Conserv. Recycl. 2011, 55, 441–447. [Google Scholar] [CrossRef]
  34. Liu, B.D.; Iwamura, K. Chance constrained programming with fuzzy parameters. Fuzzy Sets Syst. 1998, 94, 227–237. [Google Scholar] [CrossRef]
  35. Huang, X.X. Credibility-based chance-constrained integer programming models for capital budgeting with fuzzy parameters. Inf. Sci. 2006, 176, 2698–2712. [Google Scholar] [CrossRef]
  36. Rong, A.; Lahdelma, R. Fuzzy chance constrained linear programming model for optimizing the scrap charge in steel production. Eur. J. Oper. Res. 2008, 186, 953–964. [Google Scholar] [CrossRef]
  37. Zhang, Y.; Huang, G.H. Fuzzy robust credibility-constrained programming for environmental management and planning. J. Air Waste Manag. Assoc. 2010, 60, 711–721. [Google Scholar] [CrossRef] [PubMed]
  38. Wang, X.; Huang, G.H. Violation analysis on two-step method for interval linear programming. Inf. Sci. 2014, 281, 85–96. [Google Scholar] [CrossRef]
  39. Huang, G.H.; Baetz, B.W.; Patry, G.G. A grey linear programming approach for municipal solid waste management planning under uncertainty. Civ. Eng. Syst. 1992, 9, 319–335. [Google Scholar] [CrossRef]
  40. Ministry of Housing and Urban-Rural Development of the People’s Republic of China. Code for Urban Wastewater and Stormwater Engineering Planning GB50318-2017 (CUWSEP), 2017; China Building Industry Press: Beijing, China, 2017.
  41. Statistics Bureau of Henan Municipality (SBHM). Statistical Yearbook of Henan Province (SYH), 2016; Statistics Bureau of Henan Municipality: Zhengzhou, China, 2017.
  42. Water Resources Department of Henan Province. Water Resources Bulletin of Henan Province (WRBH), 2016; Water Resources Department of Henan Province: Zhengzhou, China, 2017.
  43. Fu, Q.; Li, L.Q.; Li, M.; Li, T.X.; Liu, D.; Song, C. A simulation-based linear fractional programming model for adaptable water allocation planning in the main stream of the Songhua River Basin, China. Water 2018, 10, 627. [Google Scholar] [CrossRef]
  44. Zhang, S.H.; Yang, J.S.; Wan, Z.Y.; Yi, Y.J. Multi-water source joint scheduling model using a refined water supply network: Case study of Tianjin. Water 2018, 10, 1580. [Google Scholar] [CrossRef]
  45. Li, Z.; Huang, G.H.; Wang, X.Q.; Han, J.C.; Fan, Y.R. Impacts of future climate change on river discharge based on hydrological inference: A case study of the Grand River Watershed in Ontario, Canada. Sci. Total Environ. 2016, 548, 198–210. [Google Scholar] [CrossRef]
  46. Wang, K.; Li, L.; Lan, Y.; Dong, P.; Xia, G. Application Research of Chaotic Carrier Frequency Modulation Technology in Two-Stage Matrix Converter. Math. Probl. Eng. 2019, 2019, 2614327. [Google Scholar] [CrossRef]
  47. Liu, J.; Li, Y.P.; Huang, G.H.; Fu, H.Y.; Zhang, J.L.; Cheng, G.H. Identification of water quality management policy of watershed system with multiple uncertain interactions using a multi-level-factorial risk-inference-based possibilistic-probabilistic programming approach. Environ. Sci. Pollut. Res. 2017, 24, 14980–15000. [Google Scholar] [CrossRef]
  48. Cai, W.; Liu, C.; Zhang, C.; Ma, M.; Rao, W.; Li, W.; He, K.; Gao, M. Developing the ecological compensation criterion of industrial solid waste based on emergy for sustainable development. Energy 2018, 157, 940–948. [Google Scholar] [CrossRef]
Figure 1. Formulation of the SIFCP-WRMS model.
Processes 07 00312 g001
Figure 2. The solution process of SIFCP-WRMS model.
Processes 07 00312 g002
Figure 3. Study area.
Processes 07 00312 g003
Figure 4. Allocated water under different scenarios in different departments and different periods (106 m3). Note: S1, Scenario 1; S2, Scenario 2; S3, Scenario 3; S4, Scenario 4; t1, period 1; t2, period 2; t3, period 3; 1, Dengzhou City; 2, Nanyang City; 3, Pingdingshan City; 4, Xuchang City; 5, Luohe City; 6, Zhoukou City; 7, Zhengzhou City; 8, Jiaozuo City; 9, Xinxiang City; 10, Hebi City; 11, Huaxian County; 12, Puyang City; 13, Anyang City.
Processes 07 00312 g004
Figure 5. Water distribution proportions under different scenarios in different departments (%). Note: S1, Scenario 1; S2, Scenario 2; S3, Scenario 3; S4, Scenario 4; 1, Dengzhou City; 2, NanyangCity; 3, Pingdingshan City; 4, Xuchang City; 5, Luohe City; 6, Zhoukou City; 7, Zhengzhou City; 8, Jiaozuo City; 9, Xinxiang City; 10, Hebi City; 11, Huaxian County; 12, Puyang City; 13, Anyang City.
Processes 07 00312 g005
Figure 6. Amounts of sewage discharge under different scenarios in different departments and different periods (106 m3). Note: S1, Scenario 1; S2, Scenario 2; S3, Scenario 3; S4, Scenario 4; t1, period 1; t2, period2; t3, period3; 1, Dengzhou City; 2, Nanyang City; 3, Pingdingshan City; 4, Xuchang City; 5, Luohe City; 6, Zhoukou City; 7, Zhengzhou City; 8, Jiaozuo City; 9, Xinxiang City; 10, Hebi City; 11, Huaxian County; 12, Puyang City; 13, Anyang City.
Processes 07 00312 g006
Figure 7. Amounts of COD emission under different scenarios in different departments and different. periods (103 tonnes). Note: S1, Scenario 1; S2, Scenario 2; S3, Scenario 3; S4, Scenario 4; t1, period 1; t2,period2; t3, period3; 1, Dengzhou City; 2, Nanyang City; 3, Pingdingshan City; 4, Xuchang City; 5, Luohe City; 6, Zhoukou City; 7, Zhengzhou City; 8, Jiaozuo City; 9, Xinxiang City; 10, Hebi City; 11, Huaxian County; 12, Puyang City; 13, Anyang City.
Processes 07 00312 g007
Figure 8. COD emission proportions under different scenarios in different departments (%). Note: S1, Scenario 1; S2, Scenario 2; S3, Scenario 3; S4, Scenario 4; 1, Dengzhou City; 2, Nanyang City; 3, Pingdingshan City; 4, Xuchang City; 5, Luohe City; 6, Zhoukou City; 7, Zhengzhou City; 8, Jiaozuo City; 9, Xinxiang City; 10, Hebi City; 11, Huaxian County; 12, Puyang City; 13, Anyang City.
Processes 07 00312 g008
Figure 9. System benefits under different λ levels and scenarios (1012 RMB¥). Note: λ = 1, 0.9, 0.8, 0.7; S1, Scenario 1; S2, Scenario 2; S3, Scenario 3; S4, Scenario 4.
Processes 07 00312 g009
Figure 10. Water allocation, COD emission, and sewage discharge under different λ levels in S1. Note: λ = 1, 0.9, 0.8, 0.7; S1, Scenario 1; 1, Dengzhou City; 2, Nanyang City; 3, Pingdingshan City; 4, Xuchang City; 5, Luohe City; 6, Zhoukou City; 7, Zhengzhou City; 8, Jiaozuo City; 9, Xinxiang City; 10, Hebi City; 11, Huaxian County; 12, Puyang City; 13, Anyang City.
Processes 07 00312 g010
Table 1. Water supply pattern in each water-receiving city in 2014–2016 (106 m3).
Water-Receiving Area201420152016
Dengzhou0.5007.54318.237
Nanyang5.69140.19757.249
Pingdingshan56.66819.39026.324
Xuchang46.07663.85178.539
Louhe7.58656.06953.477
Zhouko0.0000.14015.599
Zhengzhou180.486355.238438.467
Jiaozuo4.016511.31814.347
Xinxiang29.83395.082109.501
Hebi17.12736.70950.334
Huaxian0.0000.0309.902
Puyang15.64546.96971.246
Anyang0.0005.32230.134
Total363.630737.859973.355
Table 2. Water supply pattern in each water-receiving city under different departments by 2016 (106 m3).
Water-Receiving AreaWater from SNWDPWater for Urban LifeWater for IndustryWater for Ecology and Environment
Dengzhou18.2377.1704.9636.105
Nanyang57.24919.67733.7123.859
Pingdingshan26.3245.97719.8740.472
Xuchang78.53915.52647.88515.127
Louhe53.47714.47332.9386.065
Zhouko15.59910.6754.6470.277
Zhengzhou438.467222.954169.9083.417
Jiaozuo14.3473.7419.1361.470
Xinxiang109.50155.82153.6800.000
Hebi50.33421.65923.9134.762
Huaxian9.9028.7711.1310.000
Puyang71.24625.08642.7793.381
Anyang30.1348.93112.4708.732
Total973.355420.461457.03653.669

