1. Introduction
The growing demand of social development and energy consumption raises the request for energies. Although fossil fuel remains the world’s primary energy source, the CO
2 emission during its combustion process has been boosting the global warming effect. Therefore, biomass, as an alternative renewable energy source, has been considered as a potential solution for energy supply, all attributed to its advantages on low carbon footprint and closed-loop carbon cycles [
1].
Biomass is usually liquified to pyrolytic oil for further treatment and utilization. Pyrolytic oil could be produced from various sources [
2], such as wood waste, energy crops or other organic materials. The production process of pyrolytic oil is heating biomass under anaerobic condition with temperatures above 500 °C [
3]; the liquefied oil from that process normally contains oxygen, resulting in non-volatility, corrosiveness, immiscibility and thermal instability [
4,
5,
6]. Therefore, upgrading processes for pyrolytic oil are required for environmental-friendly utilization.
Hydrotreatment is one of the most efficient methods to modify the molecular structure of pyrolytic oil [
7,
8]. Through hydro-processing, impurities such as sulfur, oxygen and nitrogen could be removed [
9]; proper hydrotreatment could also make pyrolytic oil lighter by converting heavy components, such as tars and heavy non-volatiles, into lighter oil cuts, to raise the quality of oils and enable them to be utilized as chemical materials [
10]. Hydrogen is one of the key reactants in the hydrotreatment process, most of which was produced through reforming in a plant [
11]. Steam methane reforming (SMR) is the most widely used hydrogen production method due to the environmental-friendly production process. Two reaction steps are required by the SMR process, which are reforming and water–gas-shift (WGS); a gas separation system followed the latter reaction step to store CO
2 and purify hydrogen through pressure swing adsorption (PSA) [
12]. The conventional process schematic was shown in
Figure 1a. Although PSA could produce hydrogen with >99mol% purity, the high operational cost of it limits the application [
13]. Conventional hydro-processing reactors require a hydrogen stream with 80mol%–95mol% purity to sustain the upgrading process of pyrolytic oil, and thus the PSA separation unit may not be adequate for such process. In addition, the water, CO and CO
2 are generated in pyrolytic oil upgrading reactions as byproducts, which could contribute to hydrogen production through an in-situ WGS reaction; therefore it is feasible to employ syngas (a raw product output from SMR reactor) as a hydrogen supplier for the pyrolytic oil hydrotreating (HT) process.
The application of syngas HT was investigated by Fu et al. [
14] and the results showed promising potentials. They employed syngas to hydrotreat the liquefied coal, and the conversion was similar to pure hydrogen; they suggested that the water content showed significant impacts on the performance, which could reduce hydrogen consumption by an in-situ WGS reaction. However, there are still several issues that await further solutions for the process. Biomass-derived pyrolytic oil has various properties over a long time duration [
15], and therefore the syngas composition may not suit all HT processes; the cost-sensitive nature of pyrolytic oil requires high efficiency on production and low capital expense (CAPEX) and operation expense (OPEX) to compensate the cost on feedstock [
16]. Therefore, intensive research efforts on new process designs and optimizations are required to promote the application of the pyrolytic oil HT process [
17]. Hydrogen takes about 90% of the total OPEX, the production and recovery of which determine the profit of whole process; therefore, the hydrogen production and recovery system deserve a thorough optimization for the pyrolytic oil upgrading process. The economic issues would be the primary concern for the HT process, and employing syngas as the hydrogen source could be an alternative solution. Nonetheless, the feasibility of hydrotreatment with syngas enables it to consider omitting the WGS reactor to simplify the process design, but the demands of the plant on high-purity hydrogen (>99mol%) accompanying it would be an obstruction for the application.
In this study, an integrated steam methane reforming-hydrotreating (SMR-HT) pyrolytic oil upgrading process enhanced by membrane gas separation system was proposed and optimized to improve the upgrading efficiency, and the design schematic of the process is shown in
Figure 1b. The syngas was produced by SMR reactor and purified by membrane gas separation unit subsequently; the sweetened syngas was applied to hydrotreat the pyrolytic oil feedstock in a packed-bed reactor, in which the oil was upgraded with presence of an in-situ WGS reaction; the flash gases were further recovered and purified to produce high-purity hydrogen, which improved the process efficiency by mutual production of pure hydrogen and upgraded oil. An axial-dispersion model with five-lump reaction kinetics and a WGS reaction was proposed to model the packed-bed pyrolytic oil HT reactor; through which the process was simulated and optimized in the commercial simulator. This study provided an alternative process design for the pyrolytic oil upgrading process; through the model-based process optimizations, the proposed theoretical framework could also provide guidance on future applications of pyrolytic oil upgrading processes.
3. Process Design
3.1. Data Communication between Proposed Model and Aspen HYSYS
The Aspen HYSYS has various inbuilt equipment models for chemical industry, which could handle casual simulations. However, the commercial simulator lacks models for newly developed unit operations. In Aspen HYSYS, the default membrane gas separation unit is supplied as an example for user-defined extension, in which a pressure drop in the permeate side of the membrane module could not be calculated, causing up to 40% of deviations on predicted results. Additionally, the inbuilt PFR module has poor performance on complex reaction networks and convergence, which usually takes several minutes to reach convergence; it also has high dependency on initial values, which causes serious convergence problems during the simulation process.
To improve the calculation efficiency and accuracy of the proposed SMR-HT process, this study developed several self-defined extensions for Aspen HYSYS. By communicating with Aspen HYSYS through the COM object in Windows, the data calculated in the Python script in this model could be transferred to Aspen HYSYS [
28]. The membrane process was coded and compiled in Visual Basic (VB); by registering the DLL (Dynamic Link Library) file in Aspen HYSYS [
29], the simulator could directly calculate the membrane unit with the proposed algorithm. The calculation procedure was coded into a Python script; by performing a programed automation routine, the process in Aspen HYSYS was calculated until convergence. The schematic of the simulation procedure was shown in
Figure 3.
3.2. Conceptual Design of Hydrogen Production and Pyrolysis Upgrading Process
Hydrogen is usually produced by SMR in a chemical plant or refineries. A typical SMR process includes natural gas steam reformer, water–gas-shifter and gas purification system (PSA or membrane); the latter system is to remove the CH4, CO2 and CO content from the raw syngas. In the pyrolytic oil upgrading process, the oxygen and water content will form CO and CO2, which are also the major byproduct in the syngas. Therefore, there is no need for the gas purification system to remove CO, which enables the system to employ a less expensive unit for gas purification.
Several studies have investigated the feasibility of employing syngas as a hydrogen supplier for the upgrading process. It has been proved in the experiments that the upgrading performance of the pyrolytic oil was almost the same when the partial pressure of hydrogen was similar; some studies proposed that the in-situ reaction of the WGS could promote the upgrading reactions. The results of [
30] showed that under the same initial conditions (hydrogen partial pressure), the conversion of the upgrading process was higher in the batch reactor than in continuous flow reactor, proving the impacts of in-situ WGS reactions.
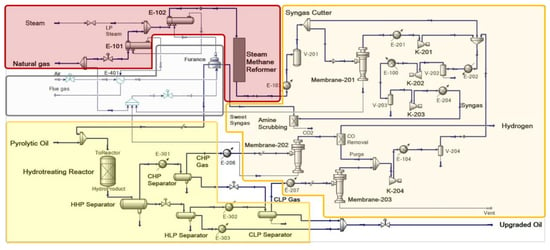
On the basis of that research, this study proposed a novel pyrolytic oil upgrading process with integrated system of a steam methane reformer, gas separation system and HT reaction system. The proposed process utilized a steam methane reformer to produce syngas without a WGS reactor; the hydrogen concentration in the syngas was adjusted by gas separation system, in which the flash gases of the hydrotreating reactor were also purified to produce pure hydrogen as byproduct; the syngas was input into the packed-bed hydrotreating reactor along with pyrolytic oil, and the flashed gases were treated by several steps for hydrogen recovery. The process design is shown in the flow diagram in
Figure 4. Noting that the feed flow rate of natural gas was set at a constant of 34.1 × 10
3 Nm
3/h, under this configuration, the conversion and hydrogen production could be compared and evaluated properly.
The gas separation system in the proposed process was composed by two major parts. The syngas cutter cut part of the stream to a membrane unit (membrane-201), which could adjust the hydrogen concentration by changing membrane area; the residue of membrane-201 was injected into the furnace to recover heat. Another key part for the gas separation system was the flash gas separator (membrane-202), which recovered the hydrogen in the cold high-pressure gas (CHP Gas); with an optional CO removal unit, the permeate from membrane-202 could be transferred to other unit as pure hydrogen product.
The proposed process utilized the CO component in the syngas to induce an in-situ WGS reaction in the hydrotreating reactor, and integrated the pyrolytic oil upgrading process with SMR and gas separation system, which improved the integrity of the plant by merging unit operations, and raised the synthetic utilization of hydrogen and other utilities. The mutual contribution of those aspects would reduce operational expense (OPEX) and capital expense (CAPEX).
4. Discussion
4.1. Reactor Sizing
The core equipment of the pyrolytic oil upgrading process was the hydrotreating reactor. The space velocity of the packed-bed reactor directly determined the performance, which is also the key parameter for scale-up designs of industrial reactors. The impacts of the reactor size on space velocity are shown in the Supporting Information (
Figure S1). When the reactor diameter was 3–5 m, and the bed height was higher than 30 m, the space velocity was 0.1–2 h
−1, which could satisfy the requirements of a normal HT process.
The performance of the pyrolytic oil upgrading process could be monitored by the conversion of the heavy distillate components.
Figure 5 shows the impacts of reactor size on conversion. It could be observed that when the bed length was higher than 80 m and diameter greater than 5 m, the conversion of pyrolytic oil could reach 80% and more. However, higher conversion implied higher risk of a coking problem, and two reactors in series would be required to reach the space velocity, which would increase the CAPEX; the coking problem would induce coke formation and blockage in catalyst pores, causing serious engineering problems. Therefore, choosing an intermediate reactor size would be more suitable for the upgrading process.
Another important aspect of the HT process was the hydrogen consumption. Normally, higher conversion of pyrolytic oil leads to higher hydrogen consumption.
Figure 6 shows that the space velocity affected the hydrogen consumption greatly (noting that the hydrogen consumption was calculated by weight ratio with respect to the mass flow rate of pyrolytic oil); with increasing reactor size, the hydrogen consumption increased. The cost of hydrogen usually takes 90%–95% of the operational cost.
Considering the counterbalance demonstrated in
Figure 3,
Figure 4 and
Figure 5, a reactor with 40 m height and 3 m diameter was chosen as the basis for further simulations to balance the trade-off between reactor size and upgrading performance.
4.2. Effects of Operating Temperature on Pyrolysis Upgrading
The operating temperature of the reactor is crucial for the upgrading process.
Figure 7 shows the impacts of operating temperature on the product distribution and the WGS reaction equilibrium constant. It could be observed from the figure that the conversion increased with increasing temperature, along with higher yield of the aromatics lump. Because the WGS reaction is exothermic, higher operating temperatures depressed the reaction equilibrium, and hence reduced the reaction equilibrium constant.
Besides the impacts on yields, a higher operating temperature would produce more coke; although in this study the reaction kinetics did not present much coke or gas formation, the uncertainty of it would be a major consideration for a realistic process. Considering all the impacts of operating temperature, a moderate temperature of 380 °C was selected as the base case for further investigation.
4.3. Impacts of the Gas Separation System
The gas separation and purification system were the central functional subsystem for the SMR-HT integration process. The gas separation system was composed of three membrane modules. Membrane-201 was employed to enrich the hydrogen in raw syngas; membrane-202 was employed to purify the cold high-pressure flash gas; and membrane-203 was to recover hydrogen from cold low-pressure flash gas. Despite of the impacts of membrane areas, the ratio of syngas cutter was also a determinate factor for the upgrading performance. The mole fraction of hydrogen in the syngas determined the hydrogen partial pressure in the reaction system, and hence determined the reaction process. Therefore, the separation performance of the gases would also provide influences on conversion and hydrogen consumption.
The effects of membrane areas on the syngas hydrogen mole fraction is shown in
Figure 8a,b; in which it demonstrated that a lower membrane area in membrane-202 would provide higher hydrogen concentration in the syngas.
Figure 8a shows that, the syngas concentration became more sensitive at a higher ratio of syngas cutter. Although the membrane-202 unit did not process syngas directly, its residue was purged into the gas separation system, affecting the syngas concentration indirectly. Comparing
Figure 8a,b, when the membrane area of membrane-202 was raised, the hydrogen concentration decreased, implying higher hydrogen recovery.
The influences of membrane area and syngas cut ratio on conversion are shown in
Figure 9a,b. Lower membrane area for membrane-201 and higher cut ratio would significantly reduce the flow rate of raw syngas, which would cease the hydrogenation reactions due to a shortage of reactant (hydrogen). When the membrane area (membrane-201) reached 4000 m
2, and the cut ratio was lower than 0.5, the conversion could reach 0.60. Comparing
Figure 9a,b, the increment of membrane area in membrane-202 had little influence on the pyrolytic oil conversion. This was caused by the excess hydrogen in the reaction system. When membrane area and cut ratio were adequate, the reaction progress would be dependent only on hydrogen concentration (partial pressure) at the same temperature.
The impacts of membrane areas on hydrogen consumption are demonstrated in
Figure 10a,b, in which it could be observed that with the increasing membrane area in membrane-201, the hydrogen consumption increased. Comparing
Figure 10a and
Figure 6, it could be deduced that under the same conversion (60% for example), the process configurations with a gas separation system consumed much less hydrogen than simply reducing space velocity (raising reactor diameter and length). This was because of the higher concentration of hydrogen in the syngas raised the partial pressure and boosted the HT reactions, and therefore enable the reaction system to achieve higher conversion with lower hydrogen consumption. Comparing
Figure 10a,b, the membrane area of membrane-202 still had little impact on the hydrogen consumption, which was similar to previous discussions (
Figure 8 and
Figure 9).
Although the impacts of the membrane area in membrane-202 were at a minimum for the reactions, it determined the flow rate of hydrogen product directly. The gas byproducts of the process were mainly hydrocarbons, CO and CO2. The membrane unit could reject most CO and hydrocarbons in the residue (as fuel gas for the furnace); with a traditional amine scrubbing or adsorption method, the acid gases, such as CO2, could be removed, and then produce hydrogen with >99.0 mol% purity.
The influences of membrane areas on the flow rate of hydrogen product are shown in
Figure 11. When cut ratio was low, increasing the membrane area of membrane-202 had significant positive impact on hydrogen flow rate; when the ratio reached 0.4–0.5, doubling the membrane area of membrane-202 could only provide a little increase in hydrogen flow rate. It is worth noting that when the membrane area of membrane-201 was about 5000 m
2, the impacts of cut ratio became minimal. From
Figure 11 we could find the process configuration which could maximize hydrogen production (0.2–0.3 cut ratio, and 5000/10,000 m
2 membrane area for membrane-201/202). Membrane-203 has little impact on separation and reaction because of its small capacity, and the influences are demonstrated in the Supporting Information (
Figure S2).
4.4. Effects of Water Content in Pyrolytic oil
The pyrolytic oil usually contains water content; literatures have reported that the water content could reach 0 wt%–20 wt% in typical pyrolytic oil [
31,
32,
33]. The water could be utilized as a reactant for the WGS reaction, producing in-situ generated hydrogen which could promote the HT reaction.
This study investigated the effects of water content on pyrolytic oil upgrading. The range that was investigated in this study was 0 wt%–15 wt%, and the kinetics for the water–gas-shift reaction was discussed in
Section 2.1. The contributions of the WGS reaction converts CO and water into hydrogen and CO
2. The effects are shown in
Figure 12; it could be observed that with the increasing water content in the pyrolytic oil, the H
2O/CO ratio (molar) at the reactor inlet gradual increased; when water content reached 15 wt%, the H
2O/CO ratio was 2.0; according to the stoichiometry of the WGS reaction, the water for the shift reaction would be in excess.
Although excess water could promote the WGS reaction, it could also dilute the reactant oil, and hence reduce the conversion.
Figure 13 investigated the impacts of water content on conversion and hydrogen consumption; from which it could be observed that with the increasing water content, the conversion gradually decreased, while the hydrogen consumption was decreased by 0.05 percent (with respect to flow rate of pyrolytic oil), which was about 5950 kg/h. The reduced hydrogen consumption would save about 12,000
$/h, and the lower conversion might only cause 200–500
$/h reduction in profit. The WGS reaction could also consume CO, which would benefit the purification process downstream. On the basis of the discussion, it could be concluded that moderate content of water that existed in the pyrolytic oil could reduce hydrogen consumption by promoting the WGS reaction, and hence reduce CO content and OPEX for hydrogen production.
4.5. Techno-Economic Assessment
The evaluations of economics were carried out based on the results of previous sections. When the cut ratio of syngas cutter was 0.4, the upgrading process could achieve higher conversion and hydrogen production.
Figure 14 showed the impacts of the cut ratio on the CAPEX of the membrane and compressor (in which the cost was estimated by hourly depreciation rate; only membrane and compressor CAPEX were compared since the two are the major variables for the investment in
Figure 14). The CAPEX of the membrane, compressor, reactor, and other key equipment are shown in the
Appendix A.
In
Figure 14, the configuration of 0.4 cut ratio and 5000/10,000 m
2 membrane area (for membrane-201/202 respectively) could provide the highest hydrogen sale; however, the CAPEX for that configuration was significantly higher than others. When the membrane area was reduced to 5000/5000 m
2 with 0.4 cut ratio, the CAPEX was reduced by 32.0%, while the product sale of hydrogen was only reduced by 2.7%. Considering the almost-identical conversion of the two configurations, the optimal configuration of the proposed SMR-HT process should be 5000/5000/500 m
2 for membrane-201/202/203 with 0.4 ratio for syngas cutter.
The evaluations of the inlet/outlet throughput and utility consumptions are listed in
Table 5 (mass balance of the SMR-HT process is presented in the Supporting Information,
Table S1). It could be found that the process consumed significant amount of cooling water, which implies that the heat exchanging network still required further optimization. Nonetheless,
Table 5 shows that the proposed integrated SMR-HT process could upgrade pyrolytic oil with high conversion and operational flexibility, while producing hydrogen as a byproduct with low expense; the comprehensive utilization of hydrogen in the proposed process achieved a high hydrogen recovery of 95.6 %, which demonstrated the efficiency of the designed system (reactor size: 5 m diameter and 40m length; membrane area: 5000/5000/500 m
2 for membrane-201/202/203; ratio for syngas cutter: 0.4).
A conventional SMR plant contains main equipment including a furnace, SMR reactor, WGS reactor, and a separation system (PSA). In the proposed SMR-HT process, the WGS reactor and pressure swing adsorption were substituted by a membrane gas separation system, which could reduce the equipment CAPEX by 30.2%; although the membrane system required intensive compression power, which increased the equipment cost of SMR-HT process by 46.2%, as
Table 6 presents.
However, higher equipment investment of the SMR-HT process contributed to higher conversion and less consumption. In the comparisons of feedstock and product sale sections of
Table 6, it could be concluded that the SMR-HT process not only reduced additional fuel gas (natural gas) for heat balance, the high conversion also contributed greatly on product sale. When equipment depreciation cost was considered, the net profit showed that the SMR-HT process could provide 70.0% higher hourly profit than the conventional process. Note that the membrane unit was calculated by an excessively high price (1000
$/m
2); while in other studies, the membrane unit usually possessed low price as 50–500
$/m
2 [
34,
35]. The purpose of the high price in this study was to counterbalance the possibility of overestimation: Housing, pipes, unscheduled shutdown of compressors. The high price could compensate for those factors to some extent and provide reasonable results for comparisons. In the research of Ohs et al. [
36], it indicated that the housing of membrane material took the major part of the investment, which implies that after four years of usage, the replacement of membrane material would cost much less, giving advantages for the proposed SMR-HT process.
5. Conclusions
In this study, the integrated process of steam methane reforming and pyrolytic oil upgrading process enhanced by a gas separation system was proposed conceptually. The integrated process substituted the WGS reactor with a membrane gas separation unit, allowing the system to adjust hydrogen concentration in the syngas; the pyrolytic oil was hydrotreated by syngas, which reduced the OPEX on hydrogen consumption. A synthesis gas recovery system was designed to recover hydrogen from the flash gases, which could improve the utilization of hydrogen and further produce pure hydrogen as product.
A simulation framework was developed to model the hydrotreater and membrane module. The hydrotreater was modeled by an axial-dispersion model; five-lump reaction kinetics were employed to simulate the upgrading process of the pyrolytic oil. The proposed framework provided data communications between self-defined algorithm and commercial simulator Aspen HYSYS, enabling the simulator to solve complex reaction kinetics and optimize the process in a more efficient way.
The optimizations of the proposed process aided it to achieve 63.7% conversion with 2.0 wt% hydrogen consumption and 95.6% hydrogen recovery. The effects of water content was investigated, and the results showed that moderate water content could promote the in-situ WGS reaction, and improve the hydrogen production with slight reduction in conversion. The proposed integrated process enabled the upgrading process to achieve higher performance with simplified design and flexible operating. The results demonstrated that the proposed integrated process could upgrade pyrolytic oil and produce hydrogen synthetically, providing 70% higher net profit than the conventional process.


