Abstract
Membrane techniques constitute an interesting alternative to conventional activated sludge systems (CAS). In membrane bioreactors (MBR), the biomass separated on membranes is retained independently of sludge sedimentation properties. As a consequence, a high biomass concentration as well as low food to microorganisms ratio can be obtained. Moreover, the development of a characteristic activated sludge population is stimulated by the specific conditions prevailing in MBRs. In the study, the operation and treatment efficiency of the MBR and CAS processes were examined and compared. Simulation was performed with the use of GPS-X software. The effluent quality obtained for the MBR system was either better or comparable to that of CAS. The most significant difference concerned the elimination of total suspended solids, which amounted to 99.8% in the MBR. Regarding nutrients, a low concentration of total phosphorus in the effluent from CAS and MBR was obtained (0.67 gP m−3 and 0.50 gP m−3, respectively). Greater differences were achieved in the case of total nitrogen. Although almost complete nitrification took place in both systems, a lower concentration of nitrate in the effluent from MBR in comparison to CAS, i.e., 11.2 gN m−3 and 14.1 gN m−3, respectively, allowed us to obtain a higher removal of total nitrogen (80.8% and 76.1%, respectively).
1. Introduction
Municipal wastewater is usually treated by a process that includes primary sedimentation and an activated sludge method based on a treatment system comprising of an aeration tank (bioreactor) followed by a secondary clarifier. The efficiency of this process mainly depends on the condition of the activated sludge and the appropriate operation of the secondary clarifier [1]. Wastewater treatment plants temporarily or permanently face difficulties regarding maintaining the required sludge age, dealing with a decrease in nitrification efficiency, sludge swelling, its flotation, a decrease in the effectiveness of sewage sludge thickening, and dewatering. Furthermore, an increase in the amount of wastewater and seasonal irregularity due to the development of tourist infrastructure as well as the expansion of the sewage system can cause overloading of wastewater treatment plants [2]. Additionally, with the implementation of more stringent quality requirements for wastewater discharged to receivers, conventional activated sludge process (CAS)—with its limitations—is often insufficient at removing some contaminants, thus, modernization or expansion of the system becomes necessary. On the other hand, efficient wastewater treatment without the above-mentioned problems occurring in classical systems is possible in membrane bioreactors (MBR) [1,3].
In MBR technology, the separation of solids is conducted without the need of secondary sedimentation in clarifiers. Instead, this process is performed by a membrane capable of retaining the particulate phase within the reactor and allowing the clarified effluent to be discharged to the receiver or be reused [4]. Due to an effective membrane pore size of <0.1 µm, which is considerably smaller than pathogenic viruses, bacteria, and protozoa, MBRs produce clarified and largely disinfected permeate of high quality [5] with the reported removal of COD, BOD, and total suspended solids (TSS) of 95%, 98%, and 99%, respectively [6]. In CAS, an appropriately long hydraulic retention time (HRT) is required for the growth of the flocs (mixed liquor solid particles) to a sufficient size (>50 µm) to allow their efficient separation by sedimentation. In an MBR, the particles only need to be larger than the pore size of the membrane, which ensures direct control over the solids retention time (SRT) and HRT [5]. The long SRT in the MBR improves the conditions for the development of slowly growing bacteria capable of removing hardly biodegradable compounds such as pesticides, hormones, or pharmaceuticals [2,7]. Moreover, it allows operating at higher concentrations of mixed liquor suspended solids (MLSS), which enables a reduction in the required reactor size [5,6].
A thorough understanding as well as optimization of MBR, which is a relatively complex system, is difficult and time-consuming. An alternative resides in mathematical modeling [8]. Modeling enables the development of the basis of the designed processes and upscales them from the laboratory scale to a full-scale system. Moreover, it can be used for analyzing the performance and effectiveness of the process under various operating conditions, thus shortening it and minimizing costs [9]. The MBR model is a tool for teaching, design assistance, research, process optimization, and troubleshooting at full-scale treatment plants. Models can be used to predict the system response to the appearance of disturbances as well as visualize the effects of configuration changes on the system performance without actually interfering with the system. Nowadays, mathematical modeling of MBR is considered to be an inherent part of the process of designing and managing real objects [10,11,12].
Activated sludge models (ASM) have been developed and applied to describe wastewater treatment processes under typical operating conditions [8,13,14]. Due to the fact that MBRs are based on the activated sludge process, ASM models have been transferred to simulate kinetics in such systems, assuming that necessary adaptations are provided [13]. Under typical MBR conditions (high SRT, increased MLSS), the model needs changes in oxygen transfer and uptake, while due to a different microbiological composition, the model requires careful calibration of stoichiometric and kinetic parameters [15]. Furthermore, the formation and degradation kinetics of the main MBR foulants like soluble microbial products (SMPs) and extracellular polymeric substances (EPS) have been investigated using the ASM models [16].
In addition to biological models that simulate biological organic degradation, another approach to MBR modeling focuses on physical models, which mainly deal with membrane resistance variations due to fouling [17,18]. However, the complexity of the fouling phenomenon, the lack of agreement on a specific fouling indicator, and the impact of biological processes increase the difficulty of modeling the filtration process. Thus, integrated (hybrid) models have been proposed for a comprehensive description of the MBR process, which combine biomass kinetic models with membrane fouling models [16,17,18,19,20,21,22,23]. The latter enable better modeling of the involved processes as they take into account not only the physical, but the biological phenomena, and the interactions between them [17].
Nowadays, many modeling problems are solved by computer programs dedicated to specific engineering tasks. For this purpose, industry-specific support software including special simulation programs, so-called dedicated simulators, is used increasingly often [24]. One such wastewater treatment simulation software packages is GPS-X, which was developed by Hydromantis Environmental Software Solutions from Canada. The program enables modeling advanced technological schemes and conducting both steady-state and dynamic simulations. The MBR model implemented in GPS-X calculates the removal of solids by means of membrane using a mass balance and the solids capture rate [25].
In recent years, several studies have compared the MBR process to the CAS with respect to the same influent wastewater. Gao et al. [26] found that a submerged MBR had smaller particles of sediment, contained more nitrifiers, and was characterized by more effective and stable nitrification than a reference CAS system. Jiang et al. [27] reported that MBR biomass demonstrated a greater affinity for oxygen, which was related to smaller sludge flocs compared with CAS. Gonzalez et al. [28] obtained a higher removal efficiency of COD, TSS, and NH4-N concentration as well as various surfactants in MBR in comparison to the CAS system, regardless of the quality of the wastewater influent. Bertanza et al. [29] applied a holistic assessment procedure for comparing the technical, social, administrative, economic, and environmental impacts of MBR and CAS processes.
Taking into account the differences in MBR and CAS systems, various modeling approaches can be employed. More modeling studies for alternative MBR systems allow important relationships to be noticed and may contribute to standardization guidelines for MBR modeling. The aim of this study was to examine and compare the operation and treatment efficiency of the MBR and CAS processes. Simulations were carried out using GPS-X software.
2. Materials and Methods
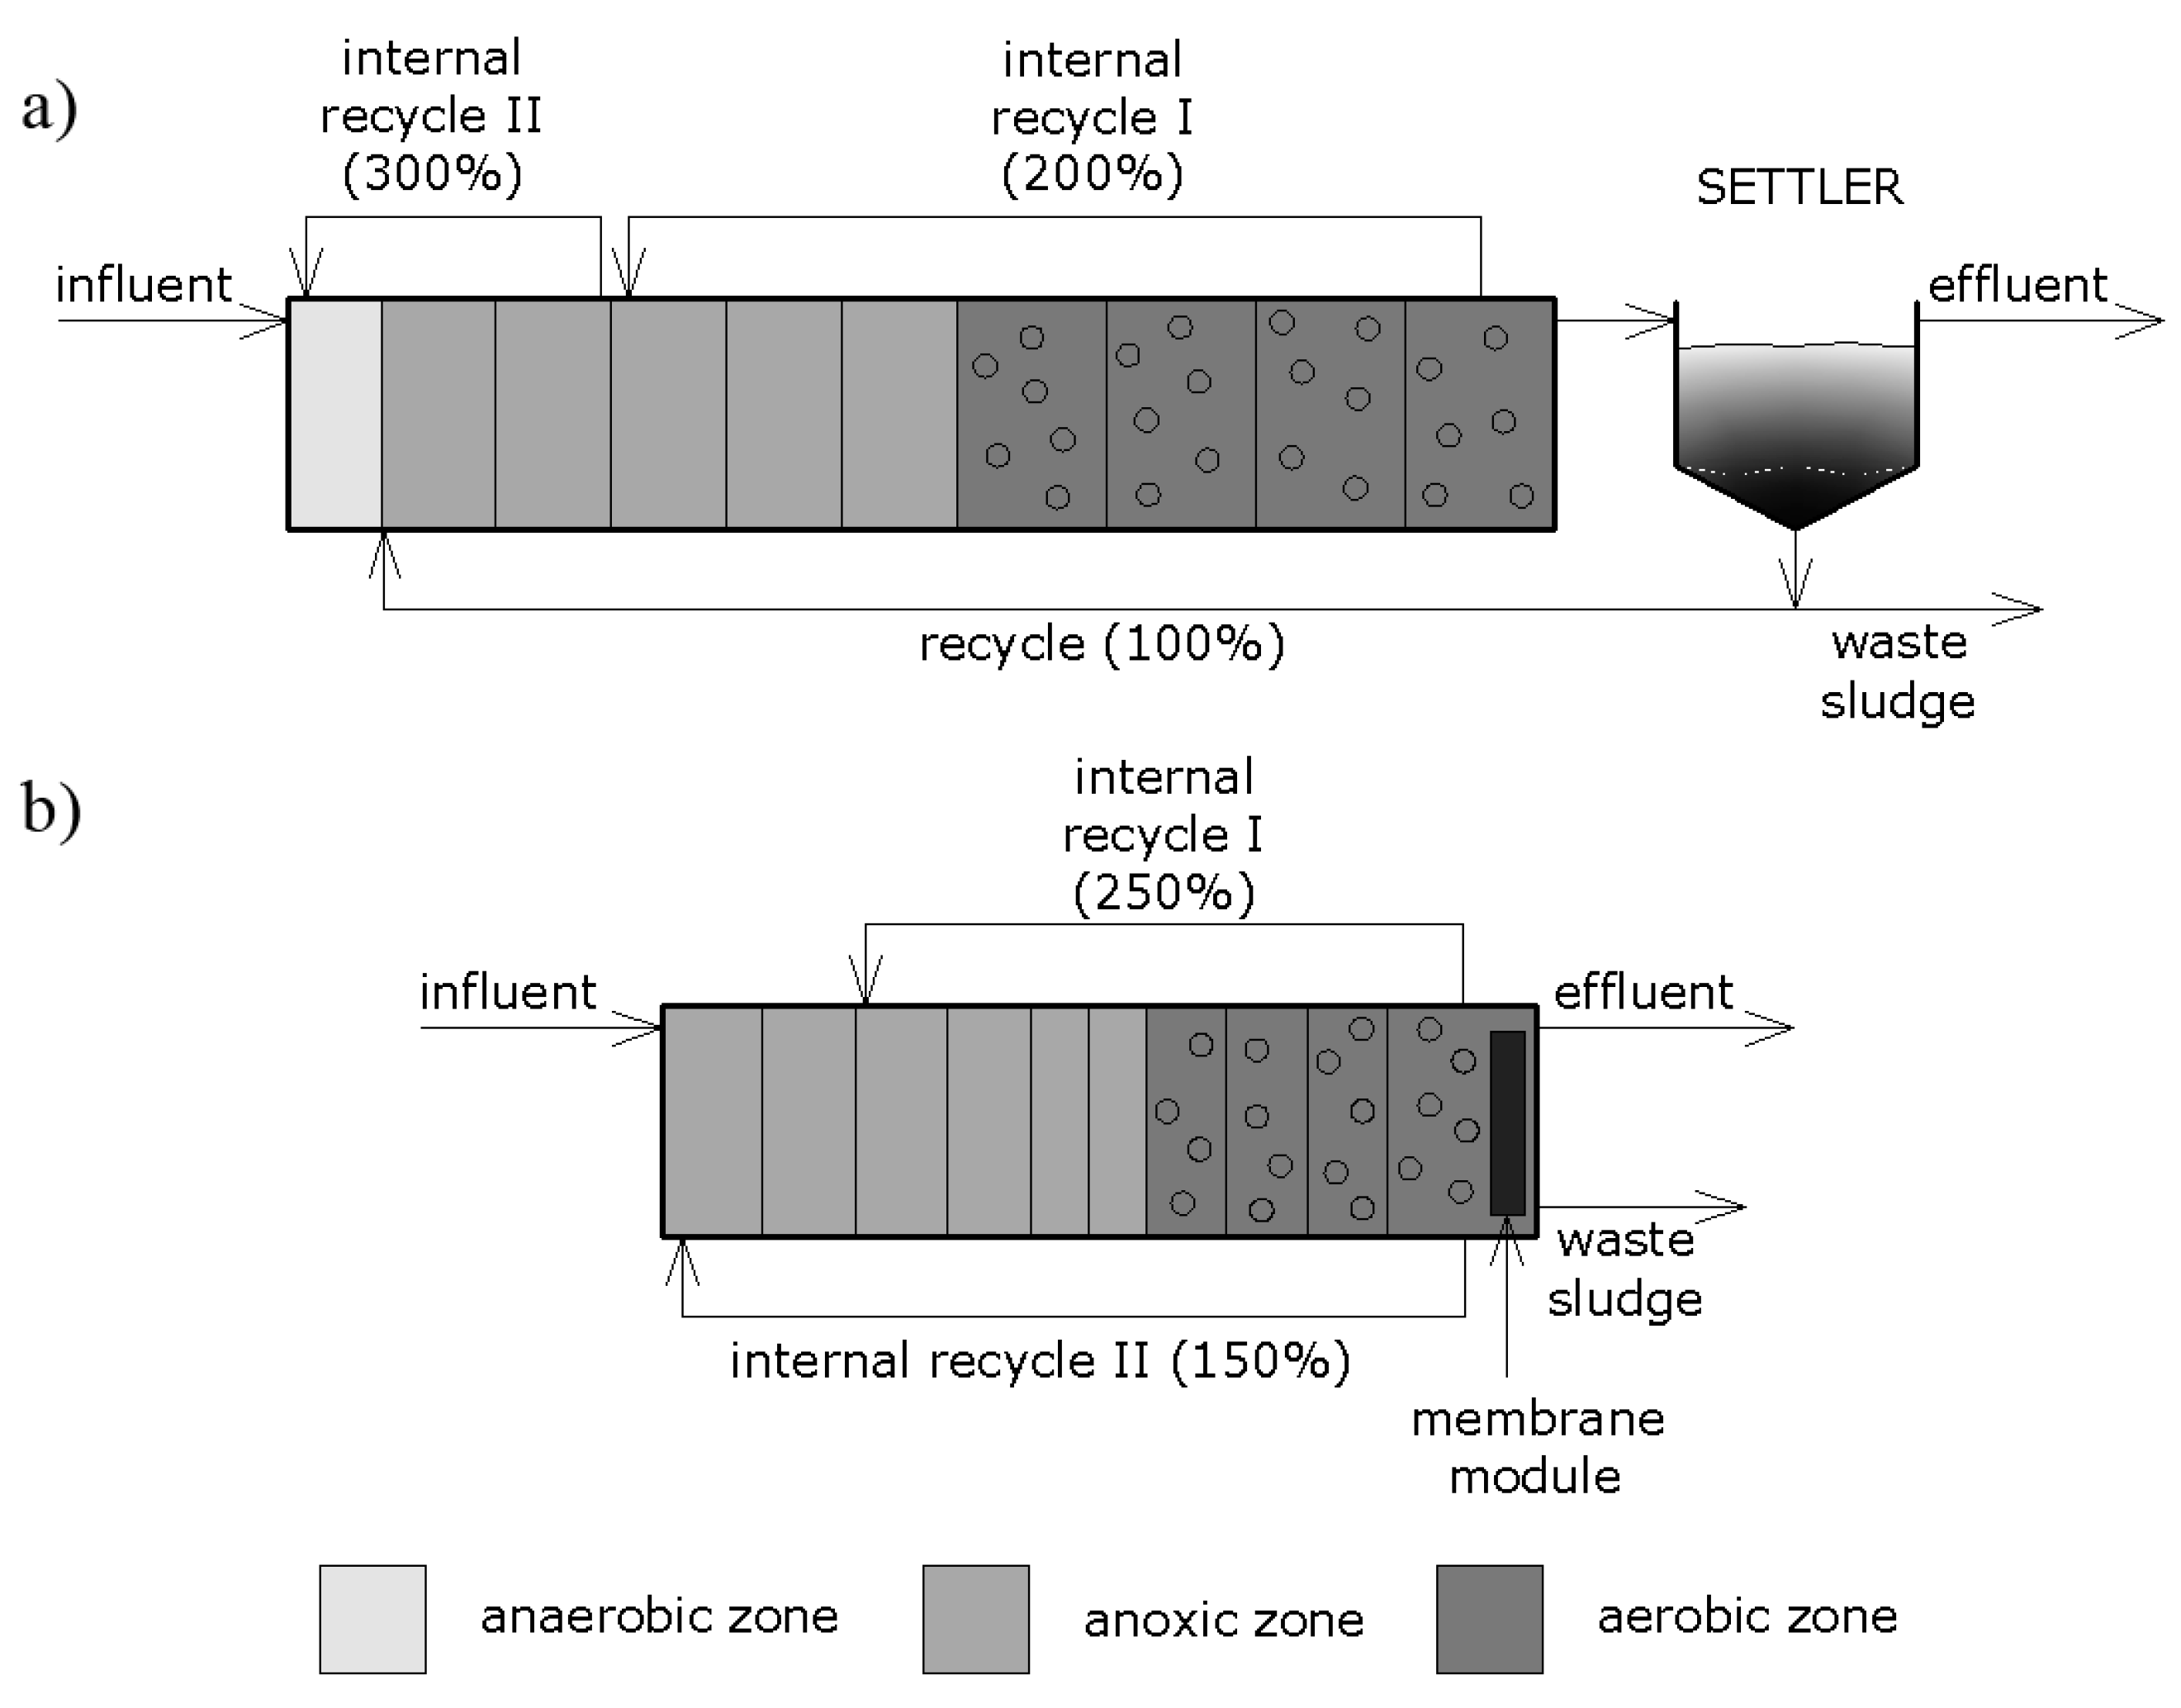
For comparison purposes two different processes were used in the study: a membrane bioreactor (MBR) and a conventional, four-stage biological nutrient removal activated sludge (CAS). Figure 1 presents a schematic diagram of the analyzed systems. In both cases, activated sludge model no. 2d (ASM2d) was used as the biological model.
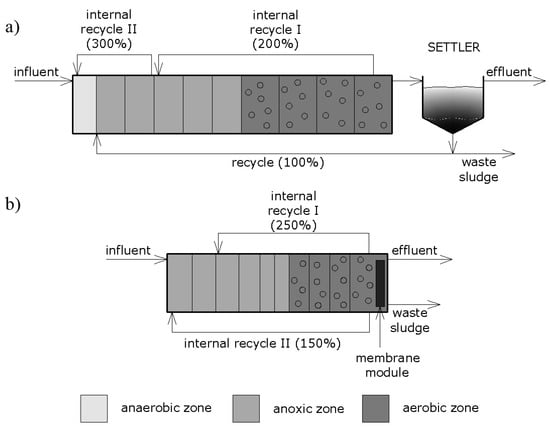
Figure 1.
Schematic diagram of the analyzed systems: (a) conventional activated sludge process (CAS) with a secondary clarifier, (b) membrane bioreactor (MBR).
In order to conduct the simulation and due to the convenience in obtaining and interpreting data, two separate models of wastewater treatment systems with distinct layouts were created by means of GPS-X software (v7.0.1, Hydromantis Environmental Software Solutions, Inc., Hamilton, ON, Canada). The predefined processes implemented in the software were used to build individual models. In the case of the membrane bioreactor, a plug-flow version of the MBR process was employed by combining biokinetic activated sludge and membrane resistance models. The CAS model was comprised of a plug-flow tank reactor followed by a circular secondary clarifier. Additionally, in both models, wastewater influent and effluent objects were used to characterize the input and to obtain the output data, respectively. Prior to building the models, the individual processes were linked with the use of appropriate connection points and the streams were uniquely labelled. In GPS-X, a binary executable code is generated in several steps where the layout content is translated into Advanced Continuous Simulation Language (ACSL) and then converted to a FORTRAN executable program. The models were numerically solved with the use of the Runge–Kutta–Fehlberg method. The time interval of 15 min was used in the simulation.
The parameter values pertaining to the physical and operational properties were assessed to maximize the effectiveness of the systems. The recycle streams, both external and internal, exhibited typical values for such processes. The CAS system is comprised of 10 reactors in series (total volume of 11,000 m3) as well as a circular secondary clarifier (with the volume of 2925 m3). The settled activated sludge is returned from the clarifier to the predenitrification chamber by means of external recirculation (100%). On the other hand, mixed liquor is returned from the aerobic into the anoxic zone as well as from the anoxic to anaerobic zone at 200% and 300%, respectively, because of the two internal recirculation streams. The volume of the anaerobic chamber, anoxic chambers, and aerobic chambers was established at 800 m3, 1000 m3, and 1300 m3, respectively. Fine bubble aeration with diffusers was used to introduce air into the aerobic zone. A constant level of 2 mg dm−3 for the dissolved oxygen was maintained automatically by means of a DO controller.
In the case of the settler, the one-dimensional non-reactive model was chosen with only vertical flow taken into account and no biological reactions included. In the model, ten equal layers were specified (one of which is a feed layer) and a mass balance was carried out for each layer, thus obtaining the solids profile. As for the solids flux, both gravity settling and a bulk movement of the liquid were considered. The modeled clarifier had a height of 4.5 m (0.45 m for the layer) with the seventh layer as the feed layer.
The MBR system included 10 reactors in series with the total volume of 4525 m3, which was less than in the case of the CAS system, and a solids separation filter located in the last reactor. This system also comprised two internal recirculation streams (250% and 150%, respectively), which were separated in order to enhance the removal of phosphorus and aid in the even distribution of mixed liquor.
The MBR model in GPS-X software consisted of the following components: hydraulic, biological, aeration, and membrane filtration model, and utilized the submerged membrane configuration [25]. In the last MBR chamber, additional aeration was provided due to the increased concentration of the suspension. The method of introducing air perpendicular to the membrane surface (cross-flow aeration) was chosen. In the aerobic zones, the concentration of the dissolved oxygen was kept approximately at the level of 2 mg dm−3. Like the CAS model, the aeration was provided as fine-bubble with the introduction of air into the system by means of diffusers.
The average daily flow rate of wastewater in the influent to each system was assumed at the level of 9800 m3 d−1. The characterization of influent was conducted with the use of the internal program tool based on COD fractions. The same values of influent parameters were used as input data for both modeled systems. The selected operational conditions of the analyzed systems are presented in Table 1. In turn, the basic parameters of wastewater in the inflow of the system, together with some characteristic stoichiometric coefficients, are listed in Table 2. In Table 2, nitrate and nitrite nitrogen are included together, since in the ASM2d model, no separate variables for the two nitrogen forms are provided and nitrification is assumed to take place in one step.

Table 1.
Selected operational conditions of CAS and MBR systems.
Table 2.
Composition of wastewater entering CAS and MBR systems.
3. Results and Discussion
In this paper, the results of the steady-state simulations were included, assuming immutability of the inflow parameters in time. The operation of MBR was performed in simplified mode, i.e., the parameters related to physical aspects of the filtration such as transmembrane pressure or filter resistance were neglected.
In the model, three different metabolic groups of microorganisms were distinguished: heterotrophic, autotrophic, and polyphosphate accumulating organisms (PAOs). The concentration of biomass in both systems varied depending on the reactor, however, greater values were obtained in the MBR process. The achieved values for heterotrophs, autotrophs, and PAOs amounted on average to 2400, 125, and 1050 gCOD m−3, respectively. In the CAS process, the observed concentrations of microorganisms were lower (particularly in the case of heterotrophs and autotrophs) and amounted on average to 880, 60, and 775 gCOD m−3, respectively.
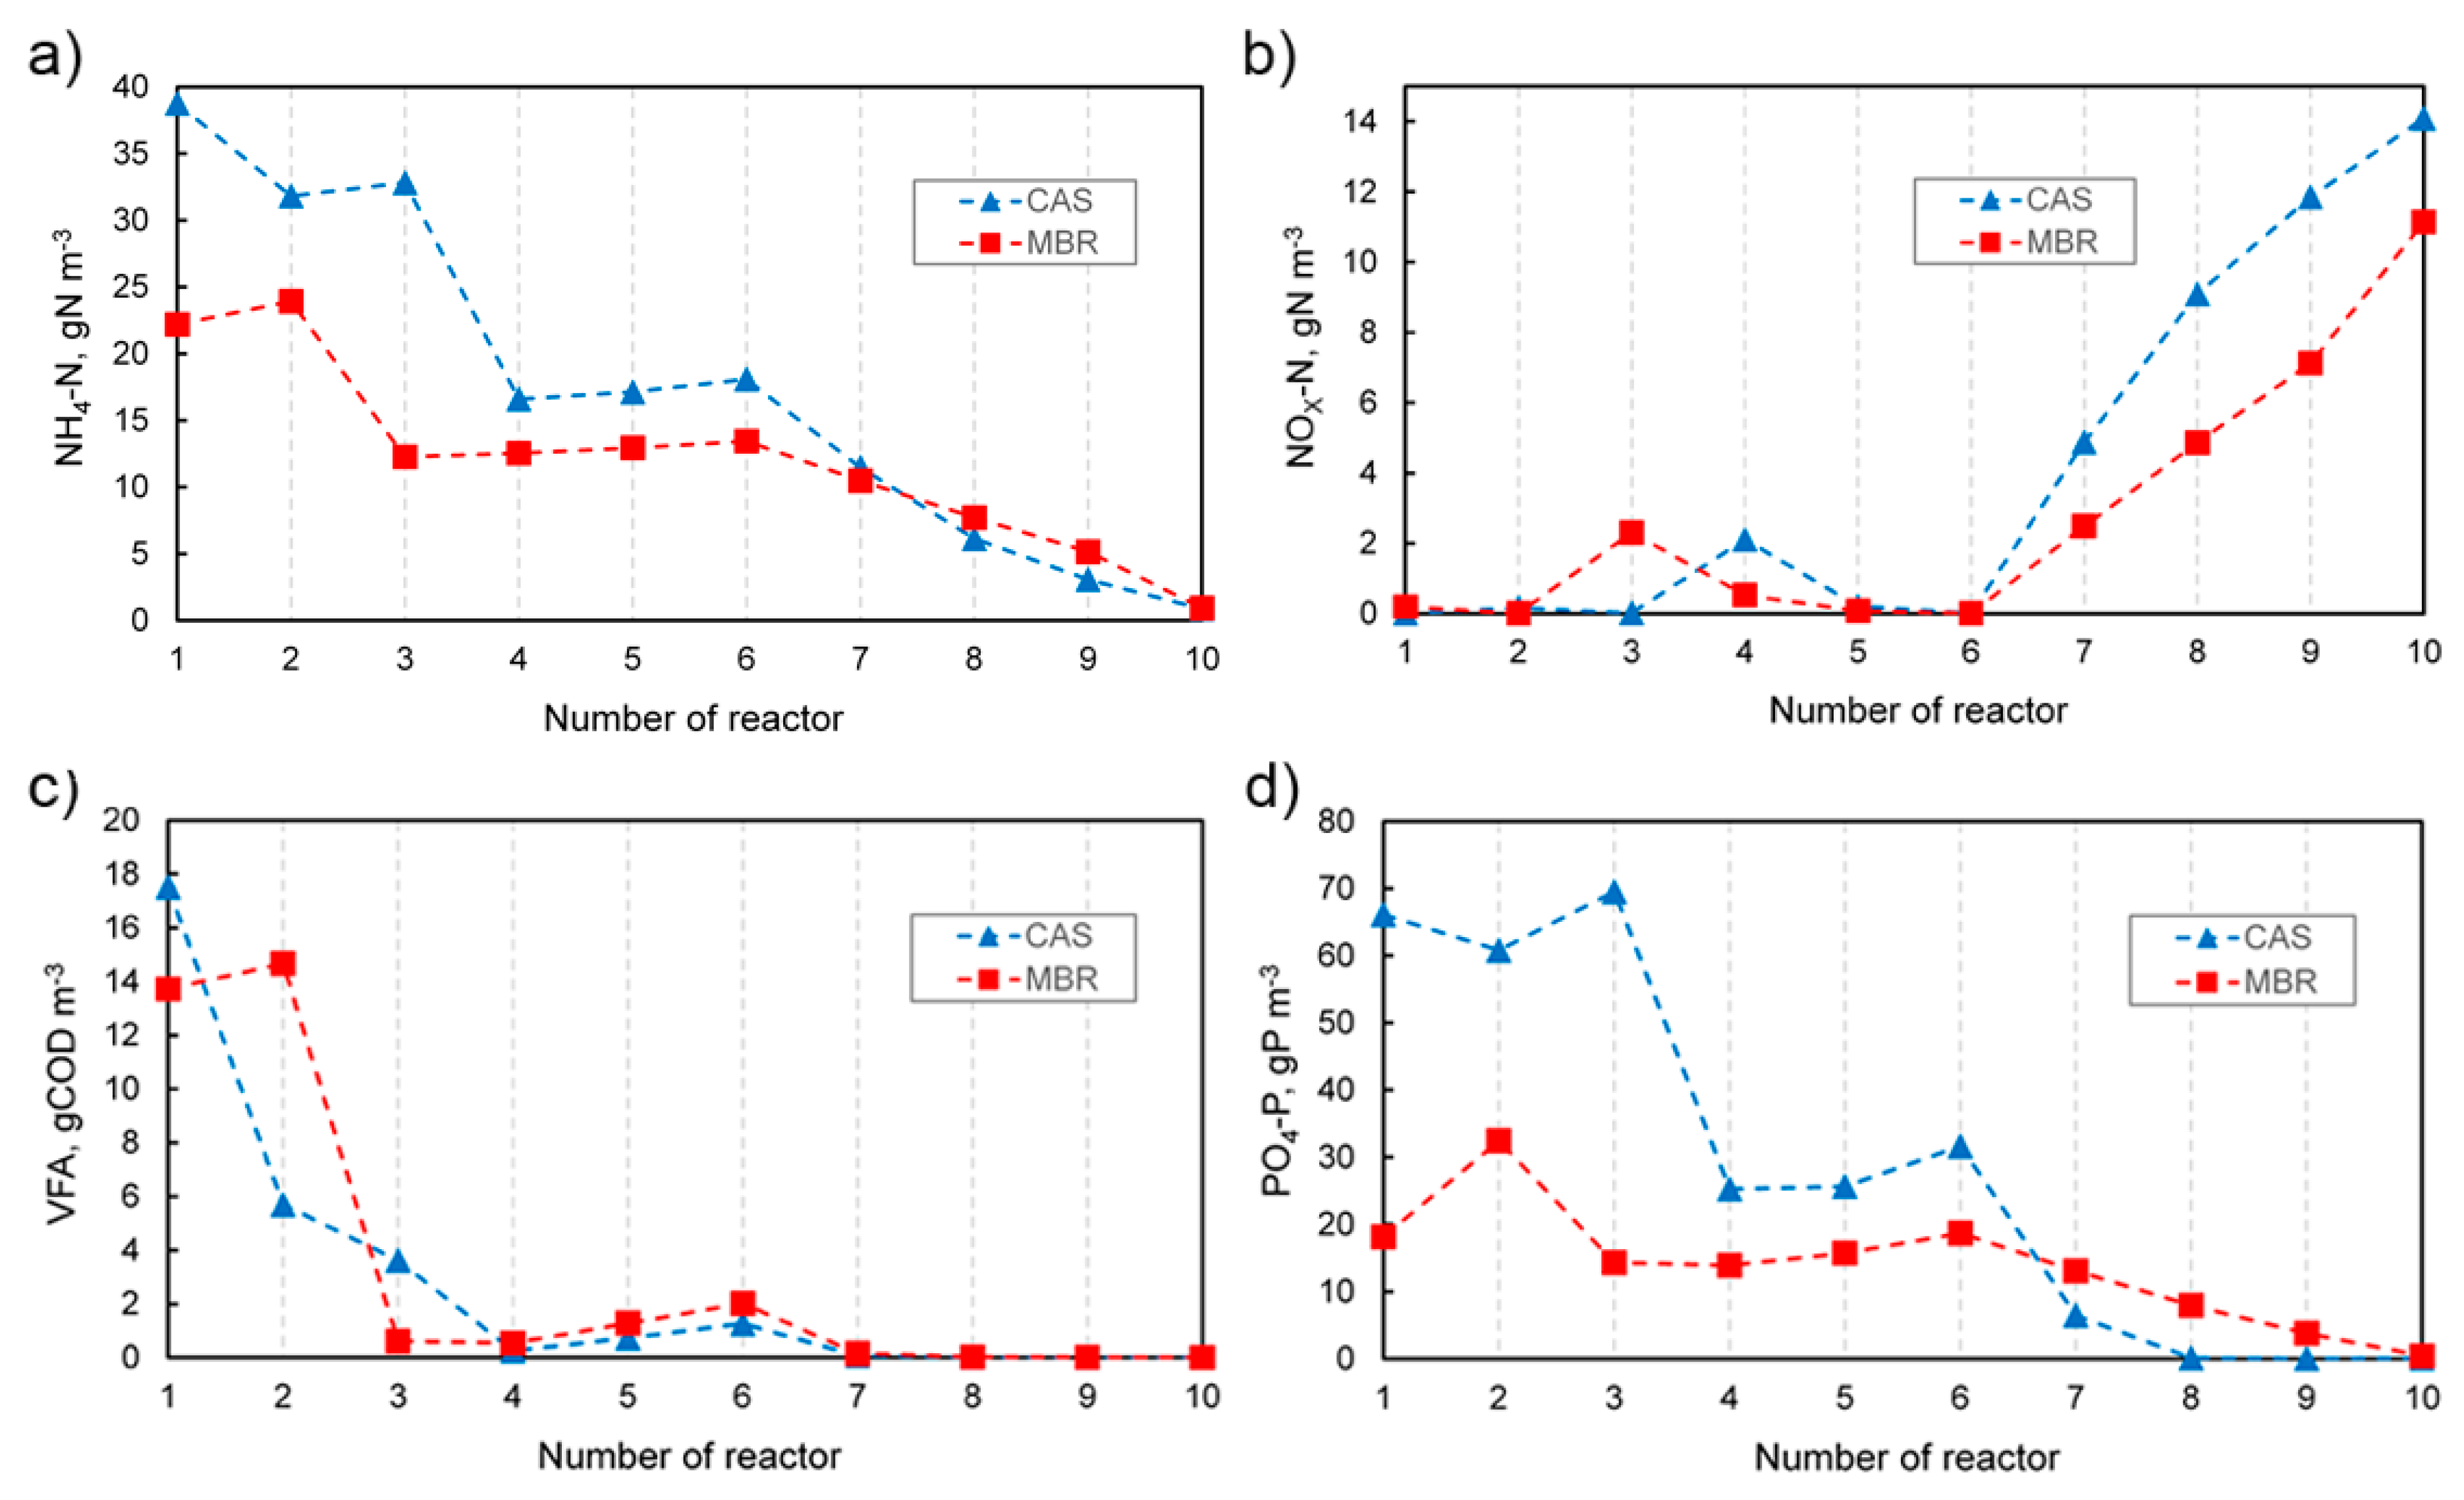
In Figure 2, the profiles of four selected parameters measured in individual tanks in both systems are compared. In turn, the effluent concentrations together with the removal efficiency of characteristic parameters are presented in Table 3. The results obtained for the CAS as well as the MBR system were mostly satisfying. However, the effluent quality in the MBR system was either better or comparable to the CAS. The removal level for suspended solids was 99.8%, which was the most notable difference. In turn, as far as the soluble substances are concerned, no significant differences were observed. Similar beneficial effects, i.e., 100% removal of TSS, were obtained in real objects, even if adverse conditions occurred (e.g., low temperature) [30,31]. The effectiveness of TSS removal depends to a large extent on the membrane type used and the size of its pores. In real wastewater treatment plants, a similarly high removal efficiency of COD (>92%), NH4-N (>99%) [31], and BOD5 (>99.5%) [30] can be achieved. The higher effectiveness of removing COD in the MBR compared to the CAS process could be the result of the TSS retention as well as the retention of polysaccharides and proteins in the supernatant [32].
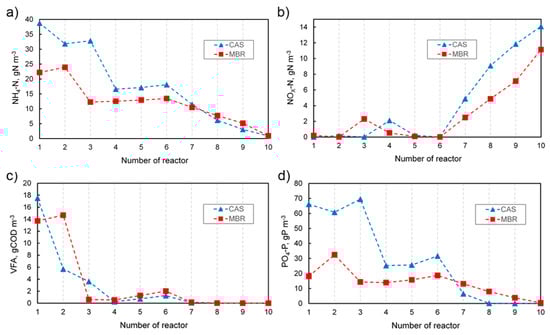
Figure 2.
Concentration of selected parameters through individual tanks in the CAS and MBR systems. (a) Ammonia, (b) Nitrate and nitrite, (c) Volatile fatty acids, (d) Orthophosphate.
Table 3.
Comparison of effluent parameters in the modeled systems.
Taking into account the total phosphorus removal efficiency, it was noticed that in the MBR, the process occurred slightly more efficiently than in the CAS process. The achieved removal efficiency was 95.9% in the CAS and 96.9% in the MBR system. Analyzing the concentration of orthophosphate in individual chambers, which is shown in Figure 2d, at the beginning of the reactors, a significant difference between the MBR and CAS could be seen. In the CAS, a more than three times higher concentration of PO4-P in the first reactor resulted from a different system configuration. The external recycle stream with nitrate was directed to the second reactor, thus no denitrification occurred in the first reactor and the orthophosphate could be released. This process is favored by the presence of volatile fatty acids, which are taken up by PAOs and stored as polyhydroxyalkanoates (PHA). In the case of MBR, in the first reactor, the influent stream containing orthophosphate is mixed with the internal recycle II with no PO4-P present. Additionally, as nitrate is directed by the recycle stream, denitrification with volatile fatty acids occurs, and the release of orthophosphate is limited. In turn, under aerobic conditions, as an uptake of orthophosphate carried out by PAOs takes place, the concentration of PO4-P gradually decreases. Generally, in the MBR process, due to the lack of a secondary clarifier in the system, which results in different characteristics of recirculation streams and different ranges of operational parameters, it is difficult to create a typical anaerobic zone for biological dephosphatation. Very often in real systems, chemical precipitation is also used [33,34] frequently for the elimination of residual phosphorus after bio-P-removal [35]. The introduction of alternating aerobic and anoxic conditions by intermittent aeration methods provides better control as far as the maintenance of the conditions encouraging biological P-removal is concerned [35]. Daigger et al. [36] concluded that intensive mixing at the inlet into the anaerobic and anoxic zones and controlling recirculation to maintain the appropriate MLSS distribution were very important for effective biological dephosphatation.
Comparing the effectiveness of both systems in the area of removing nitrogen compounds in the process of nitrification and denitrification, in the case of CAS, the efficiency of TN removal was achieved at 76.1%, while in the case of MBR, it was 80.8%. The differences mainly resulted from a lower concentration of nitrate at the effluent of MBR while the ammonia was almost completely oxidized in both systems. As is widely-known, the volumetric ratio of anoxic and aerobic zones as well as the internal recycling rate dramatically affect the nitrifying and denitrifying processes in MBR [37,38]. Ding et al. [38] reported that TN removal could be improved with the increase of the internal recycle rate and the optimal conditions for TN removal were at an internal recycle ratio of 400%. Furthermore, in the afore-mentioned paper, the authors stated that MBR could exhibit better removal efficiency of NH4-N and TN when the volumetric ratio of aerobic and anoxic zones was around 1. In this study, the volume of anoxic zone in MBR was set at 2400 m3 and the aerobic zone at 2125 m3 with the volume ratio of 1:13.
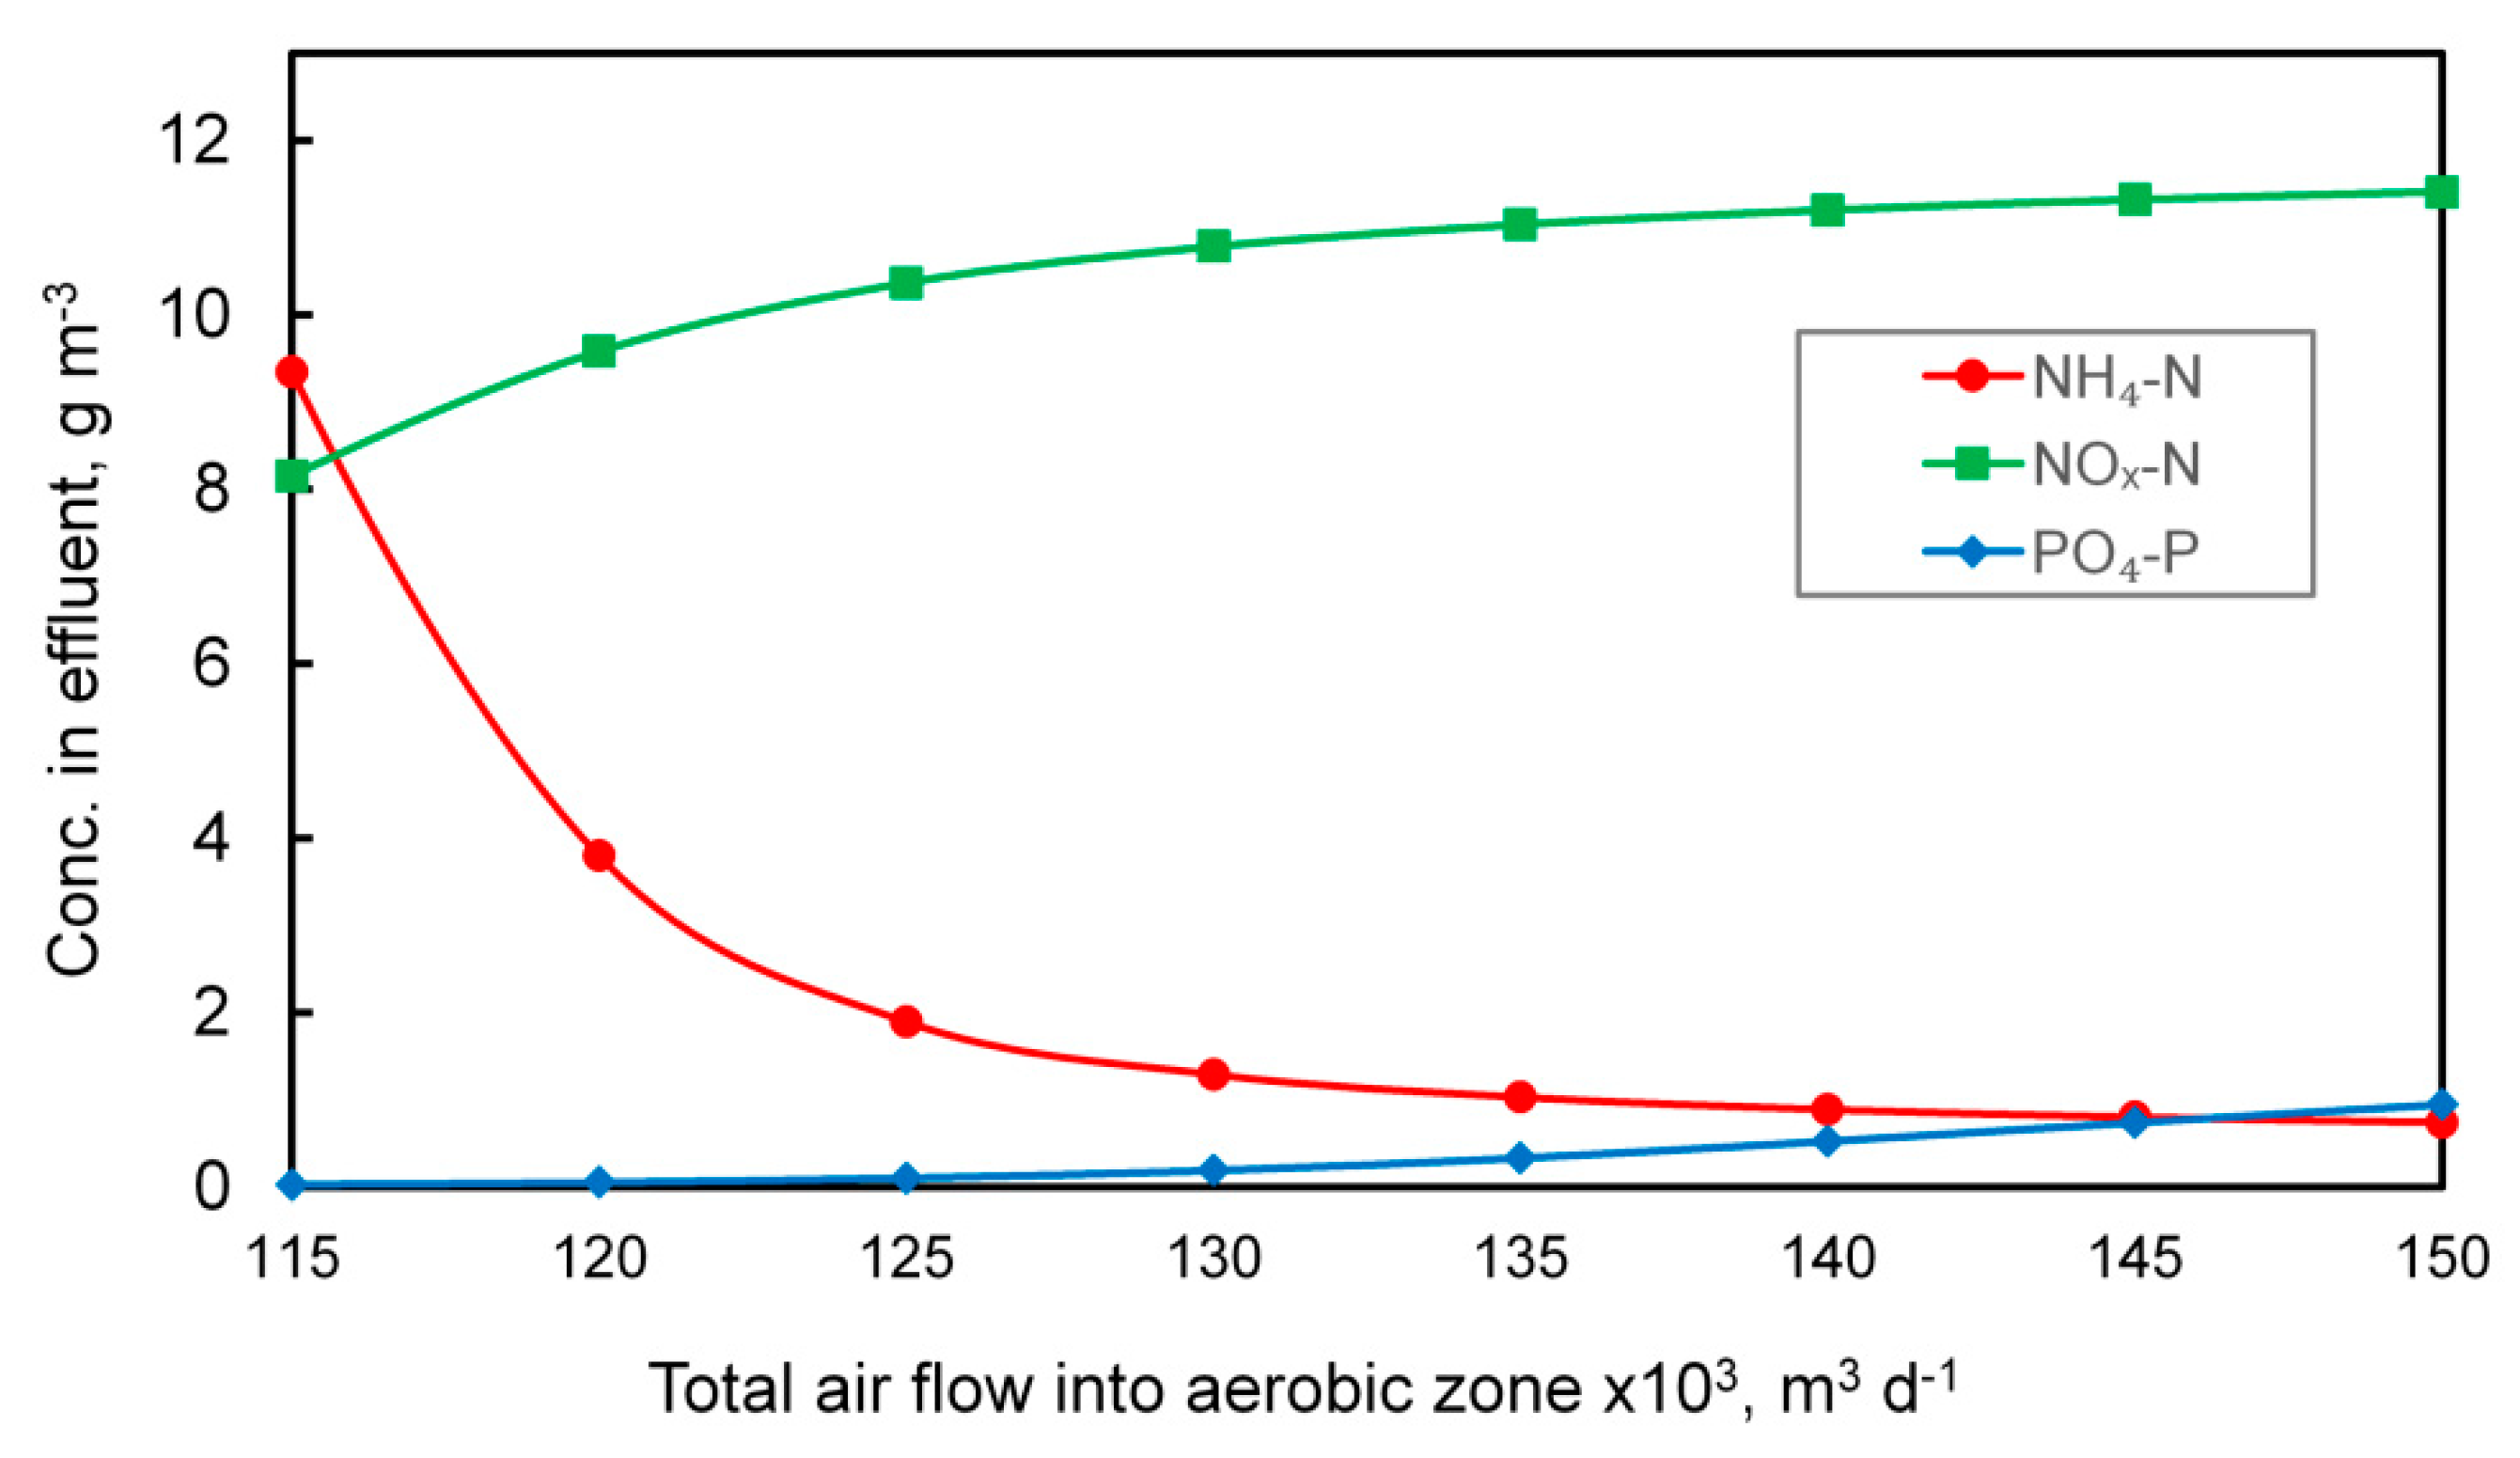
Suitable conditions for nitrification can also be ensured by providing an appropriate amount of air is introduced into the nitrification zone. In the MBR, direct aeration was used (no automatic controllers) and the determination of the appropriate amount of air was carried out experimentally, as shown in Figure 3.
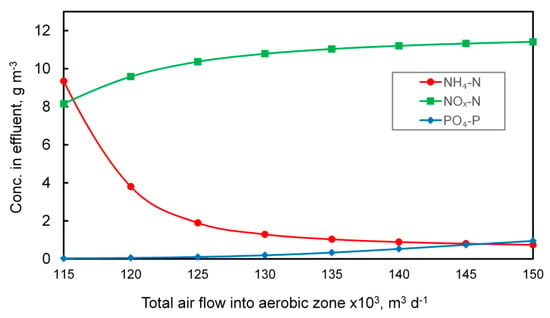
Figure 3.
Influence of the amount of air introduced into the nitrification chambers of the MBR system on the concentration of orthophosphate, nitrate and nitrite, and ammonia nitrogen in the outflow.
Increasing the amount of oxygen fed into the system improves the nitrification process, which is illustrated by the dropping concentration of ammonia nitrogen in the outflow. At the same time, since the aerobic zone is located just before the secondary settler, the amount of nitrate and nitrite increases, which, in turn, adversely affects the phosphorus removal efficiency due to the use of a large degree of internal recirculation. The total amount of air supplied to the MBR system designed to meet biological needs was set at 138,000 m3 d−1. For comparison, the total air flow supplied into the aeration zone in CAS reached up to 151,000 m3 d−1. The aeration process generates significant operating costs and when considering only this parameter, MBR technology may look favorable. However, when other air demands are included, for example, cross-flow aeration, the situation is very different. In general, the MBR process is recognized as more energy consuming when compared to the CAS [29,39], even when the lower sludge production is taken into account (see Table 1). On the other hand, when considering the energy consumption of the entire wastewater treatment plant, the difference is not so significant. Furthermore, to ensure effluent quality comparable to MBR, additional processes such as filtration and disinfection of wastewater need to be provided, thus raising the overall costs [29].
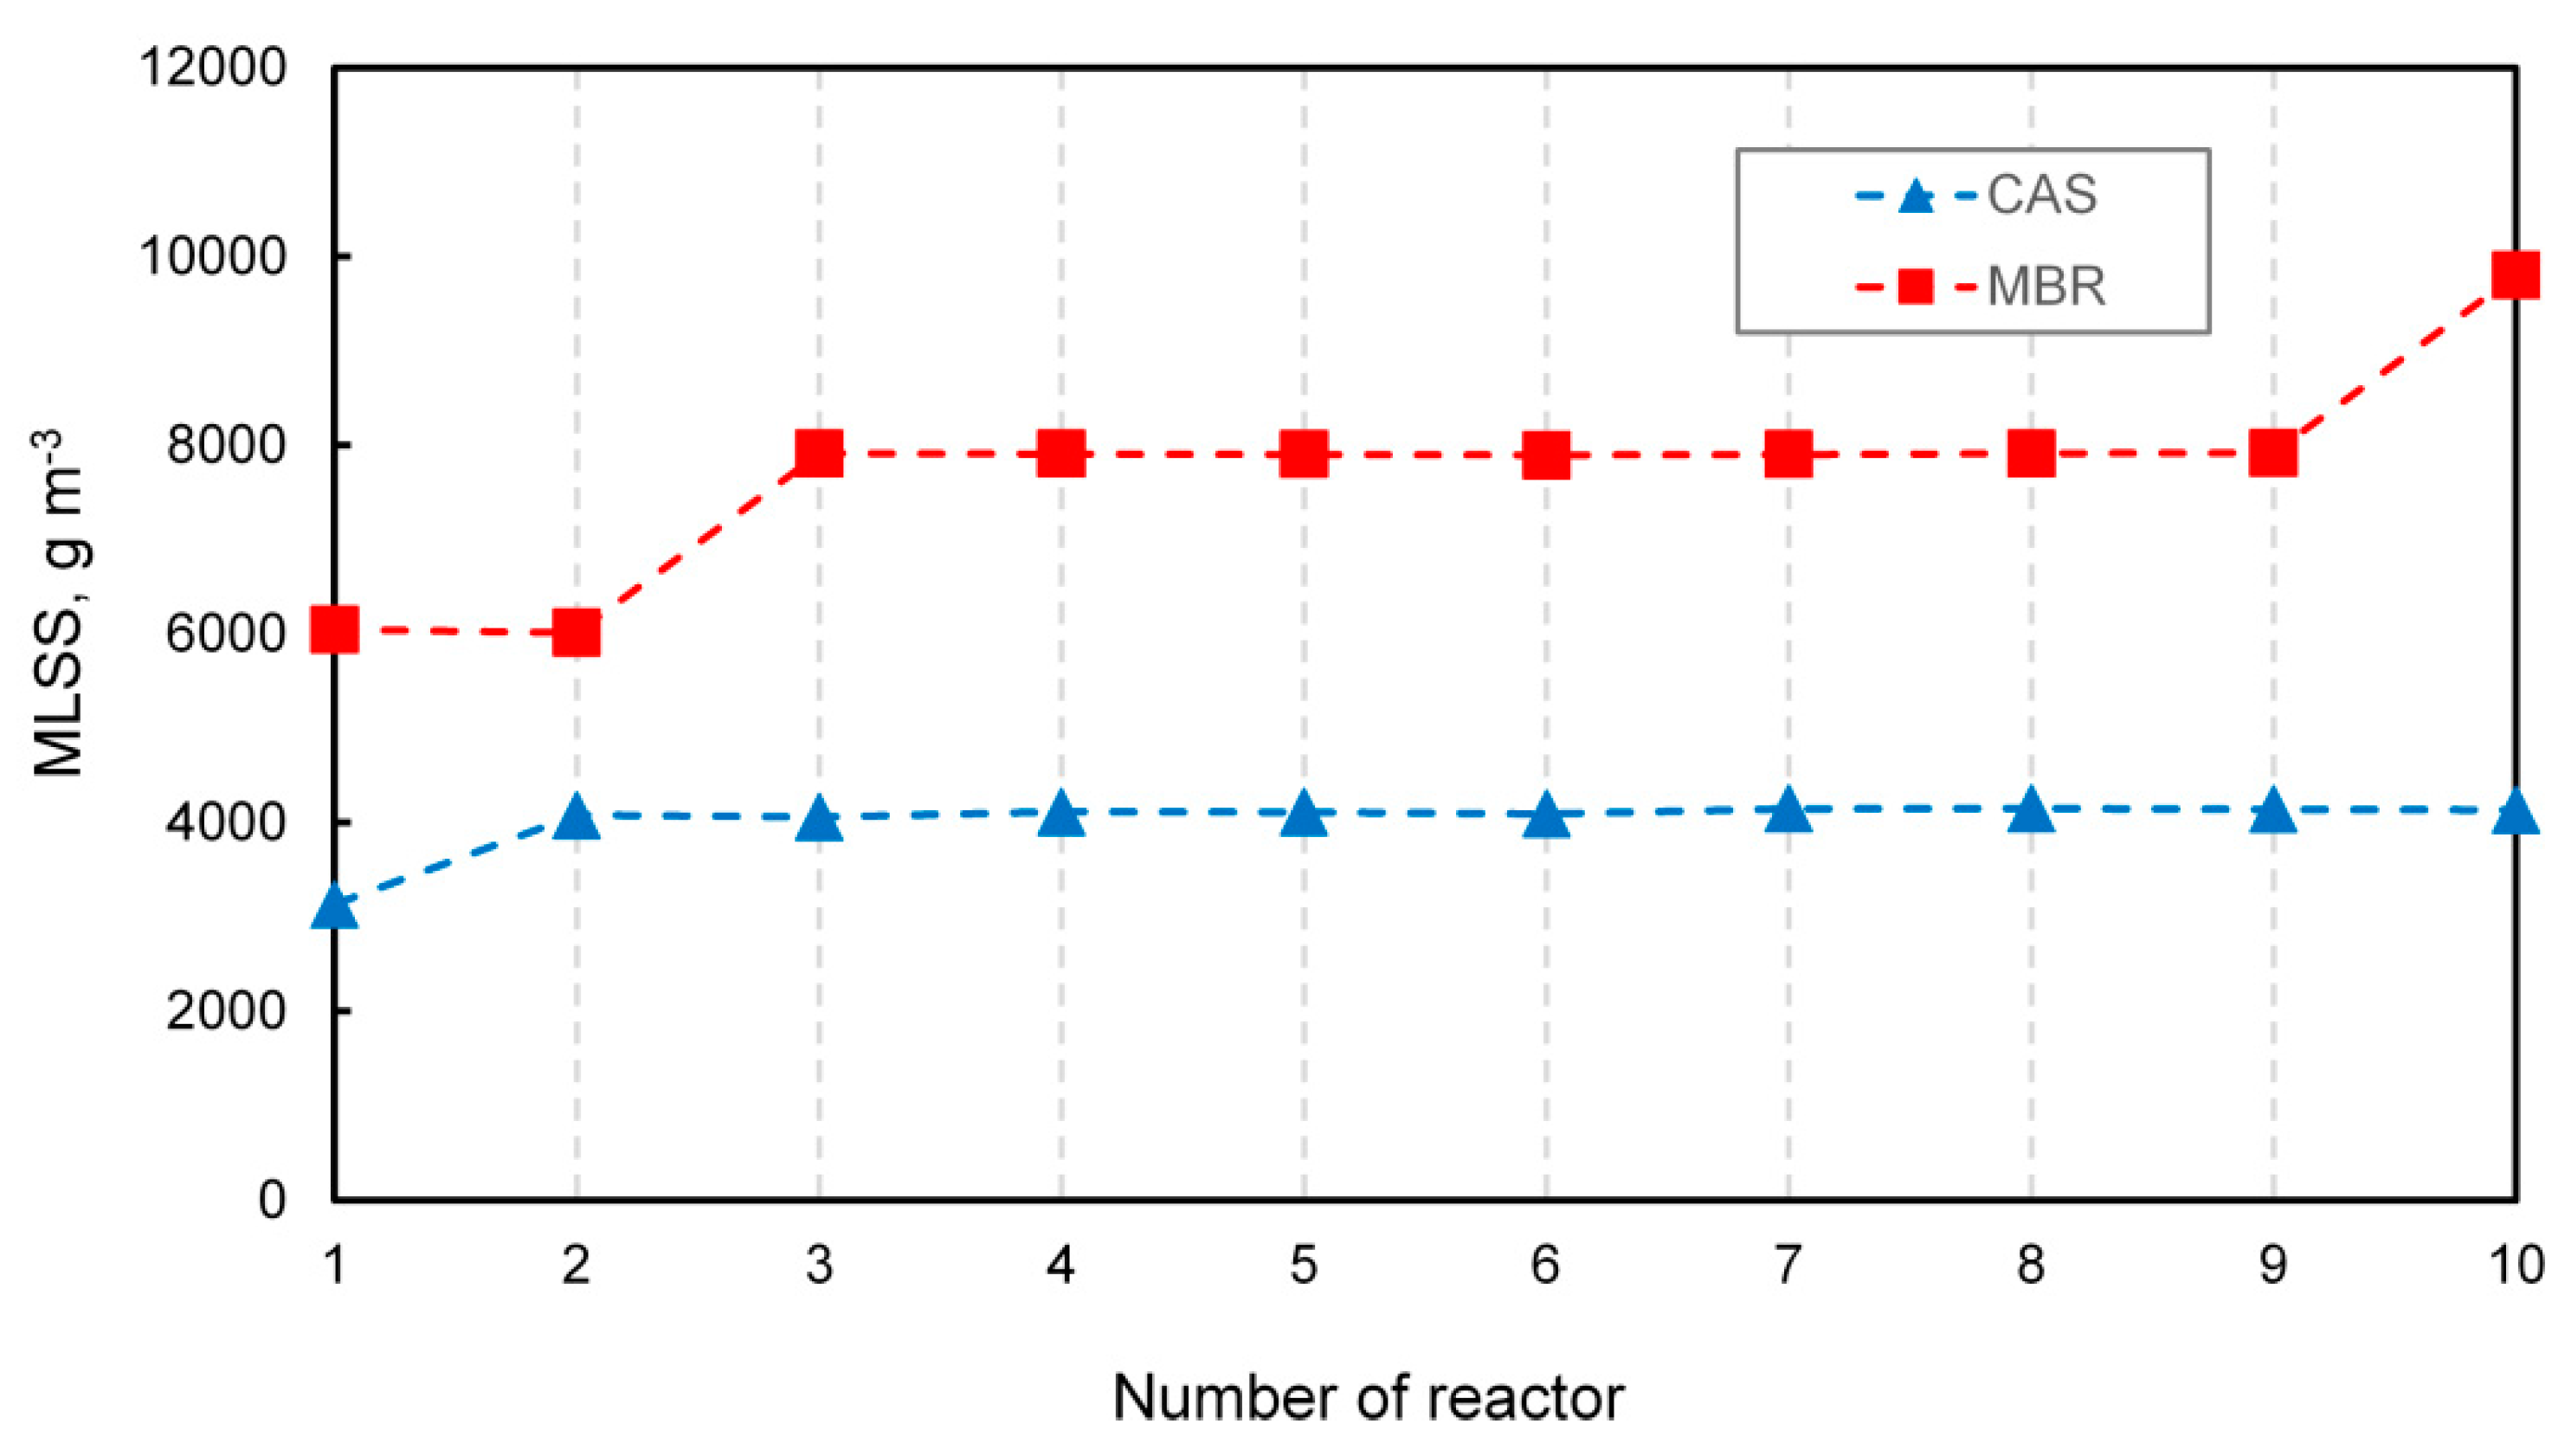
Oxygen diffusion depends on the conditions prevailing in the MBR. Germain and Stephenson [40] noticed that increasing airflow led to a higher concentration of oxygen, resulting in a more efficient mixing intensity and inducing floc breakup, so that particles of various sizes were formed. Additionally, oxygen transfer decreased exponentially with increasing solids concentration. The mixed liquor suspended solids (MLSS) is considered to be a crucial operational parameter in MBR technology [41]. Figure 4 shows the concentration of MLSS in the modeled CAS and MBR systems.
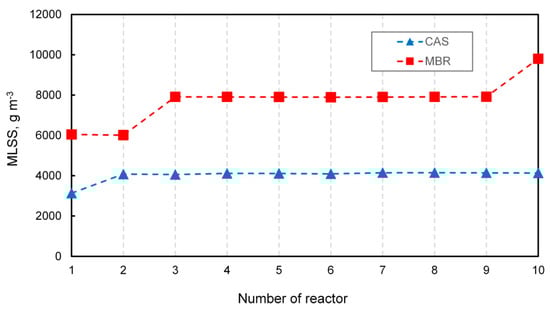
Figure 4.
The MLSS concentration in the CAS and MBR.
A characteristic feature of MBR technology that distinguishes it from conventional systems is the capability to maintain a higher concentration of MLSS. In both systems, different levels of MLSS throughout the reactors were observed, mainly due to alternative configurations of the recycle streams. The lowest value of MLSS was noticed at the beginning of the MBR and amounted to approximately to 6000 g m−3, which is on average twice as high of that in the CAS system. In turn, the highest concentration reaching up to 10,000 g m−3 occurred in the last reactor where the filter was located, while in the CAS, the highest value of MLSS slightly exceeded 4000 g m−3. The observed effect was in line with that reported by Ren et al. [42], who noticed a low level of microbial metabolism as a consequence of low COD removal in cases when MLSS was under the threshold value of 6000 g m−3. According to Yang et al. [43], the MLSS of 8820 g m−3 was optimal for decreasing the reversible membrane fouling. The concentration of MLSS affects sludge viscosity, floc size, and oxygen diffusion. Insel et al. [44] suggested that MBR systems that operated at a higher MLSS concentration were characterized by much smaller flocs (30–40 μm) when compared to CAS plants with average flocs of 300 μm. However, Sarioglu et al. [45] reported that elevated MLSS concentration resulted in higher sludge viscosity by favoring poor diffusional conditions.
4. Conclusions
Defining optimal ranges of operational parameters for effective wastewater treatment is greatly facilitated by using computer simulations. Modeling the operation of two different biological wastewater treatment systems showed several discrepancies in treatment efficiency. In both cases, results indicating a high quality of effluent were obtained. However, in MBRs, it is possible to achieve the highly efficient removal of contaminants by using smaller reaction zones with a simultaneous high concentration of MLSS. The results were also heavily influenced by the lack of a secondary settler and thus external recirculation.
As expected, the greatest difference pertained to the suspended solids removal where TSS in MBR was eliminated at the very high rate of 99.8%. The employed membrane module also influenced the elimination of the particulate fraction of organic matter, which increased the total COD and BOD5 removal. In terms of nutrients, in the case of nitrogen, almost complete nitrification was achieved in both systems (with an ammonia removal efficiency of 98.3% in CAS and 98.2% in MBR), whereas the lower concentration of nitrate in the effluent from MBR (11.2 gN m−3 compared to 14.1 gN m−3) contributed to a higher degree of total nitrogen removal (80.8% in MBR and 76.1% in CAS). As far as phosphorus is concerned, despite a different system configuration, the obtained results for total phosphorus in the effluent (0.67 gP m−3 in CAS and 0.50 gP m−3 in MBR) indicate that the biological dephosphatation proceeded with high efficiency in both cases; nevertheless, again, a slight advantage in favor of MBR was achieved.
Author Contributions
M.B. and A.M. developed the concept of the article, and wrote the outline of the paper draft; M.B., and A.P. performed the modeling processes, analyzed the data, and improved the paper draft; A.M. and G.Ł. analyzed the data and improved the paper draft. All authors of this article provided substantive comments.
Funding
This work was financially supported by the Ministry of Science and Higher Education in Poland, within the statutory research of particular scientific units.
Conflicts of Interest
The authors declare no conflict of interest.
References
- Piaskowski, K.; Wojciechowski, R. Technologie membranowe jako alternatywa dla klasycznej rozbudowy oczyszczalni gwarantujące maksymalną ochronę środowiska naturalnego. Membrane Technologies as an alternative to classic development wastewater treatment plant giving a guarantee maximum protection of the environment. Gaz Woda Tech. 2017, 11–17. [Google Scholar] [CrossRef]
- Konieczny, K. Efektywność oczyszczania ścieków przy pomocy reaktora membranowego. Effectiveness of Wastewater Treatment with the Use of the Biological Membrane Reactors. Rocz. Ochr. Śr. Annu. Set Environ. Prot. 2015, 17, 1034–1052. [Google Scholar]
- Korniluk, M.; Montusiewicz, A.; Piotrowicz, A.; Łagód, G. Simulation of wastewater treatment systems with membrane separation. Proc. ECOpole 2008, 2, 41–45. [Google Scholar]
- De Luca, G.; Sachetti, R.; Leoni, E.; Zanetti, F. Removal of indicator bacteriophages from municipal wastewater by a full-scale membrane bioreactor and a conventional activated sludge process Implications to water reuse. Bioresour. Technol. 2013, 129, 526–531. [Google Scholar] [CrossRef]
- Judd, S. The status of membrane bioreactor technology. Review. Trends Biotechnol. 2008, 26, 109–116. [Google Scholar] [CrossRef]
- Ng, A.N.L.; Kim, A.S. A mini-review of modeling studies on membrane bioreactor (MBR) treatment for municipal wastewaters. Desalination 2007, 212, 261–281. [Google Scholar] [CrossRef]
- Radjenović, J.; Matošić, M.; Mijatovi, I.; Petrović, M.; Barceló, D. Membrane Bioreactor (MBR) as an Advanced Wastewater Treatment Technology. Handb. Environ. Chem. 2008, 5, 37–101. [Google Scholar] [CrossRef]
- Naessens, W.; Maere, T.; Nopens, I. Critical review of membrane bioreactor models, part 1: Biokinetic and filtration models. Bioresour. Technol. 2012, 122, 95–106. [Google Scholar] [CrossRef] [PubMed]
- Tsai, H.-H.; Ravindran, V.; Pirbazari, M. Model for predicting the performance of membrane bioadsorber reactor process in water treatment applications. Chem. Eng. Sci. 2005, 60, 5620–5636. [Google Scholar] [CrossRef]
- Vanhooren, H.; Meirlaen, J.; Amerlinck, Y.; Claeys, F.; Vangheluwe, H.; Vanrolleghem, P.A. WEST: Modelling biological wastewater treatment. J. Hydroinform. 2003, 5, 27–50. [Google Scholar] [CrossRef]
- Drewnowski, J.; Zaborowska, E.; De Vega, C.H. Computer Simulation in Predicting Biochemical Processes and Energy Balance at WWTPs. In E3S Web of Conference; EDP Sciences: Les Ulis, France, 2018; Volume 30. [Google Scholar]
- Drewnowski, J.; Mąkinia, J.; Szaja, A.; Łagód, G.; Kopeć, Ł.; Aguilar, J.A. Comparative Study of Balancing SRT by using Modified ASM2d in Control and Operation Strategy at Full-Scale WWTP. Water 2019, 11, 485. [Google Scholar] [CrossRef]
- Fenu, A.; Guglielmi, G.; Jimenez, J.; Spèrandio, M.; Saroj, D.; Lesjean, B.; Brepols, C.; Thoeye, C.; Nopens, I. Activated sludge model (ASM) based modelling of membrane bioreactor (MBR) processes: A critical review with special regard to MBR specificities. Water Res. 2010, 44, 4272–4294. [Google Scholar] [CrossRef]
- Henze, M.; Gujer, W.; Mino, T.; Matsuo, L.T.; Wentzel, M.C.; Marais, G.R.; Loosdrecht, C.M.V. Activated sludge model No.2D, ASM2D. Water Sci. Technol. 1999, 39, 165–182. [Google Scholar] [CrossRef]
- Verrecht, B.; Maere, T.; Benedetti, L.; Nopens, I.; Judd, S. Model-based energy optimisation of a small-scale decentralised membrane bioreactor for urban reuse. Water Res. 2010, 44, 4047–4056. [Google Scholar] [CrossRef]
- Zuthi, M.F.R.; Ngo, H.H.; Guo, W.S. Modelling bioprocesses and membrane fouling in membrane bioreactor (MBR): A review towards finding an integrated model framework. Bioresour. Technol. 2012, 122, 119–129. [Google Scholar] [CrossRef]
- Mannina, G.; Di Bella, G. Comparing two start-up strategies for MBRs: Experimental study and mathematical modelling. Biochem. Eng. J. 2012, 68, 91–103. [Google Scholar] [CrossRef]
- Busch, J.; Cruse, A.; Marquardt, W. Modeling submerged hollow-fiber membrane filtration for wastewater treatment. J. Membr. Sci. 2007, 288, 94–111. [Google Scholar] [CrossRef]
- Janus, T. Integrated Mathematical Model of a MBR Reactor Including Biopolymer Kinetics and Membrane Fouling. Procedia Eng. 2014, 70, 882–891. [Google Scholar] [CrossRef]
- Mannina, G.; Di Bella, G.; Viviani, G. An integrated model for biological and physical process simulation in membrane bioreactors (MBRs). J. Memb. Sci. 2011, 376, 56–69. [Google Scholar] [CrossRef]
- Zuthi, M.F.R.; Guo, W.; Ngo, H.H.; Nghiem, DL.; Hai, F.I.; Xia, S.; Li, J.; Li, J.; Liu, Y. New and practical mathematical model of membrane fouling in an aerobic submerged membrane bioreactor. Bioresour. Technol. 2017, 238, 86–94. [Google Scholar] [CrossRef]
- Dalmau, M.; Atanasova, N.; Gabarrón, S.; Rodriguez-Roda, I.; Comas, J. Comparison of a deterministic and a data driven model to describe MBR fouling. Chem. Eng. J. 2015, 260, 300–308. [Google Scholar] [CrossRef]
- Janus, T. Modelling and Simulation of Membrane Bioreactors for Wastewater Treatment. Ph.D. Thesis, Faculty of Technology, School of Engineering, Media and Sustainable Development, De Montfort University, Leicester, UK, 2013. Available online: https://www.dora.dmu.ac.uk/handle/2086/9507 (accessed on 4 April 2019).
- Drewnowski, J. Zastosowanie komputerowej symulacji w procesie kształcenia inżyniera branży sanitarnej. The application of computer simulation in the education of modern sanitary engineer. Zesz. Naukowe Wydz. Elektrotech. i Autom. PG 2016, 48, 17–22. [Google Scholar]
- Hydromantis ESS, Inc. GPS-X Technical Reference; Hydromantis ESS, Inc.: Hamilton, ON, Canada, 2017. [Google Scholar]
- Gao, M.; Yang, M.; Li, H.; Yang, Q.; Zhang, Y. Comparison between a Submerged Membrane Bioreactor and a Conventional Activated Sludge System on Treating Ammonia-Bearing Inorganic Wastewater. J. Biotechnol. 2004, 108, 265–269. [Google Scholar] [CrossRef]
- Jiang, T.; Sin, G.; Spanjers, H.; Nopens, I.; Kennedy, M.D.; van der Meer, W.; Futselaar, H.; Amy, G.; Vanrolleghem, P.A. Comparison of the modeling approach between membrane bioreactor and conventional activated sludge processes. Water Environ Res. 2009, 81, 432–440. [Google Scholar] [CrossRef]
- Gonzalez, S.; Petrovic, M.; Barcelò, D. Removal of a broad range of surfactants from municipal wastewater—Comparison between membrane bioreactor and conventional activated sludge treatment. Chemosphere 2007, 67, 335–343. [Google Scholar] [CrossRef]
- Bertanza, G.; Canato, M.; Laera, G.; Vaccari, M.; Svanström, M.; Heimersson, S. A comparison between two full-scale MBR and CAS municipal wastewater treatment plants: Techno-economic-environmental assessment. Environ. Sci. Pollut. Res. 2017, 24, 17383–17393. [Google Scholar] [CrossRef]
- Arévalo, J.; Ruiz, L.M.; Pérez, J.; Gómez, M.A. Effect of temperature on membrane bioreactor performance working with high hydraulic and sludge retention time. Biochem. Eng. J. 2014, 88, 42–49. [Google Scholar] [CrossRef]
- Gurung, K.; Ncibi, M.C.; Sillanpää, M. Assessing membrane fouling and the performance of pilot-scale membrane bioreactor (MBR) to treat real municipal wastewater during winter season in Nordic regions. Sci. Total Environ. 2017, 579, 1289–1297. [Google Scholar] [CrossRef]
- Massé, A.; Spérandio, M.; Cabassud, C. Comparison of sludge characteristics and performance of a submerged membrane bioreactor and an activated sludge process at high solids retention time. Water Res. 2006, 40, 2405–2415. [Google Scholar] [CrossRef]
- Yang, X.-L.; Song, H.-L.; Chen, M.; Cheng, B. Characterizing membrane foulants in MBR with addition of polyferric chloride to enhance phosphorus removal. Bioresour. Technol. 2011, 102, 9490–9496. [Google Scholar] [CrossRef]
- Zhang, Z.; Wang, Y.; Leslie, G.L.; Waite, T.D. Effect of ferric and ferrous iron addition on phosphorus removal and fouling in submerged membrane bioreactors. Water Res. 2015, 69, 210–222. [Google Scholar] [CrossRef]
- Zuthi, M.F.R.; Guo, W.S.; Ngo, H.H.; Nghiem, L.D.; Hai, FI. Enhanced biological phosphorus removal and its modeling for the activated sludge and membrane bioreactor processes. Review. Bioresour. Technol. 2013, 139, 363–374. [Google Scholar] [CrossRef] [PubMed]
- Daigger, G.T.; Crawford, G.V.; Johnson, B.R. Full-Scale Assessment of the Nutrient Removal Capabilities of Membrane Bioreactors. Water Environ. Res. 2010, 82, 806–818. [Google Scholar] [CrossRef] [PubMed]
- Ahmed, Z.; Lim, B.-R.; Cho, J.; Ahn, K.-H. Effects of the internal recycling rate on biological nutrient removal and microbial community structure in a sequential anoxic/anaerobic membrane bioreactor. Bioprocess Biosyst. Eng. 2007, 30, 61–69. [Google Scholar] [CrossRef] [PubMed]
- Ding, A.; Qu, F.; Liang, H.; Ma, J.; Han, Z.; Yu, H.; Guo, S.; Li, G. A novel integrated vertical membrane bioreactor (IVMBR) for removal of nitrogen from synthetic wastewater/domestic sewage. Chem. Eng. J. 2013, 223, 908–914. [Google Scholar] [CrossRef]
- Fenu, A.; Roels, J.; Wambecq, T.; De Gussem, K.; Thoeye, C.; De Gueldre, G.; Van De Steene, B. Energy audit of a full scale MBR system. Desalination 2010, 262, 121–128. [Google Scholar] [CrossRef]
- Germain, E.; Stephenson, T. Biomass Characteristics, Aeration and Oxygen Transfer in Membrane Bioreactors: Their Interrelations Explained by a Review of Aerobic Biological Processes. Rev. Environ. Sci. Biotechnol. 2005, 4, 223–233. [Google Scholar] [CrossRef]
- Lousada-Ferreira, M.; Geilvoet, S.; Moreau, A.; Atasoy, E.; Krzeminski, P.; van Nieuwenhuijzen, A.; van der Graaf, J. MLSS concentration: Still a poorly understood parameter in MBR filterability. Desalination 2010, 250, 618–622. [Google Scholar] [CrossRef]
- Ren, N.; Chen, Z.; Wang, A.; Hu, D. Removal of organic pollutants and analysis of MLSS–COD removal relationship at different HRTs in a submerged membrane bioreactor. Int. Biodeterior. Biodegrad. 2005, 55, 279–284. [Google Scholar] [CrossRef]
- Yang, M.; Yu, D.; Liu, M.; Zheng, L.; Zheng, X.; Wei, Y.; Wang, F.; Fan, Y. Optimization of MBR hydrodynamics for cake layer fouling control through CFD simulation and RSM design. Bioresour. Technol. 2017, 227, 102–111. [Google Scholar] [CrossRef]
- Insel, G.; Hocaoğlu, M.; Cokgor, U.; Orhon, D. Modelling the effect of biomass induced oxygen transfer limitations on the nitrogen removal performance of membrane bioreactor. J. Membr. Sci. 2011, 368, 54–63. [Google Scholar] [CrossRef]
- Sarioglu, M.; Sayi-Ucar, N.; Cokgor, E.; Orhon, D.; van Loosdrecht, M.C.M.; Insel, G. Dynamic modeling of nutrient removal by a MBR operated at elevated temperatures. Water Res. 2017, 123, 420–428. [Google Scholar] [CrossRef] [PubMed]
© 2019 by the authors. Licensee MDPI, Basel, Switzerland. This article is an open access article distributed under the terms and conditions of the Creative Commons Attribution (CC BY) license (http://creativecommons.org/licenses/by/4.0/).