Article

Synthesis and Characterization of Natural Extracted Precursor Date Palm Fibre-Based Activated Carbon for Aluminum Removal by RSM Optimization

by
Alfarooq O. Basheer
1,
Marlia M. Hanafiah
1,*,
Mohammed Abdulhakim Alsaadi
2,3,4,
Y. Al-Douri
5,2,6,
M.A. Malek
7,
Mustafa Mohammed Aljumaily
2 and
Seef Saadi Fiyadh
2
1
Center for Earth Sciences and Environment, Faculty of Science and Technology, Universiti Kebangsaan Malaysia, 43600 Bangi, Selangor, Malaysia
2
Nanotechnology and Catalysis Research Center (NANOCAT), University of Malaya, 50603 Kuala Lumpur, Malaysia
3
National Chair of Materials Science and Metallurgy, University of Nizwa, 611 Nizwa, Sultanate of Oman
4
Almaref University College, Al-Anbar 31001, Iraq
5
University Research Center, Cihan University Sulaimaniya, Sulaymaniyah 46002, Iraq
6
Department of Mechatronics Engineering, Faculty of Engineering and Natural Sciences, Bahcesehir University, 34349 Besiktas, Istanbul, Turkey
7
Institute of Sustainable Energy (ISE), Universiti Tenaga Nasional, 43000 Kajang, Selangor, Malaysia
*
Author to whom correspondence should be addressed.
Processes 2019, 7(5), 249; https://doi.org/10.3390/pr7050249
Submission received: 28 February 2019 / Revised: 20 April 2019 / Accepted: 22 April 2019 / Published: 28 April 2019
(This article belongs to the Special Issue Wastewater Treatment Processes)

Abstract

:
The Powder-Activated Carbon (PAC) under optimum conditions from a new low-cost precursor Date Palm Fibre (DPF) biomass through a carbonization followed by KOH activation has been synthesized by response surface methodology (RSM) combined with central composite design (CCD). The special effects of activation temperature, time, and impregnation ratio on bio-PAC Aluminum (Al3+) removal and uptake capacity were examined. The optimum conditions for synthesized bio-PAC were found to be 99.4% and 9.94 mg·g−1 for Al3+ removal and uptake capacity, respectively at activation temperature 650 °C, activation time 1h and impregnation ratio 1. The optimum bio-PAC was characterized and analyzed using FESEM, FTIR, XRD, TGA, BET, and Zeta potential. RSM-CCD experimental design was used to optimize removal and uptake capacity of Al3+ on bio-PAC. Optimum conditions were found to be at bio-PAC dose of 5 mg with pH 9.48 and contact time of 117 min. Furthermore, at optimized conditions of Al3+ removal, kinetic, and isotherm models were investigated. The results reveal the feasibility of DPF biomass to be used as a potential and cost-effective precursor for synthesized bio-PAC for Al3+ removal.

1. Introduction

Concentrations of heavy metals in water are increased due to wastes of industrial, mining and human activities, and construction of siding and motor vehicles. In the aqueous systems, metals mobility and non-biodegradable are the most present and have the tendency to gather in living tissues, which may eventually lead to disorders and diseases [1,2,3]. One of the most important metals is Aluminum (Al3+), which is known to be a vital element in the earth’s layer. However, it holds an immense risk of negatively affecting health of both humans and animals at high concentrations [4,5,6].
According to the Environmental Protection Agency (EPA), the drinking water is not supposed to contain Al3+ more than 0.20 mg·L−1 [7]. Thus, it is necessary to get rid of Al3+ from water. In order to eliminate Al3+ and other heavy metals, several methods have been applied like biosorption [8], coagulation and flocculation [9], visual mesocaptor [10], membrane processes [11], ion exchange, monolithic scaffolds [12], complexation, cementation, and chemical precipitation [13,14,15,16]. However, the incomplete metal elimination, constant input of chemicals and high costs are among the disadvantages of applied methods [17,18].
Previously, the adsorption technique has been proven to be one of the most effective methods due to its advantages such as simplicity of design, easy operation, environmentally friendly, cost-effective, high efficiency, and reusability of adsorbent [19]. Different adsorbents were used for water treatment including carbon, industrial wastes, zeolite, and natural clay. Carbon-based materials have been widely used in wastewater treatment due to their unique chemical and physical properties, such as chemical inertness, high surface area, and a large number of edge-plane-like defects [20]. In terms of ability for high removal efficiency of pollutants, powder-activated carbon (PAC) has been established to be superior compared to other adsorbents for wastewater treatment due to distinct advantages such as excellent adsorption characteristics, larger number of pores, simplicity of design and low cost substrate mainly from biomass [12,21,22,23]. The PAC has been produced from different sources including starch [24], clay [25], activated charcoal, wood charcoal, date-pit, and BDH-activated carbon, plants, algae, mushrooms, and bacteria [6,26]. However, these sources have some limitations such as low efficiency and high cost. Therefore, there is a need to identify new sources to serve as adsorbents for pollutants removal.
The Iraqi Date Palm Fibre (I-DPF) is proposed in the present study as a source of activated carbon since date palm is regarded as a very popular plant in Iraq. I-DPF is neither consumed by humans in any forms not preferred by animals. The responses towards the irradiance intensity, which affects the date palm’s production of carbon/nitrogen ratio, differs according to the type of the date palm. The I-DPF is selected due to availability of high ratio of carbon to nitrogen [27] (See Figure S1 and supplementary data).
Moreover, it has been reported that chemical activation leads to good surface area and better pore volume for removal and uptake capacity compared to physical activation [28]. Thus, the challenge associated with PAC formation is optimization of the process conditions to produce PAC acceptable for required application. The preparation variables include activation temperature, time and impregnation ratio for controlling the removal efficiency. The optimum value of process variables can be obtained by experimental design technique to optimize the interactions between the process variables.
In order to explore and study the possible exchanges and connections of three or more variables, it is believed to better rely on the Response Surface Methodology (RSM) [29]. RSM has been used by previous studies for preparing PAC, where the tentative experimental conditions were optimized by applying different types of precursors such as luscar char [30], coconut husk [31], Turkish lignite and olive-waste cakes [30,32]. So far, no information found in literature about optimization synthesis bio-PAC from I-DPF biomass using KOH activation agent for Al3+ removal by RSM.
Therefore, this study focuses on finding optimum operating conditions for synthesis, biomass powdered activated carbon (bio-PAC) from new precursor I-DPF. Furthermore, the bio-PAC at optimum condition was characterized and analyzed using physico-chemical techniques such as FESEM, FTIR, XRD, TGA, BET and Zeta potential and utilized for Al3+ ions removal from water. RSM was applied to obtain the maximum adsorption capacity of bio-PAC. In addition, the effect of adsorbent dose, pH and time were studied and optimized using RSM. The isotherm and kinetics studies were performed according to the optimized conditions to provide better understanding of the adsorption process of Al3+ on bio-PAC from I-DPF.

2. Materials and Methods

2.1. Materials

Aluminum standard solution Al (NO3)3 × 9H2O, hydrolytic acid (HCl), sodium hydroxide (NaOH) and potassium hydroxide (KOH) were purchased from Merck (Malaysia). I-DPF was obtained from local farms in Basrah, Iraq and has been used as a raw material in the present study.

2.2. Preparation of Activated Carbon

Date palm fibre was dried for 24 h under the temperature of 105 °C before the surface-adhered particles were removed through washing the fibre with distilled water. Subsequently, another process of crushing and sieving the dried fibre to reach the carbonization phase at 700 °C under the purified nitrogen, 99.995% where the flow rate is 150 cm3/min over two hours. This process takes place in a horizontal tubular furnace where the heating was stabilized at 10 °C/min. Carbonized samples were scaled and soaked with KOH pallets at multiple impregnation ratio according to Equation (1):
I R = W K O H / W C a r b o n i z e d
where WKOH is the dry weight (g) of KOH pallets and WCarbonized is the dry weight (g) of carbonized. All the KOH pallets were dissolved by distilled water.
Oven was used to dry the mixture overnight at 105 °C. Similar to the carbonization phase, the activation step was applied through a vertical tubular furnace, but at different activation temperature and time. Depending on the activation temperature, carbon dioxide CO2 substitutes nitrogen in the gas flow of 150 cm3/min. The activated product was cooled to room temperature under a specific nitrogen flow. Finally, the samples were washed with hot deionized water and 0.1 M hydrochloric acid (HCL) for pH of washing solution to reach 6–7.

2.3. Experimental Design and Optimization of Synthesized PAC

To figure out the best operating conditions for the synthesized bio-PAC, it is highly significant to determine the mutual connection among the varied procedures which is regarded as the key for Designing the Experiment (DoE). Moreover, there are some other crucial elements which need to be taken into consideration during the methodological design. DoE has to be economic and cost-efficient. On the other hand, the experimental time has to be decreased in order to save the material [29]. To analyze and demonstrate the problem in this present study besides processing optimization, the approach of Response Surface Methodology (RSM) was employed as it is considered to be a very effective statistical method [33,34].
The Central Composite Design (CCD) was utilized to plan experiments which allow the optimization of production parameters, comprising activation temperature and time and impregnation ratio, via the application of Design-Expert V7.0. These variables are summarized in Table 1. To make most of design response shown through the bio-PAC (removal %) and (uptake capacity mg·g−1), the process of optimization was conducted. The model implemented for the studied responses had to be adequate. Accordingly, the model’s suitability was justified by the performance of Analysis of Variance ANOVA. To assess the reliability and certainty of suggested model, the coefficient of determination (R2) was predicted. Additionally, the connection between different variables was inspected through the employment of RSM.

2.4. Adsorption Study

2.4.1. Screening of Different Conditions Adsorbent

A fixed dosage was conducted at 250 mL conical flasks of each adsorbent (50 mg) in 100 mL of 5 mg·L−1 concentration Al3+ standard solution and pH 6.5 was arranged via deionized water. The next step was aiming at attaining equilibrium through placing the flasks in a specific system where they were mechanically shaken with agitated speed, 180 rpm at a room temperature. Once the previously mentioned procedure was over, a syringe filter, 0.45 μm polypropylene membrane was used to filter the solution. After that, the inductively coupled plasma optical emission spectrometry (ICP-OES) Perkin Elmer Optima 7000 DV, Chicago, USA, was utilized to measure the final concentration of metal ion solution. All adsorbent conditions were optimized according to Al3+ removal and uptake capacity efficiency as listed in Table 2. The adsorbent which was found to have the highest removal and uptake capacity was chosen to conduct and explore additional studies. The removal percentage (%) and uptake capacity qc (mg·g−1) were calculated based on Equations (2) and (3), respectively [35]:
R e m o v a l   ( % ) = C o C e C o × 100
q c = ( C o C e ) V W
where Co and Ce are the starting concentration of Al3+ and concentration after a period (mg·L−1), respectively, qc is the amount of Al3+ adsorbed by bio-PAC (mg·g−1), V is the initial volume of the solution (L) and W is the dry adsorbent weight used (mg).

2.4.2. Optimization of Al3+ Adsorption

RSM and the software Design of Experts V7.0, CCD were applied to improve and enhance the conditions of Al3+ removal. The impact and connection of three parameters were investigated, specifically the amount of bio-PAC dosage (5–20 mg), contact time (5–120 min) and pH (3–11) as shown in Table 3. Uptake capacity (mg·g−1) and removal percentage (%) were adopted as a response function of optimization study. The primary concentration, 5 mg·L−1 was performed for the optimization. The Flasks were agitated on a shaker at 180 rpm.

2.4.3. Adsorption Isotherm and Kinetic Studies

The transfer rate of ions from the solution to surface of adsorbents and correlated factors are pivotal as they can be specified by implementing the kinetic study. The adsorbent efficiency is specified by the adsorption system kinetic rate and can determine the adsorbent possible applications [36]. The kinetic study was accomplished by fixing the adsorbent dosage and pH parameters. Different values of Al3+ ions concentrations, 3 and 5 mg·L−1, and at different contact times were studied until the equilibrium state was obtained after 92 min. In the present study, three well-known kinetic models were applied including pseudo-first-order, pseudo-second-order and intraparticle diffusion models.
The isotherm study includes the optimum condition of pH, the amount of adsorbent dosage and contact time which were obtained from the optimization study. Freundlich and Langmuir isotherm models were applied in the isotherm study. These aforementioned models are meant to describe the Al3+ ions adsorption to the bio-PAC surface where the initial concentration of Al3+ was varied from 3 to 40 mg·L−1 [37].

2.5. Characterization of Powder-Activated Carbon

The synthesis of bio-PAC was characterized at optimum condition. The Fourier transform infrared (FTIR) (Perkin Elmer spectrometer, Chicago, USA) was used to examine the exterior functional groups and chemical bonds, and the X-ray Diffraction (XRD) was utilized to analyze the adsorbent structure phase compositions and materials properties by Burker AXS D8 advance Karlsruhe,, Germany using Diffrac software, while the thermogravimertic (TGA) and differential thermogravimetry (DTG) were implemented to study the thermal oxidation using thermal analyzer (STA-6000 Perkin Elmer, Chicago, USA). A surface morphology was determined by Field Emission Scanning Electron Microscope (FESEM) model (ZEISS, MERLIN, UK) equipped with an energy dispersive X-ray spectrometer (EDX). Moreover, the surface area and pore size were determined by Brunauer-Emmett-Teller (BET) method (TriStar II 3020, USA). Additionally, the Zeta potential (Malvern, Zeta sizer, UK) was employed to measure the surface charge.

3. Results and Discussion

3.1. Model Establishment and Analysis

RSM and CCD were used to examine the CO2 decomposition which may be influenced by the activation temperature, time and KOH ratio. Hence, 16 rounds were completely performed besides using the analysis of variance (ANOVA) known as multiple variable analysis to study the impact on removal (%) and uptake capacity (mg·g−1. It was perceived that even though the coefficient of determination (R2) of 2FI (0.7403) model indicated close correlation, the 2FI model was more significant as its probability, Prob > F value was calculated, 0.0497 < 0.05 32. The 2FI model was selected for uptake capacity (mg·g−1) analysis due to higher R2 (0.7403), even though Prob value of mean < 0.05. Table 2 demonstrates the 16 runs’ results for both responses (removal % and uptake capacity mg·g−1) which were achieved through the DoE.

3.2. Statistical Analysis and Modelling

The ANOVA outcomes for removal (%) responses presented in Table 4 shows that the main effects of activation temperature (A), interaction of activation time (B) and impregnation ratio (C) of bio-PAC, as their Prob > F values were less than 0.05. Consequently, we can deduce that A and AC were the main factors for removal (%). The activation parameters remained, including the activation time (B), impregnation ratio (C), interaction of A and B (AB) were shown to have Prob > F values greater than 0.05. Therefore, these parameters hold less effect upon removal (%) over the studied range. Yet, to guarantee the chosen 2FI model stayed hierarchical, the previous mentioned model terms were still included in the analysis. Table 4 and Table 5 illustrate the accurate response data of removal (%) and uptake capacity (mg·g−1) to mean, linear, two-factor interaction (2FI), quadratic and cubic polynomial models, which were extracted through DoE. The regression equation for removal (%) is given by:
R e m o v a l   ( % ) = + 98.19 0.18 A 0.30 B 0.13 C + 0.07 A B + 0.67 A C 0.12 B C
where A embodies the activation temperature, B is the activation time and C is the impregnation ratio.
Equation (4) paves the way to better predict and compare between the experimental results and model values of removal (%) which is portrayed in Figure 1a. A simulated model was consistent with the results, which is designated by a high R2 value. Figure 1a exhibits the worthy merging between the experimental and expected values of removal (%).
The ANOVA outcomes for uptake capacity (mg·g−1) responses are presented in Table 3. The impact of A, parallel to removal (%), was very noteworthy with a Prob > F value that less than 0.05. Therefore, we can conclude that A was the major determinant of uptake capacity (mg·g−1). The other reaction parameters, such as B, C, the interaction of A and B (AB), the interaction of A and C (AC) revealed Prob > F values were higher than 0.05. Therefore, these parameters can be concluded had effect on uptake capacity (mg·g−1) over the studied range. The regression Equation (5) for uptake capacity (mg·g−1) is given by:
A d s o r p t i o n   C a p a c i t y = + 9.82 0.018 A 0.030 B 0.013 C + 7.628 E 003 A B + 0.067 A C 0.012 B
where A represents the activation temperature, B is the activation time and C is the impregnation ratio.
Equation (5) clarifies better comparison between experimental results and model values of uptake capacity (mg·g−1) which is shown in Figure 1b. A simulated model was consistent with the results, which is designated by a high R2 value. Figure 1b illustrated the exceptional merging between experimental and expected values of uptake capacity (mg·g−1).

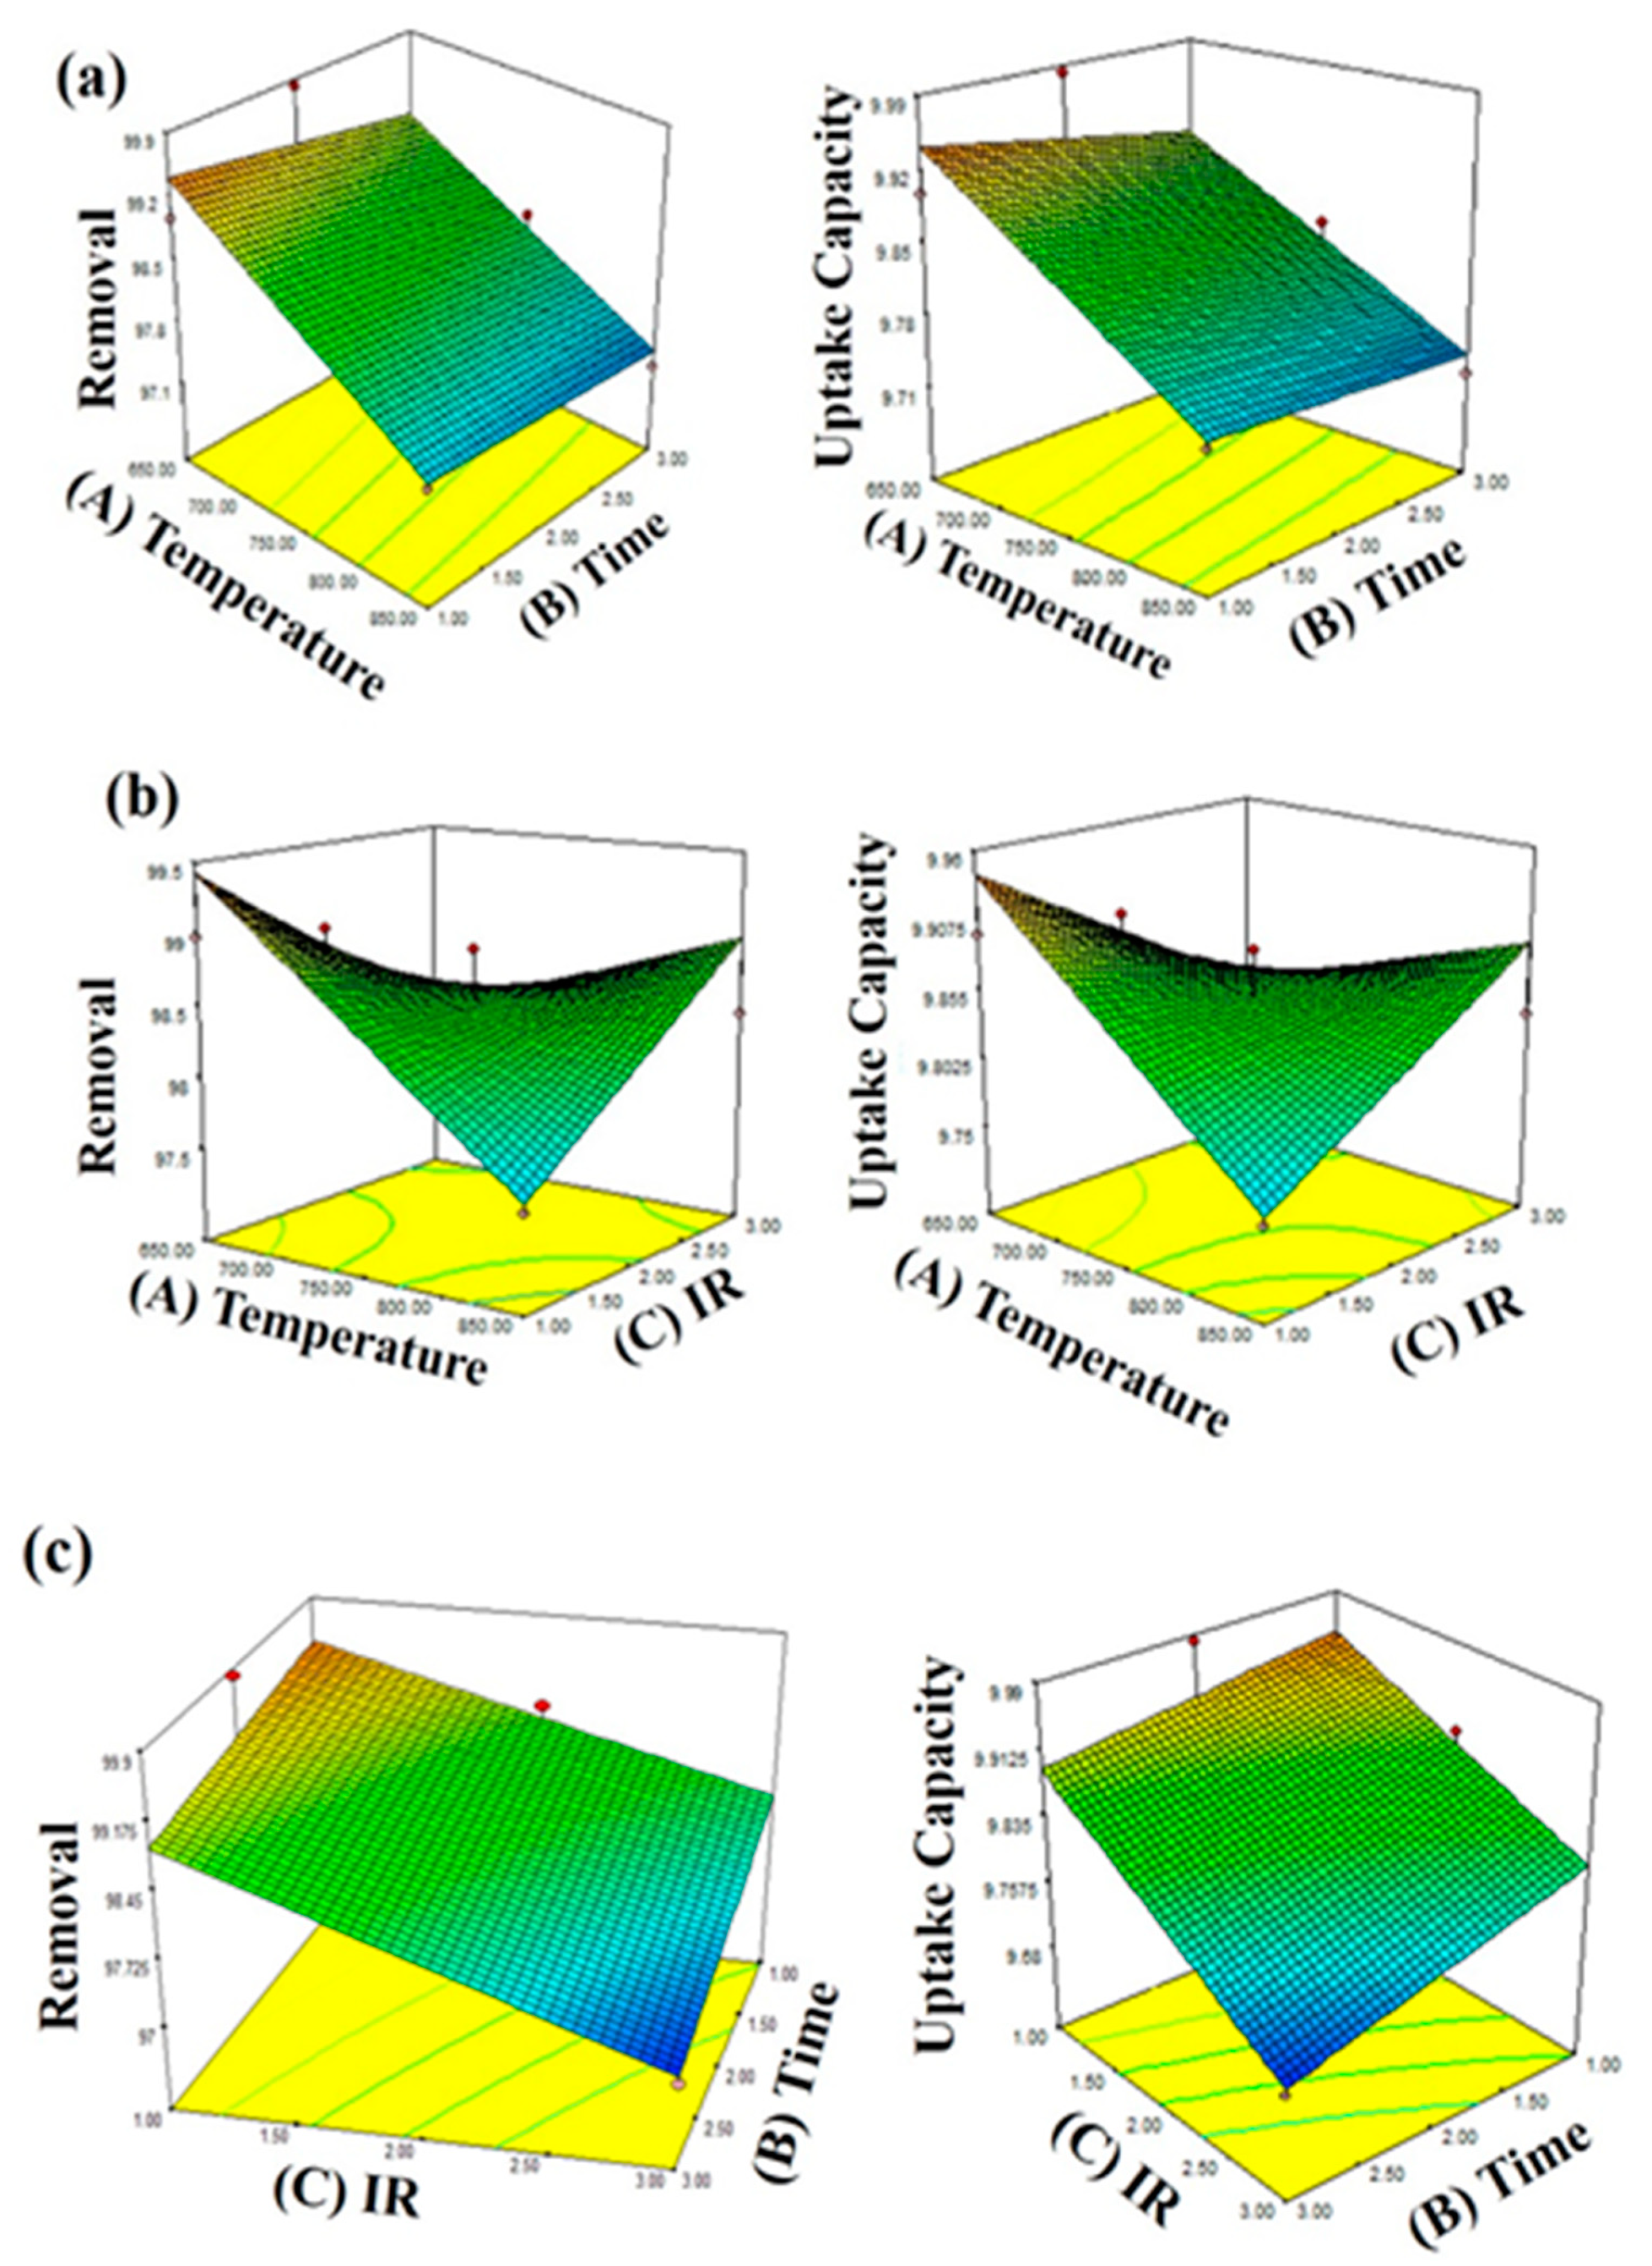
3.3. Effects of Activation Temperature, Activation Time, and Impregnation Ratio

The impact of three major variables on Al3+ removal (%) and uptake capacity (mg·g−1) through the creation of a three-dimensional response surface was displayed in Figure 2. Moreover, Figure 2 demonstrated a three-dimensional surface graphs and contour plots between the factors. Activation temperature imposed greater effect on powder-activated carbon removal (%) and uptake capacity (mg·g−1) compared to activation time as shown in Figure 2a [38]. It was detected that Al3+ removal augmented with the rise in the activation temperature. The maximum amount of latter lead to the highest Al3+ removal (%) and uptake capacity (mg·g−1). The bio-PAC could be broadened by elevating the activation temperature which made it more suitable for Al3+ removal (%) and uptake capacity (mg·g−1).
Similarly, Figure 2b presents the important interaction between the temperature and impregnation ratio. The increase in removal of Al3+ is related to the rise in KOH impregnation ratio. Accordingly, the removal (%) and uptake capacity (mg·g−1) are increased as the impregnation ratio increases due to vital role of KOH impregnation on bio-PAC pore structure. The massive growth and development of carbon materials were due to impregnation ratio which contains intercalated chemicals as it was elaborated by many researchers. From the other hand, the massive progression of carbon material leads to the formation of a wide surface area and high pore volume [31,39,40].
According to Figure 2c, under specific conditions, the interaction effect between activation time and KOH impregnation ratio (IR) has a slightly significant influence on the percentage of Al3+ removal (%) and uptake capacity (mg·g−1), implying the activation time gave no significant effect on pore form structure. While activation temperature and KOH impregnation ratio has significantly changed on pore form structure, the results obtained were in agreement with other works [31,41].

3.4. Optimization Study of Synthesis bio-PAC

RSM was used to optimize the variables which have an impact on the removal and uptake capacity of Al3+ from the aqueous solution. The CCD method was selected as the desired goal for each parameter and response. However, it turned out to be problematic to optimize the responses under the same circumstances because of diverse interest regions of variables.
Table 6 displays the optimum parameters from numerical optimization to acquire a high value of bio-PAC removal (%) and sufficient amount of bio-PAC uptake capacity (mg·g−1) together with the results from validation experiment. To further authenticate and confirm the developed model, an experiment was carried out through the previously mentioned optimum processing condition. The expected and experimental results of bio-PAC removal (%) and uptake capacity (mg·g−1) were in an upright covenant. As a result, the expectations from ANOVA model were ensured through the obtained results for both responses under the experimental conditions. The optimum preparation conditions for the maximum desirability were chosen and applied to prepare optimum bio-PAC.
The optimum bio-PAC was attained by applying an activation temperature 650 °C, activation time 1h and KOH impregnation ratio 1. The results show that the predicted removal of 99.423% and uptake capacity of 9.9423 mg·g−1 for Al3+ adsorption close to the experimental values with a slight error, 2.58%.

3.5. Analysis and Characterization

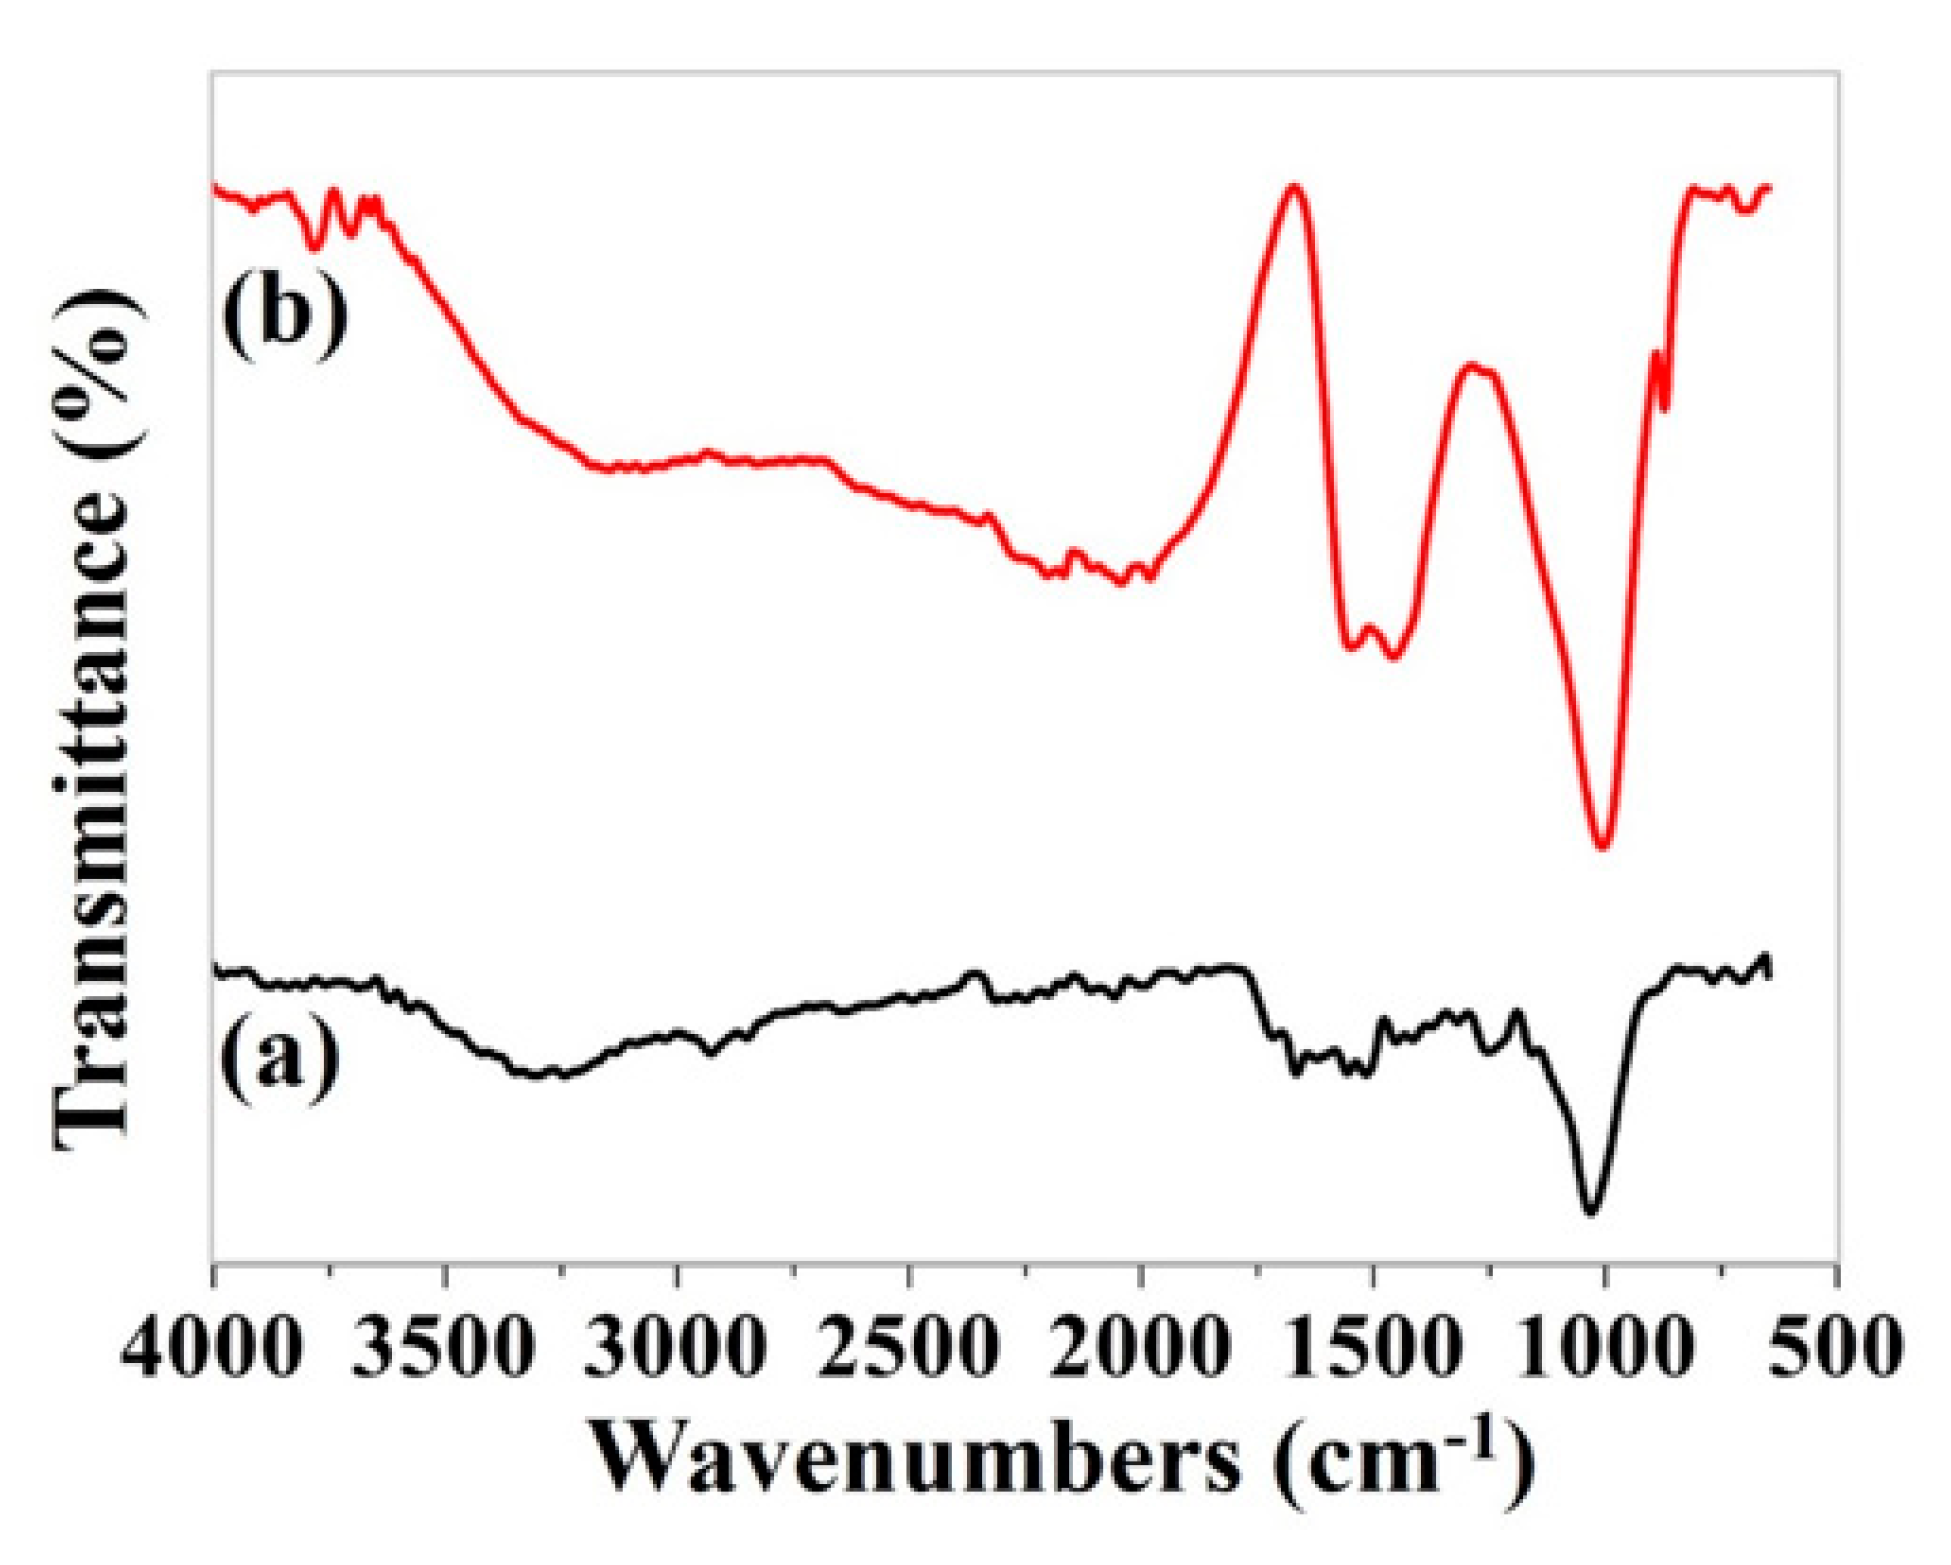
3.5.1. FTIR analysis
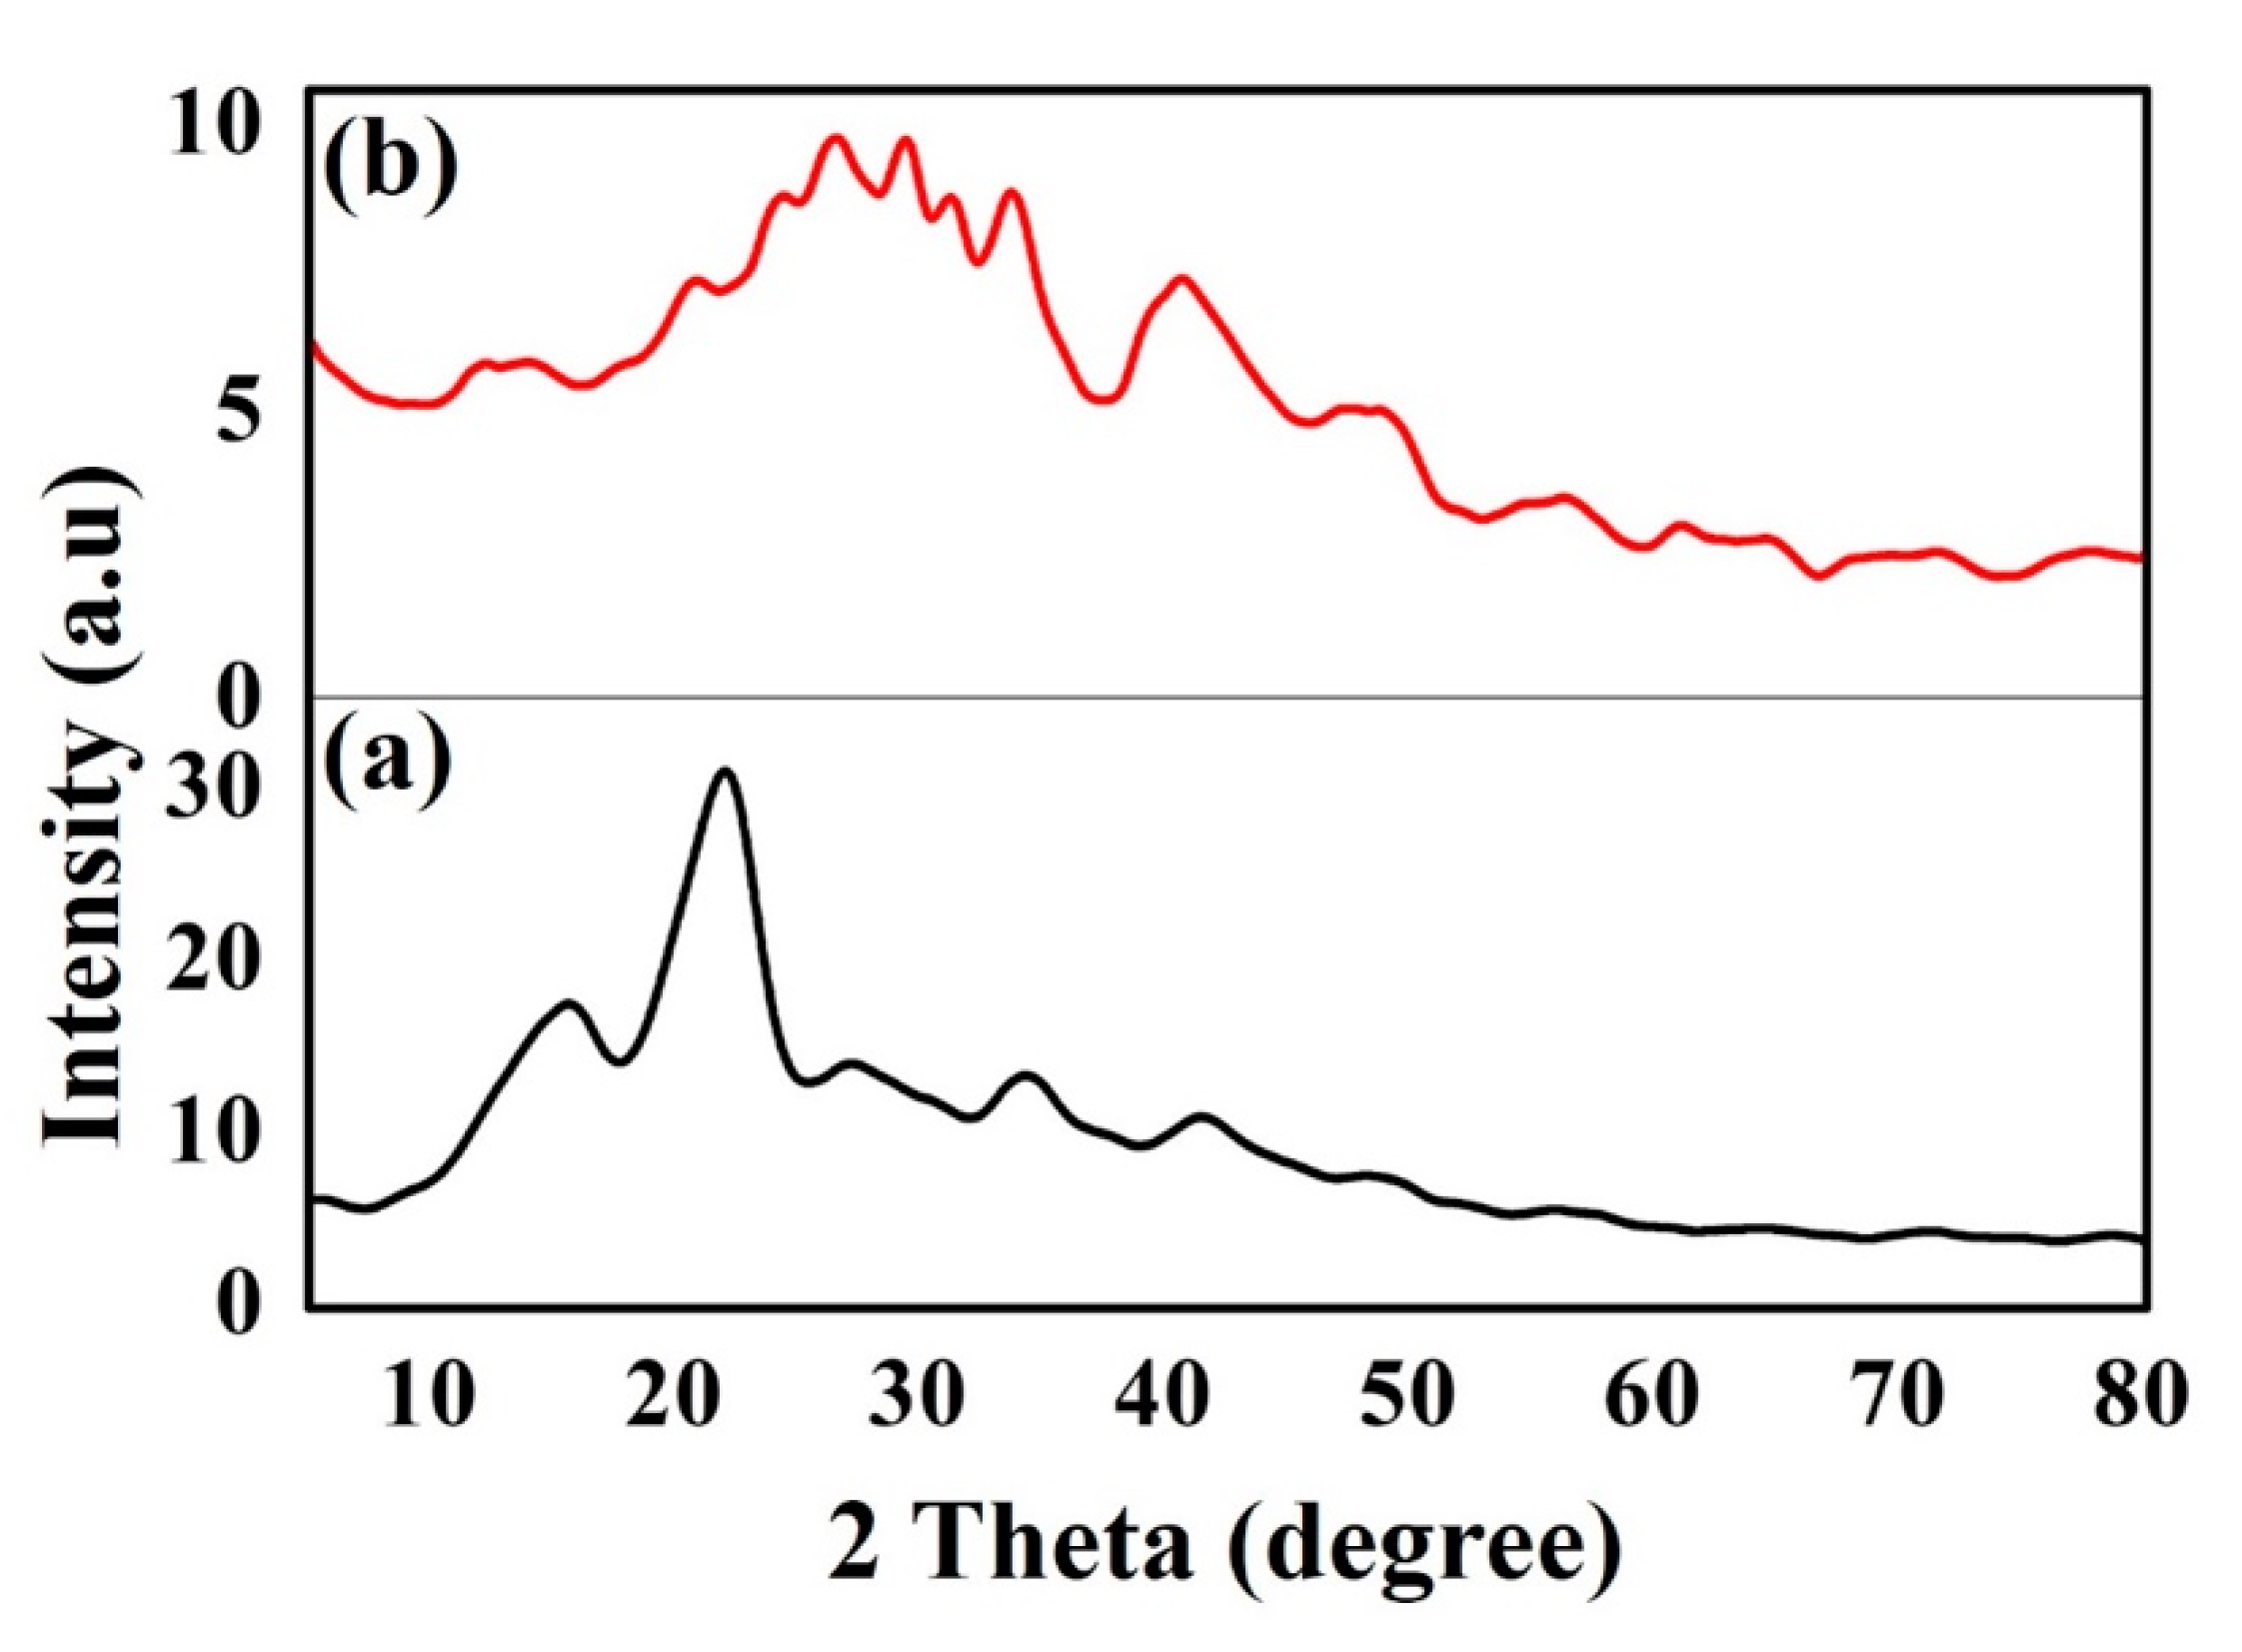
The spectrum of raw and bio-PAC are shown in Figure 3. The spectrum (a) of raw exhibits more functional groups at broad 3354 cm−1 indicates O-H stretching vibrations of cellulose, pectin, absorbed water, hemicellulose and lignin [42]. The notable band at 2889 cm−1 indicated by the vibration of C-H stretching of methyl groups. The peak at 1607 cm−1 is responsible for N-H bond stretching. Moreover, bands between 1242 and 1030 cm−1 could be dedicated to the stretching vibration of carboxylic acids alcohols C-O and phenol group. In addition, spectrum (b) shows that the bio-PAC processes of the O-H stretching vibration peaks loses its strength and intensity due to the evaporation of moisture and volatile contents [43]. It has been strikingly observed that the unique peak in the range of 2154 cm−1 is specified for C=O stretch of CO2. The band at 1559 cm−1 is attributed to C=C vibration in aromatic rings [44]. Thus, the appearance shoulder of band at 873 cm−1 is indicated to vibration stretching in C-H. The presence of functional groups plays an important function in the adsorption of pollutant ions.

3.5.2. XRD Analysis

The XRD is a fundamental method for evaluating the carbon staking structure [45]. XRD patterns are shown in Figure 4. Raw (a) and bio-PAC (b) show amorphous structure together, which is a valuable property for highly porous material. The raw amorphous structure was contributed with high content of hemicellulose and lignin [46]. The reduction of amorphous structure was observed for the conversion of raw to bio-PAC (Figure 4b) due to hemicellulose and the lignin which are exposed to high temperature [47]. The wide diffraction pattern exhibits a peak at 29.39° and 43.33°, that is attributed to (002) and (101) reflections of graphite, respectively. These peaks demonstrate a partially graphitic layer structure of bio-PAC. The hemicellulose and lignin were disappeared due to degradation of activated DPF which is in line with FTIR results as shown in Figure 3.

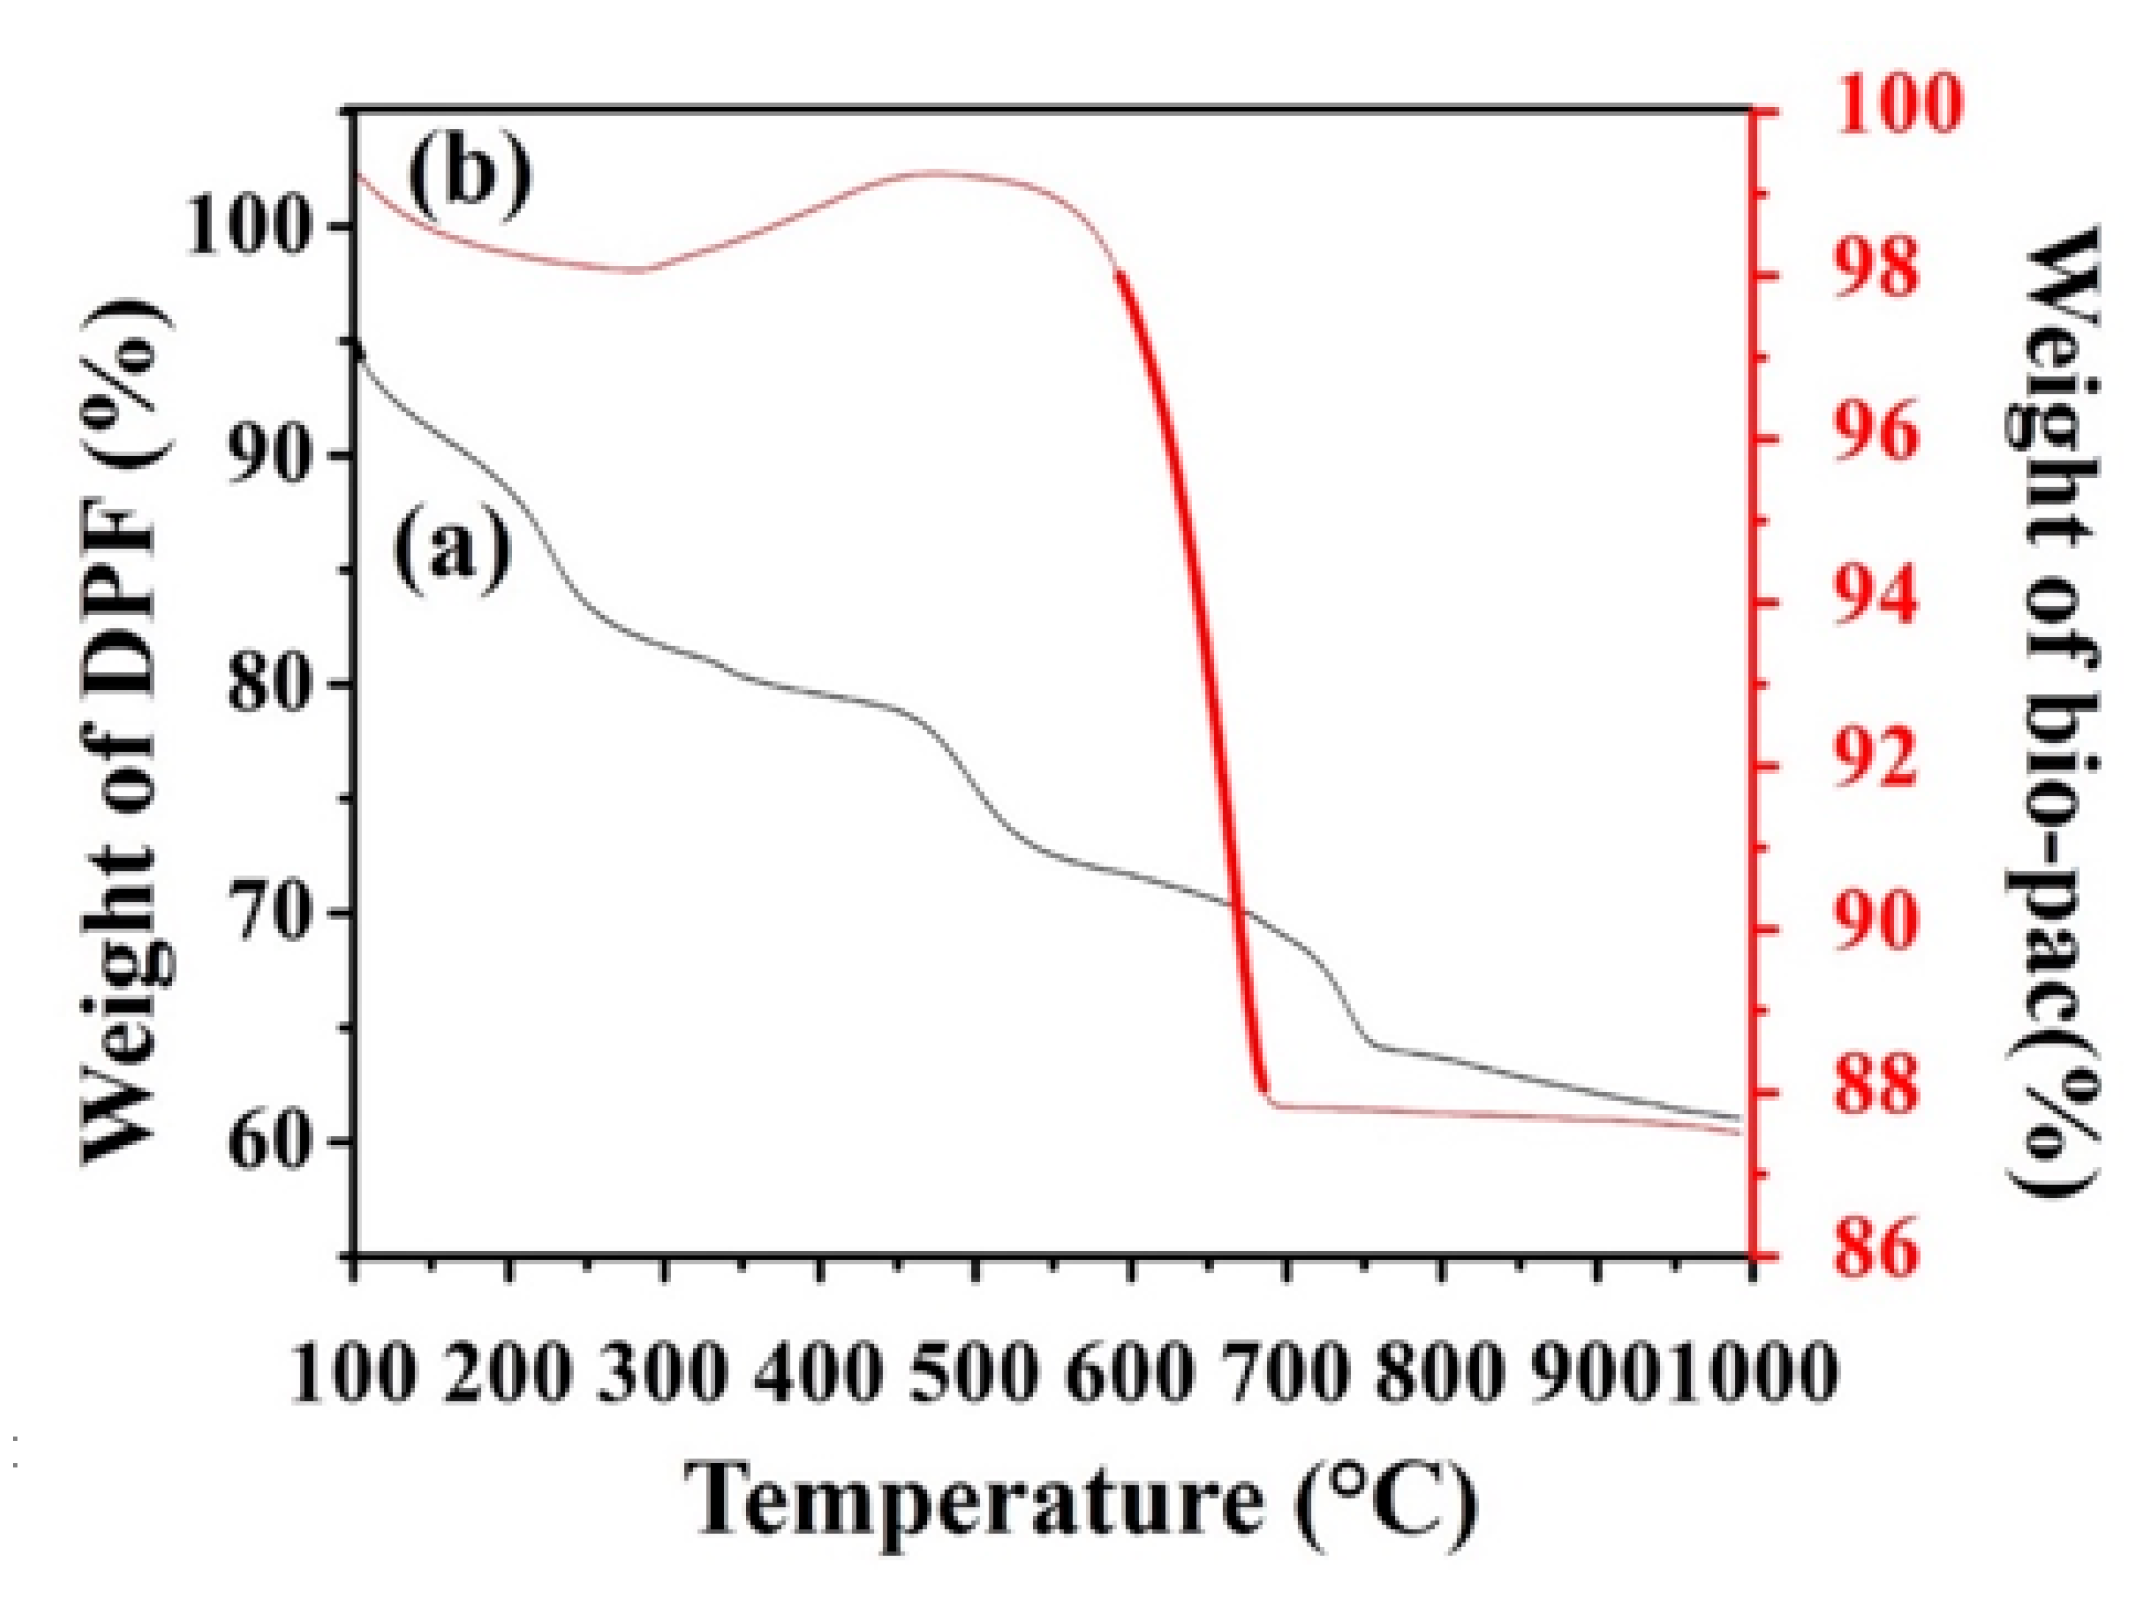
3.5.3. Thermogravimetric Analysis (TGA)

The behavior of TGA curves with a heating step in oxygen of DPF as illustrated in Figure 5 comprises of 157, 445, 540 and 724 °C. The first peak at 157 °C can be explained by the volatilization, hemicelluloses material in TFC and the moisture loss from the surface. The evaporation of these smaller volatile molecules due to the decomposition of thermal treatment [48]. Until the temperature reached 445 °C, the massive loss of DPF sample was documented at only 20%. The degradation of DPF began at 445 °C and resulted in 30% of weight loss. On the other hand, the degradation of bio-PAC started at 541.6 °C. The sharp mass degradation of amorphous carbon oxidizes around 500 °C. This huge loss was caused by CO2 release from the bio-PAC. At temperature 570.39 °C, the immense losses were 12.94%. It was mainly due to lignin decomposition since the lignin decomposes over a broad range of temperature.

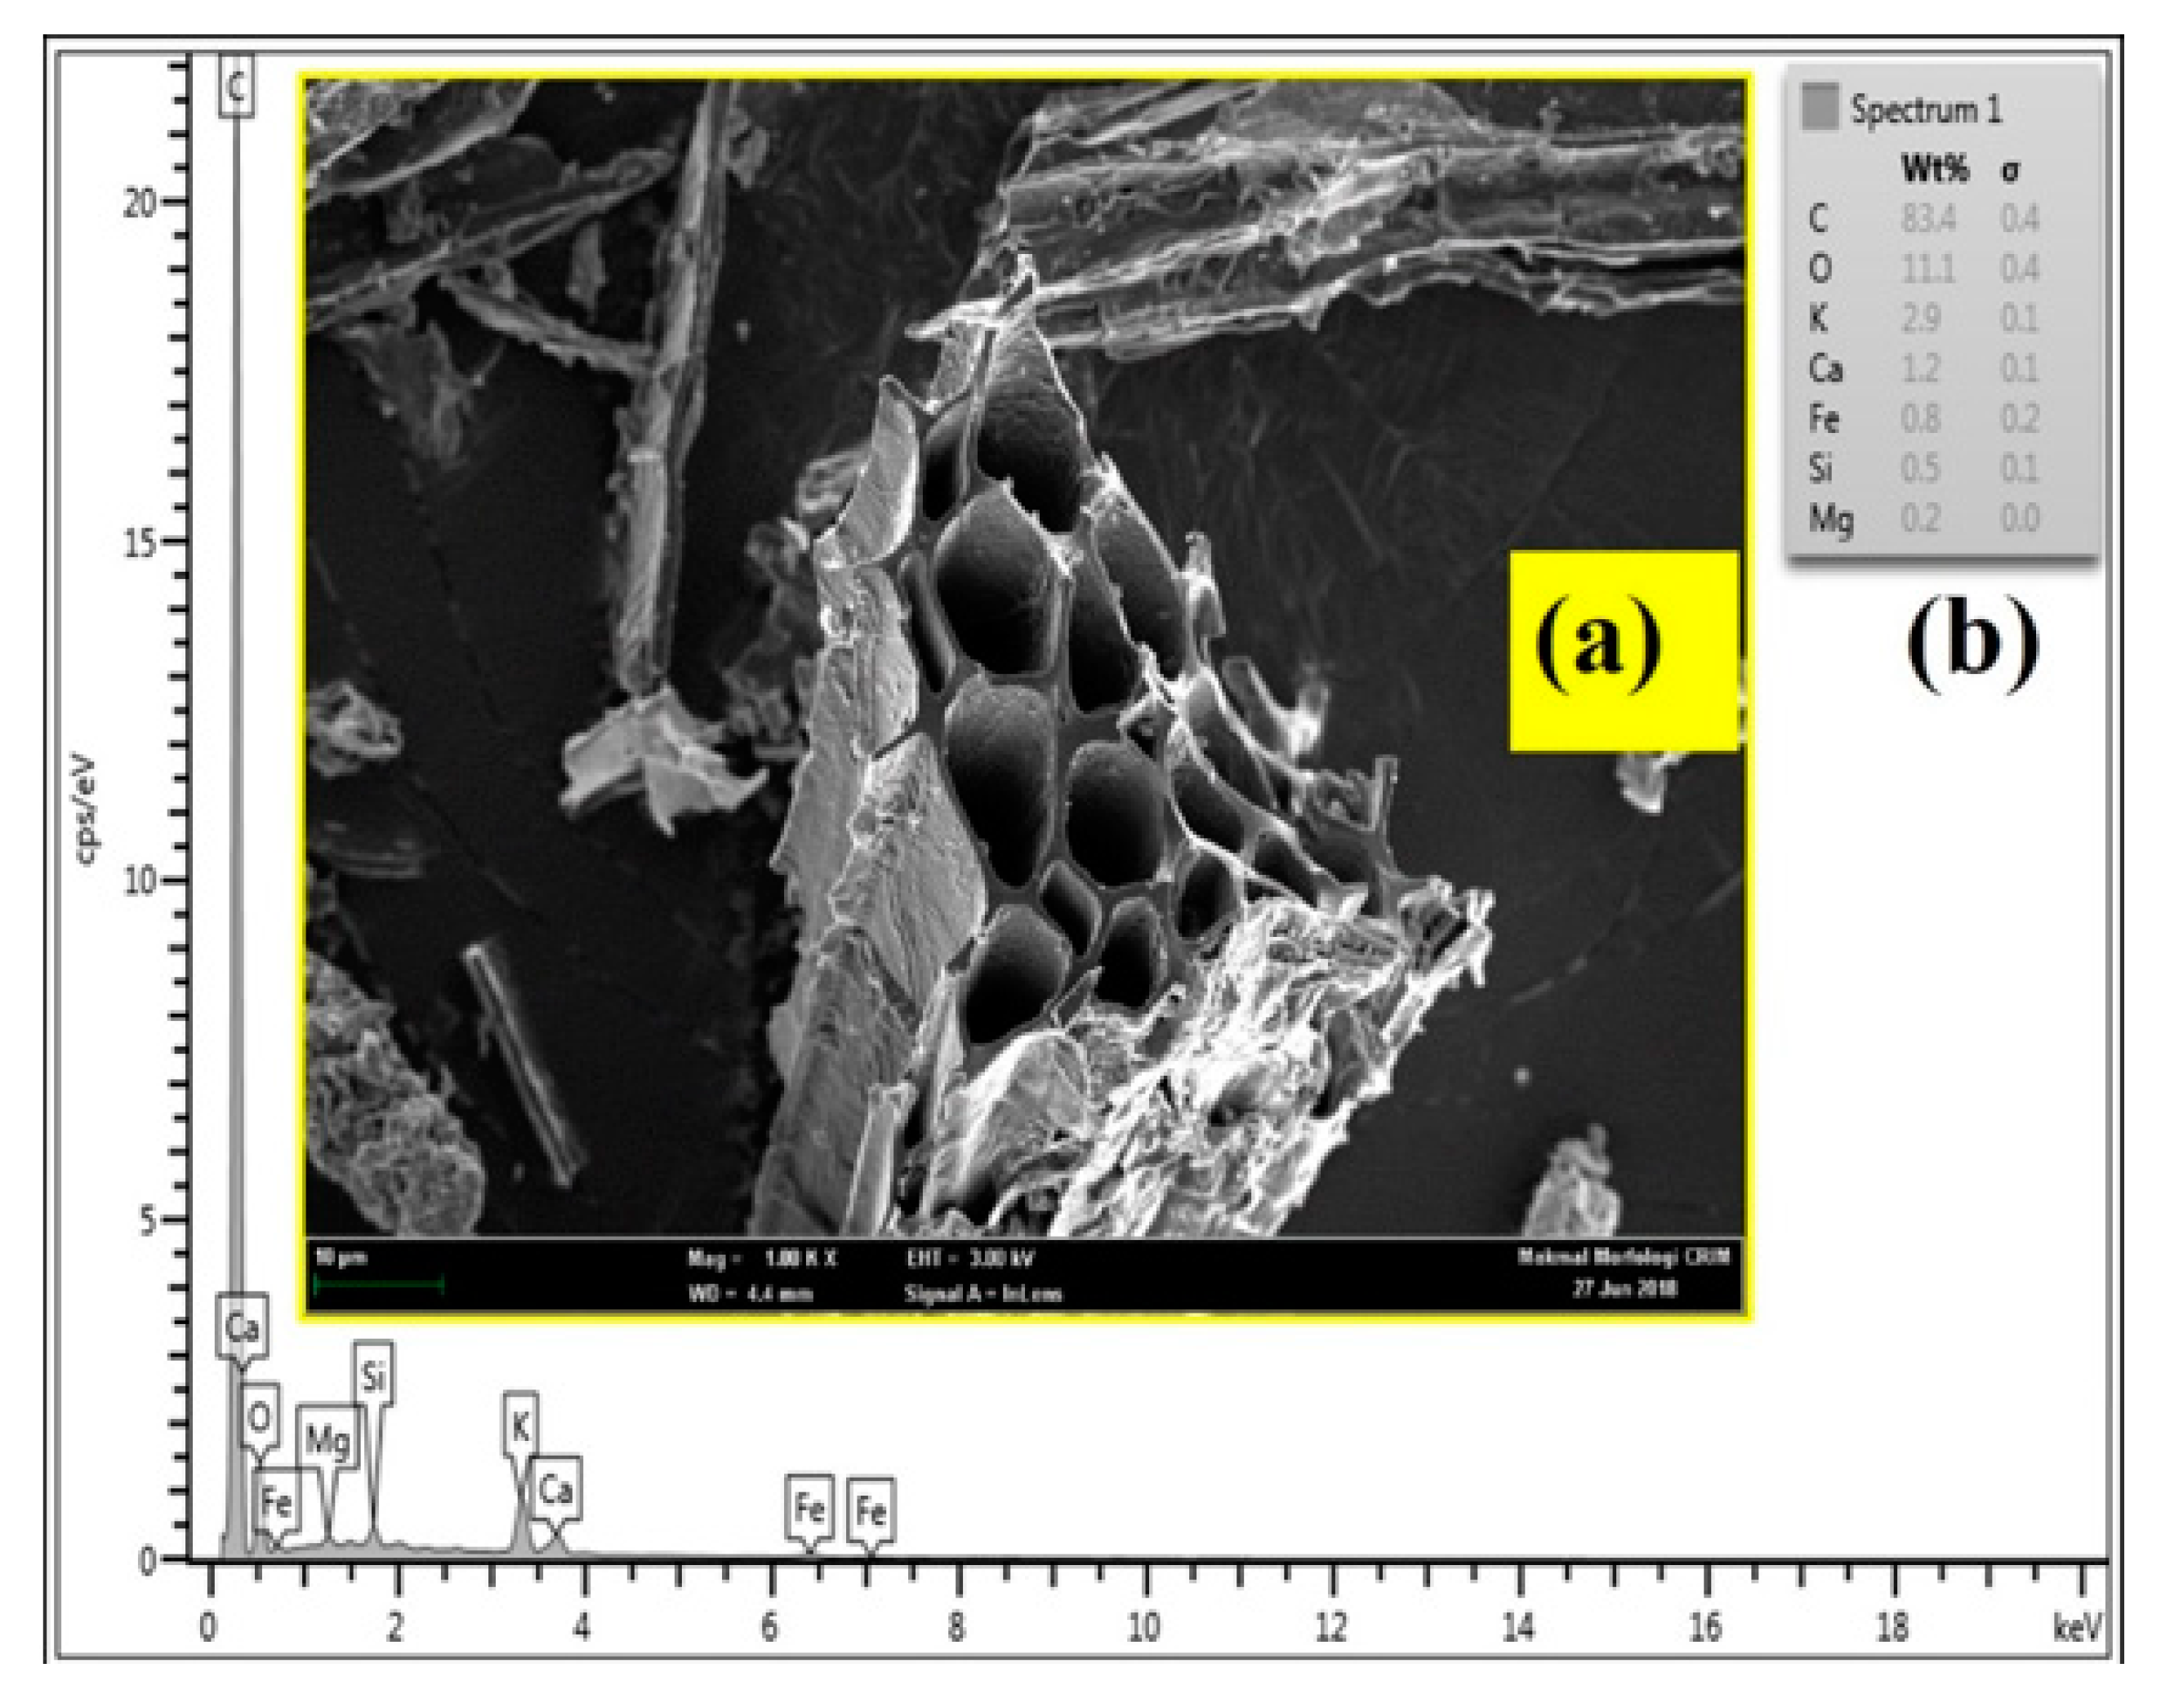
3.5.4. FESEM and EDX
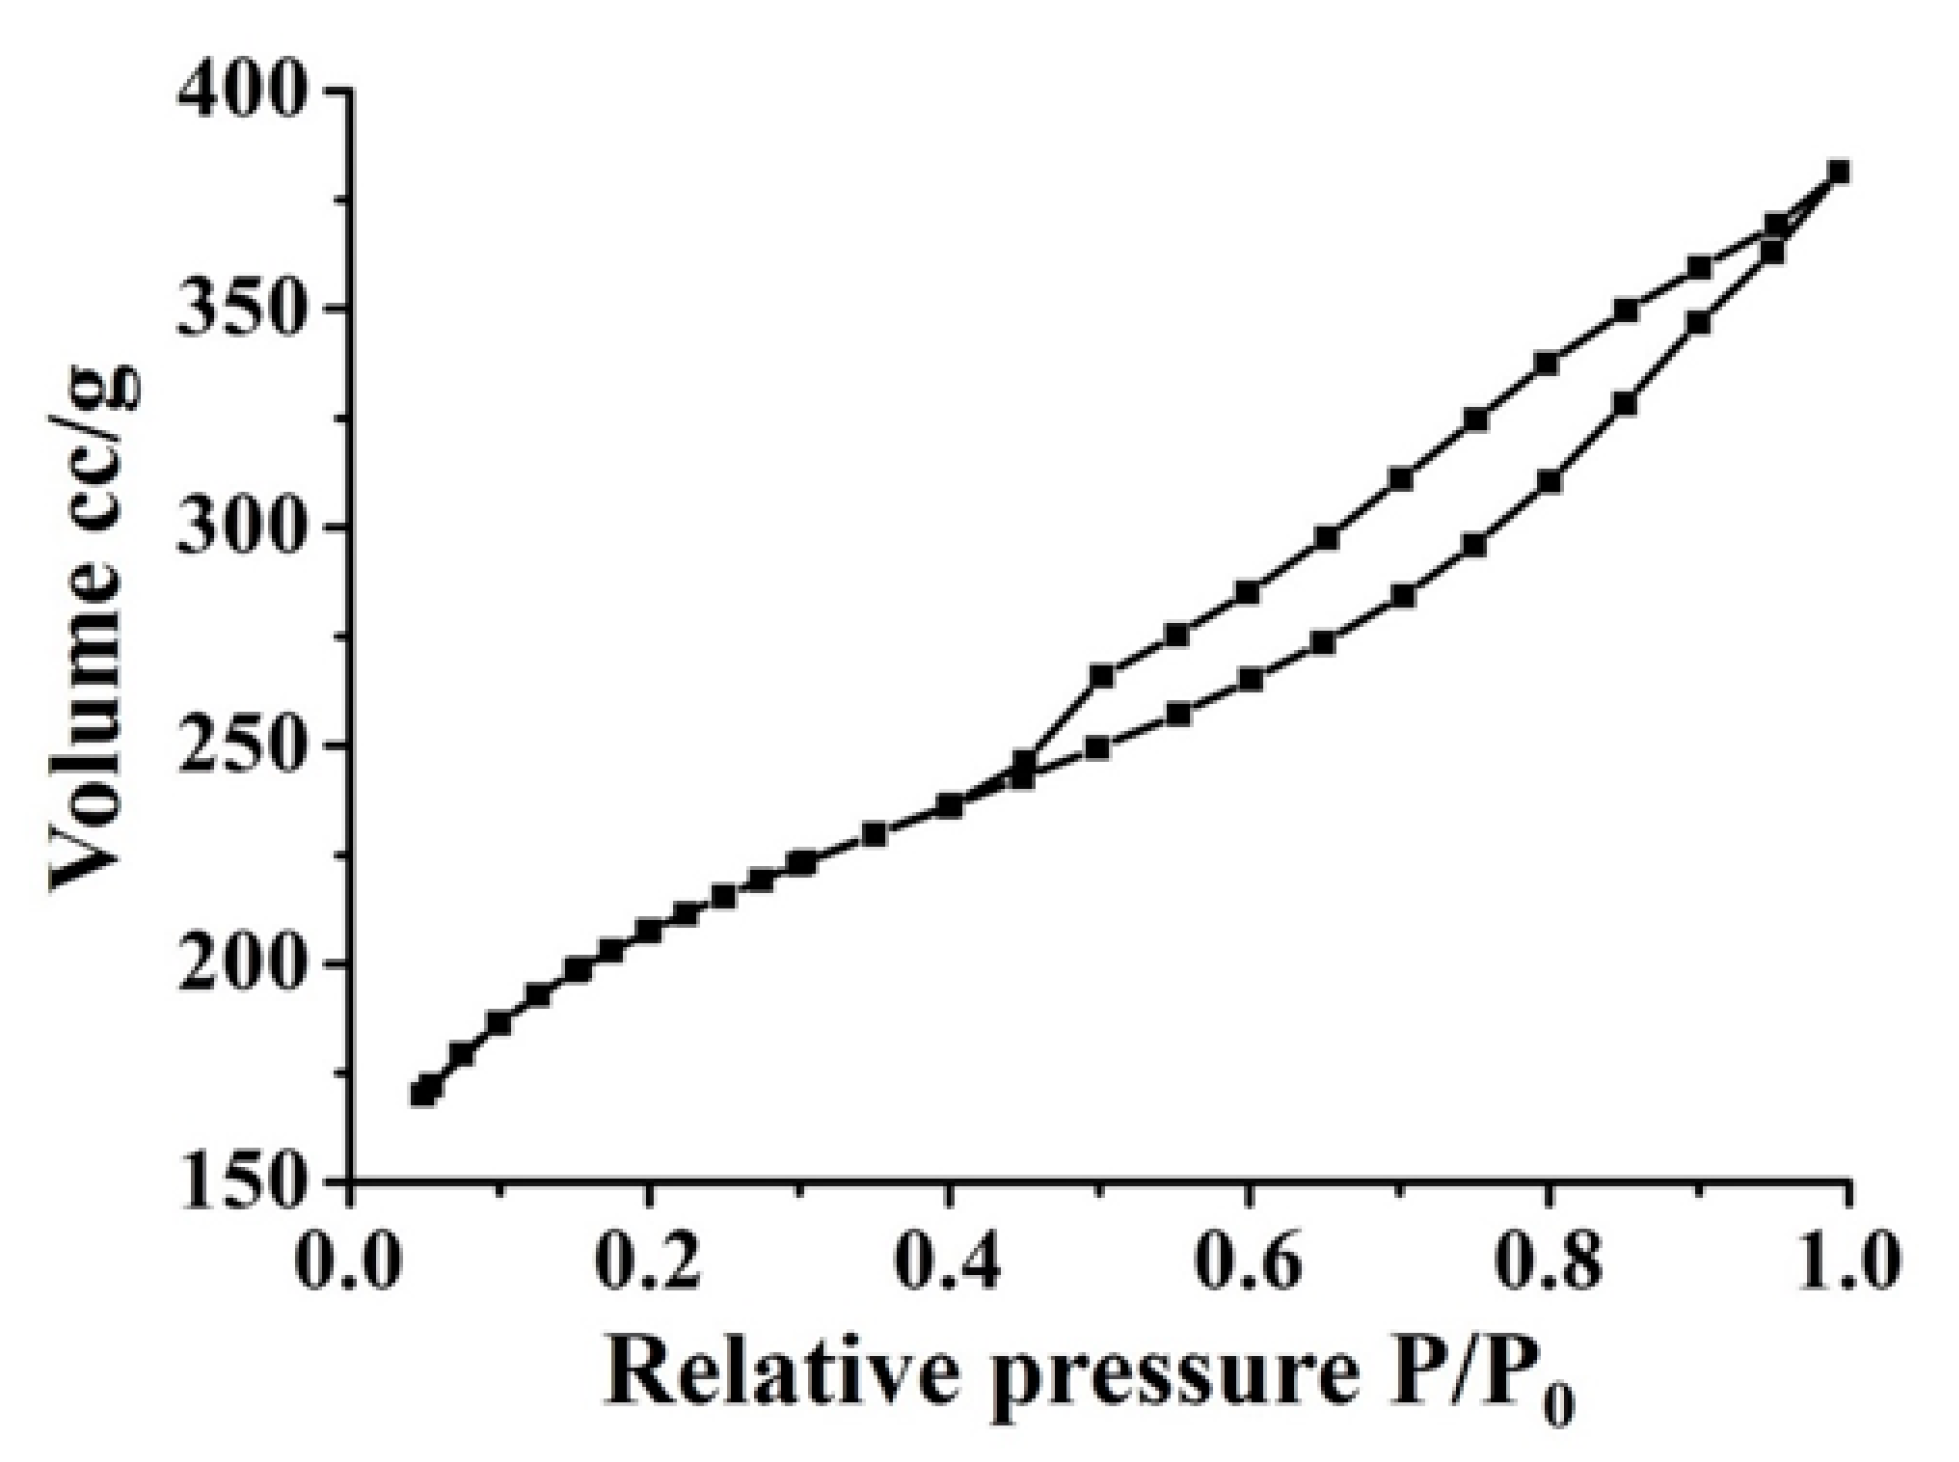
FESEM and EDX are given in Figure 6. FESEM was used to investigate the surface morphology of bio-PAC which is synthesized from the optimum condition of DPF. The pore size distribution is believed to have a harmonious and a fairly identical affiliation with pore arrangement as it was illustrated in Figure 6a,b. It was pointed out in the micrograph images that cylinder-like tubes compose the pore structure of the prepared bio-PAC. The activated carbon made of jute and coconut fibres were reflecting the same trend [49]. Furthermore, it was revealed that the formulation of a high surface area with well-built and developed pores on the fibre surface can be effectively reached through the KOH which works as an activating agent along with the activation procedure. EDX spectroscopy was used to determine the element composition of bio-PAC as illustrated in Figure 6c.

3.5.5. BET Analysis

The nitrogen adsorption isotherm of bio-PAC is shown in Figure 7. This adsorption isotherm exhibits type IV according to IUPC classification and hysteresis loops were observed around 0.45 which is demonstrated by mesoporous material. The pore size of bio-PAC can be categorized into three types micropores (<2 nm), mesopores (2–50 nm) and macropores (>50 nm) [12,50]. BET surface area, pore volume and pore diameter of bio-PAC were 669.72 m2/g, 0.312 cc/g and 1.53 nm, respectively. Therefore, the prepared bio-PAC can be classified as a material which has pores in the mesoporous category.
Particularly, the adsorption mechanism of bio-PAC depends on the mesoporous capacity. The existence of mesoporous in bio-PAC might enhance the adsorption of Al3+ from wastewater. Ghani et al. [51] highlighted that mesoporous is highly important for adsorption in the liquid phase because it may act as diffusion channels.

3.5.6. Zeta Potential

Zeta potential refers to the potential of electric at the interfacial of stationary fluid layer attached to the adsorbent. 10 mg of bio-PAC was dispersed in 20 mL. The zeta potential was measured as a function of pH ranges from 3–11. The results revealed that the surface charge of bio-PAC increased from 0.0415 to−0.0602. The effect of pH on the surface charge can be clearly observed in Figure 8. This phenomenon might be attributed to ionization of oxygen comprising of functional groups on the surface like -OH and –COOH which is matched with FTIR analysis [52]. Moreover, the pH of the adsorbent can be changed to negative or positive charge. When the pH adsorbent < pHzpc adsorbent, the adsorption of negative is chosen. In opposition, the adsorption of positive is chosen when pH adsorbate > pHzpc adsorbent [53,54]. The alkaline pHzpc value attained by the bio-PAC was possibly due to the presence of alkaline earth, alkaline metal (K) and metal (Mg) on its surface as shown by EDX analysis (Figure 6).

3.6. Adsorption Study

3.6.1. Optimization and Analysis of Variance (ANOVA) on Adsorbent of Al3+

The optimization study was obtained by using RSM approach. The results of optimum parameters of each run, in terms of DoE are shown in Table 3. The highest removal and uptake capacity under optimum condition were amount of bio-PAC dose 5 mg, pH 9.48 and contact time 117 min as seen in Table 3.
The ANOVA of adsorption process on bio-PAC showed that the F-values are 48.89 and 92.30 which indicate that both removal (%) and uptake capacity (mg·g−1) models are significant. For removal (%), the values of “Prob > F” <0.0500 indicate that model terms are significant. In this case, B, C, AB, BC, B2 are considered to be significant model terms. However, for the cases of uptake capacity (mg·g−1) B, AB, BC, B2 are significant model terms. Table 7 and Table 8 listed the mean square, P-values, F-values and mean square for removal and uptake capacity.
Both models are assigned for removal (%) and uptake capacity (mg·g−1) with the followings Equations (6) and (7):
R e m o v a l   ( % ) = + 100.14 1.31 A + 12.99 B + 5.16 C 3.64 A B + 1.35 A C + 5.88 B C 2.04 A 2 26.72 B 2 2.82 C 2
U p t a k e   c a p a c i t y   ( m g g ) = + 10.01 0.13 A + 1.30 B + 0.52 C 0.36 A B + 0.14 A C + 0.59 B C 0.20 A 2 2.67 B 2 0.28 C 2
where A, B and C represented bio-PAC dose, pH and contact time, respectively.

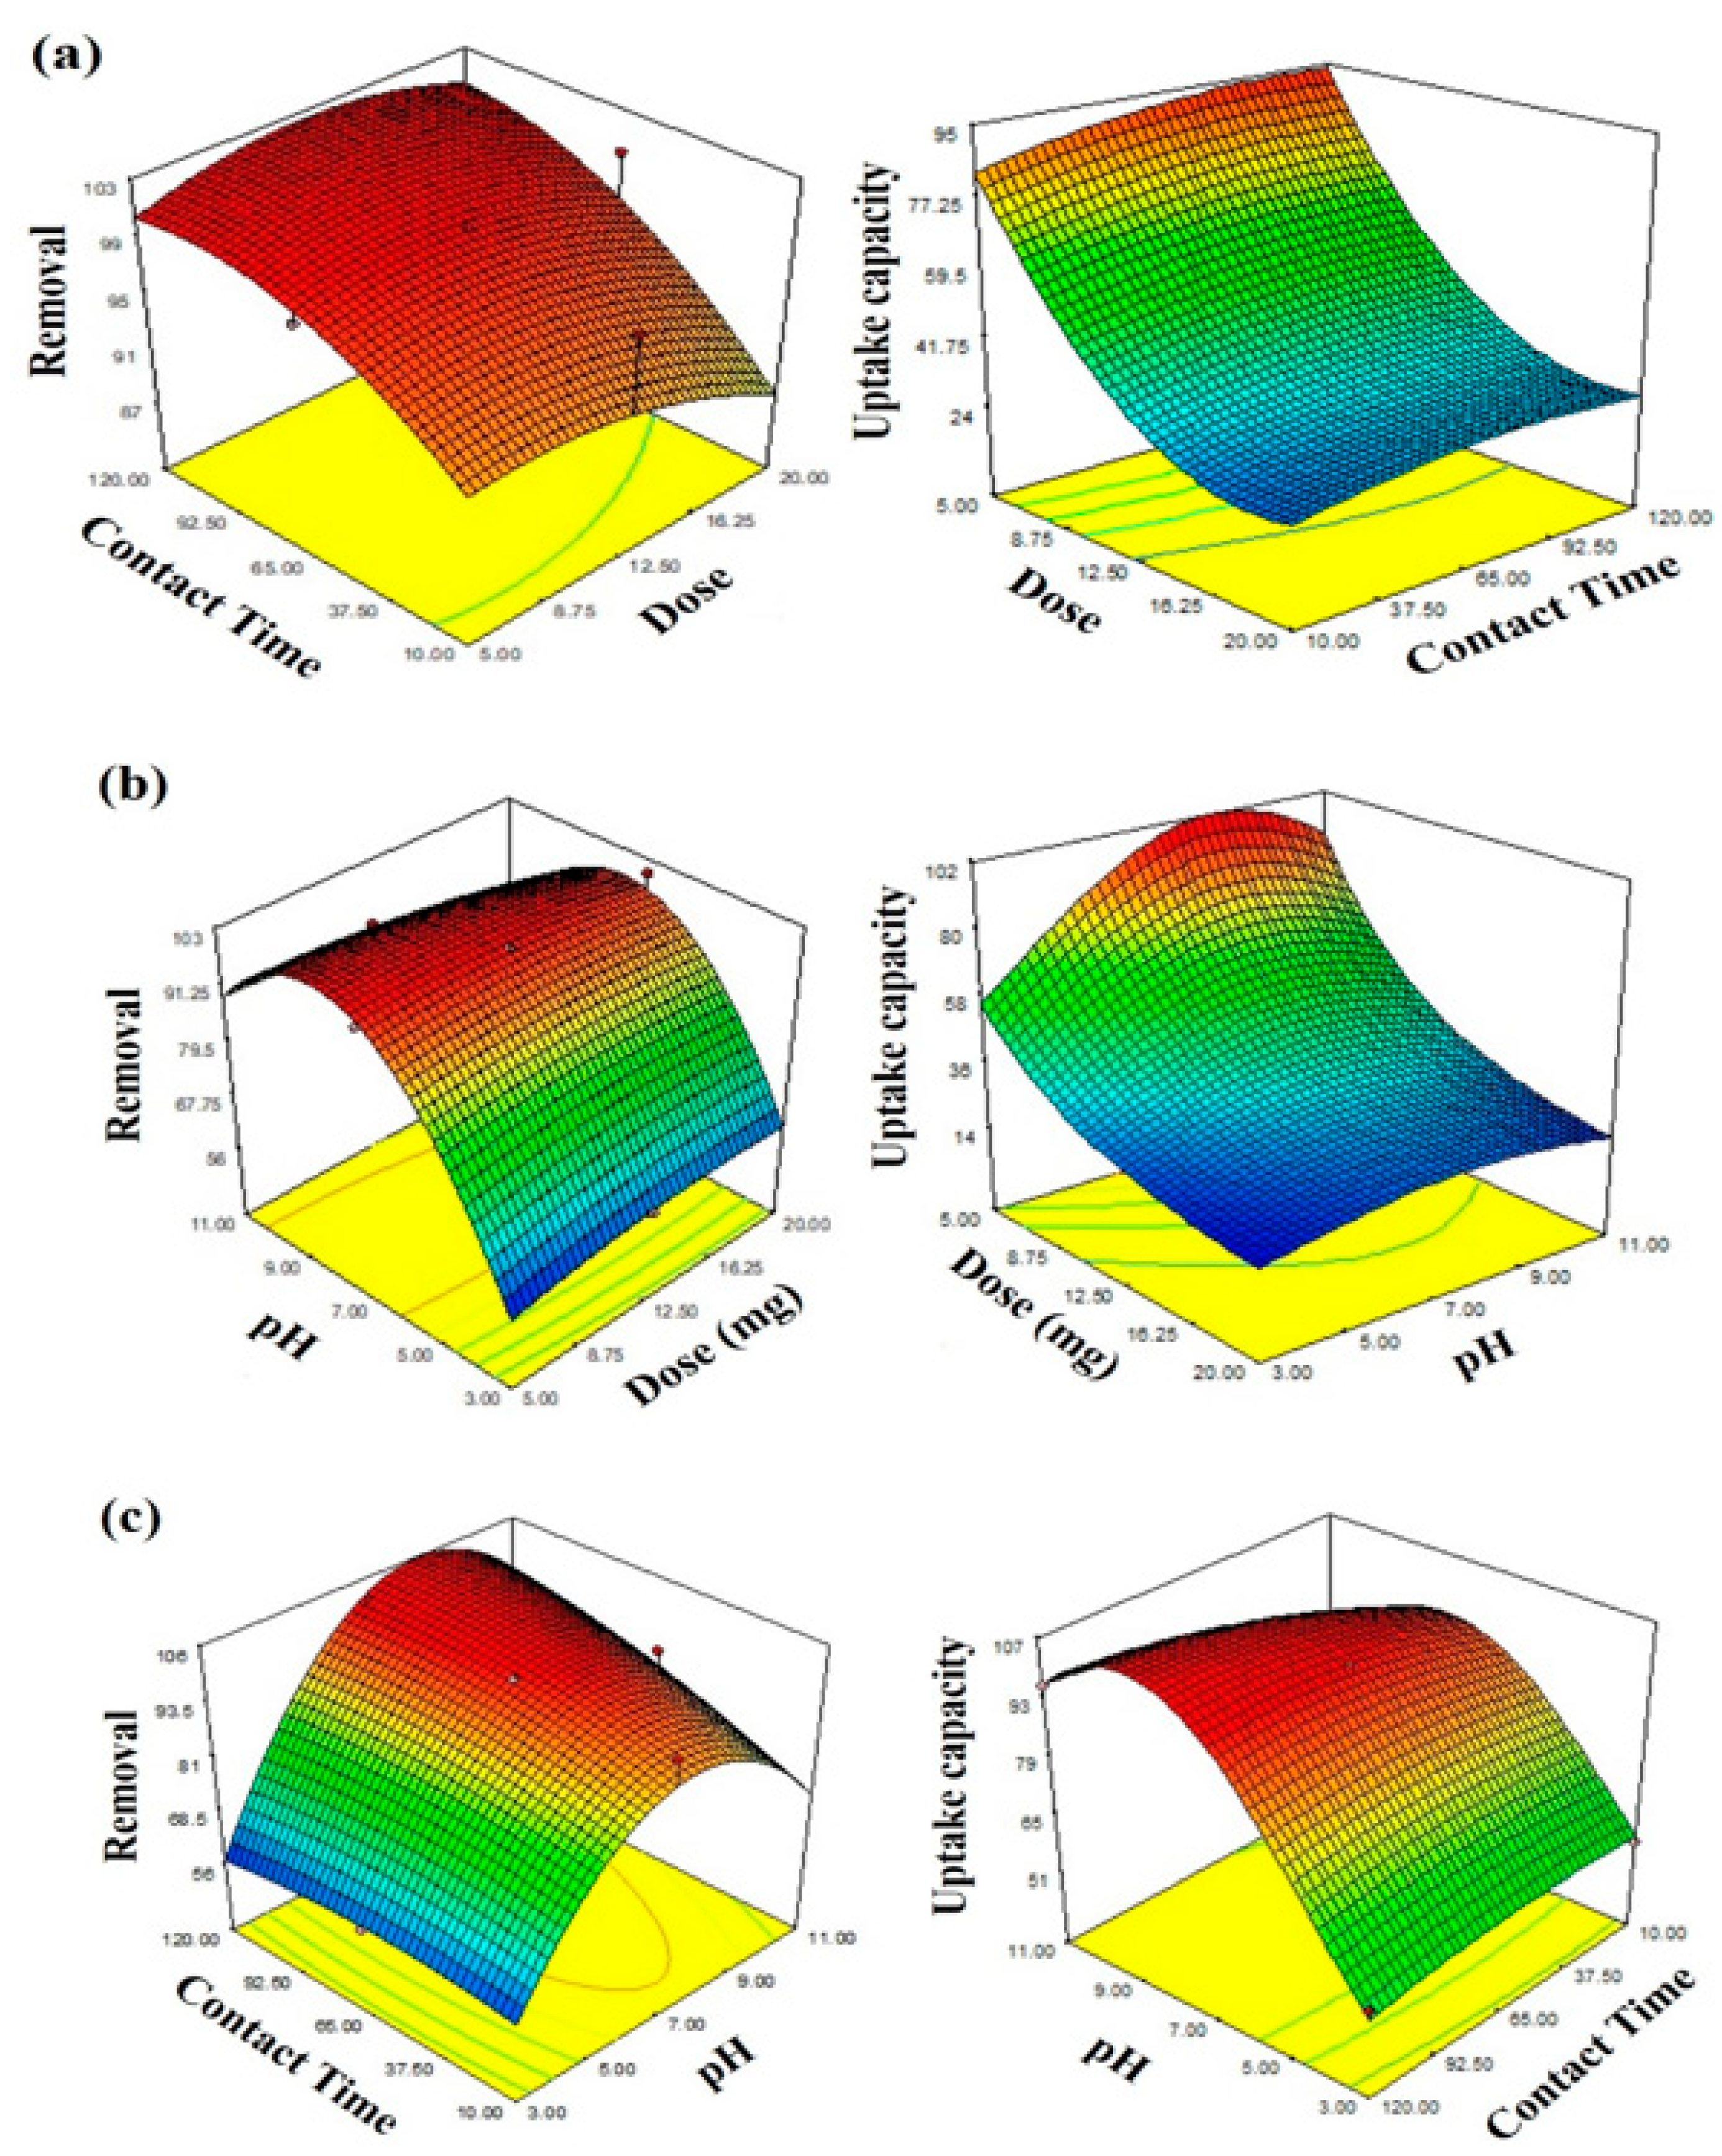
3.6.2. Effects of Optimization Variables on Adsorption of Al3+

The effects of bio-PAC dose and contact time on adsorption are shown in Figure 9a. Contact time has significantly affected the optimization of Al3+ removal and uptake capacity compared to bio-PAC dose [55]. Figure 9b demonstrates the interaction effect between bio-PAC dose and pH on removal (%) and uptake capacity (mg·g−1) at a specific time. Active sites concentration can be increased if the amount of adsorbent is augmented. Consequently, this aids at regulating the adsorption solution of electrostatic charge according to the desired level by eliminating the competitive H+ cations. From the other hand, setting a particular pH and contact time rises the adsorbent dose removal, unlike the uptake capacity which was found to be decreased.
The effect between pH and contact time on the adsorption process is presented in Figure 9c. The removal (%) augmented with pH increasing and extended the maximum pH 9.48, followed by a sudden reduction with the increasing pH. Moreover, the uptake capacity (mg·g−1) observed a similar trend where it reached its maximum pH 9.48 and became constant [56].
It is very common that high values of pH lead to the rapid emergence of heavy metals [57]. Therefore, the impact of OH anions existing in the solution results into the precipitation of Al3+ in a form of Al3+ (NO3) [58]. For the sake of altering and regulating the pH, the primary concentration measurement was taken. Thus, the impact of precipitation will be at its minimum upon the adsorption process of bio-PAC [59].
Regardless the precipitation phenomena, the rise of pH effect reduces the overall amount of H+ cations that are in competition with the Al3+ cations for occupying the active sites on the adsorbent. Furthermore, high pH improves the adsorbent surface charge.

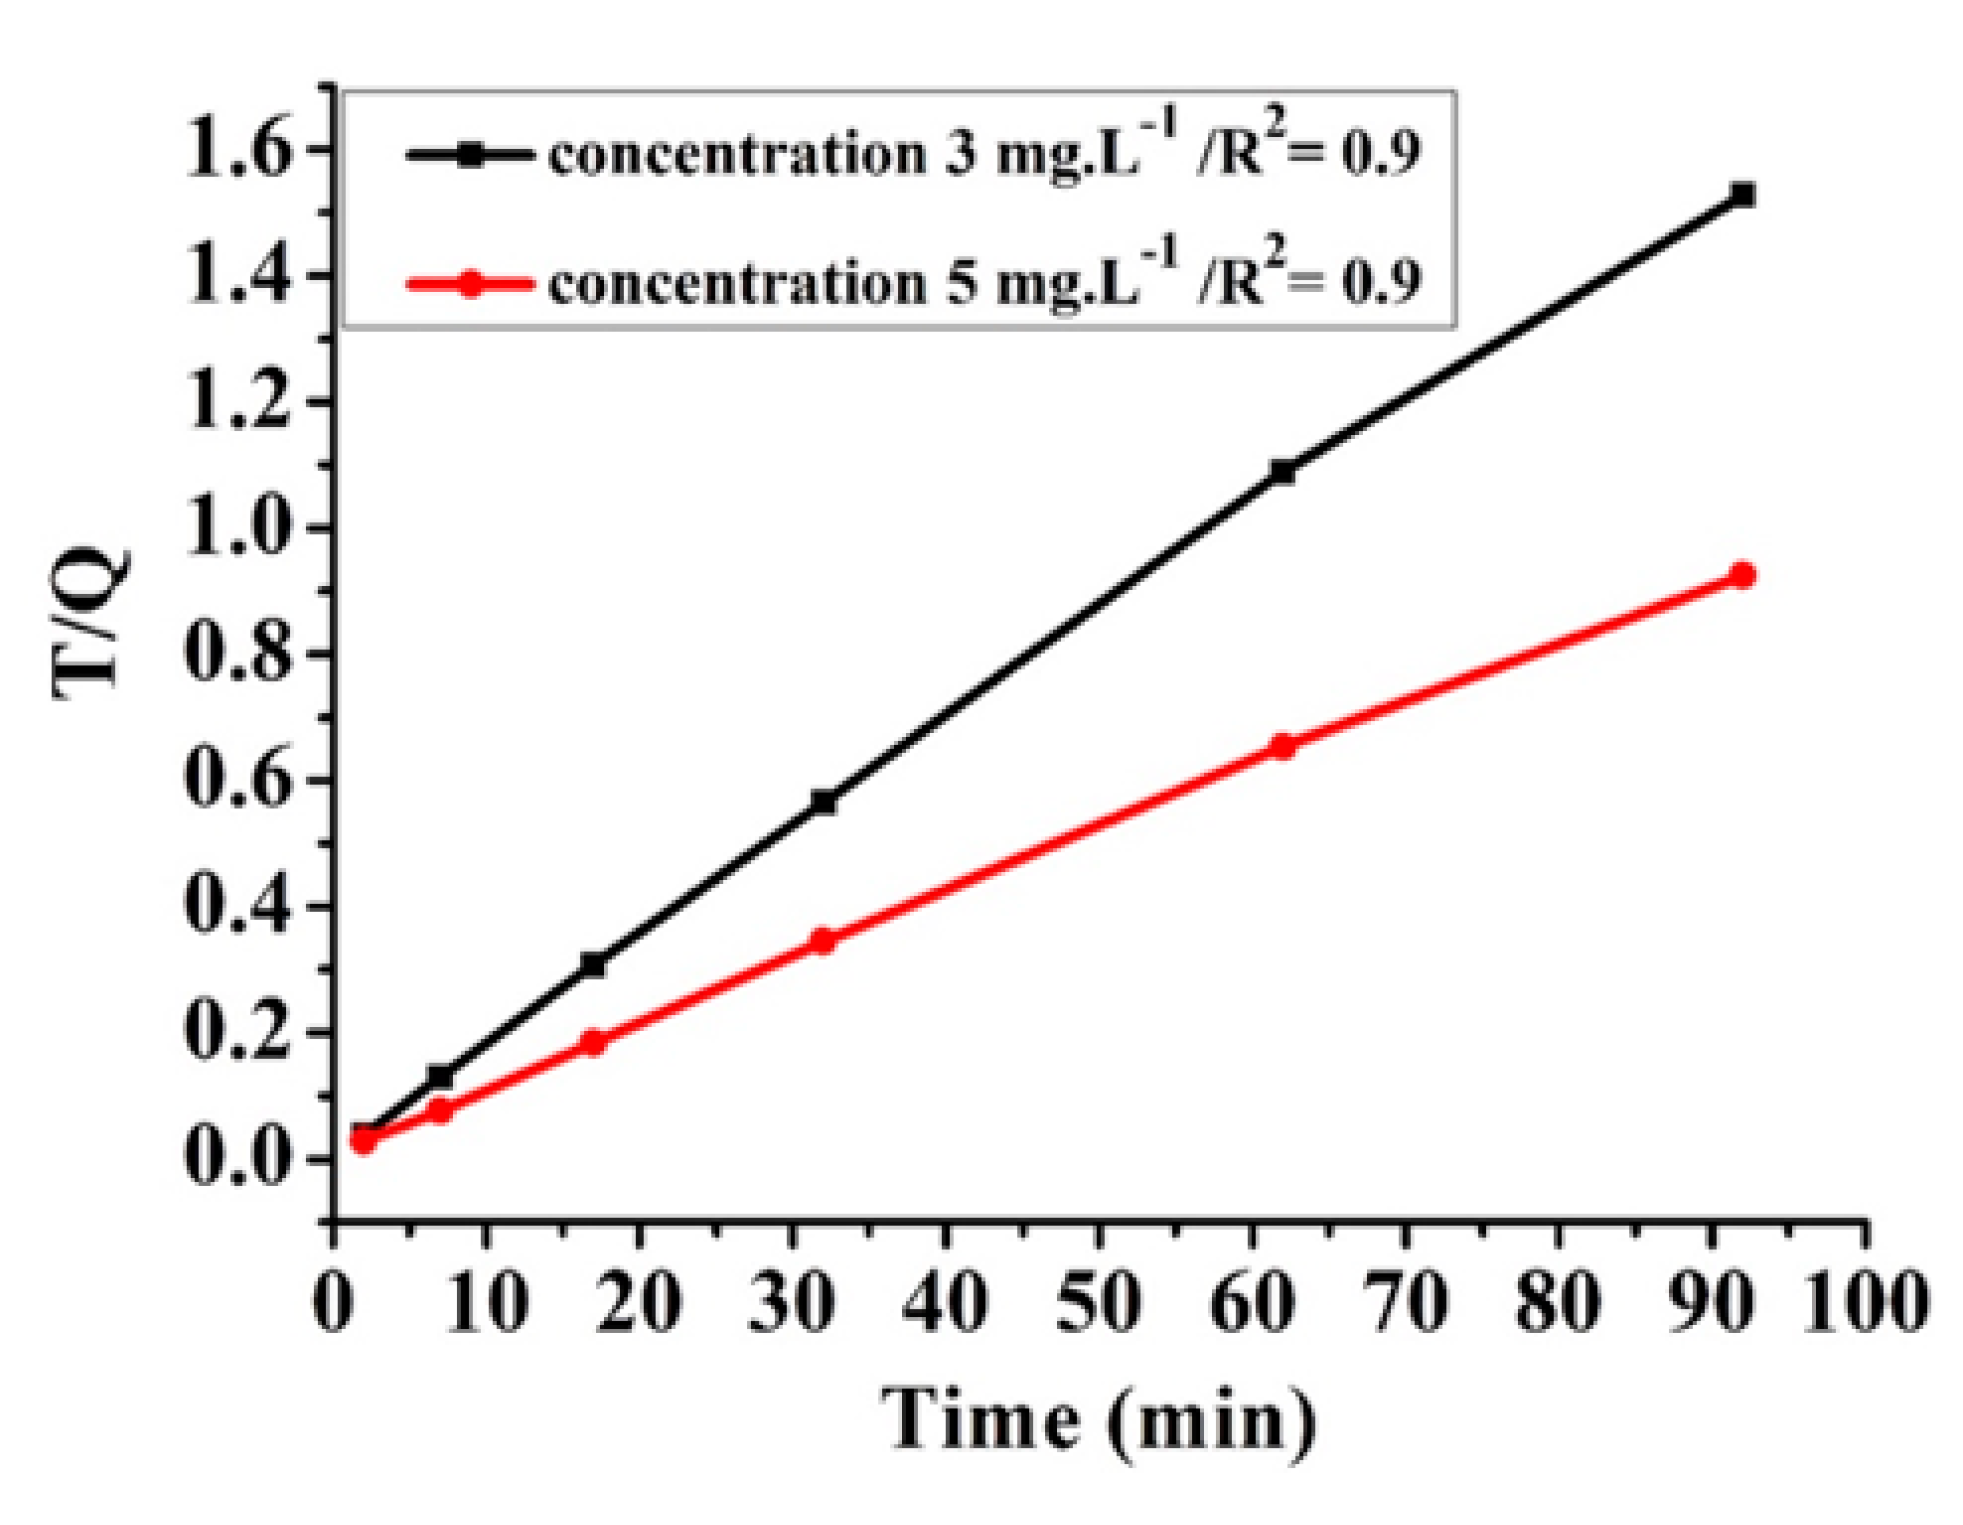
3.6.3. Kinetic Study

The kinetic study was conducted to examine the reaction behavior of bio-PAC adsorbent. Three kinetic models were utilized on experimental data namely pseudo-first-order, pseudo-second-order and intraparticle diffusion model [60]. The kinetic study was conducted at different Al3+ concentrations, 3 and 5 mg·L−1, with fixed values of adsorbent dosage 5 mg, pH of 9.48 at different time interval until the formation of an equilibrium state. The results of three well-known models reveal that the best fitting is with the pseudo-second-order at different concentrations of Al3+ with a higher value of correlation coefficient R2 compared to the pseudo-first-order and intraparticle diffusion models correlation coefficient values [61]. The results of the pseudo-second-order are shown in Figure 10. For both concentrations 3 and 5 mg·L−1, the kinetic results of the three applied models are given in Table 9.

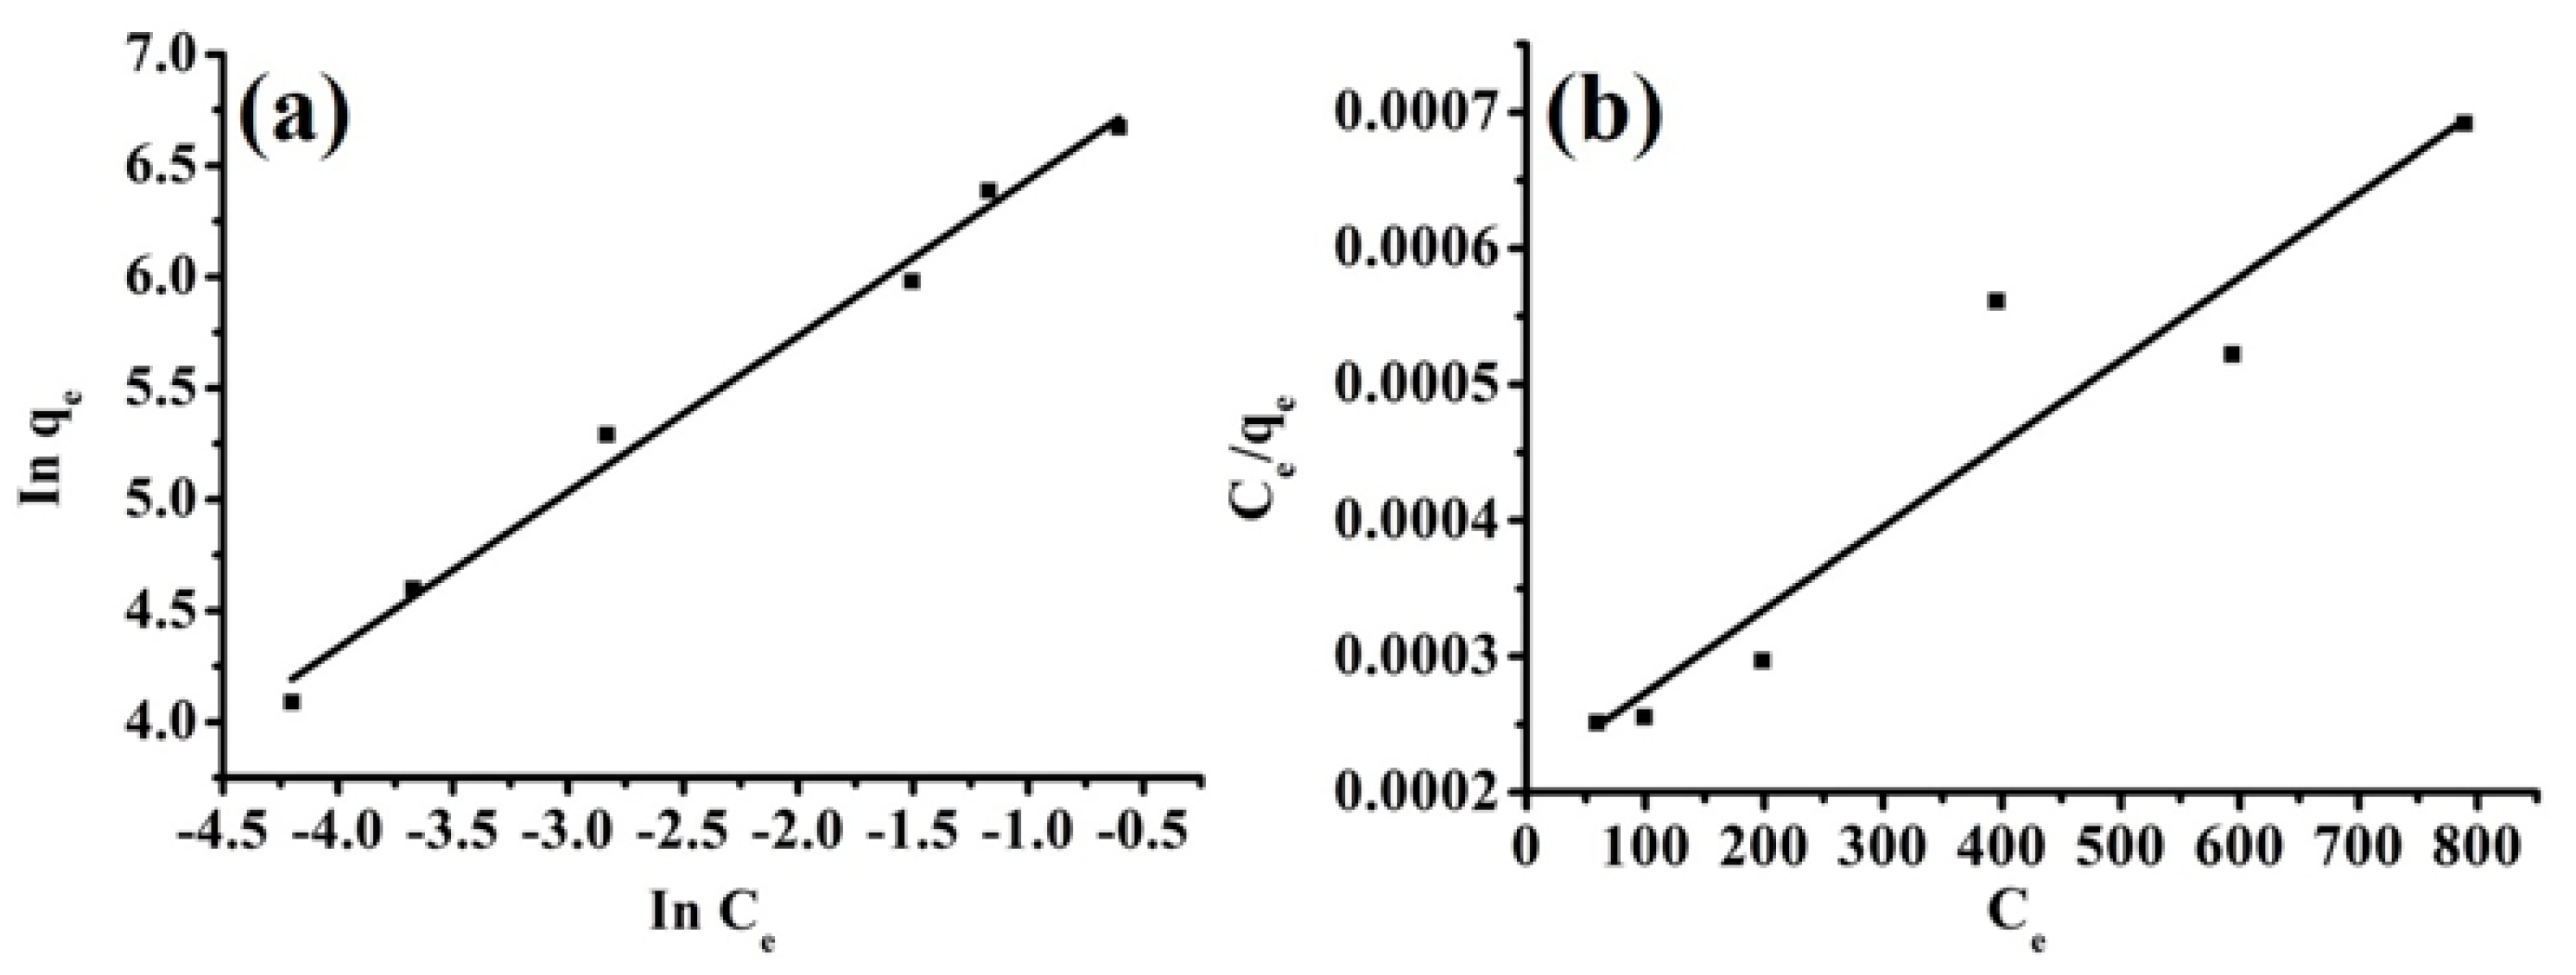
3.6.4. Isotherm Study

The isotherm study was conducted to describe the Al3+ ions adsorption onto the bio-PAC adsorbent surface using Freundlich and Langmuir isotherm models. Different Al3+ were employed to study the adsorption isotherm, 3, 5, 10, 20, 30 and 40 mg·L−1. Optimization study showed that pH and adsorbent dosage are found to be at 9.48 and 5 mg, respectively. The Freundlich and Langmuir isotherm results are presented in Figure 11.
Comparing the Freundlich to Langmuir, the result reveals that the Freundlich has a better fit for the Al3+ adsorption onto the bio-PAC adsorbent surface. The coefficient of correlation (R2) obtained from Freundlich model is 0.9907, whereby, the R2 obtained from the Langmuir model is 0.9143. The results indicate that the adsorption of Al3+ happens at a heterogeneous surface with an interaction between molecules of adsorbent [62].

4. Conclusions

The two step processes of carbonization followed by KOH activation were established to be effective techniques for converting I-DPF to a potential adsorbent bio-PAC for removal and uptake capacity of Al3+ from wastewater. The finding of optimum conditions to synthesized bio-PAC was examined using RSM. It was found that the optimum activation temperature, time and impregnation ratio is 650 °C, 1h and 1, respectively. The activation temperature displayed the highest influence on adsorption process. The optimized bio-PAC was characterized and analyzed using FESEM, FTIR, TGA, XRD, EDX, BET and Zeta potential. Furthermore, optimization of Al3+ was investigated by RSM technique and it was found that the optimum conditions for maximum removal and uptake capacity were 5 mg·g−1, 9.48 and 117 min for bio-PAC dose, pH and contact time, respectively. Under these optimized conditions, the maximum removal and uptake capability were 96.5 (%) and 104.47 mg·g−1, respectively. For kinetics and isotherm studies, the pseudo second order and Langmuir models were best fitted to describe the Al3+ adsorption performance. Based on the obtained results, I-DPF biomass might serve as a potential precursor for synthesized bio-PAC and as a good adsorbent for numerous environmental applications.

Supplementary Materials

The following are available online at https://www.mdpi.com/2227-9717/7/5/249/s1, Figure S1: Synthesis and Characterization of Natural Extracted Precursor Date Palm Fibre-Based Activated Carbon for Aluminum Removal by RSM Optimization.

Author Contributions

Synthesis, A.O.B., M.A.A.; Characterisation, A.O.B., M.M.A., S.S.F.; Writing-Original Draft Preparation, A.O.B.; Writing-Review & Editing, M.M.H., Y.A., M.A.M.; Supervision, M.M.H., Y.A., M.A.A.

Funding

This research was funded by the Universiti Kebangsaan Malaysia (DIP-2017-006) and the Ministry of Education Malaysia (FRGS/1/2018/WAB05/UKM/02/2).

Acknowledgments

Marlia M. Hanafiah was funded by the Universiti Kebangsaan Malaysia (DIP-2017-006) and the Ministry of Education Malaysia (FRGS/1/2018/WAB05/UKM/02/2).

Conflicts of Interest

The authors declare no conflict of interest.

References

  1. Balkhair, K.S.; Ashraf, M.A. Field accumulation risks of heavy metals in soil and vegetable crop irrigated with sewage water in western region of Saudi Arabia. Saudi J. Biol. Sci. 2016, 23, S32–S44. [Google Scholar] [CrossRef]
  2. Ashraf, M.A.; Hanfiah, M.M. Recent Advances in Assessment on Clear Water, Soil and Air; Springer: Berlin/Heidelberg, Germany, 2017. [Google Scholar]
  3. Awual, M.R.; Yaita, T.; Taguchi, T.; Shiwaku, H.; Suzuki, S.; Okamoto, Y. Selective cesium removal from radioactive liquid waste by crown ether immobilized new class conjugate adsorbent. J. Hazard. Mater. 2014, 278, 227–235. [Google Scholar] [CrossRef] [PubMed]
  4. Tassist, A.; Lounici, H.; Abdi, N.; Mameri, N. Equilibrium, kinetic and thermodynamic studies on aluminum biosorption by a mycelial biomass (Streptomyces rimosus). J. Hazard. Mater. 2010, 183, 35–43. [Google Scholar] [CrossRef] [PubMed]
  5. Mishra, M.; Chauhan, M. Biosorption as a Novel Approach for Removing Aluminium from Water Treatment Plant Residual—A Review. In Water Quality Management; Springer: Singapore, 2018; pp. 93–99. [Google Scholar]
  6. Aly, Z.; Graulet, A.; Scales, N.; Hanley, T. Removal of aluminium from aqueous solutions using PAN-based adsorbents: Characterisation, kinetics, equilibrium and thermodynamic studies. Environ. Sci. Pollut. Res. 2014, 21, 3972–3986. [Google Scholar] [CrossRef]
  7. Al-Muhtaseb, S.A.; El-Naas, M.H.; Abdallah, S. Removal of aluminum from aqueous solutions by adsorption on date-pit and BDH activated carbons. J. Hazard. Mater. 2008, 158, 300–307. [Google Scholar] [CrossRef] [PubMed]
  8. De Philippis, R.; Colica, G.; Micheletti, E. Exopolysaccharide-producing cyanobacteria in heavy metal removal from water: Molecular basis and practical applicability of the biosorption process. Appl. Microbiol. Biotechnol. 2011, 92, 697. [Google Scholar] [CrossRef] [PubMed]
  9. Fu, F.; Wang, Q. Removal of heavy metal ions from wastewaters: A review. J. Environ. Manag. 2011, 92, 407–418. [Google Scholar] [CrossRef]
  10. Shenashen, M.A.; Shahat, A.; El-Safty, S.A. Ultra-trace recognition and removal of toxic chromium (VI) ions from water using visual mesocaptor. J. Hazard. Mater. 2013, 244, 726–735. [Google Scholar] [CrossRef] [PubMed]
  11. Daraei, P.; Madaeni, S.S.; Ghaemi, N.; Salehi, E.; Khadivi, M.A.; Moradian, R.; Astinchap, B. Novel polyethersulfone nanocomposite membrane prepared by PANI/Fe3O4 nanoparticles with enhanced performance for Cu (II) removal from water. J. Membr. Sci. 2012, 415, 250–259. [Google Scholar] [CrossRef]
  12. Shenashen, M.A.; El-Safty, S.A.; Elshehy, E.A. Monolithic scaffolds for highly selective ion sensing/removal of Co (II), Cu (II), and Cd (II) ions in water. Analyst 2014, 139, 6393–6405. [Google Scholar] [CrossRef] [PubMed]
  13. Ahn, C.K.; Kim, Y.M.; Woo, S.H.; Park, J.M. Removal of cadmium using acid-treated activated carbon in the presence of nonionic and/or anionic surfactants. Hydrometallurgy 2009, 99, 209–213. [Google Scholar] [CrossRef]
  14. Xiong, C.; Yao, C.; Wang, L.; Ke, J. Adsorption behavior of Cd (II) from aqueous solutions onto gel-type weak acid resin. Hydrometallurgy 2009, 98, 318–324. [Google Scholar] [CrossRef]
  15. Mohammad, A.W.; Teow, Y.; Ang, W.; Chung, Y.; Oatley-Radcliffe, D.; Hilal, N. Nanofiltration membranes review: Recent advances and future prospects. Desalination 2015, 356, 226–254. [Google Scholar] [CrossRef]
  16. Zhu, Y.; Li, H. A New Method for the Process Division and Effect Evaluation of Coagulation Based on Particle Size Fractal Dimension. Processes 2018, 6, 237. [Google Scholar] [CrossRef]
  17. Loganathan, P.; Shim, W.G.; Sounthararajah, D.P.; Kalaruban, M.; Nur, T.; Vigneswaran, S. Modelling equilibrium adsorption of single, binary, and ternary combinations of Cu, Pb, and Zn onto granular activated carbon. Environ. Sci. Pollut. Res. 2018, 1–12. [Google Scholar] [CrossRef] [PubMed]
  18. Halim, A.A.; Han, K.K.; Hanafiah, M.M. Removal of methylene blue from dye wastewater using river sand by adsorption. Nat. Environ. Pollut. Technol. 2015, 14, 89. [Google Scholar]
  19. Hanafiah, M.M.; Hashim, N.A.; Ahmed, S.; Ashraf, M.A. Removal of chromium from aqueous solutions using a palm kernel shell adsorbent. Desalin. Water Treat. 2018, 118, 172–180. [Google Scholar] [CrossRef]
  20. Emran, M.Y.; El-Safty, S.A.; Shenashen, M.A.; Minowa, T. A well-thought-out sensory protocol for screening of oxygen reactive species released from cancer cells. Sens. Actuators B Chem. 2019, 284, 456–467. [Google Scholar] [CrossRef]
  21. Sajjad, M.; Khan, S.; Ali Baig, S.; Munir, S.; Naz, A.; Ahmad, S.S.; Khan, A. Removal of potentially toxic elements from aqueous solutions and industrial wastewater using activated carbon. Water Sci. Technol. 2017, 75, 2571–2579. [Google Scholar] [CrossRef]
  22. Teow, Y.H.; Kam, L.M.; Mohammad, A.W. Synthesis of cellulose hydrogel for copper (II) ions adsorption. J. Environ. Chem. Eng. 2018, 6, 4588–4597. [Google Scholar] [CrossRef]
  23. Awual, M.R.; Shenashen, M.; Jyo, A.; Shiwaku, H.; Yaita, T. Preparing of novel fibrous ligand exchange adsorbent for rapid column-mode trace phosphate removal from water. J. Ind. Eng. Chem. 2014, 20, 2840–2847. [Google Scholar] [CrossRef]
  24. Alidokht, L.; Khataee, A.; Reyhanitabar, A.; Oustan, S. Reductive removal of Cr (VI) by starch-stabilized Fe0 nanoparticles in aqueous solution. Desalination 2011, 270, 105–110. [Google Scholar] [CrossRef]
  25. Chen, H.; Zhao, J.; Zhong, A.; Jin, Y. Removal capacity and adsorption mechanism of heat-treated palygorskite clay for methylene blue. Chem. Eng. J. 2011, 174, 143–150. [Google Scholar] [CrossRef]
  26. Tomko, J.; Backor, M.; Stofko, M. Biosorption of heavy metals by dry fungi biomass. Acta Metall. Slovaca 2006, 12, 447–451. [Google Scholar]
  27. Ali, M.A.; Al-Hattab, T.A.; Al-Hydary, I.A. Extraction of date palm seed oil (phoenix dactylifera) by soxhlet apparatus. Int. J. Adv. Eng. Technol. 2015, 8, 261. [Google Scholar]
  28. Charola, S.; Patel, H.; Chandna, S.; Maiti, S. Optimization to prepare porous carbon from mustard husk using response surface methodology adopted with central composite design. J. Clean. Prod. 2019, 223, 969–979. [Google Scholar] [CrossRef]
  29. Aljumaily, M.M.; Alsaadi, M.A.; Das, R.; Hamid, S.B.A.; Hashim, N.A.; AlOmar, M.K.; Alayan, H.M.; Novikov, M.; Alsalhy, Q.F.; Hashim, M.A. Optimization of the Synthesis of Superhydrophobic Carbon Nanomaterials by Chemical Vapor Deposition. Sci. Rep. 2018, 8, 2778. [Google Scholar] [CrossRef] [PubMed]
  30. Azargohar, R.; Dalai, A. Production of activated carbon from Luscar char: Experimental and modeling studies. Microporous Mesoporous Mater. 2005, 85, 219–225. [Google Scholar] [CrossRef]
  31. Tan, I.; Ahmad, A.; Hameed, B. Optimization of preparation conditions for activated carbons from coconut husk using response surface methodology. Chem. Eng. J. 2008, 137, 462–470. [Google Scholar] [CrossRef]
  32. Uribe, E.; Pasten, A.; Lemus-Mondaca, R.; Vega-Gálvez, A.; Quispe-Fuentes, I.; Ortiz, J.; Di Scala, K. Comparison of Chemical Composition, Bioactive Compounds and Antioxidant Activity of Three Olive-Waste Cakes. J. Food Biochem. 2015, 39, 189–198. [Google Scholar] [CrossRef] [Green Version]
  33. Gottipati, R.; Mishra, S. Process optimization of adsorption of Cr (VI) on activated carbons prepared from plant precursors by a two-level full factorial design. Chem. Eng. J. 2010, 160, 99–107. [Google Scholar] [CrossRef]
  34. Vaez, M.; Zarringhalam Moghaddam, A.; Alijani, S. Optimization and modeling of photocatalytic degradation of azo dye using a response surface methodology (RSM) based on the central composite design with immobilized titania nanoparticles. Ind. Eng. Chem. Res. 2012, 51, 4199–4207. [Google Scholar] [CrossRef]
  35. Banerjee, S.; Sharma, G.C.; Chattopadhyaya, M.; Sharma, Y.C. Kinetic and equilibrium modeling for the adsorptive removal of methylene blue from aqueous solutions on of activated fly ash (AFSH). J. Environ. Chem. Eng. 2014, 2, 1870–1880. [Google Scholar] [CrossRef]
  36. Chen, X.W.; Su, D.S.; Schlögl, R. Immobilization of CNFs on the surface and inside of the modified activated carbon. Phys. Status Solidi (b) 2006, 243, 3533–3536. [Google Scholar] [CrossRef] [Green Version]
  37. Alayan, H.M.; Alsaadi, M.A.; AlOmar, M.K.; Hashim, M.A. Growth and optimization of carbon nanotubes in powder activated carbon for an efficient removal of methylene blue from aqueous solution. Environ. Technol. 2018, 1–16. [Google Scholar] [CrossRef]
  38. Yahaya, N.; Pakir, M.; Latiff, M.; Abustan, I.; Bello, O.; Ahmad, M. Process optimisation for Zn (II) removal by activated carbon prepared from rice husk using chemical activation. Int. J. Eng. Technol. 2010, 10, 132–136. [Google Scholar]
  39. Tan, I.; Ahmad, A.; Hameed, B. Preparation of activated carbon from coconut husk: Optimization study on removal of 2, 4, 6-trichlorophenol using response surface methodology. J. Hazard. Mater. 2008, 153, 709–717. [Google Scholar] [CrossRef]
  40. Sarici-Özdemir, Ç.; Önal, Y. Study to observe the applicability of the adsorption isotherms used for the adsorption of medicine organics onto activated carbon. Part. Sci. Technol. 2018, 36, 254–261. [Google Scholar] [CrossRef]
  41. Theydan, S.K.; Ahmed, M.J. Optimization of preparation conditions for activated carbons from date stones using response surface methodology. Powder Technol. 2012, 224, 101–108. [Google Scholar] [CrossRef]
  42. Sayğılı, H.; Güzel, F. High surface area mesoporous activated carbon from tomato processing solid waste by zinc chloride activation: Process optimization, characterization and dyes adsorption. J. Clean. Prod. 2016, 113, 995–1004. [Google Scholar] [CrossRef]
  43. Sulaiman, N.S.; Hashim, R.; Amini, M.H.M.; Danish, M.; Sulaiman, O. Optimization of activated carbon preparation from cassava stem using response surface methodology on surface area and yield. J. Clean. Prod. 2018, 198, 1422–1430. [Google Scholar] [CrossRef]
  44. Yin, J.; Zhu, Y.; Yue, X.; Wang, L.; Zhu, H.; Wang, C. From environmental pollutant to activated carbons for high-performance supercapacitors. Electrochim. Acta 2016, 201, 96–105. [Google Scholar] [CrossRef]
  45. Moralı, U.; Demiral, H.; Şensöz, S. Optimization of activated carbon production from sunflower seed extracted meal: Taguchi design of experiment approach and analysis of variance. J. Clean. Prod. 2018, 189, 602–611. [Google Scholar] [CrossRef]
  46. Poletto, M.; Ornaghi, H.L.; Zattera, A.J. Native cellulose: Structure, characterization and thermal properties. Materials 2014, 7, 6105–6119. [Google Scholar] [CrossRef]
  47. Zubrik, A.; Matik, M.; Hredzák, S.; Lovás, M.; Danková, Z.; Kováčová, M.; Briančin, J. Preparation of chemically activated carbon from waste biomass by single-stage and two-stage pyrolysis. J. Clean. Prod. 2017, 143, 643–653. [Google Scholar] [CrossRef]
  48. Krahnstöver, T.; Plattner, J.; Wintgens, T. Quantitative detection of powdered activated carbon in wastewater treatment plant effluent by thermogravimetric analysis (TGA). Water Res. 2016, 101, 510–518. [Google Scholar] [CrossRef]
  49. Danish, M.; Hashim, R.; Ibrahim, M.M.; Sulaiman, O. Optimization study for preparation of activated carbon from Acacia mangium wood using phosphoric acid. Wood Sci. Technol. 2014, 48, 1069–1083. [Google Scholar] [CrossRef]
  50. Syafiuddin, A.; Salmiati, S.; Hadibarata, T.; Kueh, A.B.H.; Salim, M.R.; Zaini, M.A.A. Silver Nanoparticles in the Water Environment in Malaysia: Inspection, characterization, removal, modeling, and future perspective. Sci. Rep. 2018, 8, 986. [Google Scholar] [CrossRef] [PubMed] [Green Version]
  51. Ab Ghani, Z.; Yusoff, M.S.; Zaman, N.Q.; Zamri, M.F.M.A.; Andas, J. Optimization of preparation conditions for activated carbon from banana pseudo-stem using response surface methodology on removal of color and COD from landfill leachate. Waste Manag. 2017, 62, 177–187. [Google Scholar] [CrossRef]
  52. Bohli, T.; Ouederni, A. Improvement of oxygen-containing functional groups on olive stones activated carbon by ozone and nitric acid for heavy metals removal from aqueous phase. Environ. Sci. Pollut. Res. 2016, 23, 15852–15861. [Google Scholar] [CrossRef]
  53. Ben-Ali, S.; Jaouali, I.; Souissi-Najar, S.; Ouederni, A. Characterization and adsorption capacity of raw pomegranate peel biosorbent for copper removal. J. Clean. Prod. 2017, 142, 3809–3821. [Google Scholar] [CrossRef]
  54. El-Safty, S.A.; Shenashen, M. Optical mesosensor for capturing of Fe (III) and Hg (II) ions from water and physiological fluids. Sens. Actuators B Chem. 2013, 183, 58–70. [Google Scholar] [CrossRef]
  55. Danish, M.; Hashim, R.; Ibrahim, M.M.; Sulaiman, O. Response surface methodology approach for methyl orange dye removal using optimized Acacia mangium wood activated carbon. Wood Sci. Technol. 2014, 48, 1085–1105. [Google Scholar] [CrossRef]
  56. El-Sewify, I.M.; Shenashen, M.A.; Shahat, A.; Yamaguchi, H.; Selim, M.M.; Khalil, M.M.; El-Safty, S.A. Dual colorimetric and fluorometric monitoring of Bi3+ ions in water using supermicroporous Zr-MOFs chemosensors. J. Luminescence 2018, 198, 438–448. [Google Scholar] [CrossRef]
  57. Hu, X.-J.; Liu, Y.-G.; Wang, H.; Zeng, G.-M.; Hu, X.; Guo, Y.-M.; Li, T.-T.; Chen, A.-W.; Jiang, L.-H.; Guo, F.-Y. Adsorption of copper by magnetic graphene oxide-supported β-cyclodextrin: Effects of pH, ionic strength, background electrolytes, and citric acid. Chem. Eng. Res. Des. 2015, 93, 675–683. [Google Scholar] [CrossRef]
  58. AlOmar, M.K.; Alsaadi, M.A.; Hayyan, M.; Akib, S.; Hashim, M.A. Functionalization of CNTs surface with phosphonuim based deep eutectic solvents for arsenic removal from water. Appl. Surf. Sci. 2016, 389, 216–226. [Google Scholar] [CrossRef]
  59. Awual, M.R.; Miyazaki, Y.; Taguchi, T.; Shiwaku, H.; Yaita, T. Encapsulation of cesium from contaminated water with highly selective facial organic–inorganic mesoporous hybrid adsorbent. Chem. Eng. J. 2016, 291, 128–137. [Google Scholar] [CrossRef]
  60. Ifelebuegu, A.; Salauh, H.; Zhang, Y.; Lynch, D. Adsorptive Properties of Poly (1-methylpyrrol-2-ylsquaraine) Particles for the Removal of Endocrine-Disrupting Chemicals from Aqueous Solutions: Batch and Fixed-Bed Column Studies. Processes 2018, 6, 155. [Google Scholar] [CrossRef]
  61. Fiyadh, S.S.; AlSaadi, M.A.; AlOmar, M.K.; Fayaed, S.S.; Mjalli, F.S.; El-Shafie, A. BTPC-Based DES-Functionalized CNTs for A s 3+ Removal from Water: NARX Neural Network Approach. J. Environ. Eng. 2018, 144, 04018070. [Google Scholar] [CrossRef]
  62. Xu, H.; Qin, Q.; Zhang, C.; Ning, K.; Zhao, R.; Wang, P.; Deng, J.; Huang, G. Adsorption of Organic Constituents from Reverse Osmosis Concentrate in Coal Chemical Industry by Coking Coal. Processes 2019, 7, 44. [Google Scholar] [CrossRef]
Figure 1. Parity plot of actual and predicted values of (a) removal (%) and (b) uptake capacity (mg·g−1).
Processes 07 00249 g001
Figure 2. Surface response plots for the effects of (a) activation temperature and impregnation ratio (b) activation temperature and activation time (c) impregnation ratio and activation time, on removal (%) and uptake capacity (mg·g−1).
Processes 07 00249 g002
Figure 3. FTIR spectra of (a) raw date palm fibre (DPF) before activation and (b) bio-powder activated carbon (bio-PAC) after activation.
Processes 07 00249 g003
Figure 4. XRD spectrum for (a) raw date palm fibre (DPF) before activation (b) bio-powder activated carbon (bio-PAC) after activation.
Processes 07 00249 g004
Figure 5. Thermogravimetric analysis (TGA) curves for (a) raw date palm fibre (DPF) before activation (b) bio-powder activated carbon (bio-PAC) after activation.
Processes 07 00249 g005
Figure 6. (a) FESEM image and (b) EDX profile of bio-powder activated carbon (bio-PAC).
Processes 07 00249 g006
Figure 7. Nitrogen adsorption isotherm for optimum bio-PAC after activation.
Processes 07 00249 g007
Figure 8. Effect of pH on Zeta potential of the bio-PAC.
Processes 07 00249 g008
Figure 9. Surface response plots effects of adsorption parameters on removal and uptake capacity (a) interaction bio-PAC dose with contact time; (b) interaction between bio-PAC and pH; (c) interaction pH with contact time.
Processes 07 00249 g009
Figure 10. Plot of pseudo-second-order kinetic model for Al3+ adsorption.
Processes 07 00249 g010
Figure 11. Plots of (a) Frendlich isotherm and (b) Langmuir isotherm models for Al3+ adsorption.
Processes 07 00249 g011
Table 1. Parameters Level of Design.
FactorNameUnitsLow ActualHigh ActualLow CodedHigh CodedMeanStd. Dev.
AActivation Temperature°C650.00850.00−1.001.00753.1283.79
BActivation Timeh1.003.00−1.001.002.000.79
CImpregnation Ratio 1.003.00−1.001.001.810.72
Table 2. Experimental design for preparation bio-powder-activated carbon (bio-PAC) and results.
RunParametersResponses
Temperature (°C)Time (h)KOH RatioRemoval (%)Capacity (mg·g−1)
1850.003.001.0097.189.71
2650.003.003.00979.7
3750.001.002.0098.859.88
4750.002.003.0098.659.86
5750.002.002.0097.989.79
6750.002.001.0098.29.82
7850.003.002.0097.69.76
8750.003.001.0098.39.83
9850.001.003.0098.349.83
10650.001.001.0098.989.89
11850.001.001.0097.59.75
12750.003.002.0097.659.76
13650.002.002.00989.8
14650.002.001.0099.829.98
15650.001.002.0098.889.88
16900.002.002.0098.59.85
Table 3. List of Design of Expert (DoE) runs and actual parameters.
FactorsResponse
DosepHContact Time (min)Removal (%)Uptake Capacity (mg·g−1)
15.0011.0010.0076.4876.48
220.003.00120.0058.3214.58
312.507.0065.0098.6439.45
412.507.0065.0098.6439.45
512.507.0010.0097.7439.09
65.007.0065.0098.4898.48
720.0011.00120.0089.8422.46
812.507.00120.0099.1639.66
912.503.0065.0059.5223.80
1020.003.0010.0056.9214.23
1112.507.0065.0098.6439.45
1220.007.0065.0099.9824.99
1312.5011.0065.0089.5835.83
145.003.0010.0053.953.9
155.003.00120.0054.0854.08
1620.0011.0010.0060.7415.18
175.0011.00120.0095.9895.98
Table 4. ANOVA for removal % surface modified model.
SourceSum of SquaresDFMean SquareF Valuep-Value
Prob > F
Model6.0461.014.280.0258
A-Activation Temperature0.2810.281.180.3054
B-Activation Time0.6110.612.610.1408
C-Impregnation Ratio0.1310.130.530.4833
AB0.0310.030.130.7224
AC1.7511.757.420.0235
BC0.0610.060.260.6250
Table 5. Uptake capacity (mg·g−1) surface modified model.
SourceSum of SquaresDFMean SquareF Valuep-Value
Prob > F
Model0.06060.0104.280.0258
A-Activation Temperature2.780 × 10−312.780 × 10−31.180.3054
B-Activation Time6.139 × 10−316.139 × 10−32.610.1408
C-Impregnation Ratio 1.258 × 10−311.258 × 10−30.530.4833
AB3.163 × 10−413.163 × 10−40.130.7224
AC0.01710.0177.420.0235
BC6.026 × 10−416.026 × 10−40.260.6250
Table 6. Constraints for optimization process based on central composite design (CCD) for bio-powder activated carbon (bio-PAC) performance.
NameGoalLower LimitUpper LimitImportance
Activation Temperature (°C)in range6508503
Activation Time (h)in range133
IRin range133
Removal (%)maximize9799.825
Uptake capacity (mg·g−1)maximize9.79.9825
Table 7. ANOVA of optimization Al3+ removal (%) on bio-powder activated carbon (bio-PAC).
SourceSum of
Squares
dfMean
Square
F Valuep-Value
Prob > F
Model5931.269659.0348.89<0.0001
A-Dose17.21117.211.280.2957
B-pH1686.8811686.88125.13<0.0001
C-Contact Time266.261266.2619.750.0030
AB106.141106.147.870.0263
AC14.63114.631.090.3321
BC276.361276.3620.500.0027
A211.14111.140.830.3935
B21912.7911912.79141.89<0.0001
C221.30121.301.580.2491
Table 8. ANOVA of optimization Al3+ uptake capacity (mg·g−1) on bio-powder activated carbon (bio-PAC).
SourceSum of SquaresdfMean SquareF Valuep-Value Prob > F
Model60.11134.6292.300.0016
A-Dose0.01110.010.220.6679
B-pH4.5214.5290.200.0025
C-Contact Time 0.0110.010.200.6841
AB1.0611.0621.190.0193
AC0.1510.152.920.1859
BC2.7612.7655.170.0050
A20.1110.112.220.2326
B219.13119.13381.860.0003
C20.2110.214.250.1312
ABC0.0810.081.750.2774
A2B0.1010.102.080.2448
A2C0.5010.509.880.0515
AB20.1110.112.120.2412
Table 9. Adsorption kinetics and correlation coefficient.
Pseudo-First-Order
ln(qc − qt) vs time (t)
Pseudo-Second-Order
(t/qcvs t)
Intraparticle
(qc vs t0.5)
Dose
mg
pHC0
mg·L−1
R2R2R2
39.8630.7490.99960.8898
59.8650.49290.99890.5908

