Article

DEM Investigation of the Influence of Minerals on Crack Patterns and Mechanical Properties of Red Mudstone

State Key Laboratory of Coal Resources and Safe Mining, School of Mines, China University of Mining and Technology, Xuzhou 221116, China
*
Authors to whom correspondence should be addressed.
Processes 2019, 7(3), 162; https://doi.org/10.3390/pr7030162
Submission received: 27 December 2018 / Revised: 1 March 2019 / Accepted: 2 March 2019 / Published: 15 March 2019
(This article belongs to the Special Issue Fluid Flow in Fractured Porous Media)

Abstract

:
Rocks are natural heterogeneous materials. It is common for a rock to have several kinds of minerals, which will have a significant effect on its mechanical behavior. The purpose of the numerical simulation study in this paper is to explore the effects of minerals on the crack patterns and mechanical properties of rocks. First, the corresponding calculation model is established by using the discrete element method (DEM), whereby the mechanical parameters of the blocks and joints in the Tyson polygon procedure are fitted with the rock properties obtained in the laboratory. Then, various combination models of different mineral sizes and ratios are established to study the effects of mineral size, position, and ratio on the fracture distribution and mechanical properties of rock samples. The results indicate that with increased circle size of the center mineral and the mineral ratio, the elastic modulus and uniaxial compression strength (UCS) of the model gradually increase. The drop degree of post-peak stress decreases, and the integrity and bearing capacity increase. It is found that there is a quartic polynomial relationship between elastic modulus and mineral circle radius, with R2 ≥ 0.94. The minerals located in the crack propagation path will effectively block the crack and change the propagation direction. When the mineral position is close to the model boundaries, especially the lateral boundaries, it has a significant influence on the crack initiation position, causing crack initiation to occur at the upper boundary of the mineral circle and propagate to the middle of the model. With increased mineral percentage and small-size mineral circle proportion, the depth of extension of the crack from boundary to center is reduced, the crack has wide development in the boundary area, the number of central cracks in the rock specimen decreases, and the degree of fragmentation decreases.

1. Introduction

Rocks are categorized as natural inhomogeneous materials that include different minerals, particles, holes, and fissures. These individual materials and defects usually have different physical and mechanical properties [1,2], which will cause different responses under the action of internal and external forces. Underground engineering (such as coal mining, chamber excavation, oil and gas extraction, etc.) will break the original stress balance, causing a redistribution of stress in the surrounding rock and achieving a new equilibrium state, which produces a more complex stress environment by the dual action of tectonic stress and mining stress. The response of heterogeneous rock under this stress environment will have a significant impact on geotechnical and coal mining work [3], therefore, it is of great theoretical and engineering value in many rock engineering problems to study the influence of mineral composition on the crack distribution and mechanical properties of rock specimens.
Under normal circumstances, the research methods of rock mechanics characteristics include field measurements, laboratory experiments and numerical simulations. The rock properties obtained by field measurement methods are usually reliable, but field measurement is not widely used because of complex geological conditions and high cost [4,5,6]. At present, most mechanical tests of rock samples are carried out in the laboratory; however, due to limitations in the current experimental equipment, it is difficult to accurately determine the mineral types and their locations within the rock samples, and it is impossible to quantify mineral ratios (the ratio of mineral area to the area of model) on the rock sample scale. In addition, due to the randomness of sampling and the influence of accidental factors, it is difficult to analyze the fracture modes and mechanical properties of different combinations of mineral sizes and ratios by experimental mechanical testing. In recent years, with the rapid development of computer performance, numerical simulation methods for the influence of minerals on rock properties have been used more. The most commonly used numerical simulation methods include finite element, discrete element, and finite-discrete hybrid models [7,8].
Considering the heterogeneity of rock, the granite model containing biotite, quartz, and feldspar was established by using FLAC finite element software [9]. The conventional Mohr–Coulomb and tensile stress failure criteria were used to study the tensile failure characteristics of granite, and the results show that the weakest mineral, biotite, was found to control the initiation and failure mode of cracks [10]. Tang et al. [11] used RFPA software to establish five models with the same heterogeneity and five models with different heterogeneity, and heterogeneity was found to play an important role in the deformation and strength characterization of specimens. More homogeneous specimens have stronger linear deformation characteristics than more nonuniform specimens before peak stress. Blair et al. [12] used a nonlinear, rule-based model to study the influence of microheterogeneity on the macroscopic mechanical behavior of rock samples and found that the heterogeneity of the local stress field caused by grain shape and loading had a significant effect on the macroscopic properties of rock. In the finite software, the material points in the research area remain in the same neighboring relation, which cannot simulate the fracture and separation process of the block; the continuous method has difficulties presenting the microscopic and macroscopic crack patterns [13].
Compared with the finite element method (FEM), the discrete element method (DEM) and hybrid finite/discrete methods can simulate movement and separation of the block. In the DEM method, the rock is simulated using polygon blocks that interact with neighboring blocks through contacts. Cracks can only occur along the polygon block boundaries. The initiation, expansion, and closure of joints between blocks can simulate the formation of fissures in rocks and the response of microscopic and macroscopic cracks under stress loads [14,15]. Lan et al. [16] established the GBM-UDEC model to simulate the microheterogeneity of rock samples caused by elastic variation and contact stiffness anisotropy, and found that microheterogeneity plays an important role in the micromechanical behavior and macroscopic response control under uniaxial compressive loading. Fu [17] used PFC software to establish different mineral compositions of particles with regular and irregular shapes to study the effect of particle size, stiffness, and friction coefficient on the microscopic and macroscopic behavior of granular materials.
In the course of rock foundation mechanical experiments (compressive, tensile, and shear, as shown in Figure 1), we found that when the mineral particles are in the propagation path of the crack, the extension direction of the original crack changes [18,19,20]. This causes the crack to extend along the edges of the blocks representing the mineral particles to other regions; during the failure process the cracks are not allowed to pass through the mineral particles. The experimental and numerical simulation methods mentioned above did not determine the influence of mineral size, position, and ratio on the mechanical properties of rock specimens. This shows that the gray-white minerals in red mudstone will have a great influence on the crack mode and macroscopic mechanical properties of rock specimens, and there have been no studies analyzing the mechanism of mineral influence on red mudstone to fill this gap. Considering the intrinsic advantages of DEM in simulating crack propagation, the UDEC polygon method is used to establish combination models of different mineral sizes and ratios to study the influence of mineral size, position, and ratio and different sizes of mineral ratios on rock crack distribution and mechanical properties.

2. Materials and Methods
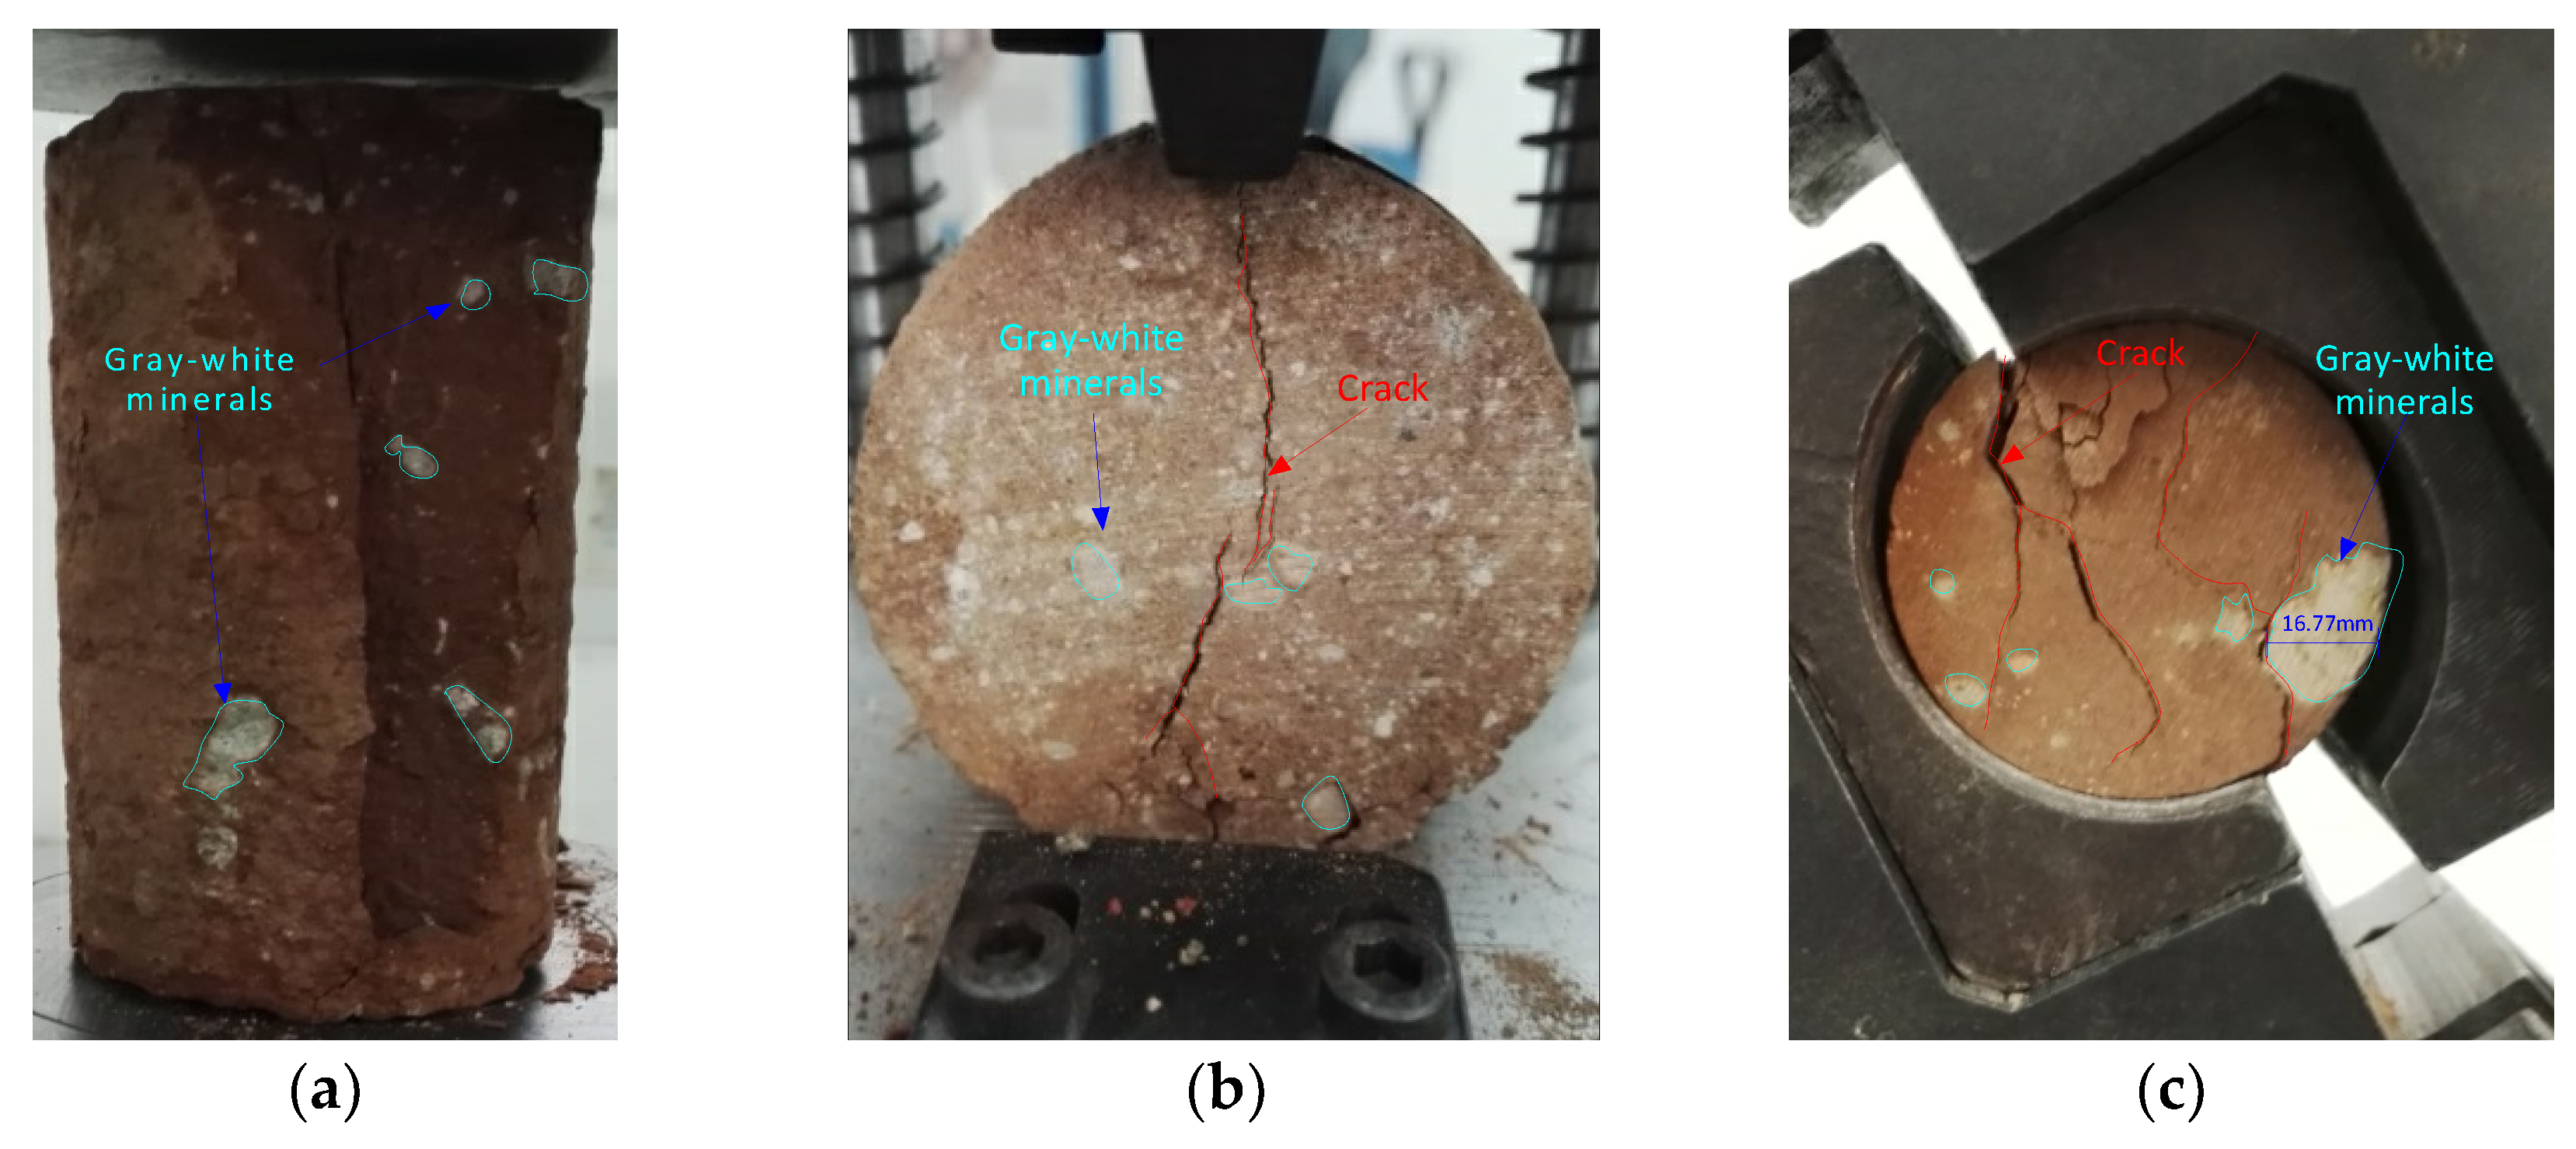
2.1. Study Case

Red mudstone is continuously distributed on a large scale in the Laosangou field, located 15 km northwest of Xuejiawan town, Jungar banner, Erdos city, Inner Mongolia, as shown in Figure 2. Laosangou coal mine is located in the eastern part of the Loess Plateau of Ordos, the ground is high in the north and low in the south. The red mudstone surface is mainly red. Gray-white mineral particles can be seen in parts of the fading area, and there is a clear boundary between the fading area and the red rock. Gray-white minerals particles in the red mudstone appear grayish white and are mostly granular, lumpy and breccia, the maximum particle size is about 16.7 mm, as shown in Figure 1. During the grinding process of the rock samples, it was found that compared to the red mudstone, the gray-white minerals particles in the red mudstone are more difficult to grind into 200-purpose powdery. It indicates that the hardness of gray-white minerals is higher than red mudstone. This layer of red mudstone is of great significance for maintaining a reasonable ecological underground water level in this mine area. In order to improve the success rate of standard sample preparation, the rock samples extracted from the scene were cut and ground directly in the laboratory. The diameter of the rock samples was between 74 and 86 mm, and the height of the model was two times the corresponding diameter.

2.2. Contact Constitutive Model

Multiple studies have shown that the 2D Voronoi model in UDEC can reliably simulate mechanical responses for both laboratory tests and field observations of rocks [21,22,23,24,25,26]. Both deformable and rigid polygon blocks can be produced in UDEC; polygon blocks cannot be destroyed, and a fracture can only be generated along the edges of a polygon. The generated polygon blocks are connected by joints, and the relationship between force and displacement at these joints is determined based on the normal joint stiffness and shear stiffness. The strength of a joint depends on its cohesion, internal friction angle, and tensile strength. Joints break when the stress between polygons is greater than the shear and tensile stress limits they can withstand. Therefore, the initiation, expansion, and closure of joints between polygons can be used to simulate the fracture generation process. The joint constitutive model is shown in Figure 3.

2.3. Model Construction and Parameter Fitting

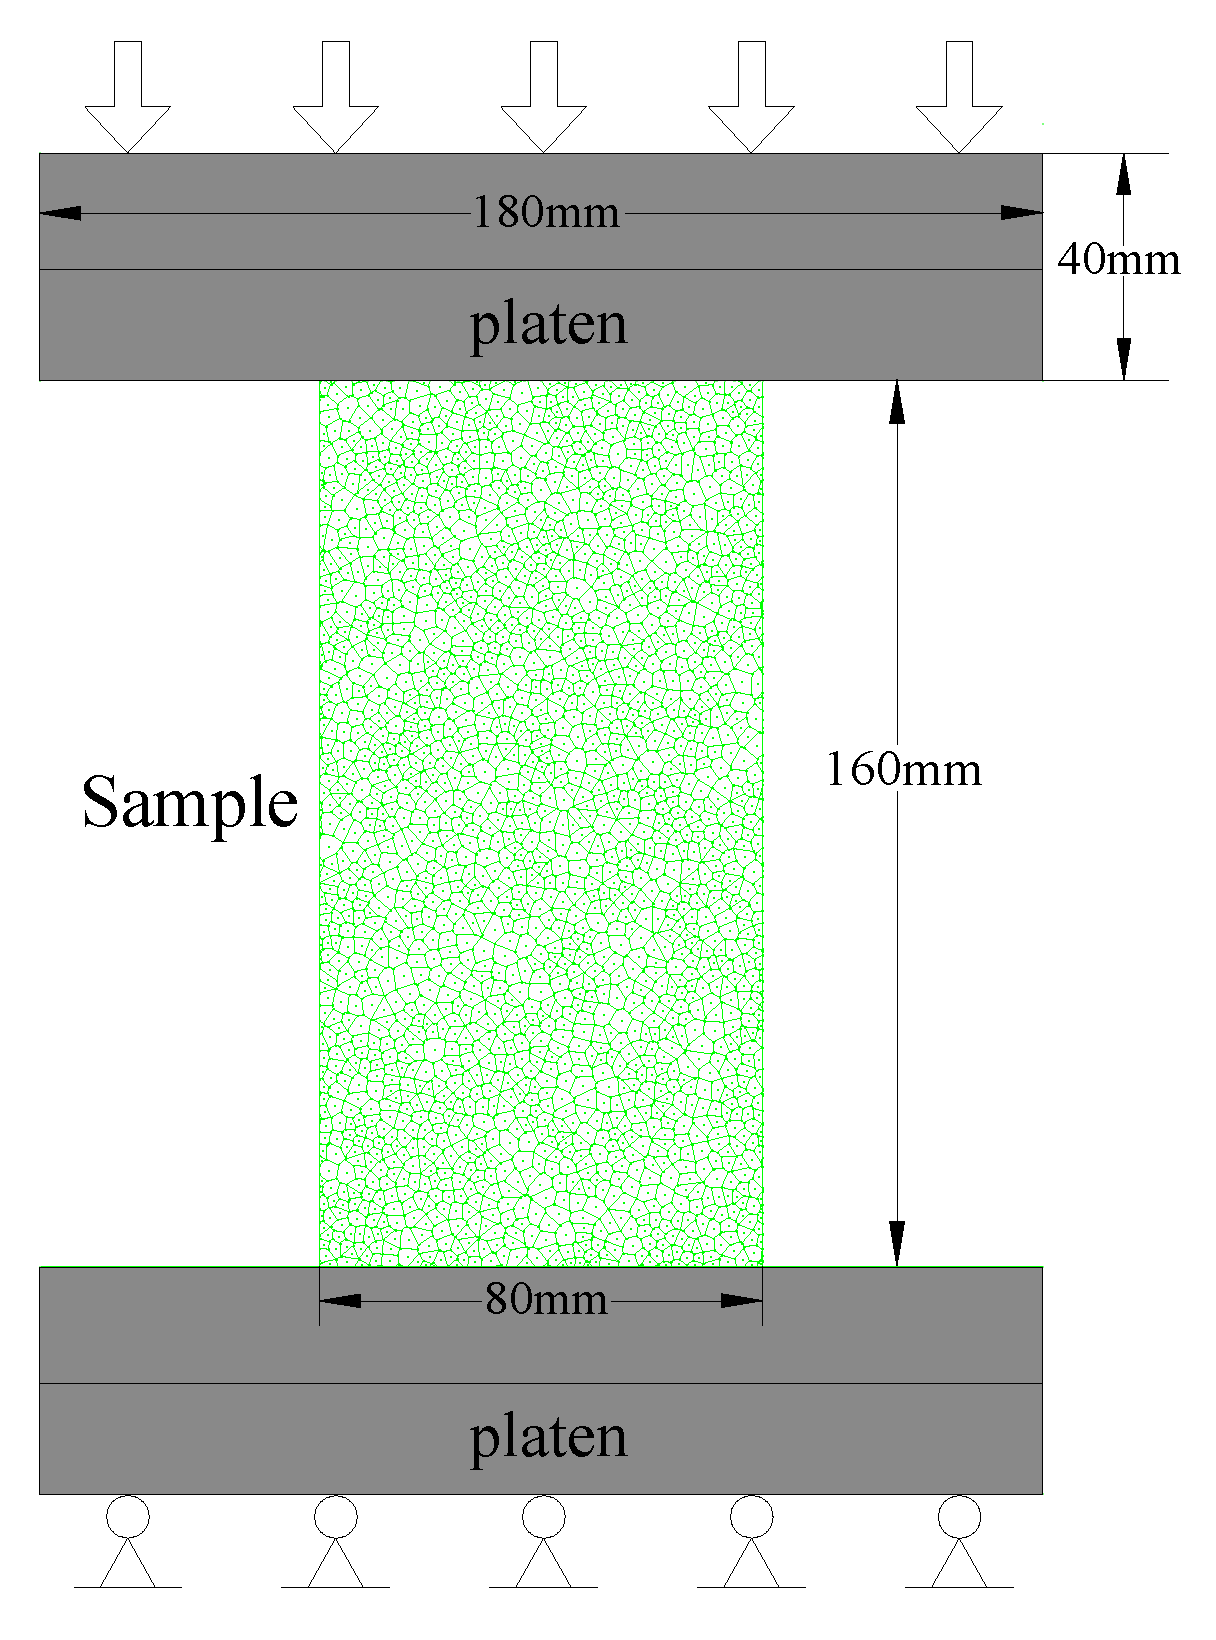
2.3.1. Construction of Numerical Simulation Model

In this paper, considering the intrinsic advantages of UDEC in simulating the development of rock fissures, the UDEC polygon method was used to simulate the response of rock under uniaxial compression, with a model size of 160 mm height × 80 mm width. Using the Voronoi tessellation generator command, the blocks were segmented into polygons and joints by setting the number of seeds and usually had a relatively uniform size, as shown in Figure 4. The upper and lower loading plates were set as a rigid body to simulate the loading plate in the mechanical experiment. The other blocks were made deformable, the displacement control was applied to the upper loading plate, and the fixed constraints were applied to the bottom loading plate. The quasi-static loading method was used in rock mechanics experiments, and local damping (damping value is 0.8 by default) was chosen as the damping setting.
The size of the block will influence the mechanical properties and crack propagation of the model. In order to study the influence of block size on the mechanical properties of the model, nine models with an average block size of 1.5–4 mm were established to simulate the uniaxial compressive strength of the rock specimen, as shown in Figure 5. Kazerani and Yao [27,28] suggested that when the grain size is less than one-tenth of the model, the effect of block size on the mechanical properties is reduced. However, crystals that are too refined will significantly increase the model’s establishment and calculation time. It takes 89 h using an ASUS computer (processor: Intel(R) Core(TM) i5-2450M [email protected] GHz, RAM: 4 GB) to calculate a model with an average size of 1 mm. In order to reduce the influence of block size on the mechanical properties and improve the calculation efficiency of the model, the average size of a block was set at 2.25 mm, which is enough refinement to simulate the mechanical behavior.
The displacement rate control applied by the upper loading plate has an important influence on the mechanical behavior of rock, and the loading speed must be slow enough to ensure that the rock specimen is in a quasi-static condition. In order to study the influence of loading rate on the mechanical properties of the model, different displacement rates (0.01, 0.02, 0.05, 0.10, 0.15.2 m/s) were exerted on the upper loading plate, and the axial stress was calculated by continuously recording the stress values in the contact area between the upper boundary and the loading plate, as shown in Figure 6. With increased loading rate, the uniaxial compressive strength and peak strain increased. The uniaxial compression strength with 0.01 m/s loading rate was as low as 9.974 MPa, and the maximum uniaxial compression strength with 0.2 m/s loading rate was 13.26 MPa. We used the 0.1 m/s loading rate, which has been validated to be low enough to ignore the effect of loading rate on mechanical properties [29].
Based on the findings of the previous rock foundation mechanical experiment (Figure 1), the cracks in the experiment did not penetrate the gray-white minerals in the red mudstone. In order to reproduce this phenomenon in numerical simulations, the contacts were joined in the specified range of the numerical model to simulate the mineral circles. Contacts that are joined cannot slide or open. The average size of the blocks of gray-white minerals in the model was 2.25 mm. The joint stiffness in the specified area was calculated automatically. The normal stiffness was based on an average zone stiffness multiplied by a factor, and the default value of the coefficient was 100. In the process of calculation, the maximum normal stiffness value that was calculated automatically was assigned to the joint, and the shear stiffness value was taken as half of the normal stiffness value [15]. Based on the grinding experiment of the rock samples, it was found that the hardness of gray-white minerals is higher than that of red mudstone. The bulk and shear modulus of the grains as well as normal and shear stiffness of the polygonal contacts control the sample’s elastic constants, they have a relatively small effect on the sample’s UCS [30]. In order to describe the difference between the mechanical properties of the gray-white minerals and red mudstone, it is assumed that the bulk modulus and shear modulus of the mineral circle were twice that of red mudstone.

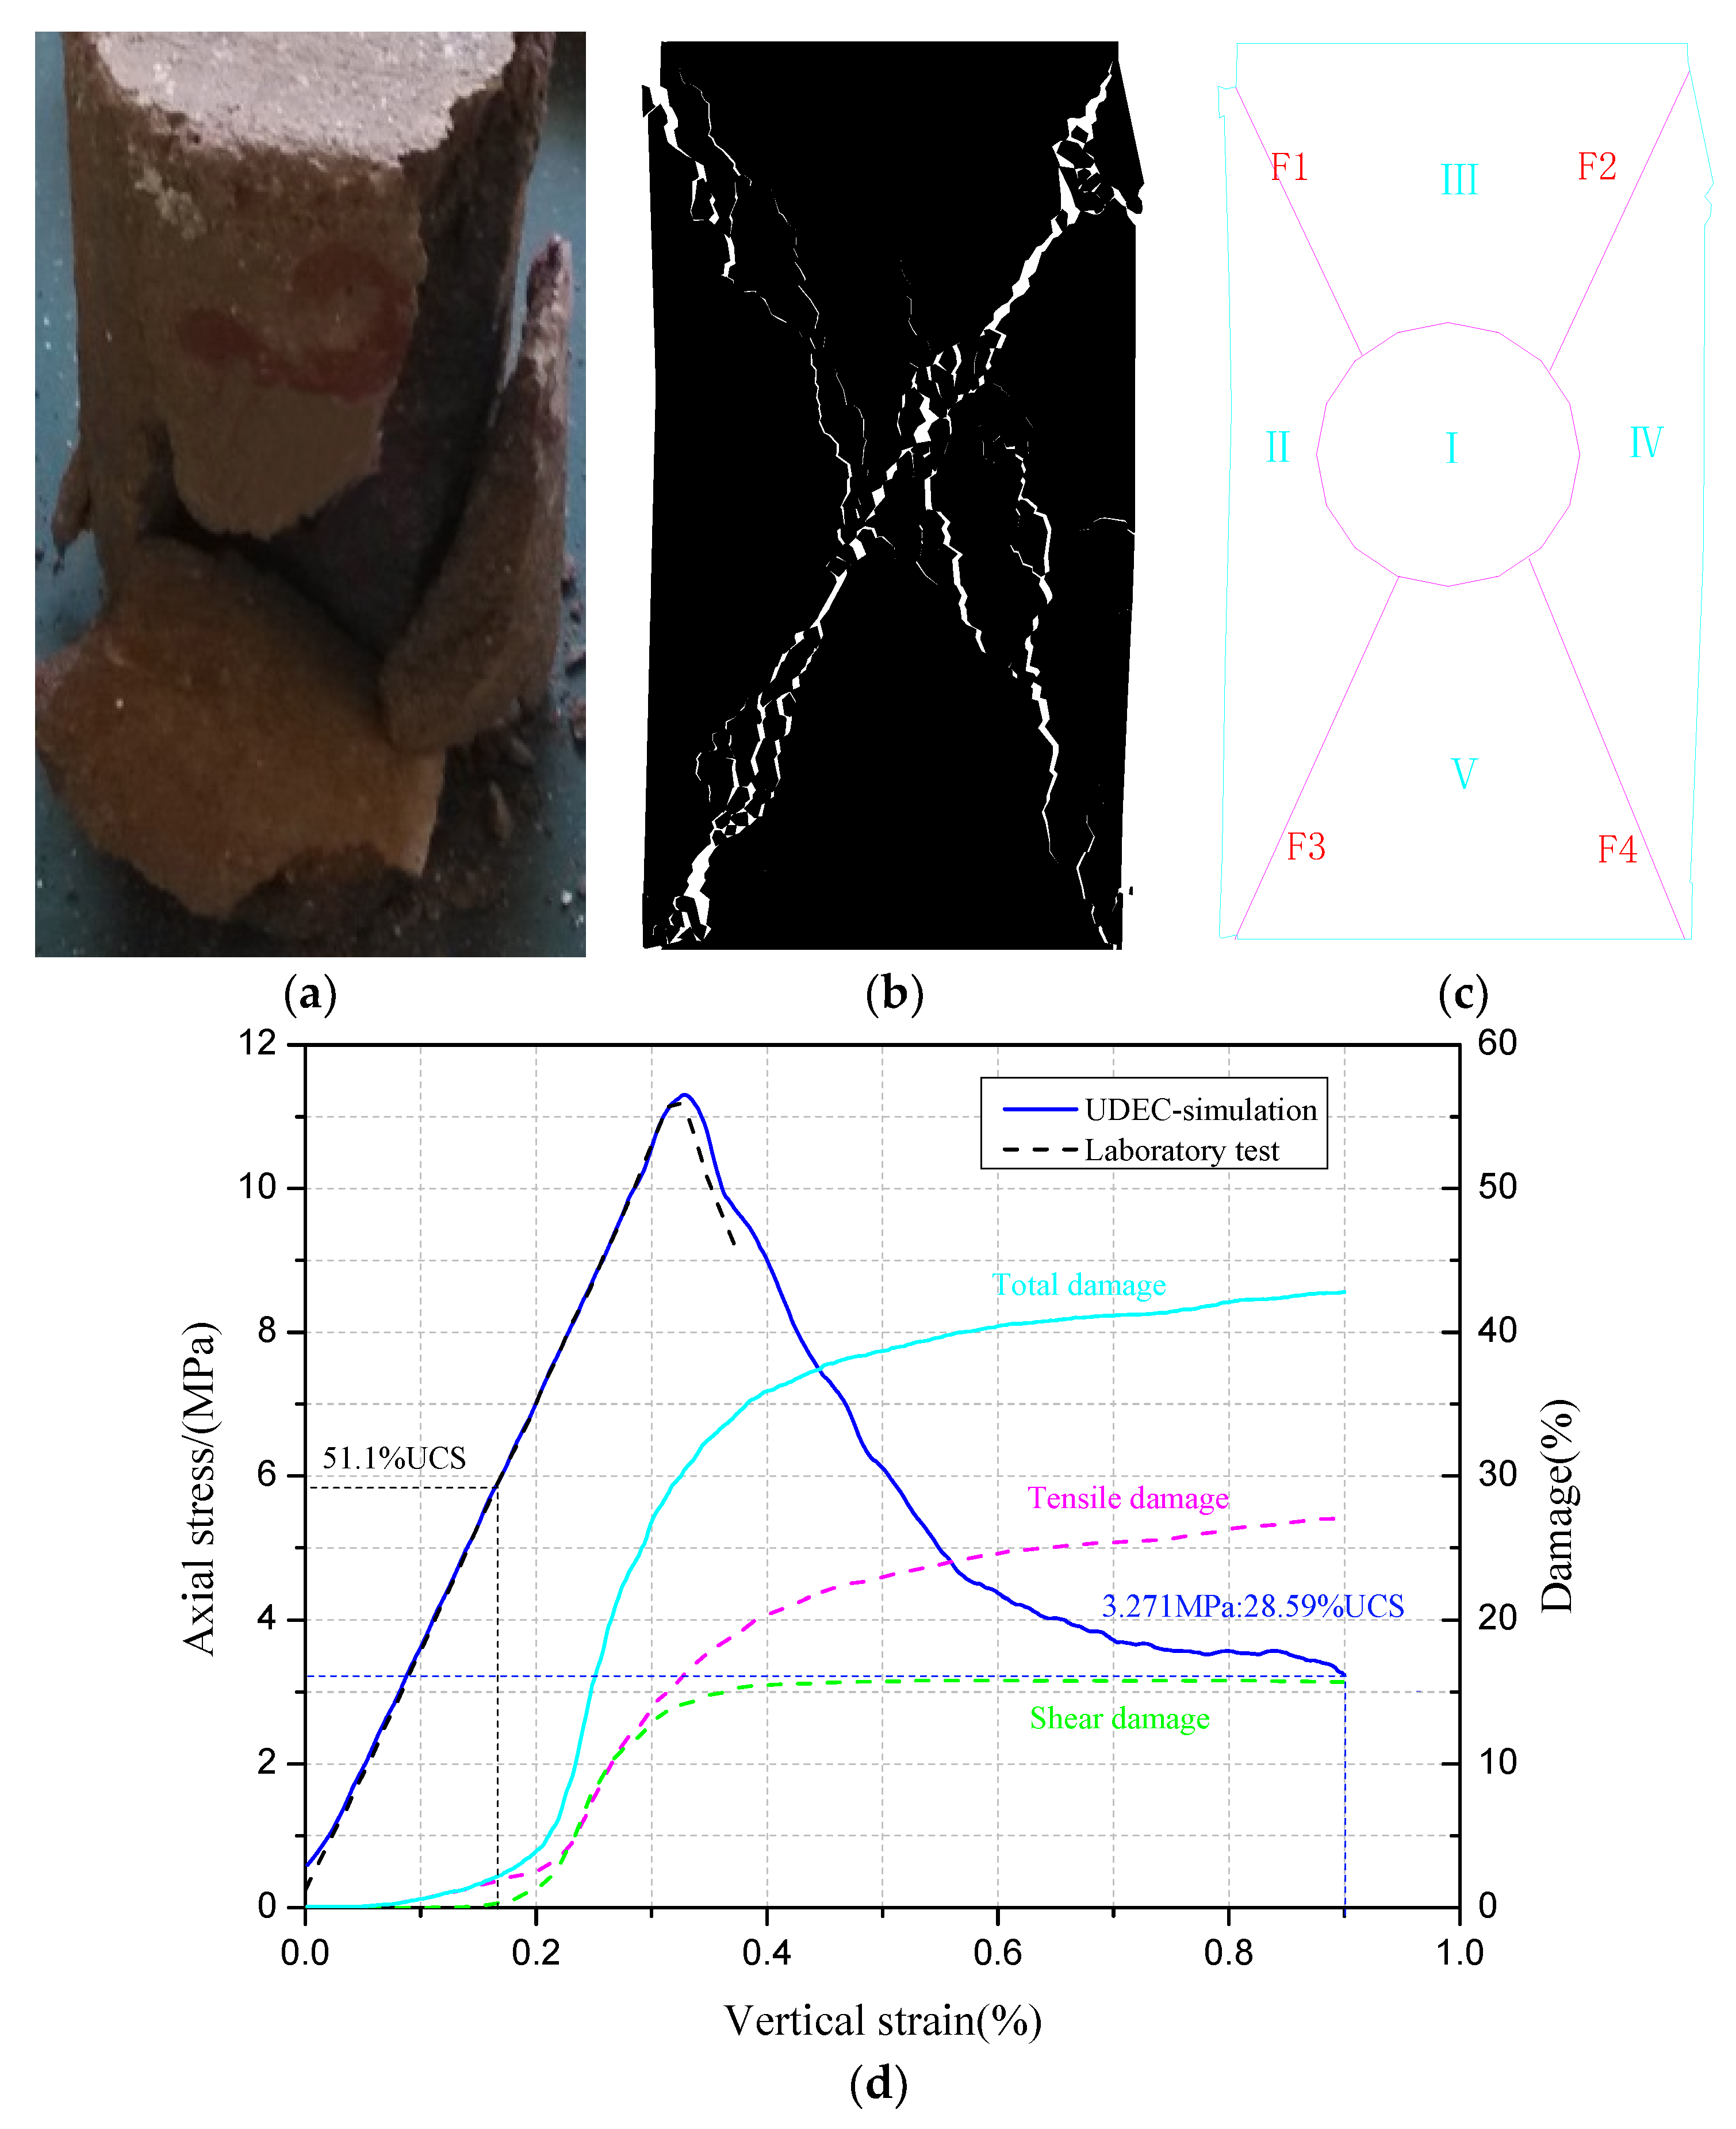
2.3.2. Numerical Model Parameter Verification

In the process of numerical simulation calculation, selecting reasonable physical and mechanical parameters can effectively reproduce the mechanical behavior of rock. A previous method was used to fit data in this paper [31,32,33]. The mechanical parameters of the blocks and contacts were determined by fitting the uniaxial compressive strength of the rock. In order to obtain the physical and mechanical parameters of the blocks and contacts in the model to represent the mechanical behavior of red mudstone, a relatively uniform sample (compared to Figure 1a) was selected for the uniaxial compression text for parameter fitting. The blocks in the model was elastomer, and the mechanical strength was controlled by the joints. The FISH language was used to determine joint damage. Joints that produced tensile damage were the tensile damage group, and joints that produced shear damage were the shear damage group.
The physical and mechanical parameters applied to the numerical model are shown in Table 1. Figure 7 shows the numerical simulation results of the uniaxial compression test. As shown in Figure 7a. An X-shaped failure pattern occurs during the experimental uniaxial compression test. The same failure mode was obtained in the numerical simulation, as shown in Figure 7b. Figure 7c is the stress–strain curve of the model; the stress peak of uniaxial compression model was 11.39 MPa, the stress peak of the specimen was 11.44 MPa, and the error value was 0.44%. The numerical simulation results of uniaxial compression are well fitted to the experimental results. Before the stress peak was reached, the stress increased linearly with the increase in strain. The stress decreased rapidly after the peak stress. The stress value was reduced to the lowest value of 3.271 MPa and the uniaxial compression strength (UCS) was 28.59%. The number of damaged joints was recorded during the simulation. The amount of damage was equal to the number of damaged joints divided by the total number of joints. Before reaching 51.1% of the peak stress, the joints were mainly affected by tensile damage, and when the stress value was exceeded, the joints began to produce shear damage and the quantity increased rapidly. When peak stress was reached, the percentage of shear and tensile damage was 14.47% and 17.22%, respectively. After the peak, the number of joints suffering shear damage increased and then stabilized at approximately 15.69%. The number of joints suffering tensile damage increased and then stabilized at approximately 27.1%. Nearly 42.79% of the joints were found to be cracked. The number of joints suffering tensile damage was approximately 1.73 times the number suffering shear damage.
The presence of minerals will change the stress distribution inside the rock specimen and cause a change in the position of stress concentration, resulting in a change in the crack initiation location and failure mode [11,18,19,34]. In order to describe the crack morphology, the broken fitting model (Figure 7b) was partitioned, as shown in Figure 7c. The model was divided into five regions: region I was the central crushing region, and regions II–V were the relatively complete zone of the model. The main macrocracks were named F1–F4 in the clockwise direction.

2.4. Determining the Numerical Simulation Scheme

Based on the Voronoi polygon method and mineral circle simulation technology, five numerical simulation schemes were determined and 42 calculation models were established. In scheme one, the mineral circle was arranged in the central coordinates (40 mm, 80 mm) of region I, and the radius of the mineral circle was 2.5–40 mm (C1–C9), as shown in Figure 8, to study the influence of different mineral sizes on rock specimen strength and failure mode. In scheme two, the mineral circle radius was 5 mm with a 0.6% mineral ratio, the upper left quarter of the rock sample was divided into three levels, and three positions were selected at each level to decorate the mineral circle (L1–L9), as shown in Figure 9. This was used to study the influence of mineral circle position on the mechanical properties of rock specimens. In scheme three, the mineral circle radius was 5 mm and four positions were selected in the rock sample, the central crushing region (I) and the relatively complete zone (II and III), and a mineral circle was arranged in the extension direction of the F1 crack. Then the sequence composition of C42 was taken to analyze the influence of two mineral circle conditions on the mechanical properties of rock specimens, as shown in Figure 10. In scheme four, the mineral circle radius was 10, 5 and 2.5 mm (Figure 11a) and the mineral ratio was 2.45%, 4.9% and 9.8%. Then, according to the mineral circle radius, three computational models containing a single size mineral circle were established to explore the influence of different mineral ratios on the mechanical properties of rock samples, as shown in Figure 11. In scheme five, the mineral circle radius was 5 and 2.5 mm (Figure 12a) and the mineral ratio was 4.9%. The area ratio of the 5 and 2.5 mm mineral circles contained in the rock sample was 6:2, 4:4 and 2:6, and three numerical models were established for each ratio (Figure 12) to investigate the effects of different mineral circle proportions on the mechanical properties of rock samples. In schemes four and five, the mineral circles were randomly distributed in the model, and the FISH language built into UDEC was used to generate mineral circles and ensure that the circles were not embedded or produced at the edges of the model.

3. Numerical Simulation Results

In this section, the simulation results of the five experimental schemes are analyzed in detail. In order to study the mechanical characteristics of rock specimens in the whole stress–strain process, four characteristic values were selected as key objects: (1) elastic modulus, (2) uniaxial compressive strength, (3) maximum stress post-peak, and (4) minimum value post-peak. The crack patterns of rock specimens are studied. The UCS of the rock sample is marked on the bottom left of the model after it is broken, and the maximum value post-peak is marked on the bottom right. The maximum value is the value where the model goes through the post-peak descent stage before increasing to the maximum.

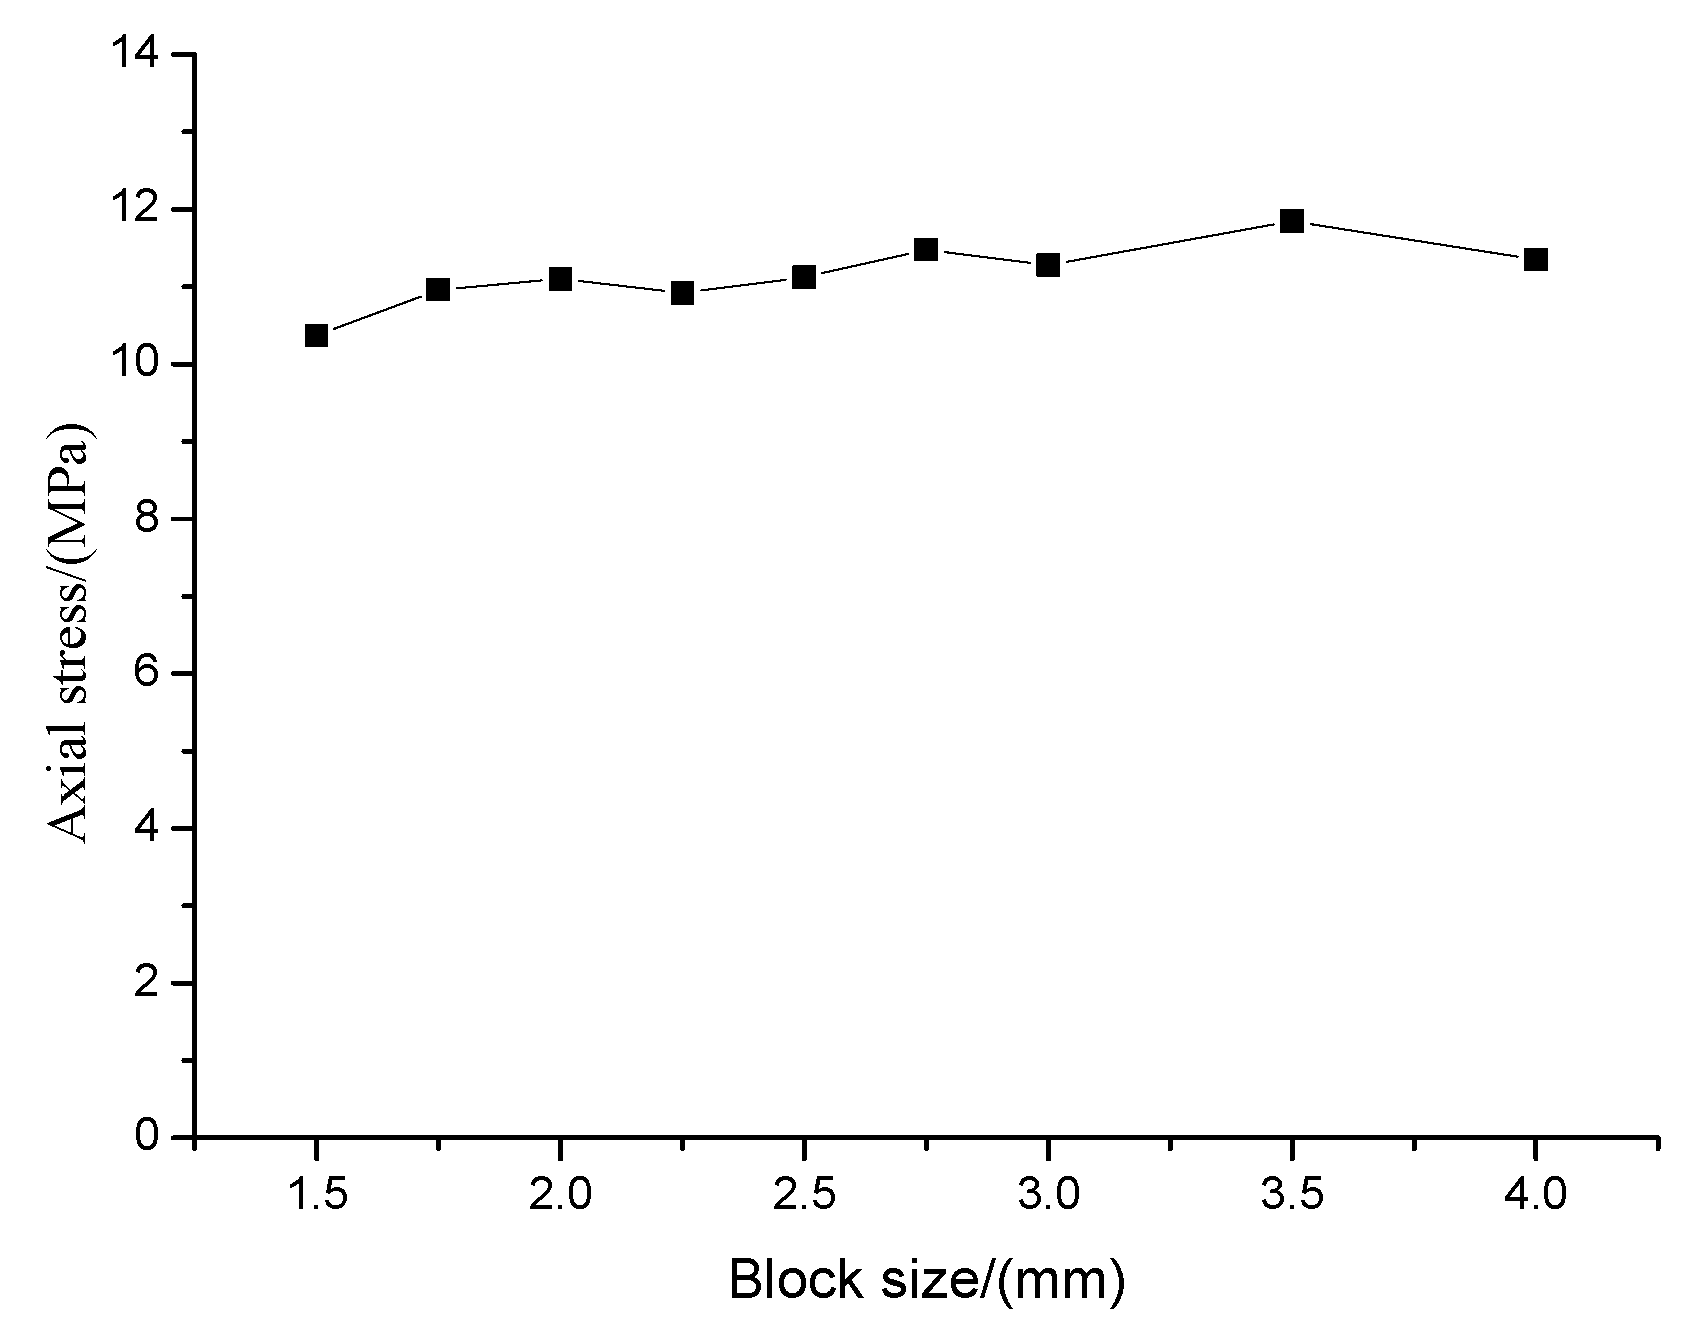
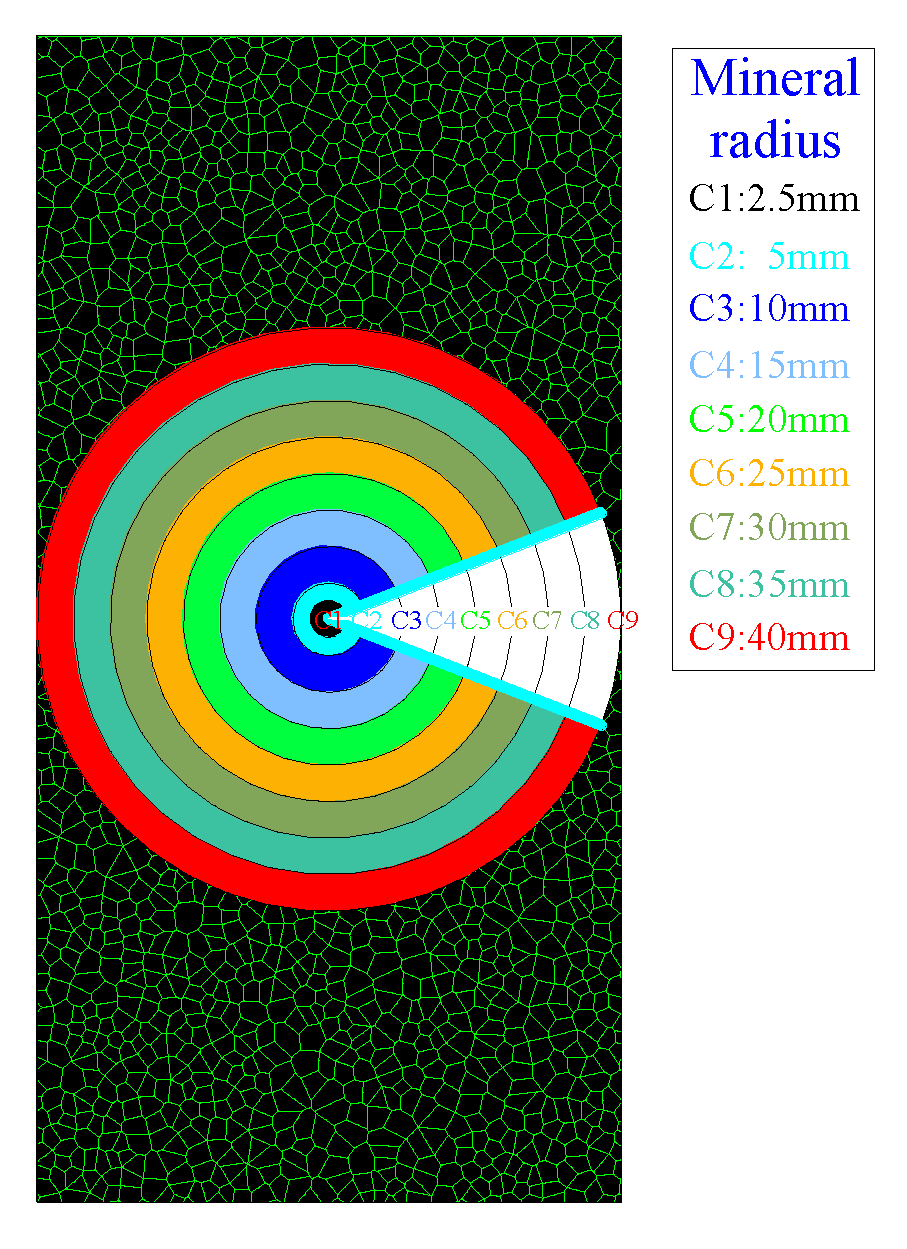
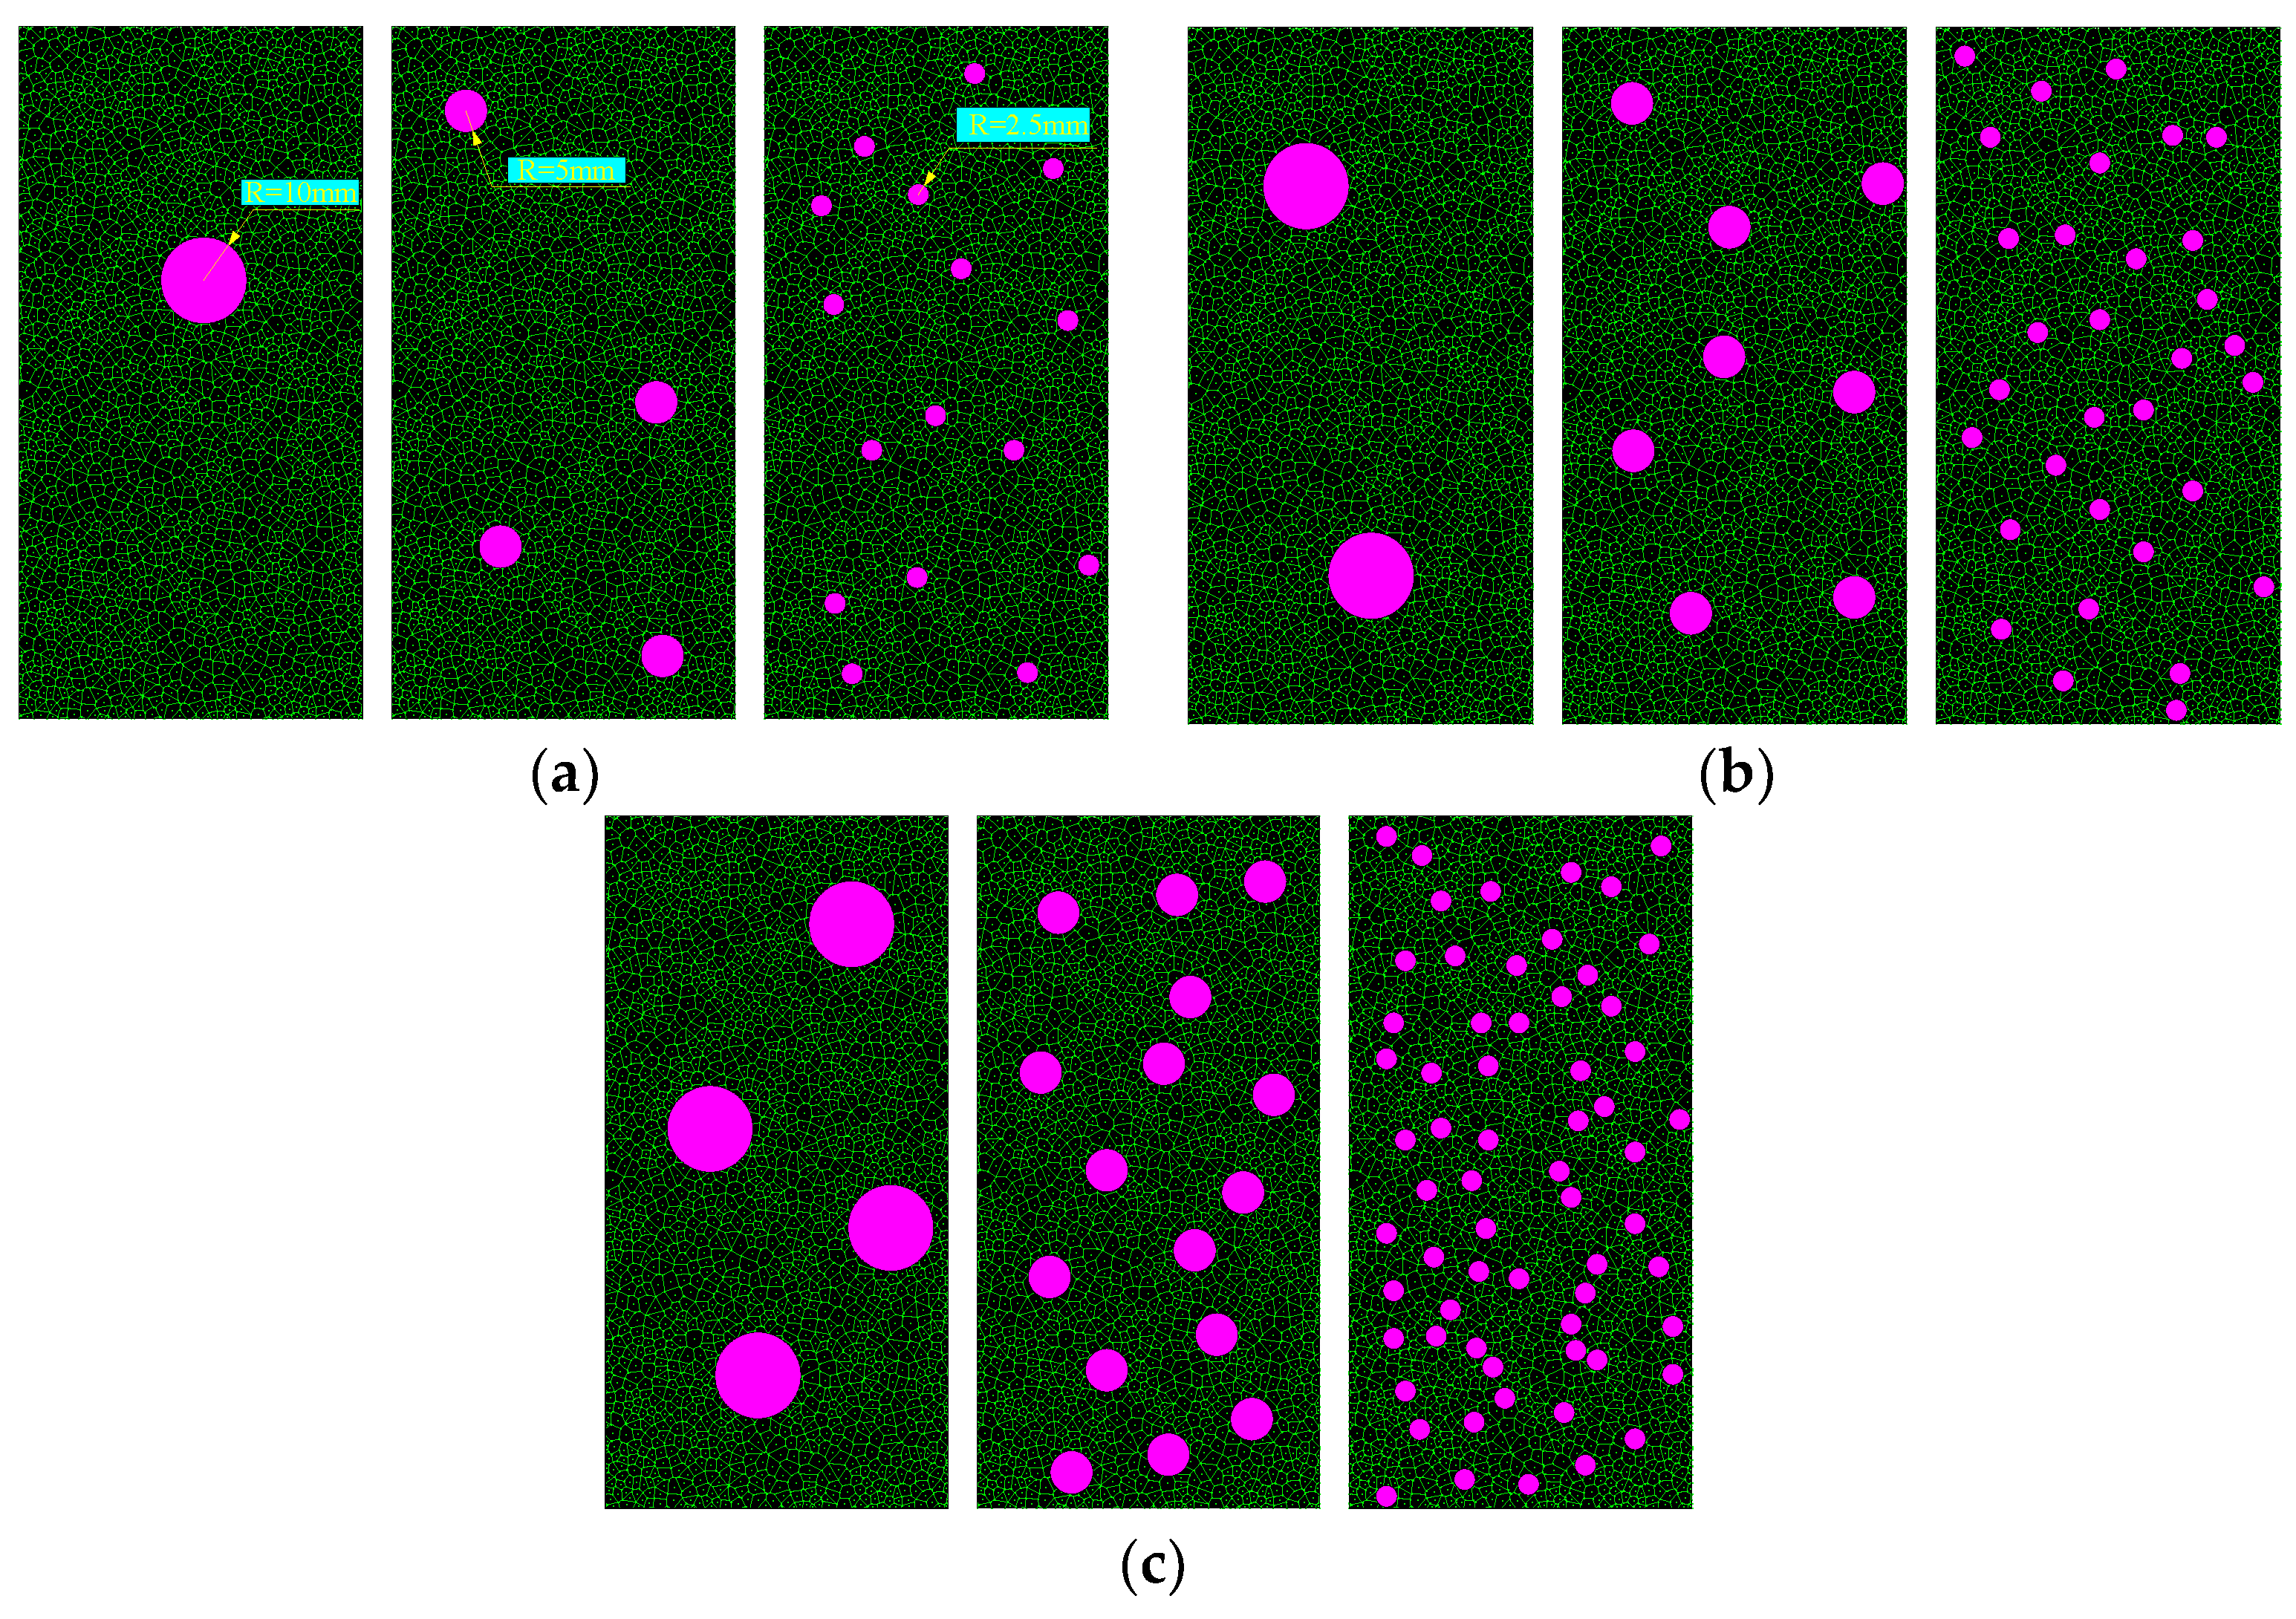
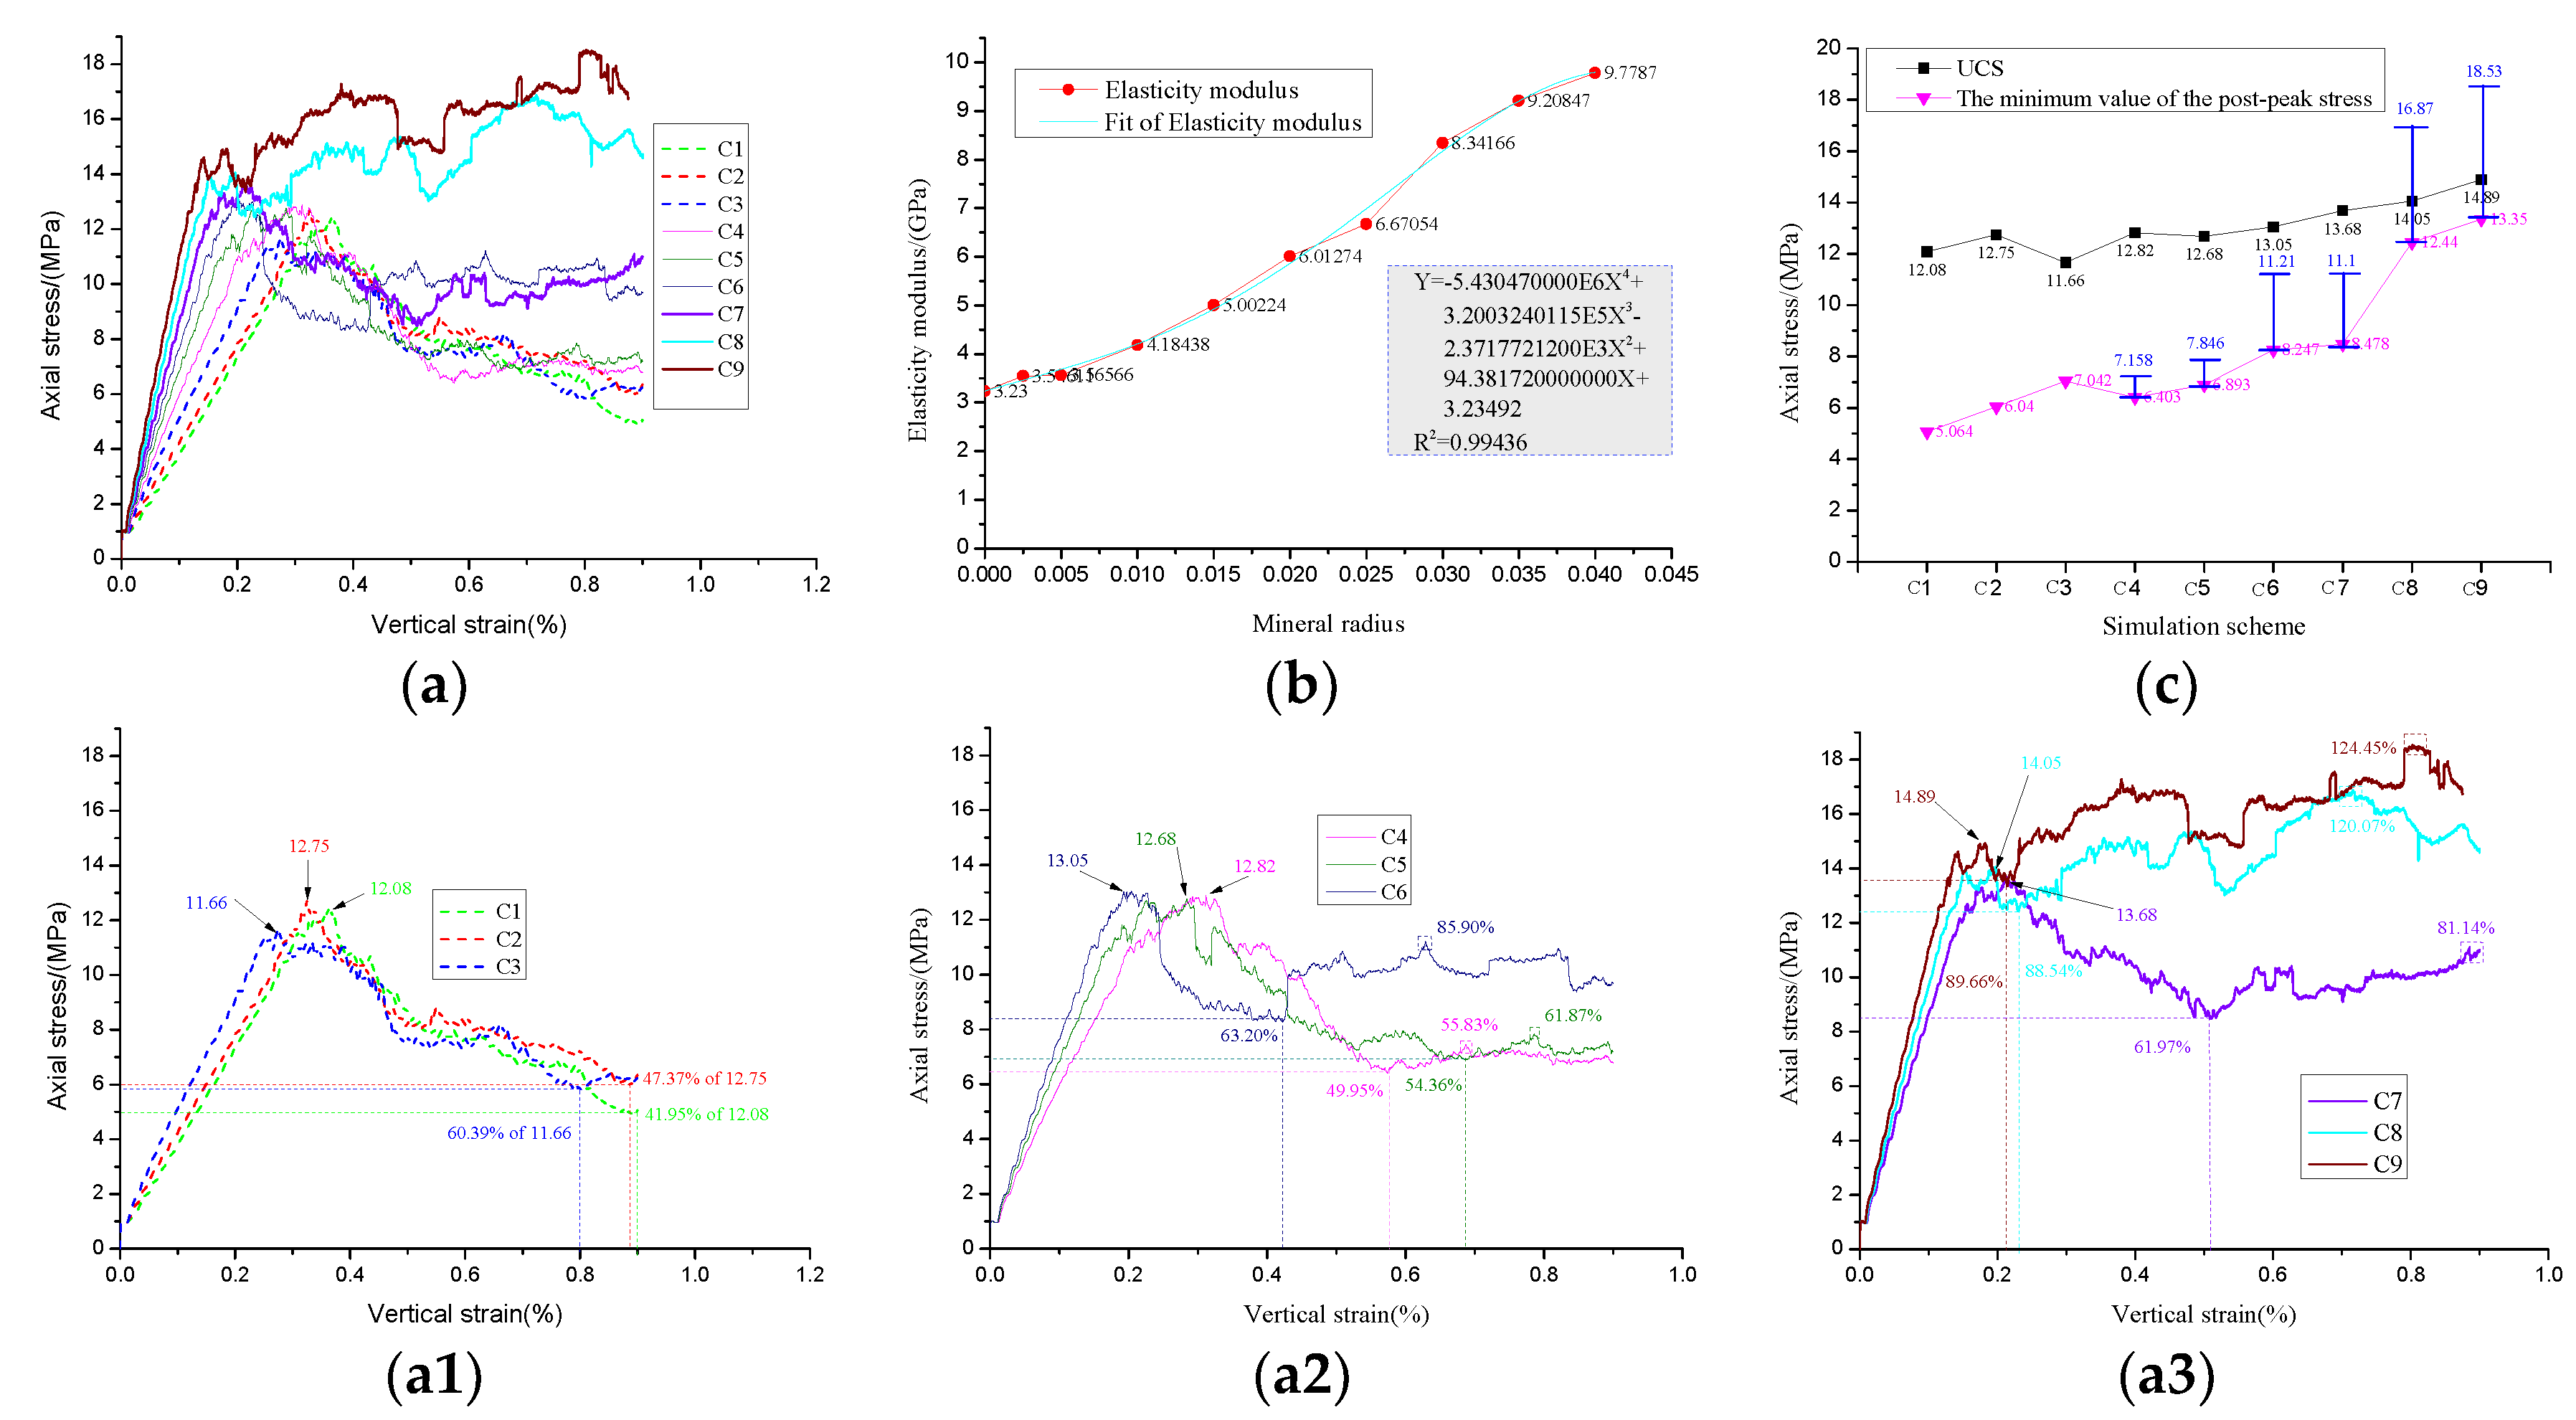
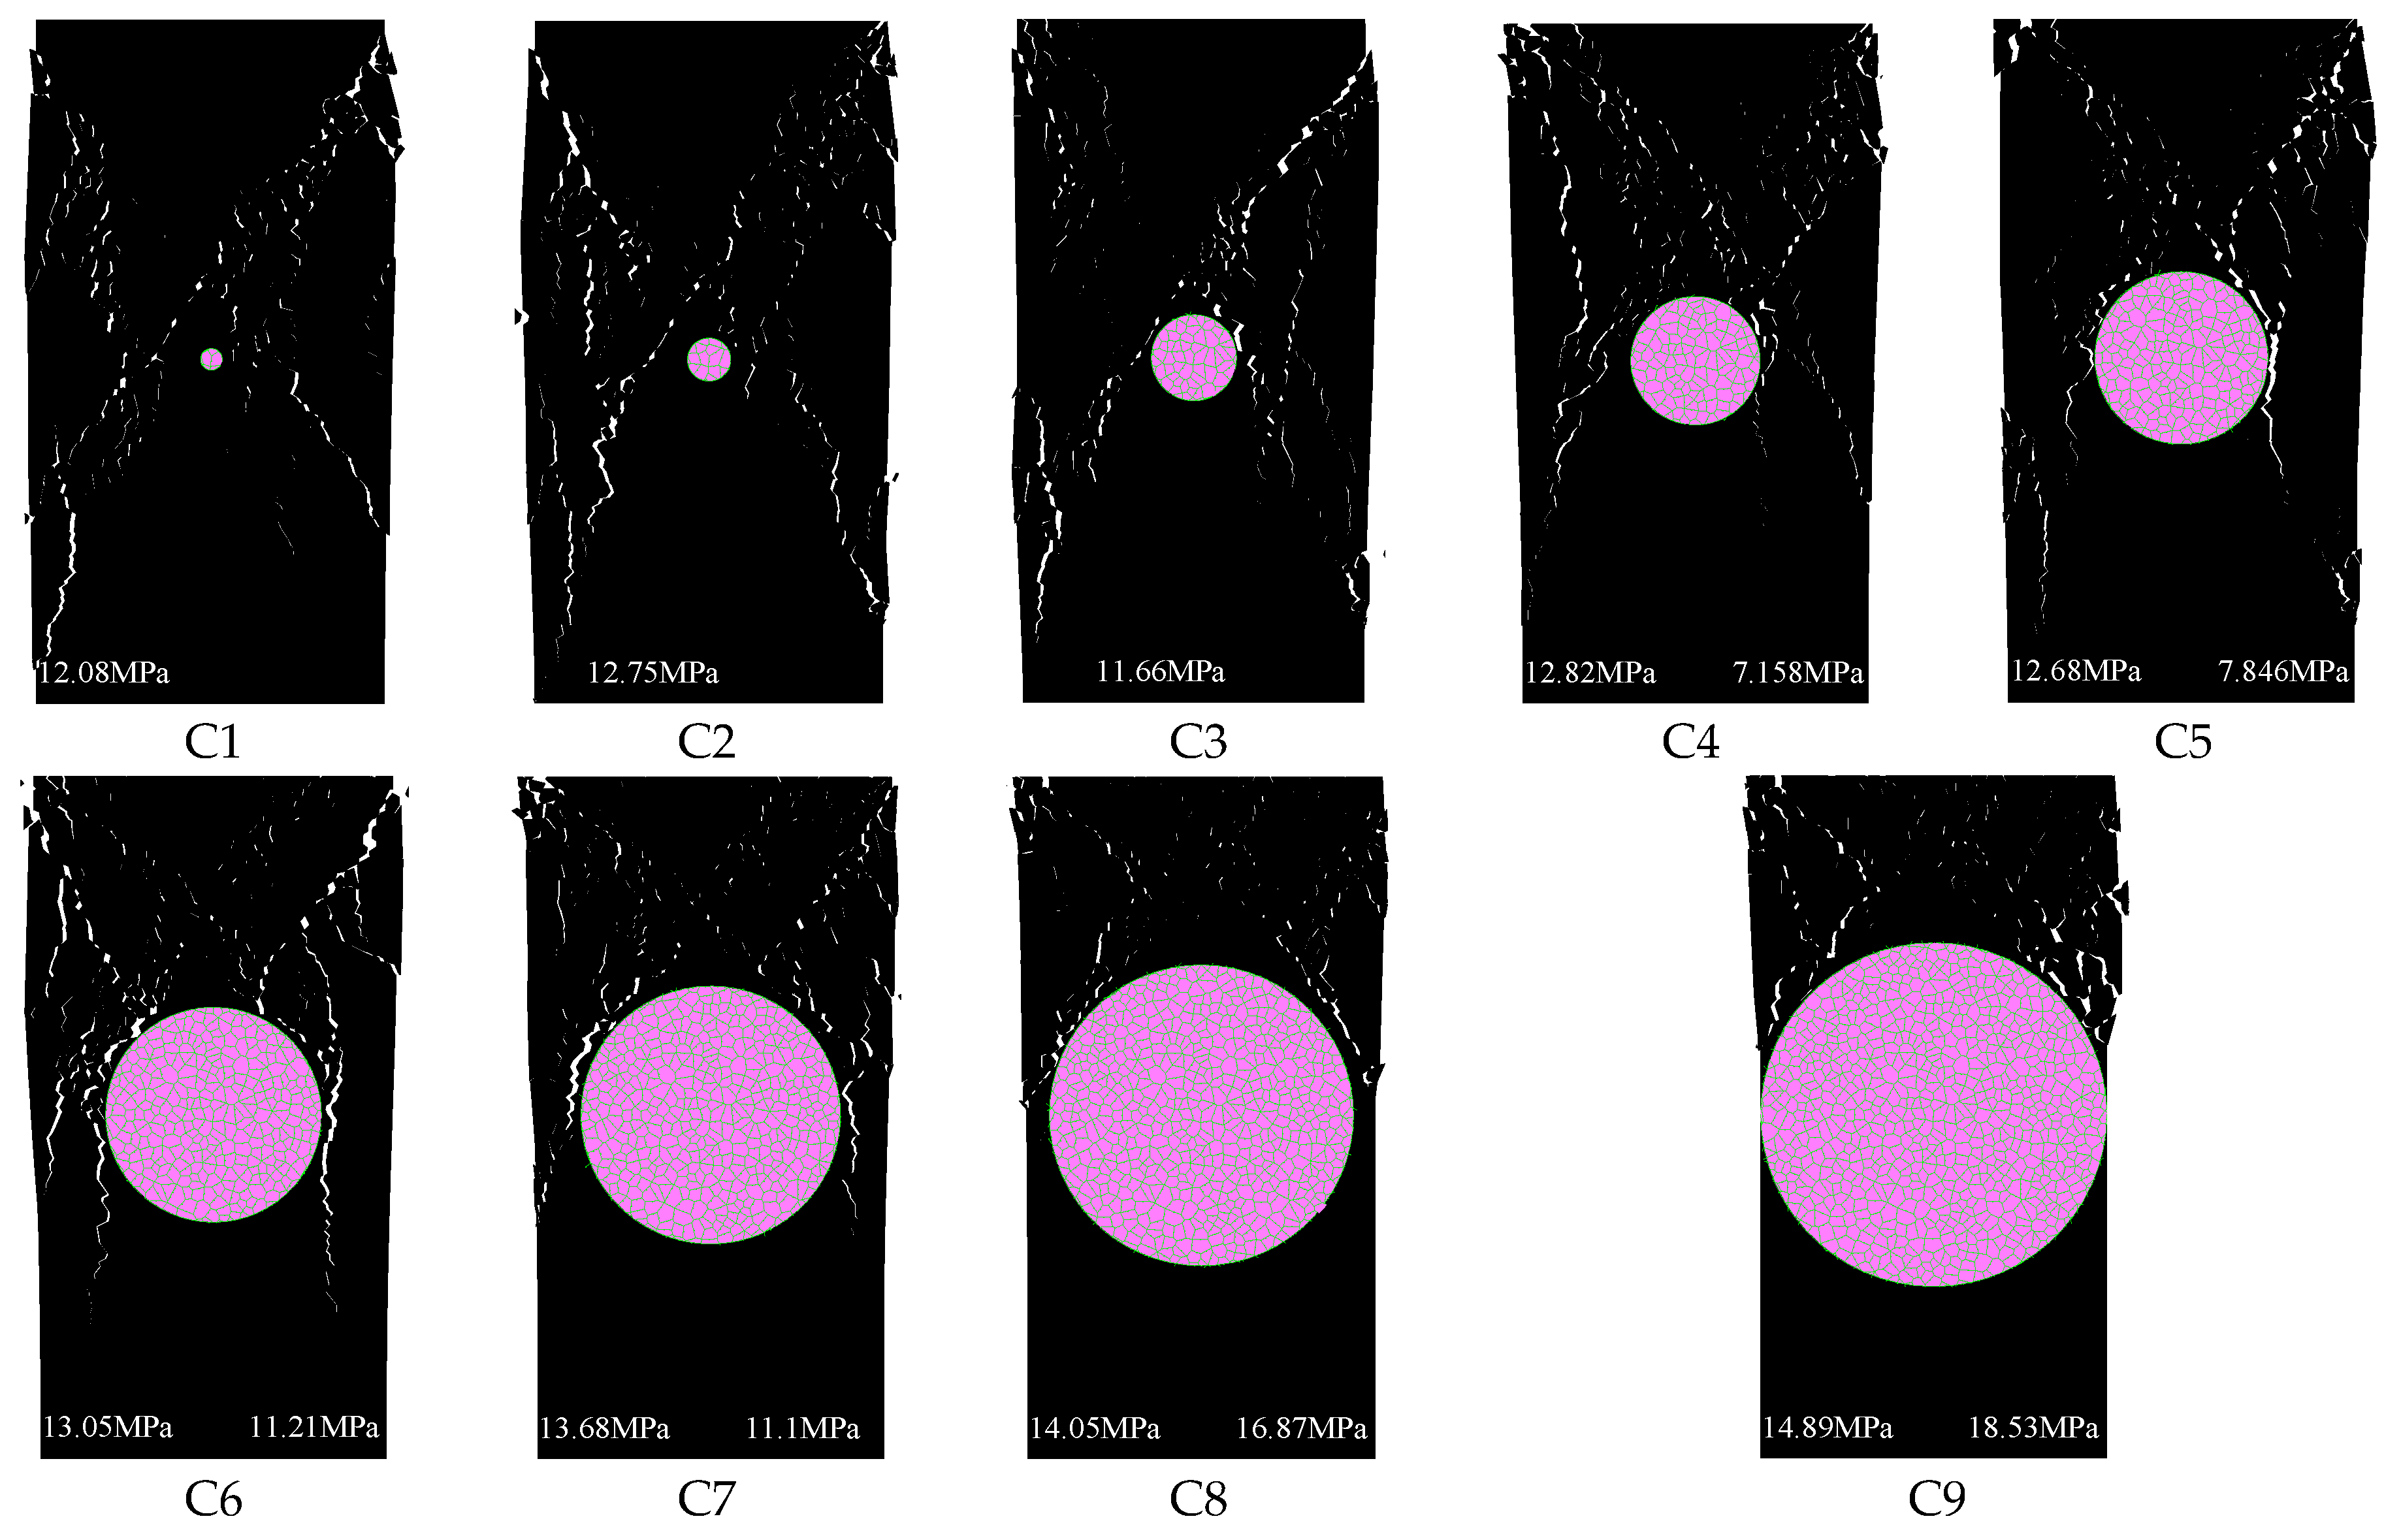
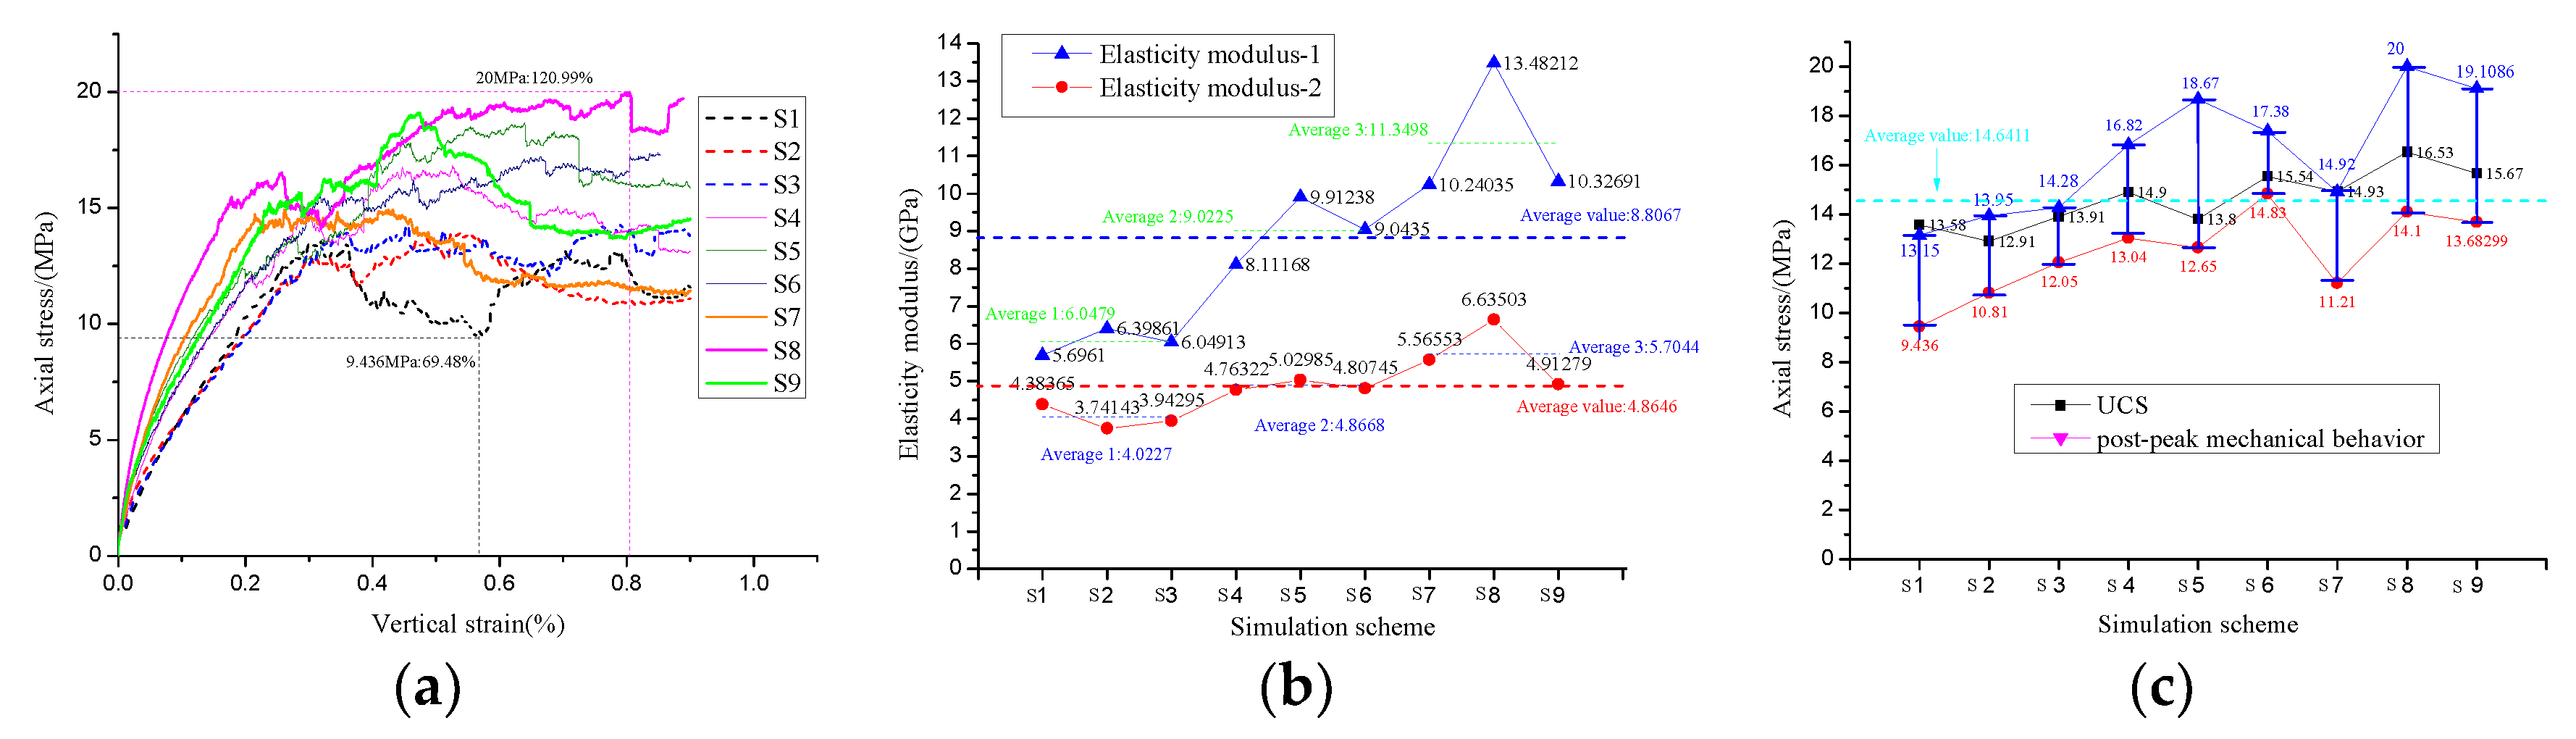
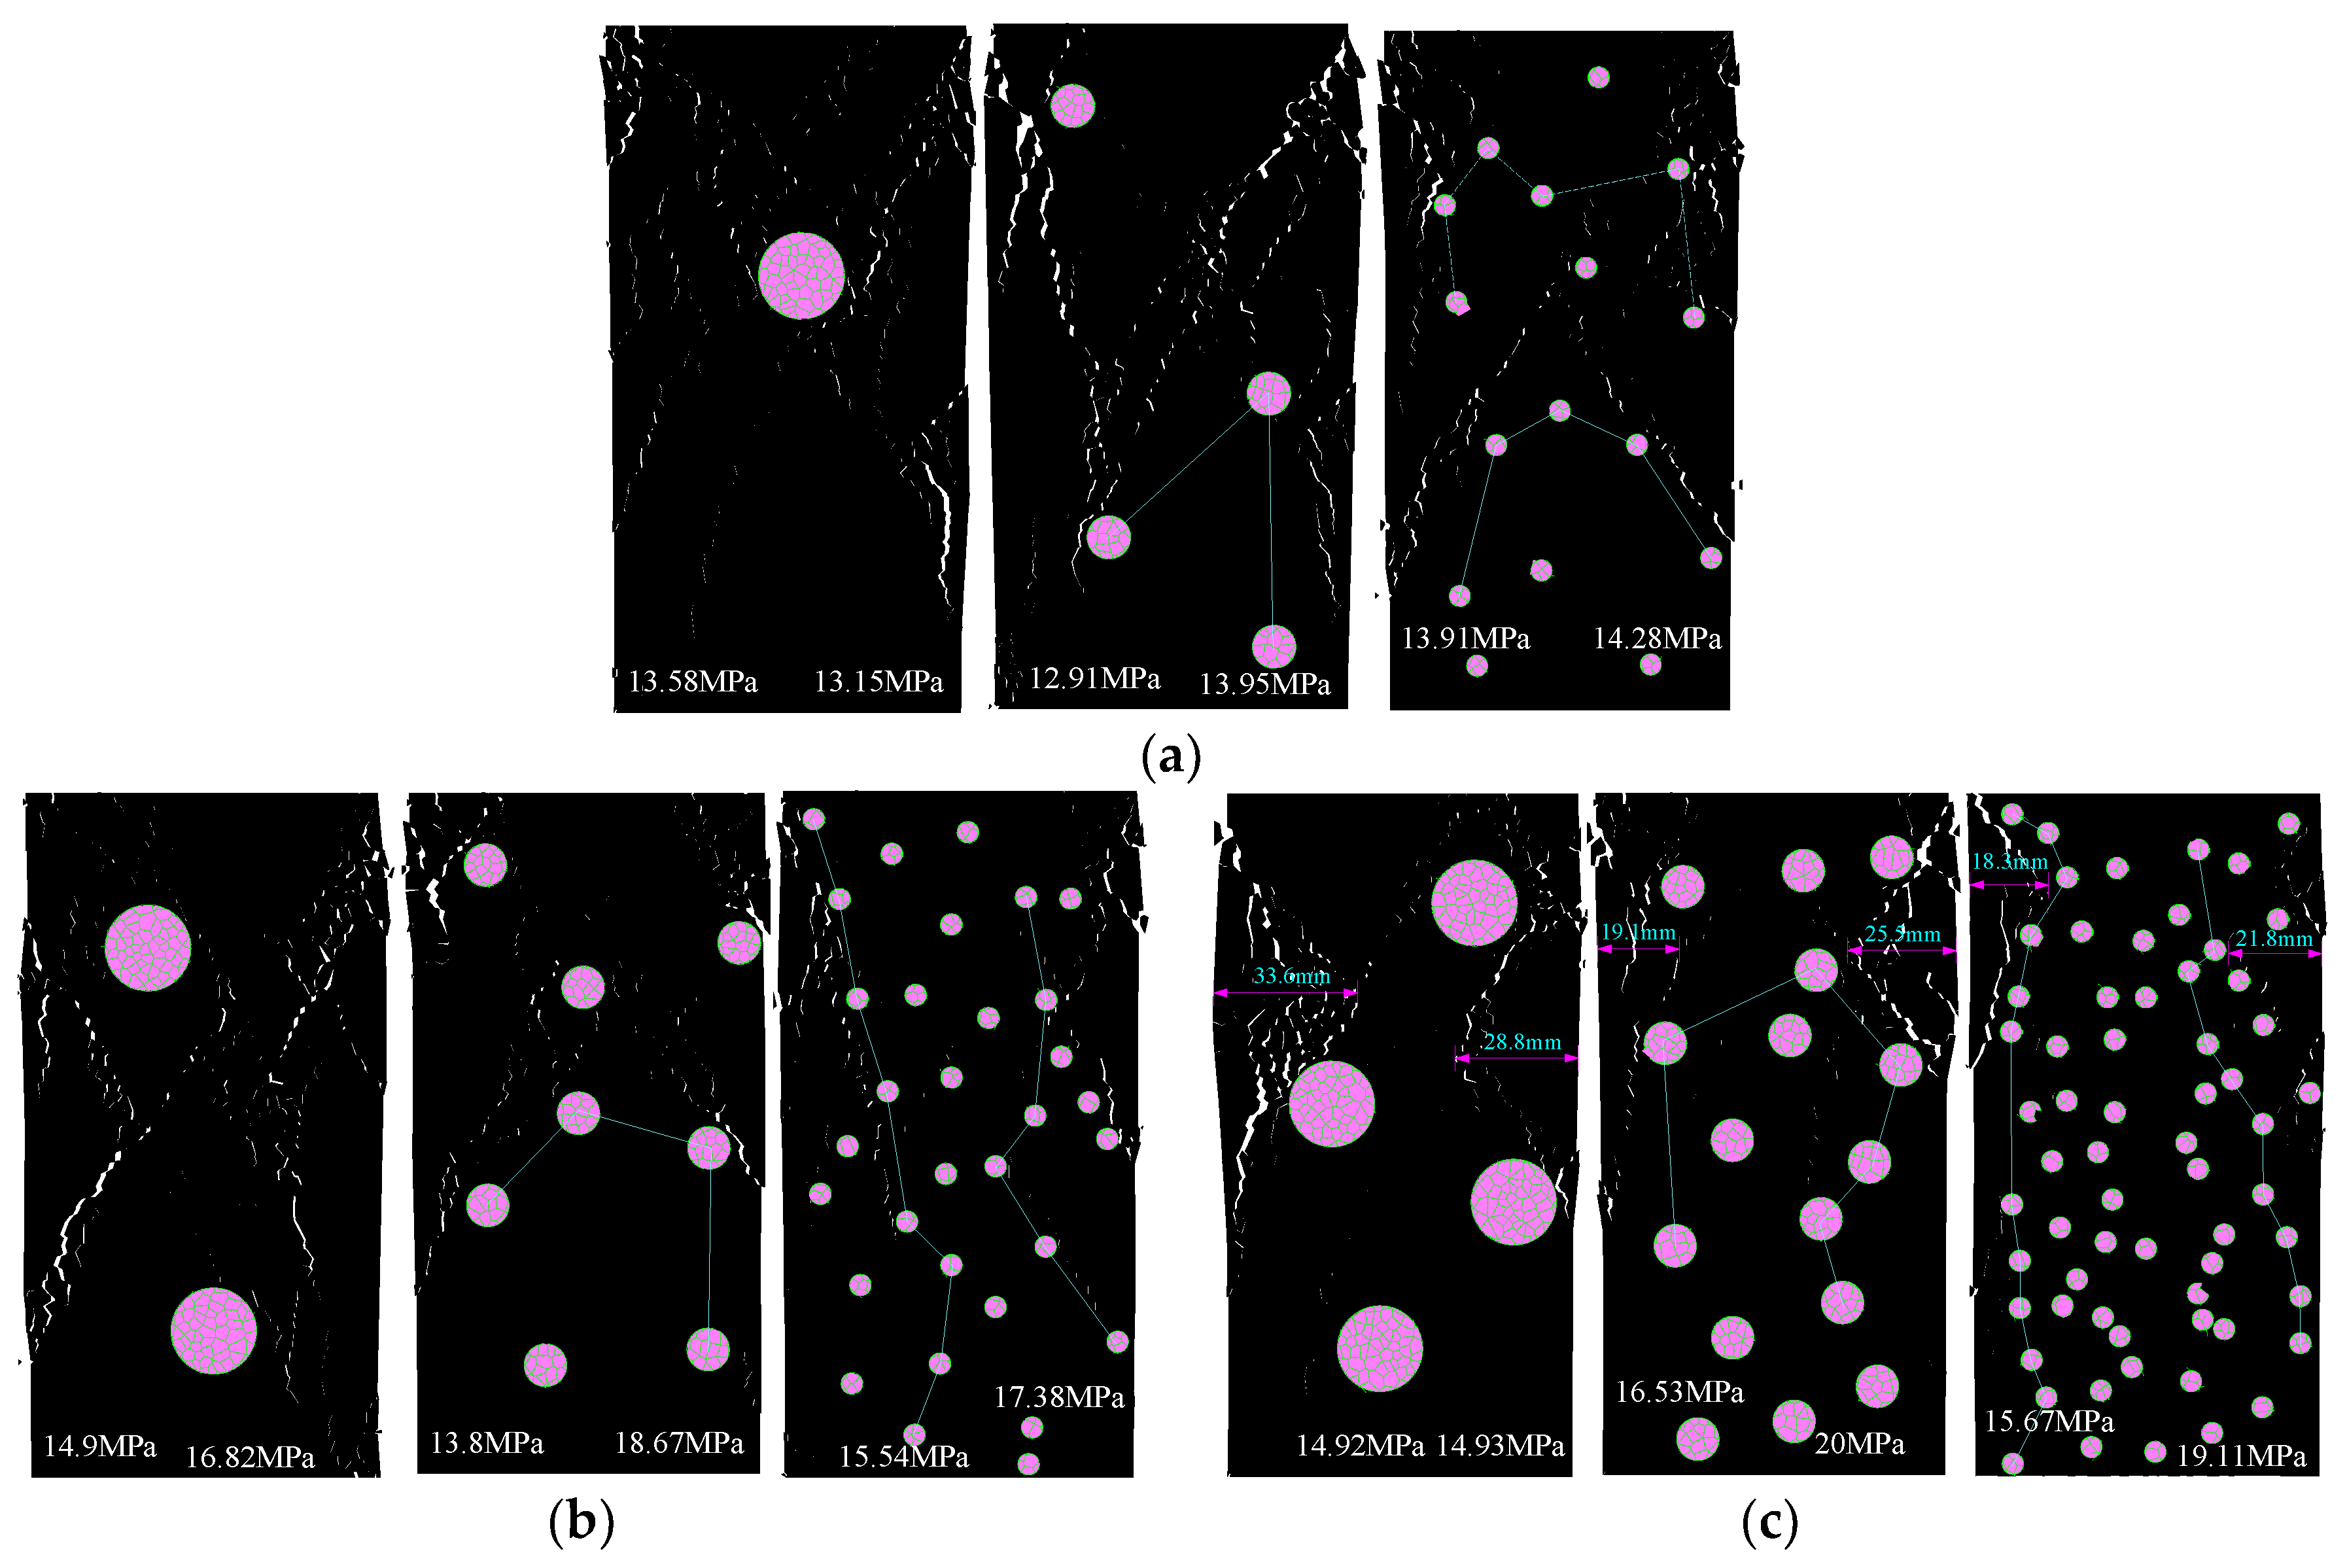
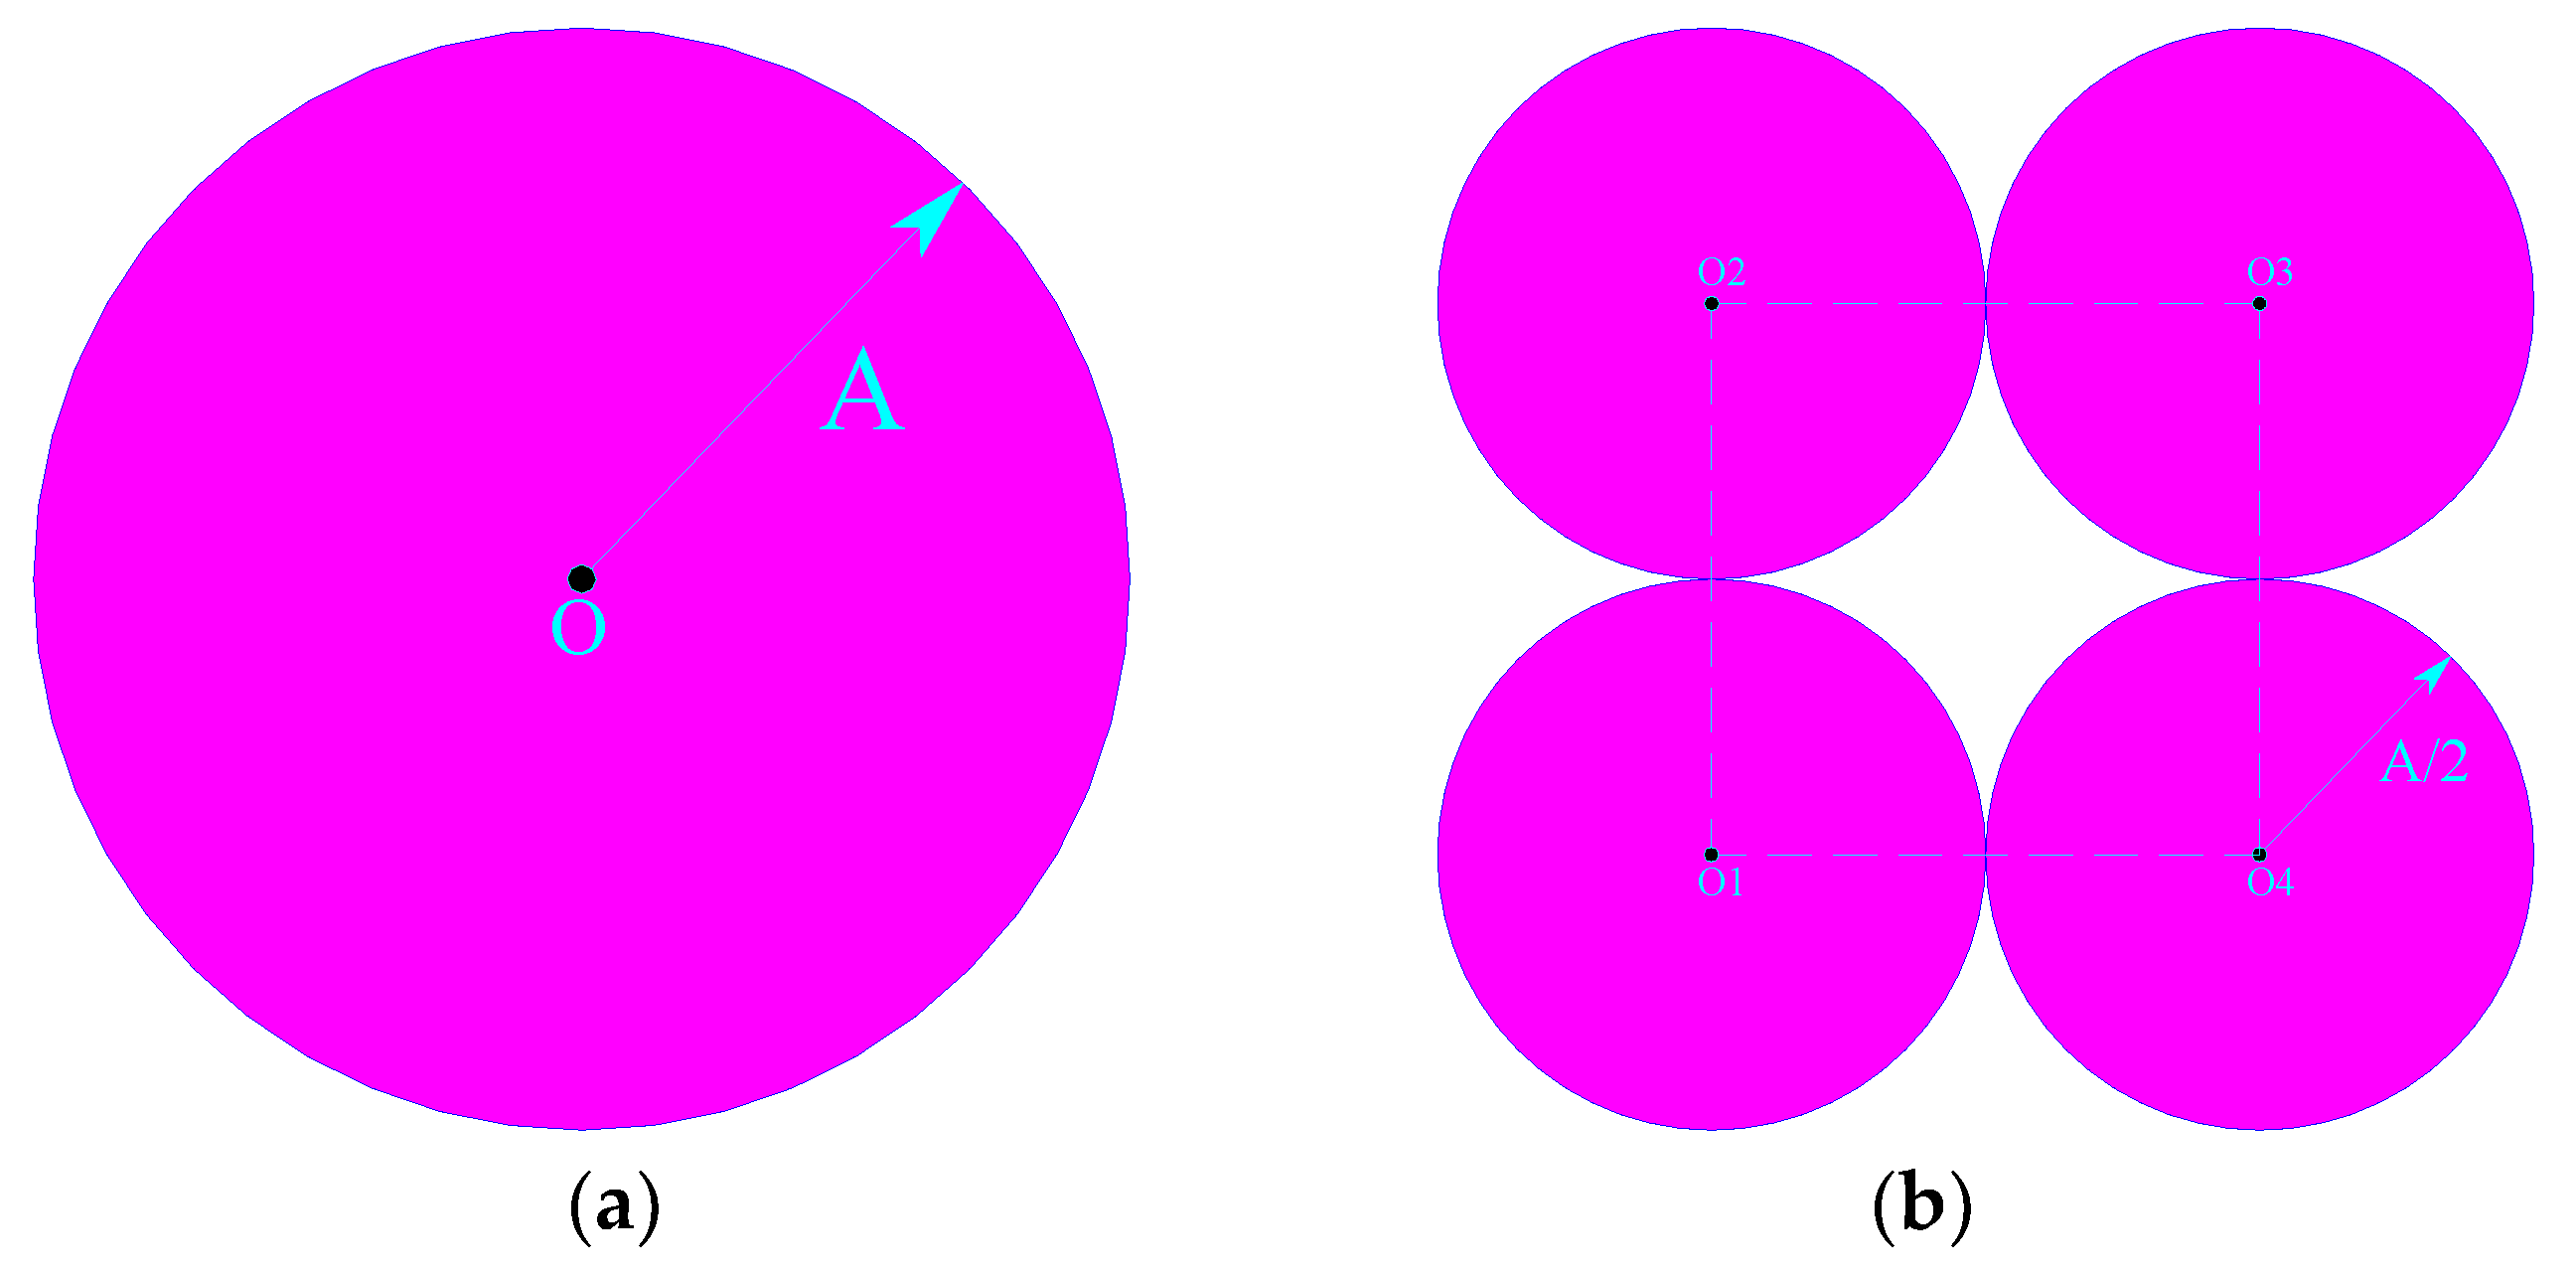
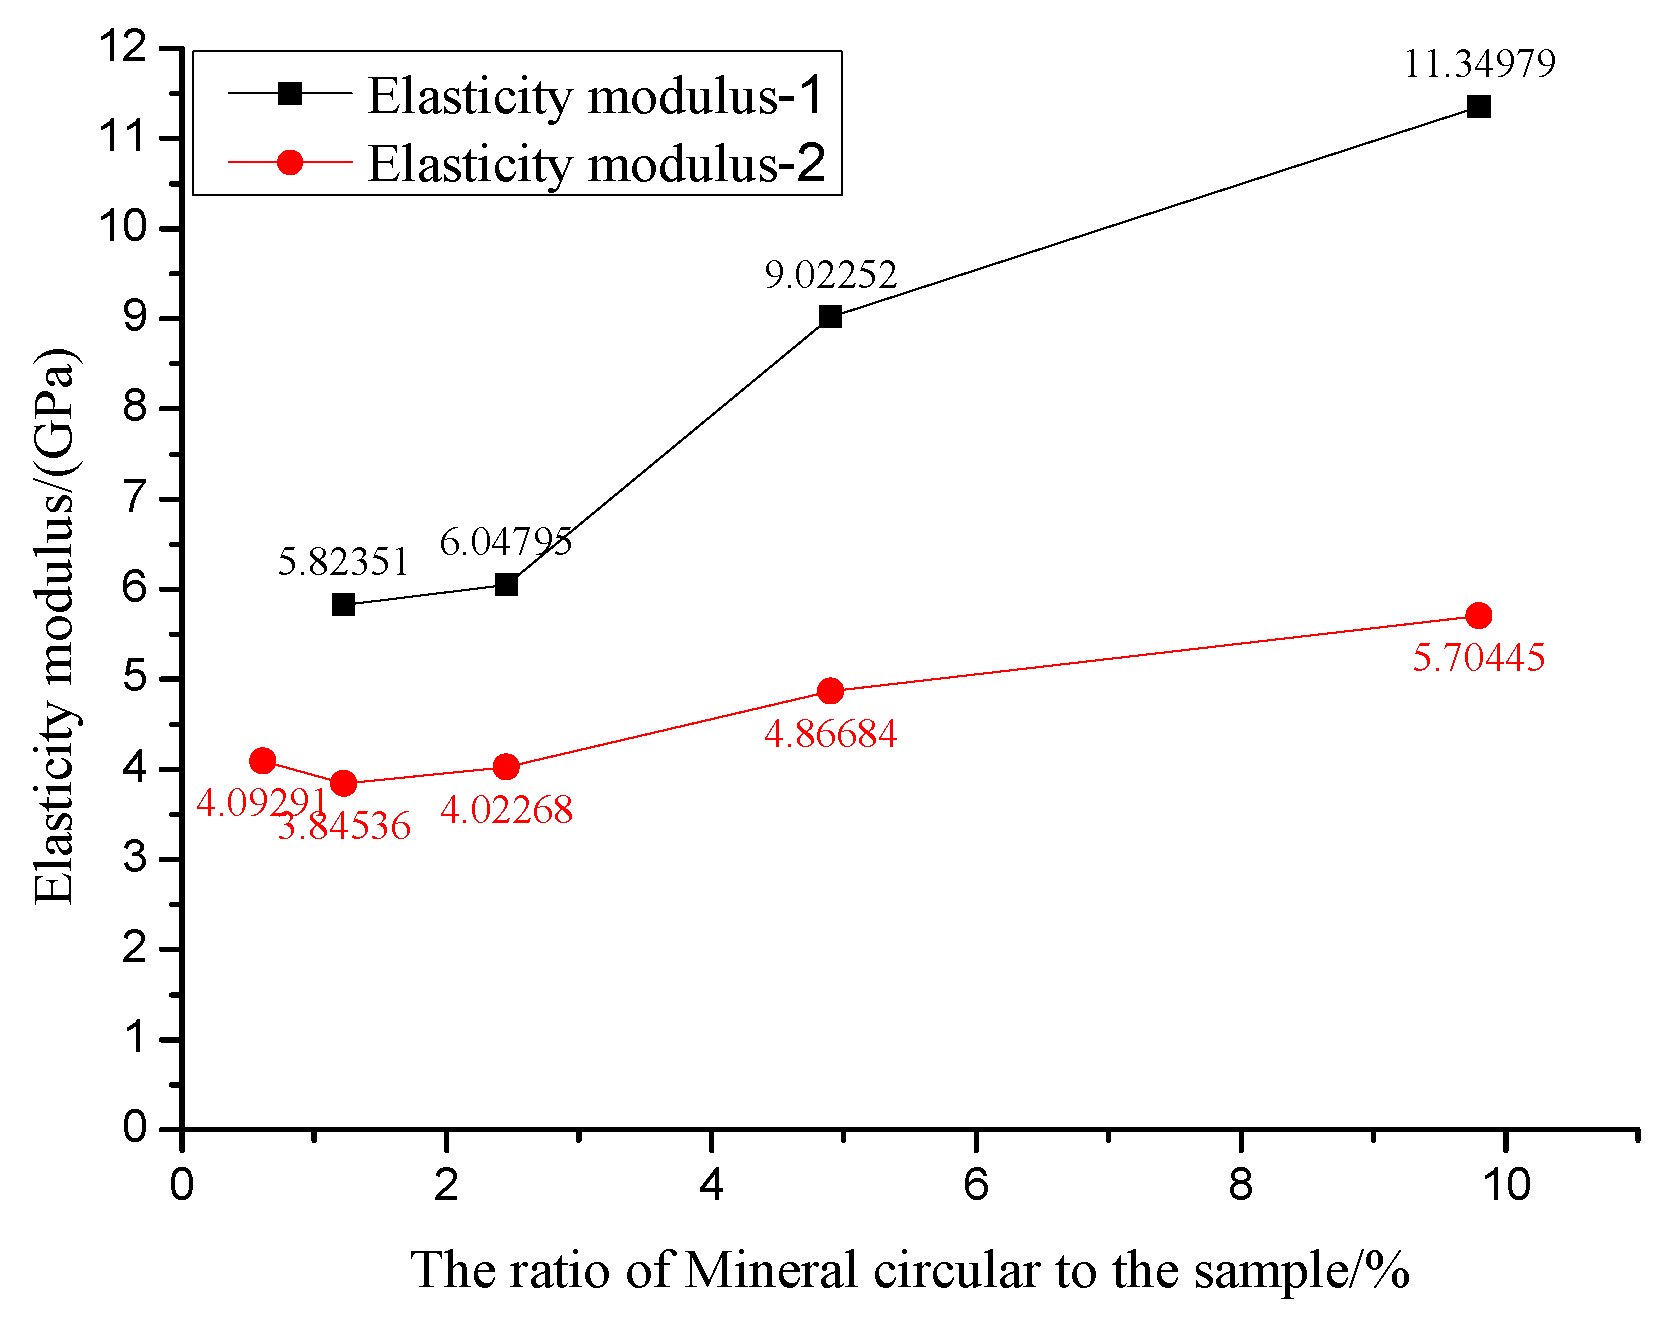
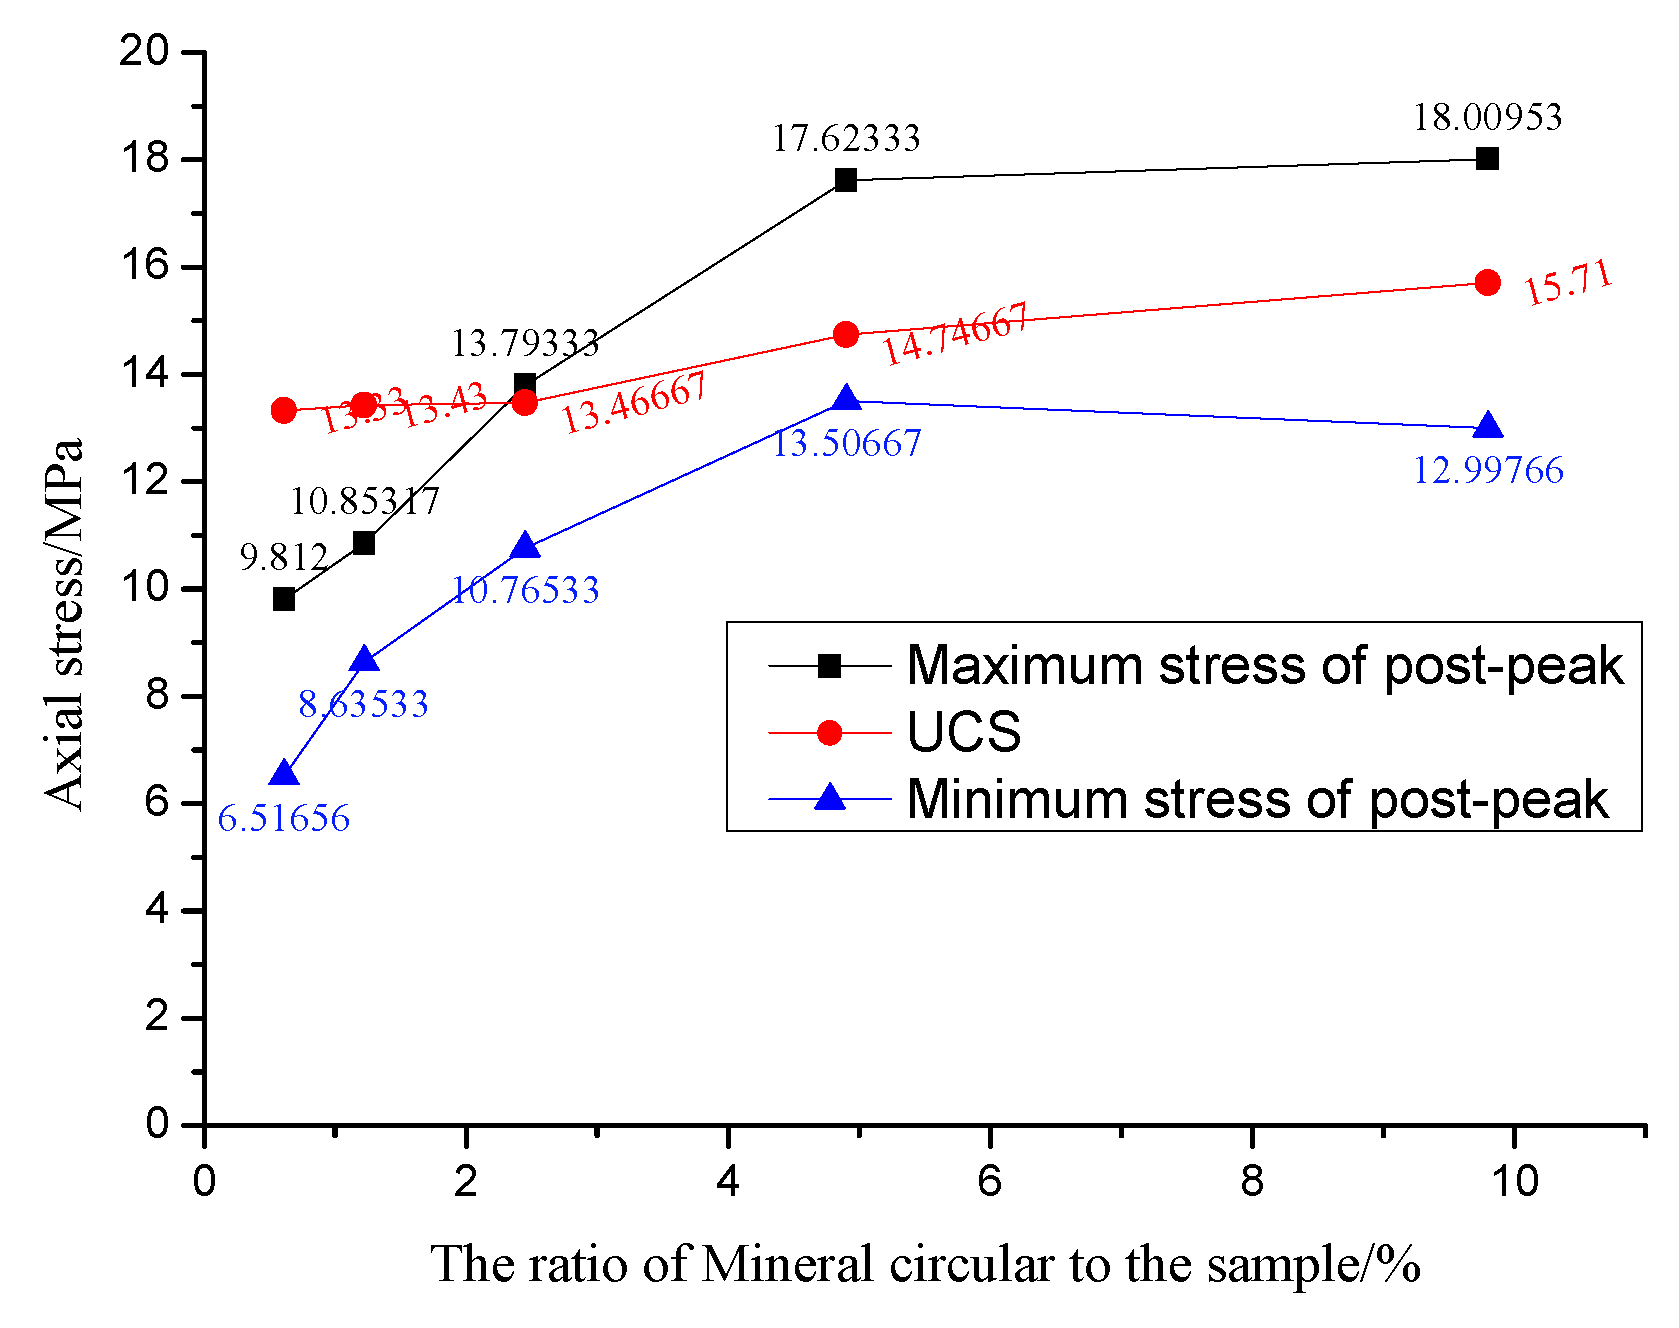
3.1. Mineral Circle Dimensions

In order to display the mechanical characteristics of the loading process of schemes C1–C9 more clearly and intuitively, Figure 13a is divided into three subfigures. Before the peak, stress increases linearly as strain increases. The elastic modulus of the model was calculated by selecting the linear segment with good stress and strain performance, as shown in Figure 13b. With increased mineral circle radius, the elasticity modulus of the model increases gradually. There is a quartic polynomial relationship between the elastic modulus and the mineral circle radius, with R2 ≥ 0.94. The stress value fluctuates near peak stress, because when stress is greater than 50% of the peak, the amount of tensile and shear damage of joints increases rapidly, then macroscopic cracks are formed gradually, and stress release and redistribution are caused by crack formation. The stress peak of each scheme is marked in Figure 13a1–a3. With increased mineral circle radius, the displacement becomes smaller when peak stress is reached. The stress peak shows different post-peak mechanical properties with increased mineral circle radius. The stress values of C1–C3 gradually decreased to the minimum as strain increased, and were respectively 41.95%, 47.37%, and 60.39% of their peaks. The stress of C4 and C5 decreased to the minimum value (49.95% and 54.36% of respective peaks) when the strain reached 0.57% and 0.69%, respectively, then fluctuated in a small range. The stress of C6 and C7 decreased to the minimum (63.20% and 61.97%) when the strain reached 0.56% and 0.51% of their peak values, then gradually increased to a maximum of 85.90% and 81.14% of the peak, respectively. C8 and C9 maintained good stress levels after the peak, and the maximum value was 120.07% and 124.45%, respectively. This indicates that with increased central mineral circle size, post-peak axial stress values decreased monotonically (C1–C3), first decreased and then stabilized (C4, C5), first decreased and then increased (C6, C7), or first fluctuated slightly and then increased (C8, C9). In order to further analyze the influence of mineral circle size on the mechanical properties of the post-peak phase, two post-peak stress values were selected for analysis: the lowest stress value and the maximum value after the descent stage. The axial stress of different mineral sizes is shown in Figure 13c; the UCS of all models is greater than the UCS (11.44 MPa) of the homogeneous rock sample. As the mineral circle radius increases, the UCS as a whole tends to increase. The UCS of the 40 mm mineral circle model is the maximum, which is 1.3 times the UCS of homogeneous sample. With increased mineral circle radius, the lowest value of stress as a whole tends to increase. The minimum and maximum stress values after peak for C1–C7 are less than their respective UCS; the minimum stress value of C8 and C9 is less than their respective UCS, but the maximum stress value after peak is greater than their respective UCS.
The fracture distribution of specimens with a central mineral circle is shown in Figure 14. When the mineral circle radius is 2.5–10 mm (C1–C3), an X-shaped destruction form is present. When the rock specimen was destroyed, the central area gradually moved upward, and the cracks were widely distributed on the upper part of the specimen and both sides of the mineral circle. The degree of damage to the lower part decreased and the integrity improved significantly. When the mineral circle radius reached 15–20 mm (C4, C5), a V-shaped destruction form was present on the upper part of the specimen, and two cracks in the lower part first spread along the edge of the mineral circle and then extended to the lower left and lower right. When the mineral circle radius reached 25–30 mm (C6, C7), a V-shaped and inverted U-shaped destruction form was present on the upper and lower part of the specimen, respectively. The U opening increased as the mineral circle radius increased. This is because the two cracks first propagated along the edge of the mineral circle, and the two cracks at the lower part of C6 developed along the vertical direction. At 30 mm, the left lower crack was connected with the left edge and the right crack extended to the right edge. When the radius was greater than 30 mm (C8, C9), the crack was concentrated in the upper and middle part of the model and was not apparent at the bottom because the propagation path downward was blocked.

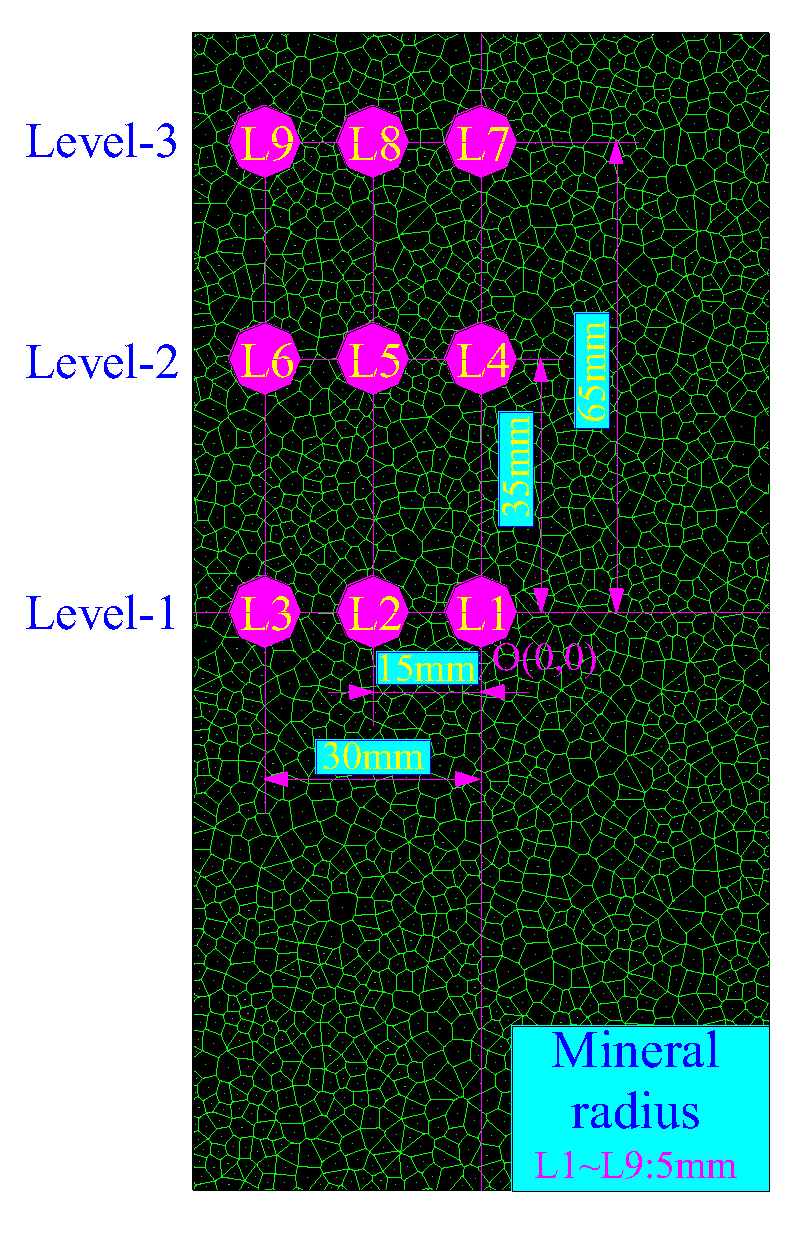
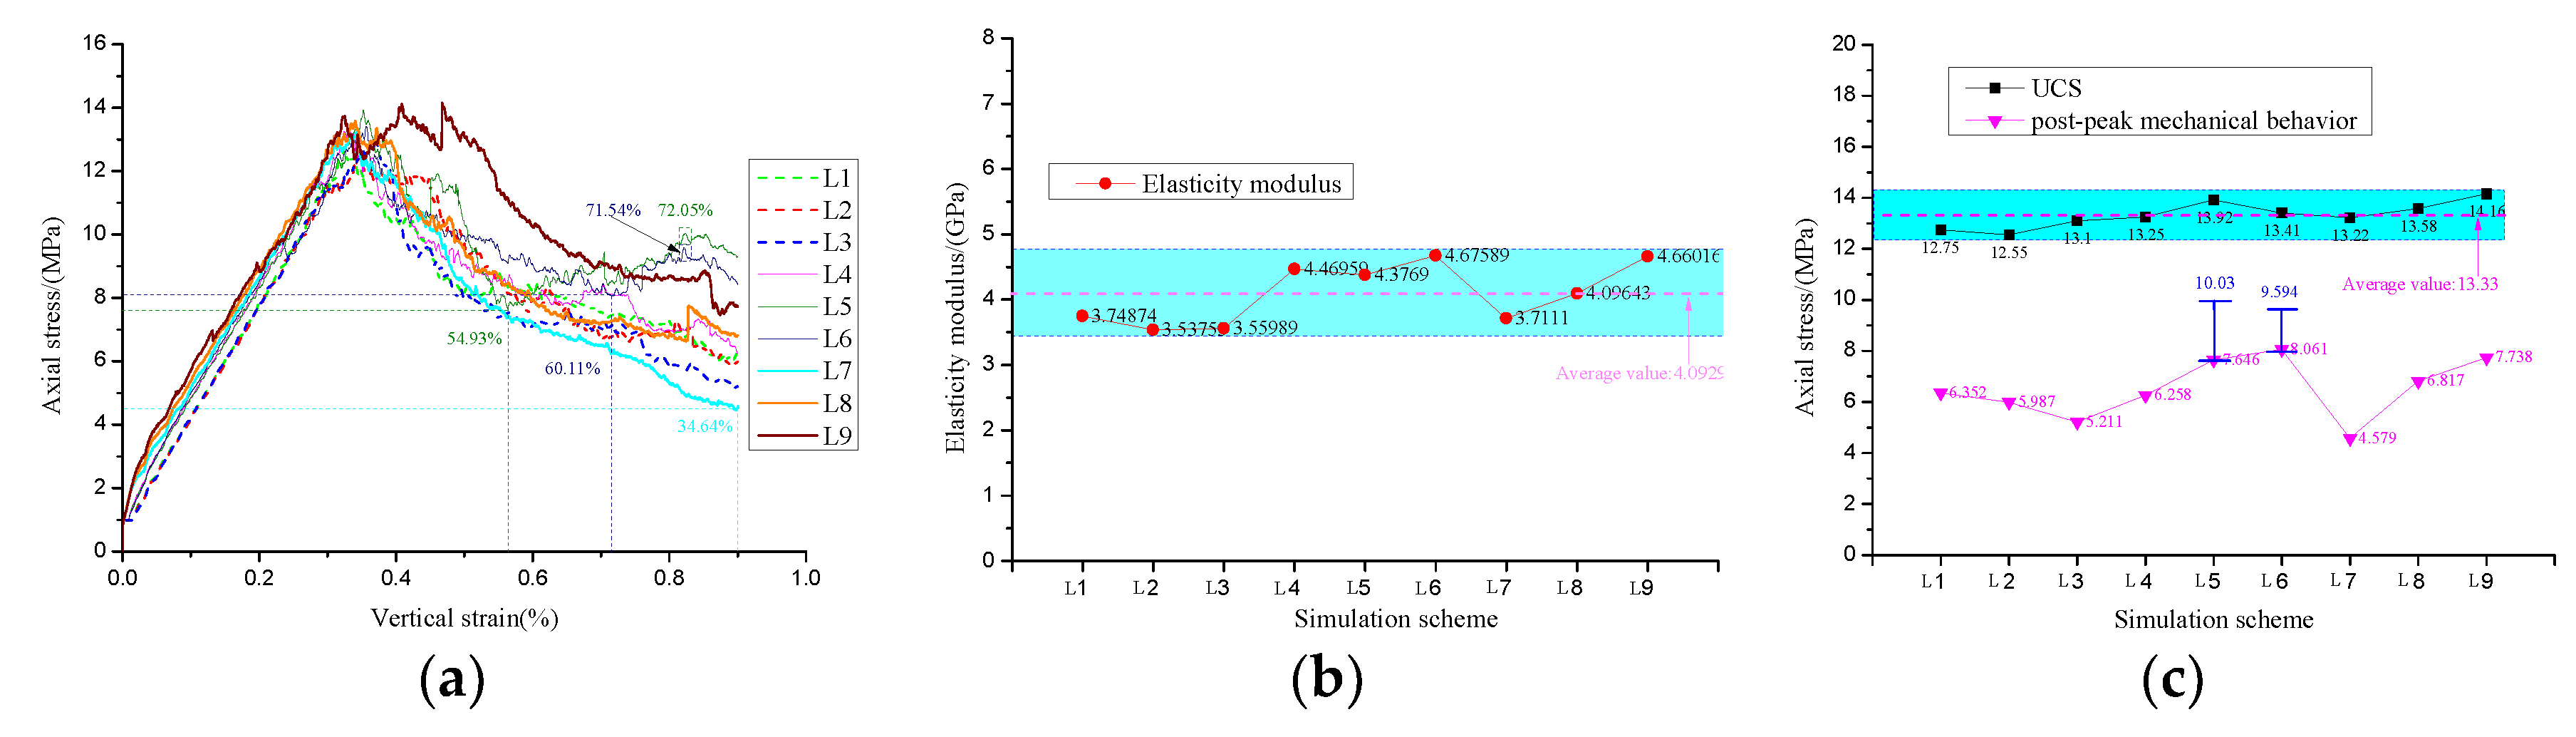
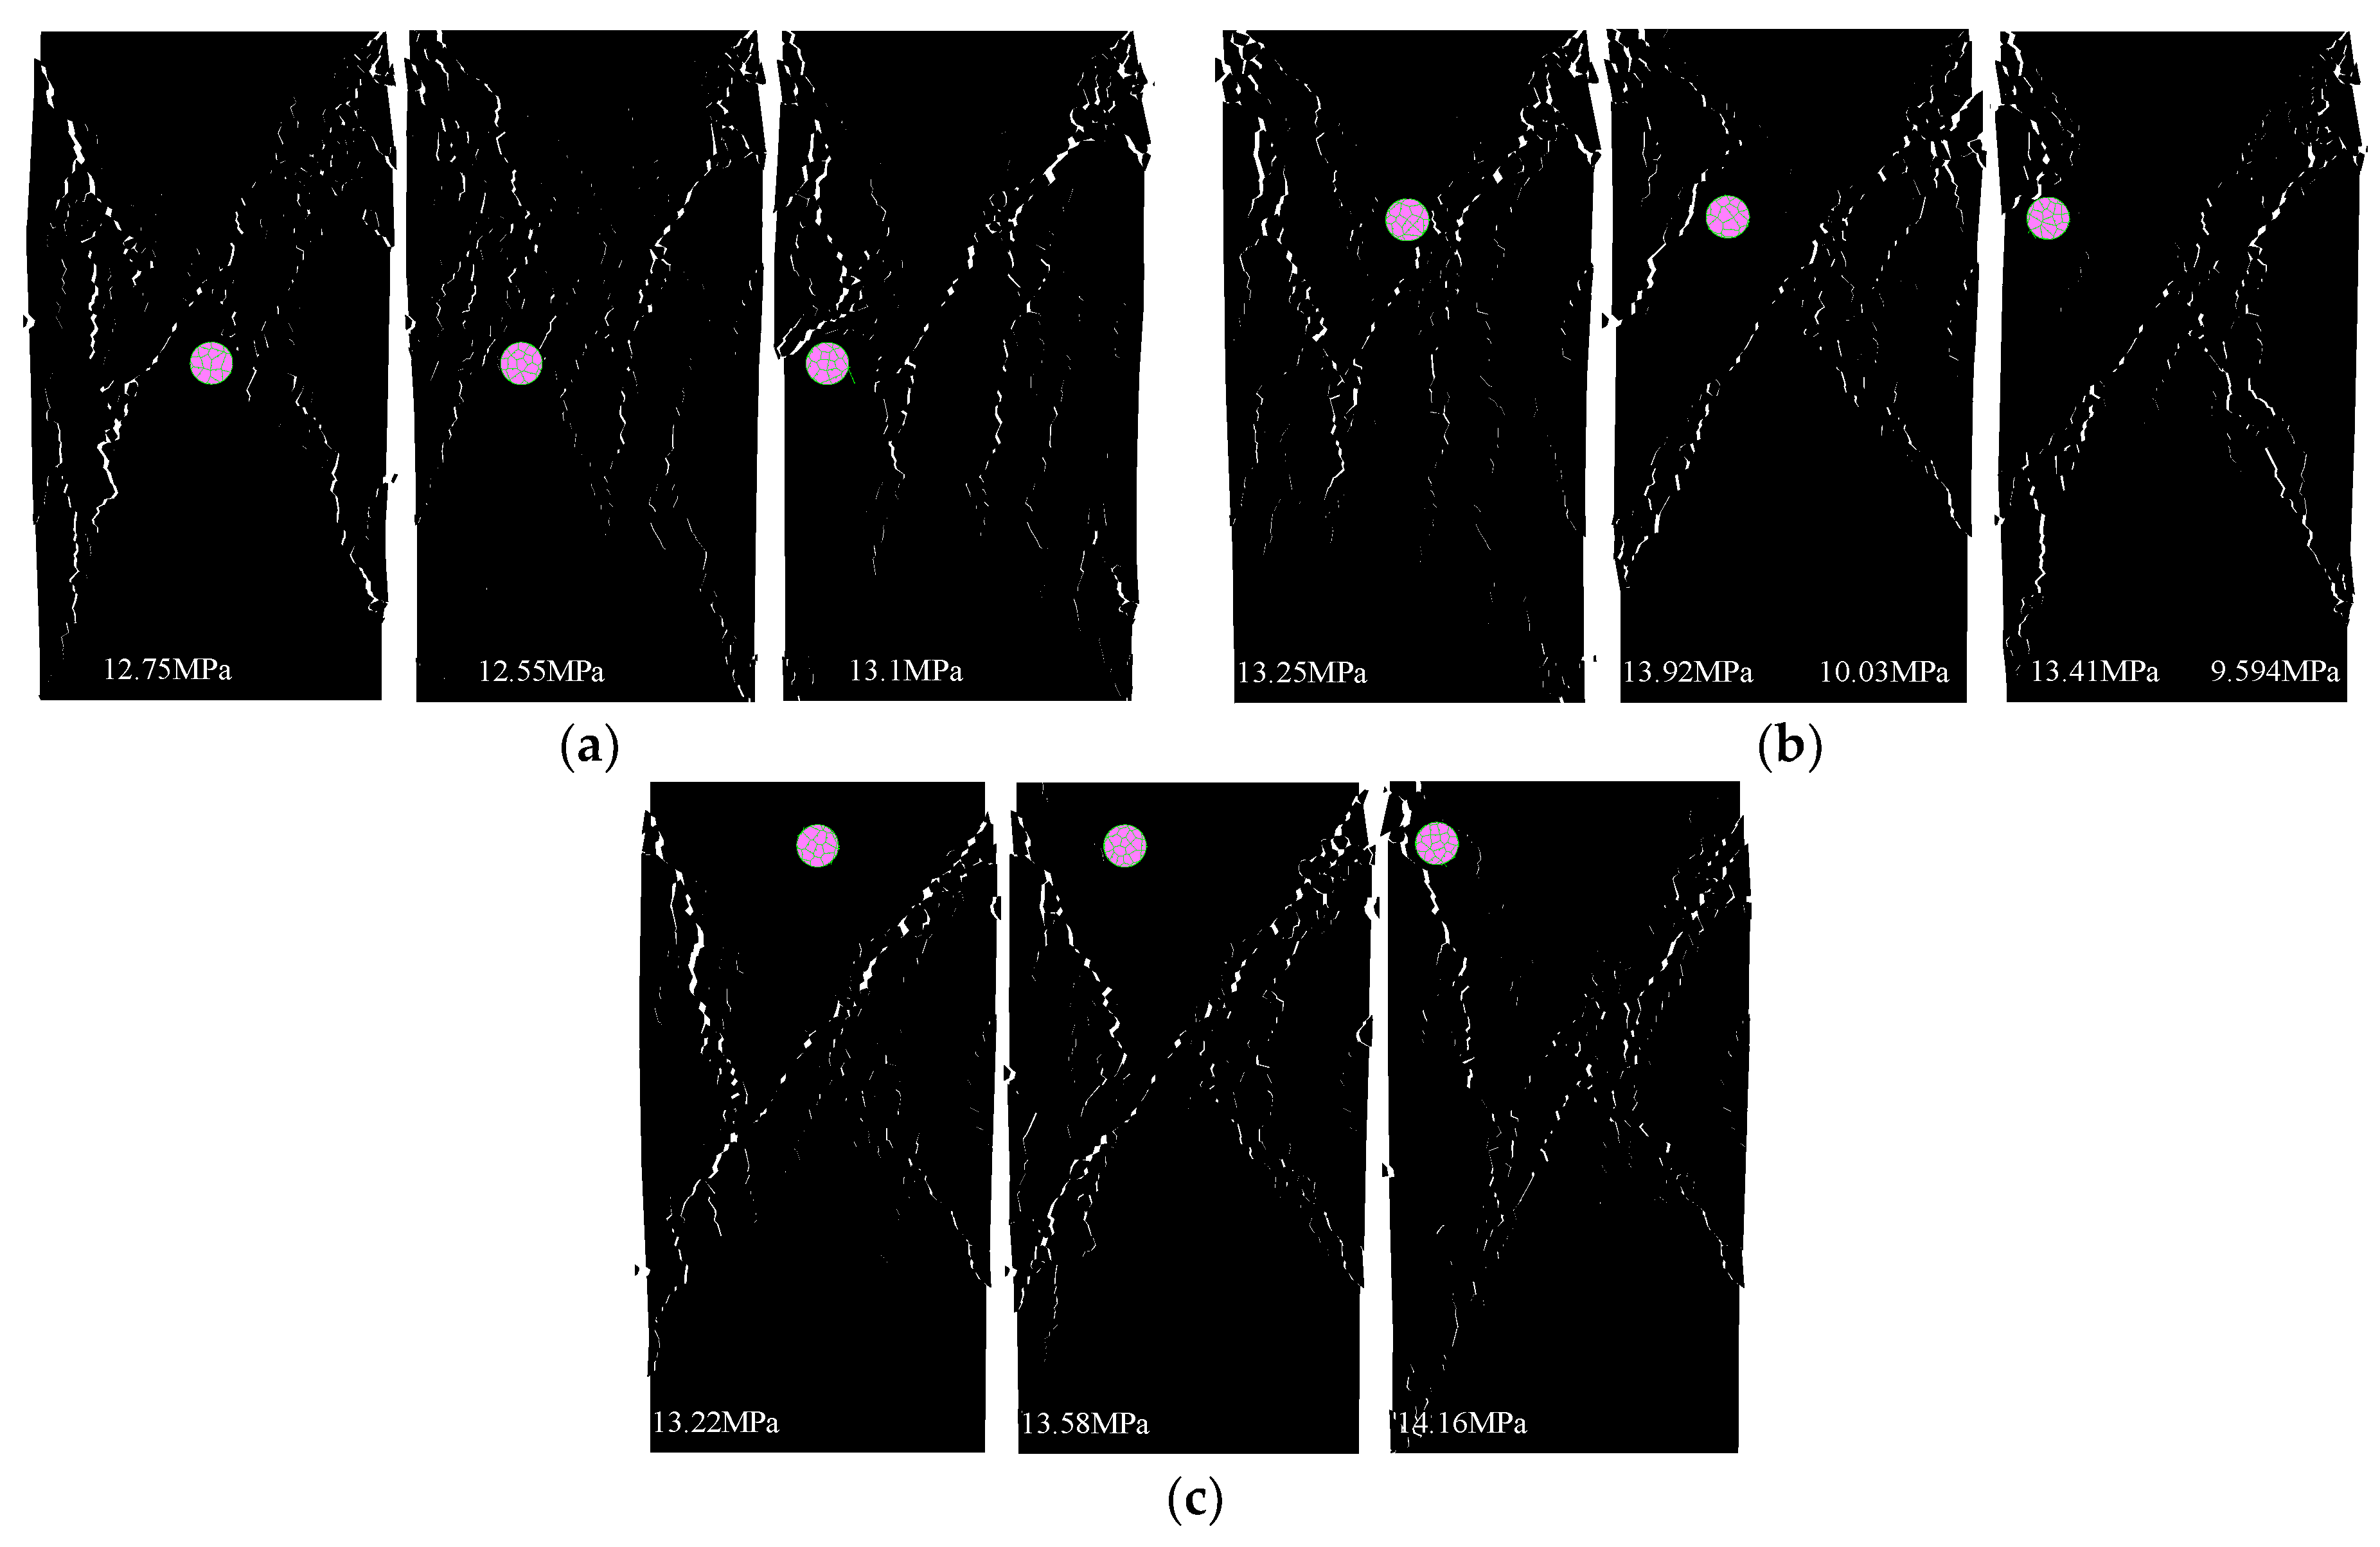
3.2. One Mineral Circle in Different Positions

Before the peak, stress increases linearly as the strain increases (Figure 15a). The elastic modulus of the model was calculated by selecting the linear segment with good stress and strain performance, as shown in Figure 15b. When the stress reached the peak, the stress value of L1–l4 and L7–L9 gradually decreased to the minimum with increased strain. The stress value of L7 reduced to the minimum value, 4.579 MPa, which is 34.64% of UCS. The stress value of L5 and L6 decreased to the minimum when the strain reached 0.56% and 0.72%, respectively, which are 54.95% and 60.11% of their respective peaks. Subsequently, the stress value gradually increased to 72.05% and 71.54% of the peak, respectively. The elasticity modulus of the model is shown in Figure 15b, and the axial stress of one mineral circle at different positions is shown in Figure 15c. When the mineral circle was at level 1 (L1–L3), the elastic modulus and stress peak were lower than the average value, and minimum stress gradually decreased as the distance between the mineral circle and the center line increased. When the mineral circle was at level 2 (L4–L6), the elasticity modulus was greater than the average, the UCS of L5 and L6 was greater than the average, and the UCS of L4 was less than the average. Minimum stress increases as the distance between the mineral circle and the center line increases. When the mineral circle was at level 3 (L7–L9), the elastic modulus, UCS, and minimum stress gradually increased as the distance between the mineral circle and the center line increased.
The fracture distribution of specimens with one mineral circle located in different positions is shown in Figure 16. When the mineral circle was at level 1 (L1–L3), the crack was widely distributed in the upper part of the model, and the degree of destruction of the upper part was significantly greater than the lower part, which indicates that the mineral circle changed the propagation direction of the crack and affected its distribution characteristics, protecting the integrity of the lower part. The order of integrity of the lower part of the model is L1 > L2 > L3. This shows that as the distance between the mineral circle and the left edge decreased, the effect of the mineral circle on decreasing the number of cracks and improving the integrity of the lower part was gradually reduced. When the mineral circle was located at level 2 (L4–L6), the upper part of L4 presented a V-shaped failure mode and the lower part presented a wormlike crack. The blocking effect of the mineral circle on crack propagation was not obvious. This is because the mineral circle was located in the upper part of region I and lower part of region III, and macroscopic cracks could not pass through the mineral circle. The mineral circles of L5 and L6 were located on the propagation path of the F1 crack, which effectively blocked the extension of the crack to region I. F1 cracks developed in the mineral circle and then extended along its edge to the lower left. It increased the overall integrity of the region below the mineral circle. This, together with region III, formed a relatively complete area in the upper left of the sample, which increased the bearing capacity of the rock specimen. This reasonably explains that in models L5 and L6, the stress value increased to 10.03 and 9.594 MPa, respectively, in the post-peak phase with the increased strain (Figure 15c). There were some microcracks in the relatively complete area of L6, indicating that as the distance between the mineral circle and left edge of the model decreased, the effect of the mineral circle on preventing the propagation of cracks gradually decreased. When the mineral circle was at level 3 (L7–L9), an X-shaped destruction form was present when the rock specimen was destroyed.

3.3. Mineral Circles in Two Positions
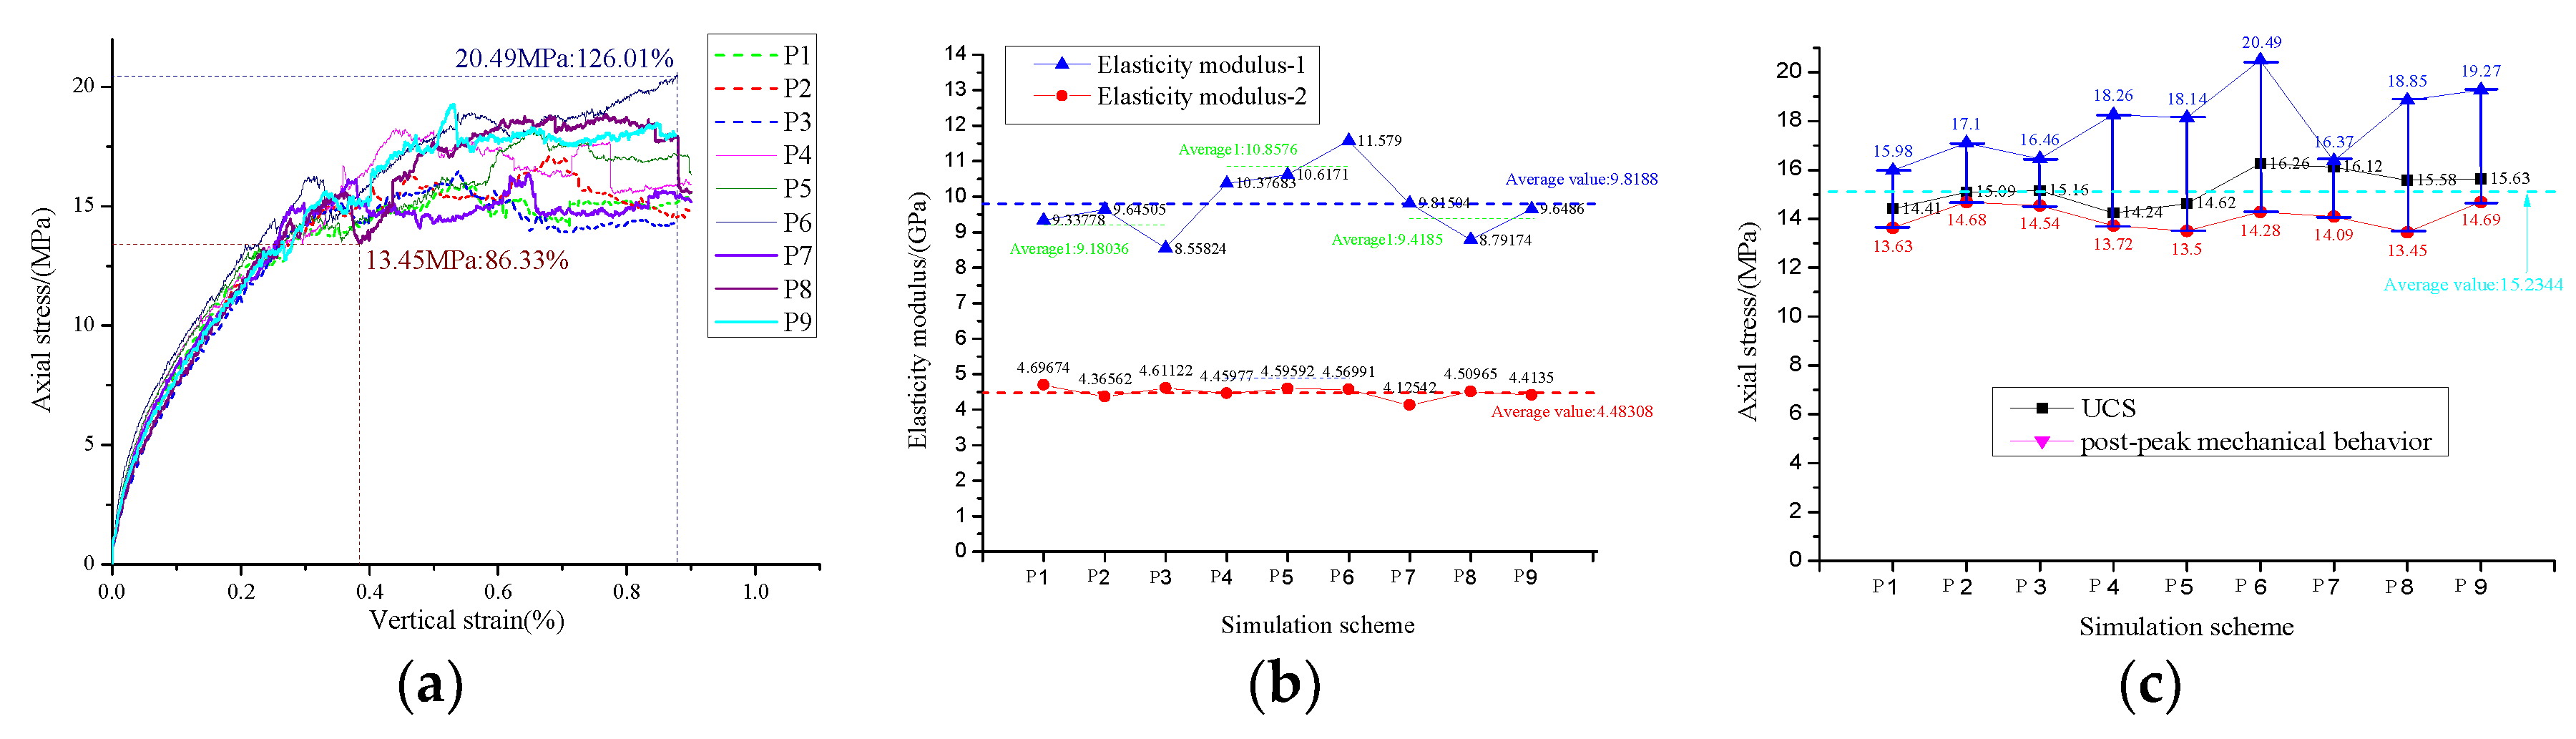
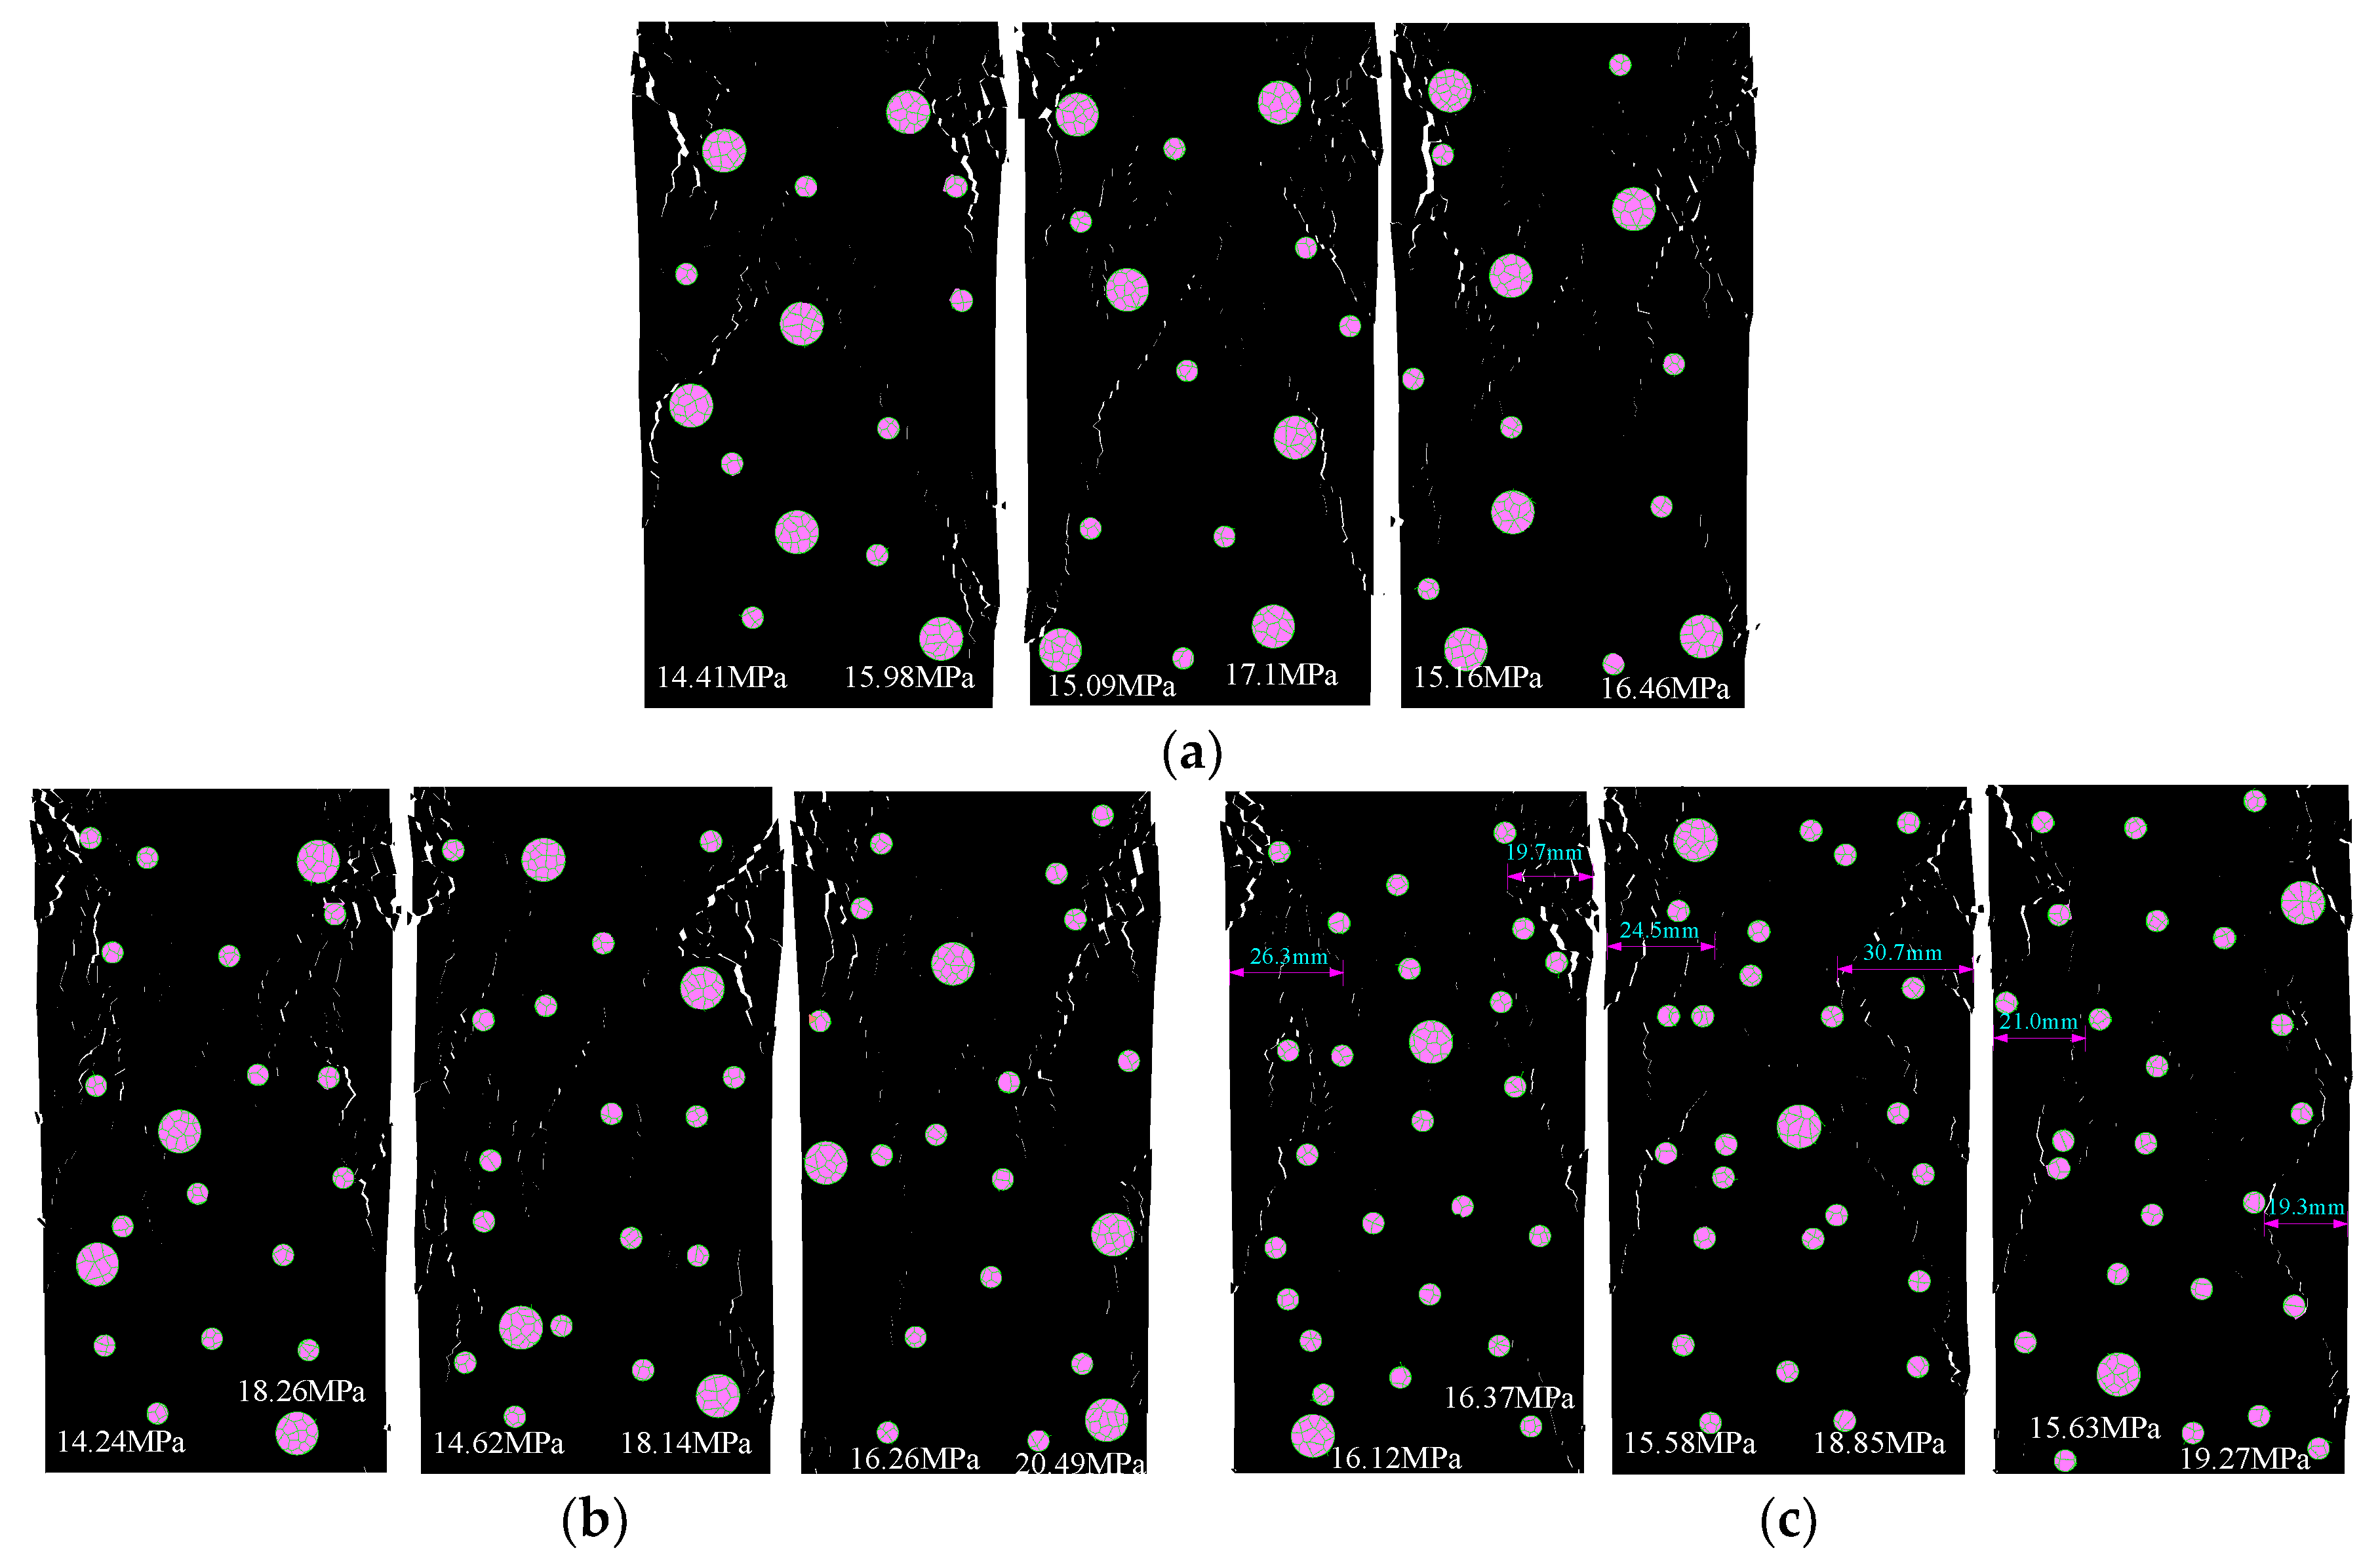
Before the peak, the stress first increases rapidly and then the growth rate slows down with increased strain (Figure 17a). The obtained elastic modulus is shown in Figure 17b. The average elastic modulus of the rapid and slow growth stages was 5.8235 and 3.8454 GPa, respectively. After the stress reaches the peak value, it decreases. The stress value of T2 reduced to the lowest value, 7.262 MPa, which was 53.28% of UCS. The stress value of T6 reduced by the least amplitude to 7.262 MPa, which was 75.24% of UCS. The stress decreases, then increases gradually. The axial stress of mineral circles in two different positions is shown in Figure 17c. The average UCS value was 13.43 MPA, and the stress peak values of T1 and T5 were less than the average, while those of other models were greater. After the peak stress, the decreased amplitude of T1, T2, and T5 was significantly greater than that of other models and the stress level was relatively low. The maximum value in the floating range after the peak was close to the minimum values of other models, which indicates that the post-peak stress bearing capacity of T1, T2, and T5 was smaller than that of other models.
The fracture distribution of specimens with two mineral circles located in different positions is shown in Figure 18. The presence of a central mineral circle (T1, T2, T5) caused the central crushing area to move up, and the degree of breakage tended to increase. This reasonably explains why the degree of stress dropped after the peaks of T1 and T2, and T5 was greater than that of other models. Only when the second model was broken, an approximate X-shaped destruction form was present on the specimen. F1–F4 all cracked from the boundary of the model and successfully extended to the middle region. In other models, F2–F4 started from the boundary and extended successfully at the middle region; the propagation path of F1 was blocked. This blocking function can be roughly divided into two types: either the mineral circle is located on the propagation path of the crack, which blocks its extension direction (T3, T4, T5), or the mineral circle is near the boundary and the crack starts at the upper boundary and develops along the upper right of the mineral circle. F1 cracks start from the left boundary and extend to the central fracture zone, and the two cracks above will connect in the upper left (T1, T6). To some extent, such blocking can improve the integrity of the upper left part of the model and reduce the degree of breakage of the central region, which improves the bearing capacity of the rock sample after the peak.

3.4. Mineral Ratios

Before the peak, the stress first increases rapidly and then the growth rate slows down with increased strain (Figure 19a). The obtained elastic modulus is shown in Figure 19b. The average elastic modulus of the rapid and slow growth stages was 8.8067 GPa (E1) and 4.8646 GPa (E2), respectively. The average values of elastic modulus E1 and E2 of the model with a mineral proportion of 2.5% were respectively 6.0479 and 4.0227 GPa, which are both lower than the average values of the overall elastic modulus. When the mineral accounted for 5%, elastic modulus E1 and E2 were 9.0225 and 4.8668 GPa, respectively, close to the average of overall elasticity modulus. Elastic modulus E1 and E2 of the model with a mineral ratio of 10% was 11.3498 and 5.7044 GPa, respectively, larger than the average of the overall elastic modulus. After reaching the peak, the stress value first reduced. The stress of S1 reduced to the lowest value (9.436 MPa, 69.48% of UCS). The stress value of S8 increased to a maximum (20 MPa), which is 120.99% of UCS. The axial stress of single mineral size with different mineral ratios is shown in Figure 19c. The stress peak values of S1–S3, with a mineral proportion of 2.5%, and S5, with a mineral proportion of 5%, were lower than the average value of UCS (14.6411 MPa), while the values of the other models were higher. With increased mineral proportion, the UCS of the rock sample tended to increase. The minimum value of post-peak strength was lower than the UCS of the respective models, and the maximum value was greater, except for S1.
The fracture distribution of specimens with different mineral ratios is shown in Figure 20. When the mineral ratio was 2.45% (Figure 20a), in model S1, the cracks were widely distributed on the upper and both sides of the mineral circle, and the number and opening of cracks in the lower part decreased significantly. The mineral circle in S2 changed the propagation direction of F1, and the relationship between the F3 crack and region I was interrupted. The degree of damage of region I in S3 was reduced, the connection between F1 F2, and region I was interrupted, and the F3, F4 crack extended from the left and right edge to region I. The crack pattern was due to the formation of two protective structures, shown on the right side of Figure 20a, which changed the crack initiation and propagation pathways. When the mineral ratio was 4.9% (Figure 20b), in model S4, an X-shaped destruction form was present on the specimen. In S5, damage occurred in the upper left and upper right corner, and there was no obvious connection between these two failure regions and the failure of the lower part, which caused the crack initiation position of F3 and F4 to change from the lower edge to the right and left edge. This is because a protective structure, as shown in Figure 20b, formed, resulting in the crack propagating along its edge, successfully changing the propagation path and protecting the integrity of the lower region. In model S6, the crack widely developed in the upper left and upper right regions of the rock sample, and no obvious cracks were found in the middle and lower part. When the mineral ratio was 9.8% (Figure 20c), the main cracks developed on the middle and upper part of the model, which approximately presented a symmetrical hyperbolic shape. The maximum damage depth of the left and right sides of S7, S8, and S9 was 33.6 and 28.8 mm, 19.1 and 25.5 mm, and 18.3 and 21.8 mm, respectively. Comparing the results of Figure 20 horizontally (models with the same mineral proportion and different mineral radius), with decreased mineral radius, the number of cracks and the breaking range of rock samples tended to decrease. Comparing the results of Figure 20 vertically (models with the same mineral radius and different mineral proportions), with increased mineral proportion, the number of cracks and the breaking range in the rock sample tended to decrease, and the distribution area of the crack gradually shifted to the edge and upper part.

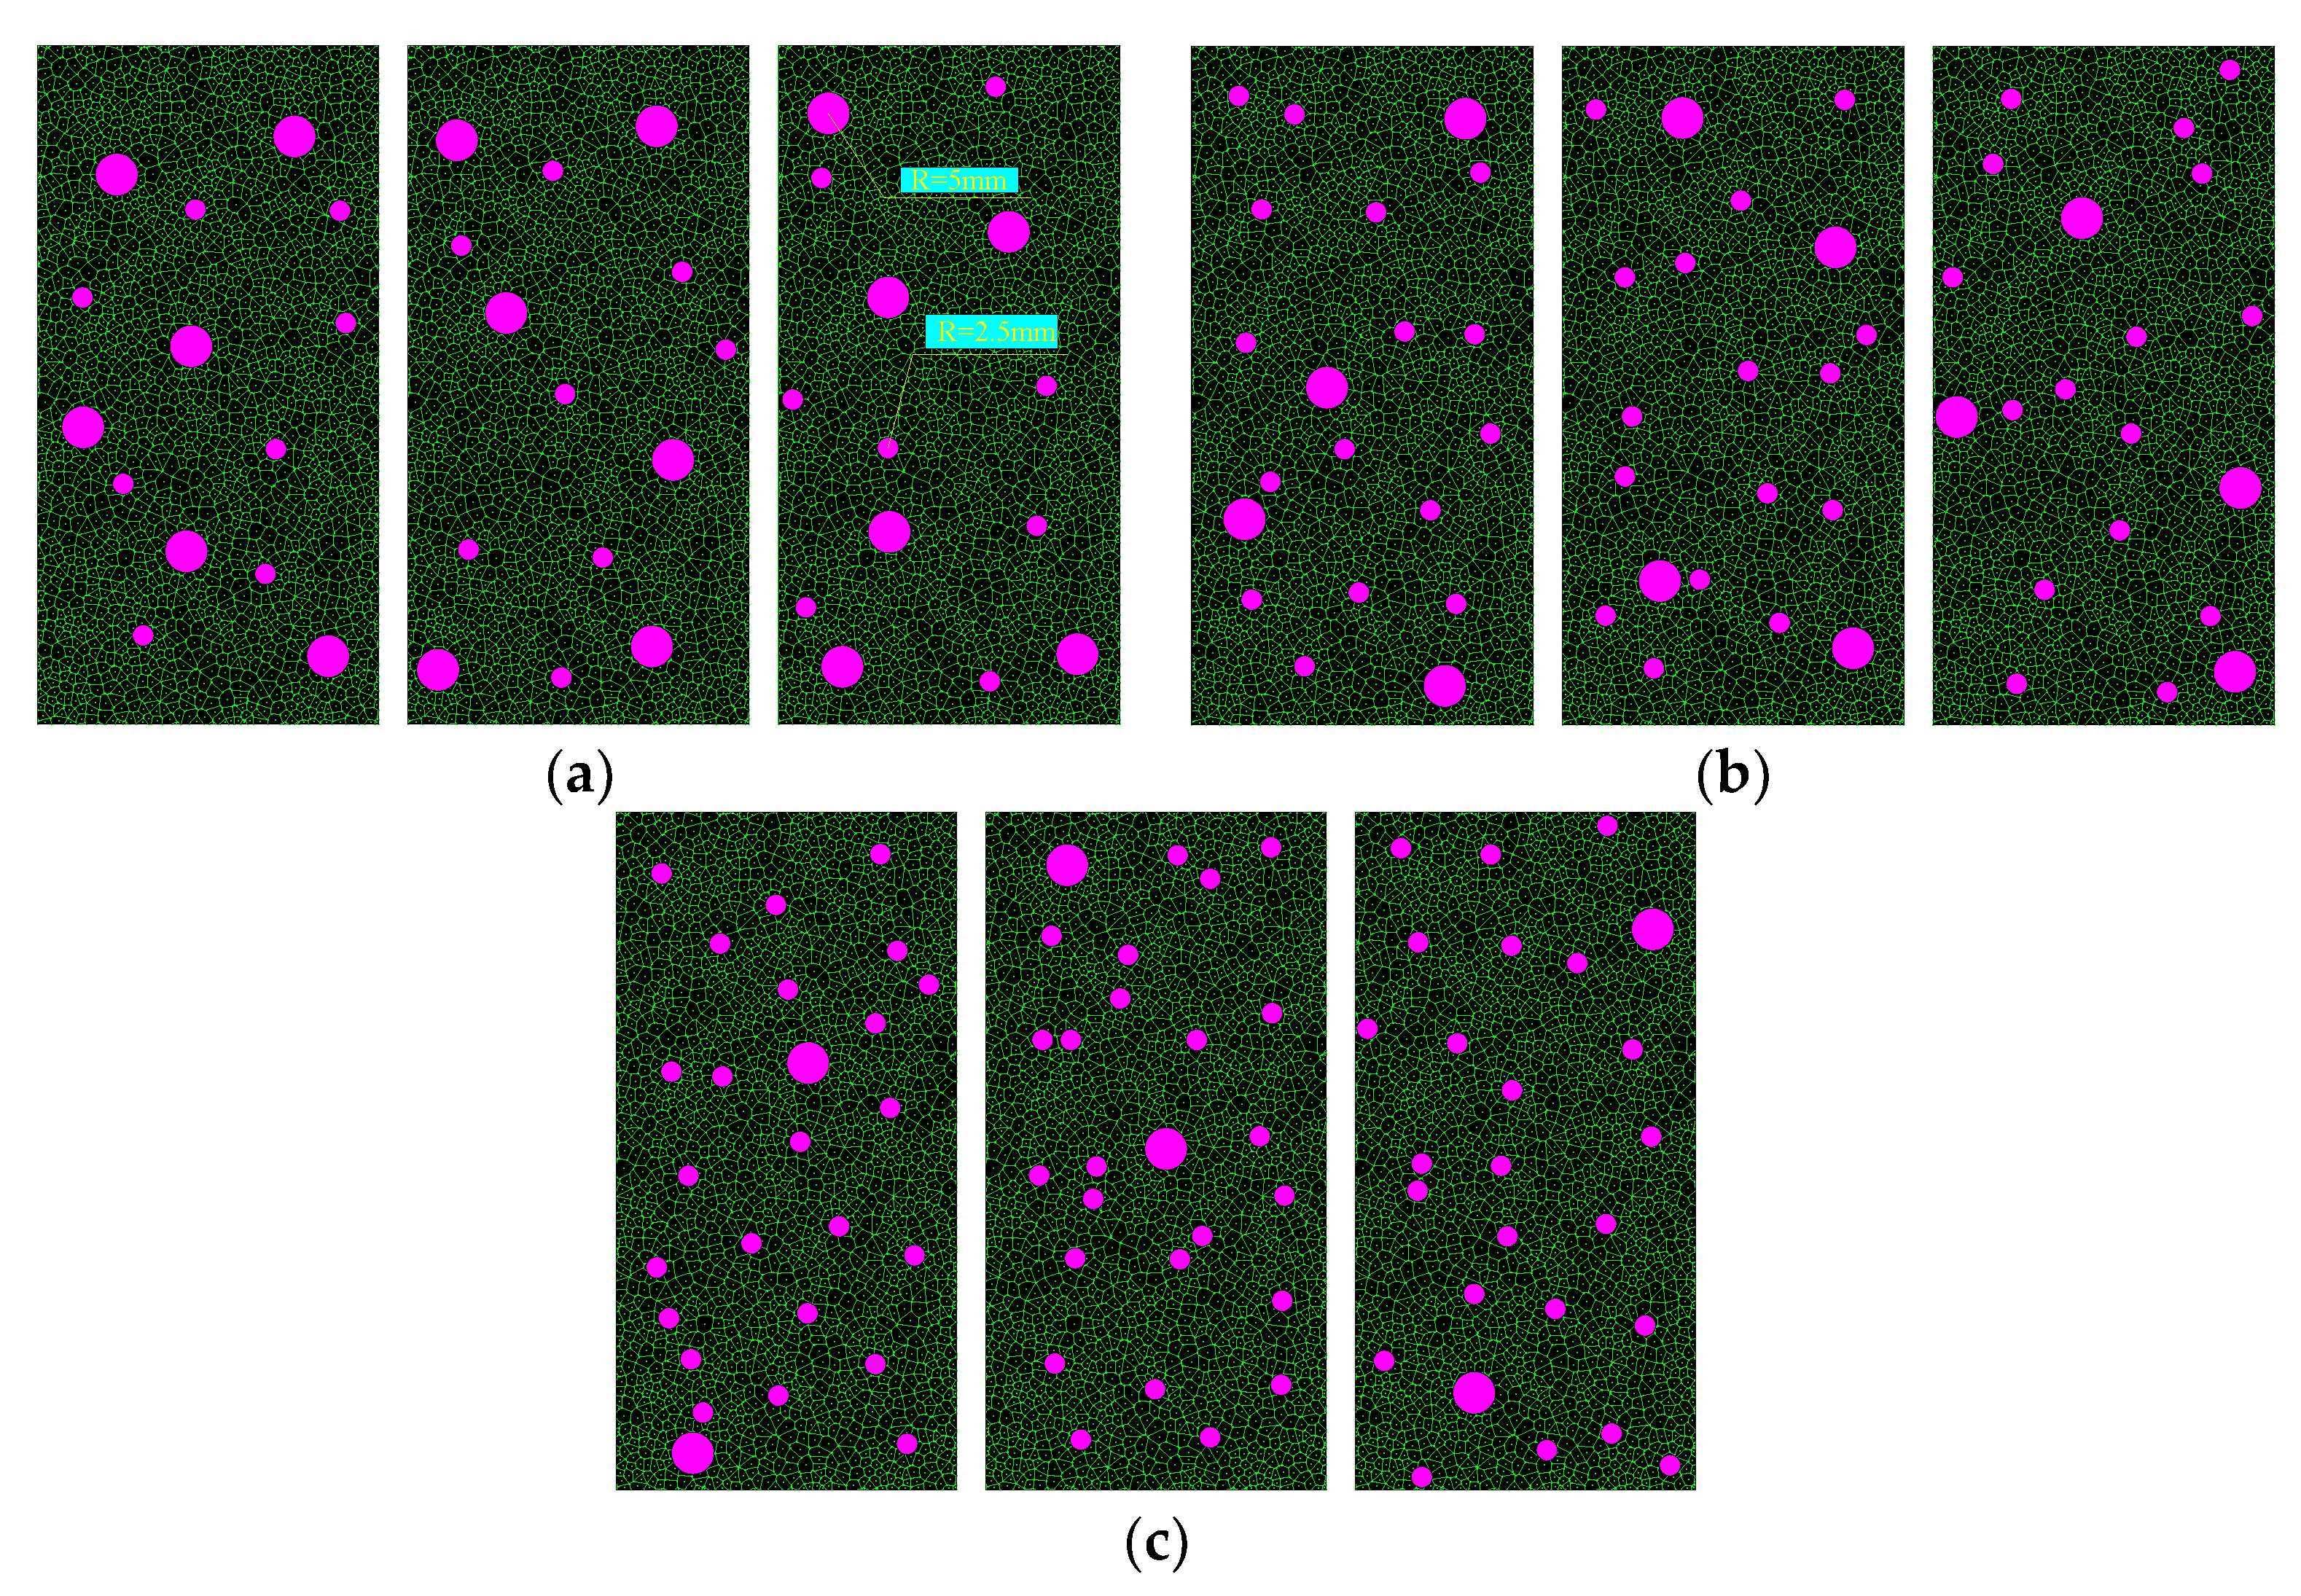
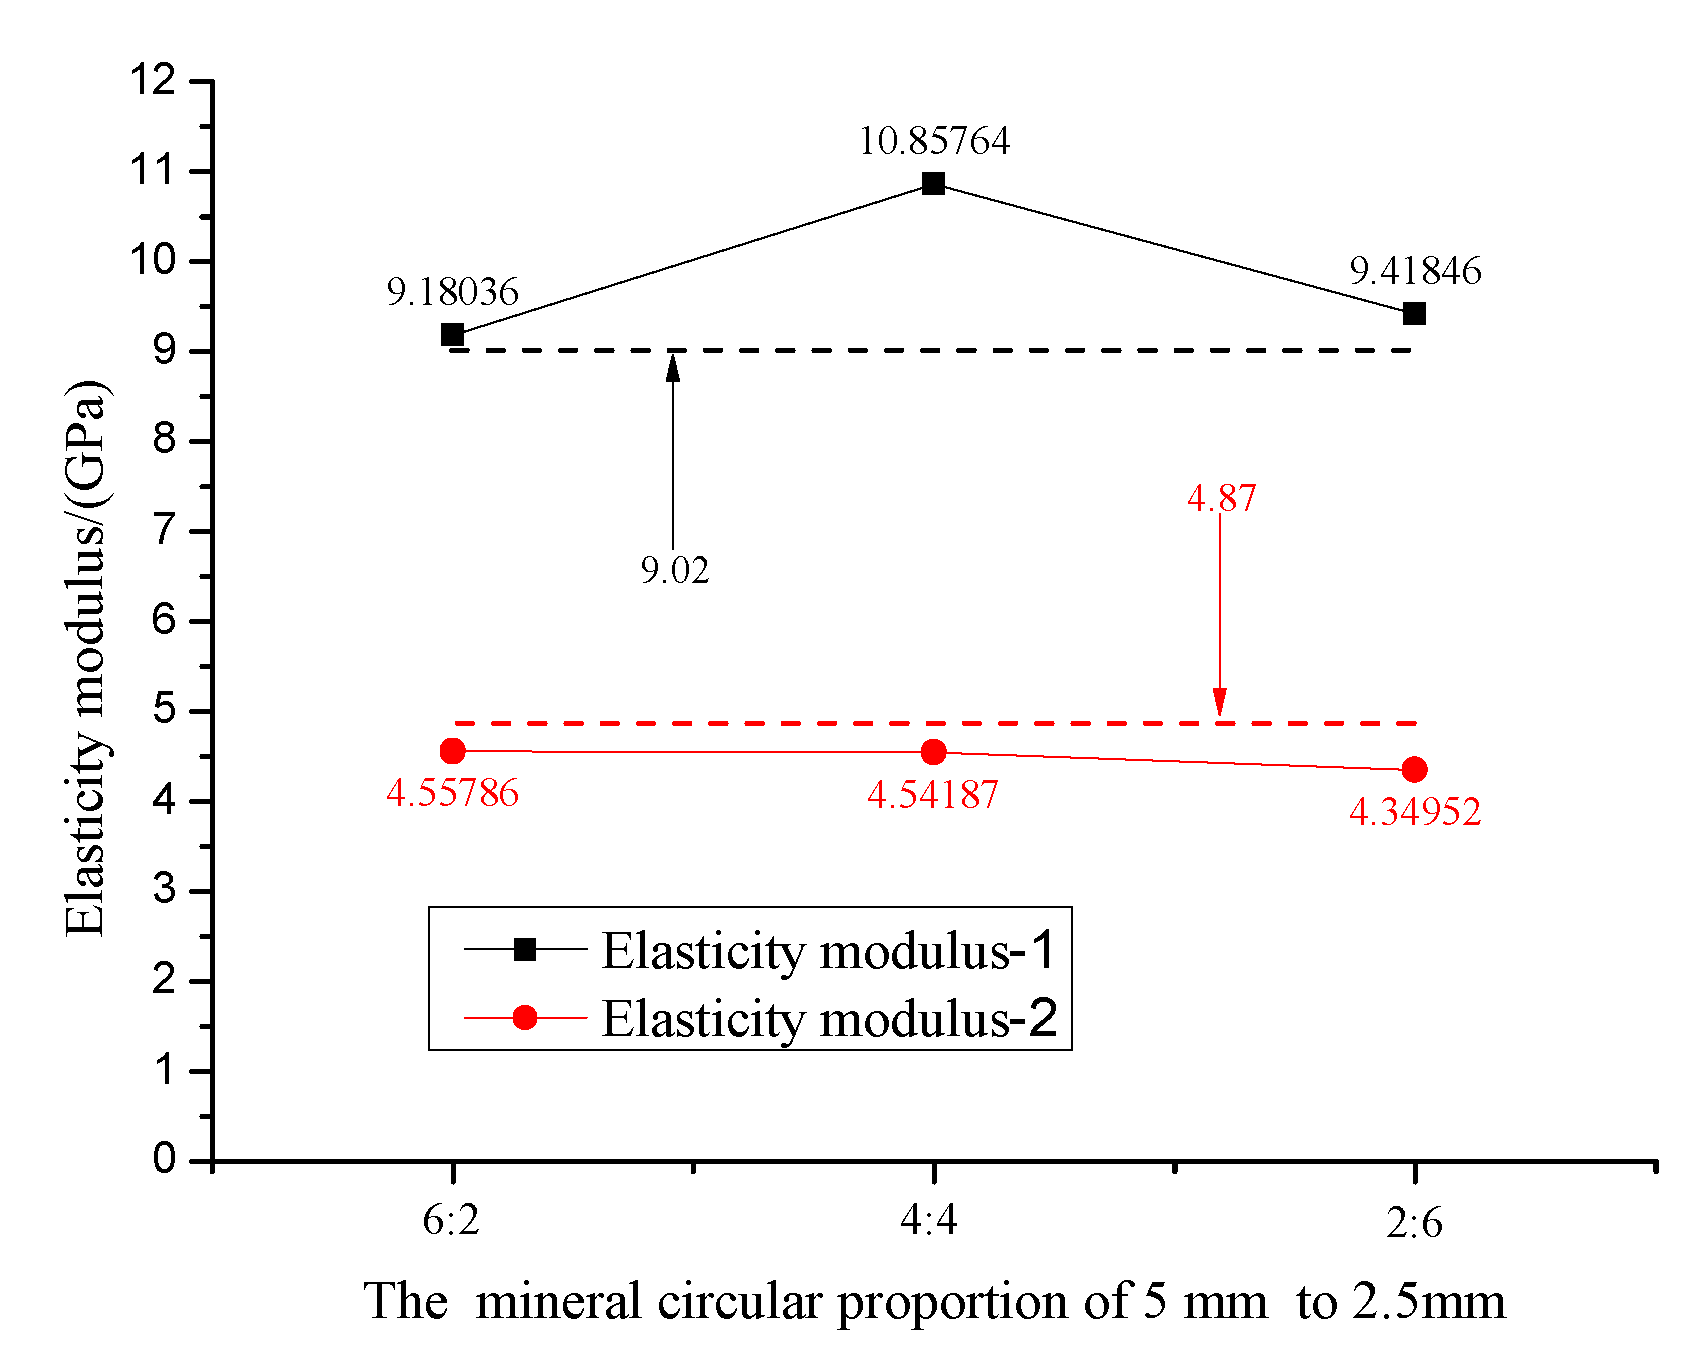
3.5. Proportions of Different Size Minerals

Before the peak, the stress first increases rapidly and then the growth rate slows down with increased strain (Figure 21a). The obtained elastic modulus is shown in Figure 21b. The average elastic modulus of the rapid and slow growth stages was 9.8188 GPa (E1) and 4.48308 GPa (E2), respectively. The average elastic modulus (E1) of the models with 5 to 2.5 mm mineral circles with proportions 6:2, 4:4 and 2:6 was 9.18036, 10.8576 and 9.4185 GPa, respectively. With an increased proportion of 2.5 mm mineral, elastic modulus E1 first increased and then decreased. After reaching peak value, the stress value first decreased. The stress value of P8 reduced to the minimum, 13.45 MPa, which is 86.33% of UCS, and the value of P6 increased to the maximum, 20.49 MPa, which is 126.01% of UCS. The axial stress of different mineral circle proportions with the same mineral ratio is shown in Figure 21c. The peak stress of P1–P5 was slightly lower than the average value of UCS (15.2344 MPa), the peak stress of P6–P9 was slightly higher than the average value, the minimum value of post-peak strength was lower than the UCS of the respective models, while the maximum value of post-peak strength was greater.
The fracture distribution of different mineral circle proportions with the same mineral ratio is shown in Figure 22. When the ratio of 5 and 2.5 mm was 6:2, in models P1 and P2, the mineral circle blocked the extension of F2 to the core region of the rock sample, and in F1, F3, and F4 cracks gathered at the center-left position. In model P3, F1–F4 converged approximately at the center of the model. After crack initiation, it mainly expanded to the center, and a crushing area was formed in the rock sample. When the ratio of 5 and 2.5 mm was 4:4, the relationship between cracks was weakened. After crack initiation, it not only expanded to the center, but also extended to both sides of the model, and the degree of brokenness in the middle was reduced. When the ratio of 5 and 2.5 mm was 2:6, after the main crack initiation, it did not successfully propagate to the midline, but was widely distributed at the left and right sides. The crushing depth of the left and right sides of P7, P8, and P9 was 26.3 and 19.7 mm, 24.5 and 30.7 mm, 20.1 and 19.3 mm, respectively. It is shown that the range of brokenness of rock samples in the model was mainly concentrated on the left and right sides, and there was a microcrack near the midline, but it did not form an obvious central crushing zone.

4. Discussion

In this paper, a DEM model is established to study the crack development and mechanical properties of red mudstone containing mineral circles under uniaxial compression. The physical mechanical parameters of the calculation model are fitted with the UCS of red mudstone, which ensures that the parameters of the polygonal blocks and joints are reasonable and feasible.
Numerical simulation results show that mineral size, position, and quantity will affect crack patterns and macroscopic mechanical properties. In most cases, the crack initially extends from the boundary position to the central region of the model. When gray-white minerals particles appear in the model, the strength of the mineral is significantly greater than that of the red mudstone. The crack does not pass through the mineral; it first accumulates in the upper area, then extends along the sides to other areas, which increases the number of cracks and degree of brokenness in the upper part of the mineral circle and improves the integrity of the lower part, as shown in Figure 14. The mineral circle also influences the crack initiation position and extension direction. The intrinsic reason is that the existence of the mineral circle changes the original stress environment and the stress concentration position and leads to a different crack initiation position and fracture mode. It was found that when the mineral circle is located in the direction of crack extension, the crack is effectively blocked and the propagation direction is changed (L5 and L6). When the mineral circle is close to the boundary, cracks will start in the upper part of the mineral circle and propagate to the middle of the model (T1, T3, and T6).
In order to more intuitively show the influence of mineral circle location on the mechanical properties of rock samples, Surfer drawing software was used to plot distribution diagrams of elastic modulus, UCS, and minimum stress value post-peak with different mineral circle locations [35], as shown in Figure 23. When the mineral circle is located at the center of the model and the center of the upper and lower boundaries, especially at positions B1 and B2, the impact on the elastic modulus is minimal; the elastic modulus is most affected when the mineral circle is located at positions A1–A4. When the mineral circle is located at the center of the model, and especially at positions B1 and B2, the effect on UCS is minimal. When the mineral circle is located at the four corners of the model ((0,0), (0,0.16), (0.08,0.16) and (0.08,0)), the impact on UCS is greatest. When the mineral circle is at the center of the model’s four boundaries ((0,0.08), (0.04,0.16), (0.08,0.08) (0.04,0)), it has the least influence on the minimum value of post-peak stress. When the mineral circle is located at position A1–A4, it has the greatest influence on the minimum stress.
For rock specimens with a single size mineral circle, the area of the 10 mm mineral circle is 2.45% of the area of the rock sample (160 × 80 mm) (Figure 20a). The number of 2.5, 5 and 10 mm mineral circles in the model with a mineral proportion of 9.8% and 4.9% is four and two times higher than that with a mineral proportion of 2.45%. For mineral circles of the same size, with an increased number of mineral circles, the area where the crack cannot pass increases. This is equivalent to increasing the area of the rock bridge in the sample to some extent; the rock bridge can stop the propagation of cracks, and this helps to increase the rock loading capacity. For mineral circles of different sizes, taking the particle composite structure of Figure 24 as an example, the radius of the mineral circles in Figure 24a,b is A and A/2, respectively. In the two-dimensional environment, the area of four mineral circles with radius A/2 is equal to the area of a mineral circle with radius A. However, compared with Figure 24a, the area where the crack cannot pass in Figure 24b was increased by (1−π/4)A2, which is equivalent to increasing the area of the rock bridge in the sample. As the proportion of minerals or small size minerals with the same proportion of minerals increases, it is more likely to form a protective structure in the rock specimen (Figure 20), which can protect the lower and inner regions in the model. The effect is not to prevent rock samples from cracking in the protected area, but to reduce to a certain extent the cracking degree. It is reasonable to compare the results of Figure 20 vertically (the left of Figure 20a–c, the model (S1, S4, S7) with same mineral radius and different mineral proportion). With increased mineral proportion, the number of cracks and the breaking range in the rock sample tended to decrease, and the distribution area of the crack gradually shifted to the edge and the upper part of the model. The crack extension depth from the boundary to the center decreased, and the crack developed widely in the boundary region. The broken range of rock sample and the number of cracks in the center position tended to decrease. Comparing the results of Figure 20 horizontally (Figure 20a, the model (S1, S2, S3) with the same mineral proportion and different mineral radius), with decreased mineral radius, the number of cracks and the breaking range of rock samples tended to decrease. The phenomenon also occurred in the model containing two types of mineral circles. With a mineral proportion of 4.9% and a decreased proportion of 5 and 2.5 mm mineral circles, the crack started and developed widely in the boundary range of the model. The number of central cracks and the degree of brokenness in rock specimen decreased.
The area of the 5 mm mineral circle is about 0.6% of the area of the rock sample (160 × 80 mm), as shown in Figure 16. The mineral ratio of Figure 18 is 1.2%, and the mineral ratio of Figure 20a–c is 2.45%, 4.9% and 9.8%, respectively. Before the peak, for the mineral proportion of 0.6%, the stress increases linearly with increased strain, while for the mineral proportion over 1.2%, the stress first increases and then the growth rate slows down with increased strain. This is because a homogeneous sample has stronger linear deformation characteristics before peak stress than a nonhomogeneous sample [11,36]. The average elasticity modulus of different mineral ratios is shown in Figure 25, with the mineral ratio increasing, E-1 and E-2 gradually increasing, and the difference between the two also increasing. The average value of the axial stress of different mineral ratios is shown in Figure 26. When the mineral proportion is less than 2.45%, the maximum and minimum values post-peak are smaller than the UCS of the model. When the mineral proportion is greater than 2.45%, the maximum value post-peak is greater than the UCS and the minimum value is less. When the mineral ratio reaches 4.9%, with increased mineral proportion, UCS, the maximum and minimum stress post-peak increase rapidly. When the mineral ratio is more than 4.9%, the growth rate decreases significantly. The mineral circle can increase the elastic modulus and strength of the red mudstone, reduce the degree of stress drop, and increase the bearing capacity of the rock after the peak.
For the mineral proportion of 4.9%, the proportion of 5 to 2.5 mm mineral circles is 6:2, 4:4, and 2:6, respectively. The mean values of elastic modulus and axial stress of proportions of different size minerals are shown in Figure 27 and Figure 28, respectively. The mean values of elastic modulus and axial stress with a mineral proportion of 4.9% obtained earlier (Figure 19b) were used as reference values, shown as dotted lines in Figure 27 and Figure 28. The biggest differences of E-1, E-2, maximum stress post-peak, UCS, and minimum stress post-peak are about 1.84 GPa, 0.52 GPa, 1.34 MPa, 1.03 and 0.78 MPa, which are 20.34%, 10.63%, 7.6%, 6.98%, and 5.75% of the reference values, respectively. The mean differences of E-1, E-2, maximum stress post-peak, UCS, and minimum stress post-peak are 0.80 GPa, –0.38 GPa, 0.26 MPa, 0.49 MPa, and 0.56 MPa, which are 8.83%, 7.89%, 1.46%, 3.31%, and 4.13% of the reference value, respectively. This indicates that the proportion of different size minerals influences the mechanical properties of rock specimens. However, the mean values of elastic modulus and axial stress of proportions of different size minerals fluctuate around the mean value without any obvious increase or decrease. This shows that the influence of the proportion of different size minerals on the mechanical properties is significantly less than that of the mineral proportion.
The paper presents an application of a DEM particle method and this type of analysis in an excellent example how DEM can be adopted in order to further understand mechanical behavior of rock containing other kinds of minerals. The limitations of this study are as follows: (1) the findings presented in this paper do not represent the complexity of natural rocks. In most cases, minerals are embedded with each other and appear at the boundary, which will have an effect on the mechanical properties [37,38]. Due to the limitations of current equipment performance and numerical modelling, it is difficult to determine the shape, location and mineral ratio of gray-white minerals particle within red mudstone. Using the ideal circular to simulate mineral particles, there are still differences with the actual shape and size of mineral particles in the red mudstone. (2) Based on the fact that it is difficult to determine the mechanical parameters of gray-white mineral particles by method of parameter fitting. In the numerical mode, the joint stiffness in the mineral circle was calculated automatically, it is assumed that the bulk modulus and shear modulus of the mineral circle were twice that of red mudstone. With the simplification and assumption in computational models, some influencing factors and the resulting deviations were not considered. (3) This paper does not present the rock crack distribution and mechanical properties affected by sample thickness. Further work needs to be done to quantitatively evaluate the influence of specimen thickness on the UCS and fracture patterns of red mudstone containing gray-white minerals. The ideal shape of the mineral used here still provides some insight into how mineral size, position, and content influence crack initiation and the morphology and mechanical properties of the rock samples. These are useful for preparing rock samples and assessing the mechanical properties of uniaxial compression of rock samples containing minerals.

5. Conclusions

With an increased circle size of the central mineral and the mineral ratio, the elastic modulus and UCS of the model gradually increased, the drop degree of post-peak stress decreased, and the integrity and bearing capacity increased. It was found that there is a quartic polynomial relationship between the elastic modulus and mineral circle radius, with R2 ≥ 0.94. When the mineral ratio is more than 2.45%, the maximum post-peak stress is greater than the UCS, and the stress bearing capacity post-peak is greatly improved. When the mineral circle is in the center, its influence on the elastic modulus and UCS of the model is less; when the distance between the mineral circle and the corner decreases, the influence of the mineral circle on the elastic modulus and UCS gradually increases. When the mineral position is close to the model boundaries, especially the lateral boundaries, it has a significant influence on the crack initiation position, causing crack initiation at the upper boundary of the mineral circle and propagating to the middle of the model. When the mineral circle is located in the crack propagation path, it will effectively block the crack and change the direction of crack propagation. With increased mineral ratio, the blocking effect on the crack is enhanced, and it is more likely to form a protective structure in the rock sample, resulting in decreased extension depth of the crack from the boundary to the center. The crack is widely developed in the boundary region. With increased proportion of small size mineral circle, the crack starts to crack and develops widely in the boundary range, the number of central cracks and the degree of brokenness decreases, the integrity of the rock sample is improved, and the degree of post-peak stress is reduced. Based on the fact that it is difficult to determine the mechanical parameters of gray-white mineral particles by method of parameter fitting. The physical and mechanical parameters of mineral particles in the model are assumed and simplified, the precise quantification of block and joint parameters in the model is not realized. If it is to be extended to other models to study the influence of mineral particles on the mechanical properties of rock, further exploration is needed.

Author Contributions

S.Z. and D.Z. conceived and designed the research. S.Z. and M.C. analyzed the data and wrote the paper. Q.Z. and W.Y. verified the results and polished the article. Q.Z. and W.Z. collected the measured data. All of the authors have read and approved the final manuscript. The authors are also grateful for the helpful comments provided by the anonymous reviewers and the journal’s editors.

Funding

The research was financially supported by the National Basic Research Program of China (2015CB251600), the Qing Lan Project (grant Sujiaoshi (2016)15), the National Natural Science Foundation (51874278), the Jiangsu Basic Research Program (Natural Science Foundation, BK20181357),the Fundamental Research Funds for the Central Universities of China (grant no. 2017XKQY022).

Acknowledgments

We also thank the Lao Sangou Coal Mine for their support. The authors are also grateful for the helpful comments provided by the anonymous reviewers and the journal’s editors.

Conflicts of Interest

The authors declare no conflict of interest.

References

  1. Martini, C.D.; Read, R.S.; Martino, J.B. Observations of brittle failure around a circular test tunnel. Int. J. Rock Mech. Min. Sci. 1997, 34, 1065–1073. [Google Scholar] [CrossRef]
  2. Akesson, U. Characterisation of Micro Cracks Caused by Coredisking; SKB Rep P-08-103; Swed Nuclear Fuel and Waste Manage Co.: Stockholm, Sweden, 2008; 43p. [Google Scholar]
  3. Li, S.J.; Li, D.; Wu, L.; Cao, L.J. Meso-simulation and fractal characteristics for uniaxial compression test of inhomogeneous rock. J. China Coal Soc. 2014, 39, 849–854. [Google Scholar]
  4. Zhang, P.H.; Yang, T.H.; Yu, Q.L.; Xu, T.; Shi, W.H.; Li, S.C. Study of a Seepage Channel Formation Using the Combination of Microseismic Monitoring Technique and Numerical Method in Zhangmatun Iron Mine. Rock Mech. Rock Eng. 2016, 49, 1–10. [Google Scholar] [CrossRef]
  5. Qu, Q.D.; Xu, J.L.; Wu, R.L.; Qin, W.; Hu, G.Z. Three-zone characterisation of coupled strata and gas behaviour in multi-seam mining. Int. J. Rock Mech. Min. Sci. 2015, 78, 91–98. [Google Scholar] [CrossRef]
  6. Adhikary, D.P.; Guo, H. Modelling of Longwall Mining-Induced Strata Permeability Change. Rock Mech. Rock Eng. 2015, 48, 345–359. [Google Scholar] [CrossRef]
  7. Lisjak, A.; Grasselli, G. A review of discrete modeling techniques for fracturing processes in discontinuous rock masses. J. Rock Mech. Geotech. Eng. 2014, 6, 301–314. [Google Scholar] [CrossRef] [Green Version]
  8. Jing, L.; Hudson, J.A. Numerical methods in rock Mechanics. Int. J. Rock Mech. Min. Sci. 2002, 39, 409–427. [Google Scholar] [CrossRef]
  9. Itasca Consulting Group, Inc. FLAC3D User’s Guide; Itasca Consulting Group, Inc.: Minneapolis, MN, USA, 2011. [Google Scholar]
  10. Chen, S.; Yue, Z.Q.; Tham, L.G. Digital image-based numerical modeling method for prediction of inhomogeneous rock failure. Int. J. Rock Mech. Min. Sci. 2004, 41, 939–957. [Google Scholar] [CrossRef]
  11. Tang, C.A.; Liu, H.; Lee, P.K.K.; Tsui, Y.; Tham, L.G. Numerical studies of the influence of microstructure on rock failure in uniaxial compression—Part I: effect of heterogeneity. Int. J. Rock Mech. Min. Sci. 2000, 37, 555–569. [Google Scholar] [CrossRef]
  12. Blair, S.C.; Cook, N.G.W. Analysis of compressive fracture in rock using statistical techniques Office of Scientific. Tech. Inf. Tech. Rep. 1994, 35, 849–861. [Google Scholar]
  13. Bai, Q.S.; Tu, S.H.; Zhang, C. DEM investigation of the fracture mechanism of rock disc containing hole(s) and its influence on tensile strength Theoretical. Appl. Fracture Mech. 2016, 86. [Google Scholar] [CrossRef]
  14. Ghazvinian, E.; Diederichs, M.S.; Quey, R. 3D random Voronoi grain-based models for simulation of brittle rock damage and fabric-guided micro-fracturing. J. Rock Mech. Geotech. Eng. 2014, 6, 506–521. [Google Scholar] [CrossRef] [Green Version]
  15. Itasca Consulting Group Inc. UDEC: Universal Distinct Element Code, Version 5.0; ICG: Minneapolis, MN, USA, 2011. [Google Scholar]
  16. Lan, H.; Martin, C.D.; Hu, B. Effect of heterogeneity of brittle rock on micromechanical extensile behavior during compression loading. J. Geophys. Res. Solid Earth 2010, 115. [Google Scholar] [CrossRef] [Green Version]
  17. Fu, Y. Experimental Quantification and DEM Simulation of Micro–Macro Behaviors of Granular Materials Using x-ray Tomography Imaging (Dissertation); Louisiana State University: Baron Rouge, LA, USA, 2005. [Google Scholar]
  18. Eberhardt, E.; Stimpson, B.; Stead, D. The influence of mineralogy on the initiation of microfractures in Granite. In Proceedings of the 9th International Congress on Rock Mechanics, Paris, France, 25–28 August 1999; A.A. Balkema: Rotterdam, The Netherlands, 1999; pp. 1007–1010. [Google Scholar]
  19. Eberhardt, E.; Stimpson, B.; Stead, D. Effects of grain size on the initiation and propagation of thresholds of stress induced brittle fractures. Rock Mech. Rock Eng. 1999, 32, 81–99. [Google Scholar] [CrossRef]
  20. Yilmaz, N.G.; Karaca, Z.; Goktan, R.M.; Akal, C. Relative brittleness characterization of some selected granitic building stones: Influence of mineral grain size. Constr. Build. Mater. 2009, 23, 370–375. [Google Scholar] [CrossRef]
  21. Cao, R.; Lin, H.; Cao, P. Strength and failure characteristics of brittle jointed rock-like specimens under uniaxial compression: Digital speckle technology and a particle mechanics approach. Int. J. Min. Sci. Technol. 2018, 28, 669–677. [Google Scholar] [CrossRef]
  22. Damjanac, B.; Fairhurst, C. Evidence for a Long-Term Strength Threshold in Crystalline Rock. Rock Mech. Rock Eng. 2010, 43, 513–531. [Google Scholar] [CrossRef]
  23. Kazerani, T.; Zhao, J. A Discrete Element Model for Predicting Shear Strength and Degradation of Rock Joint by Using Compressive and Tensile Test Data. Rock Mech. Rock Eng. 2012, 45, 695–709. [Google Scholar] [CrossRef]
  24. Gao, F.Q. Simulation of Failure Mechanisms Around Underground Coal Mine Openings Using Discrete Element Modelling (Dissertation); Simon Fraser University: Burnaby, BC, USA, 2013. [Google Scholar]
  25. Liu, R.; Li, B.; Jiang, Y. A fractal model based on a new governing equation of fluid flow in fractures for characterizing hydraulic properties of rock fracture networks. Comput. Geotech. 2016, 75, 57–68. [Google Scholar] [CrossRef]
  26. Liu, R.; Jiang, Y.; Li, B.; Wang, X. A fractal model for characterizing fluid flow in fractured rock masses based on randomly distributed rock fracture networks. Comput. Geotech. 2015, 65, 45–55. [Google Scholar] [CrossRef] [Green Version]
  27. Kazerani, T.; Zhao, J. Micromechanical parameters in bonded particle method for modelling of brittle material failure International Journal for Numerical. Anal. Methods Geomech. 2010, 34, 1877–1895. [Google Scholar] [CrossRef]
  28. Yao, C.; Jiang, Q.; Shao, J.; Zhou, C. A mesoscopic numerical model for simulation of rock fracturing. Chin. J. Rock Mech. Eng. 2013, 32. [Google Scholar] [CrossRef]
  29. Gao, F.; Stead, D.; Kang, H.; Wu, Y. Discrete element modelling of deformation and damage of a roadway driven along an unstable goaf—A case study. Int. J. Coal Geol. 2014, 127, 100–110. [Google Scholar] [CrossRef]
  30. Christianson, M.; Board, M.; Rigby, D. “UDEC simulation of triaxial testing of lithophysal tuff”. In Proceedings of the 41st U.S. Symposium on Rock Mechanics (USRMS), Golden Rocks 2006, Golden, CO, USA, 17–21 June 2006. [Google Scholar]
  31. Gao, F.Q.; Stead, D. The application of a modified Voronoi logic to brittle fracture modelling at the laboratory and field scale. Int. J. Rock Mech. Min. Sci. 2014, 68, 1–14. [Google Scholar] [CrossRef]
  32. Zhang, C.; Tu, S.; Bai, Q. Evaluation of Pore Size and Distribution Impacts on Uniaxial Compressive Strength of Lithophysal Rock. Arab. J. Sci. Eng. 2018, 43, 1235–1246. [Google Scholar] [CrossRef]
  33. Zhang, S.; Zhang, D.S.; Wang, Z.; Chen, M.W. Influence of Stress and Water Pressure on the Permeability of Fissured Sandstone Under Hydromechanical Coupling. Mine Water Environ. 2018, 37, 774–785. [Google Scholar] [CrossRef]
  34. Kazerani, T. Effect of micromechanical parameters of microstructure on compressive; and tensile failure process of rock. Int. J. Rock Mech. Min. Sci. 2013, 64, 44–55. [Google Scholar] [CrossRef]
  35. Barnes, R. Variogram Tutorial; Golden Software Inc.: Golden, CO, USA, 2004. [Google Scholar]
  36. Dey, S.; Mohanta, M.K.; Singh, R. Mineralogy and textural impact on beneficiation of goethitic ore. Int. J. Min. Sci. Technol. 2017, 27, 445–450. [Google Scholar] [CrossRef]
  37. Rigby, D.B. Influence of Lithophysal Geometry on the Uniaxial Compression of Tuff-like Rock; Department of Energy Technical Report TR-07-001, Task ORDFY04-013; System of Higher Education. U.S.: Las Vegas, NV, USA, 2007.
  38. Lin, M.; Kicker, D.; Damjanac, B.; Board, M.; Karakouzian, M. Mechanical degradation of emplacement drifts at Yucca Mountain—A modeling case study—Part II: Lithophysal rock. Int. J. Rock Mech. Min. Sci. 2007, 44, 368–399. [Google Scholar] [CrossRef]
Figure 1. Rock foundation mechanical experiments: (a) compressive, (b) tensile, (c) shear.
Processes 07 00162 g001
Figure 2. Geographical location of the study area.
Processes 07 00162 g002
Figure 3. Joint constitutive model in UDEC. (a) Normal and shear stiffness between blocks. (b) Constitutive behavior in shear and tension (i = s, n) [7].
Processes 07 00162 g003
Figure 4. Numerical model of uniaxial compression test.
Processes 07 00162 g004
Figure 5. Effect of block size on uniaxial compression strength (UCS).
Processes 07 00162 g005
Figure 6. Stress–strain curves under different loading velocities.
Processes 07 00162 g006
Figure 7. Experimental and numerical simulation results of uniaxial compression test. (a) failure pattern of the laboratory sample; (b) failure pattern of the numerical model; (c) Schematic diagram of failure pattern and (d) stress–strain curve of the numerical model.
Processes 07 00162 g007
Figure 8. Mineral radii.
Processes 07 00162 g008
Figure 9. Mineral positions.
Processes 07 00162 g009
Figure 10. Two mineral circle (C42) distribution diagram.
Processes 07 00162 g010
Figure 11. Mineral ratios for models under single circular dimensions 10, 5 and 2.5 mm: (a) S1–S3: 2.45%; (b) S4–S6: 4.9%; (c) S7–S9: 9.8%.
Processes 07 00162 g011
Figure 12. Proportion of 5 to 2.5 mm mineral circles under the same mineral ratio of 4.9%: (a) P1–P3: 6:2; (b) P4–P6: 4:4; (c) P7–P9: 2:6.
Processes 07 00162 g012
Figure 13. Mechanical characteristics of circular dimensions of different minerals: (a) stress–strain curve, (b) elastic modulus, (c) axial stress. a1, a2 and a3 are the stress-strain curves of C1-C3, C4-C6 and C7-C9 respectively.
Processes 07 00162 g013
Figure 14. Crack pattern of mineral circle size after sample is broken.
Processes 07 00162 g014
Figure 15. Mechanical characteristics of mineral circles at different positions: (a) stress–strain curve, (b) elastic modulus, (c) axial stress.
Processes 07 00162 g015
Figure 16. Crack pattern of rock specimen with one mineral circle in different positions after sample is broken: (a) level 1: L1–L3; (b) level 2: L4–L6; (c) level 3: L7–L9.
Processes 07 00162 g016
Figure 17. Mechanical characteristics of mineral circles in two positions: (a) stress–strain curve, (b) elastic modulus, (c) axial stress.
Processes 07 00162 g017
Figure 18. Crack pattern of two mineral circles located at different positions after sample is broken (T1–T6).
Processes 07 00162 g018
Figure 19. Mechanical characteristics of different mineral ratios: (a) stress–strain curve, (b) elastic modulus, (c) axial stress.
Processes 07 00162 g019
Figure 20. Crack patterns of different mineral ratios after sample is broken: (a) S1–S3: 2.45%; (b) S4–S6: 4.9%; (c) S7–S9: 9.8%.
Processes 07 00162 g020
Figure 21. Mechanical characteristics of proportions of different size minerals with the same mineral ratio (4.9%): (a) stress–strain curve, (b) elastic modulus, (c) axial stress.
Processes 07 00162 g021
Figure 22. Crack patterns of proportions of different size minerals with the same mineral ratio (4.9%) after sample is broken: (a) P1–P3: 6:2; (b) P4–P6: 4:4; (c) P7–P9: 2:6.
Processes 07 00162 g022
Figure 23. Mechanical properties of different mineral circular positions: (a) elasticity modulus, (b) UCS, (c) minimum stress post-peak.
Processes 07 00162 g023
Figure 24. Mineral circles with the same area: (a) radius A, (b) radius A/2.
Processes 07 00162 g024
Figure 25. Mean value of elastic modulus for different mineral proportions.
Processes 07 00162 g025
Figure 26. UCS and maximum and minimum stress post-peak for different mineral ratios.
Processes 07 00162 g026
Figure 27. Mean value of elastic modulus for proportions of different size minerals.
Processes 07 00162 g027
Figure 28. UCS and maximum and minimum stress post-peak for proportions of different size minerals.
Processes 07 00162 g028
Table 1. Mechanical parameters of sample fitting in numerical model.
Material Properties
UCSYoung’s modulus
11.44 MPa3.23 GPa
Calibrated Micro-Parameters
Bulk modulusShear modulusJoint normal stiffnessJoint shear stiffnessJoint cohesion
8.54 GPa3.636 GPa2461 GPa1453 GPa5.8 MPa
Joint frictionJoint tensionResidual cohesion Residual friction Residual tension
10°1.6 MPa0 MPa0 MPa

