Abstract
The objective of this research was to explore the changes of the pore structure and surface properties of nitric-modified lignite and base the adsorption performance on physical and chemical adsorbent characteristics. To systematically evaluate pore structure and surface chemistry effects, several lignite samples were treated with different concentrations of nitric acid in order to get different pore structure and surface chemistry adsorbent levels. A common heavy metal ion contaminant in water, Pb2+, served as an adsorbate probe to demonstrate the change of modified lignite adsorption properties. The pore structure and surface properties of lignite samples before and after modification were characterized by static nitrogen adsorption, X-ray diffraction, Scanning electron microscope, Fourier transform infrared spectroscopy, zeta potential, and X-ray photoelectron spectroscopy. The experimental results showed that nitric acid modification can increase the ability of lignite to adsorb Pb2+. The adsorption amount of Pb2+ increased from 14.45 mg·g−1 to 30.68 mg·g−1. Nitric acid reacted with inorganic mineral impurities such as iron dolomite in lignite and organic components in coal, which caused an increase in pore size and a decrease in specific surface areas. A hydrophilic adsorbent surface more effectively removed Pb2+ from aqueous solution. Nitric acid treatment increased the content of polar oxygen-containing functional groups such as hydroxyl, carbonyl, and carboxyl groups on the surface of lignite. Treatment introduced nitro groups, which enhanced the negative electrical properties, the polarity of the lignite surface, and its metal ion adsorption performance, a result that can be explained by enhanced water adsorption on hydrophilic surfaces.
1. Introduction
Lignite is a kind of low-rank coal with a low degree of coalification, and it is a macromolecular network structure compound that is composed of aromatic hydrocarbon rings and aliphatic chains, connected by bridge bonds. The molecular structure of lignite contains a large number of active oxygen-containing functional groups such as phenolic hydroxyl, carboxyl, ether bonds, and carbonyl, which impart the characteristics of weak acidity, hydrophilicity, and a cation exchange property to the coal [1]. Compared with other coal types, lignite has a more developed internal pore structure, a larger specific surface area, more rich oxygen-containing functional groups, and a higher porosity, which causes better adsorption properties of lignite and makes it useful as adsorbent to remove heavy metal ions and organic matter.
Shuying et al. [2] used Shulan lignite as adsorbent to handle wastewater that contained Ni2+, Zn2+, and Pb2+. The results showed that lignite can remove Ni2+, Zn2+, and Pb2+ from an aqueous solution, and the adsorption capacities of Ni2+, Zn2+, and Pb2+ were 28.18, 28.36, and 29.29 mg·g−1, respectively. Lumin et al. [3] used Longkou lignite to adsorb mercury-containing wastewater. The mercury removal rate in wastewater was 99%, and the saturated adsorption capacity of lignite was 24.34 mg·g−1 under room temperature conditions and a pH = 5. On the other hand, natural porous lignite also shows good adsorption properties for phenol, p-nitrophenol, reactive dyes, and nonionic surfactants. Polat. et al. [4] adsorbed phenol-containing wastewater by Soma lignite. Experiments showed that the saturated adsorption capacity of lignite was 10 mg·g−1, and its adsorption capacity per unit area (1.3 mg·m−2) was much higher than that of activated carbon (0.05~0.3 mg·m−2). The content of pollutants in the wastewater after adsorption was lower than the emission standard.
Although lignite has certain adsorption properties, in actual application there are some problems in the adsorption process, including low mechanical strength, high impurity content, poor chemical stability, and a tendency to shrink or swell. In order to overcome the aforementioned problems, some attempts have been done to prepare modified coal, including demineralization, nitration, sulphonation, pyrolysis, oxidation, granulation, and so on. Daocheng et al. [5] found that sulfonic acid groups can be introduced into the molecular structure of lignite coal by sulfonation with concentrated sulfuric acid. At the same time, more oxygen-containing functional groups, such as hydroxyl groups and phenolic hydroxyl groups, were formed on the surface of lignite, which made the lignite change from a weak acid-type ion exchange to a strong acid-type ion exchange, and greatly improved the adsorption capacity of lignite to metal ions. Choudhury et al. [6] studied the adsorption capacities of heavy metals on two low-rank Indian coals, which was oxidized by dilute nitric acid. Nitric acid oxidation of coal incorporates oxygen and nitrogen atoms into the coal matrix. The experimental data revealed good adsorption capacities of some heavy metal ions, such as Ni, Cu, Cd, and Pb. Kus et al. [7] studied the characteristics of oxidized coal, and found that coal oxidation lead to chemisorption of oxygen at the coal surface along with the formation of acid functional groups such as hydroxyl, carbonyl, carboxyl, and others, which led to subsequent thermal decomposition and a decrease in the aliphatic and alicyclic carbons. And during advanced stages of coal oxidation, vitrinite in coal will develop very extensive microcracks and microfissures accompanied by oxidation rims. During the modification process, the pore structure and surface chemistry of the adsorbent will change greatly and cause changes in adsorption performance. Thus, it is very important to study the changes of the pore structure and surface chemistry of modified coal to evaluate their effects on the adsorption properties of the adsorbent.
In this paper, different concentrations of nitric acid were used to modify lignite to get different pore structures and surface chemistry level samples. The pore structure, surface chemistry, and adsorption properties of different modified lignite samples were studied. Through the study we can explore the mechanism of lignite modification and the relationship between coal characteristics and adsorption performance. Furthermore, this study provides a basis for further research on the mechanism of lignite modification to improve the adsorption performance of lignite.
2. Experimental Parameters
2.1. Raw Materials and Experimental Coal Sample Preparation
The experimental lignite was obtained from Xilinhaote, Inner Mongolia. The raw coal was crushed and sieved, and the particles with a 45~75 μm size range were selected as the experimental samples. Moisture (Mad), ash (Aad), volatiles (Vad), and fixed carbon (FCad) content based on air drying were tested according to GB/T 212-2008. The proximate analysis results of raw coal are listed in Table 1.

Table 1.
Proximate analysis of the experiment lignite.
Ten raw coal samples with a mass of 10 g were weighed and added into 100 mL of nitric acid with concentrations of 0, 0.1, 0.3, 0.5, 0.7, 1, 3, 5, 7, and 10 mol·L−1, marked as N0M (the raw coal), N0.1M, N0.3M, N0.5M, N0.7M, N1M, N3M, N5M, N7M, and N10M, respectively. Then, the mixtures were placed in a shaking machine at 25 °C for 2 h. After the modification, the coal samples were washed with deionized water to a neutral state, and they were dried in a vacuum drying oven at 70 °C for subsequent use.
2.2. Coal Sample Mineral Composition Analysis
The mineral compositions of the brown coal before and after modification were measured by an X-ray diffractometer (SmartLab, Japan Science, Tokyo, Japan). The coal sample was sufficiently dried and ground before scanning with a speed of 15°·min−1, in the range of 5° to 90°.
2.3. Coal Sample Pore Structure Characterization
The specific surface area and pore structure characteristics of coal samples under different nitric acid modification conditions were characterized by a static nitrogen adsorption instrument (JW-BK122W, Jingwei Gaobo, Beijing, China). The adsorption and desorption isotherms of the samples were determined by the static capacity method using nitrogen as the adsorption medium at −195.15 °C under the relative pressure of 0.001~1. All samples were degassed at 105 °C for 4 h before the measurement. The specific surface area, pore volume, and pore size distribution of the coal samples were calculated by the BET (Brunauer-Emmett-Teller), BJH (Barret-Joyner-Halenda) and HK (Horvaih-Kawazoe) models.
2.4. Coal Sample Surface Morphology Analysis
The surface morphology characteristics of coal samples under different nitric acid modification conditions were characterized by a scanning electron microscope (JSM-7800F, JEOL, Tokyo, Japan). In the operation, firstly, the conductive adhesive was pasted on the sample holder, and the coal powders were scattered on the conductive adhesive. Next, the coal powders that did not adhere to the conductive adhesive were blown away by a blowing device, and then they were scanned by a scanning electron microscope after the gold sputtering treatment. The acceleration voltage was set to 15 KV, the resolution was set to 0.8 nm, and the magnification was 5000×.
2.5. Coal Sample Surface Functional Group Analysis
The surface functional groups of lignite under different nitric acid modification conditions were determined using a Fourier transform infrared spectroscopy analyzer (Nicolet iS10, Thermo Fisher Scientific, Waltham, MA, USA). The coal samples to be tested were ground and mixed with KBr at a ratio of 1:160, and then they were pressed into thin slices. The coal samples were fully dried in a vacuum drying oven before compression, and the test range was 4000~400 cm−1.
2.6. Coal Surface Potential Test
The surface potential of lignite samples under different nitric acid modification conditions were determined using a potential analyzer (Zetasizer Nano ZS90, Malvern, UK). One gram each of coal sample was added into 50 mL deionized water, mixed well, settled for 24 h, and the supernatant was used to determine results.
2.7. Analysis of the Existence of the Types of Coal Surface Elements
The types of coal elements existing on the surface of lignite samples were analyzed by an X-ray photoelectron spectrometer (ESCALAB 250Xi, Thermo Fisher Scientific, Waltham, MA, USA). The coal samples to be tested were ground and dried in a 50 °C drying oven for 1 h at a constant temperature, and they were then cooled in a desiccator to room temperature. After cooling, an X-ray photoelectron spectroscopy survey scan and narrow zone scan were performed.
2.8. Determination of the Adsorption Capacity of Pb2+ by Coal Samples
In this paper, Pb2+ was taken as the target pollutant to explore the adsorption efficiency of modified lignite. The Pb(NO3)2 stock solution was prepared in ultrapure water at a concentration of 200 mg·L−1. Coal samples weighing 0.6 g and a 100 mL Pb(NO3)2 solution were added into a 250 mL conical flask. The conical flask was then placed in a constant temperature shaking machine set at room temperature for 3 h. The mixture was filtered by a 45 μm membrane to obtain a clear liquid. The Pb2+ concentration in the filtrate was measured by a plasma emission spectrometer (ICPE-9000, Shimadzu, Kyoto, Japan) to calculate the Pb2+ removal efficiency.
3. Results and Discussion
3.1. Effects of Different Modified Concentrations of Nitric Acid on the Mineral Composition of Lignite
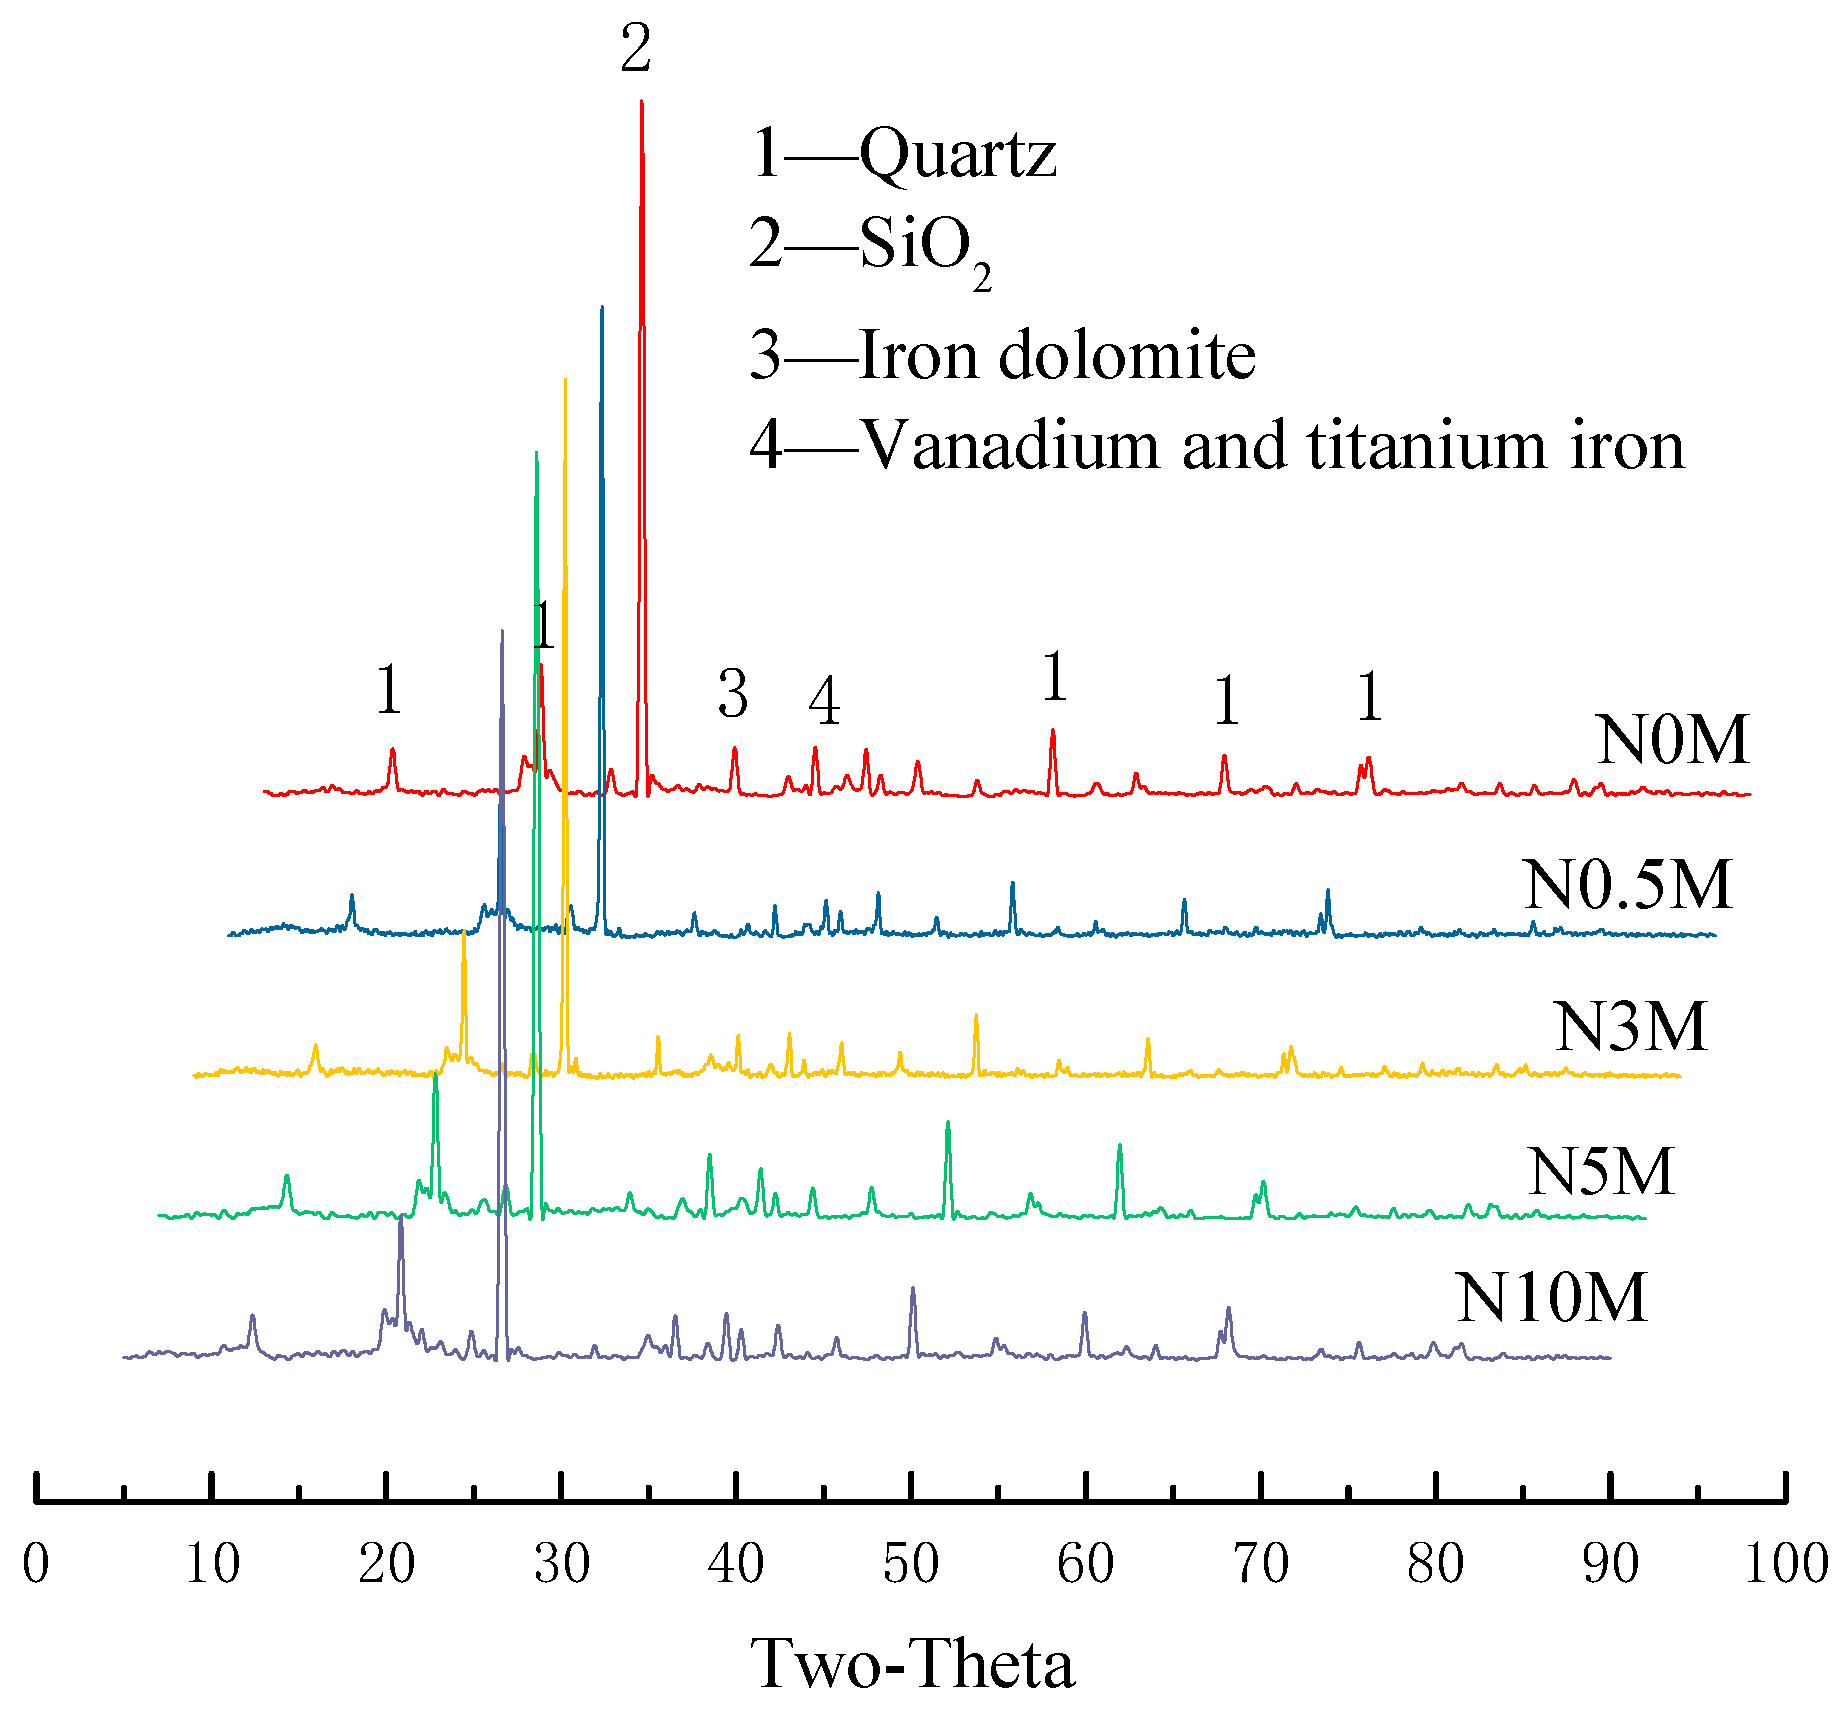
X-ray diffraction analysis of lignite before and after nitric acid modification was carried out. The analysis results are shown in Figure 1.
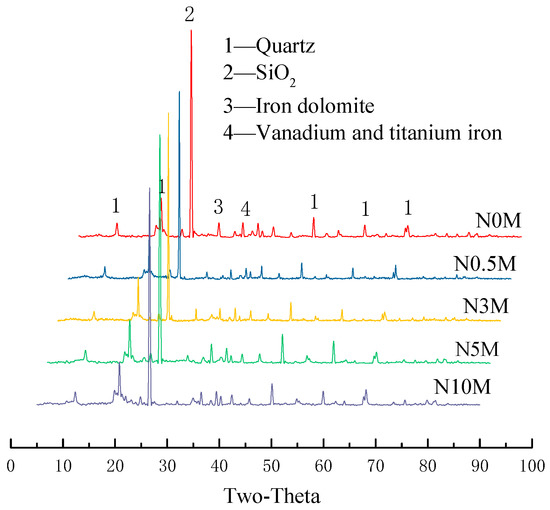
Figure 1.
X-ray diffraction spectra of lignite and nitric acid-modified lignite.
Coal is mainly composed of two major components: organic carbon molecules and inorganic minerals [8]. As seen from Figure 1, the main mineral components in the experimental lignite were quartz crystals and silica. In addition, there was a small amount of iron dolomite and vanadium titanium iron minerals. After treatment with nitric acid, the peak of iron dolomite gradually weakened, while other mineral components remained unchanged. The content of iron dolomite in lignite decreased after treatment with 5 mol·L−1 nitric acid. Furthermore, under 10 mol·L−1 of nitric acid treatment, the peak of iron dolomite nearly disappeared. The chemical formula of iron dolomite is Ca(Mg,Fe)(CO3)2, a kind of alkali metal carbonate, consisting essentially of calcium carbonate and unequal amounts of iron, magnesium, and manganese. The results indicated that the alkali metal carbonate was easy to react with acid and was dissolved under acidic conditions. This left a dissolution hole in the coal body, resulting in changes in the pore structure of coal [9].
3.2. Effects of Different Modified Concentrations of Nitric Acid on the Specific Surface Area of Lignite
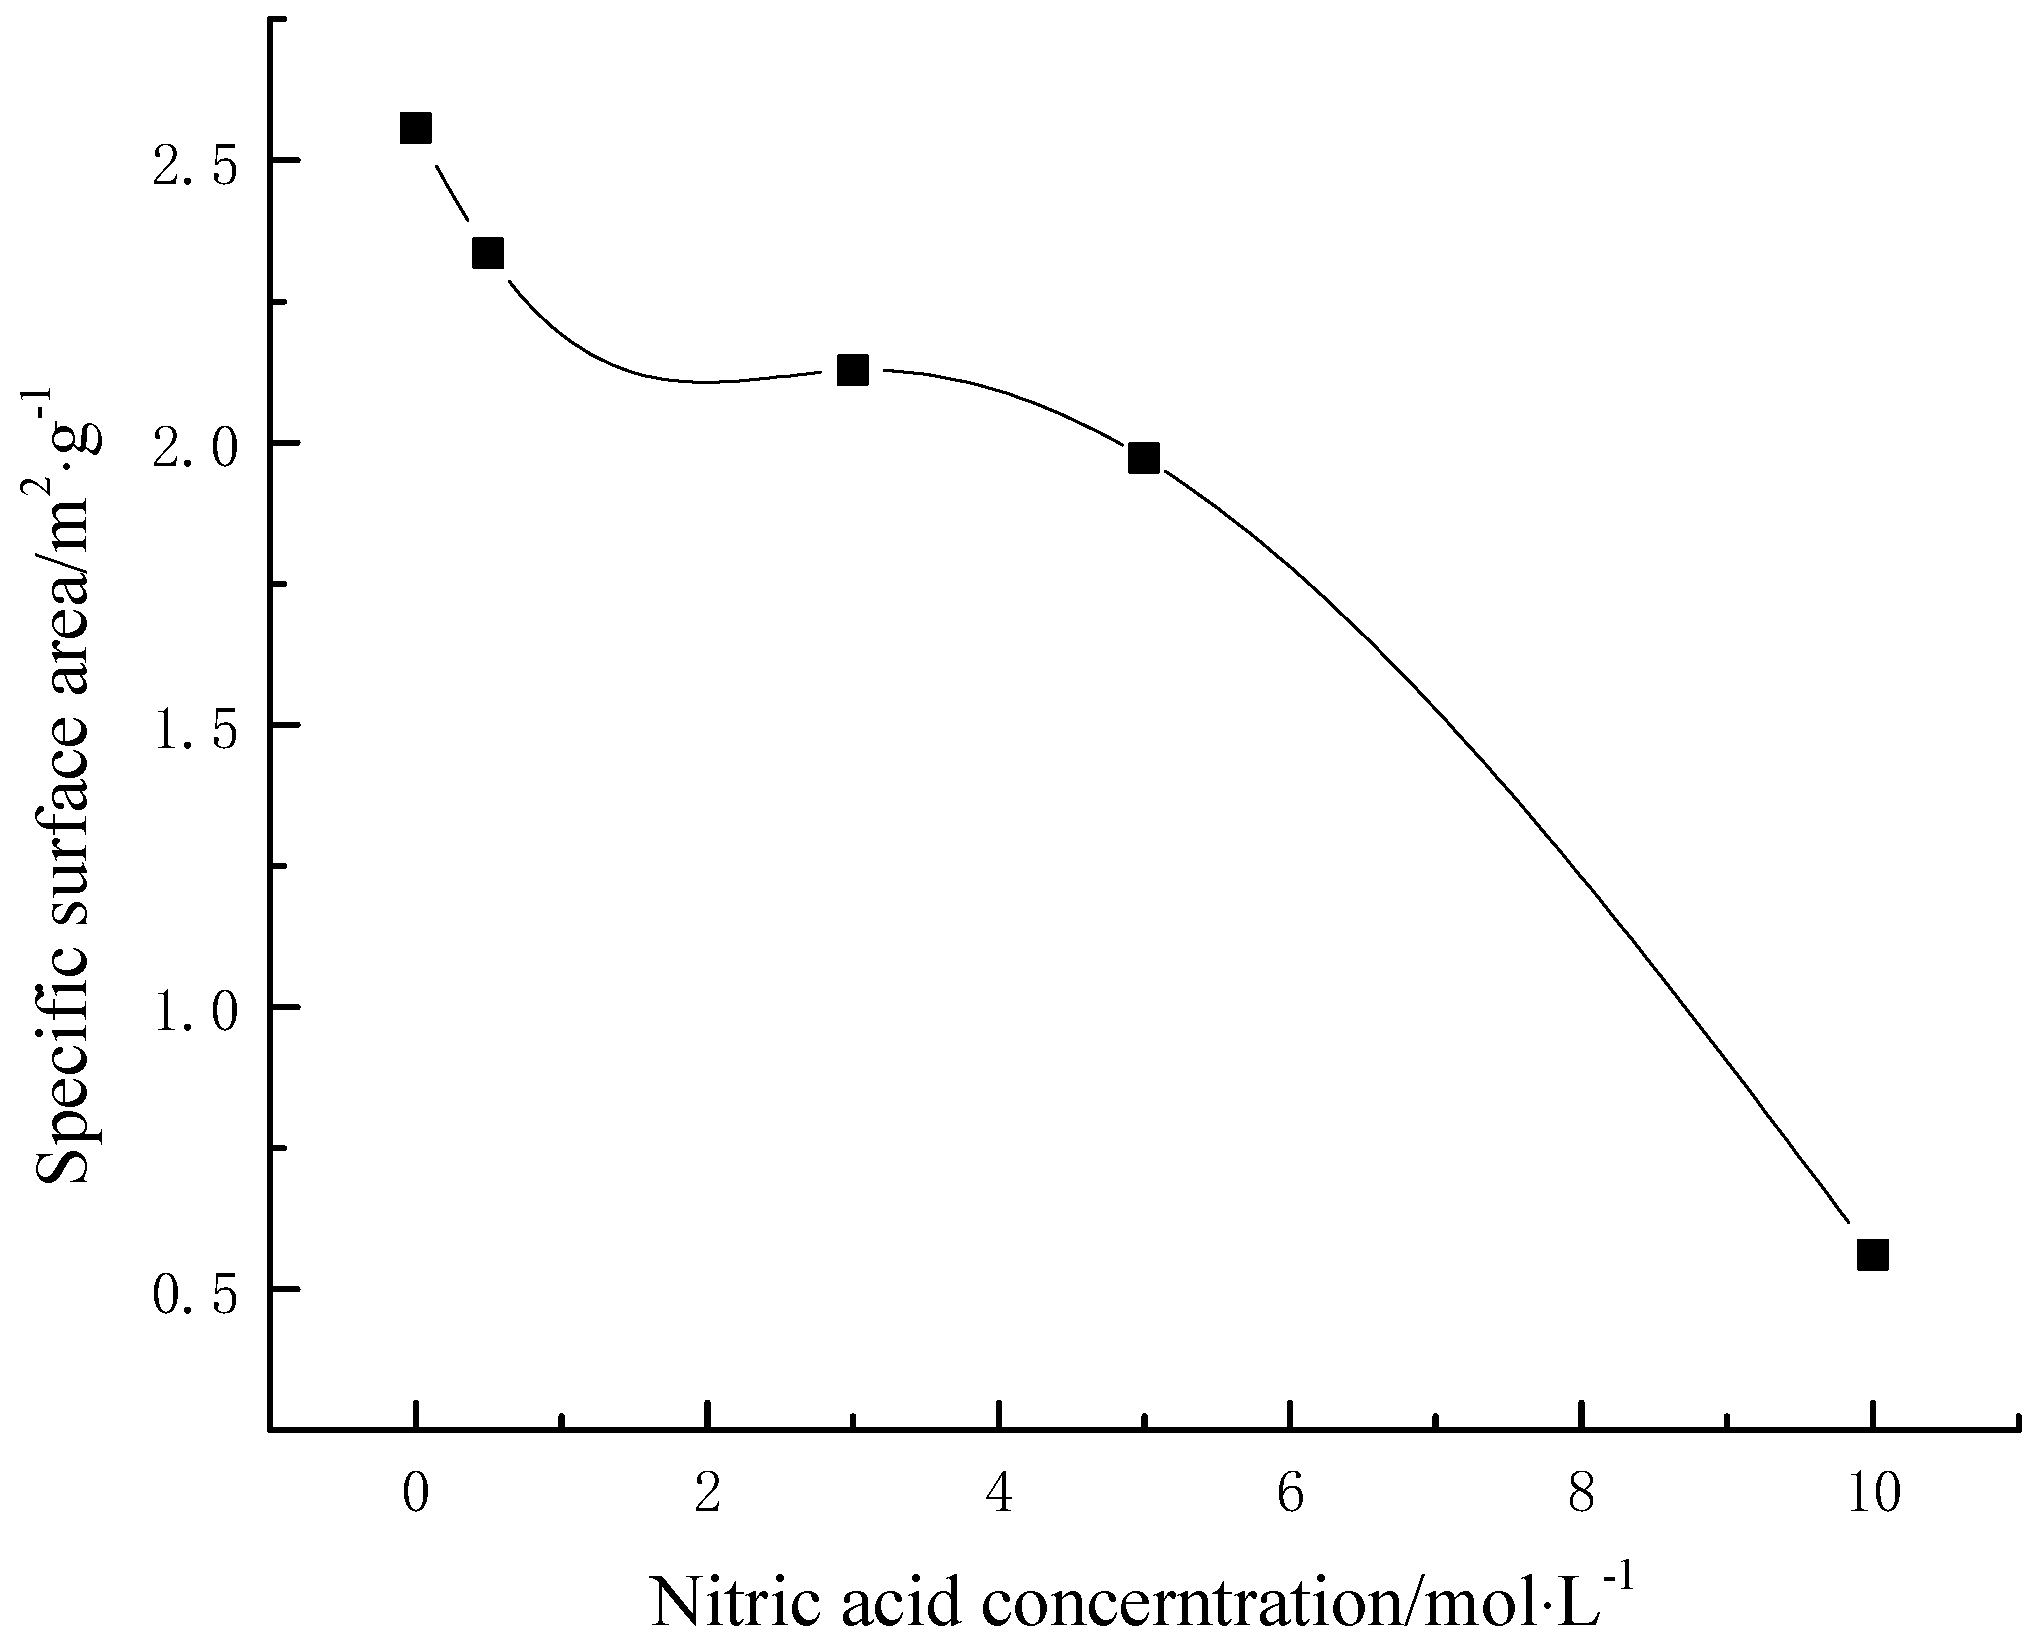
The change of specific surface area of lignite under different concentrations of nitric acid modification is shown in Figure 2.
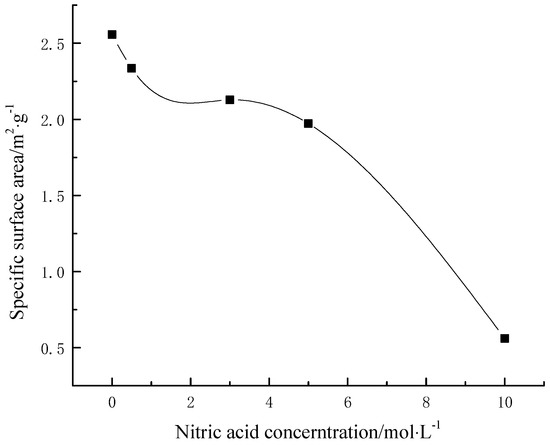
Figure 2.
Specific surface area of lignite treated with different nitric acid concentrations.
It can be seen from Figure 2, in the lignite modification process, that the specific surface area gradually decreased with the increase of nitric acid concentration. And the higher the modified concentration of nitric acid was, the more the specific surface area decreased. After modification by nitric acid, some alkaline mineral impurities in the coal were dissolved to form new pores, and at the same time the original pores in the coal were destroyed. With the increase of nitric acid concentration, the dissolution reaction was more intense. At the same time, the organic matter that made up the molecular structure of coal also participated in the reaction, which caused the pores to change (explained in the discussion section). Therefore, the specific surface area of the coal samples after nitric acid treatment was lower than that of the lignite raw coal, and the higher the modified nitric acid concentration, the more the specific surface area decreased.
3.3. Effects of Different Modified Concentrations of Nitric Acid on the Pore Shape of Lignite
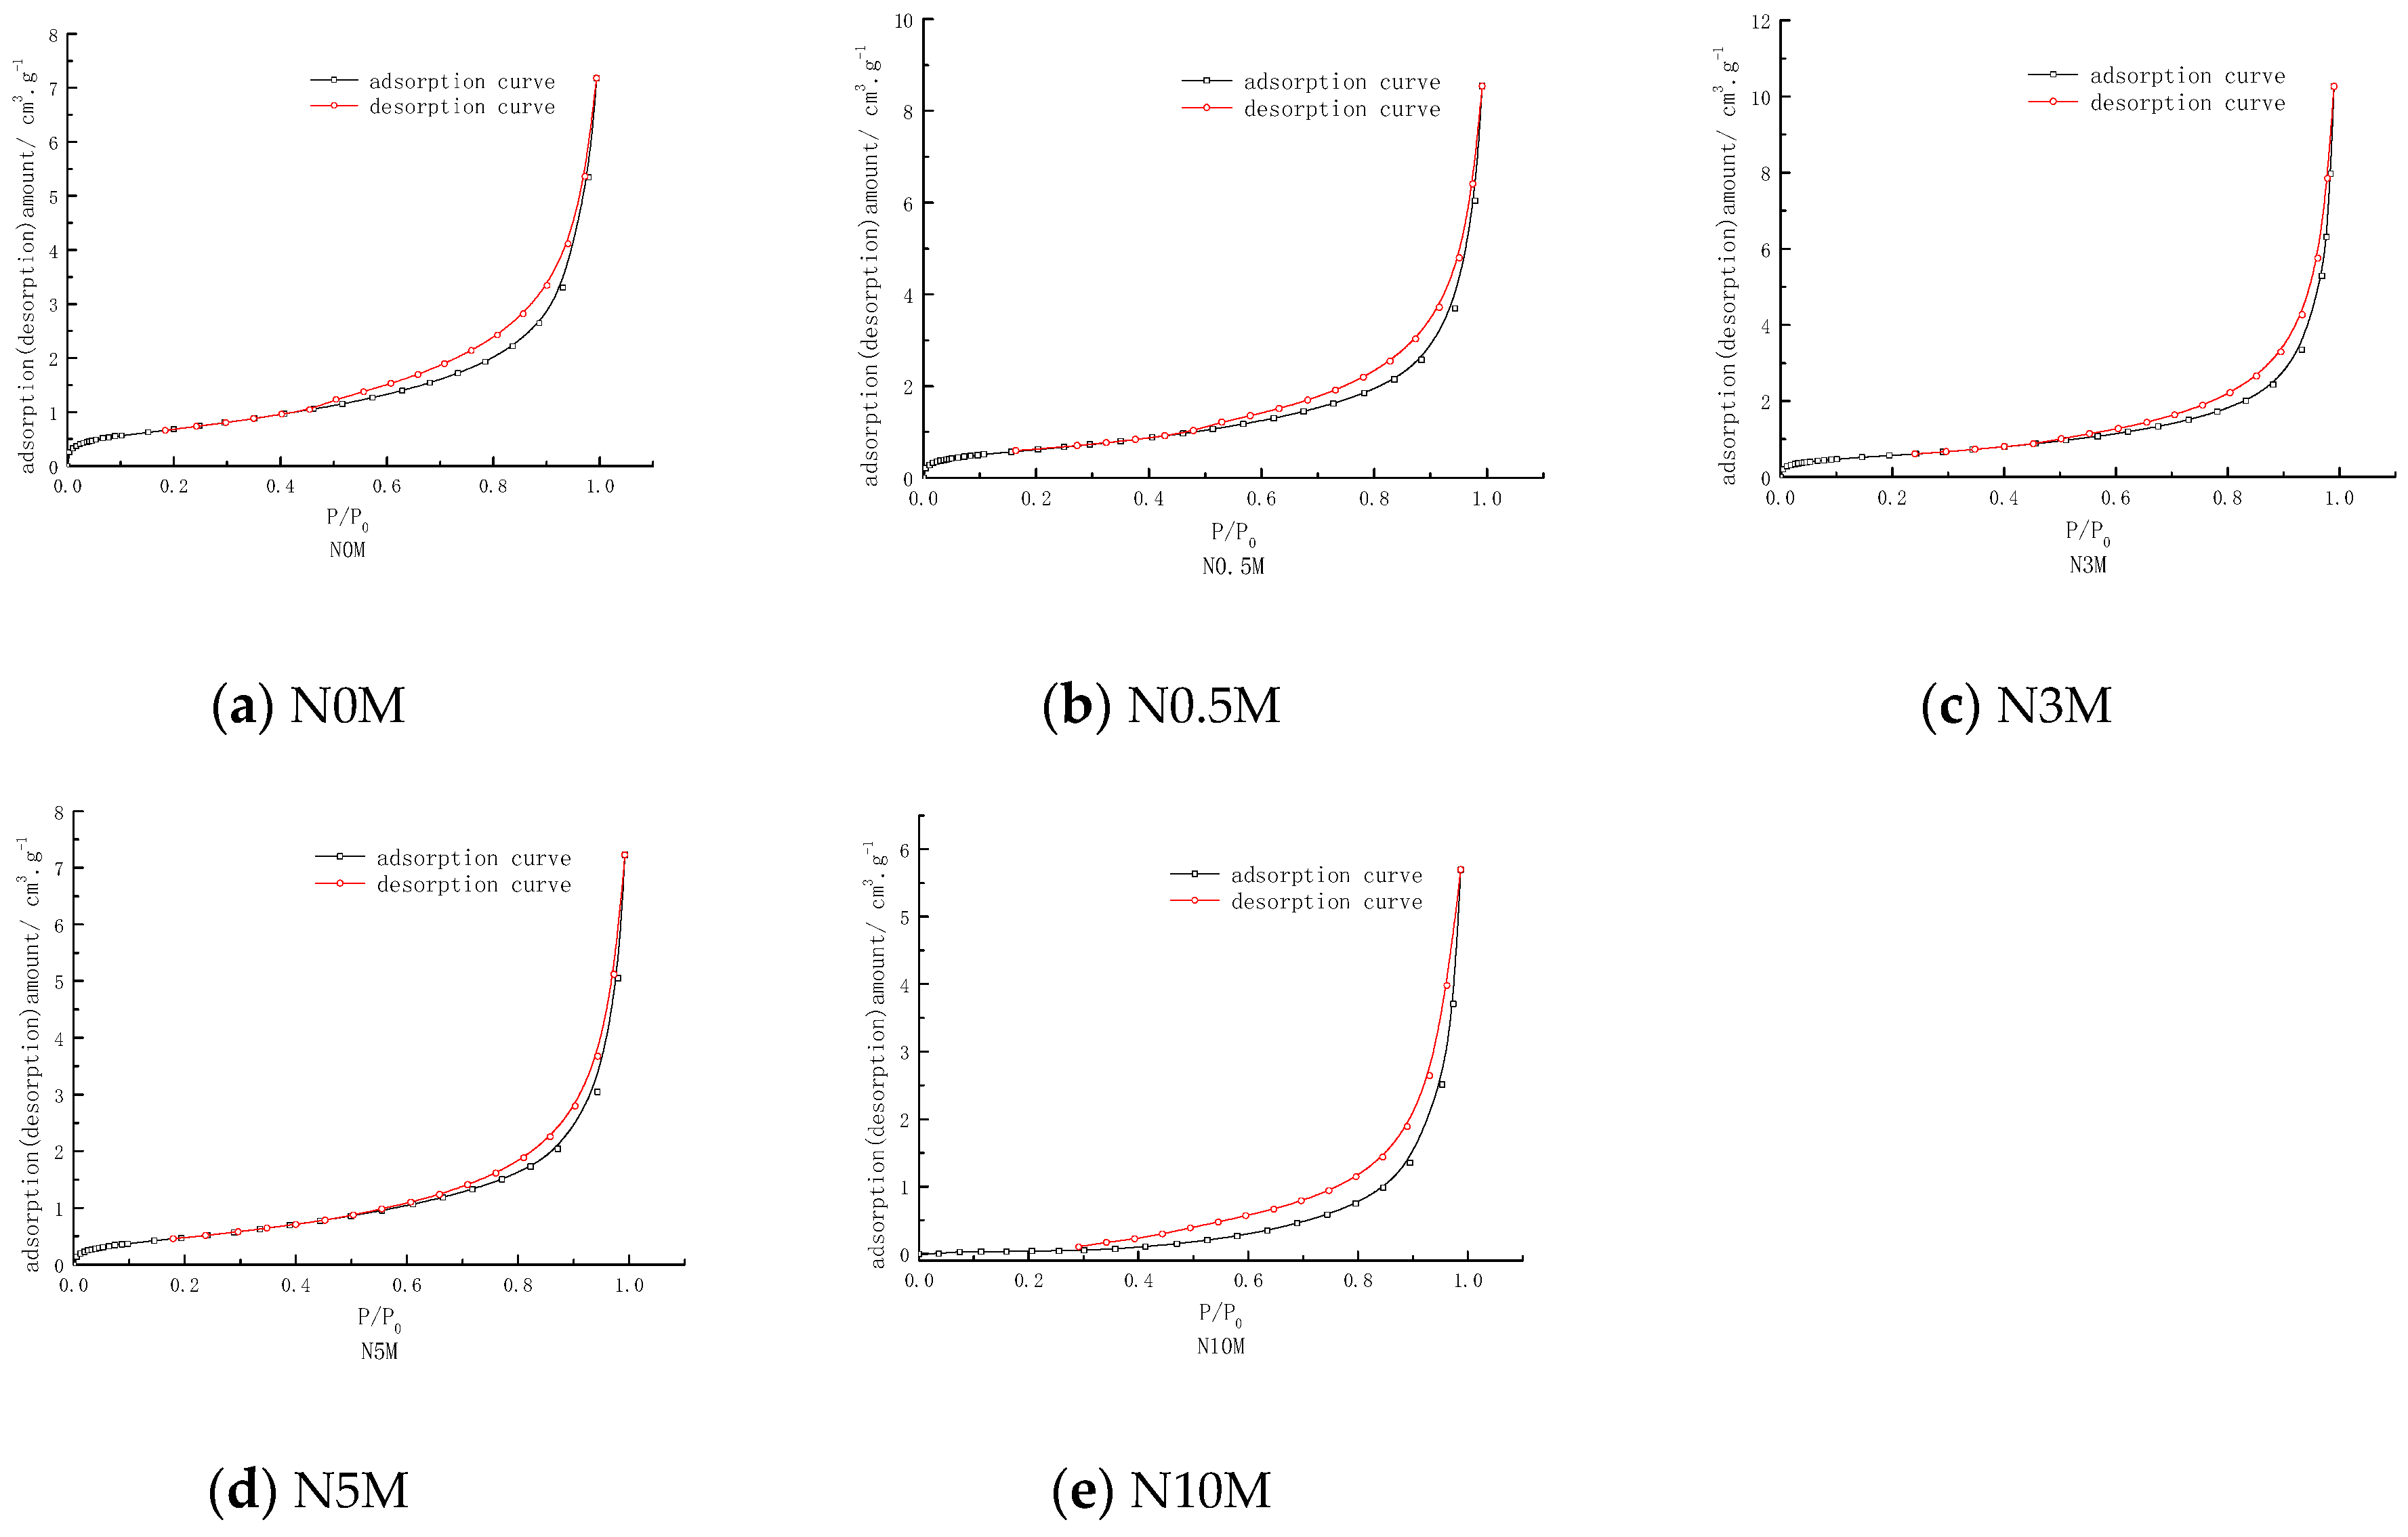
The nitrogen adsorption–desorption curves of lignite under different concentrations of nitric acid modification are shown in Figure 3.
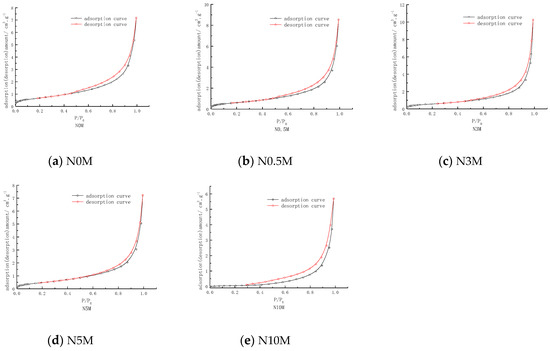
Figure 3.
Nitrogen adsorption–desorption curves of coal treated with different nitric acid concentrations.
It can be seen from Figure 3 that the shape of the adsorption–desorption curves of lignite before and after modification belonged to the type IV adsorption–desorption isotherm [10,11], meaning that when the relative pressure P/P0 was less than 0.02, the nitrogen adsorption amount increased with P/P0, which indicated that some micropores existed in the coal samples. When P/P0 was greater than 0.4, the nitrogen adsorption amount in the coal samples increased rapidly with the increase of P/P0, indicating that the coal samples contained abundant mesopores and macropores. In addition, the capillary condensation phenomenon of nitrogen in the mesopores led to the existence of hysteresis loops on the coal sample adsorption–desorption curve. The shape of the hysteresis loop reflected the pore shape in the coal samples. As seen from Figure 3, the shape of the hysteresis loop of each coal sample was uniform and conformed to the H1 type adsorption loop [12]. It can be judged from the shape of the hysteresis loop that the pore shapes in the coal samples were mostly narrow and long. At the beginning, as the modified concentration of nitric acid increased, the hysteresis loop gradually narrowed, indicating that the number of open pores decreased. This also indicated that the pore structure of lignite collapsed during nitric acid treatment, and the higher the concentration of nitric acid, the more severe the collapse of pores. When the concentration of nitric acid was 10 mol·L−1, the width of the hysteresis loop became larger. At the same time, the nitrogen adsorption amount was significantly lower than that of other coal samples, indicating that the original pores in the coal sample collapsed and crosslinked. Looking at the P/P0 range of the ring, the original pores in the coal samples mainly transformed into mesopores.
3.4. Effects of Different Modified Concentrations of Nitric Acid on the Structural Characteristics of Lignite Pores
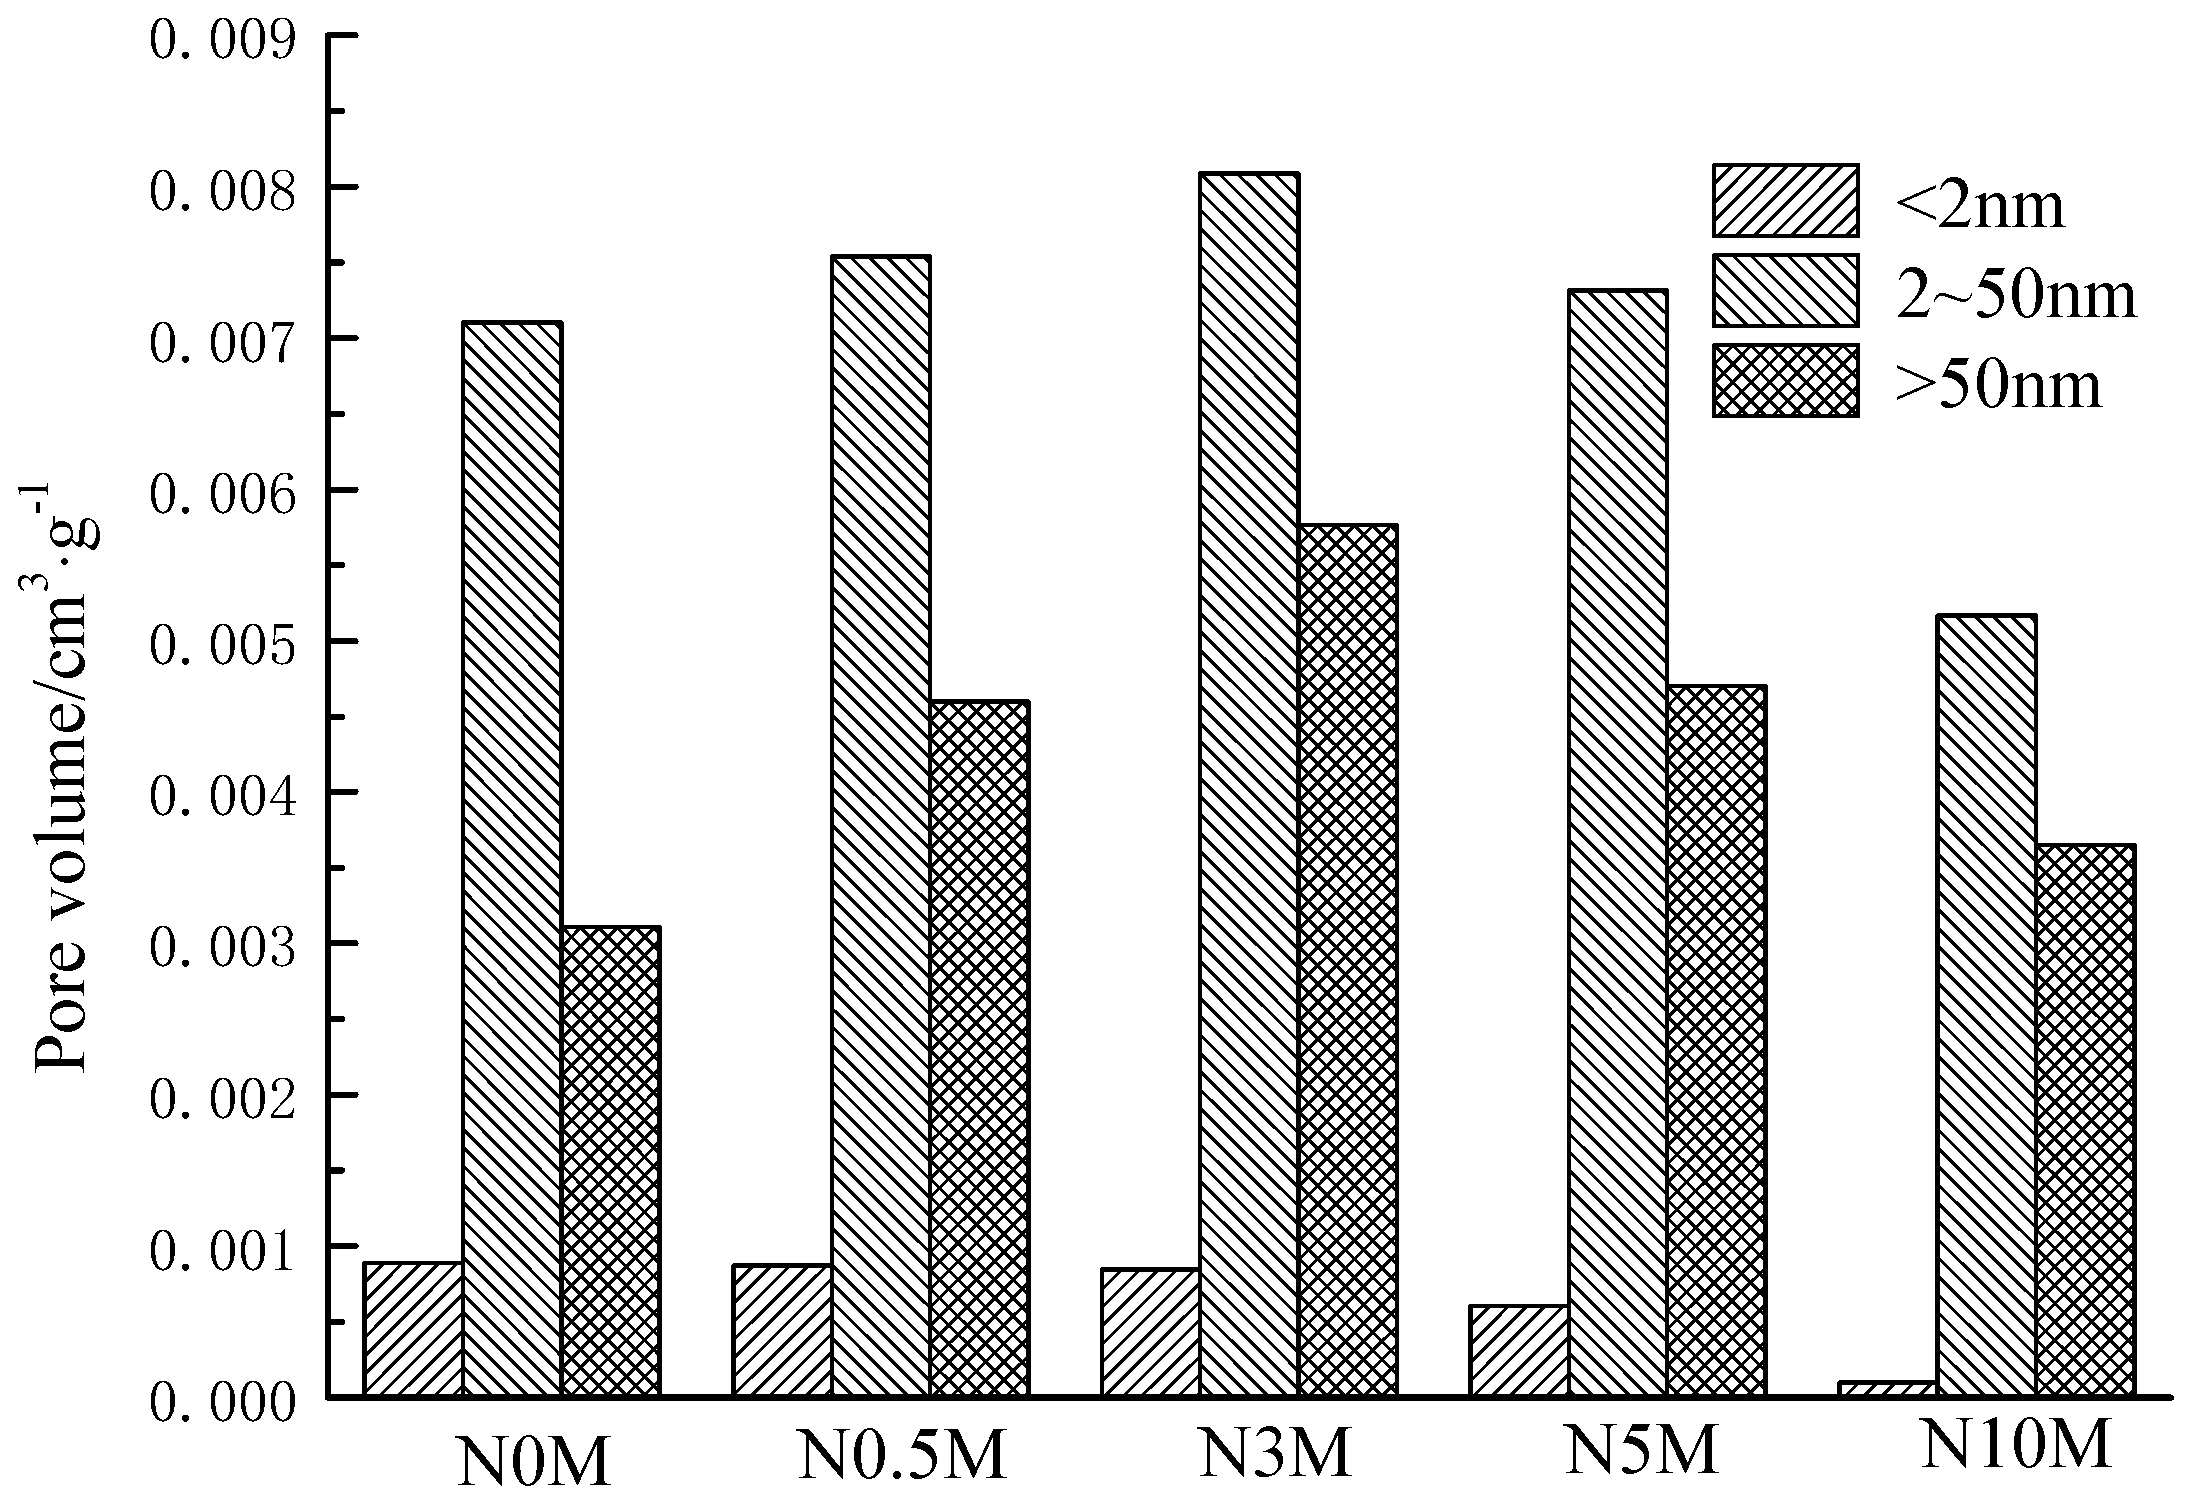
The total pore volume and pore structure parameters of lignite treated with different concentrations of nitric acid are shown in Table 2. The distribution of pores in different coal samples are shown in Figure 4.
Table 2.
The pore structure parameters of coal samples under different concentrations of nitric acid.
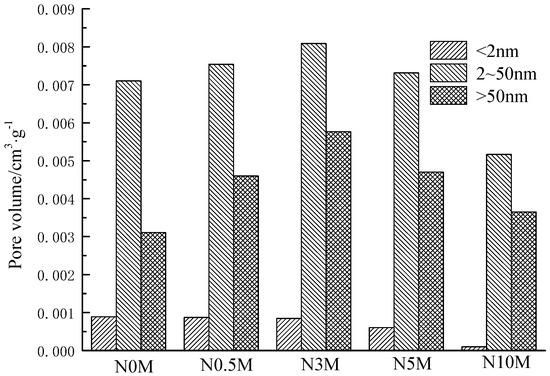
Figure 4.
Pore volume of lignite treated with different concentrations of nitric acid.
It can be seen from Table 2 and Figure 4, after treatment with different concentrations of nitric acid, the total pore volume of lignite increased first and then decreased, and the micropore volume decreased with the increase of nitric acid concentration. Combined with the results of X-ray diffraction analysis, when the concentration of nitric acid was 0.5~3 mol·L−1, the nitric acid reacted with the inorganic mineral impurities and the organic components in the coal, and it produced new pores, which increased the total pore volume of the coal samples. Then, when the concentration of nitric acid was higher than 3 mol·L−1, the nitric acid entered the micropores and reacted violently with the mineral components in lignite. The physical and chemical structure of the coal body was destroyed, causing the pores in the coal to collapse. Thus, the pore volume of each type was reduced, and the total pore volume of the coal samples decreased.
3.5. Effects of Different Modified Concentrations of Nitric Acid on the Surface Morphology of Lignite
The changes in mineral composition, specific surface area, and pore structure can be more intuitively determined from the surface morphology of lignite. Scanning electron microscope images of lignite samples under different nitric acid concentrations were obtained using a scanning electron microscope, which is shown in Figure 5.
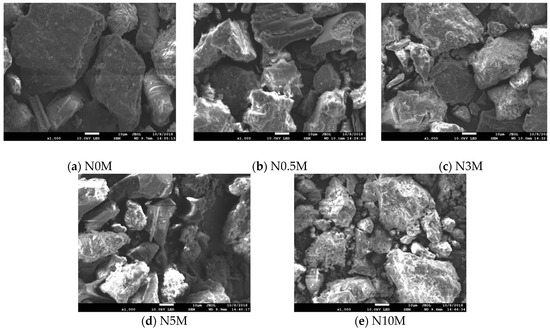
Figure 5.
Scanning electron microscope images of lignite treated with different concentrations of nitric acid.
It can be seen from Figure 5 that the surface of lignite raw coal was relatively flatter, and it gradually became rough after treatment with nitric acid. The higher the modified concentration of nitric acid, the more apparent this change was, which fully demonstrated the corrosive effect of nitric acid on the lignite structure.
3.6. Effects of Different Concentrations of Nitric Acid on the Surface Functional Groups of Lignite
The infrared scanning spectra results of lignite treated with different concentrations of nitric acid are shown in Figure 6.
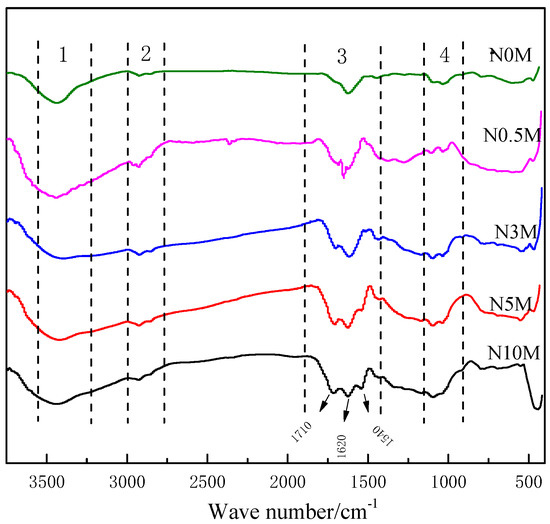
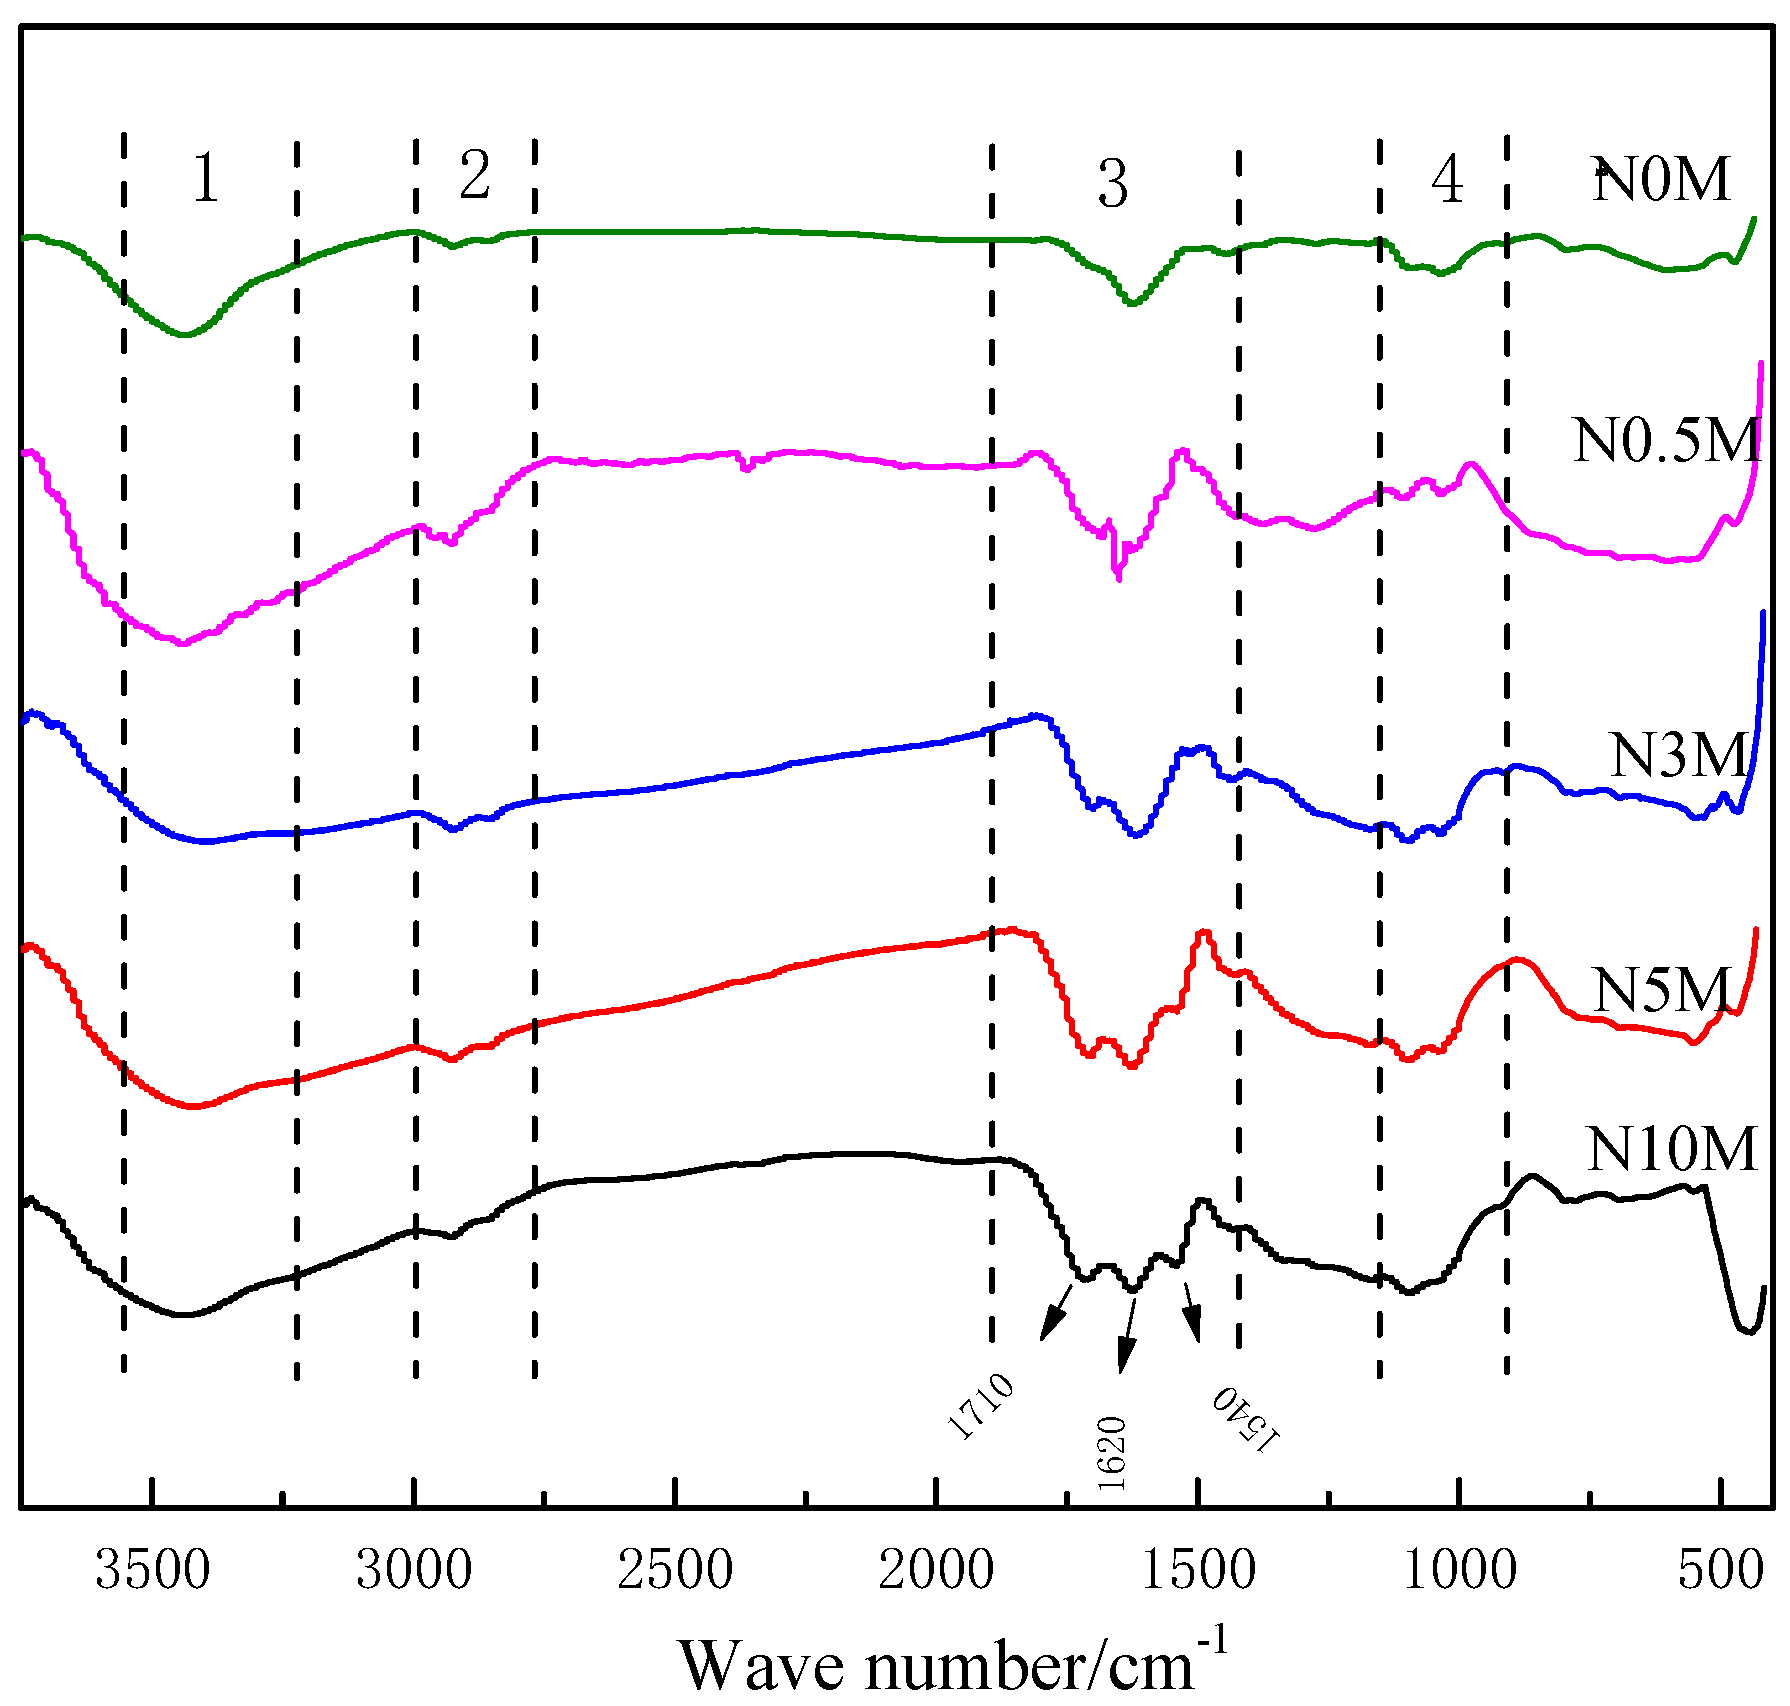
Figure 6.
Fourier transform infrared spectra of lignite and nitric acid-modified lignite.
As shown in Figure 6, the peak range of the Fourier transform infrared spectra was divided into four main regions according to the peak positions of the Fourier transform infrared spectra of the coal samples before and after nitric acid treatment. The discussions on the functional group structure for each region follows.
(1) 3600~3200 cm−1: The wide and strong absorption peak at this section was mainly the absorption band of phenolic hydroxyl (Ar-OH) in coal [13], and the characteristic absorption peak was around 3420 cm−1 [14]. It was found that the intensity of this peak in lignite raw coal was small. Compared with lignite raw coal, the width and strength of the peak were gradually enhanced with the increase of nitric acid concentration. The larger the nitric acid concentration was, the more apparent the increase was. The intensity of this peak after nitric acid modification was higher than that of raw lignite, indicating that the content of phenolic hydroxyl increased in the modified coal samples.
(2) 3000~2800 cm−1: This section was mainly the stretching vibration region of aliphatic hydrocarbons. The two characteristic absorption peaks at 2920 cm−1 and 2850 cm−1 were attributed to symmetric and asymmetric stretching vibrations of C–H. In raw coal, the peak intensity of C–H was small, and the change of peak intensity under different nitric acid concentrations was not significant, indicating that the nitric acid modification had little effect on the content of C–H alkanes in coal.
(3) 1400~1800 cm−1: The absorption peak in the range of 1700~1800 cm−1 was attributed to the C=O stretching vibration of the carboxylic acid, lactone, ester, and anthracene groups. The peak in the range of 1500~1660 cm−1 was the superposition zones of several functional groups, which were usually attributed to the stretching vibration peaks of C=C and C=O. In this region, lignite raw coal mainly had a strong absorption peak at 1620 cm−1 and a weak absorption peak at 1710 cm−1. Generally speaking, the peak at 1620 cm−1 was caused by stretching vibration of the aromatic ring C=C and conjugated stretching of the benzene ring. The peak at 1710 cm−1 was the characteristic peak of the carboxyl group in coal [15]. The FTIR spectra of raw lignite and different nitric acid concentrations of modified coal showed that the peak intensity at 1710 cm−1 was obviously enhanced with the increase of modified nitric acid concentration, indicating that the content of carboxyl groups in the lignite structure increased during the process. It was found that a new peak at 1540 cm-1 appeared, and it had an increasing trend with the increase of nitric acid concentration. There should be an anti-symmetric absorption peak of -NO2, in the forms of R-NO2 and Ar-NO2, indicating that a nitro group was introduced during the nitric acid modification treatment.
(4) 1200~900 cm−1: The characteristic absorption peak of this region was complex. Some researchers think that there were carboxylic acid, acid anhydride, lactone, ester, ether, and stretching vibration peaks of C–O–C, C–O, and O–H in this region. It can be seen from the spectra in Figure 7 that there was no strong absorption peak, but two weak absorption peaks at 1090 cm−1 and 1030 cm−1. This was attributed to the stretching vibration of C–O and C–O–C. Compared with the original coal, there was no new peak in this area, but the strength was slightly enhanced, indicating that the oxygen-containing functional groups increased in the nitric acid-modified lignite.
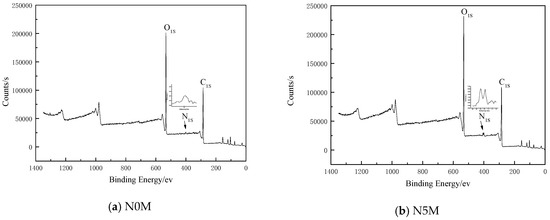
Figure 7.
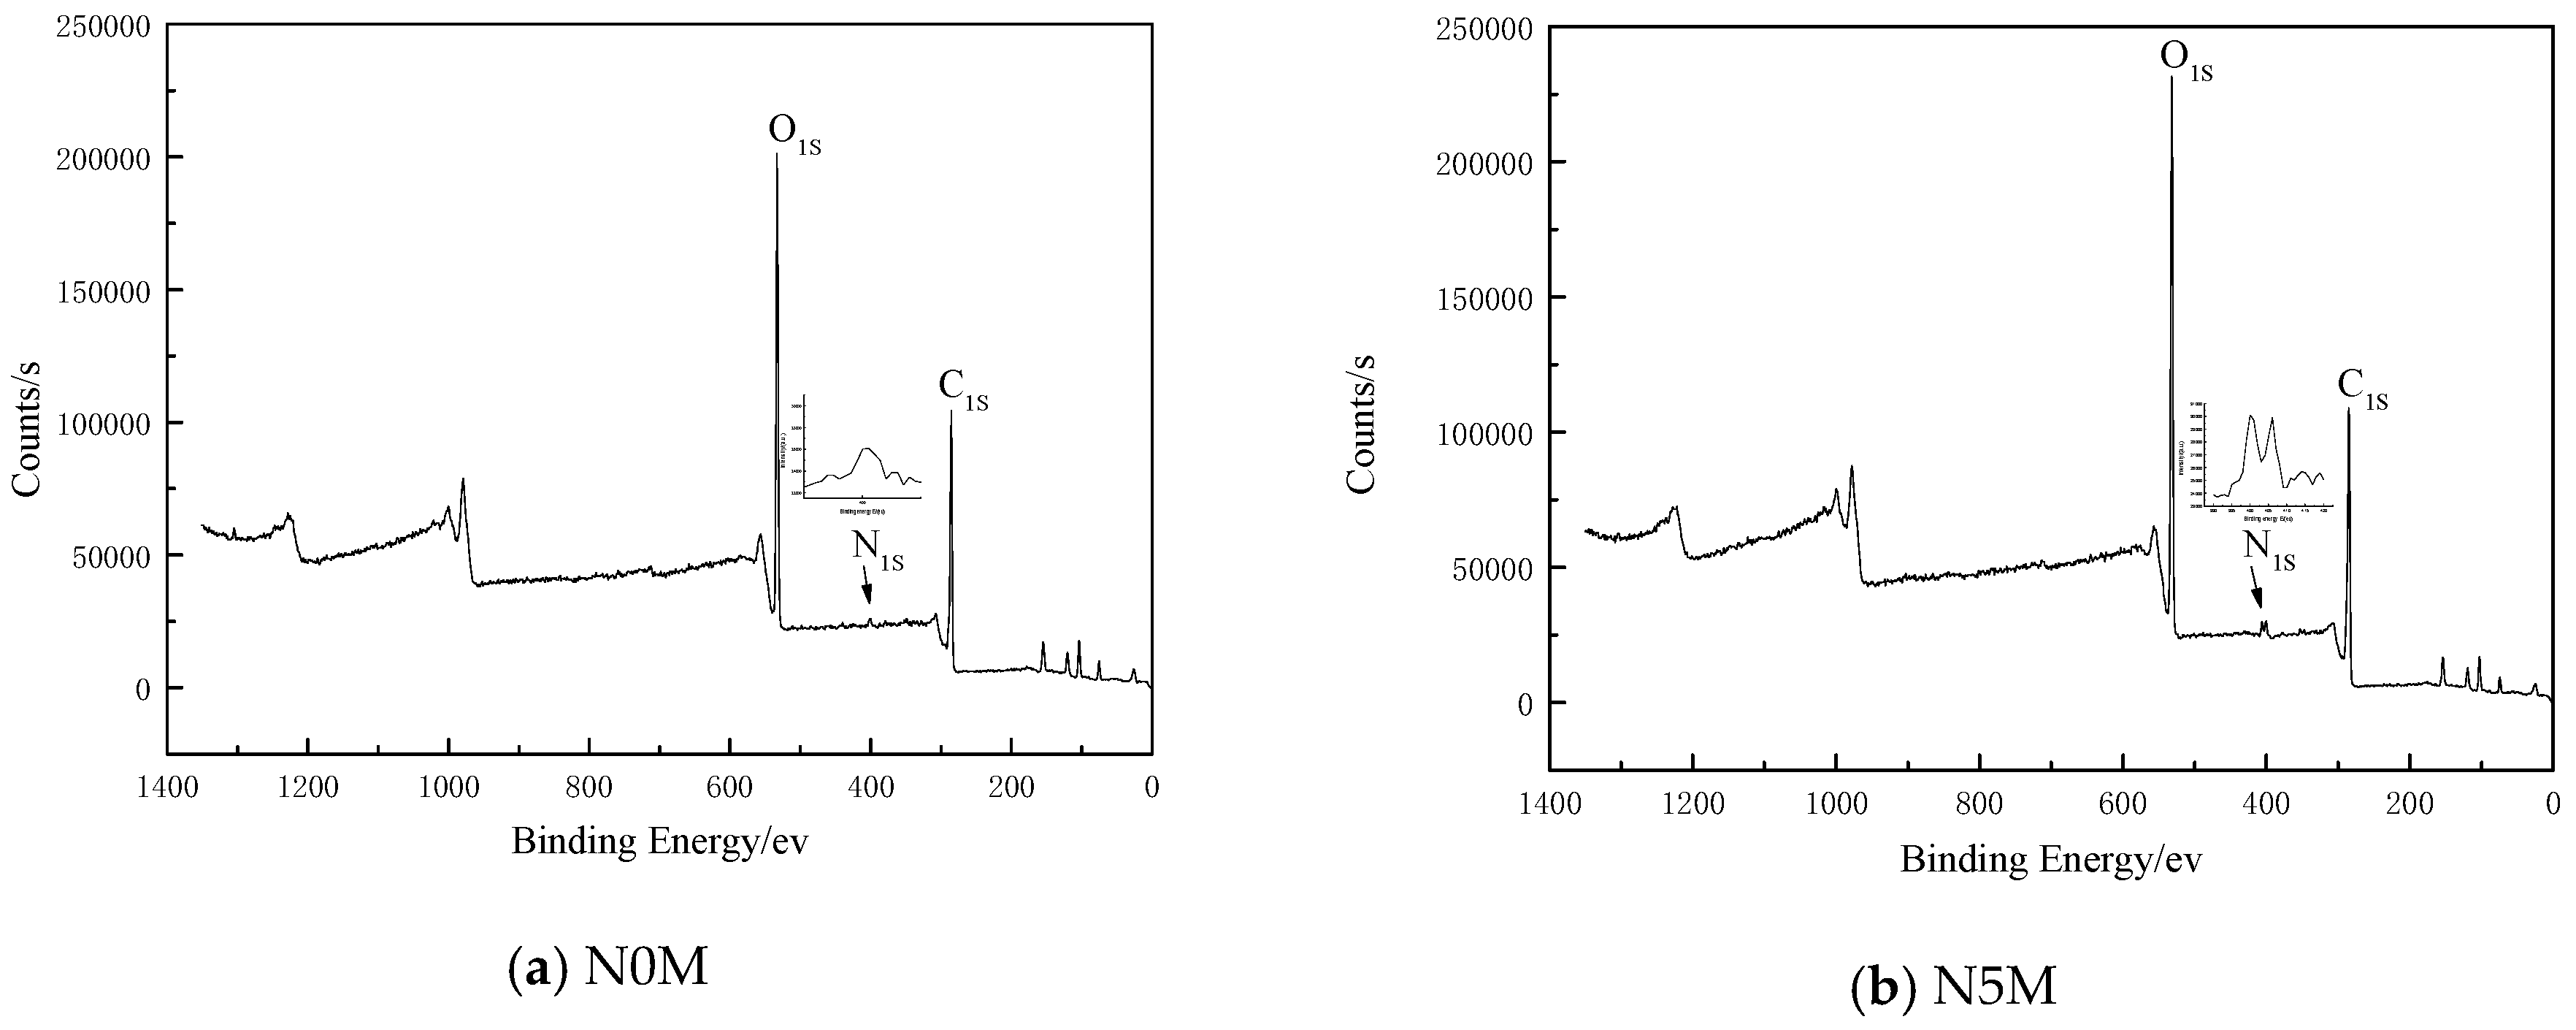
Survey X-ray photoelectron spectra of raw lignite and the modified lignite sample.
3.7. Effects of Nitric Acid Modification on the Types of Elements Existing on Coal Surfaces
3.7.1. Effects of Nitric Acid Modification on the Distribution of Chemical Functional Groups on the Lignite Surface
The survey XPS spectra of lignite and modified lignite is shown in Figure 7a,b.
It can be seen from Figure 7a,b that the lignite raw coal and the modified lignite had strong peaks of C and O elements, and gave a weaker peak of N element, indicating that the major elements in the brown coal before and after the modification were C and O. The XPS peak parameters of C, O, and N are shown in Table 3.
Table 3.
The parameters of the C, N, and O XPS peaks for the raw lignite and modified lignite samples.
It can be seen from Table 3 that the surface of raw lignite and modified lignite mainly contained C and O elements, and the content of N was small, indicating that the vast majority of the chemical functional groups of the raw lignite and modified lignite were oxygen-containing functional groups.
Comparing the nitric acid-modified lignite and the raw lignite samples, it can be seen that the C element peak area of the lignite surface increased by 20.25%, the oxygen element peak area increased by 16.5%, and the N element peak area increased by 258% after nitric acid modification. The data showed that the nitric acid acidification process had an effect on the surface element composition of lignite. This was mainly to increase the content of N and O elements on the surface of lignite.
3.7.2. Distribution of Carbon Chemical Functional Groups of Lignite and Modified Lignite Surfaces
The types of nitrogen and oxygen existing in coal are closely related to carbon atoms. When C atoms form chemical bonds with O or N, a large amount of surface chemical functional groups are created on the surface of the coal, and this leads to a change in binding energy.
In order to understand the change in the forms of C element existing on the surface of lignite before and after modification, XPS was carried out in a narrow range, and the peak of C1S was fitted by peakfit software. The peak-fitting results are shown in Figure 8a,b, and the peak parameters and attribution are shown in Table 4.
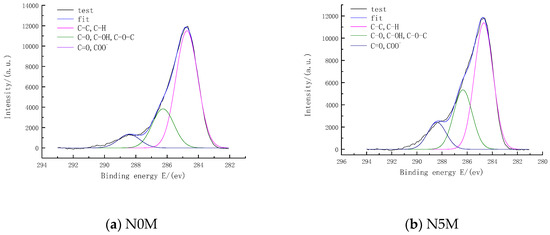
Figure 8.
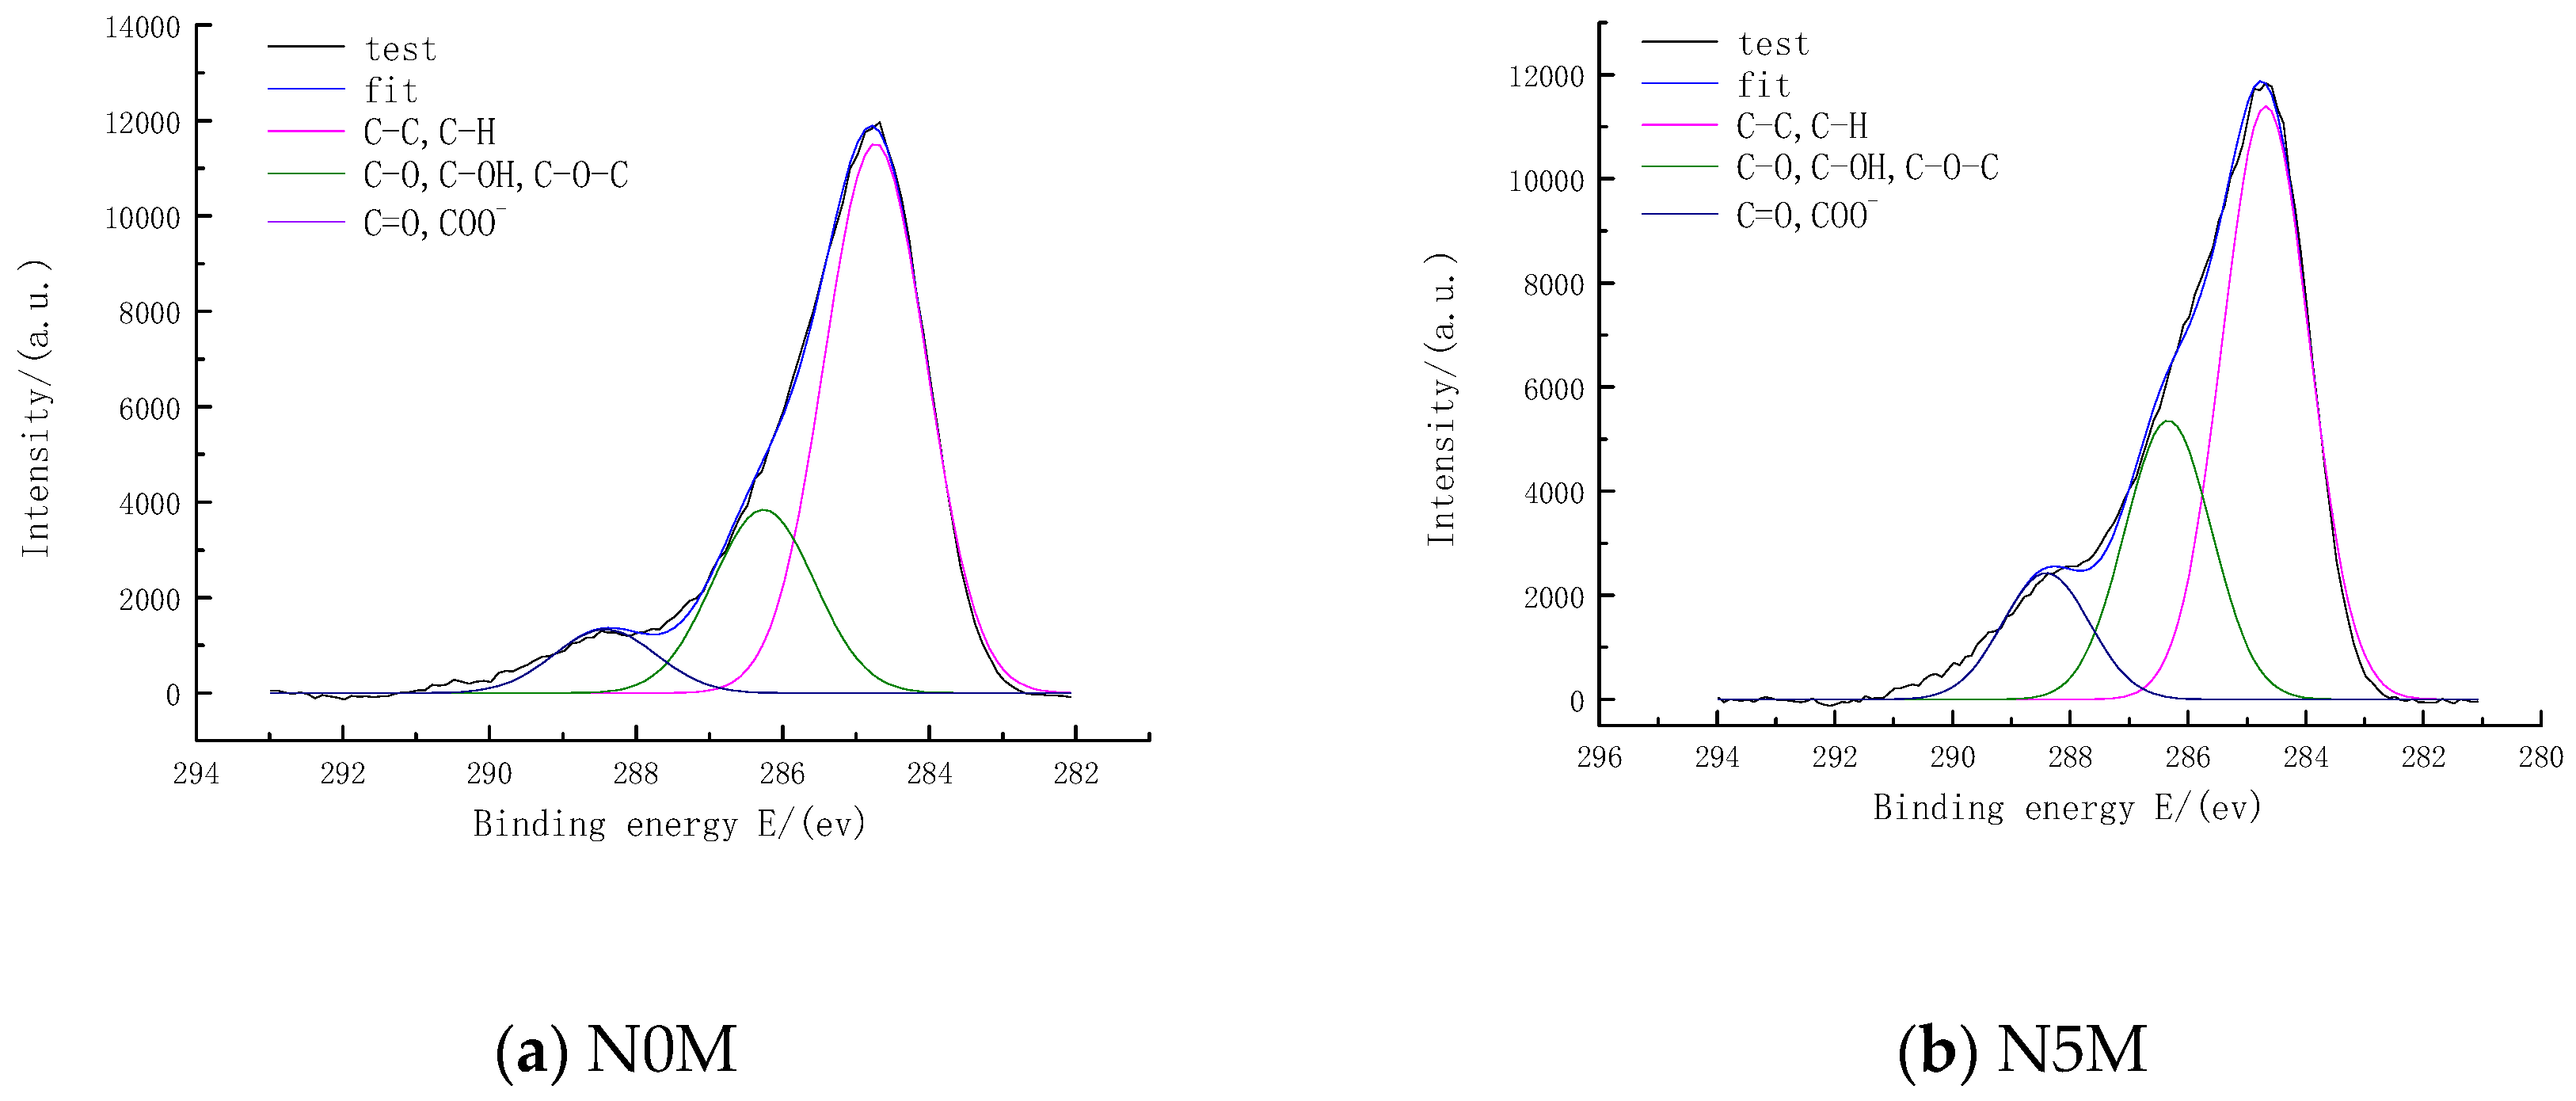
XPS C1S spectra for lignite and nitric acid-modified lignite.
Table 4.
XPS C1S synthesized data of lignite and nitric acid-modified lignite.
There are four types of carbon in coal: aromatic hydrocarbon or aromatic-substituted alkane, phenol carbon or ether carbon, the carbonyl group carbon, and the carboxyl group carbon. It can be seen from Figure 8 and Table 4 that the C-bonding energy of the raw lignite and modified lignite samples was mainly in the range of 282–290 eV. Both the lignite and the modified lignite were divided into three peaks under the best fitting state at almost the same position, which can be considered as the same species, and the peaks were aromatic hydrocarbon or aromatic-substituted alkane at 284.7 eV, the carbon–oxygen single bond at 286.3 eV, and the carbon–oxygen double bond at 288.4 eV [16,17].
Compared with the raw lignite, the peak area of aromatic carbon of the modified brown coal surface reduced by 4.98%, the carbon–oxygen single bond increased by 47.87%, and the carbon–oxygen double bond increased by 10.26%. This indicated that the nitric acid modification caused a decrease in the aromatic hydrocarbon or aromatic-substituted alkane on the lignite surface, and an increase in the oxygen-containing functional groups, such as the ether carbon or the phenol carbon, the carbonyl group, or the carboxyl group.
3.7.3. Distribution of Oxygen Chemical Functional Groups of Lignite and Modified Lignite Surfaces
The oxygen element in the coal mainly exists in the form of organic oxygen-containing groups [18]. The XPS scan of the lignite coal samples before and after nitric acid modification and the peak-fitting of the O1S spectra were carried out. The peak-fitting results are shown in Figure 9a,b. The peak parameters and attribution are shown in Table 5.
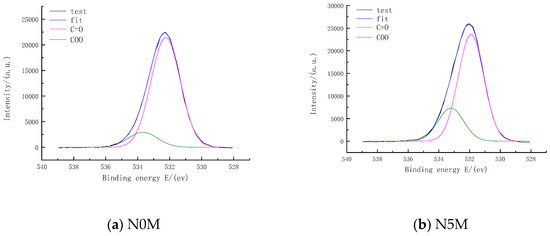
Figure 9.
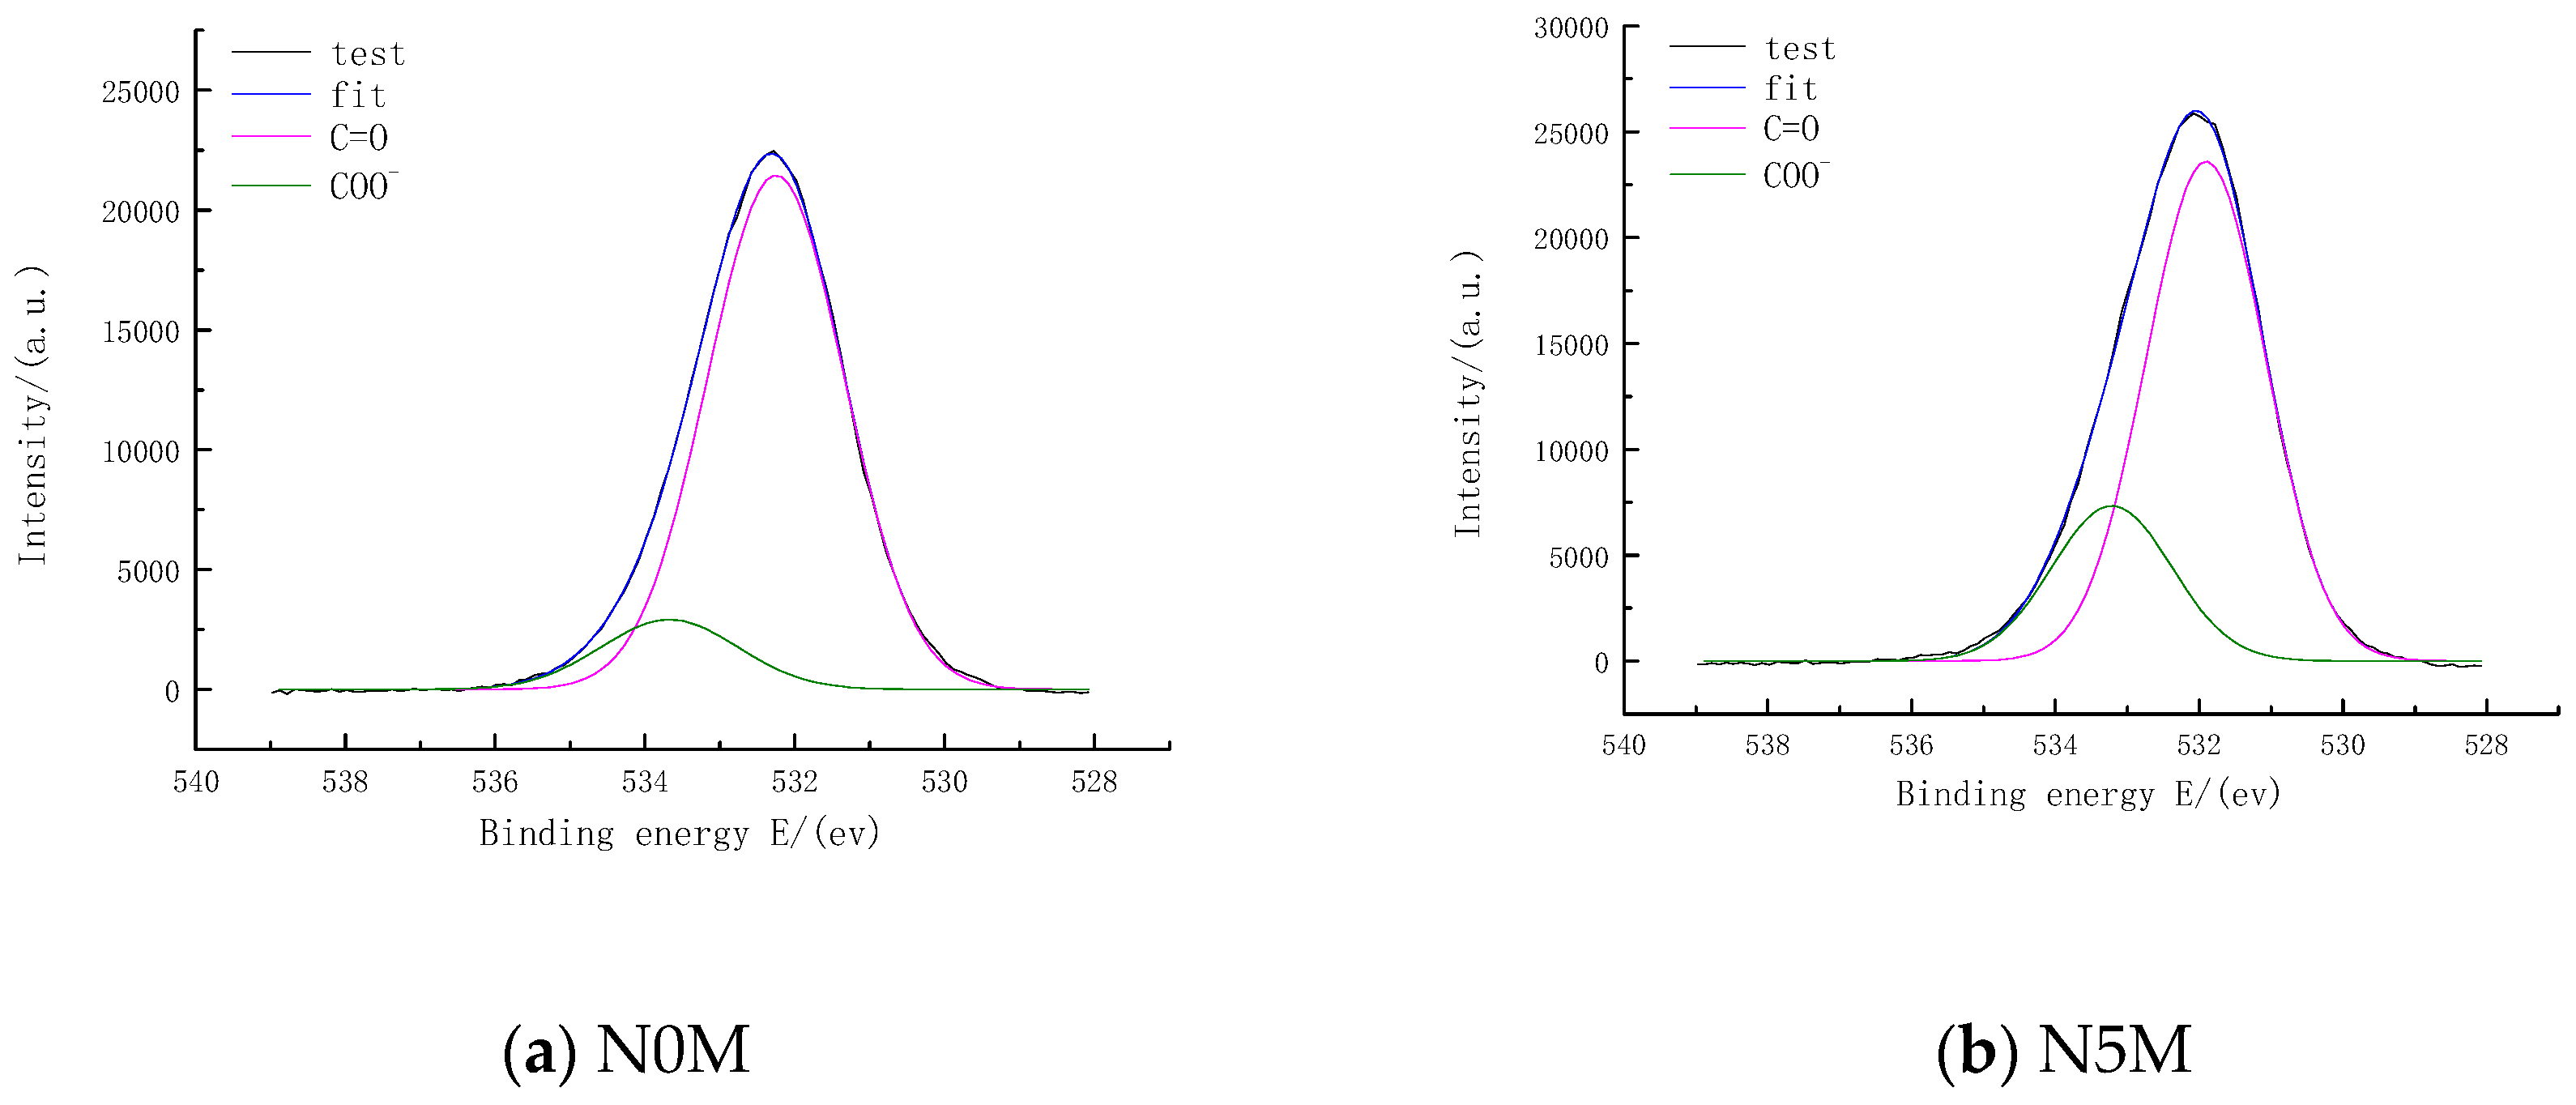
XPS O1S spectra for lignite and nitric acid-modified lignite.
Table 5.
XPS O1S synthesized data of lignite and nitric acid-modified lignite.
It can be seen from Figure 9a,b that the peak of the O element ranged from 529 to 536 eV. The types of oxygen in the oxygen-containing functional groups on the coal surface can be mainly divided into three types: C=O bond in chemical functional groups of ketones, lactones, and carbonyls; carbonyl oxygen in the chemical functional groups of esters, amides, and acid anhydrides; and COO− in the chemical functional groups of hydroxyl, ether oxygen, and carboxyl [19,20].
The XPS O1S spectra of lignite raw coal and nitric acid-modified lignite can be divided into two prominent peaks: C=O at 532 eV and COO− at 533.5 eV. The change in peak area showed that the two oxygen types changed on the surface of lignite before and after nitric acid treatment, in which C=O increased by 0.26%, and COO− increased by 129.82%. This indicated that nitric acid modification mainly changed the COO− content of the lignite surface.
3.7.4. Distribution of Nitrogen Chemical Functional Groups of Lignite and Modified Lignite Surfaces
The XPS N1S spectra scan of the lignite before and after modification and the peak-fitting of the N1S spectra were carried out. The peak-fitting results are shown in Figure 10a,b. The peak parameters and attribution are shown in Table 6.
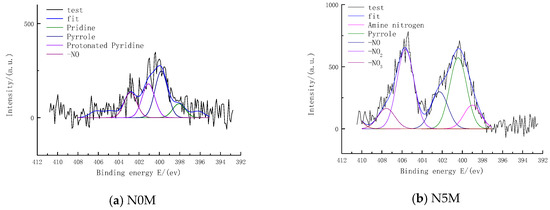
Figure 10.
XPS N1S spectra for lignite and nitric acid-modified lignite.
Table 6.
XPS N1S peak synthesized data of lignite and nitric acid-modified lignite.
It can be seen from Figure 10a,b that the N1S peak position of the raw coal was between 395 and 405 eV, and the N1S spectrum had a single peak. The significant difference from the raw coal N1S spectrum was that the lignite N1S spectrum after nitric acid modification had two peaks at 400 eV and 406 eV, indicating that the nitrogen-containing functional groups on the surface of lignite had large changes before and after modification. The specific changes are shown in Table 5.
The nitrogen element in coal is mainly from plants in the coal-forming process; therefore, mainly in the forms of organic nitrogen. There are four main forms of nitrogen in coal: pyridine nitrogen  (398.0~398.1 eV), pyrrole nitrogen
 (400.0~400.4 eV), protonated pyridine
  (401.6 eV), and nitrogen oxides
  (402~405 eV) [21,22].
(398.0~398.1 eV), pyrrole nitrogen (400.0~400.4 eV), protonated pyridine (401.6 eV), and nitrogen oxides (402~405 eV) [21,22].Four peaks were obtained by peak-fitting of lignite raw coal XPS N1S spectra, attributed to pyridine nitrogen, pyrrole nitrogen, protonated pyridine, and –NO. Therefore, the four organic nitrogen types existed in lignite raw coal. Among them, the content of pyrrole nitrogen and protonated pyridine were higher than the other two types, accounting for 39.03% and 28.24%, respectively. The contents of –NO was 21.14%, and the content of pyridine nitrogen was 11.59% of the total nitrogen content. The peak separation of N1S spectra of nitric acid-modified lignite obtained five peaks, attributed to amine nitrogen, pyrrole nitrogen, –NO, –NO2, and NO3, respectively. Among them, –NO2 accounted for 34.33% of total nitrogen, pyrrole nitrogen content was 30.69%, amine nitrogen and –NO accounted for 10.21% and 15.98%, respectively, and the rest was a small amount of NO3.
Compared with lignite raw coal, the types of nitrogen existing in nitric acid-modified lignite was quite different. The content of pyridine nitrogen and protonated pyridine on the surface of nitric acid-modified lignite was so little that it was not shown in the separation peak. The pyrrole nitrogen and –NO peak areas decreased, and new peaks of amine nitrogen, –NO2 and NO3 appeared, indicating that there was conversion of pyridine nitrogen and protonated pyridine to other types of nitrogen during the nitric acid modification process.
3.8. Effects of Different Modified Concentrations of Nitric Acid on the Surface Potential of Lignite
Zeta potential is an important aspect of adsorbent surface chemistry, which reflects the surface charge of the adsorbent. The electrostatic force plays an important role in the adsorption and purification of heavy metal ions. The negatively charged surface can provide electrostatic attraction to heavy metal ions, thereby enhancing the adsorption amount of heavy metal ions. At the same time, due to the dissociation of the chemical groups on the surface of the adsorbent, the change of the zeta potential can also reflect the change of the adsorbent surface chemical structure. The zeta potential of the lignite surface before and after nitric acid modification was determined. The measurement results are shown in Figure 11.
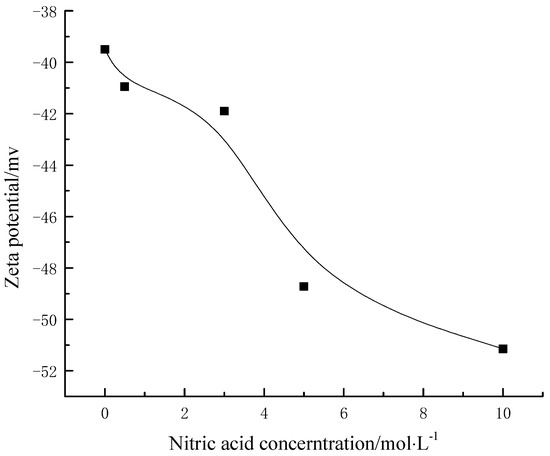
Figure 11.
Zeta potential of lignite and nitric acid-modified lignite.
It can be seen from Figure 11 that raw lignite was negatively charged because of a large amount of oxygen-containing functional groups that were present, and the absolute value of zeta potential increased with the increase of nitric acid concentration. From the analysis of FTIR and XPS, it was found that the content of oxygen-containing functional groups on the surface of lignite increased after nitric acid treatment [23]. This can be confirmed from the change of zeta potential. The negative charge was enhanced, causing the electrostatic attraction between the metal ions and the surface of the lignite.
3.9. Adsorption Capacity of Pb2+ on Different Modified Coal Samples
To elucidate the effects of adsorbent surface chemistry and pore structure on the adsorption of Pb2+ from aqueous solution, a single-solute experiment was conducted with coal samples modified by different concentrations of nitric acid. To compare single-solute adsorption results in a quantitative manner, the adsorption experiment was conducted under the same conditions. The adsorption capacity changes of Pb2+ on different concentrations of nitric acid-modified lignite are shown in Figure 12.
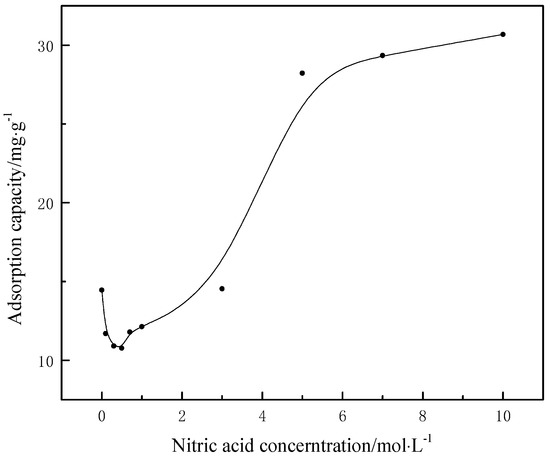
Figure 12.
The change in Pb2+ adsorption capacities with the modified concentration of nitric acid.
It can be seen from Figure 12 that with the increase of the modified concentration of nitric acid, the adsorption amount of Pb2+ on lignite samples tended to decrease first and then increase to the minimum value of 0.5 mol·L−1. In the previous analysis of the pore structure and surface properties of nitric acid-modified lignite, it was found that nitric acid modification increased the content of oxygen-containing functional groups on the lignite surface, while it decreased the specific surface area and pore volume of coal samples. When the modified concentration of nitric acid was less than 0.5 mol·L−1, the adsorption amount of Pb2+ on lignite decreased with the increase in nitric acid concentration. At this time, the concentration of nitric acid was low, which mainly played an acidic role, causing a reduction in the specific surface area of lignite and a decreased adsorption amount. When the modified nitric acid concentration was above 0.5 mol·L−1, the adsorption amount of Pb2+ on lignite increased with the increase in modified nitric acid concentration, and it increased rapidly in the range of 0.5 to 5.0 mol·L−1. At this time, nitric acid showed strong oxidizing properties. The surface of lignite was rapidly oxidized to produce a large number of polar oxygen-containing functional groups, and the adsorption amount of Pb2+ was enhanced. When the concentration of modified nitric acid was in the range of 5.0–10 mol·L−1, the surface chemistry functional group of lignite was close to oxidized saturation, and the growth rate of the Pb2+ adsorption amount slowed down. Before and after the modification, the adsorption amount of Pb2+ increased from 14.45 mg·g−1 to 30.68 mg·g−1. It suggested that nitric acid modification can obviously improve the adsorption property of lignite, and at the same time, the effects of pore structure and surface chemistry on the adsorption performance of the adsorbent.
The adsorption of Pb2+ on the surface of lignite was the result of both the pore structure and the surface chemistry of the adsorbent. At the beginning, the adsorption amount of Pb2+ decreased with the decrease in lignite-specific surface area. Next, the adsorption amount of Pb2+ was not continually reduced, while it greatly increased due to the increase in oxygen-containing functional groups on the surface of lignite. It indicated that the surface chemical structure played a greater role than the pore structure in the process of lead ion adsorption. This indicated that the removal of metal ions from aqueous solution by coal primarily involved electrostatic adsorption, ion exchange, and subsequent metal complex formation processes, and those processes are associated with oxygen-containing functional groups.
4. Conclusions
To evaluate pore structure and surface chemistry effects on the adsorption of Pb2+ from aqueous solution, a matrix of lignite with different pore structure and surface chemistry levels was studied. From the relationship observed between the adsorbent characteristics and the contaminate adsorption data in ultrapure water, a number of conclusions can be drawn.
The adsorption of Pb2+ on the surface of lignite is the result of both the pore structure and the surface chemistry of the adsorbent. The adsorption capacity of lignite to Pb2+ increased from 14.45 mg·g−1 to 30.68 mg·g−1 after modification. From the X-ray diffraction, static nitrogen adsorption, and Scanning electron microscope characterizations of the nitric acid-modified lignite, it was found that nitric acid entered the pores of coal and reacted with the mineral components, and the pore structure of the coal body was destroyed. The pores in the coal collapsed in a high, modified concentration. Both of the specific surface areas and pore volumes of each sample were decreased. This can partly explain the decrease in adsorption capacity of lignite in the low, modified concentration.
From the analysis of Fourier transform infrared spectroscopy, X-ray photoelectron spectroscopy, and the zeta potential test, it was confirmed that nitric acid modification of coal incorporated oxygen and nitrogen atoms in coal matrix. The surface of lignite was rapidly oxidized to produce a large number of polar oxygen-containing functional groups, such as hydroxyl groups and carboxyl groups, which enhanced the surface-level, negative electrical properties of lignite. The nitrification reaction between nitric acid and the lignite organic components introduced nitro groups on the surface of lignite, which also enhanced the surface polarity of lignite and its adsorption properties to metal ions.
The physical parameters of lignite, such as specific surface areas, pore volume, and pore size, do not characterize the lignite adsorption properties well. The adsorption model of Pb2+, the types of functional groups on the surface of adsorbent, and the quantity plays key roles in the adsorption of Pb2+ by lignite, which are determined between the adsorption capacity of Pb2+ and the number of oxygen-containing functional groups of lignite in the corresponding relationship.
Author Contributions
Data curation, G.L. and P.W.; Formal analysis, G.L. and H.X.; Investigation, G.L., P.W. and X.Z.; Methodology, B.H. and H.X.; Project administration, B.H.; Resources, H.X.; Software, X.Z.; Validation, X.Z.; Writing—original draft, P.W.; Writing—review & editing, G.L.
Funding
This work was supported by the National Natural Science Foundation of China (No. 51604280) and the Fundamental Research Funds for the Central Universities (No. 2016QH04).
Conflicts of Interest
The authors declare no conflict of interest.
References
- Ping, Z. Production and Application of Coal Humic Acid; Chemical Industry Press: Beijing, China, 1991; p. 28. [Google Scholar]
- Shuying, W.; Jinghong, L.; Yi, S. Adsorption Character of ShuLan Brown Coal for Heavy Metal Ions Such As Ni2+, Zn2+ and Pb2+. J. Northeast China Inst. Electr. Power Eng. 2004, 24, 85–91. [Google Scholar]
- Lumin, W.; Changliang, D.; Shujing, Y. Study of Longkou Lignite to Purify of Mercury-containing Waste Water. J. Yantai Univ. (Natl. Sci. Eng.) 1998, 2, 153–156. [Google Scholar]
- Polat, H.; Mlva, M.; Polat, M. Capacity and mechnism of phenol adsorption on lignite. Int. J. Miner. Proc. 2006, 79, 264–273. [Google Scholar] [CrossRef]
- DaoCheng, L.; JunFeng, L.; ZhongYuan, L. Study on the Treatment of Chromium (VI)-containing Wastewater Use Sulfonated Lignite. Coal Chem. Ind. 2010, 38, 36–38. [Google Scholar]
- Choudhury, D.; Srivastava, S.K.; Prasad, R. Removal of heavy metals in wastewater by its adsorption: On nitric acid oxidized coal. Indian J. Environ. Prot. 2013, 33, 804–815. [Google Scholar]
- Kus, J.; Misz-Kennan, M. Coal weathering and laboratory (artificial) coal oxidation. Int. J. Coal Geol. 2017, 171, 12–36. [Google Scholar] [CrossRef]
- Ward, C.R. Mineral matter in triassic and tertiary low-rank coals from South Australia. Int. J. Coal Geol. 1992, 20, 185–208. [Google Scholar] [CrossRef]
- Aparna, M.; Srivastava, S.K.; Udaybhanu, G. Removal of cadmium ions from waste water using raw and treated coals as adsorbents. Int. J. Chem. Sci. 2011, 9, 265–280. [Google Scholar]
- Rouquerol, J.; Avnir, D.; Fairbridge, C.W.; Everett, D.H.; Haynes, J.M.; Pernicone, N.; Ramsay, J.D.F.; Sing, K.S.W.; Unger, K.K. Physical and biophysical chemistry division commission on colloid and surface chemistry including catalysis. Pure Appl. Chem. 1994, 66, 1739–1758. [Google Scholar] [CrossRef]
- Sing, K.S.W.; Everett, D.H.; Haul, R.A.W.; Moscou, L.; Pierotti, R.A.; Rouquerol, J.; Siemieniewska, T. Reporting Physisorption Data for Gas/Solid Systems with Special Reference to the Determination of Surface Area and Porosity. Pure Appl. Chem. 1985, 57, 603–619. [Google Scholar] [CrossRef]
- Chunzhu, L. Victoria Lignite Science Progress; Chemical Industry Press: Beijing, China, 2009; p. 26. [Google Scholar]
- Yuliani, G.; Garnier, G.; Chaffee, A.L. Utilization of raw and dried Victorian brown coal in the adsorption of model dyes from solution. J. Water Proc. Eng. 2017, 15, 43–48. [Google Scholar] [CrossRef]
- Hong, Z.; Hulin, L.; Zeshen, O.; Wang, D.Z. Study on Surface Modification of Different Rank Coals by Using FTIR. J. China Univ. Min. Technol. 2001, 30, 365–369. [Google Scholar]
- Xuedong, Z.; Zibin, Z.; Chongjia, H.; Chengfang, Z. Quantitative Determination of Oxygen-containing Functional Groups in Coal by FTIR Spectroscopy. J. Fuel Chem. Technol. 1999, 4, 335–339. [Google Scholar]
- Xuqin, D.; Zune, W.; Chunbao, S. Surface Properties of Macerals from Shenfu Coal. J. China Univ. Min. Technol. 2007, 36, 630–635. [Google Scholar]
- Chen, S.; Tang, L.; Tao, X.; Chen, L.; Yang, Z.; Li, L. Effect of oxidation processing on the surface properties and floatability of Meizhiyou long-flame coal. Fuel 2017, 210, 177–186. [Google Scholar] [CrossRef]
- Xuqin, D.; Zuna, W. XPS analysis of oxygen contained functional group in coal macerals. J. Liaoning Tech. Univ. (Natl. Sci.) 2010, 29, 498–501. [Google Scholar]
- Biniak, S.; Szymański, G.; Siedlewski, J.; Świątkowski, A. The characterization of activated carbons with oxygen and nitrogen surface groups. Carbon 1997, 35, 1799–1810. [Google Scholar] [CrossRef]
- László, K.; Tombácz, E.; Josepovits, K. Effect of activation on the surface chemistry of carbons from polymer precursors. Carbon 2001, 39, 1217–1228. [Google Scholar] [CrossRef]
- Mei, L.; Junhe, Y.; Qifeng, Z.; Hai-zhou, C.; Hui, S. XPS study on transformation of N- and S-functional groups during pyrolysis of high sulfur New Zealand coal. J. Fuel Chem. Technol. 2013, 41, 1287–1293. [Google Scholar]
- Kelemen, S.R.; Gorbaty, M.L.; Kwiatek, P.J. Quantification of Nitrogen Forms in Argonne Premium Coals. Energy Fuels 1994, 8, 896–906. [Google Scholar] [CrossRef]
- Qihui, L.; Guoguang, W.; Zhiqiang, S.; Guangyou, W.; Hongfeng, X.; Yongjian, Z. Study on the influence of coalification degree and particle size on zeta potential of coal surface. Energy Technol. Manag. 2007, 3, 81–82. [Google Scholar]


© 2019 by the authors. Licensee MDPI, Basel, Switzerland. This article is an open access article distributed under the terms and conditions of the Creative Commons Attribution (CC BY) license (http://creativecommons.org/licenses/by/4.0/).