Technical Note

Experimental Study on the Shear-Flow Coupled Behavior of Tension Fractures Under Constant Normal Stiffness Boundary Conditions

1
State Key Laboratory of Mining Disaster Prevention and Control Co-founded by Shandong Province and the Ministry of Science and Technology, Shandong University of Science and Technology, Qingdao 266510, China
2
School of Engineering, Nagasaki University, Nagasaki 852-8521, Japan
*
Author to whom correspondence should be addressed.
Processes 2019, 7(2), 57; https://doi.org/10.3390/pr7020057
Submission received: 20 December 2018 / Revised: 16 January 2019 / Accepted: 16 January 2019 / Published: 22 January 2019
(This article belongs to the Special Issue Fluid Flow in Fractured Porous Media)

Abstract

:
This study experimentally investigated the effects of fracture surface roughness, normal stiffness, and initial normal stress on the shear-flow behavior of rough-walled rock fractures. A series of shear-flow tests were performed on two rough fractures, under various constant normal stiffness (CNS) boundary conditions. The results showed that the CNS boundary conditions have a significant influence on the mechanical and hydraulic behaviors of fractures, during shearing. The peak shear stress shows an increasing trend with the increases in the initial normal stress and fracture roughness. The residual shear stress increases with increasing the surface roughness, normal stiffness, and initial normal stress. The dilation of fracture is restrained more significantly under high normal stiffness and initial normal stress conditions. The hydraulic tests show that the evolutions of transmissivity and hydraulic aperture exhibit a three-stage behavior, during the shear process—a slight decrease stage due to the shear contraction, a fast growth stage due to shear dilation, and a slow growth stage due to the reduction rate of the mechanical aperture increment. The transmissivity and hydraulic aperture decreased, gradually, as the normal stiffness and initial normal stress increase.

1. Introduction

Underground fracture rock masses consist of the intact rock matrix and various discontinuities. Discontinuities such as joints and fractures play a significant role in the hydro-mechanical behaviors of a host rock mass [1,2,3,4,5,6,7]. Hence, the analysis of the shear-flow behaviors of rock fractures is critical to many mass and energy transport engineering activities, such as nuclear waste disposal, oil, natural gas production, and geothermal energy extraction [8,9,10,11,12].
Many efforts have been made to take into account the influence of shear displacement on fluid flow in a single fracture [13,14,15,16,17,18,19]. Yeo et al. [13] carried out radial and unidirectional flow tests through single rough fractures. The results showed that with increasing shear displacement, the fracture aperture became heterogeneous and anisotropic, and the permeability, in the direction perpendicular to the shear, was larger than that along the shear direction. Esaki et al. [14] developed a laboratory technique for coupled shear-flow tests, to investigate the coupled effect of joint shear deformation, and dilatancy, on the hydraulic conductivity of rock joints. The results showed that the conductivity increased, rapidly, for the first 5 mm of shear displacement, and then gradually became a constant value, with continuous increase in the shear displacement. Li et al. [15] conducted a series of shear-flow coupling tests, to evaluate the influence of morphological properties of rock fractures, on their hydro-mechanical behavior. The results showed that the contact ratio drops rapidly at the very beginning of the shear and then kept a small value. However, the transmissivity changed inversely with the contact ratio change, during shearing. Javadi et al. [16] conducted coupled shear-flow tests on three granite specimens, to investigate the variation in the critical Reynolds number (Rec), during the shear process, under different normal stresses. It was found that the Rec was in the range of 0.001 to 25, as the shear displacement increased from 0 to 20 mm. Similar shear-flow tests were also conducted by Rong et al. [17]. They suggested the Rec ranged from 1.5 to 13.0, as shear displacement increased from 0 to 10.9 mm.
Most of these shear-flow tests were conducted under constant normal load (CNL) boundary conditions, in which the normal load applying on the fracture surface was constant, during shearing. However, the CNL boundary condition was only appropriate for the non-reinforced rock slope or planar fractures, with no dilation during shearing [20,21,22,23,24]. For deep underground opening or rock anchor-reinforced slopes, the loads acting normal to the direction of shear were not constant, and the shear-induced dilation acted against the normal stiffness of the surround rock mass. The rock joints were subject to a variable normal load and the stiffness of the surrounding rock mass could significantly affect the shear behavior. In this case, during the shear process, the constant normal stiffness (CNS) boundary condition should be selected, rather than the CNL boundary condition. Some previous studies have experimentally investigated the shear behavior under CNS boundary conditions [20,21,22,25,26,27]. It was reported that the shear behavior was affected by the fracture surface roughness, normal stiffness, and initial normal stress. Note that the fracture aperture and its evolution during shear, under the CNS condition, was far more complicated than that under the CNL condition. On the one hand, shear-induced dilation could increase the fracture aperture. On the other hand, increasing the normal stress induced severe asperity degradation, which reduced joint dilation. However, few studies focused on the hydraulic behavior of fracture, during shear, under the CNS boundary condition. Li et al. [28] and Koyama et al. [29] investigated the effect of the boundary condition on the hydraulic behavior of the joint, during the shear process. The results showed that the hydraulic aperture under the CNL condition was larger than the CNS condition. Olsson et al. [30,31] investigated the effects of normal stiffness and initial normal stress on the hydraulic behavior of joint, during the shear process. The results showed that the transmissivity decreased with increasing normal stiffness and the initial normal stress. Sato et al. [32] studied the effect of roughness on the hydraulic behavior, under the CNS and the CNL condition. They expressed that the permeability of joints was larger for rougher fractures. However, the effects of surface roughness, normal stiffness, and initial normal stress on the shear-flow behavior were usually studied independently, and the corporate effects of these factors on the shear-flow behavior of fractures needed to be further investigated.
In this study, we conducted shear-flow tests on two types of fractures, with different surface roughness, under the CNS boundary conditions. For each type of fracture specimen, a series of hydraulic tests were performed for the different shear displacements (0 ~ 20 mm), under different normal stiffness (1.0, 2.0, 3.0 MPa/mm), and initial normal stresses (1.0, 2.0, 3.0 MPa). Finally, the effects of shear displacement, joint surface roughness, normal stiffness, and initial normal stress on mechanical and hydraulic characteristics of fractures were analyzed.

2. Experiment

2.1. Specimen Preparation

Two types of granite fractures (labeled as G1 and G3) were created using the Brazilian test. The fracture specimens were composed of upper and lower parts—200 mm in length, 100 mm in width, and 100 mm in height. In order to carry out repeated tests, under various boundary conditions, using specimens that had similar surface geometry, artificial replicas were manufactured by a mixture of plaster, water, and retardant, with a weight ratio of 1: 0.2: 0.005. Table 1 lists the physico-mechanical properties of these rock-like specimens.
Replica surface geometries were scanned using a high resolution 3D laser scanning profilometer system [25]. The scanning intervals in both X and Y axes were set to be 0.5 mm. Based on the scanned data, the surface topographies of the two replica of the tension fractures are shown in Figure 1a,b. To quantify the roughness of the rock joints, the Joint Roughness Coefficient (JRC) values of the replicas were evaluated using the replica profiles, which were obtained by the scanning data, along the length direction. The JRC was calculated according to the equations proposed by Tse and Cruden [33], written as:
Z 2 = [ 1 ( n 1 ) ( Δ x ) 2 i = 1 n 1 ( z i + 1 z i ) 2 ] 1 / 2
JRC = 32.2 + 32.47 log Z 2
where Z 2 is the root mean square slope of the profiles, based on the extracted data, zi represent the coordinates of the fracture surface profile, n is the number of the data points, and Δ x is the interval of the data points. The mean JRC values of the fractures G1 and G3 are 3.21 and 7.36, respectively.

2.2. Test Equipment and Procedures

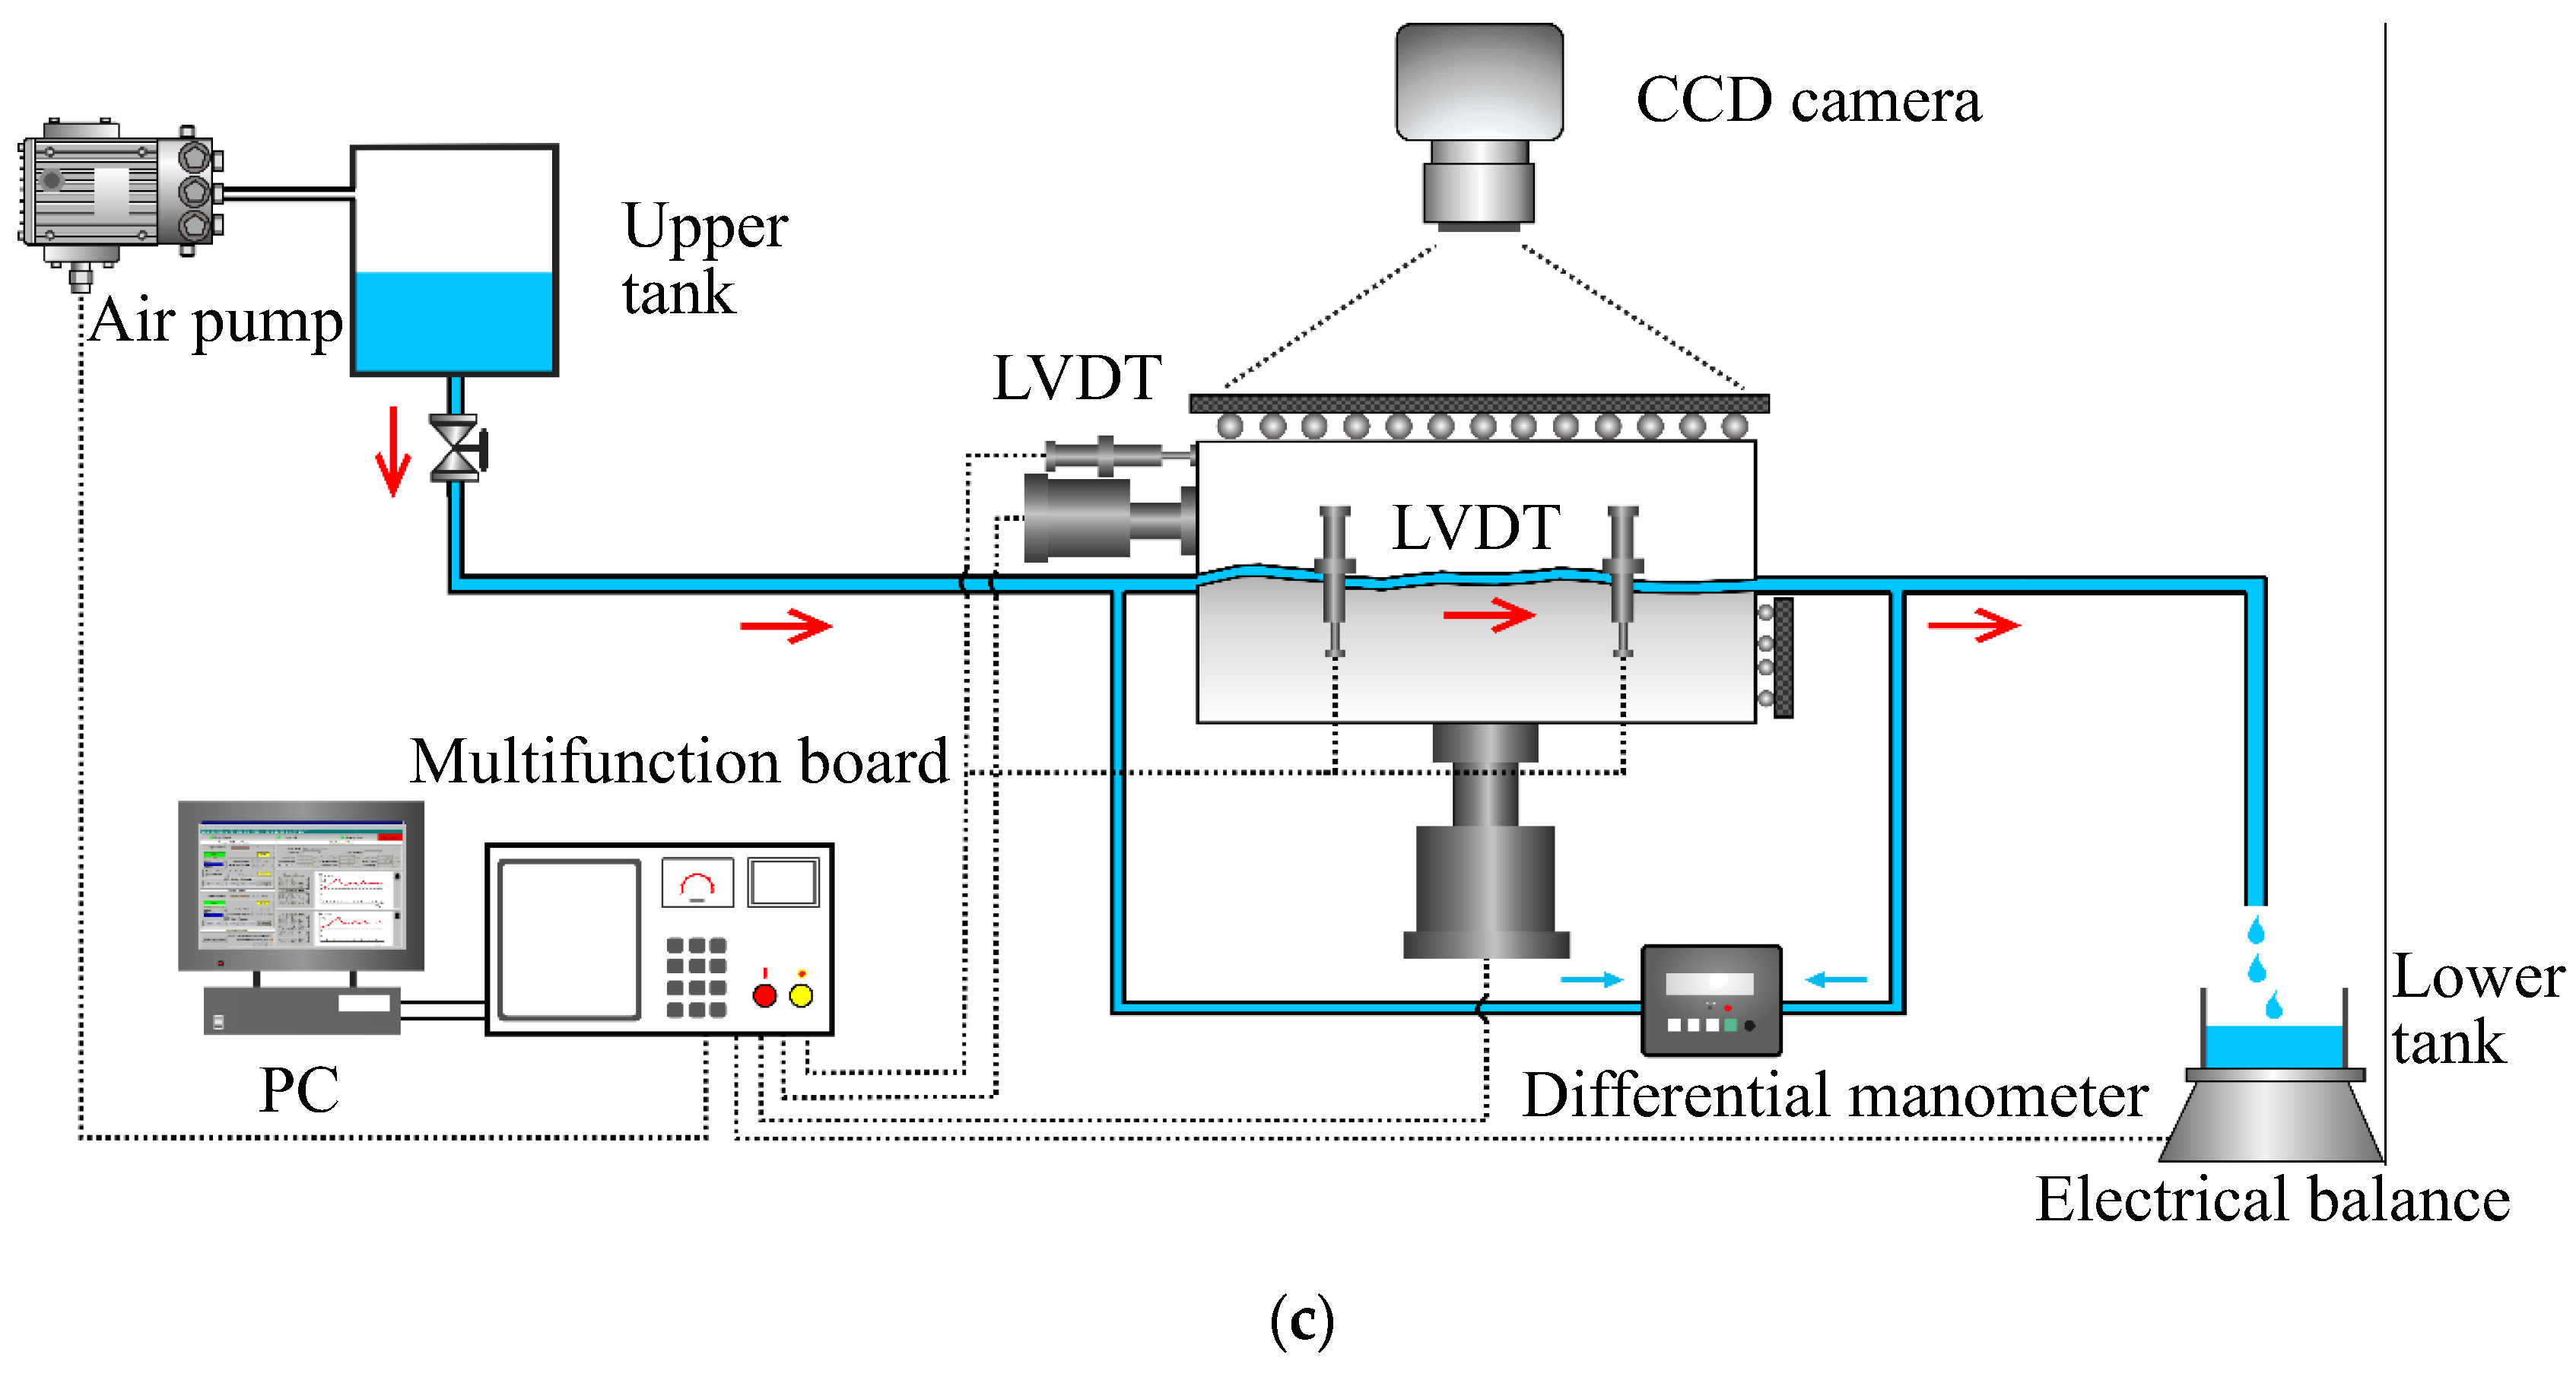
The shear-flow coupled tests under the CNS conditions were carried out on the servo-controlled shear-flow test system, in the Nagasaki University, as shown in Figure 1c. The test system mainly consisted of three units—a hydraulic-servo actuator unit, a hydraulic testing unit, and a visualization unit. The hydraulic-servo actuator unit includes horizontal and vertical load jacks, to apply the shear and normal loads, through a servo-controlled hydraulic pump. The capacity of both the normal and the shear loads was 200 kN, with a precision of 99%. The shear and normal displacements were monitored by three linear variable differential transformers (LVDTs), with an accuracy of 0.001 mm. Two LVDTs were used to monitor the normal displacement. The capacities of the shear and normal LVDTs were 20 mm and 10 mm, respectively. In this system, the CNS boundary condition was achieved by detecting the signal of normal displacement, during shearing, and servo-controlling the normal load applied to the specimen.
The change in the normal stress, due to the application of normal stiffness ( k n ) was calculated as follows [1]:
Δ P n = k n · Δ δ n
P n ( t + Δ t ) = P n ( t ) + Δ P n
where Δ P n and Δ δ n are changes in the normal load and the normal displacement, respectively.
The shear-flow tests were conducted on the two sets of replicas, with their different roughness, under the various boundary conditions. The experimental cases and their corresponding boundary conditions are shown in Table 2. The flow tests were conducted, under a constant water head of 0.3 m, during shearing. The shear displacement increased from 0 to 20 mm, with an interval of 1 mm. The shear rate was 0.5 mm/min. The outflow of the water was measured using an electrical balance that had a precision of 0.01 g. Numerous shear-flow tests were conducted using this testing system, showing a good sealing effect in these test studies [15,28,34,35].

3. Experimental Results

3.1. Effect of the Normal Stiffness on the Shear Characteristics

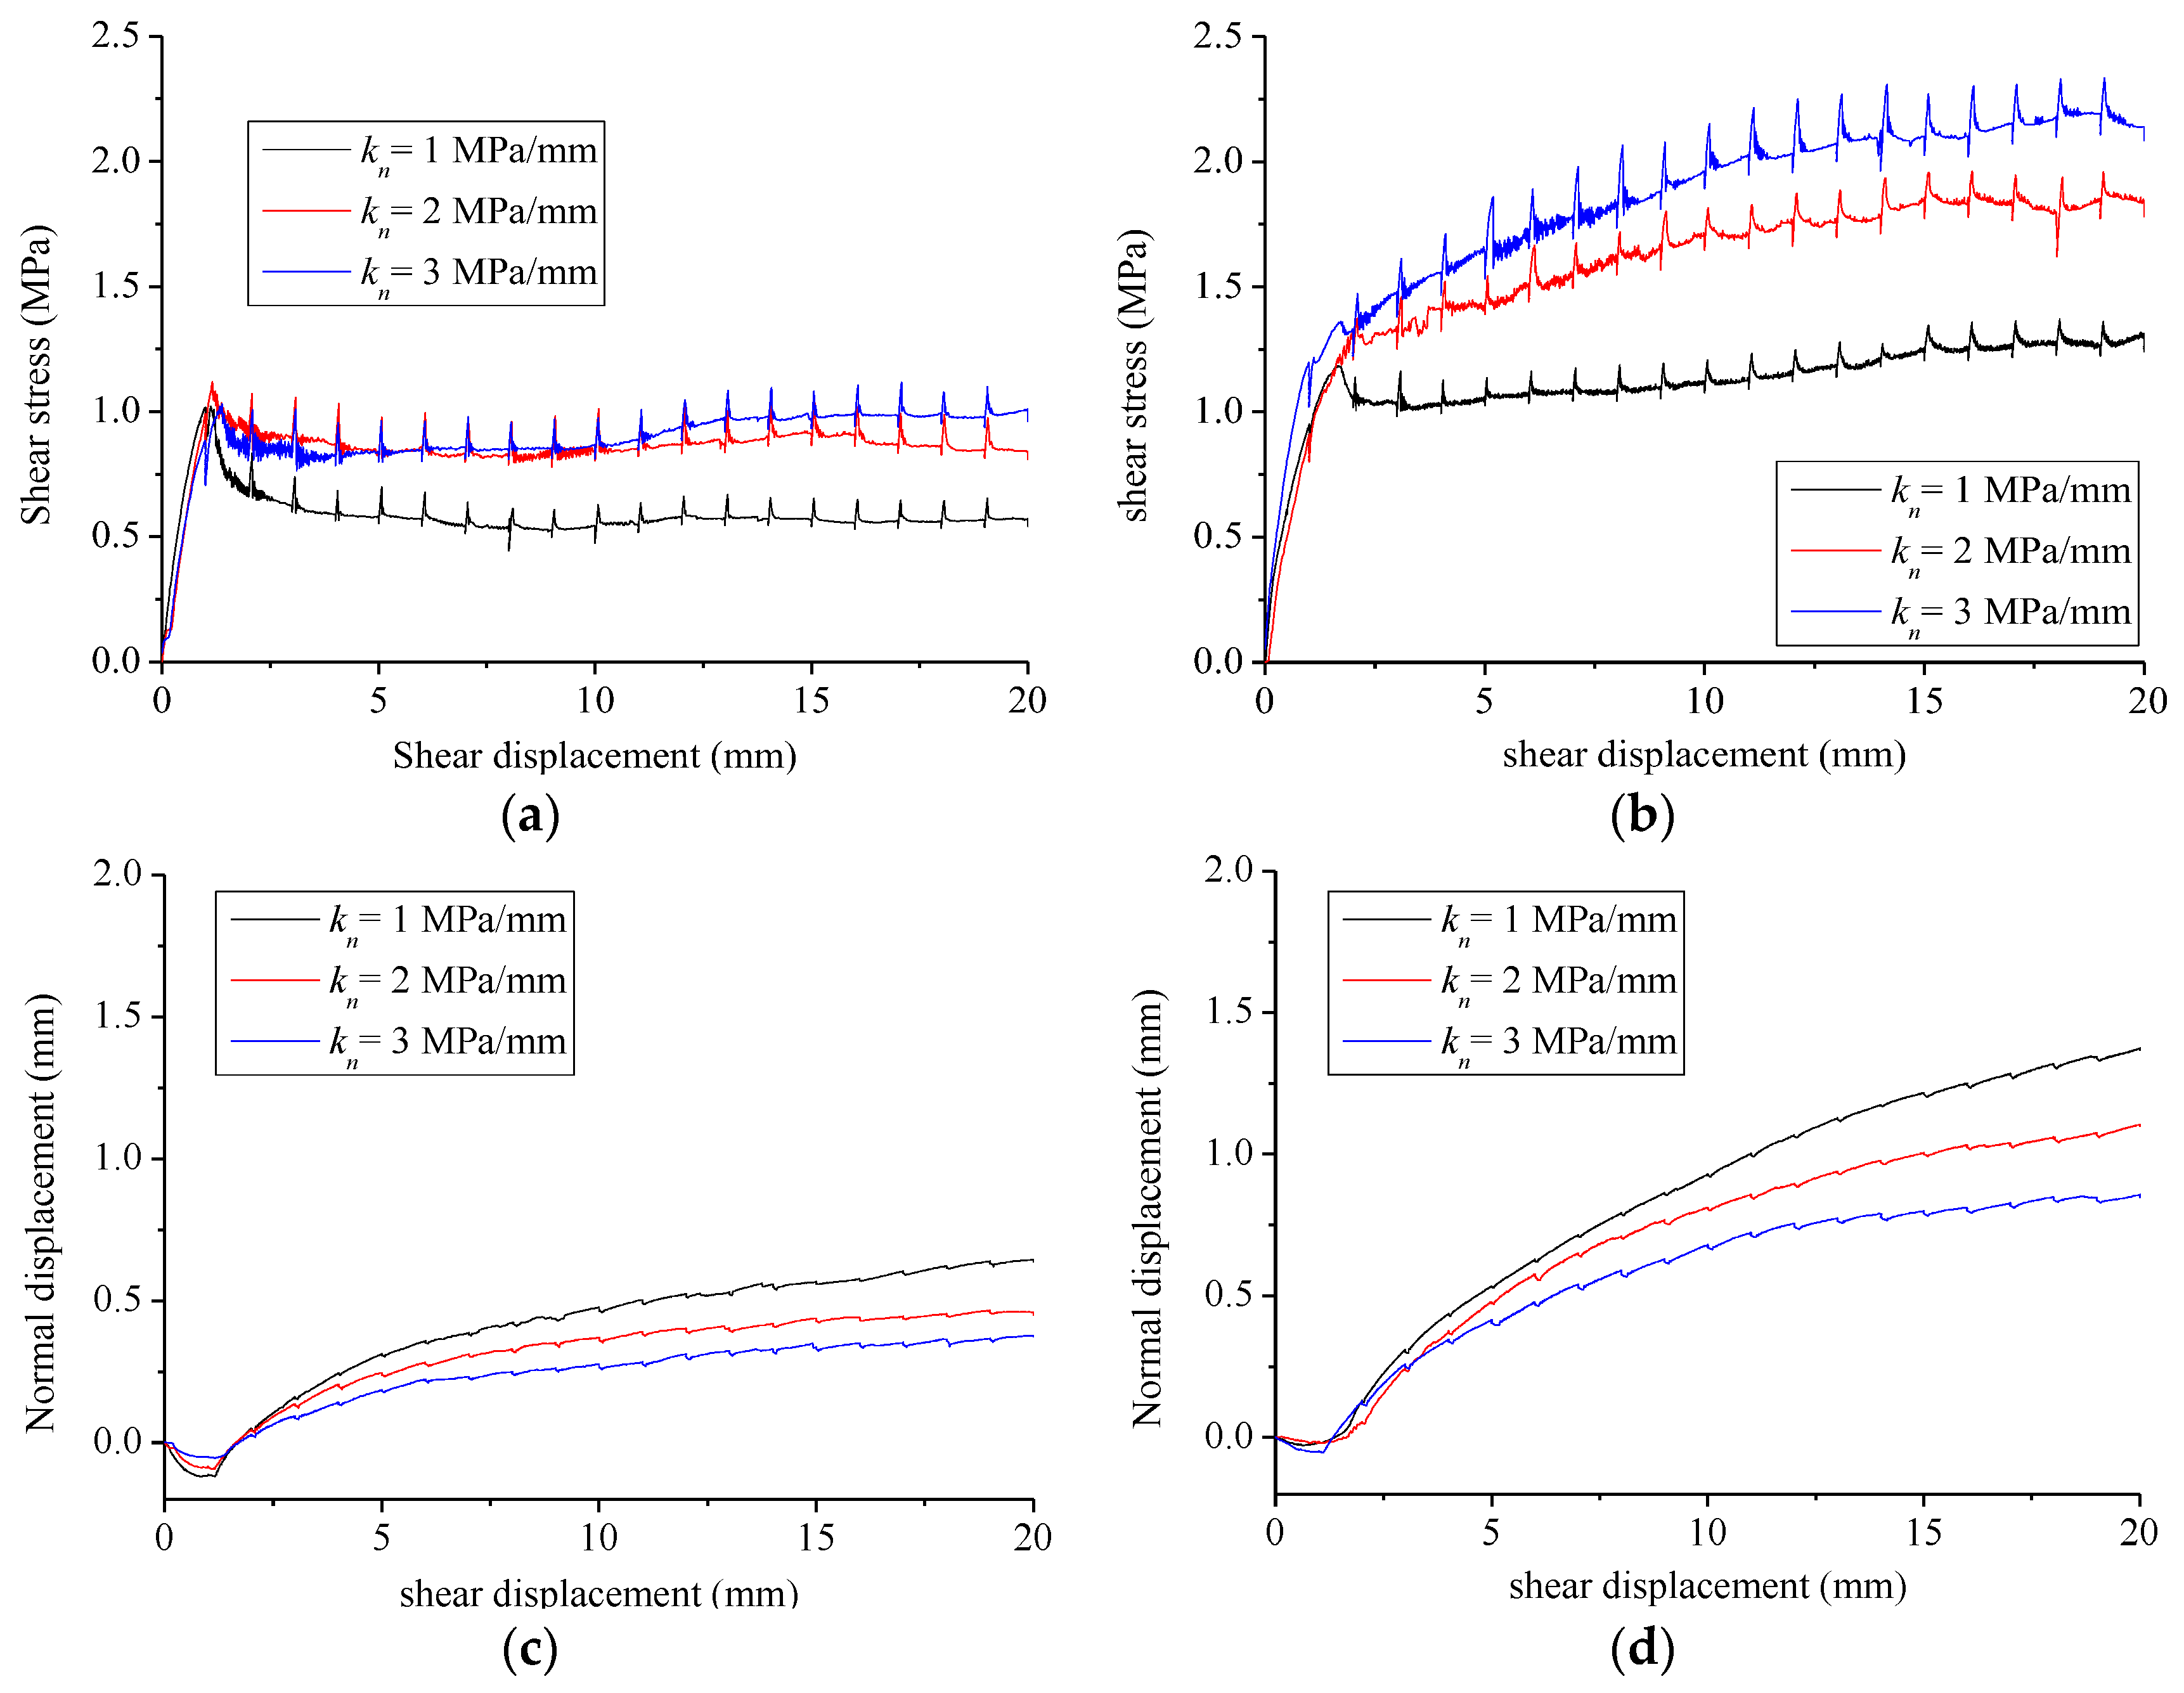
Figure 2 shows the results of the shear mechanical properties of the fractures G1 and G3, under different normal stiffness, with an initial normal stress of 1 MPa. In this study, the peck shear stress was defined as the point of shear stress, with a sharp change in curvature [20]. As shown in Figure 2a,b, in the pre-peak range, the shear stress increased linearly to the peak value, at the very beginning of shear. The test results indicate that the peak shear stress did not show obvious tendencies with respect to the normal stiffness. The peak shear stress values were similar, under various normal stiffness conditions. This is because the normal stress was approximately the same at the peak shear displacement (Figure 2e,f). In the post-peak range, the post shear strength was related to the fracture surface roughness and normal stiffness. For the relatively smooth fracture G1, when the normal stiffness was small (kn = 1 MPa/mm), the shear strength abruptly increased to the peak, and then gradually decreased to the residual stress stage. With increase in the normal stiffness, the post peak strength decreased slightly, followed by a gradual increase. However, for the relatively rough fracture G3, as the normal stiffness increased, the post-peak strength grew, appreciably, with increasing shear displacement. This phenomenon showed that a higher value of the normal stiffness and larger roughness of the fracture surfaces indicate a more pronounced stress hardening behavior. It was also found that the residual shear stress showed an increasing trend, with increase in the value of the JRC and the normal stiffness.
The relationship between normal displacement and shear displacement are shown in Figure 2c,d. For all test cases, the normal displacement slightly decreased in the pre-peak stage and then increases, gradually, with increasing shear displacement. The normal displacement decrease was due to the deformation of the asperity and surface interlocking, at the beginning of the application of the shear load. With continuous increase in the shear displacement, the normal displacement increased due to shear-induced dilation. As the normal stiffness increased, the increment of normal displacement decreased, whereas the increasing rate of normal stress increased (Figure 2e,f). This indicates that dilation was restrained at the higher normal stiffness condition. Additionally, the rougher the replica surface, the larger dilation and normal stress that could be obtained.

3.2. Effect of the Initial Normal Stress on the Shear Characteristics

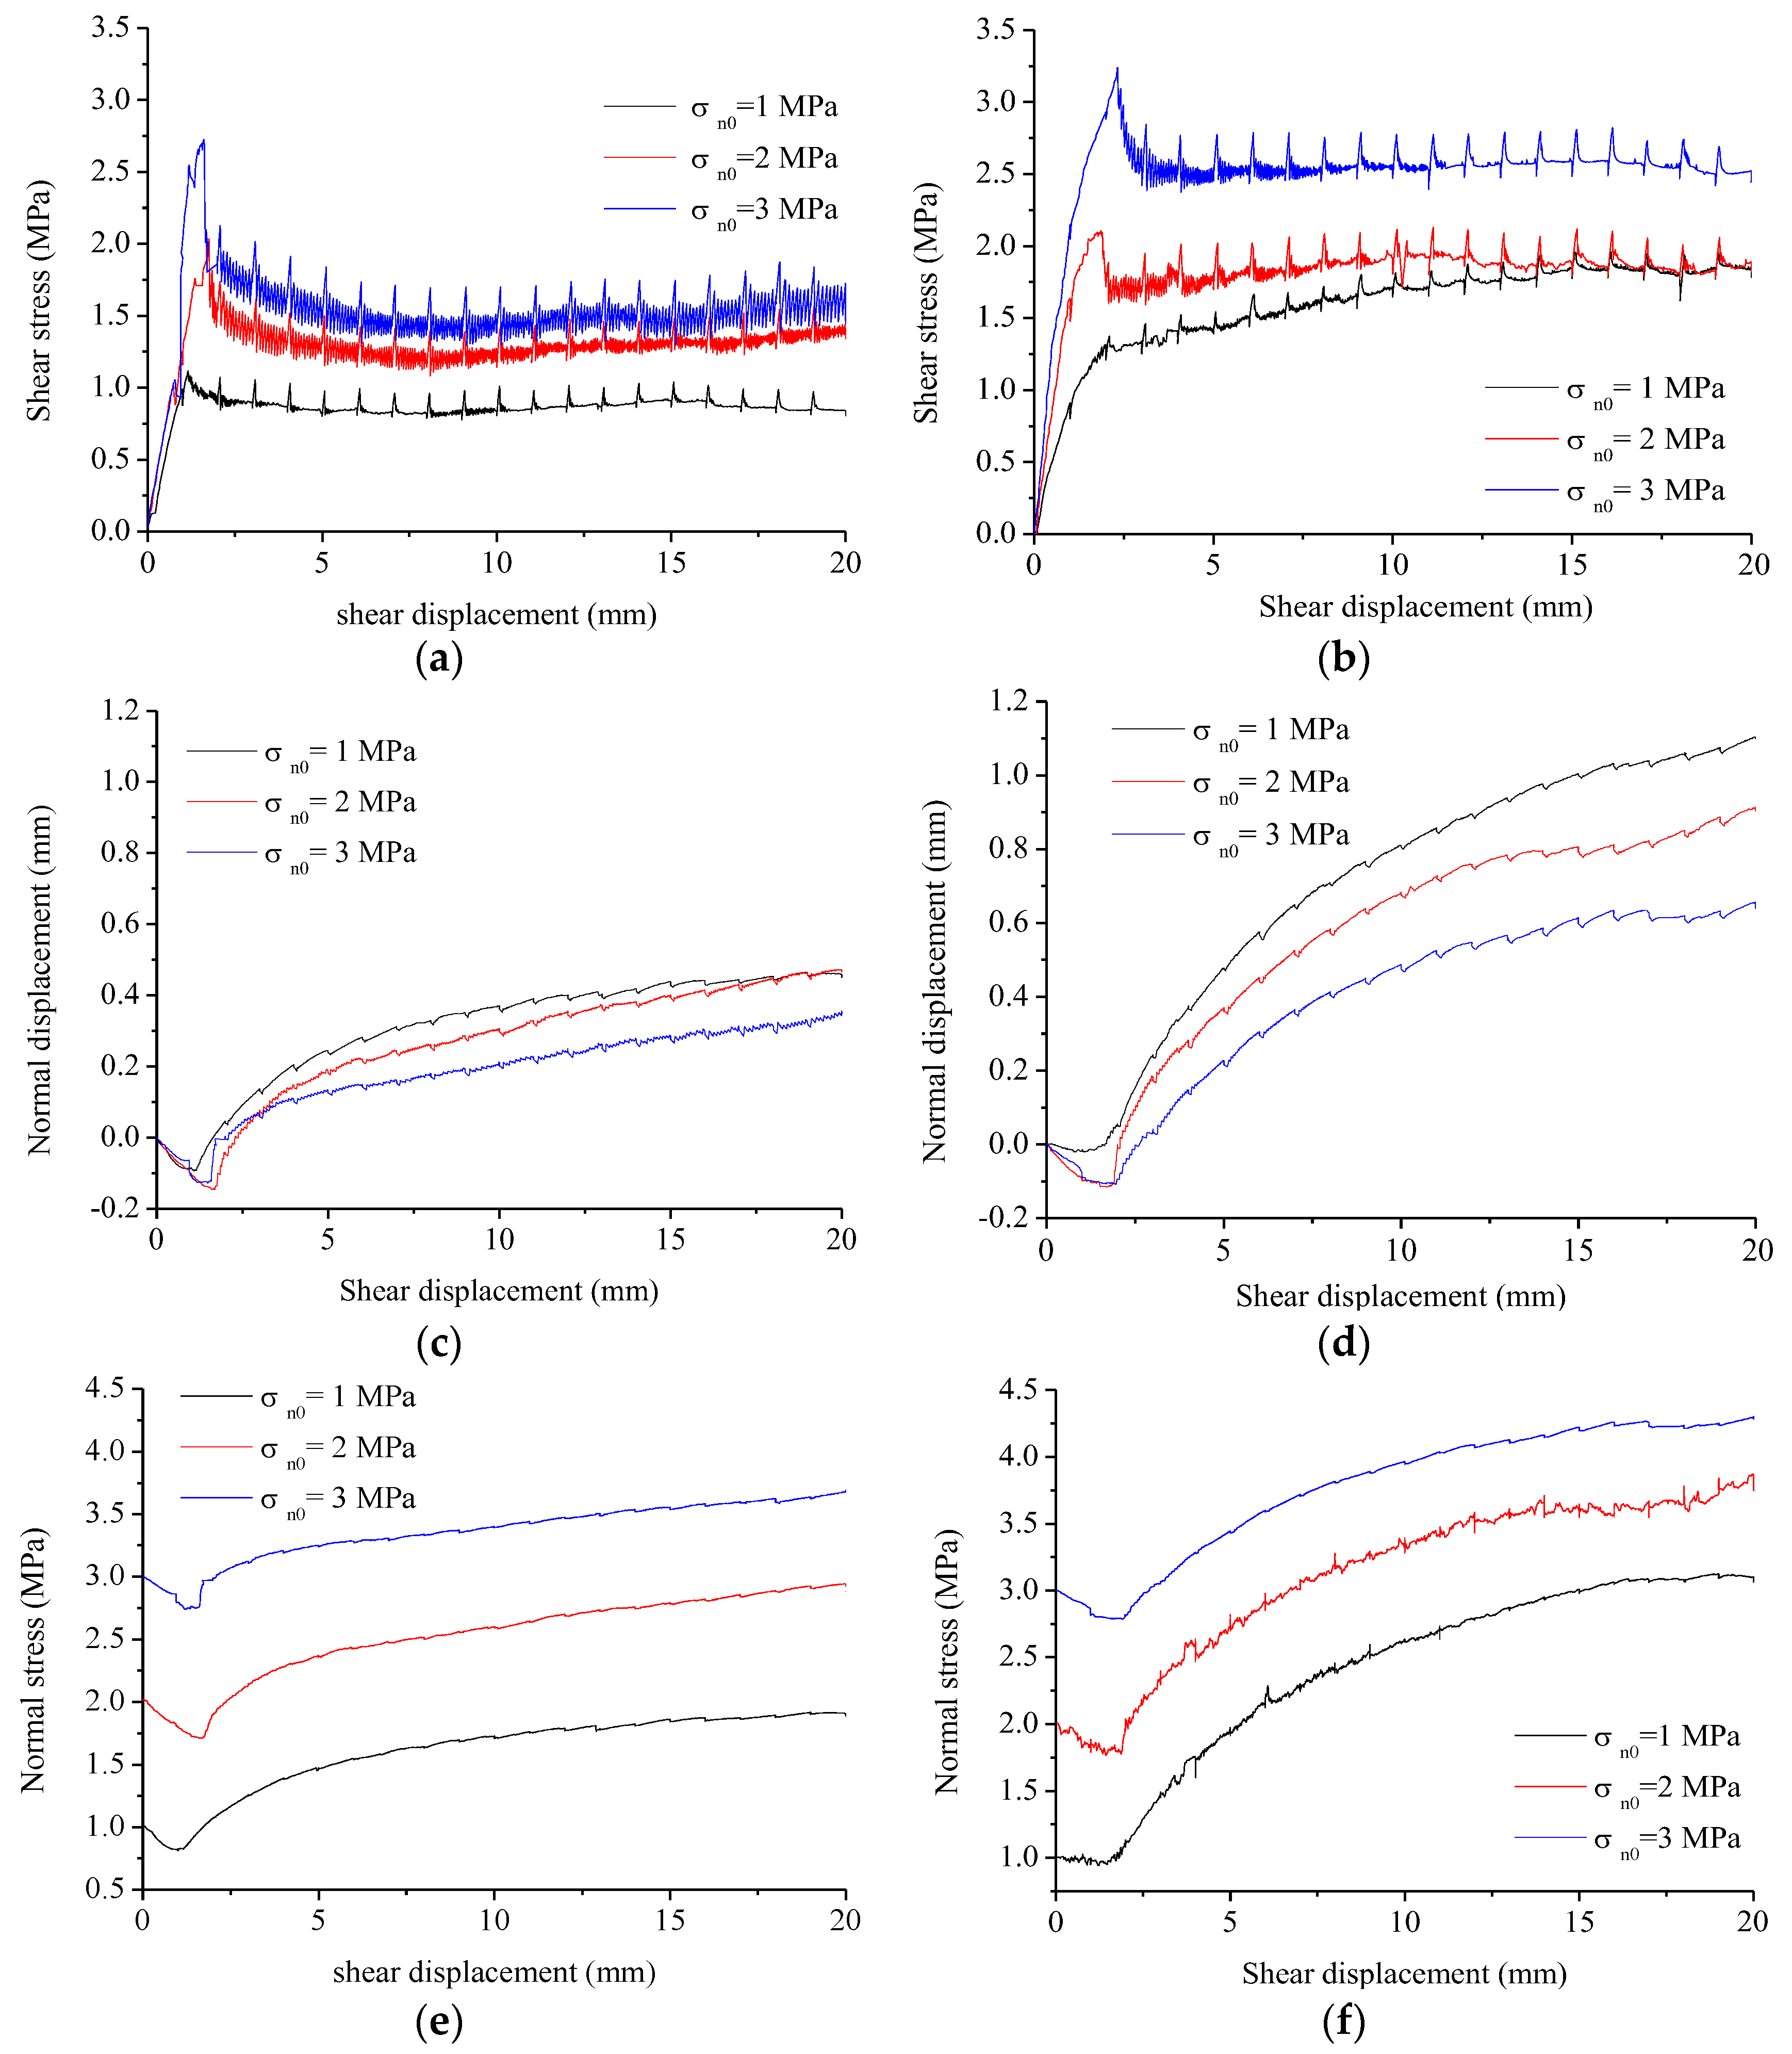
Figure 3 shows the shear mechanical properties of the fracture G1 and G3, under different initial normal stress, with a constant normal stiffness of 2 MPa/mm. As shown in Figure 3a,b, the shear stress was related to the initial normal stress and the replica fracture surface roughness. The peak shear stress and residual shear stress became larger, with an increase in the initial normal stress and JRC value. In the post-peak range, the test results indicated that the high initial normal stress condition increased the tendency toward the stress softening behavior. The transition from stress hardening to stress softening behavior was more obvious with an increase in the initial normal stress, for the rougher fracture G3.
Figure 3c,d show the relationship between normal displacement and shear displacement. The increasing rate of dilation decreased as the initial normal stress increased. For the rougher fracture G3, the dilation was larger than the fracture G1, under the same initial normal stress condition. Comparison with the dilation results, under different normal stiffness conditions, showed that the influence of the initial normal stress, on dilation, was more obvious than the normal stiffness. This was because the normal stress increased more significantly, according to Equations (3) and (4), and more significant failure of asperities was created, under higher normal stress conditions.

3.3. Evolution of Transmissivity during the Shear-Flow Tests

For a steady laminar flow through a single fracture, the flow rate is considered to be linearly proportional to the cubic of the fracture aperture, which is the cubic law [36,37,38], written as:
Q = Δ P L μ   w b h 3 12
where Q is volumetric flow rate, Δ P is the pressure drop along the flow direction, w is the fracture width, b h is the hydraulic aperture, L is the fracture length over which the pressure drop takes place, and μ is the viscosity of the fluid. The transmissivity T equals to the term w b h 3 / 12 in Equation (5), which is an important parameter to estimate the flow characteristics [36].
T = Q μ Pw = w b h 3 12
Note that the fluid flow patch, in the shear direction, will progressively become short, during shear. Therefore, the transmissivity and the hydraulic aperture are calculated using the actual length [34].
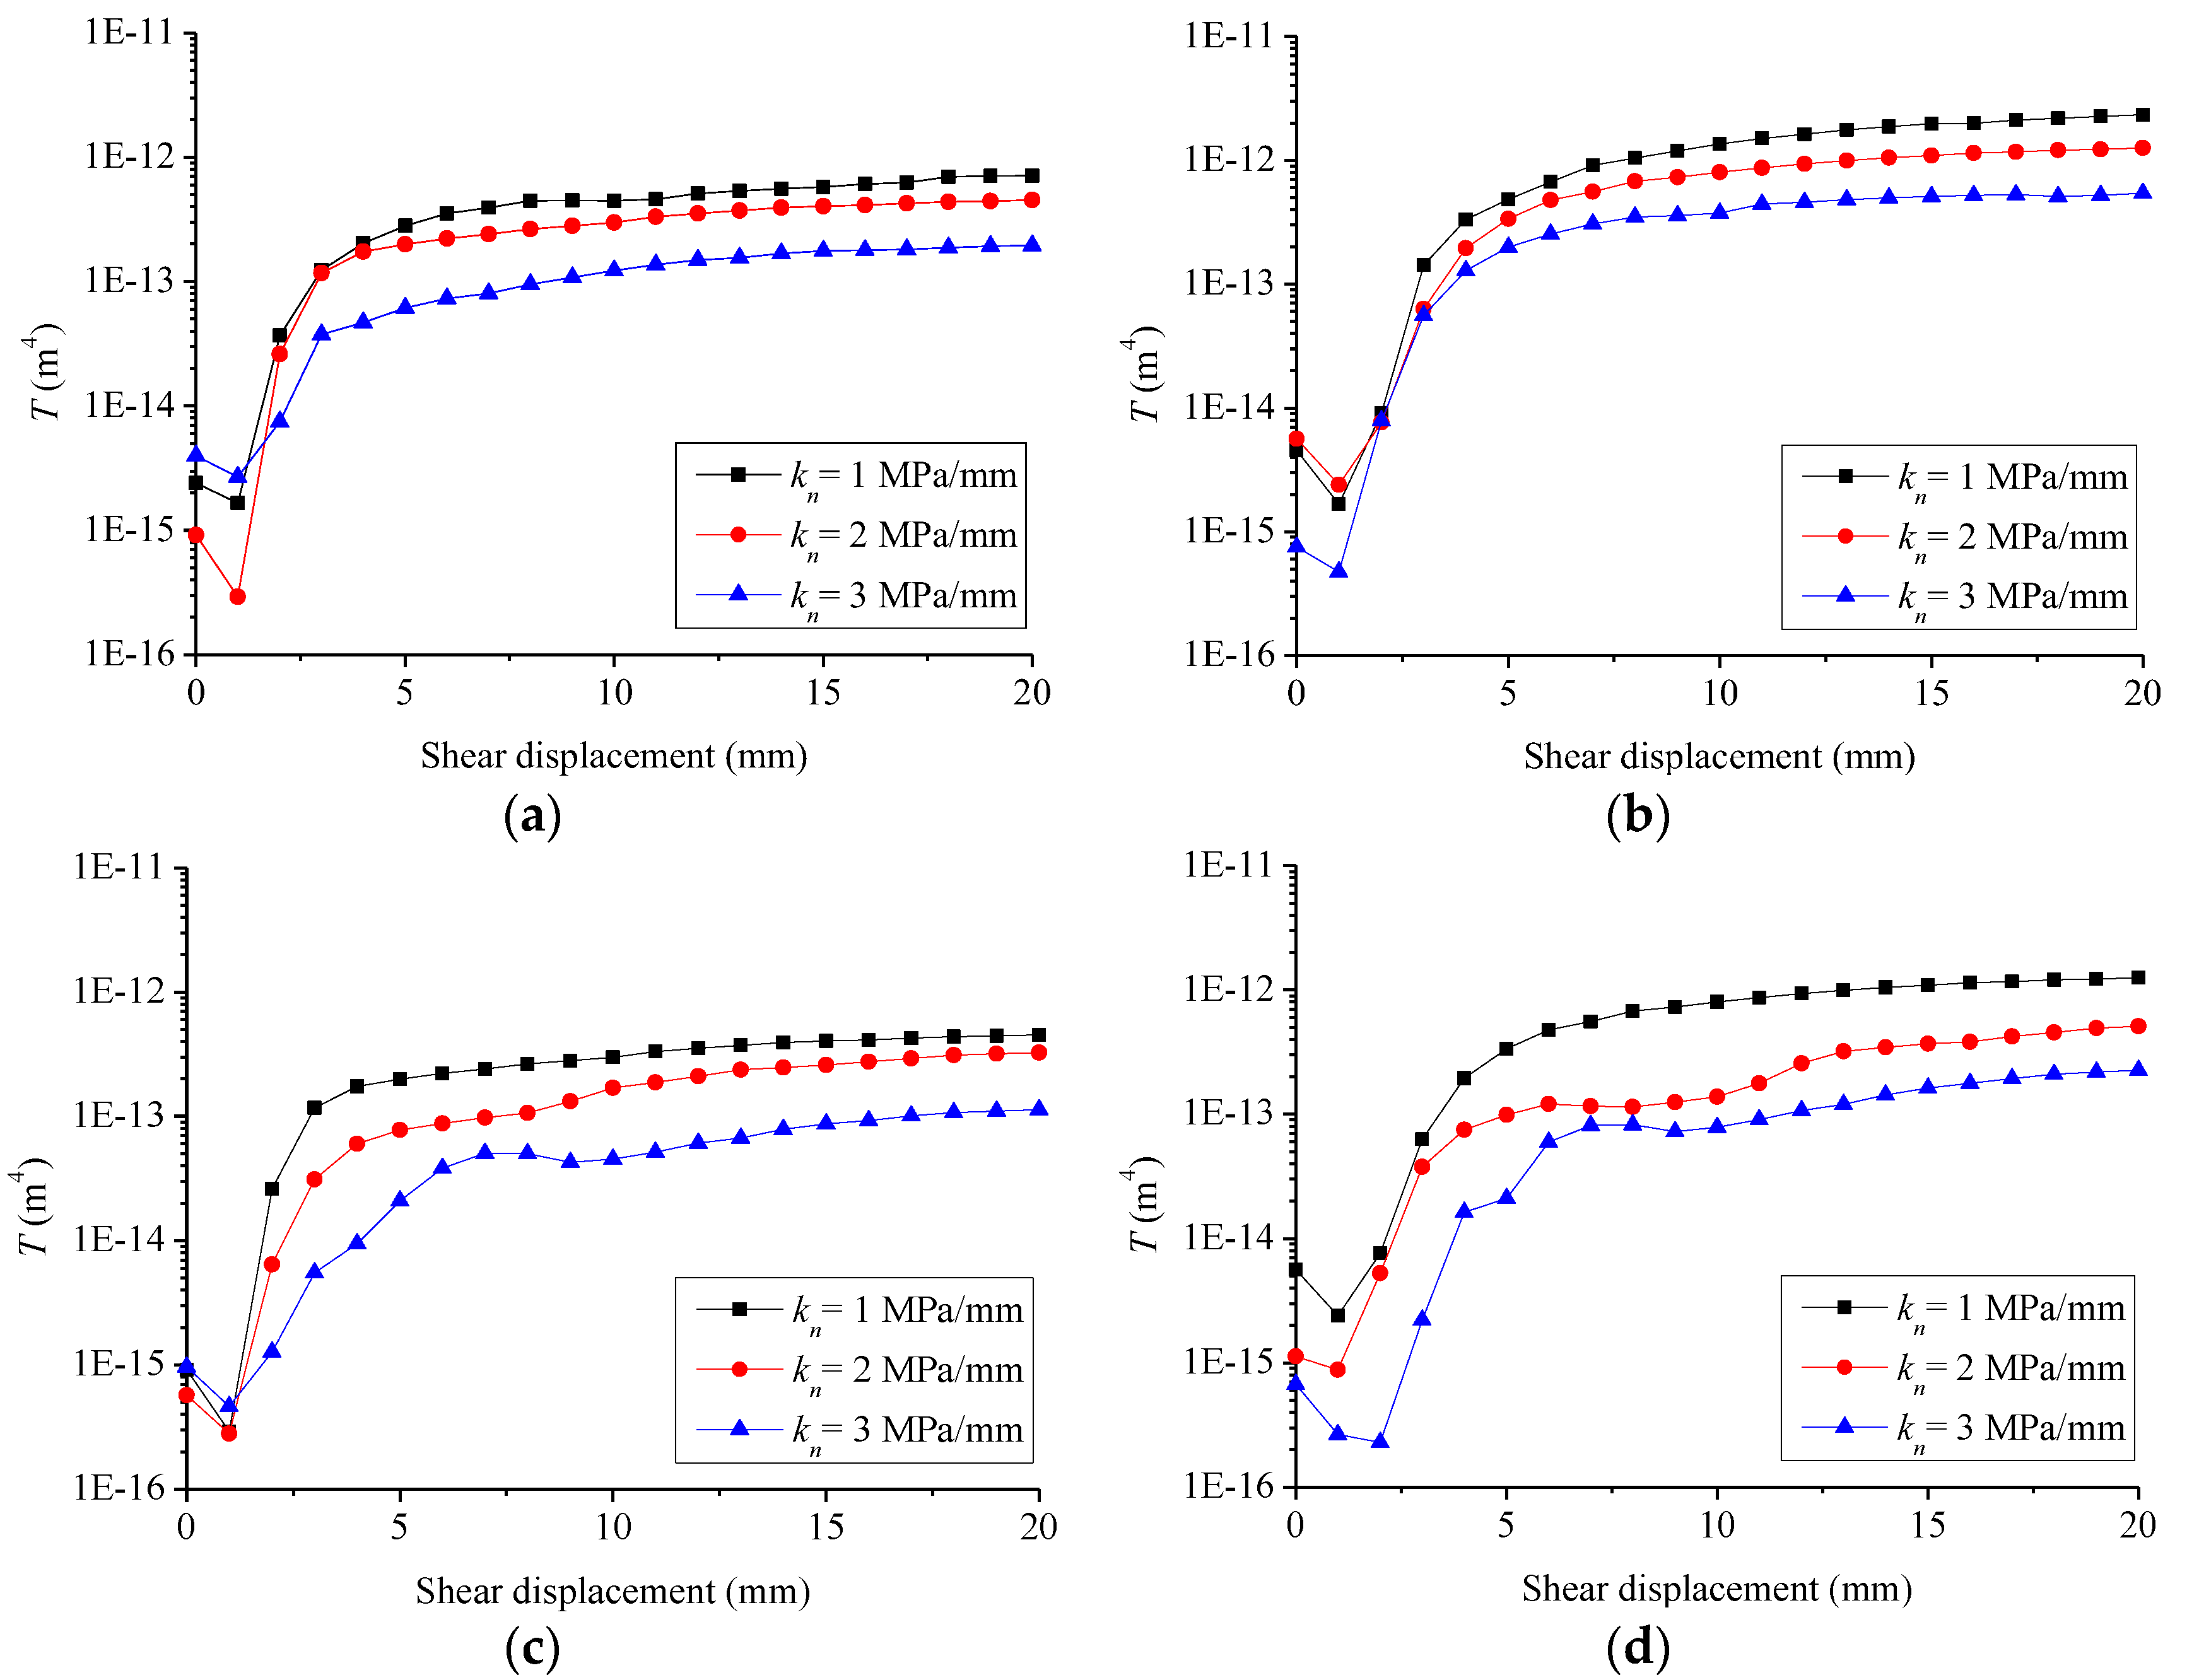
The evolution transmissivities of the relicas G1 and G3, during shearing, under different boundary conditions, have been plotted in Figure 4. The changes in transmissivity exhibited three-stage behavior, during the shear process. For all test cases, the transmissivity experienced a slight descend at 0–1 mm shear displacement. Then the transmissivity increased rapidly, at a shear displacement of 1–4 mm. When the shear displacement exceeded 4 mm, the transmissivity gradually increased, until reaching a stable value. Similar behavior have also been reported in previous studies [14,15,28]. The transmissivity showed an increment of 2—3 orders of magnitude, as the shear displacement increased from 0 to 20 mm. For the rougher replica G3, the transmissivity increment was larger than the smooth replica G1. This is because the rougher joint created a relatively larger void space between the two surfaces of a fracture, during shearing. The transmissivity decreased with the increases in normal stiffness and the initial normal stress. This was because the rougher fracture created a relatively larger void space between the two surfaces of a fracture, during shearing. The transmissivity decreased with the increase in normal stiffness and the initial normal stress.

3.4. Evolutions of the Mechanical Aperture and the Hydraulic Aperture

The evolution of the aperture, during shearing, was the key issue to study the fluid flow behaviors of fractures. Based on Equation (5), the hydraulic aperture at different shear displacements, can be calculated. The mean mechanical aperture (em) can be calculated based on the following equation [14,29]:
e m = e 0 Δ b n + Δ d
where e0 is the initial mechanical aperture, Δ b n is the change in mechanical aperture due to normal loading, and Δ d is the change in mechanical aperture induced by shear dilation. The initial mechanical aperture at the small shear displacement (0–1 mm) was assumed to equal to the hydraulic aperture. Note that the normal stress changes with increasing the shear displacement, under CNS boundary conditions, therefore, the Δ b n should be revised, based on the corresponding normal stress.
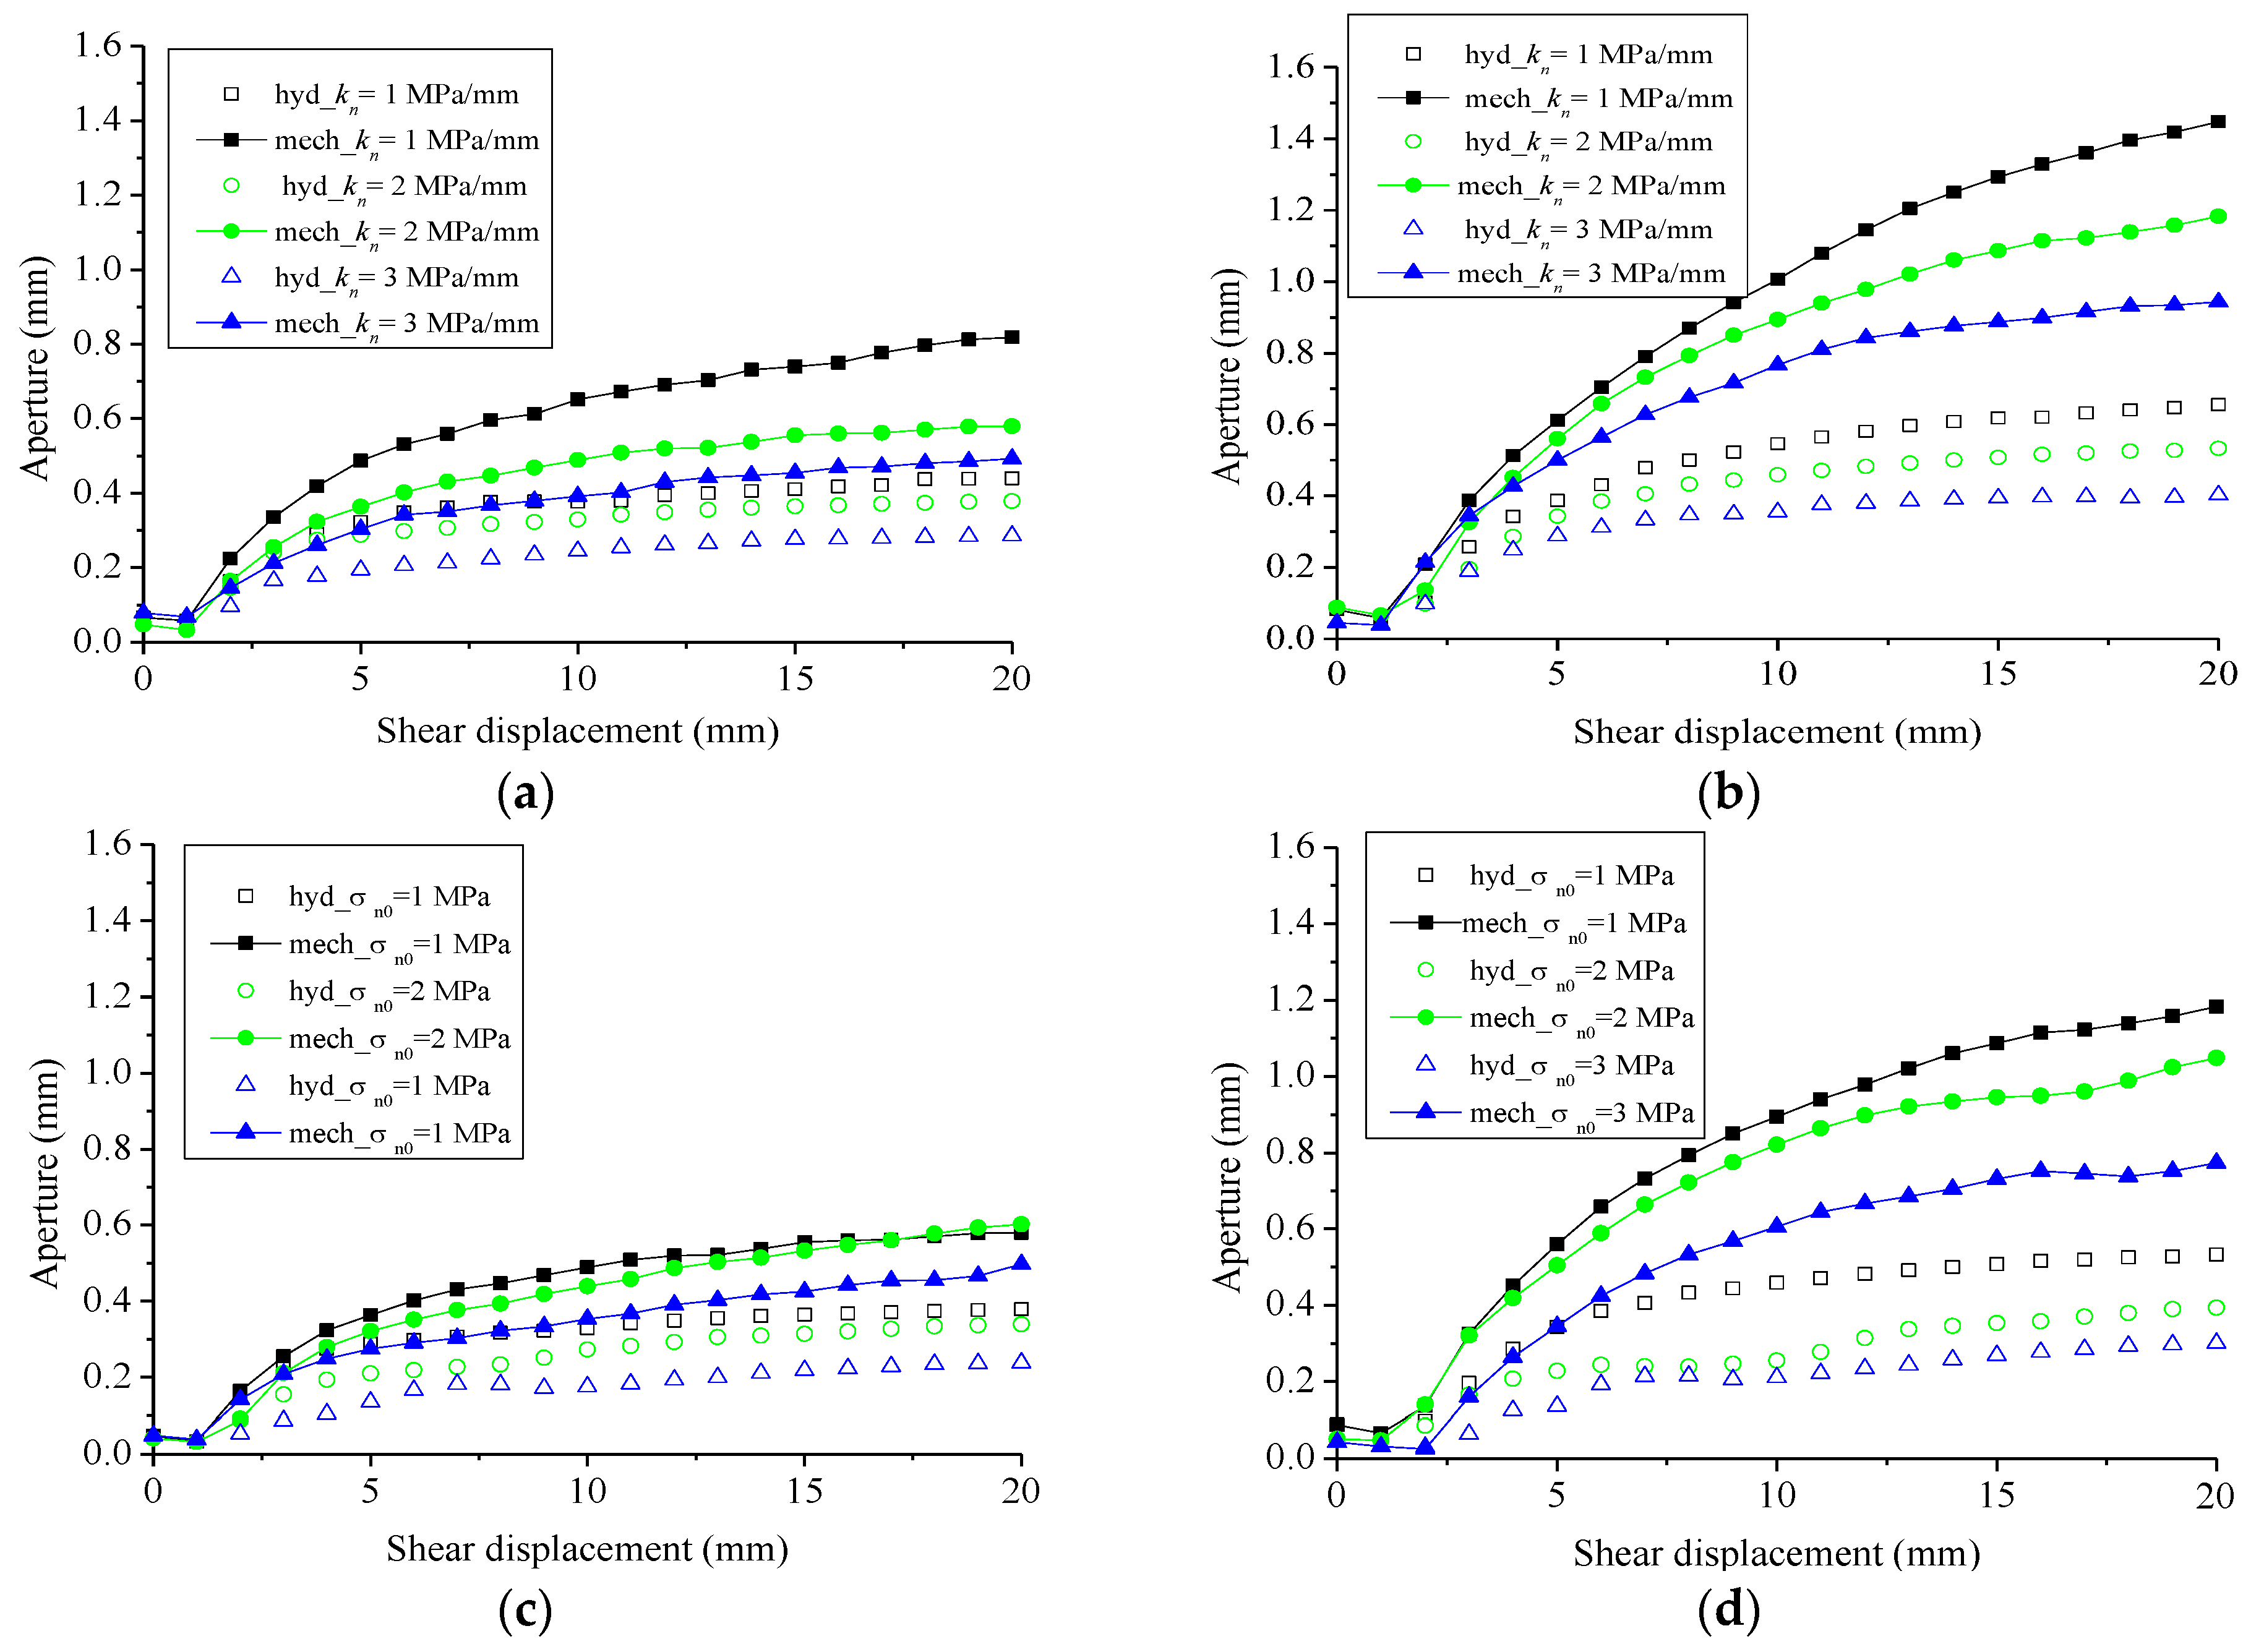
Figure 5 shows the evolutions of hydraulic and mechanical aperture of the fractures G1 and G3, during shearing, under different boundary conditions. Similar with the changes in the transmissivity, the evolution of the hydraulic aperture also exhibited a three-stage behavior, during the shear process: (1) A declining stage due to the shear contraction of the fracture, at the beginning of shear; (2) A fast growth stage, in which the aperture increased rapidly, due to shear-induced dilation; (3) A slowly growth stage, during which the aperture gradually increased and approximately approached a constant value, due to the reduction of shear dilation. Both the hydraulic and mechanical aperture decreased, with increasing normal stiffness and initial normal stress. This indicated that the stiffness- and the initial-normal-stress-induced normal stress increase caused a larger degree of asperity damage, which decreased the mechanical aperture. The mean mechanical aperture was always larger than the hydraulic aperture. For a rougher fracture surface, the degree of hydraulic aperture deviated more significantly from the mechanical aperture than the smoother fracture surface.

4. Conclusions

A series of shear-flow tests for the rough fractures G1 and G3, under various CNS boundary conditions, were performed to investigate the effects of surface roughness, normal stiffness, and initial normal stress on shear-flow behavior. The peak shear stress showed an increasing trend with the increase in surface roughness and initial normal stress, while the peak shear stress did not show obvious tendencies, with respect to the normal stiffness. The residual shear stress was related to the surface roughness, normal stiffness, and initial normal stress. With increments of surface roughness, normal stiffness, and initial normal stress, the residual shear stress increased. The dilation of the fracture was significantly related to the roughness, normal stiffness and the initial normal stress. The dilation of the fracture in the shear process was restrained, more significantly, under higher normal stiffness and initial normal stress conditions.
The evolutions of transmissivity and hydraulic aperture exhibited a three-stage behavior, during the shear process. A slight decreasing stage occurred, first, due to the contraction of the fracture at the beginning of the shear. Then, the transmissivity increased rapidly, at a shear displacement of 1–4 mm, due to the shear-induced dilation. The transmissivity of the fractures increased by 2–3 orders of magnitude, during this stage. Finally, the transmissivity and the hydraulic aperture gradually increased and approximately approached constant values, due to the reduction of shear dilation. The transmissivity and hydraulic aperture decreased, gradually, as the normal stiffness and initial normal stress increased.

Author Contributions

C.W. and Y.J. conceived and designed the experiments. H.L. and S.S. performed the experiments. J.L. collected and analyzed the data. C.W. and Y.J. wrote and modified the paper.

Funding

This research was funded by National Natural Science Foundation of China (Grant No. 41772154), Natural Science Foundation of Shandong Province, China (Grant No. ZR2017MEE003), JSPS-NSFC Bilateral Joint Research Project (Grant No. 51611140122), Shandong University of Science and Technology Graduate Innovation Fund (NO.SDKDYC180303) and China Scholarship Council (CSC NO. 201608370099).

Conflicts of Interest

The authors declare no conflict of interest.

References

  1. Jiang, Y.J.; Tanabashi, Y.; Xiao, J.; Nagaie. An improved shear-flow test apparatus and its application to deep underground construction. Int. J. Rock Mech. Min. Sci. 2004, 41, 170–175. [Google Scholar] [CrossRef]
  2. Wu, X.Z.; Jiang, Y.J.; Guan, Z.C.; Wang, G. Estimating the support effect of energy-absorbing rock bolts based on the mechanical work transfer ability. Int. J. Rock Mech. Min. Sci. 2018, 103, 168–178. [Google Scholar] [CrossRef]
  3. Barton, N.; Bandis, S.; Bakhtar, K. Strength, deformation and conductivity coupling of rock joints. Int. J. Rock Mech. Min. Sci. 1985, 22, 121–140. [Google Scholar] [CrossRef]
  4. Makurat, A. The effect of shear displacement on the permeability of natural rough joints. Hydrogeology of rocks of low permeability. In Proceedings of the 17th International Congress on Hydrogeology, Tucson, AZ, USA, 7–12 January 1985; pp. 99–106. [Google Scholar]
  5. Makurat, A.; Barton, N.; Rad, N.S.; Bandis, S. Joint conductivity variation due to normal and shear deformation. In Proceedings of the International Symposium on Rock Joints, Balkema, Loen, Norway, 4–6 June 1990; pp. 535–540. [Google Scholar]
  6. Yang, S.Q.; Liu, X.R.; Jing, H.W. Experimental investigation on fracture coalescence behavior of red sandstone containing two unparallel fissures under uniaxial compression. Int. J. Rock Mech. Min. Sci. 2013, 63, 82–92. [Google Scholar] [CrossRef]
  7. Yang, S.Q.; Yang, D.S.; Jing, H.W.; Li, Y.H.; Wang, S.Y. An experimental study of the fracture coalescence behaviour of brittle sandstone specimens containing three fissures. Rock Mech. Rock Eng. 2012, 45, 563–582. [Google Scholar] [CrossRef]
  8. Mazumber, K.; Karnik, A.A.; Wolf, K.H.A.A. Swelling of coal in response to CO2 sequestration for ECBM and its effect on fracture permeability. SPE J. 2006, 11, 390–398. [Google Scholar] [CrossRef]
  9. Schmittbuhl, J.; Steyer, A.; Jouniaux, L.; Toussaint, R. Fracture morphology and viscous transport. Int. J. Rock Mech. Min. Sci. 2008, 45, 422–430. [Google Scholar] [CrossRef] [Green Version]
  10. Leung, C.T.O.; Zimmerman, R.W. Estimating the hydraulic conductivity of two-dimensional fracture networks using network geometric properties. Transp. Porous Media 2012, 93, 777–797. [Google Scholar] [CrossRef]
  11. Wang, C.G.; Zhai, P.C.; Chen, Z.W.; Liu, J.S.; Wang, L.S.; Xie, J. Experimental study of coal matrix-cleat interaction under constant volume boundary condition. Int. J. Coal Geol. 2017, 181, 124–132. [Google Scholar] [CrossRef]
  12. Liu, R.; Li, B.; Jing, H.; Wei, W. Analytical solutions for water-gas flow through 3D rock fracture networks subjected to triaxial stresses. Fractals 2018, 26, 1850053. [Google Scholar] [CrossRef]
  13. Yeo, I.W.; Freitas, M.H.D.; Zimmerman, R.W. Effect of shear displacement on the aperture and permeability of a rock fracture. Int. J. Rock Mech. Min. Sci. 1998, 35, 1051–1070. [Google Scholar] [CrossRef]
  14. Esaki, T.; Du, S.; Mitani, Y.; Jing, L. Development of a shear-flow test apparatus and determination of coupled properties for a single rock joint. Int. J. Rock Mech. Min. Sci. 1999, 36, 641–650. [Google Scholar] [CrossRef]
  15. Li, B.; Jiang, Y.J.; Koyama, T.; Jing, L.R. Experimental study of the hydro-mechanical behavior of rock joints using a parallel-plate model containing contact areas and artificial fractures. Int. J. Rock Mech. Min. Sci. 2008, 45, 362–375. [Google Scholar] [CrossRef] [Green Version]
  16. Javadi, M.; Sharifzadeh, M.; Shahriar, K.; Mitani, Y. Critical Reynolds number for nonlinear flow through rough-walled fractures: The role of shear processes. Water Resour. Res. 2010, 389, 18–30. [Google Scholar] [CrossRef]
  17. Frash, L.P.; Carey, J.W.; Lei, Z.; Rougier, E.; Ickes, T.; Viswanathan, H.S. High-stress triaxial direct-shear fracturing of Utica shale and in situ X-ray microtomography with permeability measurement. J. Geophys. Res. Solid Earth 2016, 121, 5493–5508. [Google Scholar] [CrossRef]
  18. Frash, L.P.; Carey, J.W.; Ickes, T.; Porter, M.L.; Viswanathan, H.S. Permeability of fractures created by triaxial direct shear and simultaneous X-ray imaging. In Proceedings of the 51st U.S. Rock Mechanics/Geomechanics Symposium, San Francisco, CA, USA, 25–28 June 2017. [Google Scholar]
  19. Rong, G.; Yang, J.; Cheng, L.; Zhou, C.B. Laboratory investigation of nonlinear flow characteristics in rough fractures during shear process. J. Hydrol. 2016, 541, 1385–1394. [Google Scholar] [CrossRef]
  20. Jiang, Y.J.; Xiao, J.; Tanabashi, Y.; Mizokami, T. Development of an automated servo-controlled direct shear apparatus applying a constant normal stiffness condition. Int. J. Rock Mech. Min. Sci. 2004, 41, 275–286. [Google Scholar] [CrossRef]
  21. Jiang, Y.J.; Li, B.; Tanabashi, Y. Estimating the relation between surface roughness and mechanical properties of rock joints. Int. J. Rock Mech. Min. Sci. 2006, 43, 837–846. [Google Scholar] [CrossRef]
  22. Lee, Y.K.; Park, J.W.; Song, J.J. Model for the shear behavior of rock joints under CNL and CNS conditions. Int. J. Rock Mech. Min. Sci. 2014, 70, 252–263. [Google Scholar] [CrossRef]
  23. Shrivastava, A.K.; Rao, K.S. Physical modeling of shear behavior of infilled rock joints under CNL and CNS boundary conditions. Rock Mech. Rock Eng. 2017, 51, 101–118. [Google Scholar] [CrossRef]
  24. Li, Y.C.; Wu, W.; Li, B. An analytical model for two-order asperity degradation of rock joints under constant normal stiffness conditions. Rock Mech. Rock Eng. 2018, 51, 1431–1445. [Google Scholar] [CrossRef]
  25. Indraratna, B.; Haque, A. Experimental study of shear behavior of rock joints under constant normal stiffness conditions. Int. J. Rock Mech. Min. Sci. 1997, 34, 3–4. [Google Scholar] [CrossRef]
  26. Shrivastava, A.K.; Rao, K.S. Shear behaviour of rock joints under CNL and CNS Boundary Conditions. Geotech. Geol. Eng. 2015, 33, 1205–1220. [Google Scholar] [CrossRef]
  27. Mirzaghorbanali, A.; Nemcik, J.; Aziz, N. Effects of cyclic loading on the shear behaviour of infilled rock joints under constant normal stiffness conditions. Rock Mech. Rock Eng. 2014, 47, 1373–1391. [Google Scholar] [CrossRef]
  28. Li, B.; Jiang, Y.J.; Saho, R.; Tasaku, Y.; Tanabashi, Y. An investigation of hydromechanical behaviour and transportability of rock joints. Asian Joint Symp. Geotech. Geo-Environ. Eng. 2006, 321–325. [Google Scholar]
  29. Koyama, T.; Li, B.; Jiang, Y.J.; Jing, L.R. Numerical modelling of fluid flow tests in a rock fracture with a special algorithm for contact areas. Comput. Geotech. 2009, 36, 291–303. [Google Scholar] [CrossRef] [Green Version]
  30. Olsson, R.; Lindblom, U. Direct Shear Tests Under Constant Normal Stiffness and Fluid Flow. In Proceedings of the 9th ISRM Congress, Paris, France, 25–28 August 1999. [Google Scholar]
  31. Olsson, R.; Barton, N. An improved model for hydromechanical coupling during shearing of rock joints. Int. J. Rock Mech. Min. Sci. 2001, 38, 317–329. [Google Scholar] [CrossRef]
  32. Saito, R.; Ohnishi, Y.; Nishiyama, S.; Yano, T.; Uehara, S. Hydraulic characteristics of single rough fracture under shear deformation. In Proceedings of the ISRM International Symposium (EUROCK), Brno, Czech Republic, 18–20 May 2005; pp. 503–509. [Google Scholar]
  33. Tse, R.; Cruden, D.M. Estimating joint roughness coefficients. Int. J. Rock Mech. Min. Sci. Geomech. Abstr. 1979, 16, 303–307. [Google Scholar] [CrossRef]
  34. Xiong, X.B.; Li, B.; Jiang, Y.J.; Koyama, T.; Zhang, C.H. Experimental and numerical study of the geometrical and hydraulic characteristics of a single rock fracture during shear. Int. J. Rock Mech. Min. Sci. 2011, 48, 1292–1302. [Google Scholar] [CrossRef]
  35. Koyama, T.; Li, B.; Jiang, Y.J.; Jing, L.R. Coupled shear-flow tests for rock fractures with visualization of the fluid flow and their numerical simulations. Int. J. Geotech. Eng. 2012, 2, 215–227. [Google Scholar] [CrossRef]
  36. Yin, Q.; Jing, H.W.; Ma, G.W.; Su, H.; Liu, R.C. Investigating the roles of included angle and loading condition on the critical hydraulic gradient of real rock fracture networks. Rock Mech. Rock Eng. 2018, 51, 3167–3177. [Google Scholar] [CrossRef]
  37. Yin, Q.; Ma, G.W.; Jing, H.W.; Su, H.; Wang, Y.; Liu, R.C. Hydraulic properties of 3D rough-walled fractures during shearing: An experimental study. J. Hydrol. 2017, 555, 169–184. [Google Scholar] [CrossRef]
  38. Liu, R.C.; Jing, H.W.; He, L.; Zhu, T.; Yu, L. An experimental study of the effect of fillings on hydraulic properties of single fractures. Environ. Earth Sci. 2017, 76, 684. [Google Scholar] [CrossRef]
Figure 1. (a) Scanning graph of fracture G1. (b) Scanning graph of fracture G3. (c) Schematic view of the coupled shear-flow test system (Arrow represents water flow direction).
Processes 07 00057 g001aProcesses 07 00057 g001b
Figure 2. Shear behavior of rock fracture replicas under different normal stiffness. (a,b) Shear stress vs. shear displacement for the replicas G1 and G3; (c,d) Normal displacement vs. shear displacement for replicas G1 and G3; and (e,f) Normal stress vs. shear displacement for replicas G1 and G3.
Processes 07 00057 g002aProcesses 07 00057 g002b
Figure 3. Shear behavior of the rock fracture replicas with different initial normal stresses. (a,b) Shear stress vs. shear displacement for the replicas G1 and G3; (c,d) Normal displacement vs. shear displacement for the replicas G1 and G3; and (e,f) Normal stress vs. shear displacement for the replicas G1 and G3.
Processes 07 00057 g003
Figure 4. The evolutions of transmissivity of the replicas G1 and G3, during shearing, under different boundary conditions. (a) Transmissivity of replica G1, with different normal stiffness, under an initial normal stress of 1 MPa; (b) transmissivity of replica G3, with different normal stiffness, under an initial normal stress of 1 MPa; (c) transmissivity of replica G1, with different initial normal stresses, under a constant normal stiffness of 2 MPa/mm; (d) transmissivity of replica G3, with different initial normal stresses, under a constant normal stiffness of 2 MPa/mm.
Processes 07 00057 g004
Figure 5. Evolution of the hydraulic and the mechanical apertures of the replicas G1 and G3, during shearing, under different boundary conditions. (a) Replica G1 with different normal stiffness, under an initial normal stress of 1 MPa. (b) Replica G3 with different normal stiffness, under an initial normal stress of 1 MPa. (c) Replica G1 with different initial normal stresses, under a constant normal stiffness of 2 MPa/mm. (d) Replica G3 with different initial normal stresses, under a constant normal stiffness of 2 MPa/mm.
Processes 07 00057 g005
Table 1. Physico-mechanical properties.
Physico-Mechanical PropertiesIndexUnitValue
Densityρg/cm32.066
Compressive strengthσcMPa38.5
Modulus of elasticityEsGPa28.7
Poisson’s ratiov0.23
Tensile strengthσtσt2.5
CohesioncMPa5.3
Internal friction angleφ°60
Table 2. Experimental cases and their corresponding boundary conditions.
Joint SpecimensLoading CasesRoughness (JRC)Normal Loading Conditions
Initial Normal Stress, σ 0 (MPa)Normal Stiffness, kn (MPa/mm)
G1G1—13.2111
G1—212
G1—313
G1—422
G1—532
G3G3—17.3611
G3—212
G3—313
G3—422
G3—532