Article

An Integrated Delphi-AHP and Fuzzy TOPSIS Approach toward Ranking and Selection of Renewable Energy Resources in Pakistan

by
Yasir Ahmed Solangi
1,*,
Qingmei Tan
1,
Nayyar Hussain Mirjat
2,
Gordhan Das Valasai
3,
Muhammad Waris Ali Khan
4 and
Muhammad Ikram
1
1
College of Economics and Management, Nanjing University of Aeronautics and Astronautics, Nanjing 211106, China
2
Department of Electrical Engineering, Mehran University of Engineering and Technology, Jamshoro 76062, Pakistan
3
Department of Mechanical Engineering, Quaid-e-Awam University of Engineering, Science and Technology, Nawabshah 67480, Pakistan
4
Faculty of Industrial Management, University Malaysia, Pahang 26300, Malaysia
*
Author to whom correspondence should be addressed.
Processes 2019, 7(2), 118; https://doi.org/10.3390/pr7020118
Submission received: 31 December 2018 / Revised: 14 February 2019 / Accepted: 15 February 2019 / Published: 25 February 2019

Abstract

:
Pakistan has long relied on fossil fuels for electricity generation. This is despite the fact that the country is blessed with enormous renewable energy (RE) resources, which can significantly diversify the fuel mix for electricity generation. In this study, various renewable resources of Pakistan—solar, hydro, biomass, wind, and geothermal energy—are analyzed by using an integrated Delphi-analytical hierarchy process (AHP) and fuzzy technique for order of preference by similarity to ideal solution (F-TOPSIS)-based methodology. In the first phase, the Delphi method was employed to define and select the most important criteria for the selection of RE resources. This process identified four main criteria, i.e., economic, environmental, technical, and socio-political aspects, which are further supplemented by 20 sub-criteria. AHP is later used to obtain the weights of each criterion and the sub-criteria of the decision model. The results of this study reveal wind energy as the most feasible RE resource for electricity generation followed by hydropower, solar, biomass, and geothermal energy. The sensitivity analysis of the decision model results shows that the results of this study are significant, reliable, and robust. The study provides important insights related to the prioritizing of RE resources for electricity generation and can be used to undertake policy decisions toward sustainable energy planning in Pakistan.

1. Introduction

Energy is one of the key drivers for sustainable growth and economy of any country. In fact, in this era, the measure of the development of any economy is synonymous with the level of energy consumption. Energy, which is crucial in economic, environmental, technical, and socio-political aspects, has become one of the most discussed issues in recent times. Industrialization and technological developments have created a higher energy need worldwide [1]. However, the quantity of reserves of fossil fuels differs from one country to another. This situation has, therefore, resulted in an unavoidable economic dependency, major environmental concerns, technological issues, important social consequences, and serious political conflicts [2]. The existing situation and the future estimations for energy requirements make it crucial to explore alternate energy resources. Further, the current and future possible economic, environmental, technical, and socio-political consequences also push countries toward renewable energy (RE) resources. In this scenario, RE has become the answer to sustainable energy planning.
Pakistan is a developing country with striving economic progress and thus essentially requires a sufficient amount of energy for meeting the growth targets and attaining sustainable development. However, in the last two decades, the country has been coping with its worst ever energy crises, with regular power interruptions that have deteriorated the economy, thus adversely impacting the livelihood of people [3]. The ongoing energy crises in the country have paralyzed the economy, and the circular debt of the power sector alone has crossed over Pak Rupees 922 billion [4]. It is also unfortunate that only around 50% of the country population has access to on-grid electricity. Load shedding of 16–18 h in the rural areas is a common phenomenon while in the urban areas, the electricity is inaccessible for 10–12 h a day [5]. This huge shortfall of electricity is mainly owing to Pakistan’s reliance on fossil fuels, which are a key source of huge import bills and expensive electricity. Apart from these issues, there are also various governance-related problems and hurdles behind these crises. Amongst these all, a lack of focus toward harnessing the indigenous RE resources is a noteworthy shortcoming that has not received any major attention in the planning and development processes in Pakistan. In order to eliminate energy shortfalls, it is required that abundantly available renewable resources be harnessed effectively [6]. Pakistan is fortunate to have various RE resources that include solar, hydro, biomass, wind, and geothermal energy [7]. All these RE resources have huge potential to generate electricity as well as help to eradicate energy deficits and enhance sustainable development of the country.
The total electricity generation capacity of Pakistan in 2017 has been reached to 29,944 MW [8]. Shares in electricity generation are comprised of natural gas, 33.6%, oil, 32.1%, coal, 0.2%, hydropower, 26.1%, nuclear, 5.7%, and renewable energy, only 2.2%. In the total energy mix of Pakistan, the share of non-renewable is, as such, higher and needs to be reduced in order to ensure long-term sustainability and energy security. In the wake of the global focus on reducing greenhouse gas (GHG) emissions and thus enhanced effort for the deployment of RE-based projects for electricity generation, Pakistan also needs to undertake essential measures toward development and completion of RE-based power projects. However, so far, no significant accomplishment toward harnessing RE-based projects has been witnessed in the country. In this context, serious and extensive energy planning and decision-making efforts are required to exploit RE resources for electricity generation.
RE resources are not only capable of meeting the ever-increasing demand for electricity, but they are also environment-friendly. These facts regarding RE resources are recognized globally, but Pakistan, though blessed with enormous RE potential, is making extremely slow progress in realizing the true potential of RE-based projects. In this context, the Alternative Energy Development Board (AEDB) and the Pakistan Council of Renewable Energy Technologies (PCRET) are two key organizations of the government undertaking RE projects and technology development activities, respectively [9]. However, the progress of these organizations is very slow and only some small RE-based projects have been installed in the country. The poor level of commitment from government, the overlapping management functions of the energy sector, and the lack of financial capacity and technical awareness are key barriers toward developing RE-based projects in Pakistan. Likewise, Usama et al. [10] have identified various key barriers that obstruct successful implementation of social sustainability practices in manufacturing firms using interpretive structural modeling (ISM).
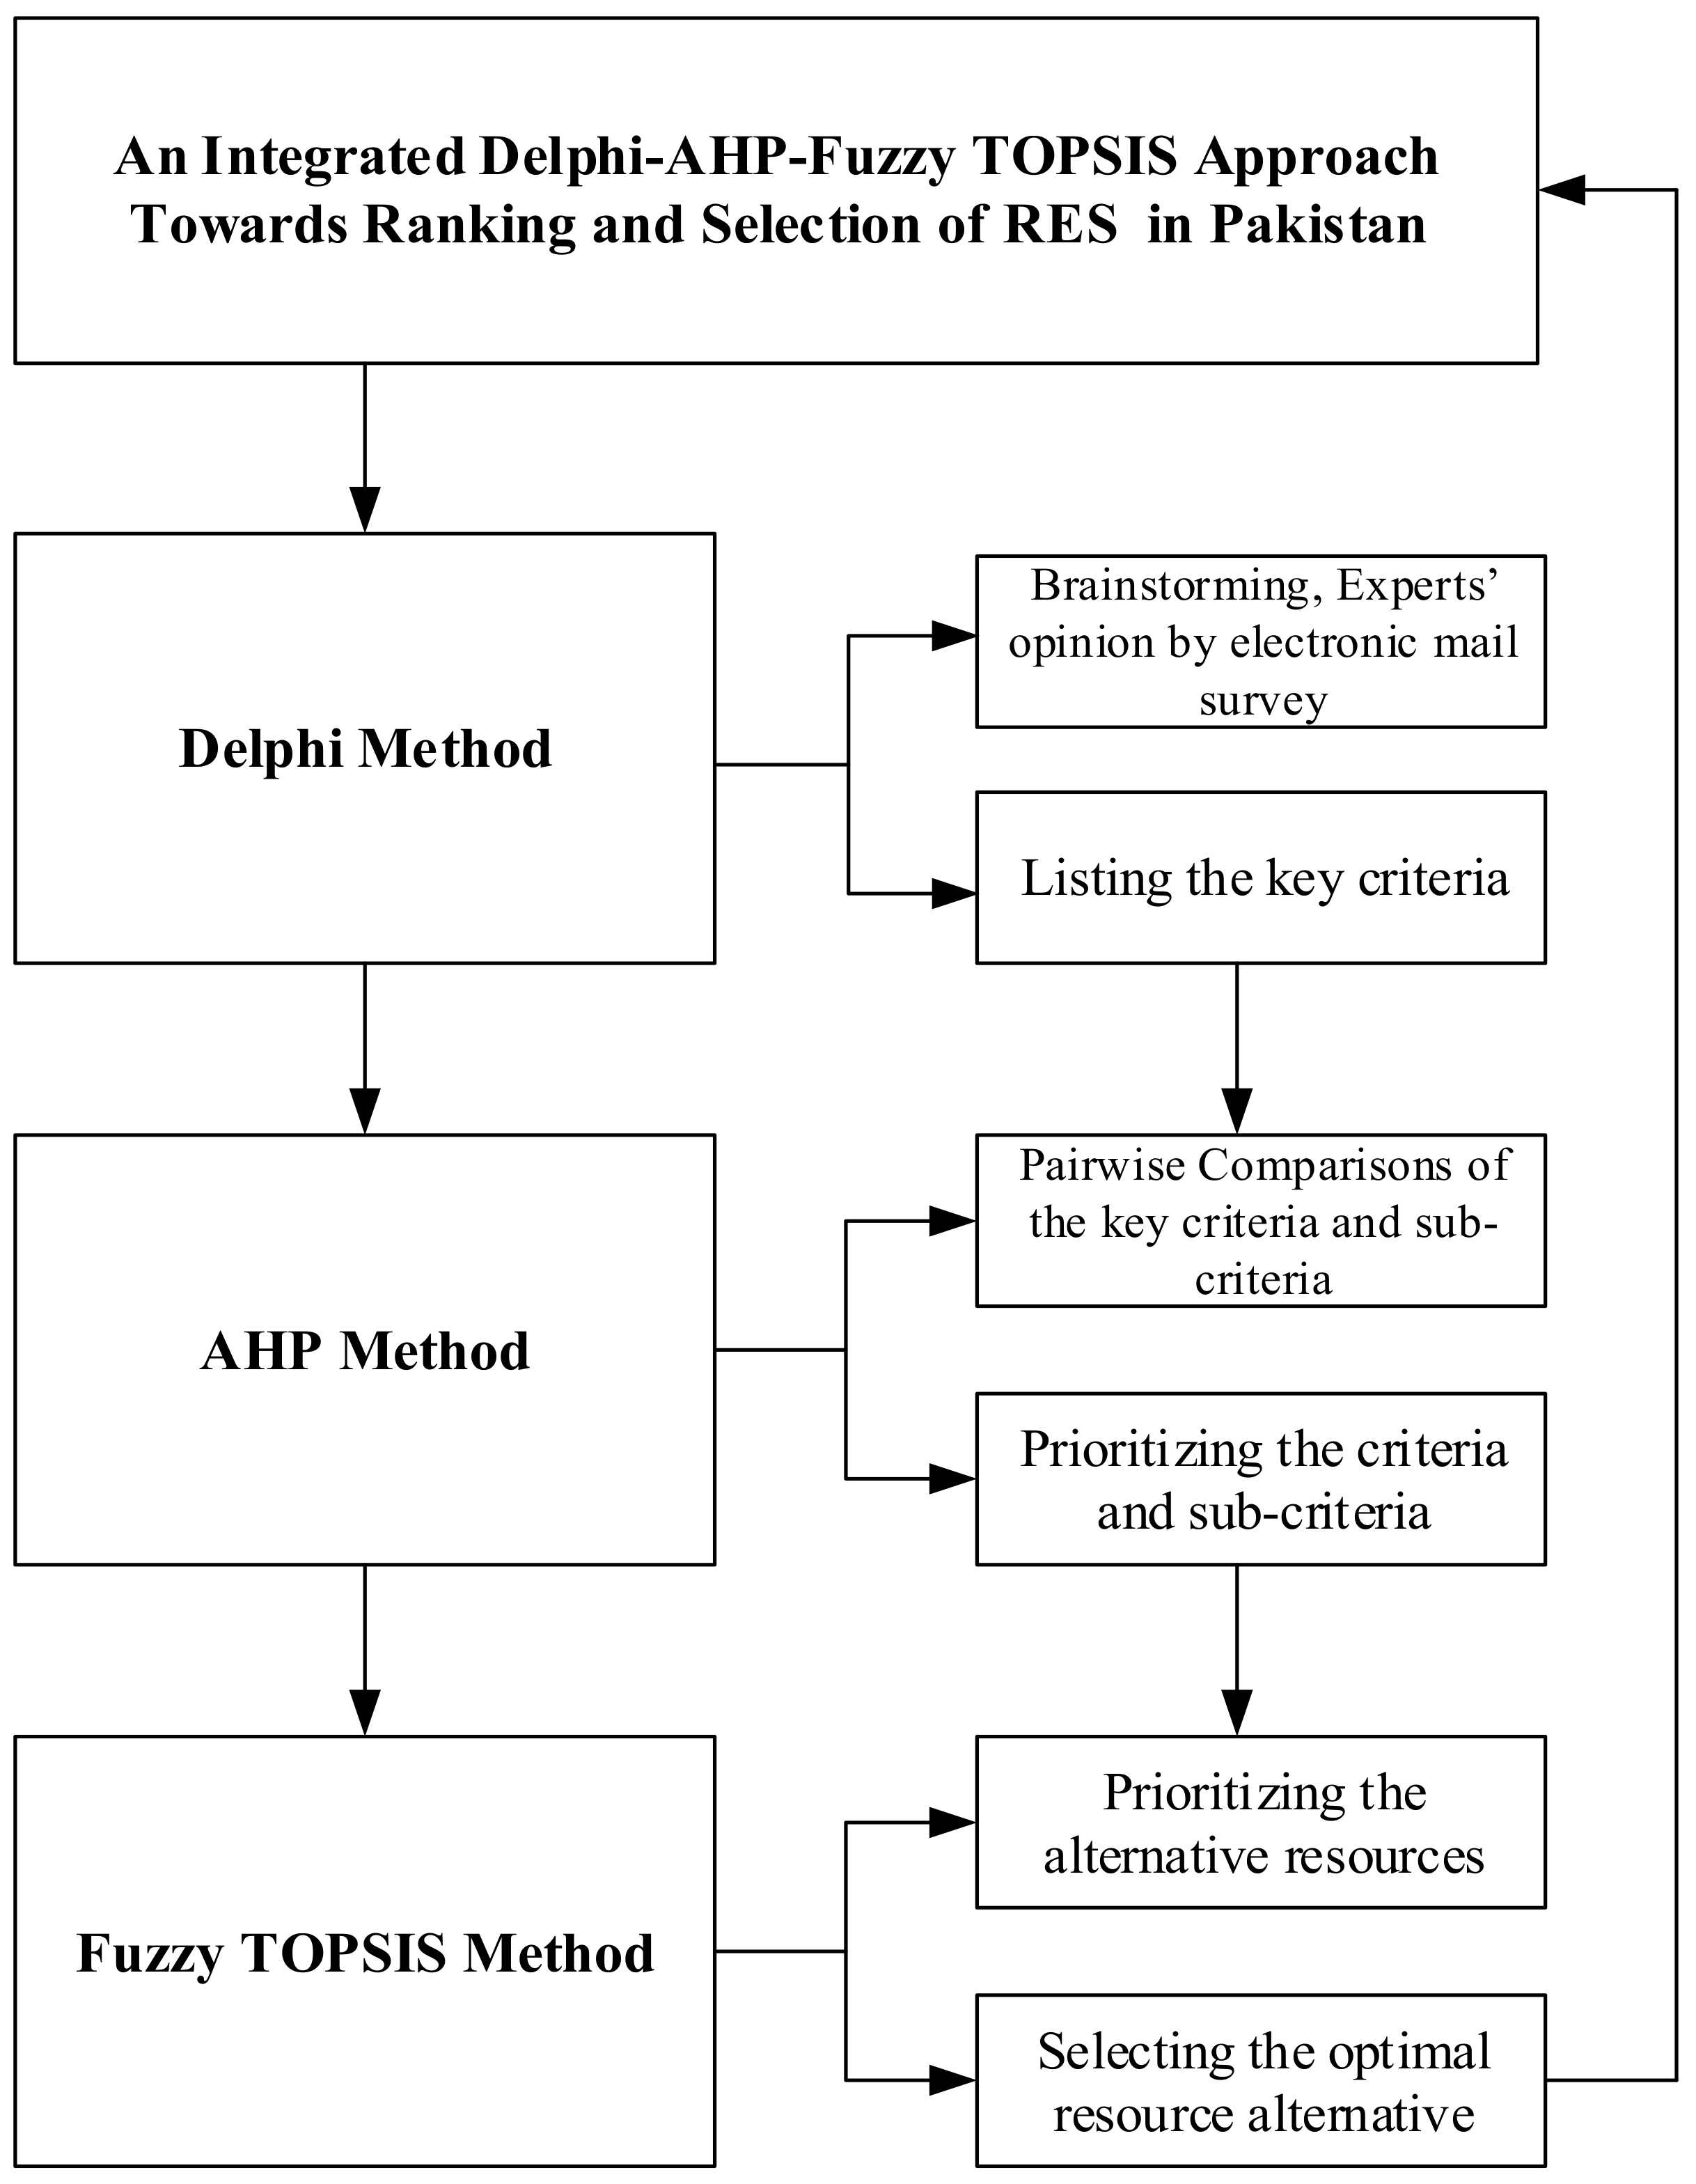
It is, therefore, important that, for sustainable development, short-term, middle-term, and long-term energy planning consider various energy resource alternatives. As such, the various RE resources need to be evaluated in a systemic way, and they must be considered from the techno-economic and socio-political point of view. In this context, the aim of this study is to systematically prioritize the RE resources of Pakistan for sustainable energy planning. According to the authors, this is the very first attempt to propose and develop an integrated Delphi-analytical hierarchy process (AHP) and fuzzy technique for order of preference by similarity to ideal solution (F-TOPSIS)-based methodology to undertake systematic prioritization of RE resources of Pakistan. This effort is expected to inspire policy and decision makers to consider a systematic planning process for resource selection to expedite the development of RE-based projects.
The rest of the paper is as follows: Section 2 presents related literature applied in the energy sector, while Section 3 provides a detailed analysis of various RE resources of Pakistan. The analysis-based proposed integrated decision framework is shown in Section 4. The results and relevant discussion are contained in Section 5, and Section 6 provides conclusions and recommendations derived from this study.

2. Related Literature

There are various energy planning-related studies where Delphi and Multi-Criteria Decision Making (MCDM) approaches have been comprehensively used with varying aims, objective, and specific criteria. These applications have considered energy planning and policymaking at different levels, risks assessments of long-term energy plans, the selection of the best RE technologies, energy scenario analysis, environmental concerns related to the energy sector, energy management problems, and the selection of power plants. The Delphi and F-TOPSIS methodology has been used to rank flood vulnerability and vulnerability characteristics in the South Han River basin in South Korea [11]. Some authors [12,13,14] have stated that MCDM approaches are well-suited to address strategic decision-making problems. MCDM methods provide a systemic and transparent way to enclose multiple conflicting objectives. MCDM based on multi-attribute value functions is often employed to support energy planning and policy, and to select and prioritize suitable alternatives. Wang et al. [15] in a detailed review provided various applications of MCDM methods in sustainable energy planning and concluded that AHP is the most prevailing and popular method.
It is apparent from the literature that MCDM methods are often used and are popular for decision making in sustainable energy planning, and they greatly help in addressing important criteria [15]. Amer and Daim [16] used the AHP method to suggest the optimal RE resource in Pakistan. In this study, authors ranked biomass as the best alternative for electricity generation; however, biomass only has a 5000 MW potential, which is not sufficient to meet the increasing energy demand of the country [17]. Another limitation of this study is that the authors used AHP to obtain the weights of the RE alternatives; however, literature has suggested that the combination or integration of various MCDM methods for one goal provide more refined and better results. Furthermore, Table 1 illustrates the summary of various energy-related studies from multi-criteria approaches.
In light of the above, this study attempts to contribute to the contemporary literature by proposing an integrated Delphi-AHP and F-TOPSIS methodology for RE resource prioritization. The Delphi approach translates Delphi qualitative assessments about the importance of the criteria into constraints on the weights that are exploited through the AHP approach. Further, the F-TOPSIS method has been employed to finally rank the RE alternatives. The following section described the detailed analysis of various RE resources of Pakistan.

3. Renewable Energy Potential of Pakistan

Pakistan is blessed with various RE resources such as solar, hydro, biomass, wind, and geothermal energy, with significant potential to produce electricity. However, there has been extremely slow growth in harnessing these resources, so they form a mere share in the overall energy mix of the country. The RE policy of 2006 aims at adding 10,000 MW of electricity from RE resources by 2030 [41]. However, the estimated potential of RE is far greater than 10,000 MW. With growing demand, the maximum potential for RE needs to be tapped. Table 2 provides a summary of the estimated potential of each RE resource and installed electricity generation capacity from these resources in Pakistan.
It is, therefore, required that government undertake extraordinary measures to explore, develop, and establish sustainable energy sources at the regional and national level to overcome the current energy crisis. In the following sub-sections, detailed analysis of five RE resources of Pakistan for electricity generation is provided.

3.1. Solar Energy

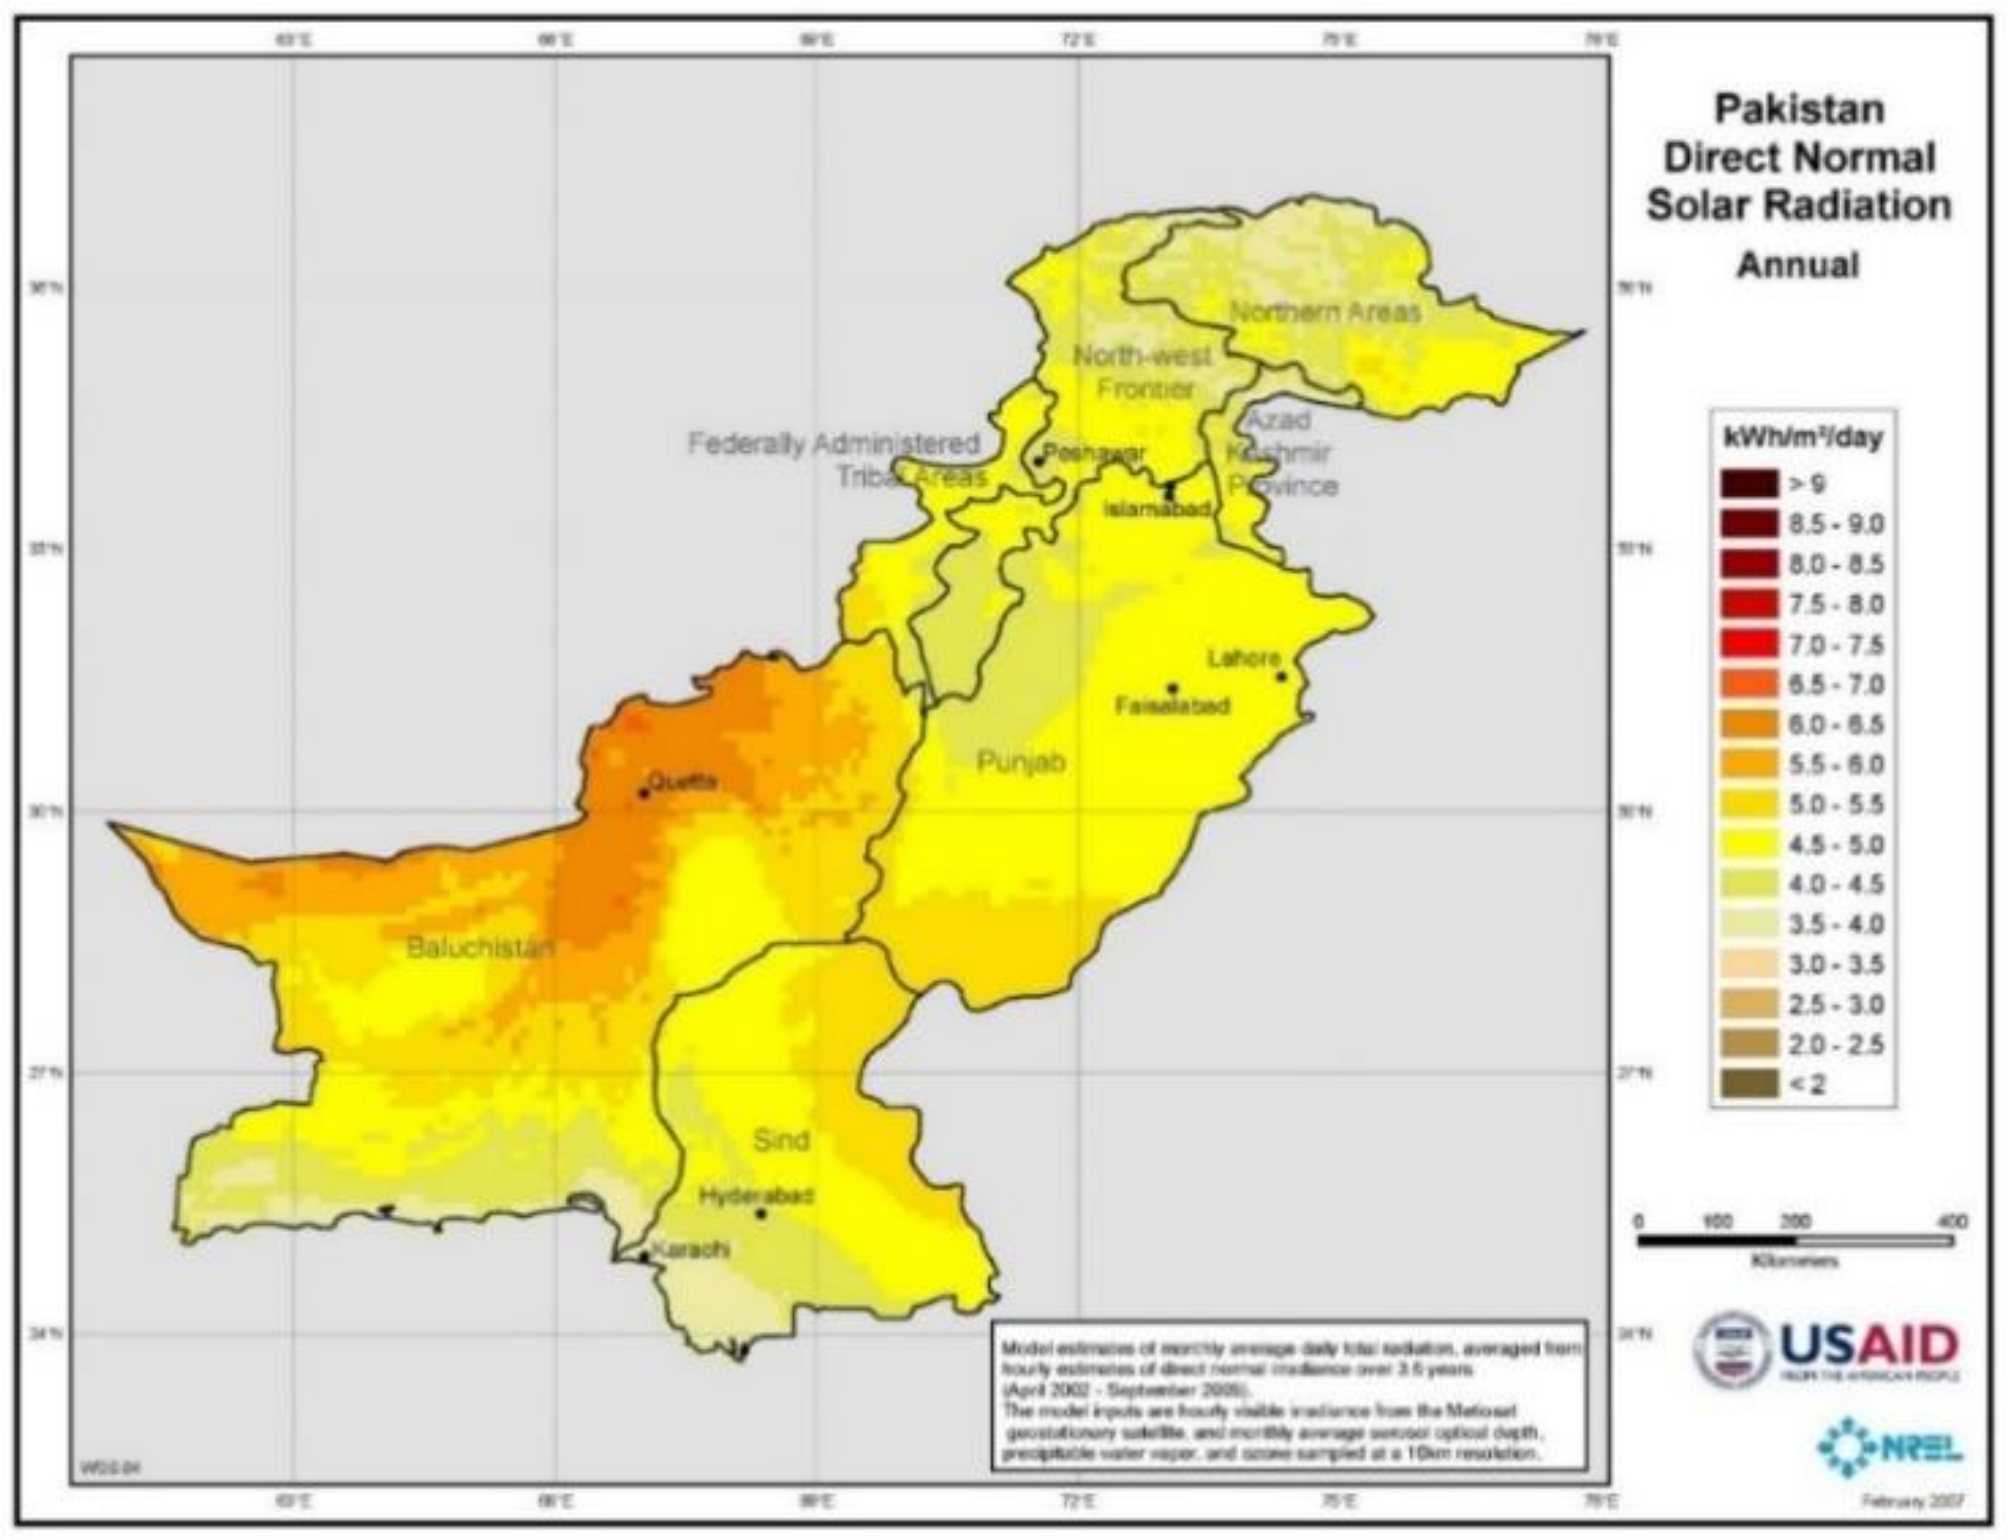
Pakistan has plentiful solar energy throughout the year and across the country [9]. The solar energy potential of Pakistan is estimated to be 2,900,000 MW, which can be exploited extensively to meet the energy demand. Geographically, Pakistan receives the highest solar radiation in the region with more than 300 sunlight days with around 1800–2200 kWh/m2 of annual radiation at a 26–28 °C average annual temperature, which can produce an electricity of 5.5–6 kWh/m2/day [45]. As such, the exploitable solar resources are estimated to be greater than 50,000 MW, with more than 2500 h of sunlight in a year. There is an excellent potential for deploying solar energy projects in Baluchistan and Sindh, where the sun shines for 7–8 h a day, approximately 2300–2700 h/annum [9]. A solar map of Pakistan for direct normal radiation is depicted in Figure 1.
Unfortunately, due to a lack of interest and commitment of concerned government authorities, the development of RE resources including solar energy for generating electricity is at very early stages despite outstanding geographical conditions. In the meantime, with the penetration of solar-based technology in the market, various electricity consumers in both rural and urban areas have installed standalone photovoltaic units of 100–500 W for power generation. However, these individual efforts can be short-lived with an operational maintenance requirement, the availability of spares, and other challenges. With the potential of solar energy duly taken into consideration, and with an annual mean sunlight duration of 8–8.5 h a day, it is projected that around 40,000 villages in the country can be provided with electricity [47].
The only significant effort by government related to the harnessing of solar energy is the development of the Quaid-e-Azam Solar Power Park underway in the Bahawalpur district of Punjab. At completion, the total installed capacity of this solar project will be 1000 MW [48]. It is evident from this analysis that the share of solar energy for electricity generation is negligible and requires colossal efforts for the development of the solar energy sector to ensure sustainable supplies to address the demand–supply gap and ensure energy security.

3.2. Hydropower

Pakistan has an enormous resource potential of hydropower, with a suitable amount of water at appropriate terrains to generate electricity [49]. The northern parts of the country are rich with significant hydropower resources, while few resources are also identified in the southern part of the country. In all, it is estimated that these resources have a potential of 60,000 MW of electricity generation [50]. As such, Pakistan can sufficiently produce electricity from hydro resources, with only a mere potential exploited so far. About 89% of the potential is yet to be harnessed. The current total installed capacity of the hydropower units of Pakistan is only 6556 MW [42].
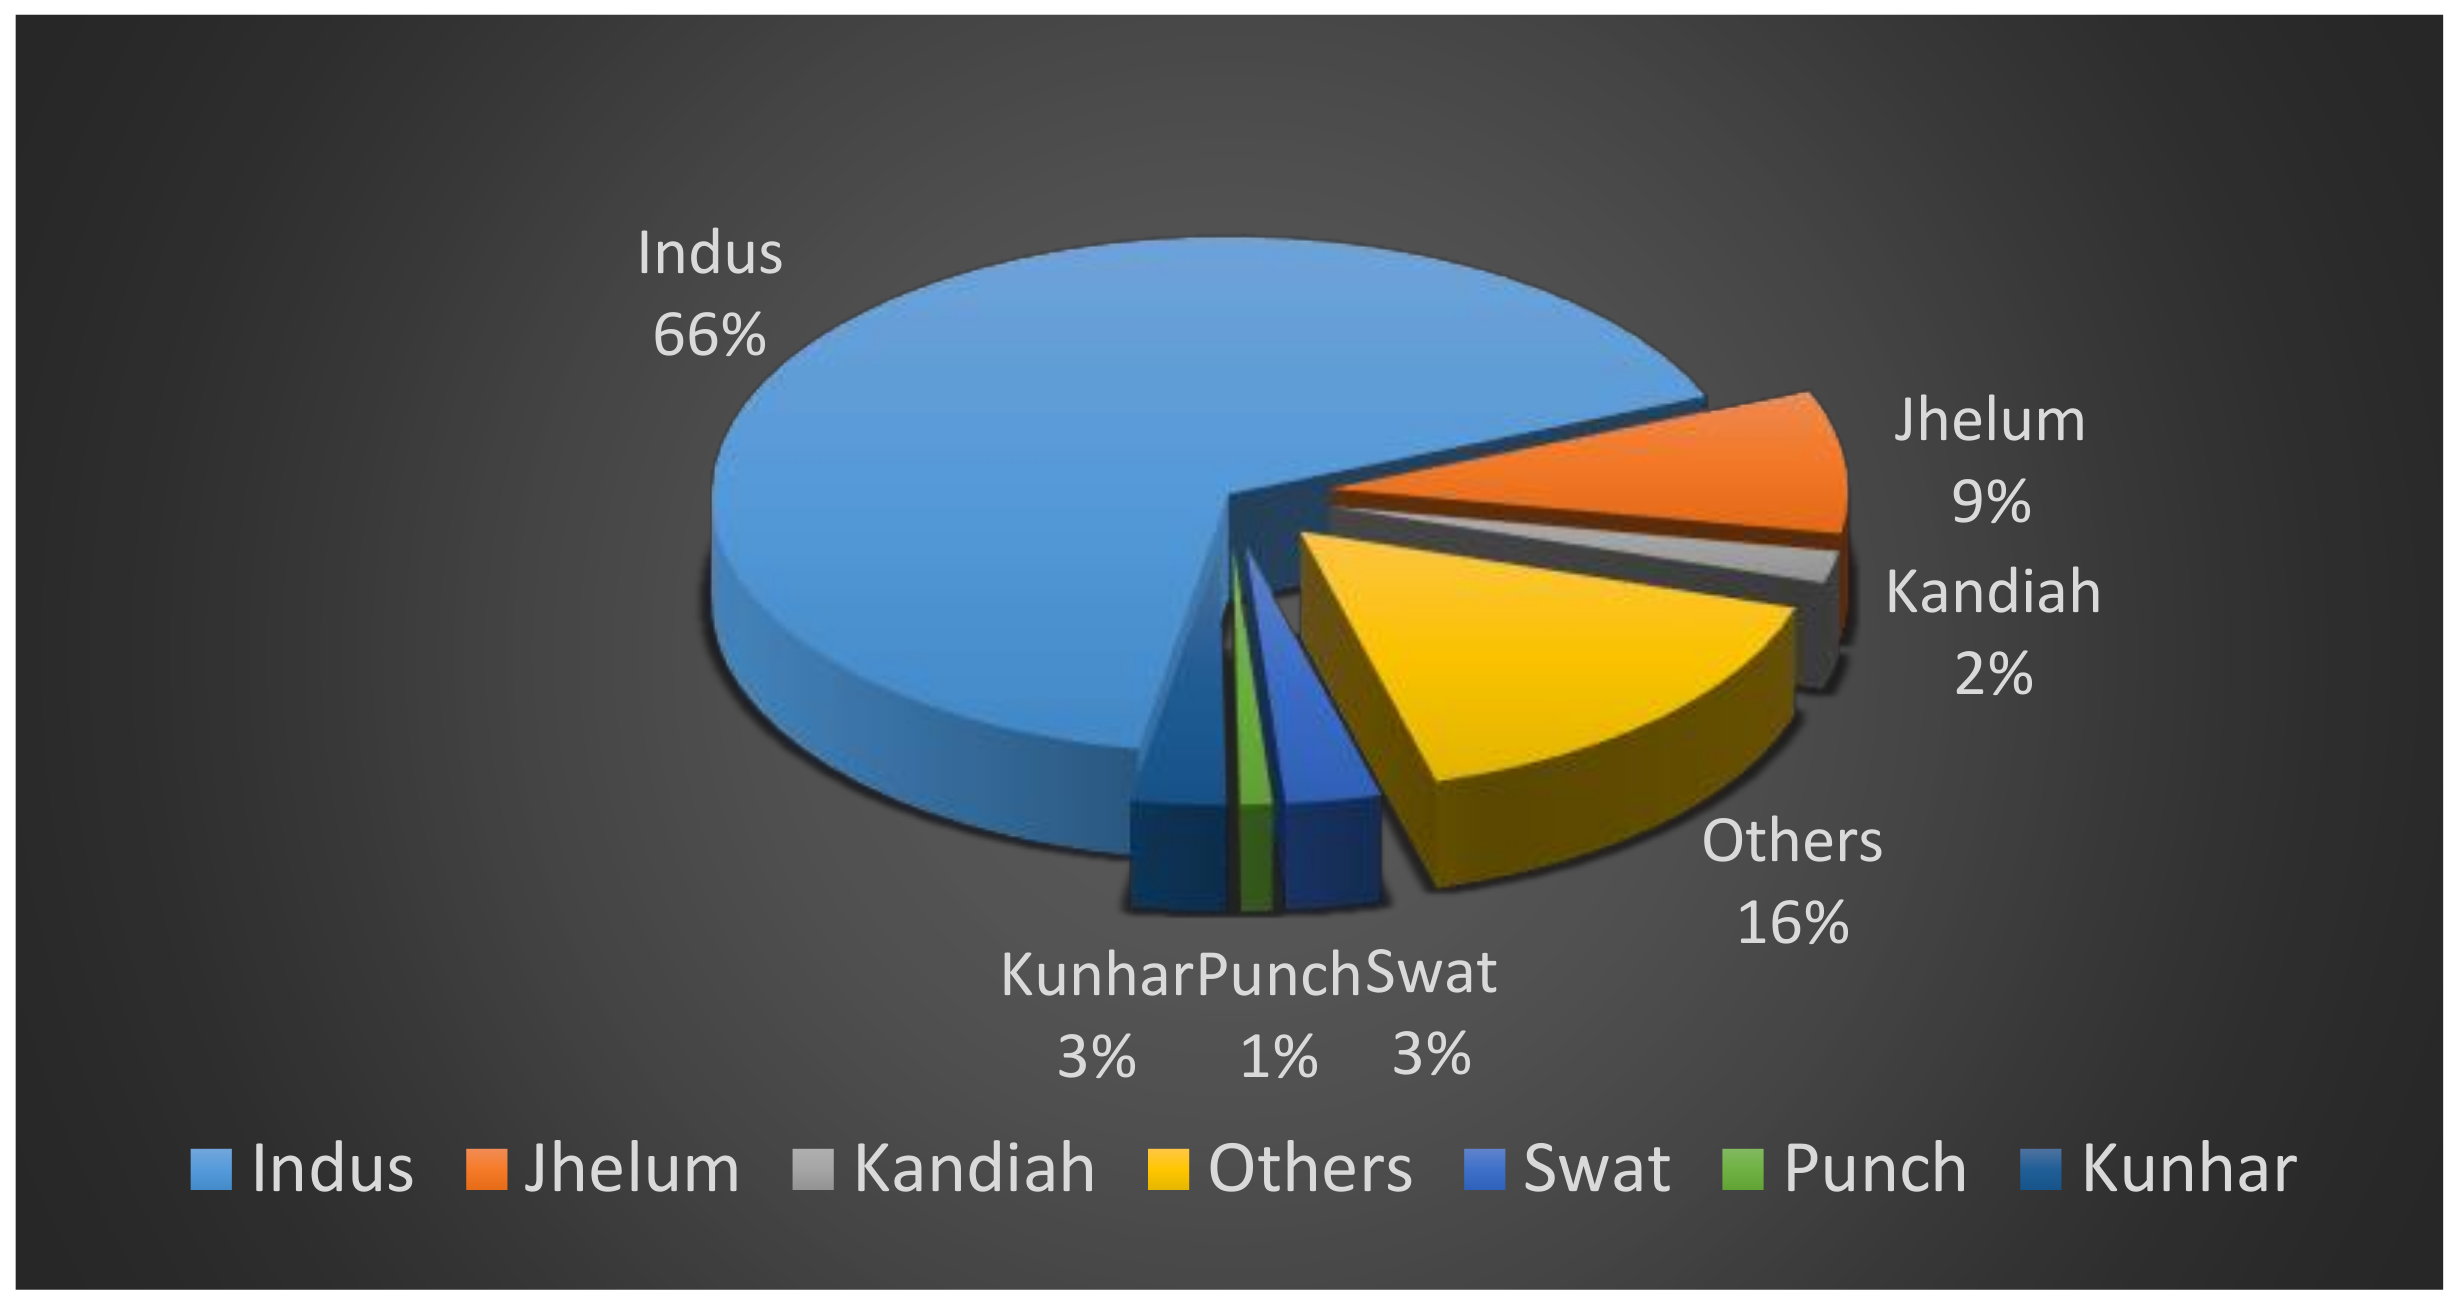
The key hydropower resources identified in the terrain of Hindukush, Himalayas, and the Karakoram ranges include flows from various rivers, namely Indus with a potential of 66% of electricity generation followed by Jhelum, 9%, Swat, 3%, Kunhar, 3%, Kandiah, 2%, Punch, 1%, and others, 16% [51]. Figure 2 illustrates the total estimated shares of identified hydro resources of major rivers of Pakistan.
At present, hydropower is the most economically viable, environmentally friendly, and cheapest source of electricity in Pakistan. It contributes 26% of the total power generation in Pakistan. The Government of Pakistan (GoP) plans to add 13 hydro projects with a capacity of 20,733 MW by 2023, whereas six projects sites have been identified with the capacity and feasibility of 8650 MW of electricity [50]. Hydropower is one of the oldest and most mature RE resources in the world. Therefore, considering the huge hydropower potential, the GoP needs to give it top priority and undertake the development of hydro-based projects in the country.

3.3. Biomass Energy

Biomass is a sustainable RE resource and is widely available [52]. Pakistan is an agricultural country and is the 5th largest sugarcane producer in the world [48]. The average 50 million tons of sugar yields provides an estimated 10 million tons of bagasse annually from sugar mills. The AEDB has identified the bagasse potential of 1800 MW and the waste-to-power potential of 500 MW with the help of Germany, USA, and Denmark [49,53]. As such, the AEDB has begun to install biomass-to-energy power plants of 12 MW, 11 MW, and 9 MW in Punjab and Sindh. However, these initiatives are not sufficient compared to the significant potential of biomass energy of the country.
With around 62% of the population of country living in rural areas, it is estimated that, overall, including bagasse, 5000 MW potential of biomass is available in the country. Both agriculture and animal wastes are readily available in rural areas and are a cheap source that can be used for cooking and heating. Biomass energy potential is a promising source of energy seeking the greatest ever attention. Despite this huge potential of biomass in the country, no notable grid-connected power generation project has been developed yet. It is therefore high time that government takes care of significant biomass resource toward electricity generation.

3.4. Wind Energy

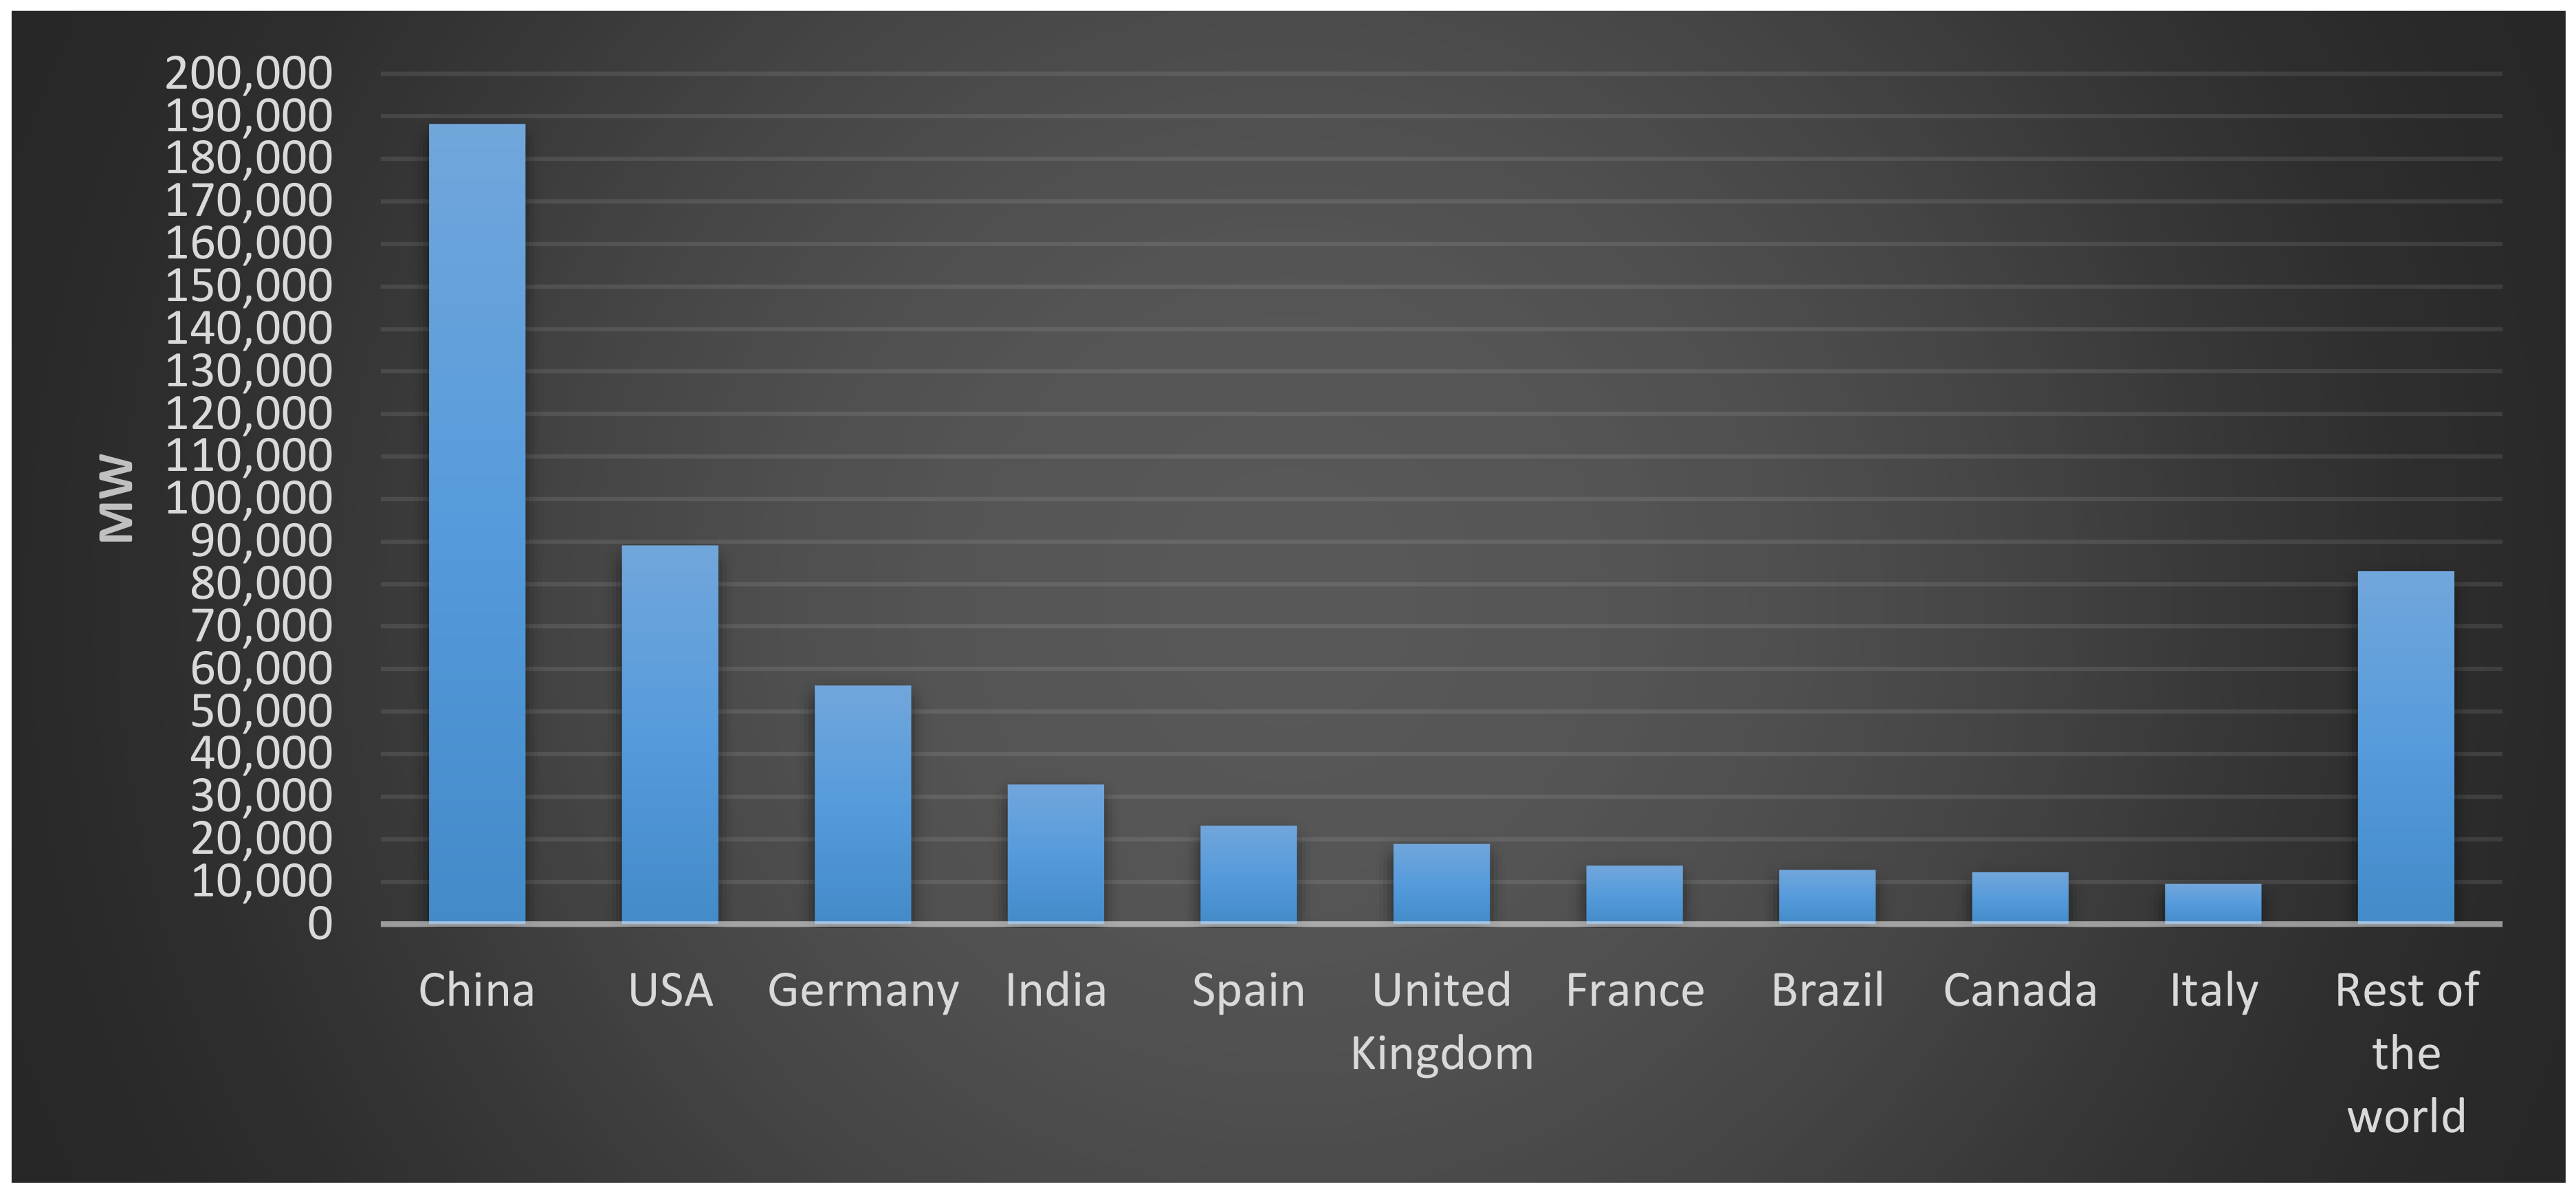
Electricity generation from wind energy has grown remarkably over the past decade; as such, wind energy is now the second leading source of RE for providing electricity globally. With its promising potential, energy experts believe that wind energy will provide one-third of total global electricity supplies by the year 2050. Countries like Germany, India, and Brazil have been leading wind energy development over the last few years [54]. China is, however, far ahead in the global wind power market with a total cumulative installed capacity of 188,232 MW followed by USA and Germany with 89,077 and 56,132 MW, respectively [55]. Figure 3 highlights the cumulative wind power installed capacity of the top 10 countries and the rest of the world in 2017.

3.4.1. Wind Energy Resources in Pakistan

Pakistan also has abundant wind energy potential for electricity generation. Wind projects, mainly comprised of 50–100 MW units in a wind corridor in the Sindh province, with a cumulative 500 W capacity were installed by 2003 [56]. PCRET also installed 26 micro units of wind energy, each of 500 W, in the village of Gul Muhammad, and it is stated to be the first wind energy-electrified village of Pakistan. It is estimated that Pakistan is capable of producing about 346,000 MW of wind power [
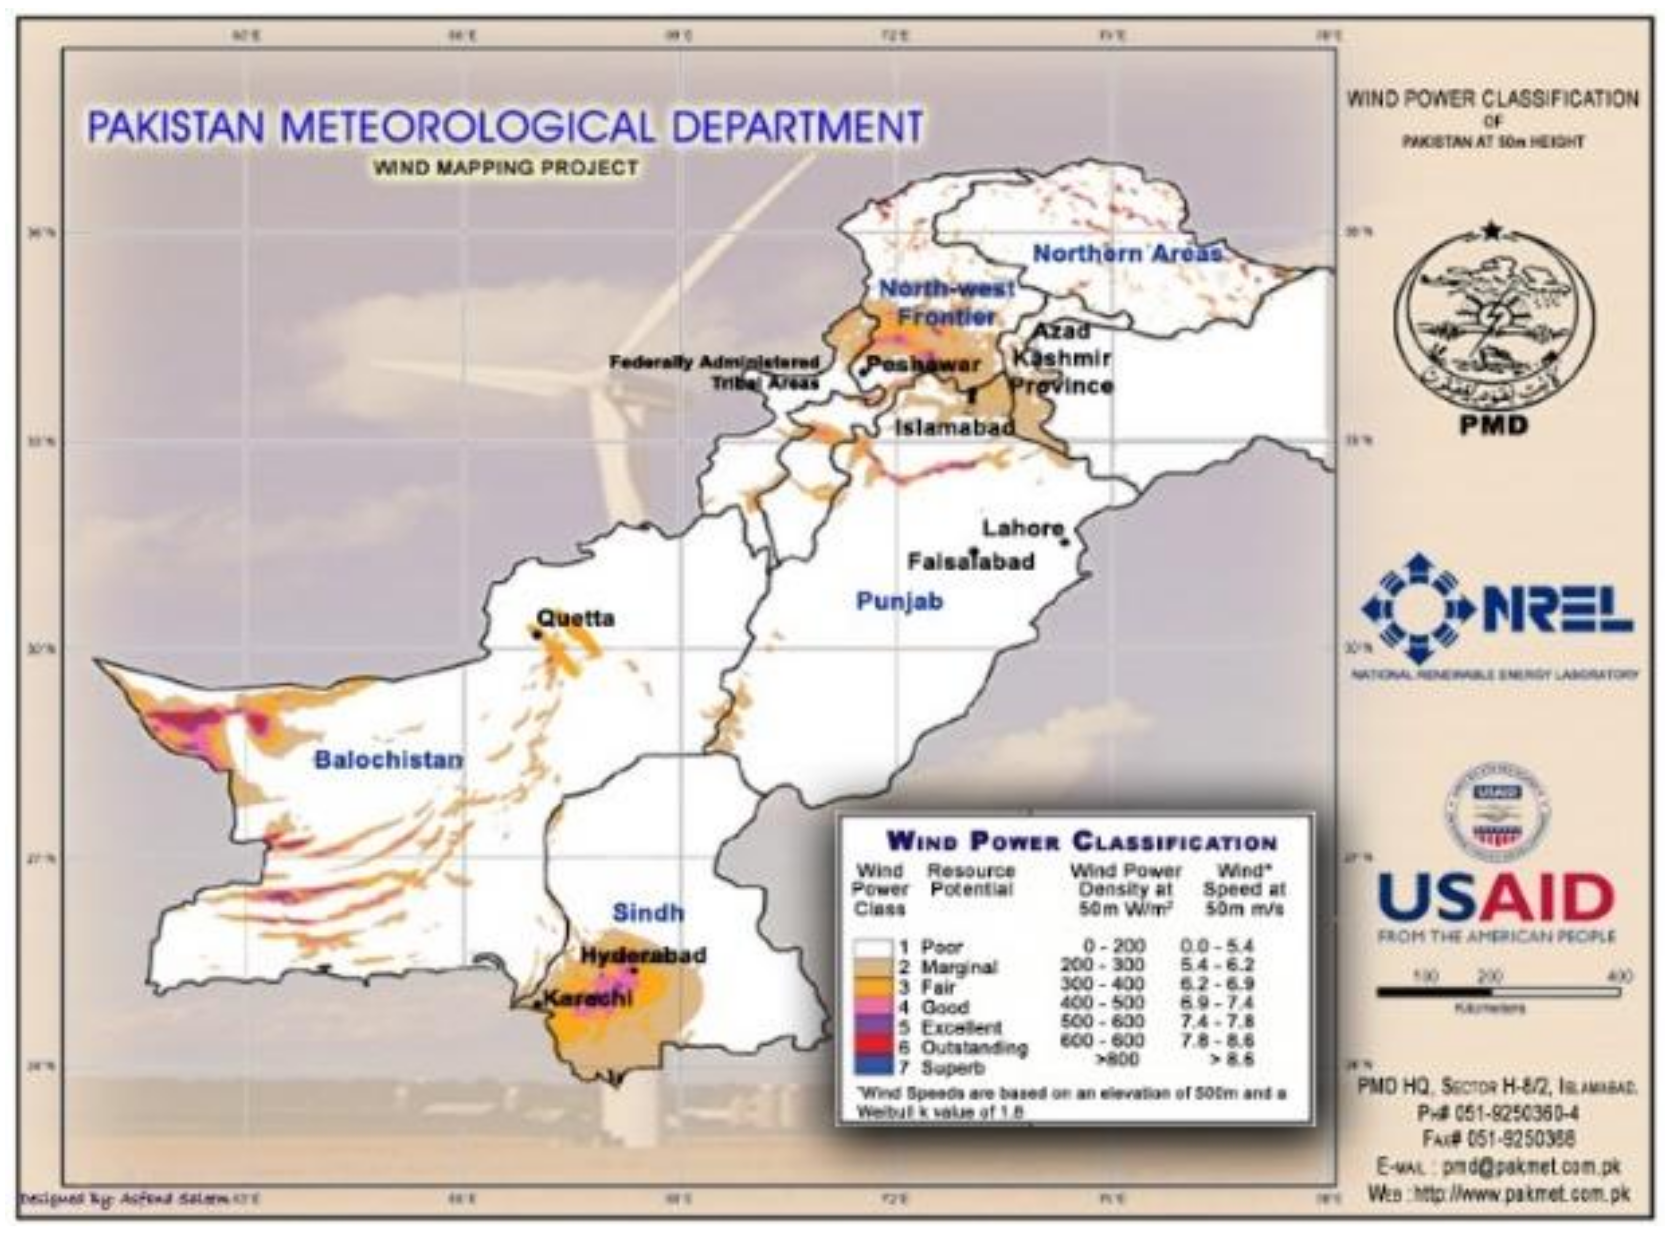
24]. However, the first major wind power project of Pakistan only became functional in 2013. According to a survey, 50,000 MW of wind power potential has been identified in the southern regions of the country alone, i.e., in Sindh and Baluchistan, whereas a wind power capacity of 1000–1500 MW has been estimated in the Punjab province. The Pakistan Meteorological Department (PMD) surveyed the wind speed in the coastal areas of Sindh and Baluchistan and found a persistent wind speed of 5–7 m/s [57]. The PMD has also measured wind in two regions in Sindh, namely Gharo and Keti Bandar. Following a year-round survey and data collection, these sites were found to be ideal for wind power projects. The annual mean wind speed in Gharo was estimated to be 6.86 m/s from the above-ground level of 50 m, while 408.6 W/m2 is the annual power density of the area. These figures show that this area has good wind potential and is economically feasible for large wind farms. The wind power potential of Pakistan is shown in Figure 4.

3.5. Geothermal Energy

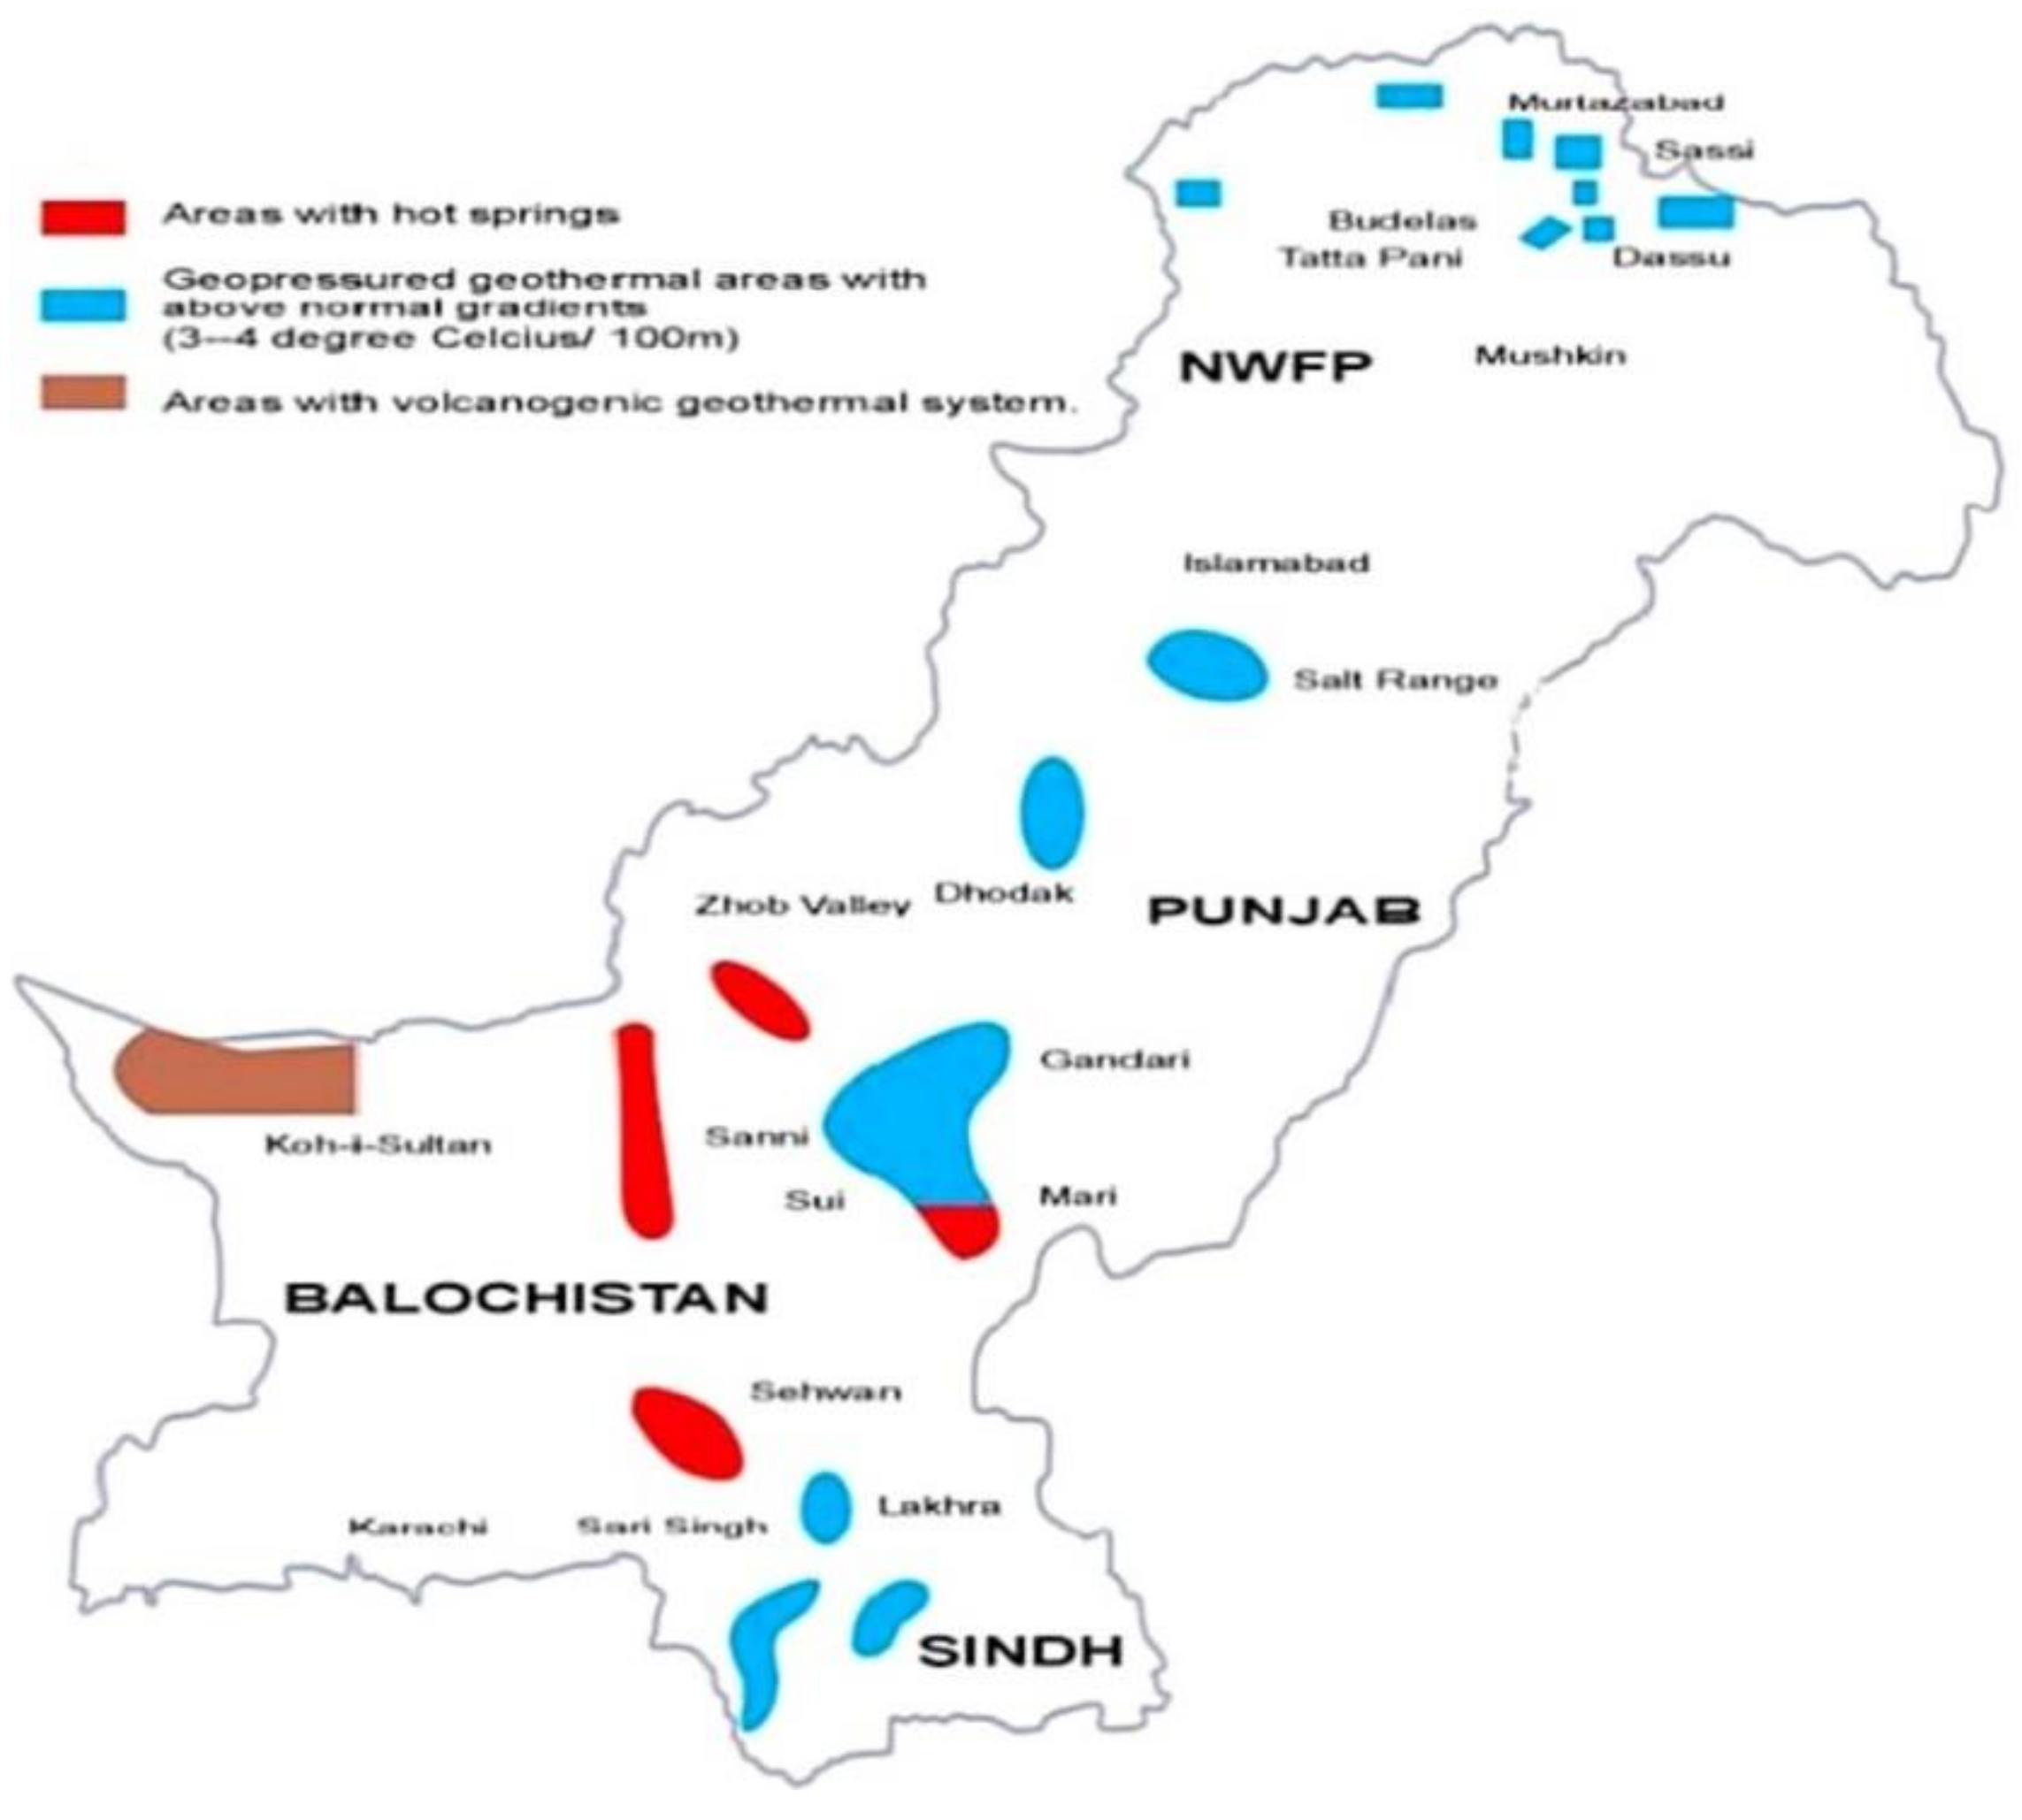
Pakistan has an enormous potential of geothermal energy, especially in KPK, Baluchistan, Kashmir, and Himalayas, with temperatures estimated around 30–170 °C [45]. Geothermal energy is a type of heat energy that is present inside the surface of the earth in the form of volcanoes, hot springs, and hot water. Further, it is identified that Pakistan can produce up to 100,000 MW of electricity from geothermal resources [44]. However, no effort has been made by government to utilize geothermal energy, so substantial investment and planning is required for implementation of geothermal energy projects in Pakistan. This renewable resource can also be useful for space heating and cooling in buildings, greenhouses, hot water supply, fish farming, and establishing small industries requiring heat. A geothermal resource potential map is presented in Figure 5.
It is evident from the above analysis that Pakistan essentially needs to seriously plan and make the required policy decisions for the development of indigenous RE resources. However, it is understood that evaluation, selection, and prioritization of these resources is a complex process with divided opinions among policy-makers, and stakeholders may have a different view as well. This is common in most developing countries, where limited financial resources are major constraints in developing RE resources. As such, for the case of Pakistan we propose and develop a multi-criteria decision model taking into account various criteria, as well as experts’ weights of these criteria, and subsequently prioritize the RE resources of the country.

4. An Integrated Decision Framework

The proposed integrated decision framework of the present study is provided in Figure 6. In the first instant, using the Delphi method, key criteria are identified; these criteria and sub-criteria are then determined using AHP methodology. Finally, the F-TOPSIS method is employed to prioritize the alternatives (i.e., renewable energy resources).
The detailed elaboration of each module of the proposed decision model is provided in the following sub-sections.

4.1. The Delphi Method

The Delphi methodology was originally developed by the RAND Corporation in the 1950s for eliciting expert opinion [59]. This research method is a systematic and interactive method to collect and analyze experts’ judgment or opinion by collecting data, brainstorming for problems, prioritizing the issues, forecasting, and decision-making [60]. It is a very useful method when there is a lack of clarity with decision makers and stakeholders regarding certain decisions.
In the precedent literature, the experts’ group size seems to be different in each study, but a panel of experts between 9 and 18 participants is suggested in order to obtain pertinent results and avoid any disagreement among experts [61]. Skulmoski et al. [62] recommended that the participants possess knowledge of different aspects of decision problems in order to be designated for the Delphi survey panel. Relevant experience and knowledge about the survey, time capacity, willingness to participate, and strong communication skills are also desired. The Delphi approach is at the first stage of our decision framework, which includes review of the literature and a survey from experts to finalize appropriate criteria toward addressing the decision problem of prioritizing RE resources. The first round is exploratory in nature. Following a comprehensive literature review, key criteria influencing RE resource prioritization such as economic, environmental, technical, and socio-political considerations have been explored. This followed the questionnaire survey process, which was conducted through electronic mail sent to academia, stakeholders, industry, and government energy experts, in order to save expenses and time. In the study, we evaluated the coefficient of variation (CV) and content validity ratio (CVR) of the survey. When the CV values were less than 0.50, a further round for evaluating criteria was not undertaken [63]. Further, the CVR proposed by C.H. Lawshe [64] and its calculation suggested by Wilson et al. [65] were employed to measure agreement among experts, determining the importance of specific criteria. The CVR ranges from +1 to −1. A greater, positive value indicates that experts were in agreement that a criterion was important. A CVR higher than 0.29 can usually be regarded as a suitable assessment level. The CV is the ratio of the standard deviation to the mean. It is easy to compare the consistency of the overall obtained data using the CV, as presented in Equation (1).
C V R = N E N 2 N 2
where NE is the number of experts representing assessed criteria, which is “important”, and N = the total number of experts.

4.2. Analysis of RE Resources Using MCDM Techniques

Evaluation and selection decisions pertaining to prioritization of RE resources for long-term development is a complex process. This is mainly because the nature of decision problems are multi-faceted and owing to various constraints and limitations [66]. In this context, multi-criteria analysis of such complex problems is useful and appropriate for technology choice, considering long-term energy planning, resource potential, acquisition and deployment of renewables, and the uncertainty of future energy demand. Therefore, AHP and F-TOPSIS methodologies of MCDM are used in this study to analyze the decision problem with economic, environmental, technical, and socio-political aspects as main criteria, and solar, hydro, biomass, wind, and geothermal energy as alternatives in the decision model. It is anticipated that this approach will provide an improved mechanism for decision making in the RE sector compared to traditional assessment methods such as cost–benefit or techno-economic analysis. No study in the Pakistani context has evaluated RE resources based on an integrated AHP and F-TOPSIS framework. However, there are a few studies in the literature wherein decision evaluation has been undertaken using limited criteria and minimum sub-criteria.

4.2.1. Analytical Hierarchy Process

Various MCDM methods are often used and are popular in energy planning decision-making [67]. AHP is one of the most widely used MCDM methods in this context. It provides a means of decomposing a complex problem into a hierarchy of sub-problems that are further subjectively evaluated. The subjective assessments are later converted into numerical form and are arranged to rank each alternative on a numerical scale. Thomas L. Saaty developed the AHP methodology in the 1970s and is accomplished using the following steps [68].
Step 1. The decision problem is divided into different levels in a hierarchical manner comprised of goal, criteria, and sub-criteria. The elements at one level are related to those at other levels, and a hierarchical relationship is established between them.
Step 2. Corresponding to the hierarchical structure, data is collected from the decision makers based on a pairwise comparison of criteria on a numerical scale, which is illustrated in Figure 7.
Step 3. The various criteria are compared to determine the relative importance via the principal eigenvalue and the corresponding normalized eigenvector of the comparison matrix. The elements of the normalized eigenvector are then named as weights with respect to criteria and sub-criteria.
Step 4. The matrix consistency of order n is assessed. The matrix comparison undertaken in this method is subjective, and inconsistency is tolerated by AHP through redundancy in the approach. The consistency index (CI) must be within the required level if it fails, and the comparison may be repeated. The CI is calculated as
C I =   ( λ max   n ) ( n 1 )
where λ m a x is the maximum eigenvalue of the judgment matrix, and n is the number of elements in the judgement. The C I can be compared with a random consistency index ( R I ) . The consistency ratio ( C R ) is calculated as
C R = C I R I
where R I is the random consistency index. The average C I of a randomly generated pairwise comparison matrix of similar size is illustrated in Table 3. Saaty suggests that the value of C R should be less than 0.1, while meaningless results may be found for a value of more than 0.1 [69].
Following implementation of the AHP methodology as per these steps, the F-TOPSIS method has been employed to finally evaluate and prioritize the best RE alternative.

4.2.2. F-TOPSIS

The TOPSIS technique was developed by Hwang and Yoon in 1981 [72]. It is based on the distance between positive and negative solutions i.e. the best alternative should be closest to the positive ideal solution, whereas the least favorable alternative should be farthest from the negative ideal solution. The fuzzy logic or fuzzy set theory is a powerful mathematical technique used to address uncertain and imprecise information in decision problems [73]. Fuzzy logic was developed by Lofti A. Zadeh in 1965 [74]. When fuzzy logic is combined with TOPSIS, it provides additional decision support, and this combined methodology is known as fuzzy TOPSIS (F-TOPSIS). This method can be based on linguistic variables with triangular fuzzy numbers (TFNs); thus, in this study, a TFN scale was utilized and is shown in Table 4.
The detailed F-TOPSIS methodology implementation steps are described as follows:
Step 1. Obtain the evaluation matrix of decision-makers.
Step 2. Define the fuzzy decision matrix W ˜ .
W ˜ = ( w i j ) m × n
where w i j = ( w 1 i j , w 2 i j , w 3 i j ) .
Step 3. Compute the normalized fuzzy decision matrix, indicated by W ˜ , is shown as
W ˜ = [ w i j ] m × n
where i = 1 , 2 , 3 , , m and j = 1 , 2 , 3 , , n .
For the benefit criteria, conduct the normalization process using Equation (6).
w i j = ( w 1 i j w 3 j * , w 2 i j w 3 j * , w 3 i j w 3 j * ) .
For cost criteria, conduct the normalization process using Equation (7).
w i j = ( w 1 j w 3 i j , w 1 j w 2 i j , w 1 j w 1 i j ) .
Step 5. Calculate the weighted normalized fuzzy decision matrix. The weighted normalized fuzzy decision matrix is presented using Equation (8).
V ˜ = [ v i j ] m × n
where v i j = w i j × w j
Step 6. Identify the distance between ideal positive solution ( d i + ) and negative ideal solution ( d i ) using Equations (9) and (10).
d i + = ( v 1 * , v 2 * , v 3 * , , v n * )
where V j + = ( 1 , 1 , 1 ) j = 1 , 2 , 3 , , n .
d i = ( v 1 , v 2 , v 3 , , v n )
where V j = ( 0 , 0 , 0 ) j = 1 , 2 , 3 , , n .
Step 7. Calculate the closeness coefficient ( C C i ) using Equation (11).
C C i = d i d i + + d i
where i = 1 , 2 , 3 , , m .
Step 8. Evaluate and prioritize the optimal alternative according to the C C i value.
We have taken into account both cost and benefit criteria. Resource potential (ECA3), job creation (SPA2), and energy security (SPA3) are considered as benefit criteria, while the rest are taken as cost criteria. All these criteria play a crucial role in assessing and prioritizing RE resources for electricity generation.

4.3. The Survey Respondents for the Delphi, AHP, and Fuzzy TOPSIS Study

It is critical to finalize and consult with specialized experts while implementing the Delphi, AHP, and F-TOPSIS methodologies since the understanding and relevancy of experts in assigning weights could be quite conflicting and uncertain [76]. In order to achieve the objective of this study, we approached 15 experts from academic institutions, government energy departments, stakeholders, and industries. However, out of these 15 only 10 experts agreed to participate in these study surveys. The demographic information of experts is given in Appendix A. YAAHP software (Version 10.5) was used to obtain the weights of main criteria and sub-criteria. Subsequently, the F-TOPSIS method was employed with Microsoft Excel to analyze and rank RE alternatives for electricity generation in Pakistan.

4.4. The Process of Delphi, AHP, and Fuzzy TOPSIS Methodology Implementation

Initially, the Delphi method was employed with the help of 10 experts’ feedback to identify the main criteria and sub-criteria for evaluating RE resources of Pakistan. From the Delphi analysis, the authors shortlisted four main criteria and their 20 sub-criteria for further analysis. Secondly, AHP and F-TOPSIS methods of MCDM were employed to obtain the weights and rank the criteria, sub-criteria, and alternatives. The AHP method has the strength to analyze quantitative and qualitative factors altogether in one model. Therefore, expert assessment was employed at the AHP step to evaluate the four criteria and 20 sub-criteria, while the F-TOPSIS approach was employed to prioritize the five RE alternatives of the decision model.

4.4.1. Data Analysis of RE Resources

In this study, alongside wind, geothermal, and biomass resources, mini-hydropower and solar PV are considered as alternatives, while large hydropower and solar thermal are excluded from the study for being cost-intensive and technologically complex. Table 5 provides the key quantitative data related to RE resources that include average initial cost, O&M cost, efficiency, capacity factor, expected life of the RE plants, and CO2 emissions avoided per year. Table 6 provides the information pertaining to the job creation, land requirements, and power generation cost of RE-based plants in the USA. It is pertinent to mention that the data of Table 6 is taken from a developed country where labor and other associated costs are quite expensive. It is, therefore, assumed that implementing RE-based plants in Pakistan will create more jobs than the USA. Moreover, for the land requirement, areas requiring a low amount of land are generally preferred for developing RE-based plants. It is also noted that in the case of wind energy plants, wind farms can also be used for other activities such as farming and cattle cropping. As such, wind farms can be far more useful compared to other RE resources where land cannot be utilized for other purposes.
Lastly, Figure 8 shows the public opinion regarding the acceptance of the implementation of RE-based plants in Portugal and Australia [80]. The public acceptance is one of the sub-criteria of the socio-political aspect in this study. The public opinion varies from country to country, but in general the public is favorable toward greener technologies for the electricity generation.

5. Results and Discussion

Assessment and prioritization of the best RE resource is a difficult and complex decision problem. However, an attempt has been made in the context of Pakistan to address this decision problem by considering four main criteria and 20 sub-criteria to evaluate five RE resources for the electricity generation in Pakistan.

5.1. Delphi Results

In this phase, the experts were not only asked to assign the weights to the criteria but also to recommend additional criteria which they consider important for evaluating RE resources. The data analysis was undertaken using the CV and CVR values of each criterion. Each evaluation criterion met the required CV (less than 0.5) and CVR (greater than 0.29) levels. The detailed CV and CVR results of the various criteria and sub-criteria are given in Appendix A. Finally, the refined results regarding criteria and sub-criteria that would influence the assessment process of RE resources are shown in Table 7.
The four main criteria and 20 sub-criteria were identified via the Delphi approach. These criteria are useful in assessing the potential of various RE resources of Pakistan. Later, each of the main criteria and sub-criteria are ranked via the AHP method. A brief description of each of these criteria is summarized as follows:

5.1.1. The economic aspect (ECA)

The economic aspect is significant for the selection and ranking of RE resources in Pakistan. The various sub-aspects (sub-criteria) have been identified from economic perspectives and are defined as follows:

Initial Cost (ECA1)

Initial cost is defined as the total expenditure required for establishing a renewable power plant and comprises the labor, equipment, and infrastructure development costs as well. RE resources that require low initial cost are generally preferred.

Operation and Maintenance Cost (ECA2)

O&M cost comprises the total cost of operating and undertaking the regular maintenance of the plant including the salaries of workers; the maintenance costs ensure system operation and reduce downtime. RE resources with a low O&M cost requirement are generally preferred.

Resource Potential (ECA3)

Resource potential is the availability of renewable resources (solar, hydro, biomass, wind, and geothermal energy) in the region to produce energy. RE resources with more potential to generate electricity are preferable.

Energy Generation Cost (ECA4)

Energy generation cost is defined as the cost of electricity generated from renewable power plants. RE resources with a lower electricity generation cost are preferable.

The Expected Life of RE Plant (ECA5)

A renewable plant has a life expectancy. The expected life of the RE plant depends upon the raw resource used to generate electricity. Thus, this sub-criterion is very important when analyzing an RE plant. As such, RE resources with a greater plant life expectancy are preferable.

5.1.2. The environmental Aspect (ENA)

The environmental aspect plays a key role in the selection and ranking of various RE resources (i.e., solar, hydro, biomass, wind, and geothermal energy). These aspects include CO2 emission reduction, impact on environment, land requirements, and noise, which are individually defined as follows:

CO2 Emissions Reduction (ENA1)

This criterion pertains to minimum CO2 emissions from RE resources, including their production and transportation. RE resources that cause low CO2 emissions are preferable.

Impact on Environment (ENA2)

A RE power plant’s impact on the environment and on its surroundings is important. As such, RE resources that cause low or no impact on the environment are preferable.

Land Requirement (ENA3)

RE power plants require land for physical installation. RE resources that occupy a low amount of land and can be used for other purposes such as cultivation and farming are preferable.

Noise (ENA4)

The probability of noise pollution due to the installation of RE power plants in the region is significant. As such, RE resources that have less or zero noise pollution are preferable.

5.1.3. The technical Aspect (TA)

The technical aspect is an important part of choosing an optimal RE resource for electricity generation. There are several key sub-aspects from the technical perspective and are defined as follows:

Technology Maturity (TA1)

This indicates how technology is extensive at regional, national, and international levels. RE resources with a mature technology are generally suitable for electricity generation.

Efficiency (TA2)

The efficiency of an electricity plant is denoted by the ratio of output energy to input energy. RE resources with greater efficiency are preferable.

Capacity Factor (TA3)

The capacity factor indicates how useful and productive energy obtained from an RE source can be. RE resources with a high capacity factor are more useful for electricity generation.

Human Resource Expertise (TA4)

Human resource (HR) experts and their availability in the country to operate and maintain the RE-based power plant is important. As such, RE resources that have more HR experts available are recommended.

Climate Conditions (TA5)

Climate conditions affect generation from a power plant; the performance of RE-based plant depends on these conditions. RE resources that are favorable and useful in different climate conditions are generally preferred.

Reliability/Feasibility (TA6)

Reliability is described as the ability of an electric power plant to perform essential functions under specified conditions. A constant and sufficient amount of electricity generation thus needs to be ensured. RE resources with higher reliability and feasibility are preferable.

5.1.4. The Socio-Political Aspect (SPA)

The socio-political aspect is crucial for the selection of RE resources in Pakistan. Similarly, this aspect has important sub-aspects (sub-criteria) and each of these has been described here:

Public Acceptance (SPA1)

Public acceptance is defined as an acceptability and opinion about the utilization of RE plants in the region. RE resources with a more favorable opinion are preferable.

Job Creation (SPA2)

RE plant installation promises job creation and opportunities for the locals in terms of both technical and non-technical positions. RE resources that create more job opportunities for the local people are preferable.

Energy Security (SPA3)

Energy security will be strengthened by installing and utilizing RE resources in the country. RE resources that can generate more electricity and help the country to reduce its reliance on fossil fuels are preferable.

Institutional Arrangement (SPA4)

Institutional arrangement is required for the development of RE resources. RE resources with an existing institutional arrangement are preferable.

The Regulatory Mechanism (SPA5)

Mechanisms that support the promotion of tariffs, long-term contracts, or mandatory targets are crucial for the deployment of RE-based plants. RE resources with a suitable regulatory mechanism are preferable.

5.2. AHP Results

The AHP technique was employed to develop the pairwise comparison matrix of the identified criteria and sub-criteria. Each element of this matrix signifies a numerical importance with the other element in the matrix entry comparison. The calculations are partly based on actual objective data for priority weightage/ranking associated with sub-criteria.
The CR and RI were determined using Equations (2) and (3). The AHP model thus provides the results of various pairwise comparisons at different levels of the hierarchy. The detailed pairwise comparisons matrices of criteria and sub-criteria are provided in Appendix B. Further, Table 8 illustrates the local and global weight and overall ranking of each main criteria and sub-criteria. The results of AHP methodology in this study reveal that the economic aspect is considered the most important criterion, with a weight of 0.3695, followed by socio-political and technical aspect criteria, with comparative scores of 0.2959 and 0.1859, respectively. The environmental aspect secured the last place in the pairwise comparison of the main criteria. In the pairwise comparison of sub-criteria, the resource potential is ranked as the priority sub-criteria from economic perspective. These aspects are rightly identified as they pose serious challenges for the government to eradicate the on-going energy crisis and maximize the utilization of RE resources for sustainable development. Experts also ranked energy security as the second most important sub-criterion of the socio-political crtierion, followed by regulatory mechanism, job creation, institutional arrangement, and public acceptance. From the environmental perspective, CO2 emission reduction and land requirements were considered the most important sub-criteria. Technology maturity was the most significant sub-criterion of the technical criterion. The preference of technology maturity over efficiency and reliability shows the lowered risk and sustainability of new renewable technologies.
It is evident from Table 9 that AHP methodology pairwise comparisons of criteria and sub-criteria have been accomplished.

5.3. Fuzzy TOPSIS Results

Finally, F-TOPSIS methodology was employed to determine the optimal RE resource from the given five RE alternatives. Initially, we obtained the decision matrix by providing the TFNs of the alternatives, obtained the normalized decision matrix, and further weighted the normalized decision matrix, provided in detail in Appendix C. The results of F-TOPSIS indicate that the wind energy-based electricity generation is the most prioritized alternative since it has the least distance from the ideal solution. Table 9 provides a summary ranking of the five RE resources of Pakistan considered in this study. The closeness coefficient C C i indicates that wind energy achieved the highest score, 0.035, followed by 0.034 for hydro, 0.033 for solar, 0.031 for biomass, and 0.031 for the geothermal alternative. Wind energy ranks first on the basis of the renewable potential in the country, a lower capital cost, the land’s potential for cultivation and cropping, higher efficiency and public acceptance, good energy security, and the lower impact on the environment, with low or zero greenhouse gas emissions.

5.4. Sensitivity Analysis

A sensitivity analysis was undertaken to investigate any major or minor variation in experts’ preferences that might change the results. As such, we examined the level of significance of criteria weights with the ranking of RE resources (i.e., alternative) one by one. Five scenarios were accordingly evaluated, revealing that the priority order of the alternatives does not vary and remains the same. Table 10 provides the criteria weights in the evaluated scenarios. Moreover, Table 11 shows the obtained results/rankings of the sensitivity analysis. Scenario 1 is the weights of this study, whereas the rest of the scenarios are considered for the sensitivity analysis. The results of Table 11 signify that results of Scenarios 2 and 3 have no impact on the ranking order of the alternatives; in Scenarios 4 and 5, the ranking order of alternatives (solar and hydro) has changed.
In summary, the sensitivity analysis reveals that there is no significant change in the main findings of the study; therefore, it appears insignificant to change the weights of the obtained results. Wind energy remained the highest ranked alternative, followed by hydro, solar, biomass, and geothermal. Thus, the study results are considered valid and robust.

6. Conclusions

Pakistan has not been able to diversify its electricity generation from fossil fuels to RE resources. Thus, the share of RE in the overall energy mix is negligible. The ongoing energy crises, the ever increasing circular debt of the power sector, and decreasing economic growth may cause further crises in the economy. It is also believed that energy demand will increase in the future. Given these facts, it is now impossible to neglect the indigenous RE resource development for electricity generation in Pakistan. As regards the decision problem pertaining to the prioritization of RE resources for harnessing, this study lays a foundation for planning and policy makers of the country to consider scientific decision aid methods.
As such, in this study, five majors RE resources of Pakistan, treated as alternatives, are analyzed and ranked on multiple decision criteria. In the AHP criteria weight analysis, the highest scores were attained for the economic aspect, followed by socio-political, technical, and environmental criteria. The quantitative and qualitative data was analyzed for overall synthesis. The AHP model results illustrated that resource potential and energy generation costs were the highest-ranked sub-criteria in the economic aspect. CO2 emission reduction and land requirements were the top-ranked sub-criteria in the environmental aspect. Technology maturity and efficiency emerged as the highest-ranked sub-criteria in the technical aspect. In the socio-political aspect, energy security and regulatory mechanisms appeared as top-ranked sub-criteria. Therefore, all selected main criteria and the top-ranked sub-criteria should play a significant role in the development of RE resources in Pakistan. In terms of F-TOPSIS, alternative weights and thus priority ranking wind energy attained the highest score, followed by hydropower, solar, biomass, and geothermal resources. Furthermore, sensitivity analysis provided additional confidence regarding the results of this study. In general, this study highlights the importance of wind energy, which can be effectively utilized for electricity generation in Pakistan. The integrated Delphi, AHP, F-TOPSIS methodologies, in fact, enabled us to understand the decision variants more specifically with regard to common criteria, thereby synthesizing the qualitative criteria into numerical values and thus providing results with adequate clarity.
The top ranking of the wind energy resource for harnessing and exploitation for electricity generation is also in consonance with international and national level development in the wind energy sector. It is therefore recommended that the GoP not only adopt a scientific basis for resolving energy planning and policy decision problems but also consider results of this study, which emphasizes the exploitation and development of available RE resource potential for sustainable electricity generation. These key recommendations in terms of prioritizing wind energy on other RE resources is viable and should be adopted because wind energy is the most abundant, economical, and environment-friendly source of electricity generation. We thus propose the following policy recommendations to promote the development of RE resources in Pakistan:
  • It is recommended that government should utilize advanced innovation or technology for the development of wind, hydro, solar, biomass, and geothermal energy.
  • Pakistan can use a competitive advantage to promote the overall industrial development and then create job opportunities and a sizable domestic market for the development of RE resources.
  • RE enterprises should be promoted to engage in the green energy industry and increase research and development to help enterprises. The government should organize information sharing platforms and technical seminars, and combine promotion policies to achieve sustainable development.
  • The electricity generation cost from the RE power plants must be low for residential or commercial use because this may obstruct the development of RE technology. Enterprises or people do not have enough incentive to install high cost RE technology. Therefore, regulating the electricity generation cost structure must be given top priority.
  • Feed in Tariffs should be reduced, and this would also encourage stakeholders to invest in the RE market.
  • New transmission and distribution (T&D) networks should be developed to increase efficiency and decrease T&D losses in the energy system.
  • There are many countries where RE technology accounts for more than 50% of electricity generation, such as Norway (96%), Austria (68%), Colombia (70%), Denmark (57%), Brazil (85%), Sweden (55%), and Iceland (100%) [101]. Thus, the GoP can refer to successful foreign cases to identify feasible implementation plans and accelerate the promotion and development of RE technology.
Further, for future research, more stakeholders, the inclusion of different experts, and the application of other MCDM methods such as VIKOR, DEMATEL, ELECTRE, ANP, and PROMETHEE can be utilized to refine results and can be explored to compare the results in search of any changes. In addition, more criteria and RE resources (such as offshore wind and tidal power) could be considered. We believe that further research can shed much more light on this subject.

Author Contributions

Conceptualization, Y.A.S. and Q.T.; Data curation, Y.A.S. and N.H.M.; Formal analysis, Y.A.S. and G.D.W.; Funding acquisition, Q.T.; Investigation, Y.A.S., N.H.M. and M.W.A.K.; Methodology, Y.A.S., N.H.M. and G.D.W.; Software, Y.A.S.; Supervision, N.H.M. and M.I.; Validation, M.I.; Writing—original draft, Y.A.S.; Writing—review & editing, Y.A.S. and N.H.M.

Funding

This paper was supported by the Social Science Foundation of China (15BGL029) and the Social Science Fund Major Project of Jiangsu Province (16ZD008).

Conflicts of Interest

The authors declare no conflict of interest.

Abbreviations

MCDMmulti-criteria decision making
AHPanalytical hierarchy process
F-TOPSISfuzzy technique for order of preference by similarity to ideal solution techniques
CRconsistency ratio
CIconsistency index
RIrandom index
CVcoefficient of variation
CVRcontent validity ratio
RErenewable energy
GoPgovernment of Pakistan
PMDPakistan meteorological department
AEDBalternative energy development board
PCRETPakistan council of renewable energy technologies

Appendix A

Table A1. Demographic information of experts.
DesignationQualificationAgeOrganization
Stakeholder Graduate55REAP, Lahore
StakeholderGraduate56Resource Future, Islamabad
ProfessorPhD43Mehran U.E.T, Jamshoro
ProfessorPhD38University of Sindh, Jamshoro
ManagerPhD52HESCO, Hyderabad
DirectorGraduate50NTDC, Islamabad
Secretary PhD48MoPW, Islamabad
DirectorGraduate45AEDB, Islamabad
Senior ManagerPhD48PAEC, Islamabad
Deputy DirectorGraduate40PCRET, Islamabad
Note: Names of the experts not revealed at their request. Questionnaire survey on the development of criteria for the selection of renewable energy resources.
Table A2. Coefficient of variation (CV) and content validity ratio (CVR) results of final evaluation criteria.
CriteriaCV (Less than 0.50)CVR (Greater than 0.29)
1. Economic Aspect (ECA)
1. Initial cost (ECA1)0.290.56
2. O&M cost (ECA2)0.270.48
3. Resource Potential (ECA3)0.170.75
4. Energy Generation Cost (ECA4)0.230.80
5. Expected life of RE plant (ECA5)0.250.65
2. Environmental Aspect (ENA)
1. CO2 Emission reduction (ENA1)0.320.80
2. Impact on Environment (ENA2)0.150.60
3. Land Requirement (ENA3)0.180.56
4. Noise (ENA4)0.310.65
3. Technical Aspect (TA)
1. Technology maturity (TA1)0.340.60
2. Efficiency (TA2)0.210.45
3. Capacity factor (TA3)0.190.50
4. Human Resource Expertise (TA4)0.260.60
5. Climate conditions (TA5)0.140.40
6. Reliability/Feasibility (TA6)0.160.40
4. Socio-Political Aspect (SPA)
1. Public acceptance (SPA1)0.320.45
2. Job creation (SPA2)0.110.75
3. Energy security (SPA3)0.120.80
4. Institutional arrangement (SPA4)0.370.80
5. Regulatory mechanism (SPA5)0.220.60

Appendix B

Table A3. Pair-wise comparison matrix of criteria with respect to goals along with the priority weight.
ECAENATASPAPriority WeightRank
ECA12.66731.78261.31950.36951st
ENA0.3749110.42510.14874th
TA0.5610110.69880.18593rd
SPA0.75792.35221.431010.29592nd
CR = 0.0102 < 0.10 and λmax = 4.1080
Table A4. Pair-wise comparison matrix of economic sub-factor.
(ECA1)(ECA2)(ECA3)(ECA4)(ECA5)Priority WeightRank
(ECA1)11.31950.41520.60841.93320.16884th
(ECA2)0.757910.45031.14871.78260.17253rd
(ECA3)2.40822.220611.43103.32270.34751st
(ECA4)1.64380.87060.698812.22060.21642nd
(ECA5)0.51730.56100.30100.450310.09495th
CR = 0.0157 < 0.10 and λmax = 5.2937
Table A5. Pair-wise comparison matrix of environmental sub-factor.
(ENA1) (ENA2)(ENA3)(ENA4)Priority WeightRank
(ENA1)11.88821.14873.51950.36951st
(ENA2)0.529610.5173188820.18863rd
(ENA3)0.87061.933213.17770.33822nd
(ENA4)0.28410.52960.314710.10374th
CR = 0.0011 < 0.10 and λmax = 4.0545
Table A6. Pair-wise comparison matrix of technical sub-factor.
(TA1)(TA2)(TA3)(TA4)(TA5)(TA6)Priority WeightRank
(TA1)11.14872.40824.28231.88821.88820.28041st
(TA2)0.870611.88823.89811.31951.14870.22032nd
(TA3)0.41520.529612.04771.148710.13545th
(TA4)0.23350.25650.488410.40660.37490.06086th
(TA5)0.52960.75790.87062.459510.80270.14154th
(TA6)0.52960.870612.66731.245710.16173rd
CR = 0.0057 < 0.10 and λmax = 6.2112
Table A7. Pair-wise comparison matrix of socio-political sub-factor.
(SPA1)(SPA2)(SPA3)(SPA4)(SPA5)Priority WeightRank
(SPA1)10.41520.24530.48840.37010.07715th
(SPA2)2.408210.36151.14870.65980.15633rd
(SPA3)4.07602.766313.39352.55080.42751st
(SPA4)2.04770.87060.294710.69880.13854th
(SPA5)2.70191.51570.39201.431010.20062nd
CR = 0.0095 < 0.10 and λmax = 5.1250

Appendix C

Table A8. Decision matrix.
ECA1ECA2ECA3ECA4ECA5ENA1ENA2ENA3ENA4TA1TA2TA3TA4TA5TA6SPA1SPA2SPA3SPA4SPA5
SE2.6, 4.6, 6.44.2, 6.2, 87, 8.6, 9.46.6, 8.4, 9.43.8, 5.8, 7.65, 7, 8.62.6, 4.6, 6.65, 6.8, 8.22.6, 4.6, 6.66.6, 8.6, 9.85.4, 7.4, 94.6, 6.6, 8.64.2, 6.2, 84.2, 6.2, 7.84.6, 6.6, 8.42.2, 4.2, 6.25.4, 7.4, 96.6, 8.4, 9.45.8, 7.8, 9.27, 8.6, 9.4
HE3.8, 5.8, 7.84.2, 6.2, 8.26.2, 8.2, 9.64.6, 6.6, 8.63.4, 5.4, 7.44.2, 6.2, 8.23.4, 5.4, 7.23, 5, 6.82.2, 4.2, 6.24.2, 6.2, 84.2, 6.2, 84.2, 6.2, 8.23.8, 5.8, 7.85.4, 7.4, 9.26.2, 8, 9.22.6, 4.6, 6.64.2, 6.2, 8.26.2, 8.2, 9.65.4, 7.4, 95.8, 7.8, 9.4
BE3, 5, 74.2, 6.2, 8.27.4, 9, 9.87, 8.8, 9.84.2, 6.2, 84.2, 6.2, 8.22.6, 4.6, 6.64.2, 6.2, 81.8, 3.8, 5.85.8, 7.8, 9.45.8, 7.6, 94.6, 6.6, 8.45.8, 7.8, 9.25.8, 7.8, 9.25, 7, 8.84.6, 6.4, 85.4, 7.4, 96.6, 8.4, 9.46.2, 8.2, 9.67.4, 9.2, 10
WE2.6, 4.6, 6.63, 5, 77.8, 9.4, 104.6, 6.6, 8.63.4, 5.4, 7.44.2, 6.2, 8.23.4, 5.4, 7.23, 5, 6.82.2, 4.2, 6.24.2, 6.2, 84.2, 6.2, 84.2, 6.2, 8.23.8, 5.8, 7.85.4, 7.4, 9.26.2, 8, 9.22.6, 4.6, 6.66.2, 8, 9.47, 8.8, 9.85.4, 7.4, 95.8, 7.8, 9.4
GE3, 5, 74.2, 6.2, 8.27.4, 9, 9.87, 8.8, 9.84.2, 6.2, 84.2, 6.2, 8.22.6, 4.6, 6.64.2, 6.2, 81.8, 3.8, 5.85.8, 7.8, 9.45.8, 7.6, 95, 7, 8.85.8, 7.8, 9.25.8, 7.8, 9.25, 7, 8.84.6, 6.4, 85.4, 7.4, 96.6, 8.4, 9.46.2, 8.2, 9.67.4, 9.2, 10
Table A9. Normalized decision matrix.
ECA1ECA2ECA3ECA4ECA5ENA1ENA2ENA3ENA4TA1TA2TA3TA4TA5TA6SPA1SPA2SPA3SPA4SPA5
SE0.406, 0.565, 10.375, 0.484, 0.7140.7, 0.86, 0.940.489, 0.548, 0.6970.447, 0.586, 0.8950.349, 0.429, 0.60.333, 0.478, 0.8460.317, 0.382, 0.520.273, 0.391, 0.6920.429, 0.488, 0.6360.467, 0.568, 0.7780.442, 0.576, 0.8260.475, 0.613, 0.9050.538, 0.677, 10.548, 0.697, 10.355, 0.524, 10.574, 0.787, 0.9570.673, 0.857, 0.9590.587, 0.692, 0.9310.617, 0.674, 0.829
HE0.333, 0.448, 0.6840.366, 0.484, 0.7140.62, 0.82, 0.960.535, 0.697, 10.459, 0.63, 10.366, 0.484, 0.7140.306, 0.407, 0.6470.382, 0.52, 0.8670.29, 0.429, 0.8180.525, 0.677, 10.525, 0.677, 10.463, 0.613, 0.9050.487, 0.655, 10.457, 0.568, 0.7780.5, 0.575, 0.7420.333, 0.478, 0.8460.447, 0.66, 0.8720.633, 0.837, 0.980.6, 0.73, 10.617, 0.744, 1
BE0.371, 0.52, 0.8670.366, 0.484, 0.7140.74, 0.9, 0.980.469, 0.523, 0.6570.425, 0.548, 0.810.366, 0.484, 0.7140.333, 0.478, 0.8460.325, 0.419, 0.6190.31, 0.474, 10.447, 0.538, 0.7240.467, 0.553, 0.7240.452, 0.576, 0.8260.413, 0.487, 0.6550.457, 0.538, 0.7240.523, 0.657, 0.920.275, 0.344, 0.4780.574, 0.787, 0.9570.673, 0.857, 0.9590.563, 0.659, 0.8710.58, 0.63, 0.784
WE0.394, 0.565, 10.429, 0.6, 10.78, 0.94, 10.535, 0.697, 10.459, 0.63, 10.366, 0.484, 0.7140.306, 0.407, 0.6470.382, 0.52, 0.8670.29, 0.429, 0.8180.525, 0.677, 10.525, 0.677, 10.463, 0.613, 0.9050.487, 0.655, 10.457, 0.568, 0.7780.5, 0.575, 0.7420.333, 0.478, 0.8460.66, 0.851, 10.714, 0.898, 10.6, 0.73, 10.617, 0.744, 1
GE0.371, 0.52, 0.8670.366, 0.484, 0.710.74, 0.9, 0.90.469, 0.523, 0.650.4, 0.54, 0.80.366, 0.484, 0.710.333, 0.478, 0.840.325, 0.419, 0.610.31, 0.474, 10.447, 0.538, 0.720.467, 0.553, 0.720.432, 0.543, 0.760.413, 0.487, 0.650.457, 0.538, 0.720.523, 0.657, 0.920.275, 0.344, 0.470.574, 0.787, 0.950.673, 0.857, 0.950.563, 0.659, 0.870.58, 0.6, 0.7
Table A10. Weighted normalized decision matrix.
ECA1ECA2ECA3ECA4ECA5ENA1ENA2ENA3ENA4TA1TA2TA3TA4TA5TA6SPA1SPA2SPA3SPA4SPA5
SE0.02, 0.028, 0.050.019, 0.024, 0.0360.035, 0.043, 0.0470.024, 0.027, 0.0350.022, 0.029, 0.0450.017, 0.021, 0.030.017, 0.024, 0.0420.016, 0.019, 0.0260.014, 0.02, 0.0350.021, 0.024, 0.0320.023, 0.028, 0.0390.022, 0.029, 0.0410.024, 0.031, 0.0450.027, 0.034, 0.050.027, 0.035, 0.050.018, 0.026, 0.050.029, 0.039, 0.0480.034, 0.043, 0.0480.029, 0.035, 0.0470.031, 0.034, 0.041
HE0.017, 0.022, 0.0340.018, 0.024, 0.0360.031, 0.041, 0.0480.027, 0.035, 0.050.023, 0.031, 0.050.018, 0.024, 0.0360.015, 0.02, 0.0320.019, 0.026, 0.0430.015, 0.021, 0.0410.026, 0.034, 0.050.026, 0.034, 0.050.023, 0.031, 0.0450.024, 0.033, 0.050.023, 0.028, 0.0390.025, 0.029, 0.0370.017, 0.024, 0.0420.022, 0.033, 0.0440.032, 0.042, 0.0490.03, 0.036, 0.050.031, 0.037, 0.05
BE0.019, 0.026, 0.0430.018, 0.024, 0.0360.037, 0.045, 0.0490.023, 0.026, 0.0330.021, 0.027, 0.040.018, 0.024, 0.0360.017, 0.024, 0.0420.016, 0.021, 0.0310.016, 0.024, 0.050.022, 0.027, 0.0360.023, 0.028, 0.0360.023, 0.029, 0.0410.021, 0.024, 0.0330.023, 0.027, 0.0360.026, 0.033, 0.0460.014, 0.017, 0.0240.029, 0.039, 0.0480.034, 0.043, 0.0480.028, 0.033, 0.0440.029, 0.032, 0.039
WE0.02, 0.028, 0.050.021, 0.03, 0.050.039, 0.047, 0.050.027, 0.035, 0.050.023, 0.031, 0.050.018, 0.024, 0.0360.015, 0.02, 0.0320.019, 0.026, 0.0430.015, 0.021, 0.0410.026, 0.034, 0.050.026, 0.034, 0.050.023, 0.031, 0.0450.024, 0.033, 0.050.023, 0.028, 0.0390.025, 0.029, 0.0370.017, 0.024, 0.0420.033, 0.043, 0.050.036, 0.045, 0.05.03, 0.036, 0.050.031, 0.037, 0.05
GE0.019, 0.026, 0.0430.018, 0.024, 0.0360.037, 0.045, 0.0490.023, 0.026, 0.0330.021, 0.027, 0.040.018, 0.024, 0.0360.017, 0.024, 0.0420.016, 0.021, 0.0310.016, 0.024, 0.050.022, 0.027, 0.0360.023, 0.028, 0.0360.022, 0.027, 0.0380.021, 0.024, 0.0330.023, 0.027, 0.0360.026, 0.033, 0.0460.014, 0.017, 0.0240.029, 0.039, 0.0480.034, 0.043, 0.0480.028, 0.033, 0.0440.029, 0.032, 0.039

References

  1. Arto, I.; Capellán-Pérez, I.; Lago, R.; Bueno, G.; Bermejo, R. The Energy Requirements of a Developed World. Energy Sustain. Dev. 2016, 3, 1–13. [Google Scholar] [CrossRef]
  2. Burke, M.J.; Stephens, J.C. Political Power and Renewable Energy Futures: A Critical Review. Energy Res. Soc. Sci. 2018, 35, 78–93. [Google Scholar] [CrossRef]
  3. Aized, T.; Shahid, M.; Bhatti, A.A.; Saleem, M.; Anandarajah, G. Energy Security and Renewable Energy Policy Analysis of Pakistan. Renew. Sustain. Energy Rev. 2018, 84, 155–169. [Google Scholar] [CrossRef]
  4. Kiani, K. Energy Sector Circular Debt Touches Record Rs922bn. Available online: https://www.dawn.com/news/1392681 (accessed on 7 November 2018).
  5. Rafique, M.M.; Rehman, S. National Energy Scenario of Pakistan—Current Status, Future Alternatives, and Institutional Infrastructure: An Overview. Renew. Sustain. Energy Rev. 2017, 69, 156–167. [Google Scholar] [CrossRef]
  6. Farooq, M.K.; Kumar, S. An Assessment of Renewable Energy Potential for Electricity Generation in Pakistan. Renew. Sustain. Energy Rev. 2013, 20, 240–254. [Google Scholar] [CrossRef]
  7. Kamran, M. Current Status and Future Success of Renewable Energy in Pakistan. Renew. Sustain. Energy Rev. 2018, 82, 609–617. [Google Scholar] [CrossRef]
  8. Pakistan Energy Yearbook; Hydrocarbon Development Institute of Pakistan: Islamabad, Pakistan, 2017.
  9. Rauf, O.; Wang, S.; Yuan, P.; Tan, J. An Overview of Energy Status and Development in Pakistan. Renew. Sustain. Energy Rev. 2015, 48, 892–931. [Google Scholar] [CrossRef]
  10. Awan, U.; Kraslawski, A.; Huiskonen, J. Understanding Influential Factors on Implementing Social Sustainability Practices in Manufacturing Firms: An Interpretive Structural Modelling (ISM) Analysis. Procedia Manuf. 2018, 17, 1039–1048. [Google Scholar] [CrossRef]
  11. Lee, G.; Jun, K.S.; Chung, E.S. Integrated Multi-Criteria Flood Vulnerability Approach Using Fuzzy TOPSIS and Delphi Technique. Nat. Hazards Earth Syst. Sci. 2013, 13, 1293–1312. [Google Scholar] [CrossRef]
  12. Marinakis, V.; Doukas, H.; Xidonas, P.; Zopounidis, C. Multicriteria Decision Support in Local Energy Planning: An Evaluation of Alternative Scenarios for the Sustainable Energy Action Plan. Omega 2017, 69, 1–16. [Google Scholar] [CrossRef]
  13. Stewart, T.J.; French, S.; Rios, J. Integrating Multicriteria Decision Analysis and Scenario Planning-Review and Extension. Omega (United Kingdom) 2013, 41, 679–688. [Google Scholar] [CrossRef]
  14. Marttunen, M.; Lienert, J.; Belton, V. Structuring Problems for Multi-Criteria Decision Analysis in Practice: A Literature Review of Method Combinations. Eur. J. Oper. Res. 2017, 263, 1–17. [Google Scholar] [CrossRef]
  15. Wang, J.J.; Jing, Y.Y.; Zhang, C.F.; Zhao, J.H. Review on Multi-Criteria Decision Analysis Aid in Sustainable Energy Decision-Making. Renew. Sustain. Energy Rev. 2009, 13, 2263–2278. [Google Scholar] [CrossRef]
  16. Amer, M.; Daim, T.U. Selection of Renewable Energy Technologies for a Developing County: A Case of Pakistan. Energy Sustain. Dev. 2011, 15, 420–435. [Google Scholar] [CrossRef]
  17. Zuberi, M.J.S.; Hasany, S.Z.; Tariq, M.A.; Fahrioglu, M. Assessment of Biomass Energy Resources Potential in Pakistan for Power Generation. In Proceedings of the 4th International Conference on Power Engineering, Energy and Electrical Drives, Istanbul, Turkey, 13–17 May 2013; pp. 1301–1306. [Google Scholar]
  18. Mousavi, S.M.; Tavakkoli-Moghaddam, R.; Heydar, M.; Ebrahimnejad, S. Multi-Criteria Decision Making for Plant Location Selection: An Integrated Delphi-AHP-PROMETHEE Methodology. Arab. J. Sci. Eng. 2013, 38, 1255–1268. [Google Scholar] [CrossRef]
  19. Ho, L.W.; Lie, T.T.; Leong, P.T.; Clear, T. Developing Offshore Wind Farm Siting Criteria by Using an International Delphi Method. Energy Policy 2018, 113, 53–67. [Google Scholar] [CrossRef]
  20. Shen, Y.C.; Chou, C.J.; Lin, G.T.R. The Portfolio of Renewable Energy Sources for Achieving the Three E Policy Goals. Energy 2011, 36, 2589–2598. [Google Scholar] [CrossRef]
  21. Ghimire, L.P.; Kim, Y. An Analysis on Barriers to Renewable Energy Development in the Context of Nepal Using AHP. Renew. Energy 2018, 129, 446–456. [Google Scholar] [CrossRef]
  22. Azizkhani, M.; Vakili, A.; Noorollahi, Y.; Naseri, F. Potential Survey of Photovoltaic Power Plants Using Analytical Hierarchy Process (AHP) Method in Iran. Renew. Sustain. Energy Rev. 2017, 75, 1198–1206. [Google Scholar] [CrossRef]
  23. Wang, C.-N.; Huang, Y.F.; Cheng, I.F.; Nguyen, V.T. A Multi-Criteria Decision-Making (MCDM) Approach Using Hybrid SCOR Metrics, AHP, and TOPSIS for Supplier Evaluation and Selection in the Gas and Oil Industry. Processes 2018, 6, 252. [Google Scholar] [CrossRef]
  24. Solangi, Y.A.; Tan, Q.; Khan, M.W.A.; Mirjat, N.H.; Ahmed, I. The Selection of Wind Power Project Location in the Southeastern Corridor of Pakistan: A Factor Analysis, AHP, and Fuzzy-TOPSIS Application. Energies 2018, 11, 1940. [Google Scholar] [CrossRef]
  25. Jozaghi, A.; Alizadeh, B.; Hatami, M.; Flood, I.; Khorrami, M.; Khodaei, N.; Ghasemi Tousi, E. A Comparative Study of the AHP and TOPSIS Techniques for Dam Site Selection Using GIS: A Case Study of Sistan and Baluchestan Province, Iran. Geosciences 2018, 8, 494. [Google Scholar] [CrossRef]
  26. Karatas, M.; Sulukan, E.; Karacan, I. Assessment of Turkey’s Energy Management Performance via a Hybrid Multi-Criteria Decision-Making Methodology. Energy 2018. [Google Scholar] [CrossRef]
  27. Ervural, B.C.; Evren, R.; Delen, D. A Multi-Objective Decision-Making Approach for Sustainable Energy Investment Planning. Renew. Energy 2018, 153, 890–912. [Google Scholar]
  28. Kim, M.-S.; Lee, E.-B.; Jung, I.-H.; Alleman, D. Risk Assessment and Mitigation Model for Overseas Steel-Plant Project Investment with Analytic Hierarchy Process—Fuzzy Inference System. Sustainability 2018, 10, 4780. [Google Scholar] [CrossRef]
  29. Alamanos, A.; Mylopoulos, N.; Loukas, A.; Gaitanaros, D. An Integrated Multicriteria Analysis Tool for Evaluating Water Resource Management Strategies. Water 2018, 10, 1795. [Google Scholar] [CrossRef]
  30. Hui, J.; Lim, S. An Analytic Hierarchy Process (AHP) Approach for Sustainable Assessment of Economy-Based and Community-Based Urban Regeneration: The Case of South Korea. Sustainability 2018, 10, 4456. [Google Scholar] [CrossRef]
  31. Papapostolou, A.; Karakosta, C.; Doukas, H. Analysis of Policy Scenarios for Achieving Renewable Energy Sources Targets: A Fuzzy TOPSIS Approach. Energy Environ. 2017, 28, 88–109. [Google Scholar] [CrossRef]
  32. Ligus, M.; Peternek, P. Determination of Most Suitable Low-Emission Energy Technologies Development in Poland Using Integrated Fuzzy AHP-TOPSIS Method. Energy Procedia 2018, 153, 101–106. [Google Scholar] [CrossRef]
  33. Cayir Ervural, B.; Zaim, S.; Demirel, O.F.; Aydin, Z.; Delen, D. An ANP and Fuzzy TOPSIS-Based SWOT Analysis for Turkey’s Energy Planning. Renew. Sustain. Energy Rev. 2018, 82, 1538–1550. [Google Scholar] [CrossRef]
  34. Büyüközkan, G.; Karabulut, Y.; Güler, M. Strategic Renewable Energy Source Selection for Turkey with Hesitant Fuzzy MCDM Method. Stud. Syst. Decis. Control 2018, 149, 229–250. [Google Scholar]
  35. Öztayşi, B.; Kahraman, C. Evaluation of Renewable Energy Alternatives Using Hesitant Fuzzy TOPSIS and Interval Type-2 Fuzzy AHP. In Renewable and Alternative Energy: Concepts, Methodologies, Tools, and Applications; IGI Global: Hershey, PA, USA, 2017; pp. 1378–1412. [Google Scholar]
  36. Zhuang, Z.-Y.; Lin, C.-C.; Chen, C.-Y.; Su, C.-R. Rank-Based Comparative Research Flow Benchmarking the Effectiveness of AHP–GTMA on Aiding Decisions of Shredder Selection by Reference to AHP–TOPSIS. Appl. Sci. 2018, 8, 1974. [Google Scholar] [CrossRef]
  37. Zare, K.; Mehri-Tekmeh, J.; Karimi, S. A SWOT Framework for Analyzing the Electricity Supply Chain Using an Integrated AHP Methodology Combined with Fuzzy-TOPSIS. Int. Strateg. Manag. Rev. 2015, 3, 66–80. [Google Scholar] [CrossRef]
  38. Kaya, T.; Kahraman, C. Multicriteria Decision Making in Energy Planning Using a Modified Fuzzy TOPSIS Methodology. Expert Syst. Appl. 2011, 38, 6577–6585. [Google Scholar] [CrossRef]
  39. Mirza, U.K.; Ahmad, N.; Harijan, K.; Majeed, T. Identifying and Addressing Barriers to Renewable Energy Development in Pakistan. Renew. Sustain. Energy Rev. 2009, 13, 927–931. [Google Scholar] [CrossRef]
  40. Awan, U.; Imran, N.; Munir, G. Sustainable Development through Energy Management: Issues and Priorities in Energy Savings. Res. J. Appl. Sci. Eng. Technol. 2014, 7. [Google Scholar] [CrossRef]
  41. Farooqui, S.Z. Prospects of Renewables Penetration in the Energy Mix of Pakistan. Renew. Sustain. Energy Rev. 2014, 29, 693–700. [Google Scholar] [CrossRef]
  42. Shaikh, F.; Ji, Q.; Fan, Y. The Diagnosis of an Electricity Crisis and Alternative Energy Development in Pakistan. Renew. Sustain. Energy Rev. 2015, 52, 1172–1185. [Google Scholar] [CrossRef]
  43. Zafar, U.; Ur Rashid, T.; Khosa, A.A.; Khalil, M.S.; Rahid, M. An Overview of Implemented Renewable Energy Policy of Pakistan. Renew. Sustain. Energy Rev. 2018, 82, 654–665. [Google Scholar] [CrossRef]
  44. Mustafa, K. Pak Geothermal Energy Resources Have Potential to Generate 100,000MW Power: Research. Available online: https://www.thenews.com.pk/print/107384-Pak-geothermal-energy-resources-have-potential-to-generate-100000MW-power-Research (accessed on 20 January 2019).
  45. Wakeel, M.; Chen, B.; Jahangir, S. Overview of Energy Portfolio in Pakistan. Energy Procedia 2016, 88, 71–75. [Google Scholar] [CrossRef]
  46. NREL. Pakistan Resource Maps and Toolkit—NREL. Available online: https://www.nrel.gov/international/ra_pakistan.html (accessed on 1 January 2017).
  47. Abdullah; Zhou, D.; Shah, T.; Jebran, K.; Ali, S.; Ali, A.; Ali, A. Acceptance and Willingness to Pay for Solar Home System: Survey Evidence from Northern Area of Pakistan. Energy Rep. 2017, 3, 54–60. [Google Scholar] [CrossRef]
  48. Das Valasai, G.; Uqaili, M.A.; Memon, H.U.R.; Samoo, S.R.; Mirjat, N.H.; Harijan, K. Overcoming Electricity Crisis in Pakistan: A Review of Sustainable Electricity Options. Renew. Sustain. Energy Rev. 2017, 72, 734–745. [Google Scholar] [CrossRef]
  49. Shakeel, S.R.; Takala, J.; Shakeel, W. Renewable Energy Sources in Power Generation in Pakistan. Renew. Sustain. Energy Rev. 2016, 64, 421–434. [Google Scholar] [CrossRef]
  50. Siddiqi, A.; Wescoat, J.L.; Humair, S.; Afridi, K. An Empirical Analysis of the Hydropower Portfolio in Pakistan. Energy Policy 2012, 50, 228–241. [Google Scholar] [CrossRef]
  51. Ministry of Water and Power. Hydro Power Resources of Pakistan. Available online: http://www.ppib.gov.pk/HYDRO.pdf (accessed on 22 November 2017).
  52. Awan, A.B.; Khan, Z.A. Recent Progress in Renewable Energy—Remedy of Energy Crisis in Pakistan. Renew. Sustain. Energy Rev. 2014, 33, 236–253. [Google Scholar] [CrossRef]
  53. Ullah, K. Electricity Infrastructure in Pakistan: An Overview. Int. J. Energy Inf. Commun. 2013, 4, 11–26. [Google Scholar]
  54. World Wind Energy Association-Market Report; World Wind Energy Association: Bonn, Germany, 2016.
  55. Lauha, F. Global Wind Statistics 2017; GWEC: Brussels, Belgium, 2017. [Google Scholar]
  56. Sheikh, M.A. Energy and Renewable Energy Scenario of Pakistan. Renew. Sustain. Energy Rev. 2010, 14, 354–363. [Google Scholar] [CrossRef]
  57. PMD WIND ENERGY PROJECT. Available online: http://www.pmd.gov.pk/wind/Wind_Project_files/Page767.html (accessed on 22 November 2017).
  58. Younas, U.; Khan, B.; Ali, S.M.; Arshad, C.M.; Farid, U.; Zeb, K.; Rehman, F.; Mehmood, Y.; Vaccaro, A. Pakistan Geothermal Renewable Energy Potential for Electric Power Generation: A Survey. Renew. Sustain. Energy Rev. 2016, 63, 398–413. [Google Scholar] [CrossRef]
  59. Dalkey, N.; Helmer, O. An Experimental Application of the DELPHI Method to the Use of Experts. Manag. Sci. 1963, 9, 351–515. [Google Scholar] [CrossRef]
  60. Rowe, G.; Wright, G. The Delphi Technique as a Forecasting Tool: Issues and Analysis. Int. J. Forecast. 1999, 15, 353–375. [Google Scholar] [CrossRef]
  61. Vidal, L.A.; Marle, F.; Bocquet, J.C. Using a Delphi Process and the Analytic Hierarchy Process (AHP) to Evaluate the Complexity of Projects. Expert Syst. Appl. 2011, 38, 5388–5405. [Google Scholar] [CrossRef]
  62. Skulmoski, G.; Hartman, F.; Krahn, J. The Delphi Method for Graduate Research. J. Inf. Technol. Educ. Res. 2007, 6, 1–21. [Google Scholar] [CrossRef]
  63. Dajani, J.S.; Sincoff, M.Z.; Talley, W.K. Stability and Agreement Criteria for the Termination of Delphi Studies. Technol. Forecast. Soc. Chang. 1979, 13, 83–90. [Google Scholar] [CrossRef]
  64. Lawshe, C.H. A Quantitative Approach to Content Validity. Pers. Psychol. 1975, 28, 563–575. [Google Scholar] [CrossRef]
  65. Wilson, F.R.; Pan, W.; Schumsky, D.A. Recalculation of the Critical Values for Lawshe’s Content Validity Ratio. Meas. Eval. Couns. Dev. 2012, 45, 197–210. [Google Scholar] [CrossRef]
  66. Kumar, A.; Sah, B.; Singh, A.R.; Deng, Y.; He, X.; Kumar, P.; Bansal, R.C. A Review of Multi Criteria Decision Making (MCDM) towards Sustainable Renewable Energy Development. Renew. Sustain. Energy Rev. 2017, 69, 596–609. [Google Scholar] [CrossRef]
  67. Mirjat, N.H.; Uqaili, M.A.; Harijan, K.; Wazir, M.; Mustafa, M. Multi-Criteria Analysis of Electricity Generation Scenarios for Sustainable Energy Planning in Pakistan. Energies 2018, 11, 757. [Google Scholar] [CrossRef]
  68. Saaty, T.L. The Analytic Hierarchy Process; McGraw-Hill: New York, NY, USA, 1980; Volume 48, pp. 109–121. [Google Scholar]
  69. Saaty, T.L. Decision Making with the Analytic Hierarchy Process. Int. J. Serv. Sci. 2008, 1, 83–98. [Google Scholar] [CrossRef]
  70. Franek, J.; Kresta, A. Judgment Scales and Consistency Measure in AHP. Procedia Econ. Financ. 2014, 12, 164–173. [Google Scholar] [CrossRef]
  71. Cavallo, B. Computing Random Consistency Indices and Assessing Priority Vectors Reliability. Inf. Sci. 2017, 420, 532–542. [Google Scholar] [CrossRef]
  72. Boran, K. An Evaluation of Power Plants in Turkey: Fuzzy TOPSIS Method. Energy Sour. Part B Econ. Plan. Policy 2017, 12, 119–125. [Google Scholar] [CrossRef]
  73. Wang, C.N.; Huang, Y.F.; Chai, Y.C.; Nguyen, V.N. A Multi-Criteria Decision Making (MCDM) for Renewable Energy Plants Location Selection in Vietnam under a Fuzzy Environment. Appl. Sci. 2018, 8, 2069. [Google Scholar] [CrossRef]
  74. Zadeh, L.A. Fuzzy Sets. Inf. Control 1965, 8, 338–353. [Google Scholar] [CrossRef]
  75. Walczak, D.; Rutkowska, A. Project Rankings for Participatory Budget Based on the Fuzzy TOPSIS Method. Eur. J. Oper. Res. 2017, 260, 706–714. [Google Scholar] [CrossRef]
  76. Vafaeipour, M.; Hashemkhani Zolfani, S.; Morshed Varzandeh, M.H.; Derakhti, A.; Keshavarz Eshkalag, M. Assessment of Regions Priority for Implementation of Solar Projects in Iran: New Application of a Hybrid Multi-Criteria Decision Making Approach. Energy Convers. Manag. 2014, 86, 653–663. [Google Scholar] [CrossRef]
  77. Ishfaq, S.; Ali, S.; Ali, Y. Selection of Optimum Renewable Energy Source for Energy Sector in Pakistan by Using MCDM Approach. Process Integr. Optim. Sustain. 2018, 2, 61–71. [Google Scholar] [CrossRef]
  78. EIA. Annual Energy Outlook 2017. Available online: https://www.eia.gov (accessed on 21 January 2019).
  79. Chatzimouratidis, A.I.; Pilavachi, P.A. Multicriteria Evaluation of Power Plants Impact on the Living Standard Using the Analytic Hierarchy Process. Energy Policy 2008, 36, 1074–1089. [Google Scholar] [CrossRef]
  80. Ribeiro, F.; Ferreira, P.; Araújo, M.; Braga, A.C. Public Opinion on Renewable Energy Technologies in Portugal. Energy 2014, 69, 39–50. [Google Scholar] [CrossRef]
  81. Kassem, A.; Al-Haddad, K.; Komljenovic, D.; Schiffauerova, A. A Value Tree for Identification of Evaluation Criteria for Solar Thermal Power Technologies in Developing Countries. Sustain. Energy Technol. Assess. 2016, 16, 18–32. [Google Scholar] [CrossRef]
  82. Brand, B.; Missaoui, R. Multi-Criteria Analysis of Electricity Generation Mix Scenarios in Tunisia. Renew. Sustain. Energy Rev. 2014, 39, 251–261. [Google Scholar] [CrossRef]
  83. Ahmad, S.; Tahar, R.M. Selection of Renewable Energy Sources for Sustainable Development of Electricity Generation System Using Analytic Hierarchy Process: A Case of Malaysia. Renew. Energy 2014, 63, 458–466. [Google Scholar] [CrossRef]
  84. Shen, Y.C.; Lin, G.T.R.; Li, K.P.; Yuan, B.J.C. An Assessment of Exploiting Renewable Energy Sources with Concerns of Policy and Technology. Energy Policy 2010, 38, 4604–4616. [Google Scholar] [CrossRef]
  85. Kang, D.; Lee, D.H. Energy and Environment Efficiency of Industry and Its Productivity Effect. J. Clean. Prod. 2016, 135, 184–193. [Google Scholar] [CrossRef]
  86. Troldborg, M.; Heslop, S.; Hough, R.L. Assessing the Sustainability of Renewable Energy Technologies Using Multi-Criteria Analysis: Suitability of Approach for National-Scale Assessments and Associated Uncertainties. Renew. Sustain. Energy Rev. 2014, 39, 1173–1184. [Google Scholar] [CrossRef]
  87. Daim, T.; Yates, D.; Peng, Y.; Jimenez, B. Technology Assessment for Clean Energy Technologies: The Case of the Pacific Northwest. Technol. Soc. 2009, 31, 232–243. [Google Scholar] [CrossRef]
  88. Shakouri G., H.; Aliakbarisani, S. At What Valuation of Sustainability Can We Abandon Fossil Fuels? A Comprehensive Multistage Decision Support Model for Electricity Planning. Energy 2016, 107, 60–77. [Google Scholar] [CrossRef]
  89. Tasri, A.; Susilawati, A. Selection among Renewable Energy Alternatives Based on a Fuzzy Analytic Hierarchy Process in Indonesia. Sustain. Energy Technol. Assess. 2014, 7, 34–44. [Google Scholar] [CrossRef]
  90. Shmelev, S.E.; Van Den Bergh, J.C.J.M. Optimal Diversity of Renewable Energy Alternatives under Multiple Criteria: An Application to the UK. Renew. Sustain. Energy Rev. 2016, 60, 679–691. [Google Scholar] [CrossRef]
  91. Santos, M.J.; Ferreira, P.; Araújo, M.; Portugal-Pereira, J.; Lucena, A.F.P.; Schaeffer, R. Scenarios for the Future Brazilian Power Sector Based on a Multi-Criteria Assessment. J. Clean. Prod. 2018, 167, 938–950. [Google Scholar] [CrossRef]
  92. Şengül, Ü.; Eren, M.; Eslamian Shiraz, S.; Gezder, V.; Sengül, A.B. Fuzzy TOPSIS Method for Ranking Renewable Energy Supply Systems in Turkey. Renew. Energy 2015, 75, 617–625. [Google Scholar] [CrossRef]
  93. Singh, R.P.; Nachtnebel, H.P. Analytical Hierarchy Process (AHP) Application for Reinforcement of Hydropower Strategy in Nepal. Renew. Sustain. Energy Rev. 2016, 55, 43–58. [Google Scholar] [CrossRef]
  94. Kahraman, C.; Kaya, I.; Cebi, S. A Comparative Analysis for Multiattribute Selection among Renewable Energy Alternatives Using Fuzzy Axiomatic Design and Fuzzy Analytic Hierarchy Process. Energy 2009, 34, 1603–1616. [Google Scholar] [CrossRef]
  95. Vidadili, N.; Suleymanov, E.; Bulut, C.; Mahmudlu, C. Transition to Renewable Energy and Sustainable Energy Development in Azerbaijan. Renew. Sustain. Energy Rev. 2017, 80, 1153–1161. [Google Scholar] [CrossRef]
  96. Shen, P.; Lior, N. Vulnerability to Climate Change Impacts of Present Renewable Energy Systems Designed for Achieving Net-Zero Energy Buildings. Energy 2016, 114, 1288–1305. [Google Scholar] [CrossRef]
  97. Chaiamarit, K.; Nuchprayoon, S. Modeling of Renewable Energy Resources for Generation Reliability Evaluation. Renew. Sustain. Energy Rev. 2013, 26, 34–41. [Google Scholar] [CrossRef]
  98. Sahir, M.H.; Qureshi, A.H. Specific Concerns of Pakistan in the Context of Energy Security Issues and Geopolitics of the Region. Energy Policy 2007, 35, 2031–2037. [Google Scholar] [CrossRef]
  99. Xin-Gang, Z.; Tian-Tian, F.; Lu, C.; Xia, F. The Barriers and Institutional Arrangements of the Implementation of Renewable Portfolio Standard: A Perspective of China. Renew. Sustain. Energy Rev. 2014, 30, 371–380. [Google Scholar] [CrossRef]
  100. Shah, A.A.; Qureshi, S.M.; Bhutto, A.; Shah, A. Sustainable Development through Renewable Energy-The Fundamental Policy Dilemmas of Pakistan. Renew. Sustain. Energy Rev. 2011, 15, 861–865. [Google Scholar] [CrossRef]
  101. Lee, H.C.; Chang, C. Ter. Comparative Analysis of MCDM Methods for Ranking Renewable Energy Sources in Taiwan. Renew. Sustain. Energy Rev. 2018, 92, 883–896. [Google Scholar] [CrossRef]
Figure 1. Solar map of Pakistan [46].
Processes 07 00118 g001
Figure 2. Identified hydro resources of Pakistan [51].
Processes 07 00118 g002
Figure 3. Global wind power capacity in MW [55].
Processes 07 00118 g003
Figure 4. Wind resource map of Pakistan [46].
Processes 07 00118 g004
Figure 5. Geothermal resource map of Pakistan [58].
Processes 07 00118 g005
Figure 6. Decision model of the study.
Processes 07 00118 g006
Figure 7. Pair-wise comparison matrix scale [70].
Processes 07 00118 g007
Figure 8. Public opinion for RE technologies implementation in Portugal and Australia.
Processes 07 00118 g008
Table 1. The summary of various energy related studies with multi-criteria perspectives.
No.FocusMethodYearReference
1Multi-criteria decision making for plant location selectionDelphi-AHP and Preference Ranking Organization Method for Enrichment of Evaluations (PROMETHEE)2013[18]
2Developing offshore wind farm siting criteriaDelphi2018[19]
3Portfolio of renewable energy sources for achieving the 3-E policy goals in TaiwanAHP2011[20]
4An analysis on barriers to renewable energy development in Nepal AHP2018[21]
5Potential survey of photovoltaic power plantsAHP2017[22]
6Supplier evaluation and selection in the gas and oil industrySupply Chain Operations Reference (SCOR) metrics-AHP and TOPSIS2018[23]
7Selection of wind power project location in the southeastern part of PakistanFactor analysis-AHP and Fuzzy TOPSIS2018[24]
8Dam site selection in IranAHP-TOPSIS2018[25]
9Assessing energy management performance in TurkeyAHP-TOPSIS and VlseKriterijuska Optimizacija I Komoromisno Resenje (VIKOR)2018[26]
10Considering the public opinion and geospatial conditions to distinguish energy alternatives for energy investment planningGoal programming, AHP and F-TOPSIS2018[27]
11Risk assessment and mitigation model for overseas steel-plant project investmentAHP—Fuzzy Inference System2018[28]
12Evaluating water resource management strategiesMultiple Attribute Utility Theory (MAUT)-AHP- Elimination Et Choice Translating Reality (ELECTRE) and TOPSIS2018[29]
13Sustainable assessment of economy-based and community-based urban regenerationAHP2018[30]
14The policy scenario analysis for accomplishing renewable energy sources targets Fuzzy TOPSIS2017[31]
15Identifying the most significant low-emission energy technologies development in PolandFuzzy AHP-Fuzzy TOPSIS2018[32]
16Assessing the energy planning in TurkeyAnalytic Network Process (ANP)-Fuzzy TOPSIS2018[33]
17Strategic selection of renewable energy source for TurkeyHesitant Fuzzy Linguistic (HFL)- Simple Additive Weighting (SAW) and HFL-TOPSIS2018[34]
18Evaluation and prioritization of renewable energy alternativesHFL-TOPSIS and Interval type-2 Fuzzy AHP2017[35]
19Comparative analysis for optimum paper shredder selectionAHP– Graph Theory and Matrix Approach (GTMA) and AHP–TOPSIS2018[36]
20A SWOT framework for analyzing the electricity supply chainStrengths, Weaknesses, Opportunities and Threats (SWOT)-AHP and Fuzzy TOPSIS2015[37]
21Selection of the best energy technology alternative in energy planningModified Fuzzy TOPSIS2011[38]
22Identifying the barriers to renewable energy development in Pakistan----2009[39]
23Sustainable development through energy management----2014[40]
Table 2. Estimated renewable energy potential of various source and installed capacity in Pakistan [42,43,44]. RE: renewable energy.
RE ResourcePotential (MW)Installed (MW)
Solar2,900,000200
Hydro60,0006556
Biomass500035
Wind346,000308
Geothermal100,0000
Table 3. Random index (RI) scale [71].
n12345678910
Random Index (RI)0.000.000.0580.901.121.241.321.411.451.49
Table 4. Linguistic scale for alternatives ranking [75].
NumberLinguistic Variable TFNs
1Very poor (VP)(0,0,1)
2Poor (P)(0,1,3)
3Rather Poor (RP)(1,3,5)
4Fair (F)(3,5,7)
5Rather Good (RG)(5,7,9)
6Good (G)(7,9,10)
7Very Good (VG)(9,9,10)
Table 5. RE data of various RE resources of Pakistan [77,78].
RE SourceInitial Cost (m USD/kW)O&M Cost (m USD/Year)Efficiency (%)Capacity Factor (%)Expected Life of RE PlantCO2 (m Tons Avoided/Year)
Solar570578025250.16
Hydro39,412788805010024.25
Biomass3000703383400.90
Wind365079634200.30
Geothermal2500359060250.95
Table 6. Job creation, land requirements, and energy generation cost for RE technologies in USA [78,79].
RE SourceJob Creation
Employees/500 MW
Land Requirement
sKM2/1000 MW
Energy Generation Cost ($/kWh)
Solar5370350.058
Hydro25007500.064
Biomass36,05550000.098
Wind56351000.044–0.20
Geothermal27,050180.04–0.14
Table 7. Criteria refined by the experts.
Criteria Reference
1. Economic Aspect (ECA)
Initial cost (ECA1)[15,81,82]
Operation and Maintenance Cost (ECA2) [15,81,83]
Resource Potential (ECA3)[83,84]
Energy Generation Cost (ECA4)[82,85,86]
Expected life of RE plant (ECA5) [15,87]
2. Environmental Aspect (ENA)
CO2 Emission reduction (ENA1) [83,86]
Impact on Environment (ENA2)[83,86]
Land Requirement (ENA3)[83,88,89]
Noise (ENA4)[90,91]
3. Technical Aspect (TA)
Technology maturity (TA1)[81,83,86]
Efficiency (TA2)[83,85,92]
Capacity factor (TA3)[16,93]
Human Resource Expertise (TA4) [16,94]
Climate conditions (TA5)[90,95,96]
Reliability/Feasibility (TA6)[15,86,97]
4. Socio-Political Aspect (SPA)
Public acceptance (SPA1)[81,83,86]
Job creation (SPA2)[81,83]
Energy security (SPA3)[16,82,98]
Institutional arrangement (SPA4)[99,100]
Regulatory mechanism (SPA5)Delphi consultation
Table 8. Overall priority weight and ranking of criteria and sub-criteria.
CriteriaSub-CriteriaLocal WeightGlobal WeightOverall Ranking
Economic Aspect (ECA) 0.3695 1st (Criteria)
Initial cost (ECA1)0.16880.06245th
Operation and Maintenance Cost (ECA2)0.17250.06374th
Resource Potential (ECA3)0.34750.12841st
Energy Generation Cost (ECA4)0.21640.08003rd
Expected life of renewable energy plant (ECA5)0.09490.035013th
Environmental Aspect (ENA) 0.1487 4th (Criteria)
CO2 Emission reduction (ENA1)0.36950.05497th
Impact on Environment (ENA2)0.18860.028115th
Land Requirement (ENA3)0.33820.05039th
Noise (ENA4)0.10370.015419th
Technical Aspect (TA) 0.1859 3rd (Criteria)
Technology maturity (TA1)0.28040.05218th
Efficiency (TA2)0.22030.040912th
Capacity factor (TA3)0.13540.025217th
Human Resource Expertise (TA4)0.06080.011320th
Climate conditions (TA5)0.14150.026316th
Reliability/Feasibility (TA6)0.16170.030114th
Socio-Political Aspect (SPA) 0.2959 2nd (Criteria)
Public acceptance (SPA1)0.07710.022818th
Job creation (SPA2)0.15630.046210th
Energy security (SPA3)0.42750.12652nd
Institutional arrangement (SPA4)0.13850.041011th
Regulatory mechanism (SPA5)0.20060.05946th
Table 9. Final ranking of the renewable alternatives.
RE Source DPIS   ( d i + ) DNIS   ( d i ) C C i Rank
Solar19.3670.6540.0333
Hydro19.3520.6720.0342
Biomass 19.3940.6250.0314
Wind19.3200.7060.0351
Geothermal19.3960.6230.0315
Table 10. Criteria weights employed for sensitivity analysis.
Criteria Scenario 1
(Current Weight)
Scenario 2Scenario 3Scenario 4Scenario 5
Economic (ECA)0.36950.250.300.350.40
Environmental (ENA)0.18590.250.200.150.10
Technical (TA)0.14870.250.300.350.40
Socio-Political (SPA)0.29590.250.200.150.10
Table 11. Results of the sensitivity analysis.
AlternativeScenario 1Scenario 2Scenario 3Scenario 4Scenario 5
Solar33322
Hydro22233
Biomass44444
Wind11111
Geothermal55555

