Experimental Study on Spray Breakup in Turbulent Atomization Using a Spiral Nozzle


Abstract
1. Introduction
- They are made of one piece of material (no internal parts, hence resistant to clogging);
- They have high discharge coefficients (higher flowrates possible at lower pressure drops);
- They can provide fine atomization, wide range of flowrates and spray angles;
- A reduction in waste energy appearing as noise;
- Very wide effective patterns produced allow replacing several nozzles with one.
2. Underlying Phenomena
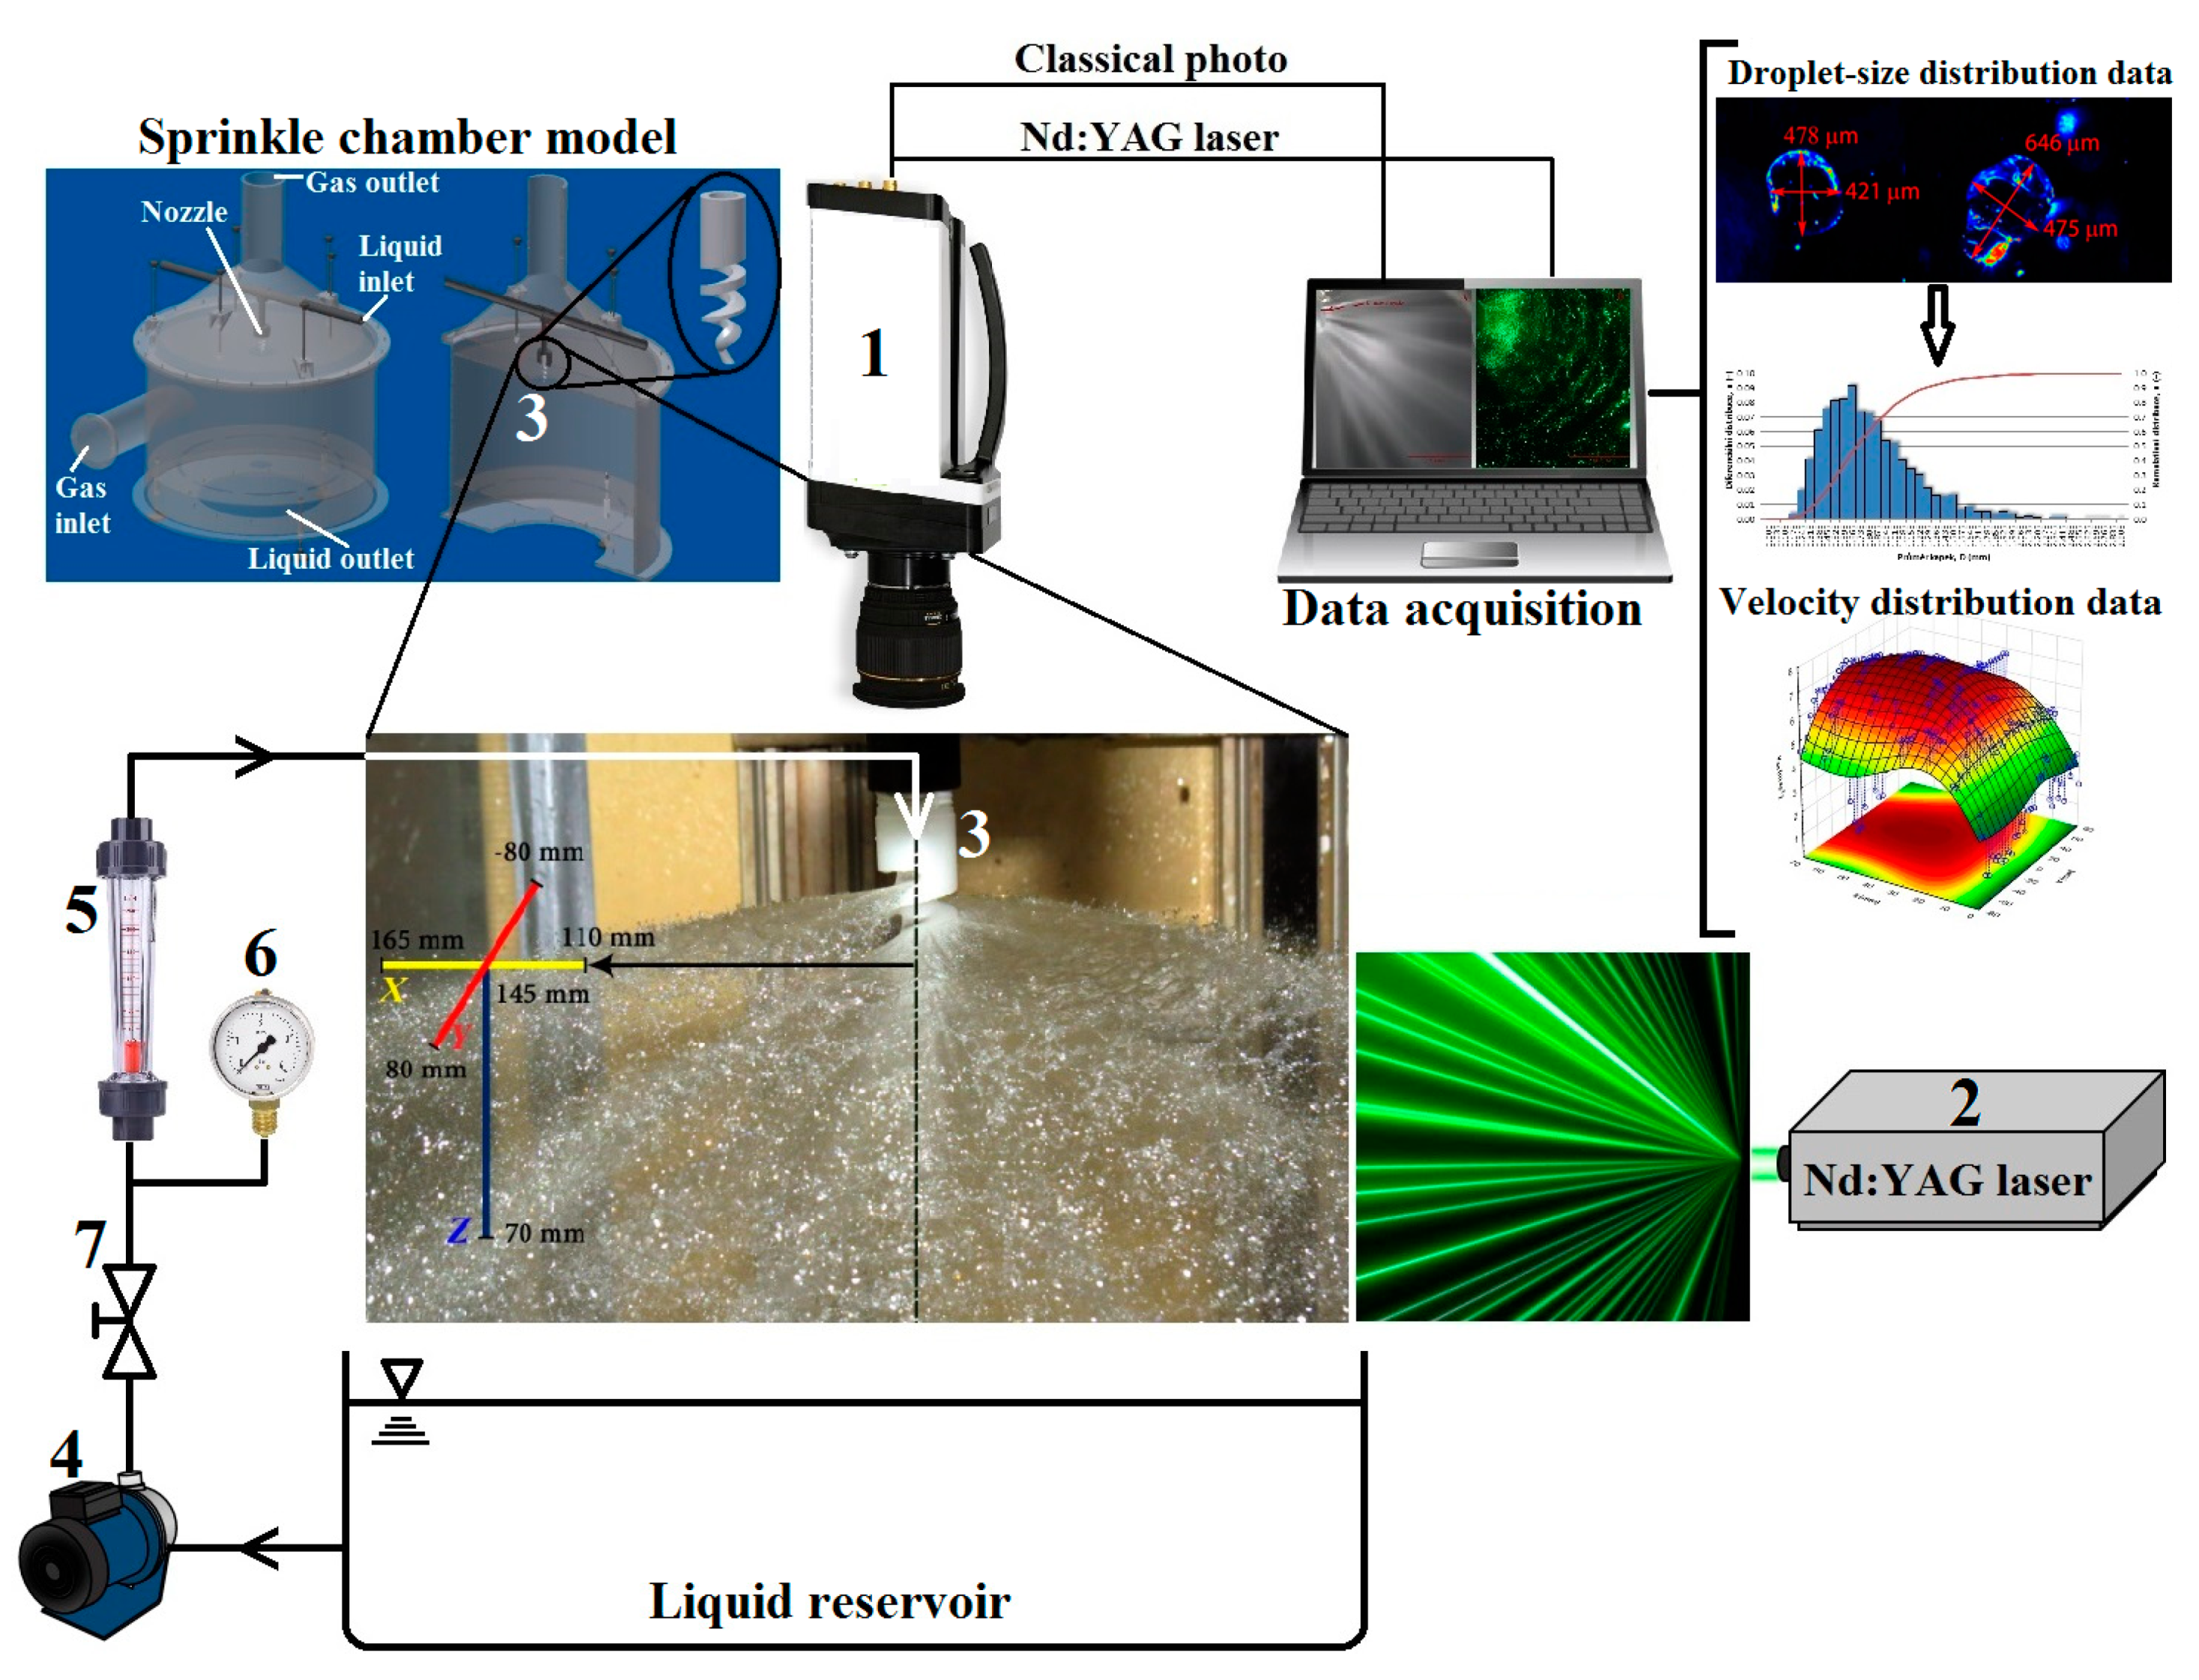
3. Experimental
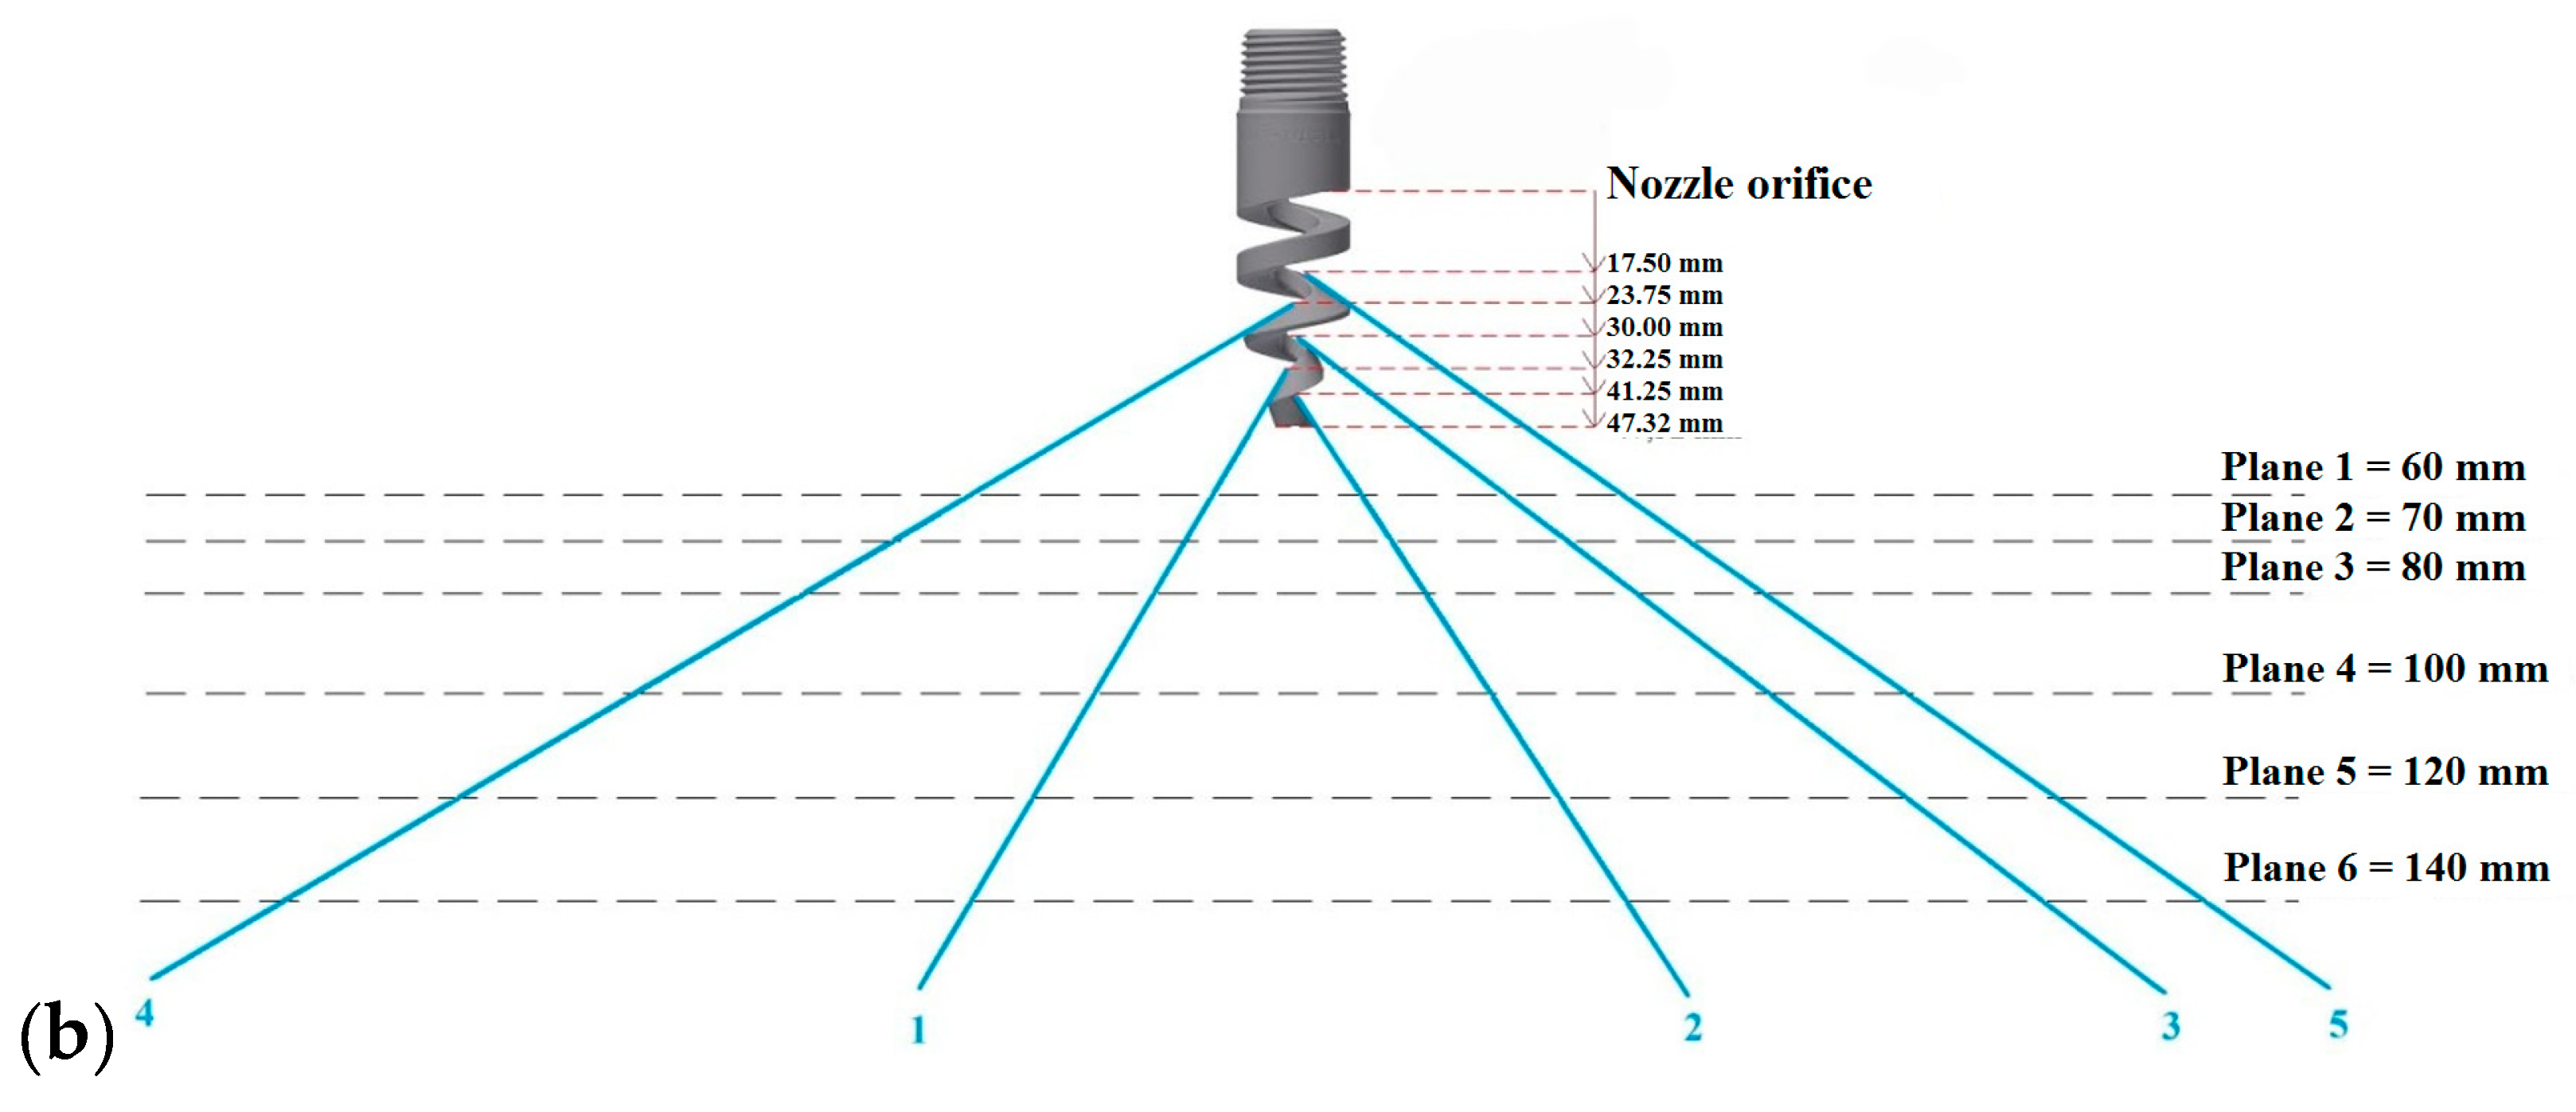
3.1. Spiral Nozzle
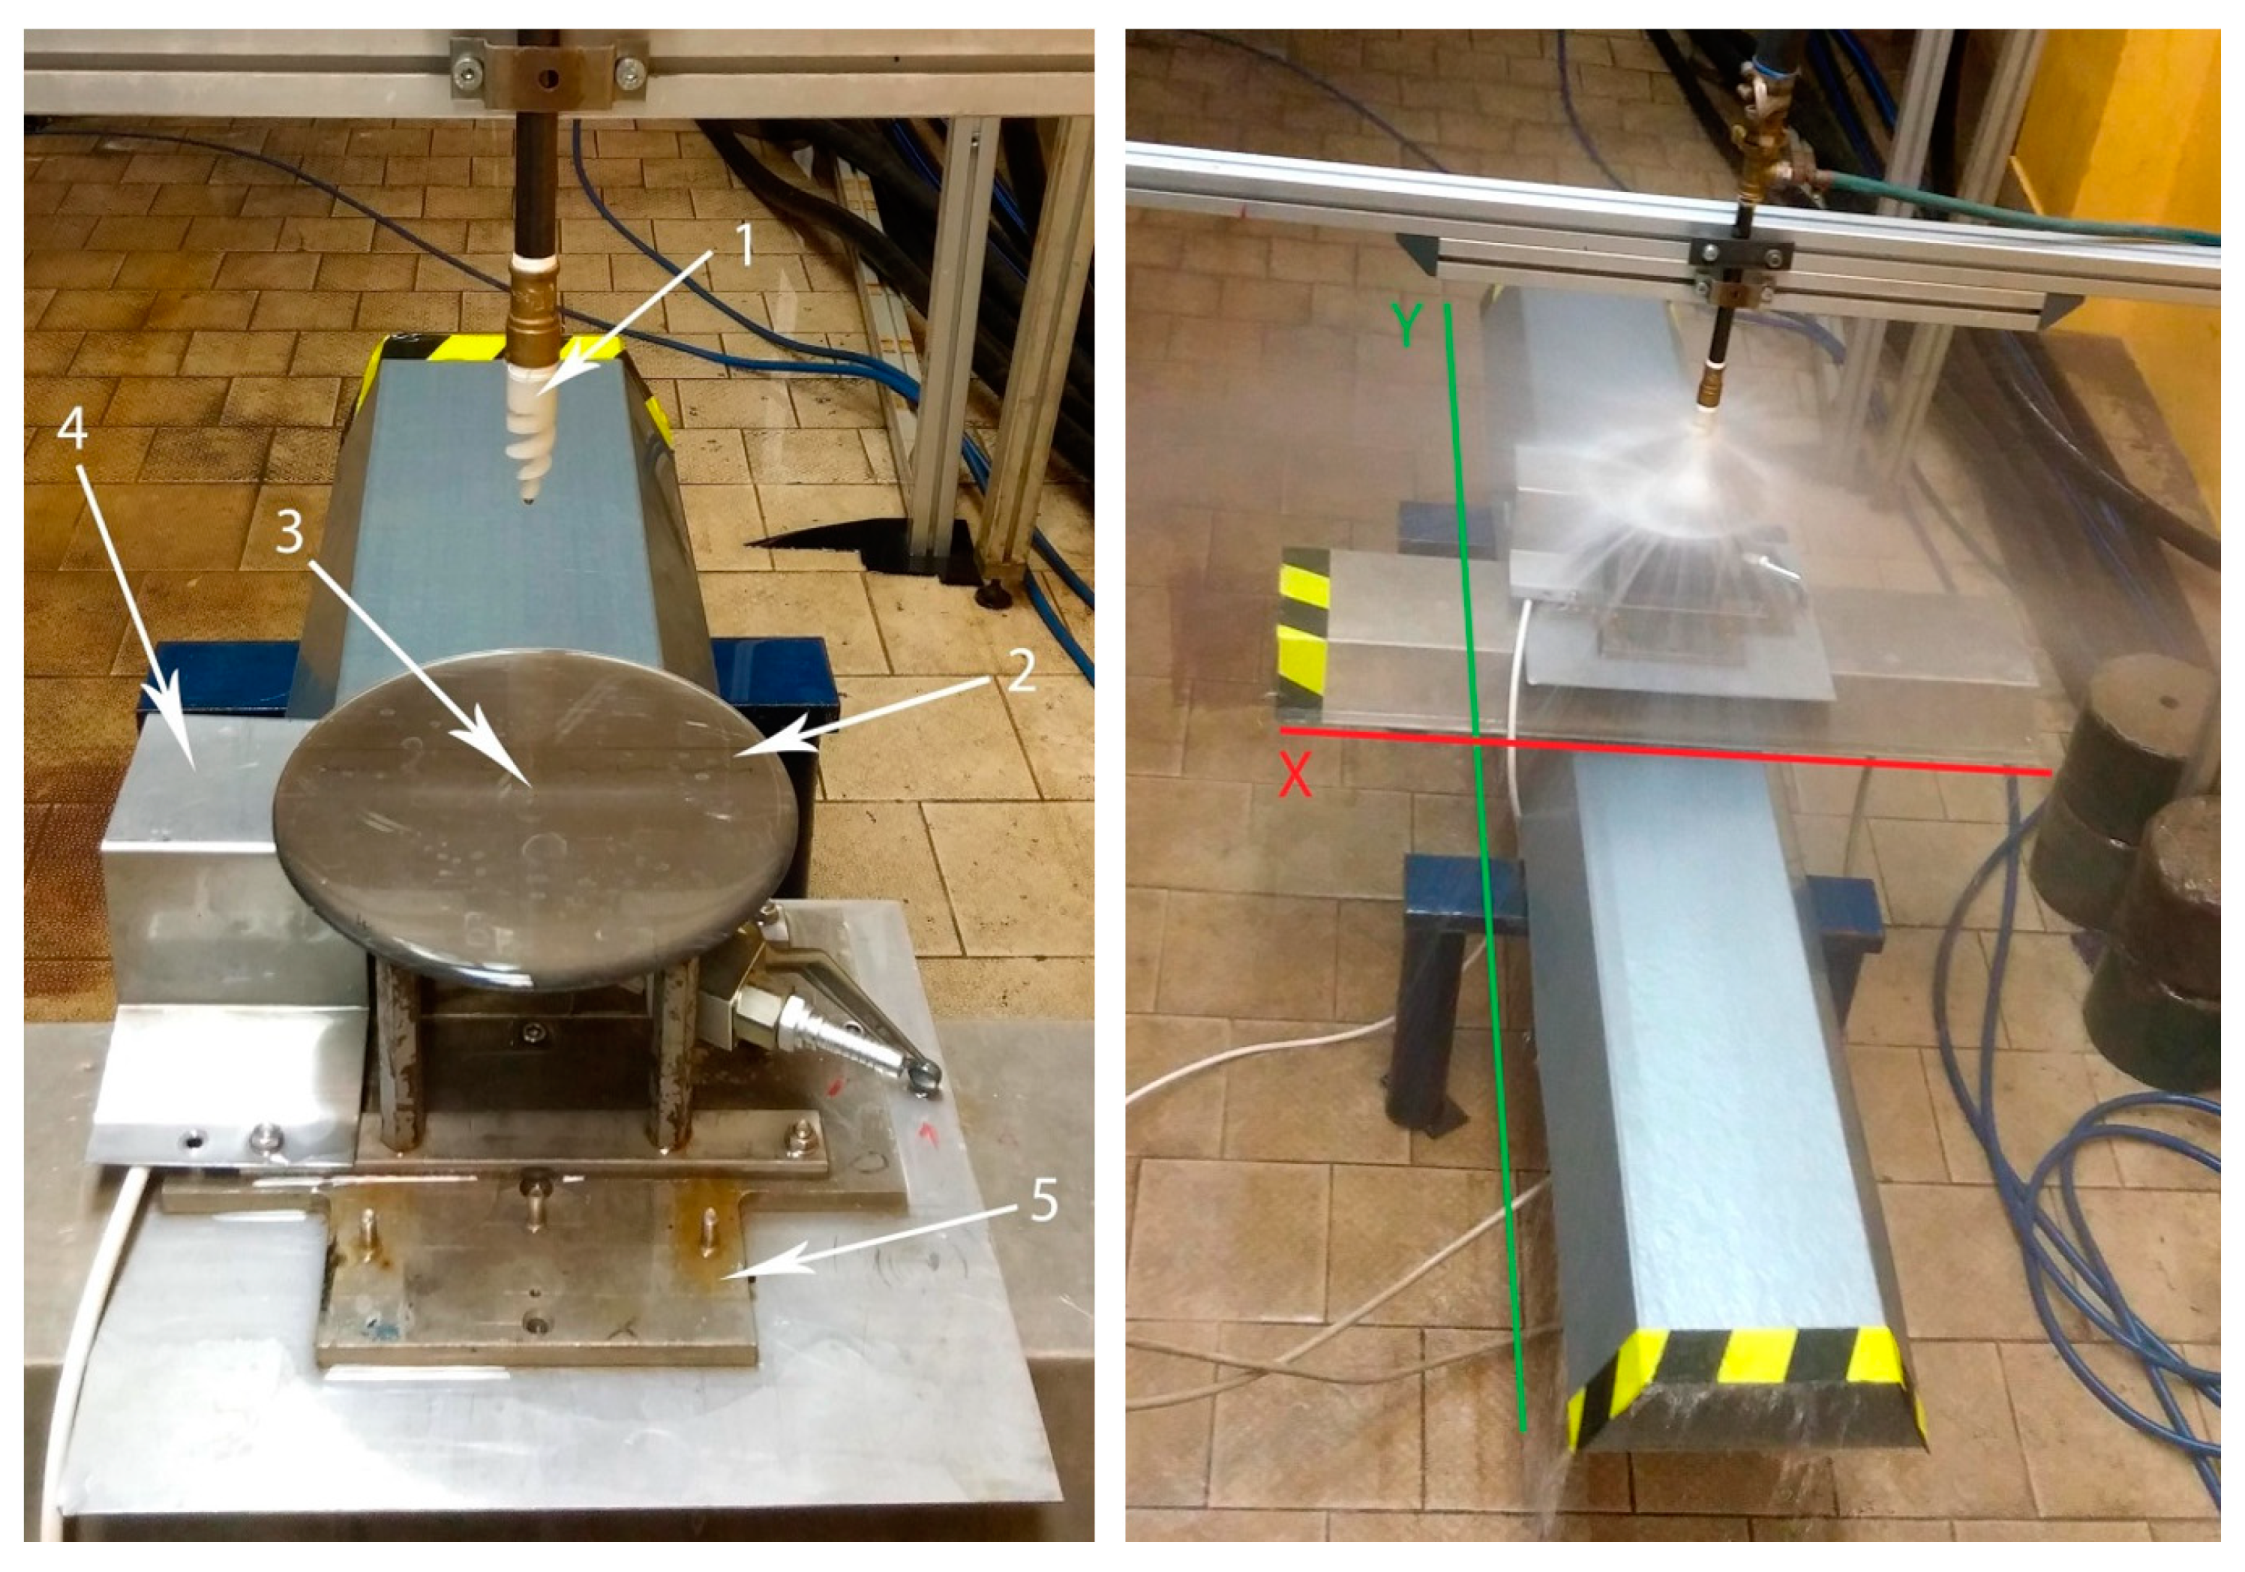
3.2. Pressure Impact Footprint
3.2.1. Measuring the Impact Pressure in Four Planes
3.2.2. Measuring the Impact Pressure in One Plane at Different Water Inlet Pressures
3.3. Spray Morphology
3.4. Spray Kinetics
4. Results and Discussion
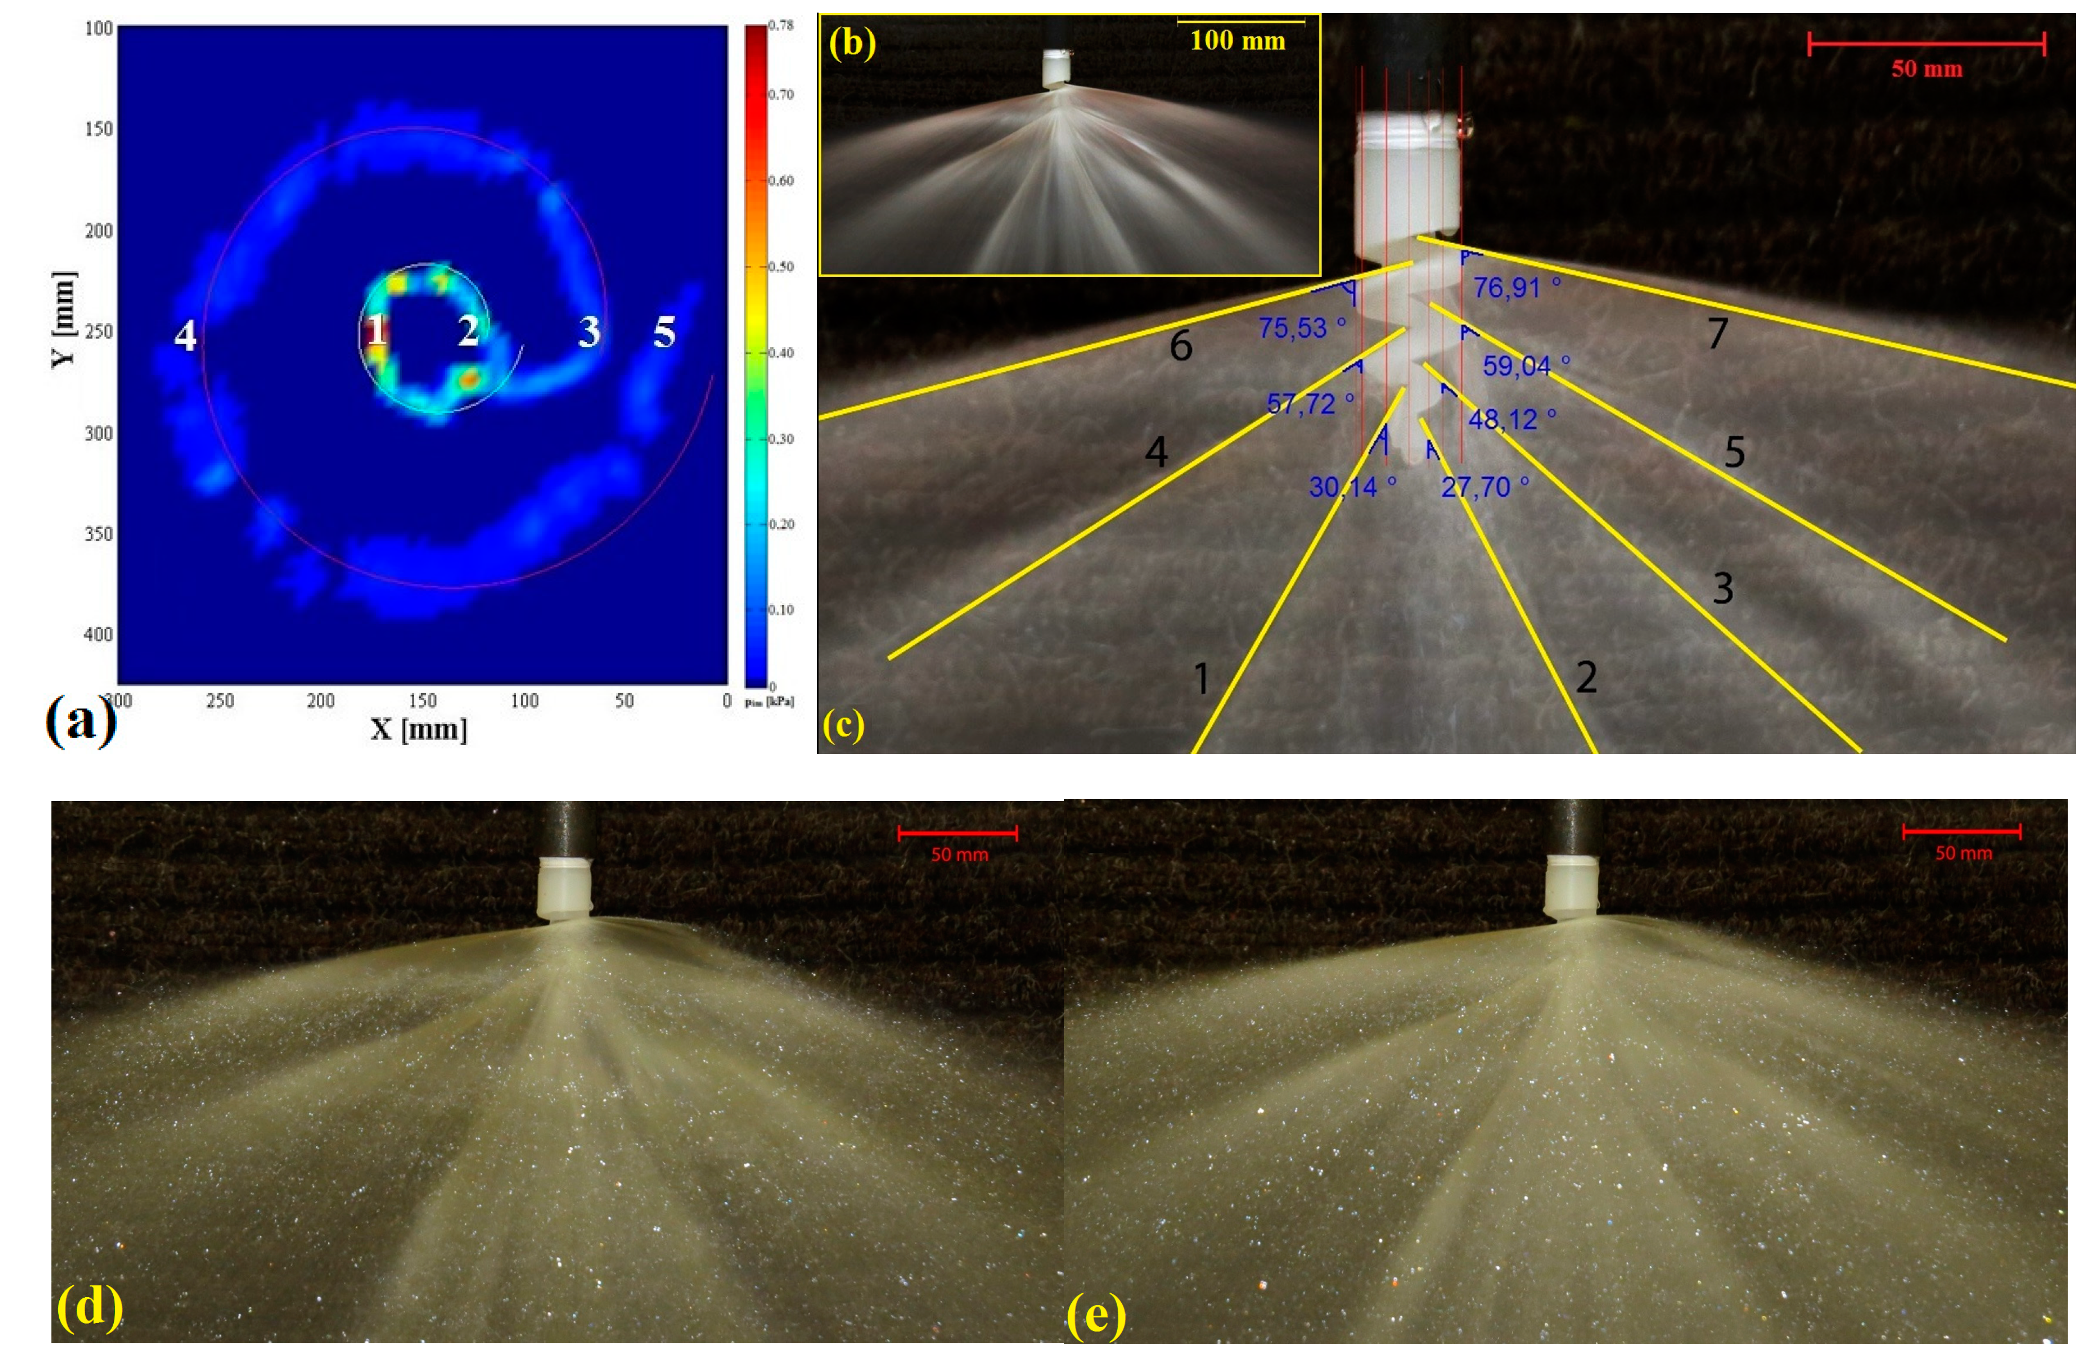
4.1. Pressure Impact Footprint
4.2. Spray Angle
4.3. Spray Breakup
4.4. Droplet Size Distribution
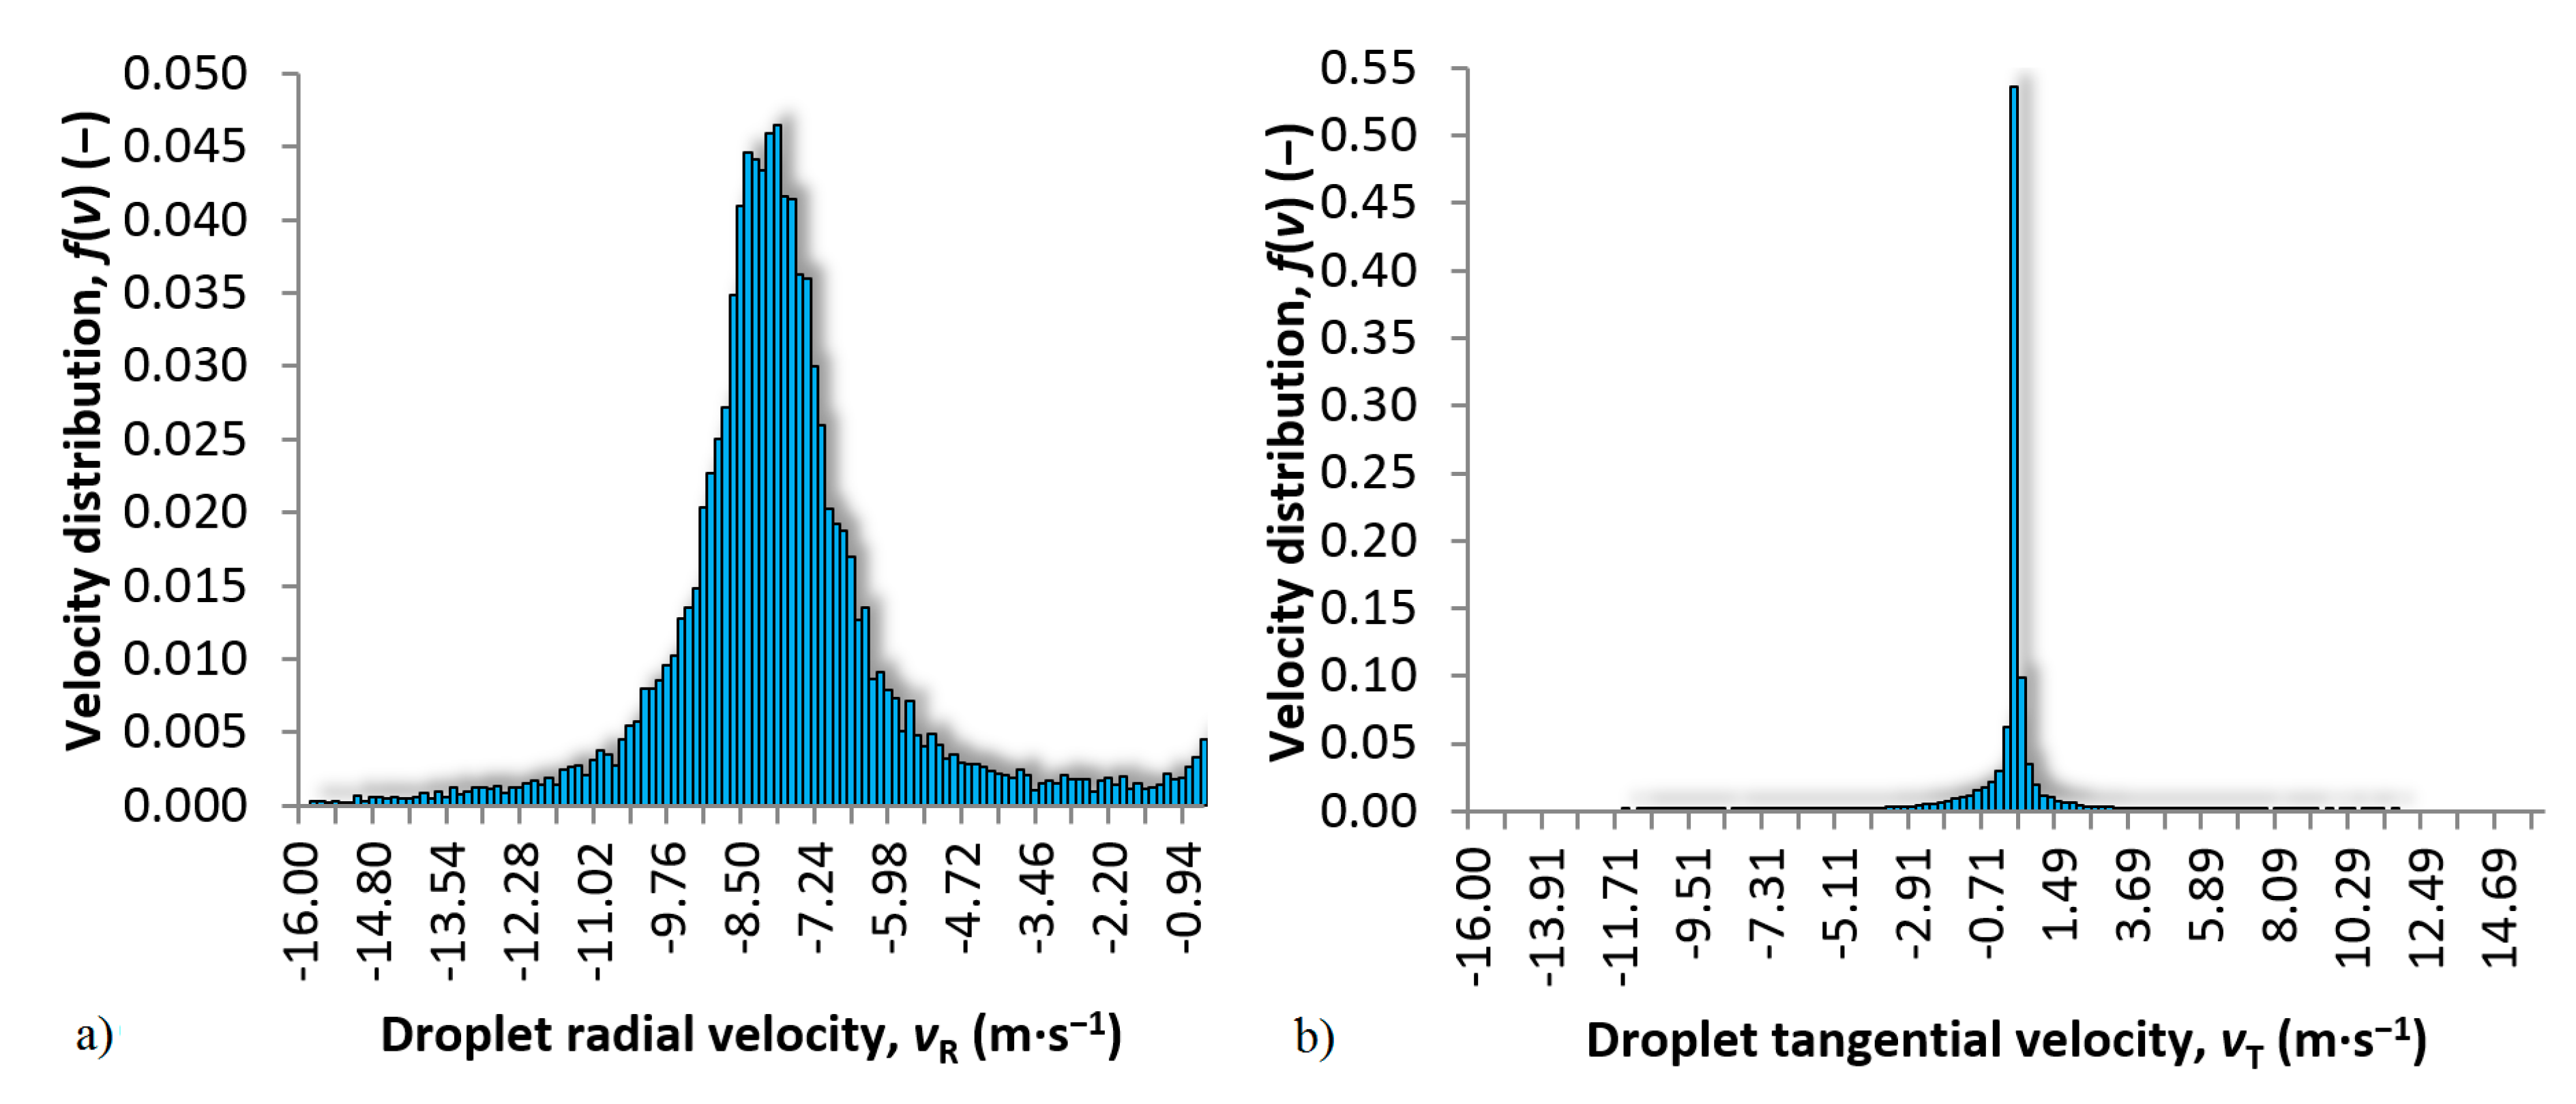
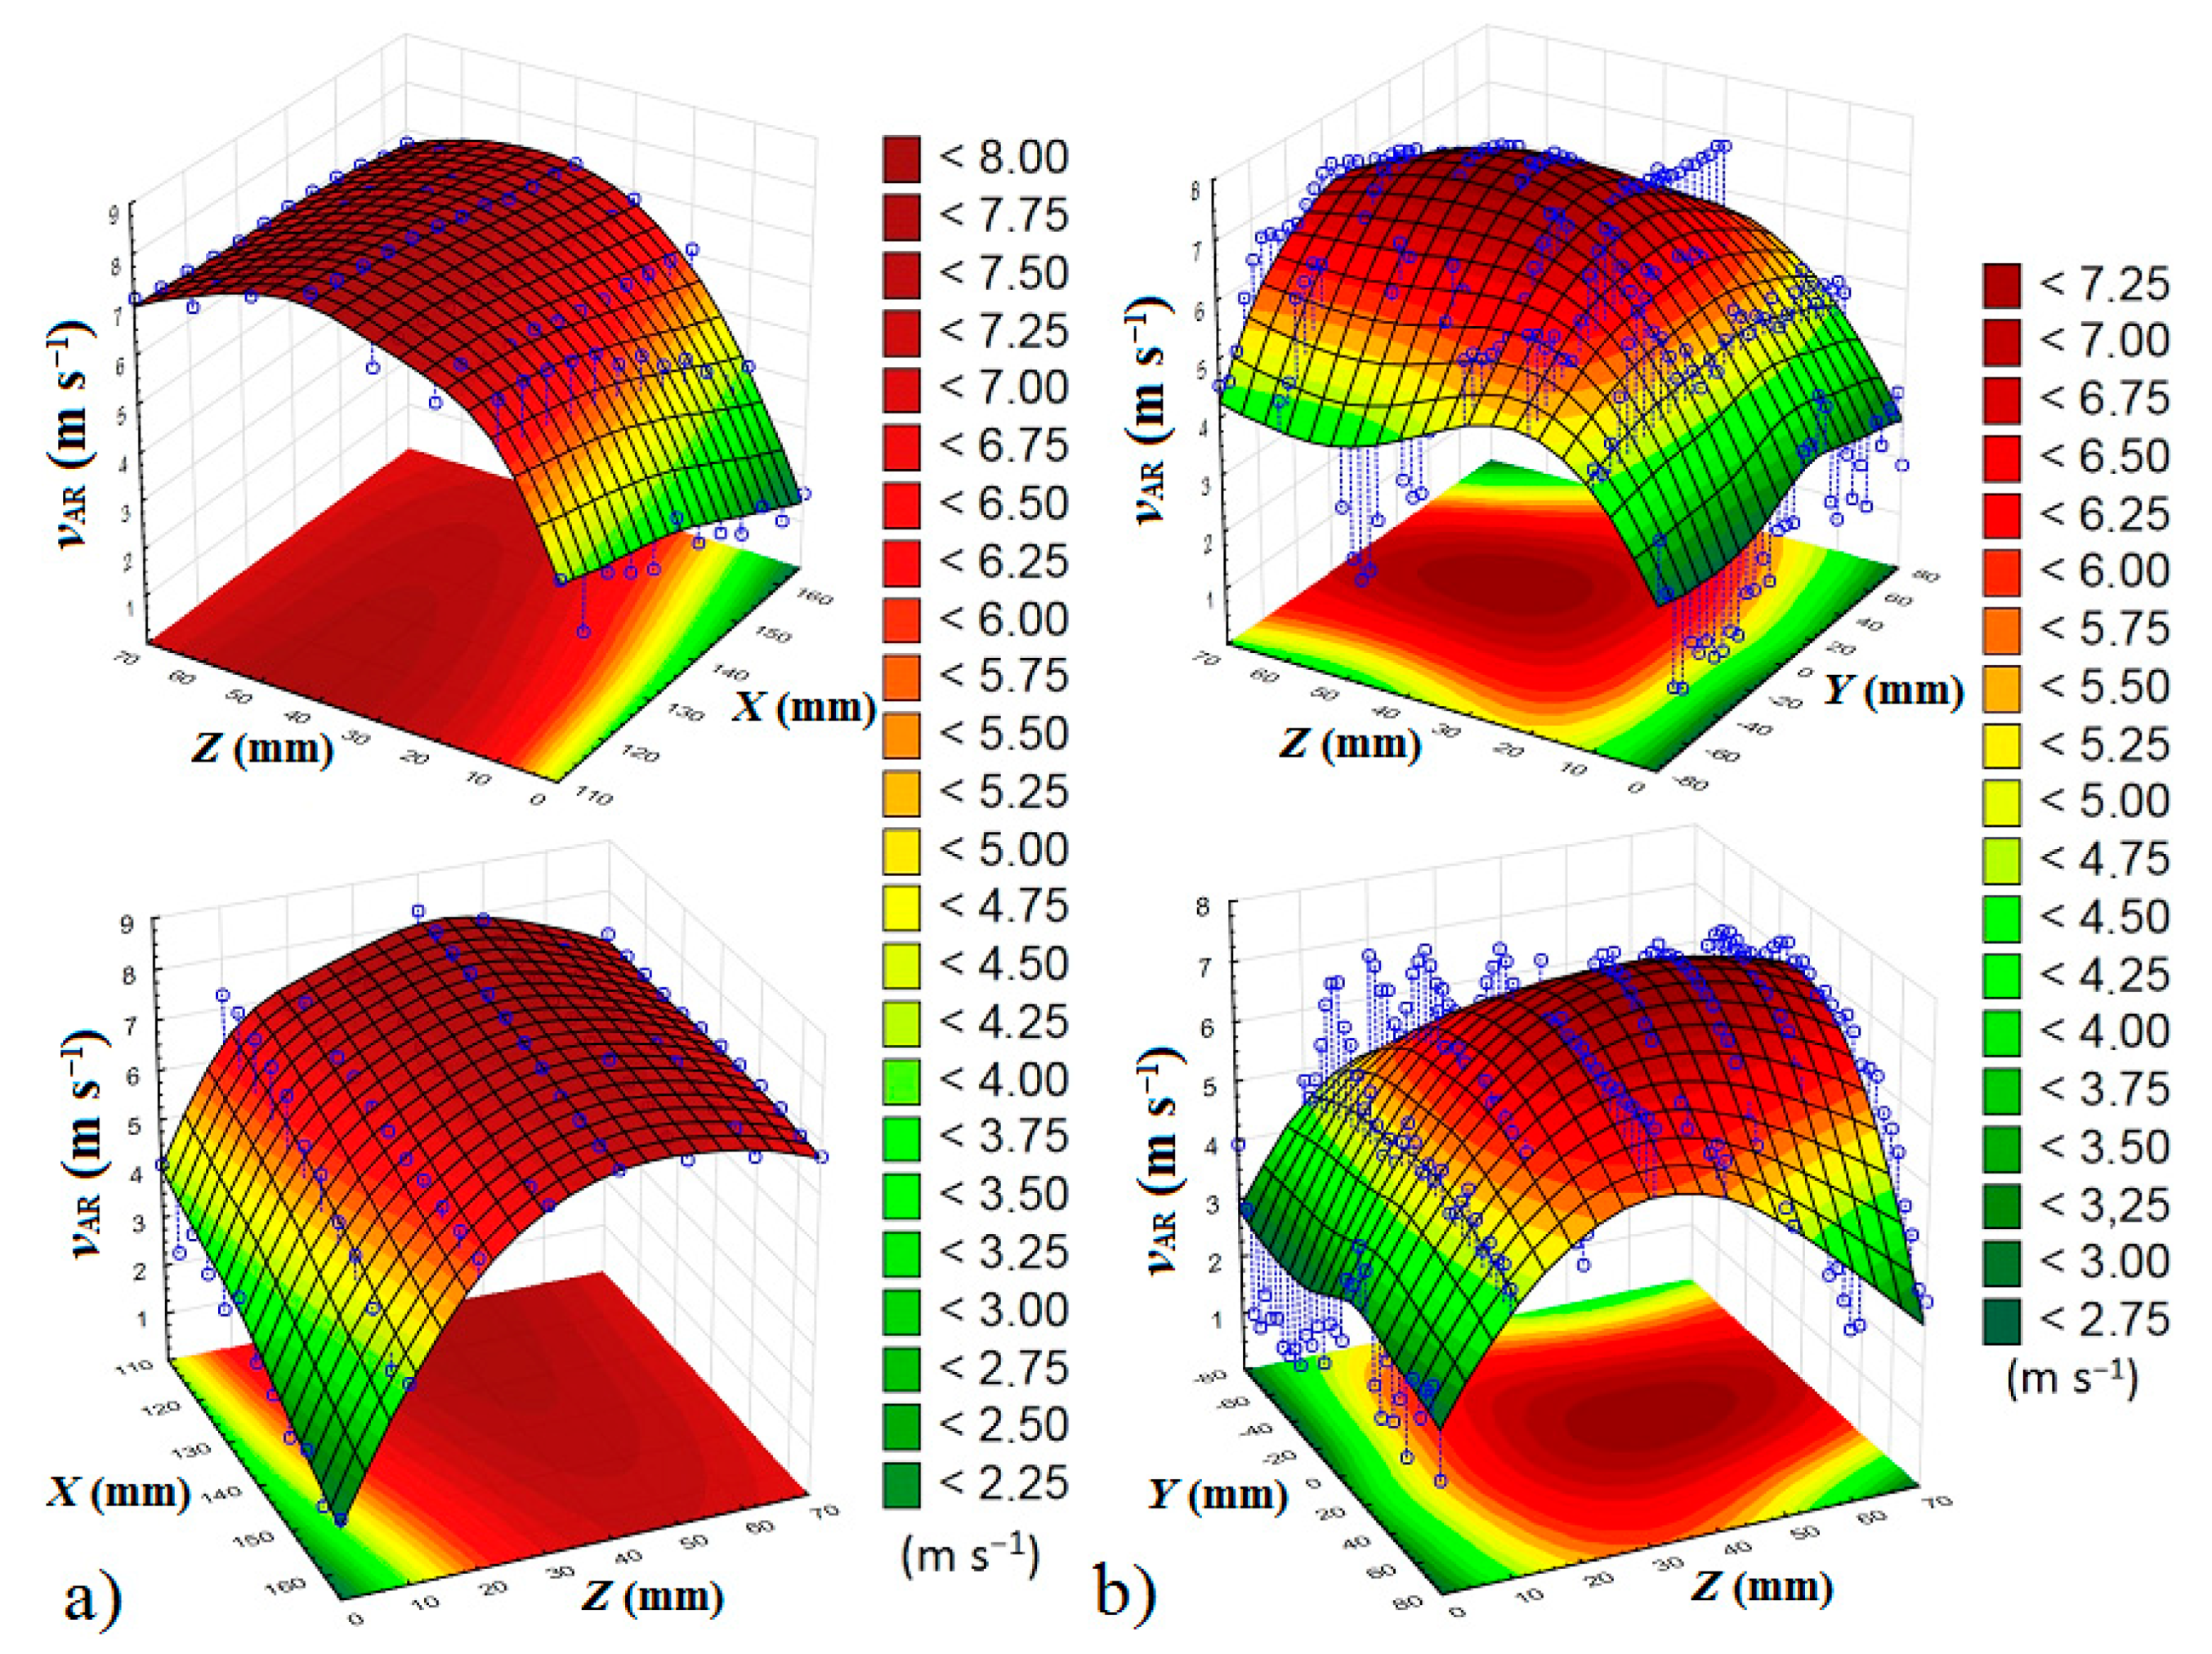
4.5. Liquid Velocity Distribution
5. Conclusions
Supplementary Materials
Author Contributions
Funding
Conflicts of Interest
References
- Seyboth, O.; Zimmermann, S.; Heidel, B.; Scheffknecht, G. Development of a Spray Scrubbing Process for Post Combustion CO2 Capture with Amine Based Solvents. Energy Procedia 2014, 63, 1667–1677. [Google Scholar] [CrossRef]
- Vlasák, J.; Svěrák, T.; Dreveny, L.; Kalivoda, J. Air Purification from CO2 Gas Using a Scrubber and Suggestions to Reach a Better Efficiency. Mater. Sci. Forum 2019, 955, 1–6. [Google Scholar] [CrossRef]
- Dumont, É. Mass Transfer in Multiphasic Gas/Liquid/Liquid Systems. KLa Determination Using the Effectiveness-Number of Transfer Unit Method. Processes 2018, 6, 156. [Google Scholar] [CrossRef]
- Li, Z.; Wang, S.; Wang, X. Spray characteristics of spiral nozzles used in wet flue gas desulfurization system. J. Southeast Univ. Nat. Sci. Ed. 2008, 38, 493–495. [Google Scholar]
- Dong, H.; Ma, H.; Li, D.; Sun, G. Comparative study on scrubbing desulfurization performances of spiral nozzle and Dynawave nozzle. Pet. Refin. Eng. 2006, 36, 32–35. [Google Scholar]
- Sadegh-Vaziri, R.; Amovic, M.; Ljunggren, R.; Engvall, K. A Medium-Scale 50 MWfuel Biomass Gasification Based Bio-SNG Plant: A Developed Gas Cleaning Process. Energies 2015, 8, 5287–5302. [Google Scholar] [CrossRef]
- Byeon, S.-H.; Lee, B.-K.; Raj Mohan, B. Removal of ammonia and particulate matter using a modified turbulent wet scrubbing system. Sep. Purif. Technol. 2012, 98, 221–229. [Google Scholar] [CrossRef]
- Zhou, J.; Zhou, S.; Zhu, Y. Characterization of Particle and Gaseous Emissions from Marine Diesel Engines with Different Fuels and Impact of After-Treatment Technology. Energies 2017, 10, 1110. [Google Scholar] [CrossRef]
- Balas, M.; Lisy, M.; Kubicek, J.; Pospisil, J. Syngas Cleaning by Wet Scrubber. WSEAS Trans. Heat Mass Transf. 2014, 9, 195–204. [Google Scholar]
- Nwokolo, N.; Mamphweli, S.; Makaka, G. Analytical and Thermal Evaluation of Carbon Particles Recovered at the Cyclone of a Downdraft Biomass Gasification System. Sustainability 2017, 9, 645. [Google Scholar] [CrossRef]
- Avveduto, A.; Ferella, F.; De Giovanni, M.; Innocenzi, V.; Pace, L.; Tripodi, P. L′Aquila Smart Clean Air City: The Italian Pilot Project for Healthy Urban Air. Environments 2017, 4, 78. [Google Scholar] [CrossRef]
- Adamec, V.; Schüllerová, B.; Hrabová, K.; Skeřil, R.; Kadlec, R.; Bulejko, P.; Adam, V. The nanoparticles concentration in the traffic loaded urban area. In Proceedings of the 9th International Conference on Nanomaterials—Research and Application, NANOCON 2017, Brno, Czech Republic, 18–20 October 2018; pp. 698–703. [Google Scholar]
- Poláčik, J.; Šnajdárek, L.; Špiláček, M.; Pospíšil, J.; Sitek, T. Particulate Matter Produced by Micro-Scale Biomass Combustion in an Oxygen-Lean Atmosphere. Energies 2018, 11, 3359. [Google Scholar] [CrossRef]
- Abdulwahid, A.A.; Situ, R.; Brown, R.J. Underground Diesel Exhaust Wet Scrubbers: Current Status and Future Prospects. Energies 2018, 11, 3006. [Google Scholar] [CrossRef]
- Sitek, T.; Pospíšil, J.; Poláčik, J.; Špiláček, M.; Varbanov, P. Fine combustion particles released during combustion of unit mass of beechwood. Renew. Energy 2019, 140, 390–396. [Google Scholar] [CrossRef]
- Svěrák, T.; Bulejko, P.; Krištof, O.; Kejík, P.; Kalivoda, J.; Horský, J. Covering ability of aluminum pigments prepared by milling processes. Powder Technol. 2017, 305, 396–404. [Google Scholar] [CrossRef]
- Sverak, T. Sorption purpose lime hydrate grinding. Int. J. Miner. Process. 2004, 74, S379–S383. [Google Scholar] [CrossRef]
- Bulejko, P.; Adamec, V.; Skeřil, R.; Schüllerová, B.; Bencko, V. Levels and Health Risk Assessment of PM10 Aerosol in Brno, Czech Republic. Cent. Eur. J. Public Health 2017, 25, 129–134. [Google Scholar] [CrossRef][Green Version]
- Bulejko, P.; Svěrák, T.; Dohnal, M.; Pospíšil, J. Aerosol filtration using hollow-fiber membranes: Effect of permeate velocity and dust amount on separation of submicron TiO2 particles. Powder Technol. 2018, 340, 344–353. [Google Scholar] [CrossRef]
- Sverak, T.; Bulejko, P.; Ostrezi, J.; Kristof, O.; Kalivoda, J.; Kejik, P.; Mayerova, K.; Adamcik, M. Separation of gaseous air pollutants using membrane contactors. IOP Conf. Ser. Earth Environ. Sci. 2017, 92, 012061. [Google Scholar] [CrossRef]
- Bulejko, P. Numerical Comparison of Prediction Models for Aerosol Filtration Efficiency Applied on a Hollow-Fiber Membrane Pore Structure. Nanomaterials 2018, 8, 447. [Google Scholar] [CrossRef]
- Ghasem, N. Modeling and Simulation of the Absorption of CO2 and NO2 from a Gas Mixture in a Membrane Contactor. Processes 2019, 7, 441. [Google Scholar] [CrossRef]
- Bulejko, P.; Krištof, O.; Dohnal, M.; Svěrák, T. Fine/ultrafine particle air filtration and aerosol loading of hollow-fiber membranes: A comparison of mathematical models for the most penetrating particle size and dimensionless permeability with experimental data. J. Membr. Sci. 2019, 592, 117393. [Google Scholar] [CrossRef]
- Bogacki, J.; Marcinowski, P.; Majewski, M.; Zawadzki, J.; Sivakumar, S. Alternative Approach to Current EU BAT Recommendation for Coal-Fired Power Plant Flue Gas Desulfurization Wastewater Treatment. Processes 2018, 6, 229. [Google Scholar] [CrossRef]
- Gao, G.; Wang, C.; Kou, Z. Experimental Studies on the Spraying Pattern of a Swirl Nozzle for Coal Dust Control. Appl. Sci. 2018, 8, 1770. [Google Scholar] [CrossRef]
- Chabičovský, M.; Hnízdil, M.; Tseng, A.A.; Raudenský, M. Effects of oxide layer on Leidenfrost temperature during spray cooling of steel at high temperatures. Int. J. Heat Mass Transf. 2015, 88, 236–246. [Google Scholar] [CrossRef]
- Brozova, T.; Chabicovsky, M.; Horsky, J. Influence of the Surface Roughness on the Cooling Intensity During Spray Cooling. In Proceedings of the 25th Anniversary International Conference on Metallurgy and Materials (METAL), Ostrava, Czech Republic, 25–27 May 2016; Volume 2016, pp. 41–46. [Google Scholar]
- Tseng, A.A.; Raudensky, M.; Lee, T.-W. Liquid Sprays for Heat Transfer Enhancements: A Review. Heat Transf. Eng. 2016, 37, 1401–1417. [Google Scholar] [CrossRef]
- Stransky, M.; Brozova, T.; Raudensky, M.; Hnizdil, M.; Turon, R. Effect of Various Spray Cooling Configurations on Hardness Profile of Tubes. In Proceedings of the 24th International Conference on Metallurgy and Materials, Ostrava, Czech Republic, 3–5 June 2015; Volume 2015, pp. 880–885. [Google Scholar]
- Lee, T.-W.; Hnizdil, M.; Chabicovsky, M.; Raudensky, M. Approximate Solution to the Spray Heat Transfer Problem at High Surface Temperatures and Liquid Mass Fluxes. Heat Transf. Eng. 2018, 40, 1649–1655. [Google Scholar] [CrossRef]
- Votavová, H.; Pohanka, M.; Bulejko, P. Cooling homogeneity measurement during hydraulic descaling in spray overlapping area. In Proceedings of the 24th International Conference on Metallurgy and Materials, Brno, Czech Republic, 3–5 June 2015; pp. 265–270. [Google Scholar]
- Zhang, D.; Li, Z.; Yi, W.; Wang, F. Test study of spray characteristics of spiral nozzle in the spray tower. Acta Energiae Solaris Sin. 2013, 34, 1969–1972. [Google Scholar]
- Ren, Z.; Hao, Y.; Wang, B. Experimental Analysis on Spiral Pressure Nozzle and Spray Angle Control in the Spray Dryer. In Proceedings of the 2011 International Conference on Internet Computing and Information Services, Hong Kong, China, 17–18 September 2011; pp. 163–165. [Google Scholar]
- Cong, H.; Li, X.; Li, Z.; Li, H.; Gao, X. Combination of spiral nozzle and column tray leading to a new direction on the distillation equipment innovation. Sep. Purif. Technol. 2016, 158, 293–301. [Google Scholar] [CrossRef]
- Cheng, X.M.; Hashimoto, B.; Kage, S.; Matsumae, Y.; Horii, K.; Ohsumi, K. Flow in Spiral Nozzle for Rope-installation in Petrochemical Pipeline Repairs. J. Jpn. Pet. Inst. 1992, 35, 382–389. [Google Scholar] [CrossRef]
- Tanner, G.; Knasiak, K.F. Spray Characterization of Typical Fire Suppression Nozzles. In Proceedings of the Third International Water Mist Conference, Madrid, Spain, 22–24 September 2003; pp. 1–16. [Google Scholar]
- Jiang, L.; Wu, R.; Zhao, H.; Mei, P.; Zhang, Q.; Zhu, J.; Xiao, J.; Lei, B. Middle or low water pressure direct spiral double helix converging nozzle structure optimization and flow field analysis. High Technol. Lett. 2015, 21, 261–268. [Google Scholar]
- Wąsik, W.; Walczak, A.; Węsierski, T. The impact of fog nozzle type on the distribution of mass spray density. MATEC Web Conf. 2018, 247, 00058. [Google Scholar] [CrossRef]
- Liu, N.-L.; Zhang, X. Distribution of droplet diameters and the spline of their empirical equation for spiral nozzle. J. Exp. Fluid Mech. 2006, 20, 8–12. [Google Scholar]
- Liu, N.; Zhang, X. Experimental research on spray and flow rate characteristics of spiral nozzle. Trans. Chin. Soc. Agric. Mach. 2006, 37, 79–82. [Google Scholar]
- Zhou, H.; Guo, W.; Zhu, Y.; Ma, W. Flow Distribution Characteristics of Low-pressure High-flux Spiral Nozzles. J. Chin. Soc. Power Eng. 2017, 37, 577–583. [Google Scholar]
- Li, C.; Wang, S.; Zhong, Z.; Zhang, X.; Kang, L. Research on spray surfaces geometry model of spiral nozzles with involute atomization. Trans. Chin. Soc. Agric. Mach. 2007, 38, 19. [Google Scholar]
- Kalata, W.; Brown, K.J.; Schick, R.J. Air Assisted Atomization in Spiral Type Nozzles. In Proceedings of the 25th Annual Conference on Liquid Atomization and Spray Systems, ILASS Americas, Pittsburgh, PA, USA, 21–23 May 2013; p. 8. [Google Scholar]
- Bete TF Spray Nozzle. Available online: https://www.johnbrooks.ca/product/bete-tf-spray-nozzle/ (accessed on 14 May 2019).
- Han, H.; Wang, P.; Liu, R.; Li, Y.; Wang, J.; Jiang, Y. Experimental study on atomization characteristics of two common spiral channel pressure nozzles. E3S Web Conf. 2019, 81, 01022. [Google Scholar] [CrossRef]
- Kim, T.H.; Matsuo, S.; Setoguchi, T.; Yu, S. A study on flow characteristics in a spiral flow nozzle. Int. J. Turbo Jet Engines 2006, 23, 129–136. [Google Scholar] [CrossRef]
- Matsuo, S.; Kim, T.-H.; Setoguchi, T.; Kim, H.D.; Lee, Y.-W. Effect of nozzle geometry on the flow characteristics of spiral flow generated through an annular slit. J. Therm. Sci. 2007, 16, 149–154. [Google Scholar] [CrossRef]
- Jain, M.; John, B.; Iyer, K.N.; Prabhu, S.V. Characterization of the full cone pressure swirl spray nozzles for the nuclear reactor containment spray system. Nucl. Eng. Des. 2014, 273, 131–142. [Google Scholar] [CrossRef]
- Zacarías, A.; Venegas, M.; Lecuona, A.; Ventas, R.; Carvajal, I. Experimental assessment of vapour adiabatic absorption into solution droplets using a full cone nozzle. Exp. Therm. Fluid Sci. 2015, 68, 228–238. [Google Scholar] [CrossRef]
- Valencia-Bejarano, M.; Langrish, T.A.G. Experimental investigation of droplet coalescence in a full-cone spray from a two-fluid nozzle using laser diffraction measurements. At. Sprays 2004, 14, 355–374. [Google Scholar] [CrossRef]
- Tseng, A.A.; Bellerová, H.; Pohanka, M.; Raudensky, M. Effects of titania nanoparticles on heat transfer performance of spray cooling with full cone nozzle. Appl. Therm. Eng. 2014, 62, 20–27. [Google Scholar] [CrossRef]
- Sada, E.; Takahashi, K.; Morikawa, K.; Ito, S. Drop size distribution for spray by full cone nozzle. Can. J. Chem. Eng. 1978, 56, 455–459. [Google Scholar] [CrossRef]
- Naz, M.Y.; Sulaiman, S.A.; Ariwahjoedi, B.; Zilati, K. Visual characterization of heated water spray jet breakup induced by full cone spray nozzles. J. Appl. Mech. Tech. Phys. 2015, 56, 211–219. [Google Scholar] [CrossRef]
- Naz, M.Y.; Sulaiman, S.A.; Ariwahjoedi, B.; Ku Shaari, K.Z. Investigation of vortex clouds and droplet sizes in heated water spray patterns generated by axisymmetric full cone nozzles. Sci. World J. 2013, 2013. [Google Scholar] [CrossRef]
- Kohnen, B.T.; Pieloth, D.; Musemic, E.; Walzel, P. Characterization of full cone nozzles. At. Sprays 2011, 21, 317–325. [Google Scholar] [CrossRef]
- Jiang, P.; Wang, Q.; Sabariman, I.; Specht, E. Experimental study on heat transfer of pressurized spray cooling on the heated plate by using 45° full cone nozzles. Appl. Mech. Mater. 2014, 535, 32–36. [Google Scholar] [CrossRef]
- Bellerová, H.; Tseng, A.A.; Pohanka, M.; Raudensky, M. Heat transfer of spray cooling using alumina/water nanofluids with full cone nozzles. Heat Mass Transf. 2012, 48, 1971–1983. [Google Scholar] [CrossRef]
- Jašíková, D.; Kotek, M.; Lenc, T.; Kopecký, V. The study of full cone spray using interferometric particle imaging method. EPJ Web Conf. 2012, 25, 01033. [Google Scholar] [CrossRef]
- Standard Full Cone Spiral Nozzle—BETE Online Catalogue. Available online: http://www.spray-nozzle.co.uk/docs/default-source/spec-sheet-pdf′s/tf-full-cone-data-sheet.pdf?sfvrsn=5cb16e8d_5 (accessed on 1 May 2019).
- Lefebvre, A.H.; McDonell, V.G. Atomization and Sprays; CRC Press: Boca Raton, FL, USA, 2017; ISBN 978-1-315-12091-1. [Google Scholar]
- Rahman, M.A.; Heidrick, T.; Fleck, B.A. Correlations between the two-phase gas/liquid spray atomization and the Stokes/aerodynamic Weber numbers. J. Phys. Conf. Ser. 2009, 147, 012057. [Google Scholar] [CrossRef]
- Guildenbecher, D.R.; López-Rivera, C.; Sojka, P.E. Droplet Deformation and Breakup. In Handbook of Atomization and Sprays: Theory and Applications; Ashgriz, N., Ed.; Springer: Boston, MA, USA, 2011; pp. 145–156. ISBN 978-1-4419-7264-4. [Google Scholar]
- Ashgriz, N.; Li, X.; Sarchami, A. Instability of Liquid Sheets. In Handbook of Atomization and Sprays: Theory and Applications; Ashgriz, N., Ed.; Springer: Boston, MA, USA, 2011; pp. 75–95. ISBN 978-1-4419-7264-4. [Google Scholar]
- Vegad, C.S.; Chakravarthy, S.R.; Kumar, A. Dynamics of a radially expanding circular liquid sheet and its atomization characteristics. Fire Saf. J. 2018, 100, 51–63. [Google Scholar] [CrossRef]
- Taylor, G.I. The dynamics of thin sheets of fluid. III. Disintegration of fluid sheets. Proc. R. Soc. Lond. Ser. Math. Phys. Sci. 1959, 253, 313–321. [Google Scholar]
- Pilch, M.; Erdman, C.A. Use of breakup time data and velocity history data to predict the maximum size of stable fragments for acceleration-induced breakup of a liquid drop. Int. J. Multiph. Flow 1987, 13, 741–757. [Google Scholar] [CrossRef]
- Faeth, G.M.; Hsiang, L.-P.; Wu, P.-K. Structure and breakup properties of sprays. Int. J. Multiph. Flow 1995, 21, 99–127. [Google Scholar] [CrossRef]
- Guildenbecher, D.R.; López-Rivera, C.; Sojka, P.E. Secondary atomization. Exp. Fluids 2009, 46, 371. [Google Scholar] [CrossRef]
- Luo, K.; Shao, C.; Chai, M.; Fan, J. Level set method for atomization and evaporation simulations. Prog. Energy Combust. Sci. 2019, 73, 65–94. [Google Scholar] [CrossRef]
- Zhao, H.; Liu, H. Breakup Morphology and Mechanisms of Liquid Atomization. Adv. Jet Engines 2019. [Google Scholar]
- Chryssakis, C.A.; Assanis, D.N.; Tanner, F.X. Atomization Models. In Handbook of Atomization and Sprays: Theory and Applications; Ashgriz, N., Ed.; Springer US: Boston, MA, USA, 2011; pp. 215–231. ISBN 978-1-4419-7264-4. [Google Scholar]
- Gelfand, B.E. Droplet breakup phenomena in flows with velocity lag. Prog. Energy Combust. Sci. 1996, 22, 201–265. [Google Scholar] [CrossRef]
- Watson, E.J. The radial spread of a liquid jet over a horizontal plane. J. Fluid Mech. 1964, 20, 481–499. [Google Scholar] [CrossRef]
- Ren, N.; Blum, A.; Zheng, Y.; Do, C.; Marshall, A. Quantifying the Initial Spray from Fire Sprinklers. Fire Saf. Sci. 2008, 9, 503–514. [Google Scholar] [CrossRef]
- Zhou, X.; Yu, H.-Z. Experimental investigation of spray formation as affected by sprinkler geometry. Fire Saf. J. 2011, 46, 140–150. [Google Scholar] [CrossRef]
- Dombrowski, N.; Johns, W.R. The aerodynamic instability and disintegration of viscous liquid sheets. Chem. Eng. Sci. 1963, 18, 203–214. [Google Scholar] [CrossRef]
- Weber, C. The break-up of liquid jets (Zum Zerfall eines Flüssigkeitsstrahles). ZAMM J. Appl. Math. Mech. Z. Angew. Math. Mech. 1931, 11, 136–154. [Google Scholar] [CrossRef]
- Dombrowski, N.; Hooper, P.C. The effect of ambient density on drop formation in sprays. Chem. Eng. Sci. 1962, 17, 291–305. [Google Scholar] [CrossRef]
- Wu, D.; Guillemin, D.; Marshall, A.W. A modeling basis for predicting the initial sprinkler spray. Fire Saf. J. 2007, 42, 283–294. [Google Scholar] [CrossRef]
- Crowe, C.T.; Schwarzkopf, J.D.; Sommerfeld, M.; Tsuji, Y. Multiphase Flows with Droplets and Particles, 2nd ed.; CRC Press: Boca Raton, FL, USA, 2011; ISBN 978-1-4398-4050-4. [Google Scholar]
- Xia, Y.; Khezzar, L.; Alshehhi, M.; Hardalupas, Y. Droplet size and velocity characteristics of water-air impinging jet atomizer. Int. J. Multiph. Flow 2017, 94, 31–43. [Google Scholar] [CrossRef]
- Liu, C.; Liu, F.; Yang, J.; Mu, Y.; Hu, C.; Xu, G. Experimental investigations of spray generated by a pressure swirl atomizer. J. Energy Inst. 2019, 92, 210–221. [Google Scholar] [CrossRef]
- Huang, J.C.P. The break-up of axisymmetric liquid sheets. J. Fluid Mech. 1970, 43, 305–319. [Google Scholar] [CrossRef]
- Jordan, S.J.; Ryder, N.L.; Repcik, J.; Marshall, A.W. Spatially-resolved spray measurements and their implications. Fire Saf. J. 2017, 91, 723–729. [Google Scholar] [CrossRef]
- Myers, T.; Trouvé, A.; Marshall, A. Predicting sprinkler spray dispersion in FireFOAM. Fire Saf. J. 2018, 100, 93–102. [Google Scholar] [CrossRef]
- Dai, Z.; Faeth, G.M. Temporal properties of secondary drop breakup in the multimode breakup regime. Int. J. Multiph. Flow 2001, 27, 217–236. [Google Scholar] [CrossRef]
- Krzeczkowski, S.A. Measurement of liquid droplet disintegration mechanisms. Int. J. Multiph. Flow 1980, 6, 227–239. [Google Scholar] [CrossRef]
- Cao, X.-K.; Sun, Z.-G.; Li, W.-F.; Liu, H.-F.; Yu, Z.-H. A new breakup regime of liquid drops identified in a continuous and uniform air jet flow. Phys. Fluids 2007, 19, 057103. [Google Scholar] [CrossRef]
- Sirignano, W.A.; Mehring, C. Review of theory of distortion and disintegration of liquid streams. Prog. Energy Combust. Sci. 2000, 26, 609–655. [Google Scholar] [CrossRef]
- Sun, Y.; Alkhedhair, A.M.; Guan, Z.; Hooman, K. Numerical and experimental study on the spray characteristics of full-cone pressure swirl atomizers. Energy 2018, 160, 678–692. [Google Scholar] [CrossRef]
- Wittner, M.O.; Karbstein, H.P.; Gaukel, V. Air-Core-Liquid-Ring (ACLR) Atomization: Influences of Gas Pressure and Atomizer Scale Up on Atomization Efficiency. Processes 2019, 7, 139. [Google Scholar] [CrossRef]
- Li, W.; Qian, L.; Song, S.; Zhong, X. Numerical Study on the Influence of Shaping Air Holes on Atomization Performance in Pneumatic Atomizers. Coatings 2019, 9, 410. [Google Scholar] [CrossRef]
- Darwish Ahmad, A.; Abubaker, A.M.; Salaimeh, A.A.; Akafuah, N.K. Schlieren Visualization of Shaping Air during Operation of an Electrostatic Rotary Bell Sprayer: Impact of Shaping Air on Droplet Atomization and Transport. Coatings 2018, 8, 279. [Google Scholar] [CrossRef]
- Ren, N.; Baum, H.R.; Marshall, A.W. A comprehensive methodology for characterizing sprinkler sprays. Proc. Combust. Inst. 2011, 33, 2547–2554. [Google Scholar] [CrossRef]
- Elkotb, M.M. Fuel atomization for spray modelling. Prog. Energy Combust. Sci. 1982, 8, 61–91. [Google Scholar] [CrossRef]
- Nonnenmacher, S.; Piesche, M. Design of hollow cone pressure swirl nozzles to atomize Newtonian fluids. Chem. Eng. Sci. 2000, 55, 4339–4348. [Google Scholar] [CrossRef]


| Inlet Pressure (bar) | 1.00 | 1.25 | 1.5 | 1.75 | 2.00 |
|---|---|---|---|---|---|
| Flowrate (L/s) | 1.25 | 1.41 | 1.54 | 1.65 | 1.76 |
© 2019 by the authors. Licensee MDPI, Basel, Switzerland. This article is an open access article distributed under the terms and conditions of the Creative Commons Attribution (CC BY) license (http://creativecommons.org/licenses/by/4.0/).
Share and Cite
Krištof, O.; Bulejko, P.; Svěrák, T. Experimental Study on Spray Breakup in Turbulent Atomization Using a Spiral Nozzle. Processes 2019, 7, 911. https://doi.org/10.3390/pr7120911
Krištof O, Bulejko P, Svěrák T. Experimental Study on Spray Breakup in Turbulent Atomization Using a Spiral Nozzle. Processes. 2019; 7(12):911. https://doi.org/10.3390/pr7120911
Chicago/Turabian StyleKrištof, Ondřej, Pavel Bulejko, and Tomáš Svěrák. 2019. "Experimental Study on Spray Breakup in Turbulent Atomization Using a Spiral Nozzle" Processes 7, no. 12: 911. https://doi.org/10.3390/pr7120911
APA StyleKrištof, O., Bulejko, P., & Svěrák, T. (2019). Experimental Study on Spray Breakup in Turbulent Atomization Using a Spiral Nozzle. Processes, 7(12), 911. https://doi.org/10.3390/pr7120911