Techno-Economic Implications of Fed-Batch Enzymatic Hydrolysis

Abstract
:1. Introduction
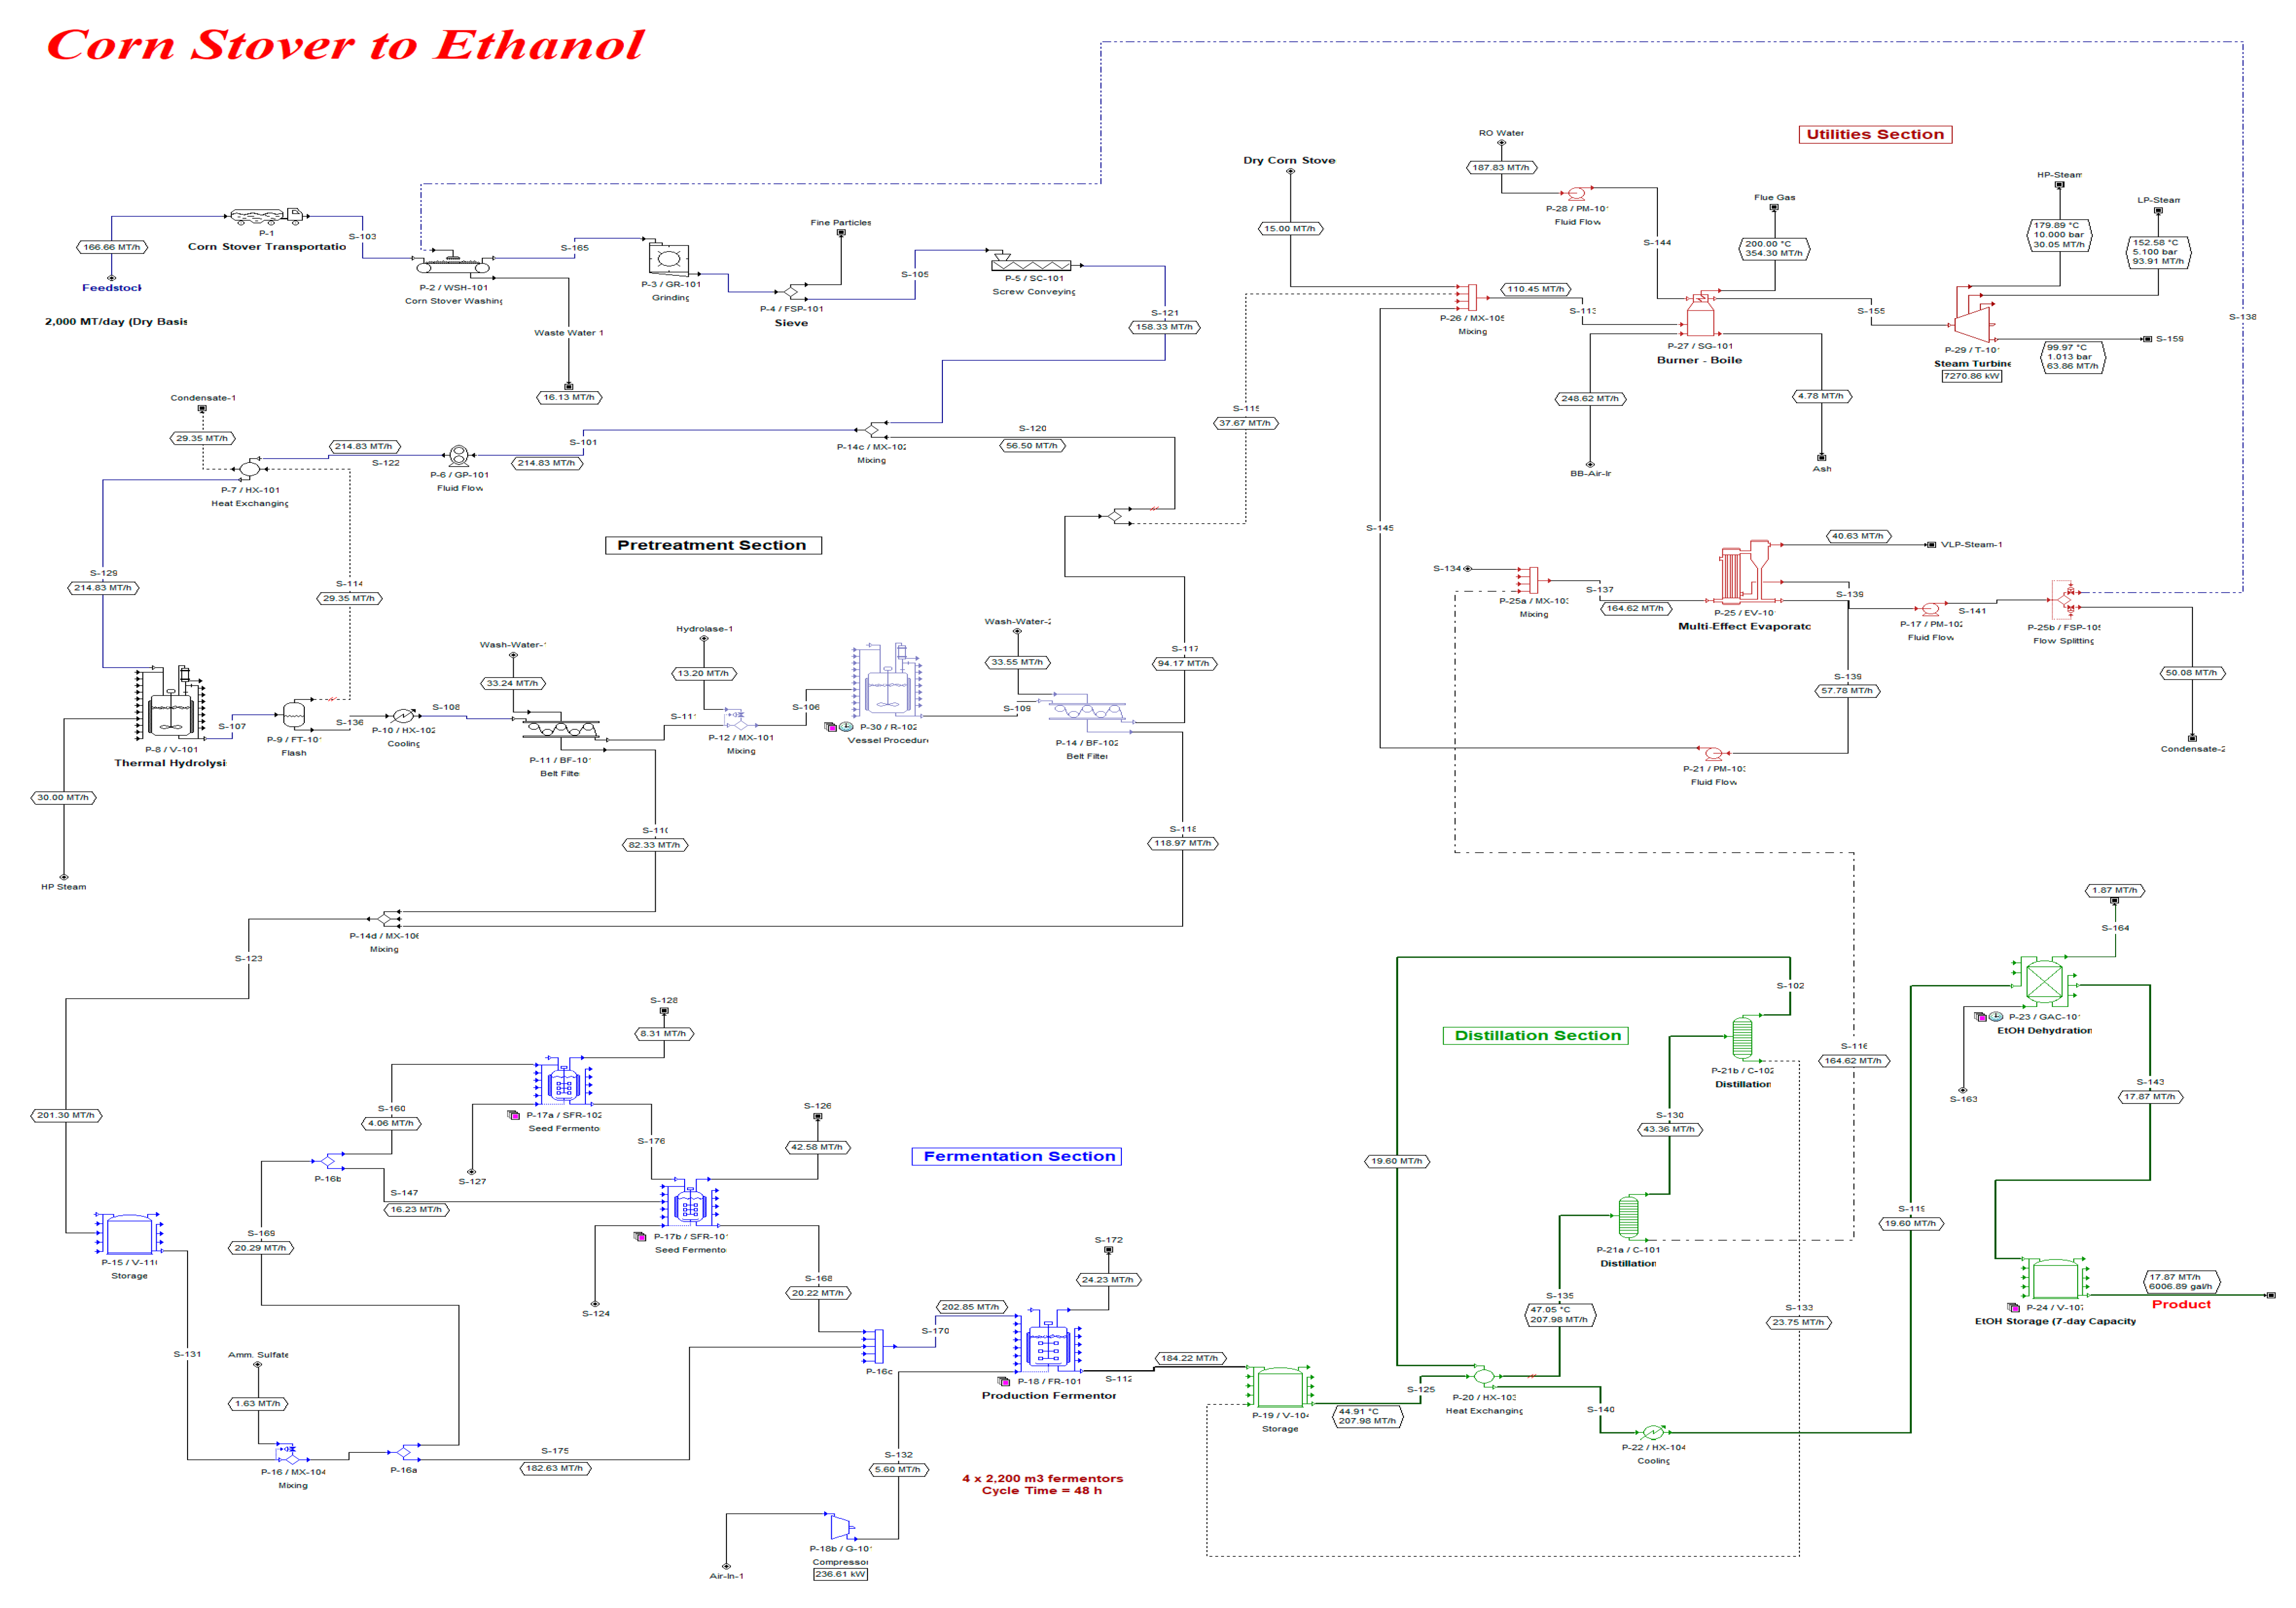
2. Materials and Methods
3. Results and Discussion
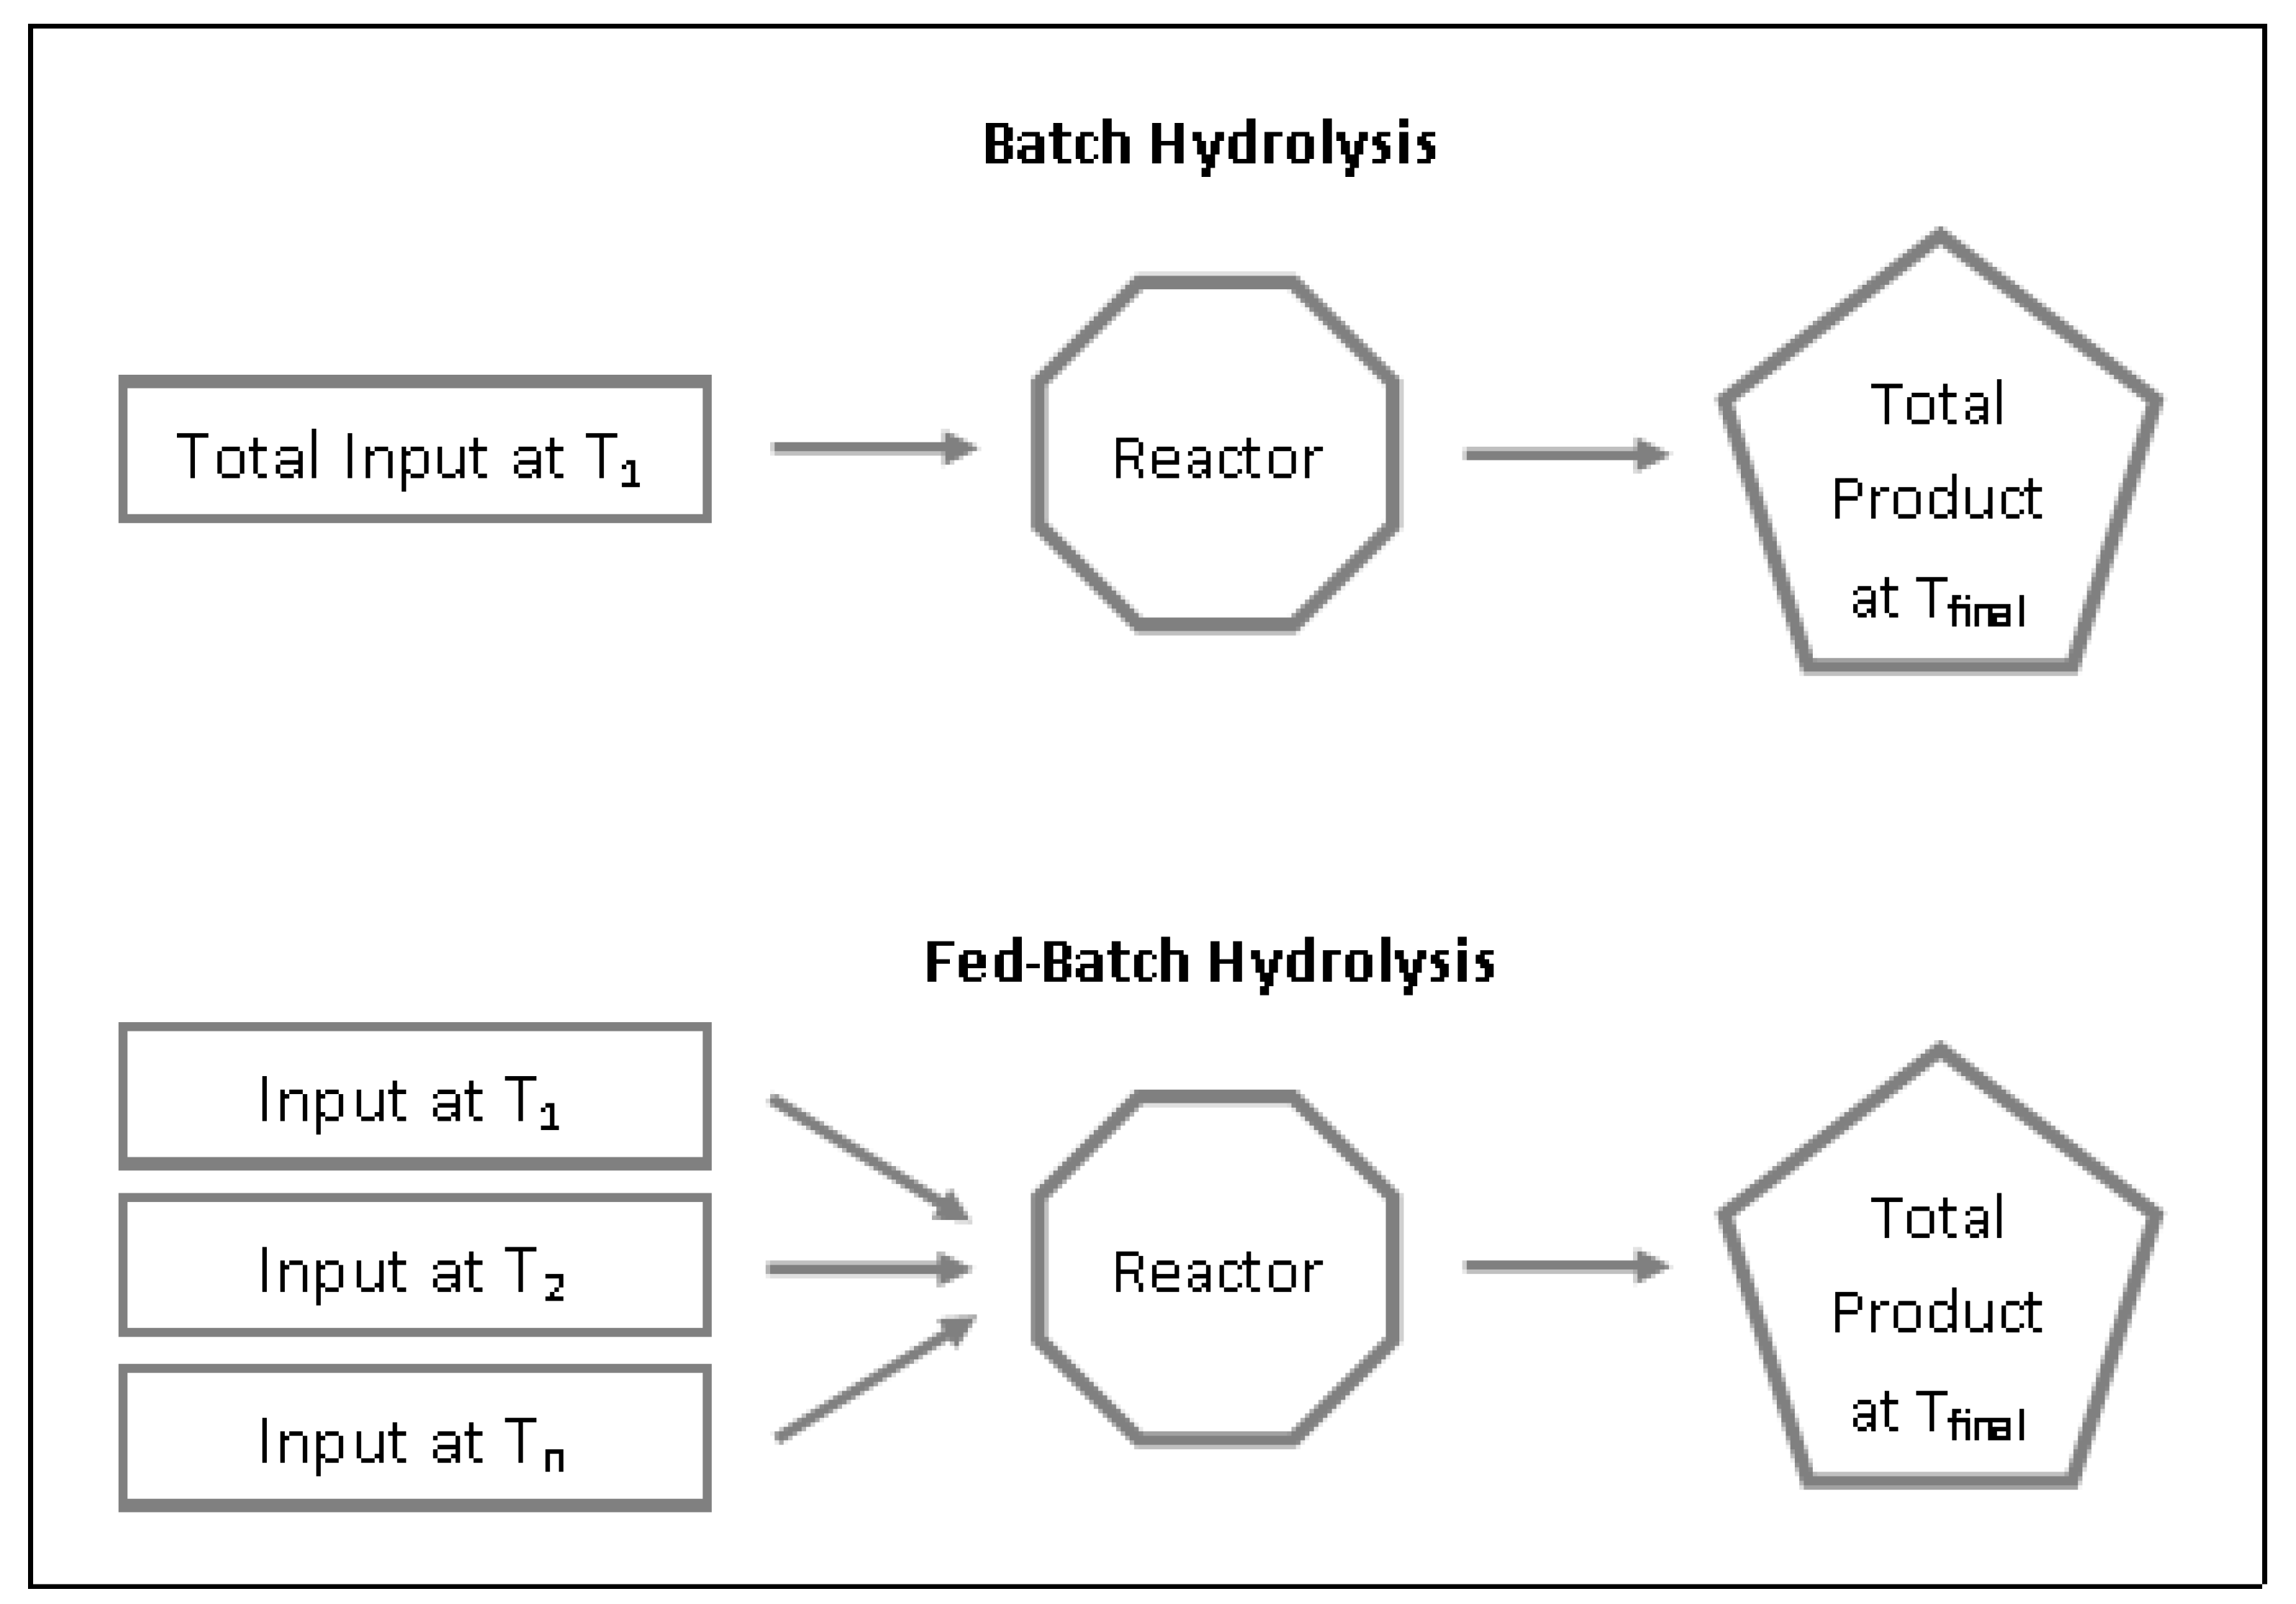
3.1. Batch vs. Fed-Batch
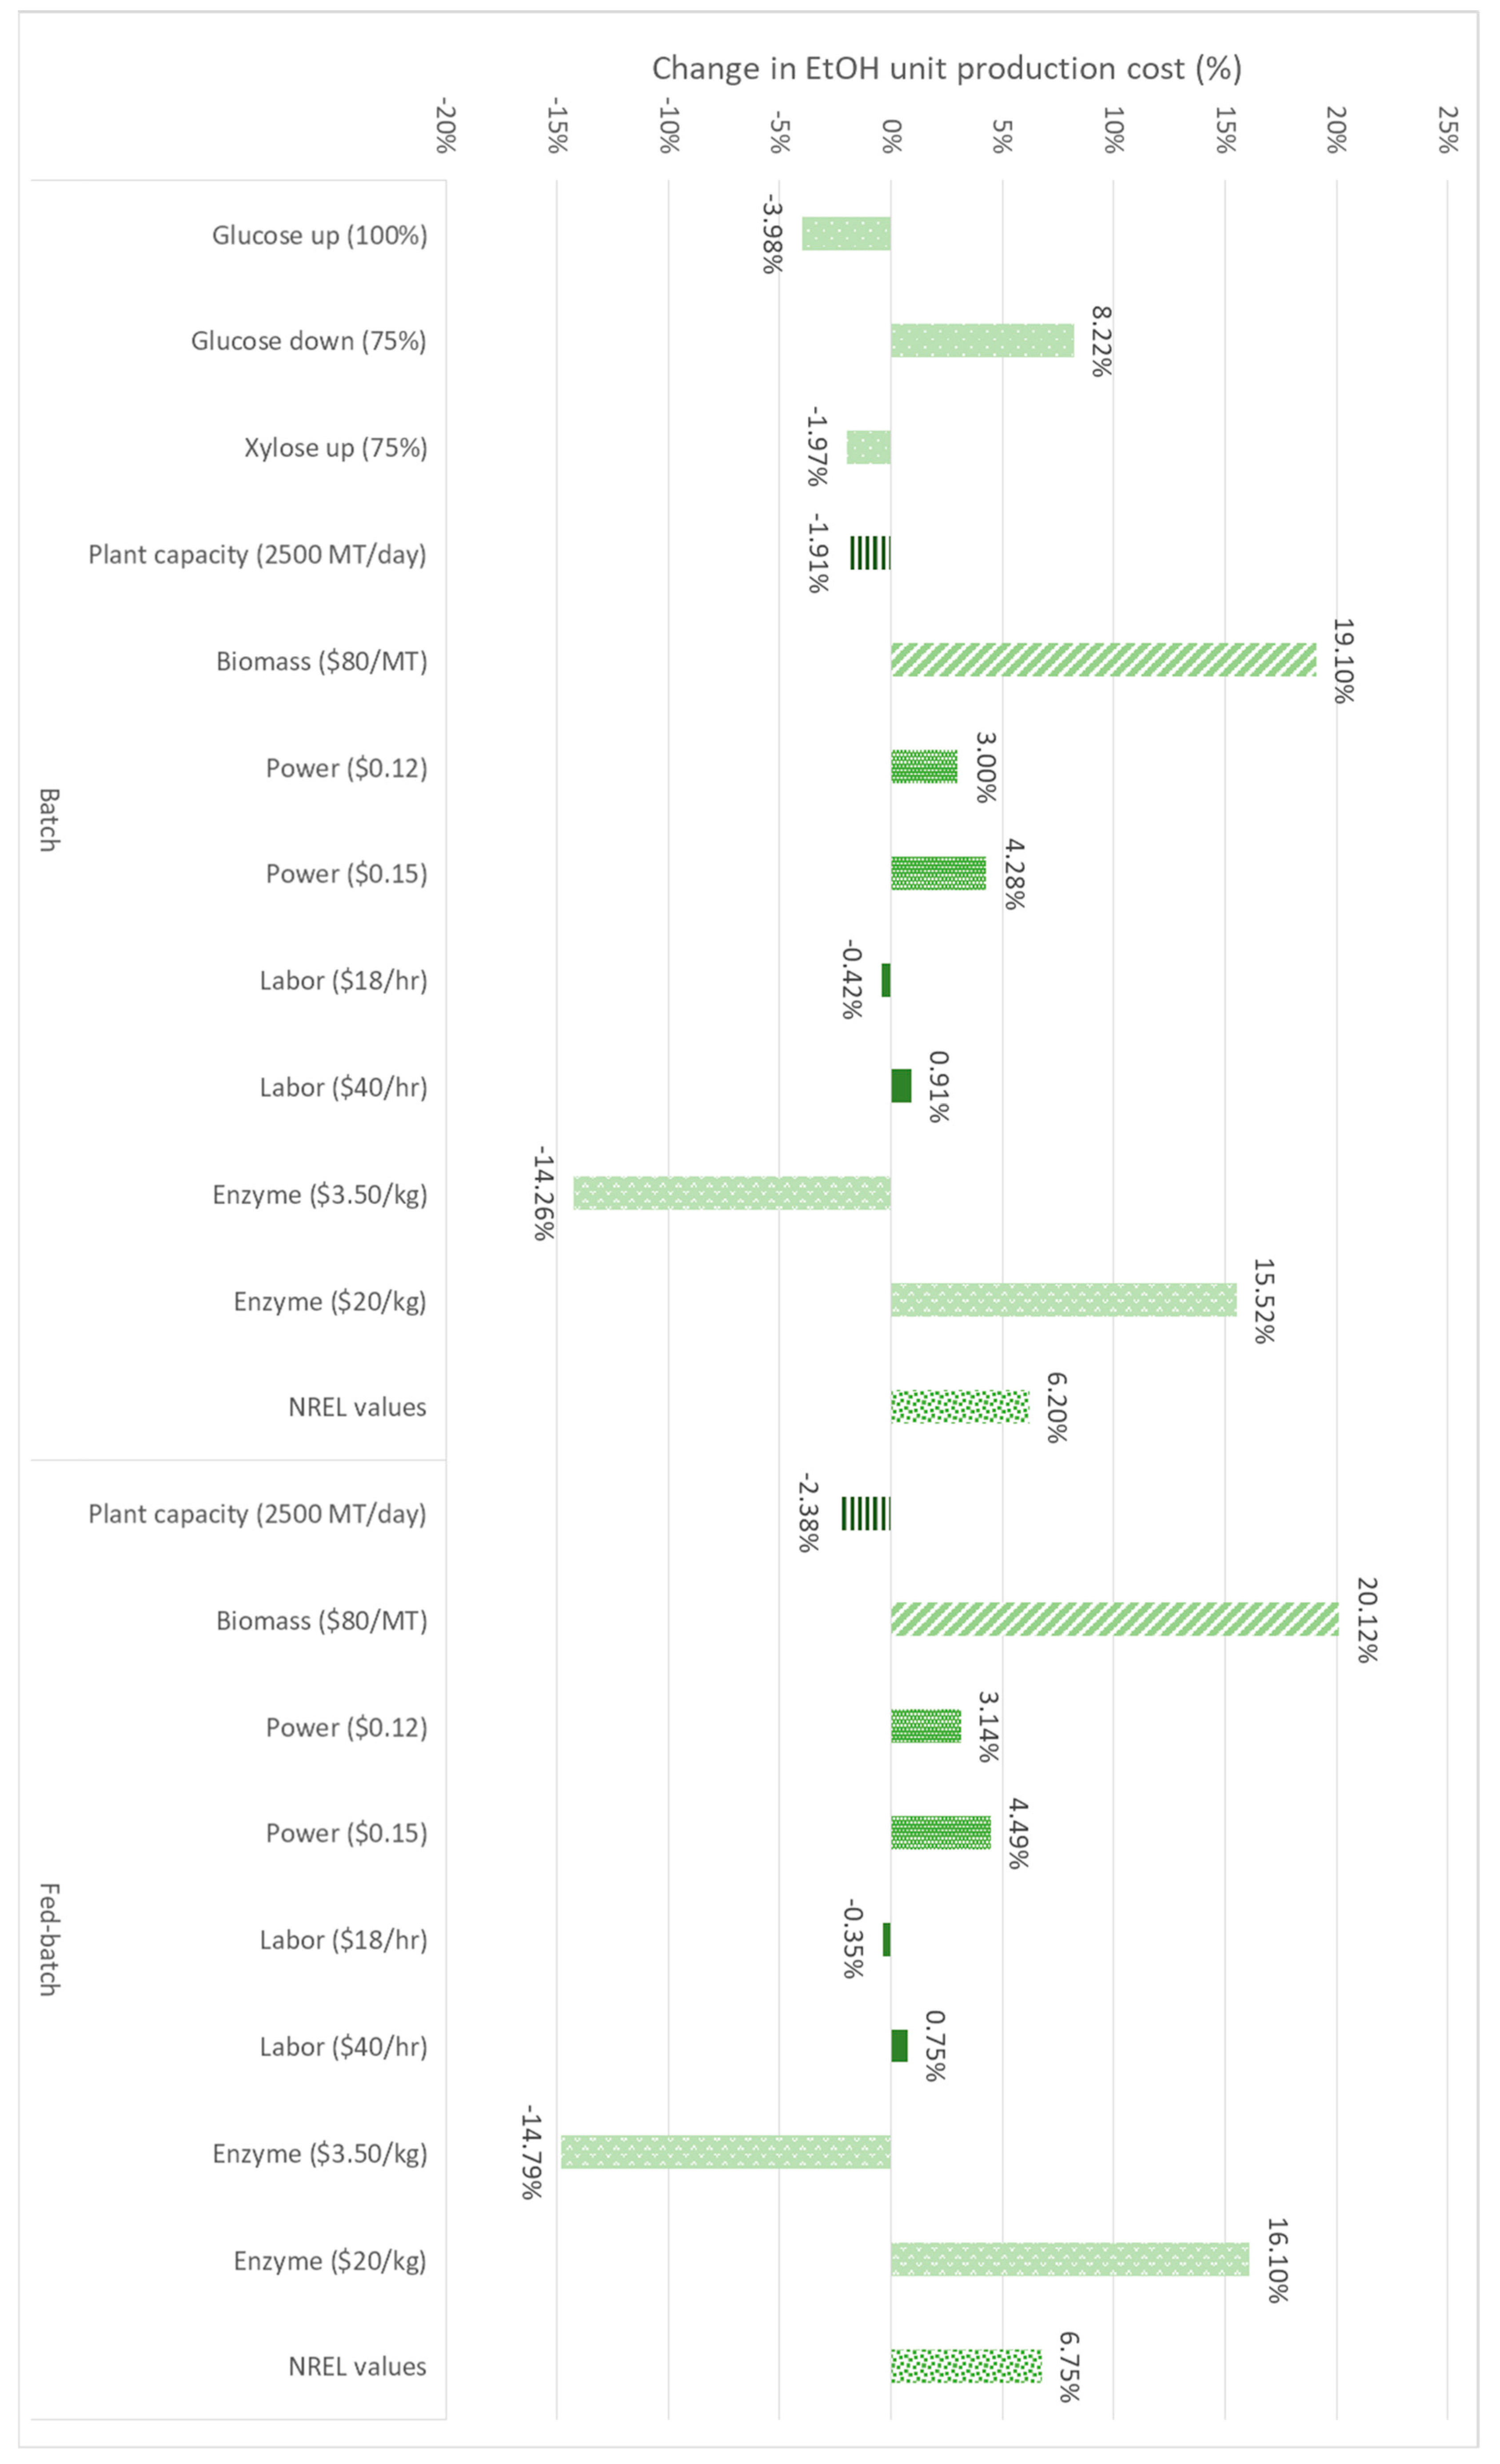
3.2. Sensitivity Analysis
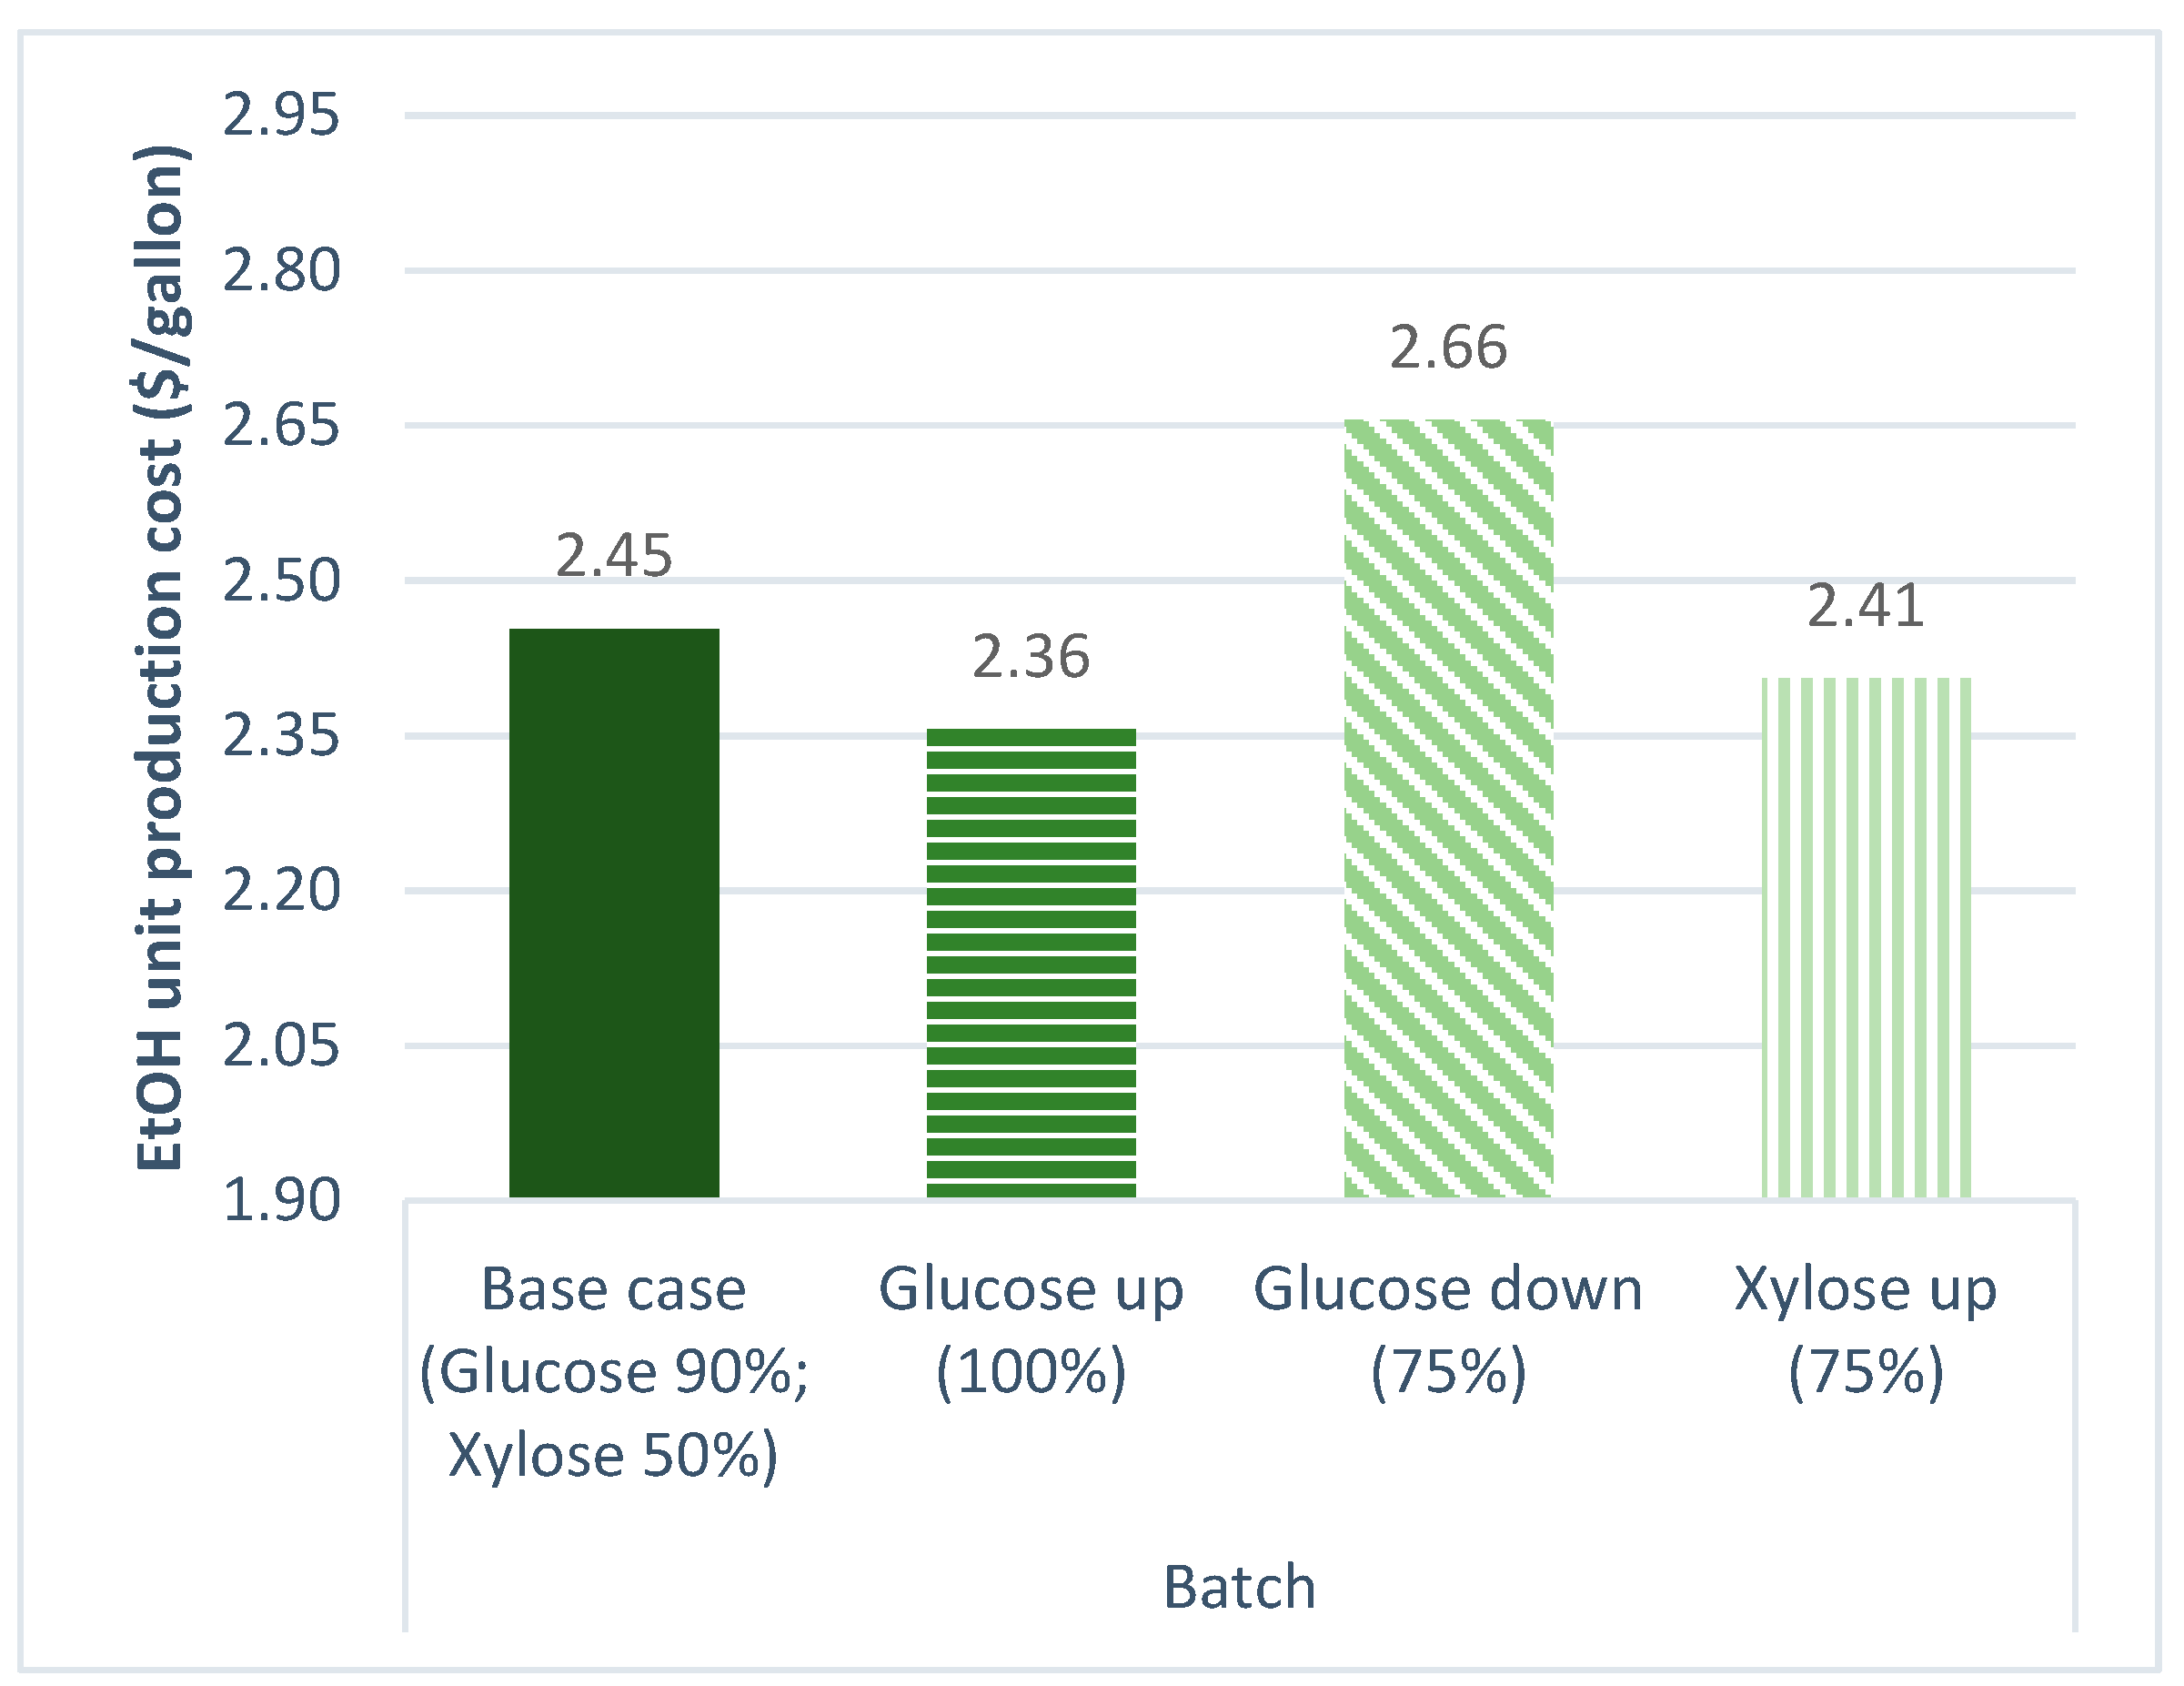
3.2.1. Sugar Conversion
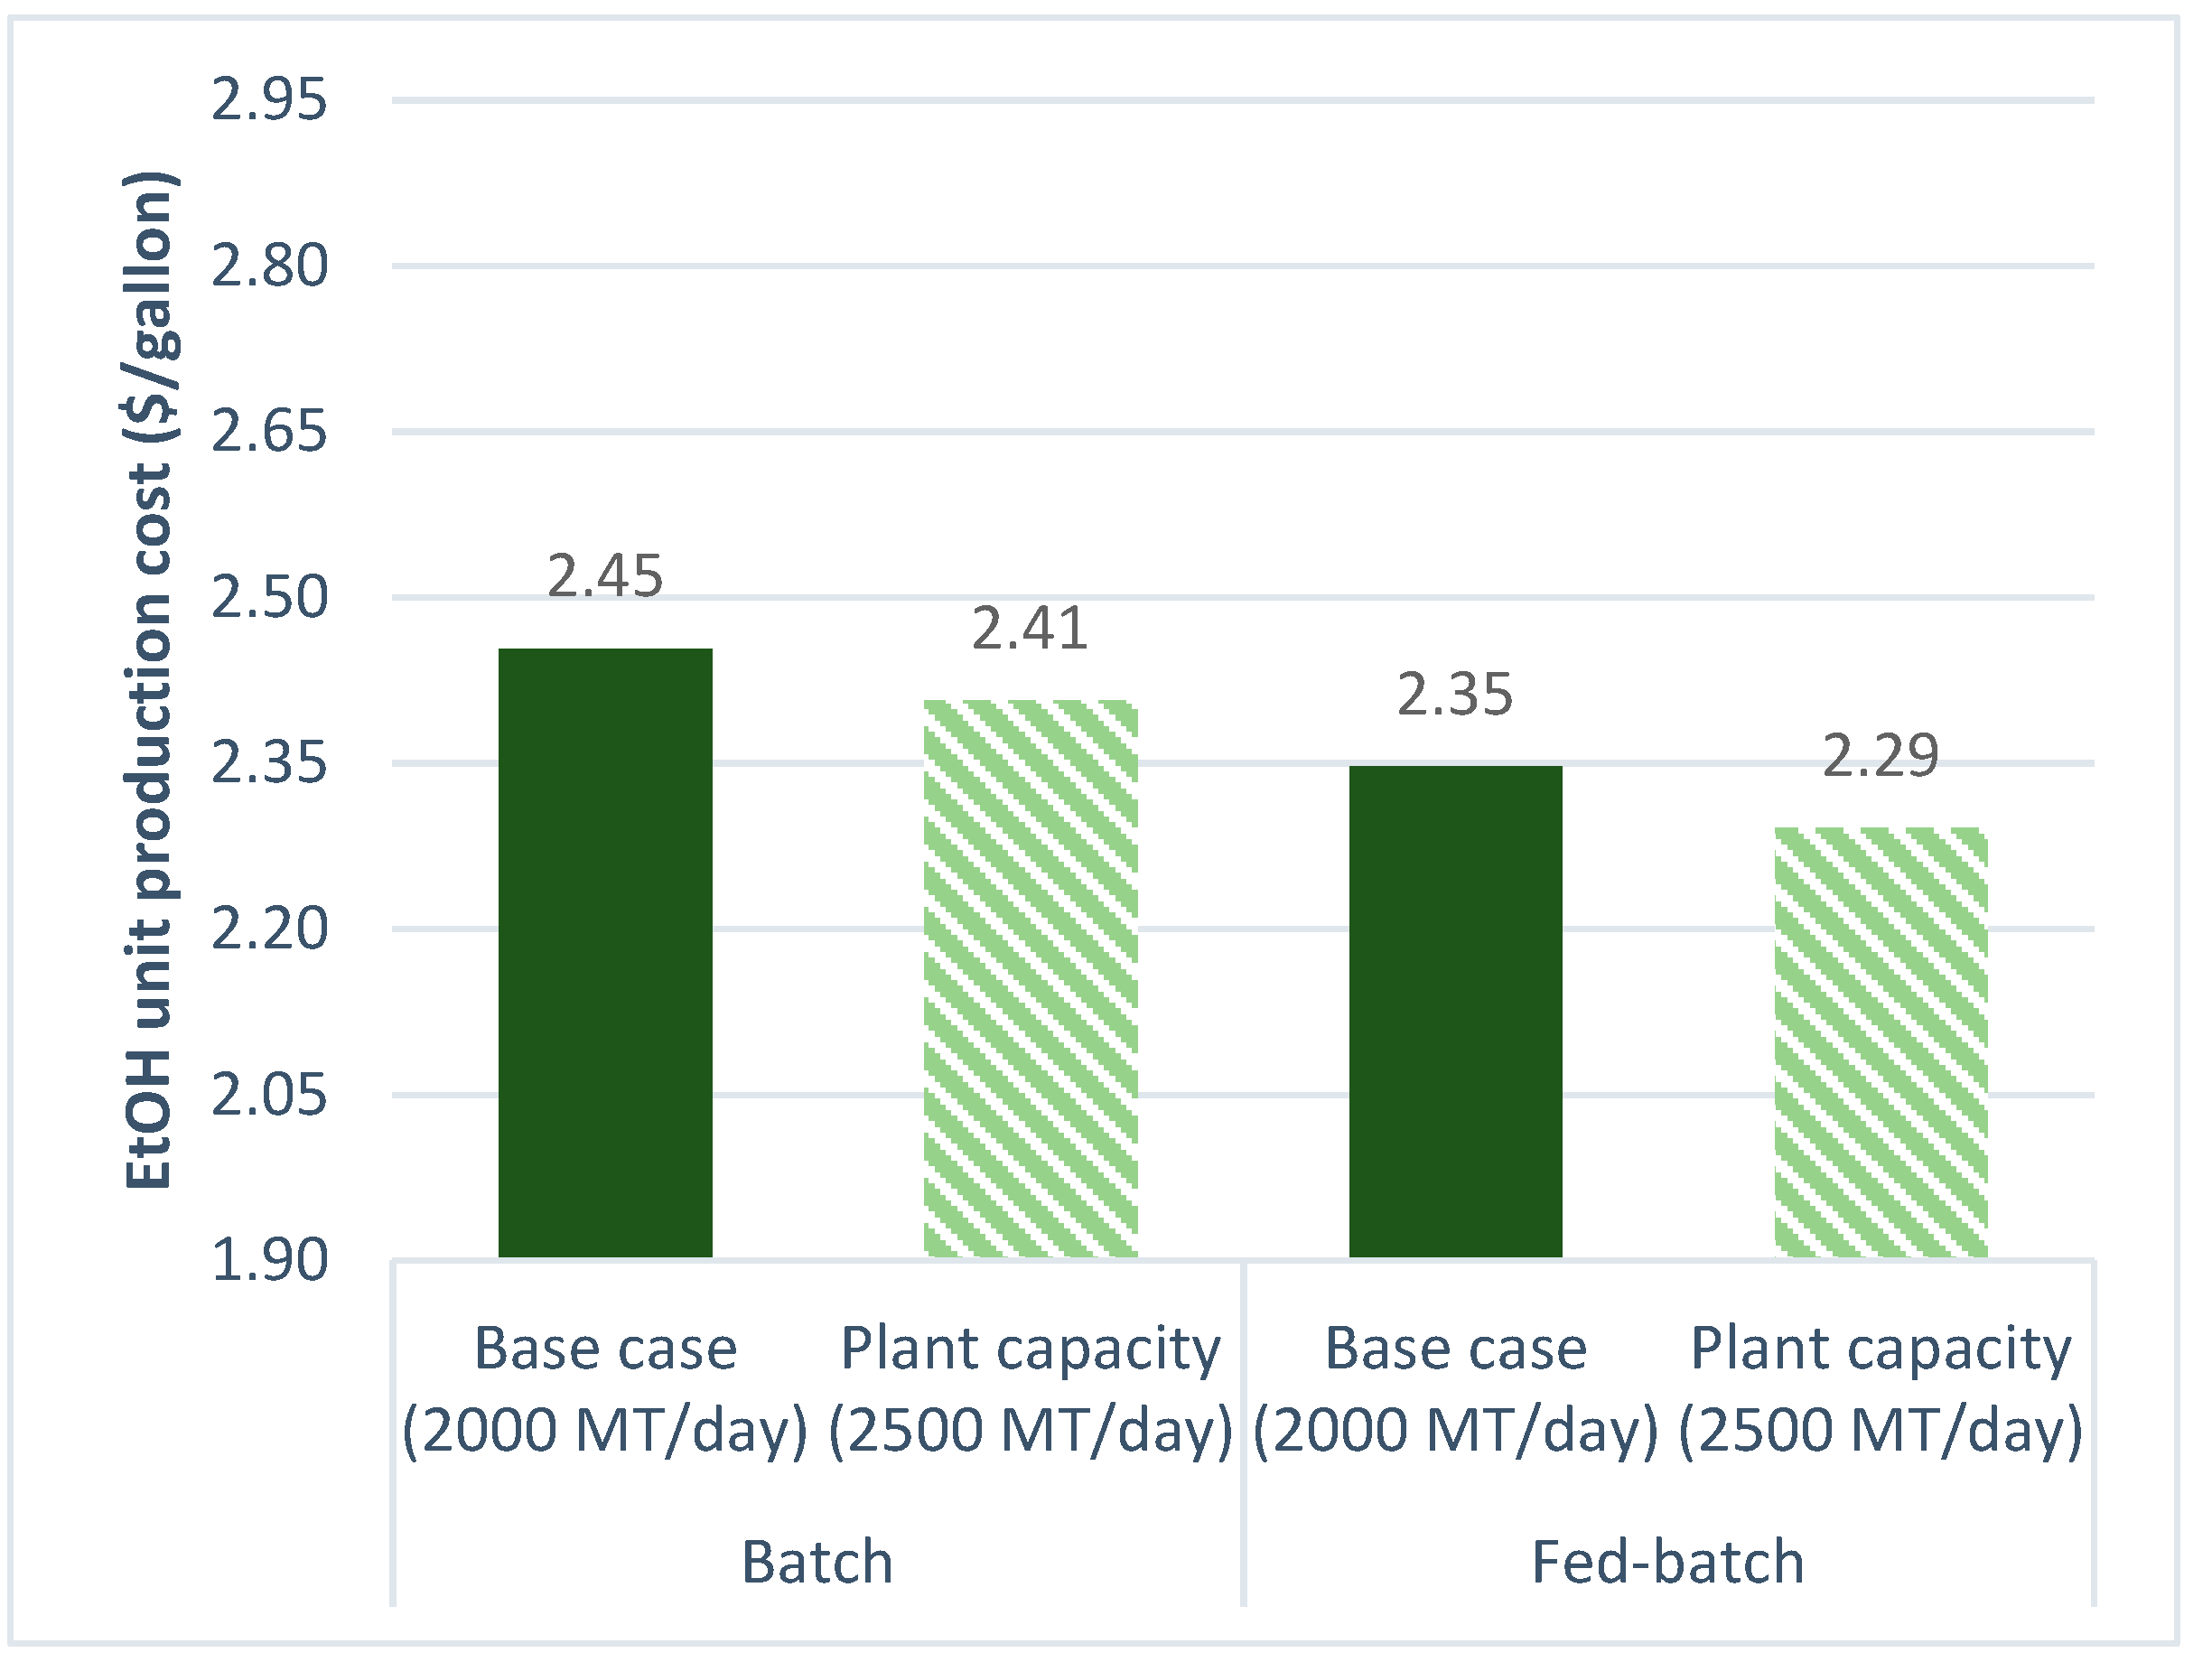
3.2.2. Plant Capacity
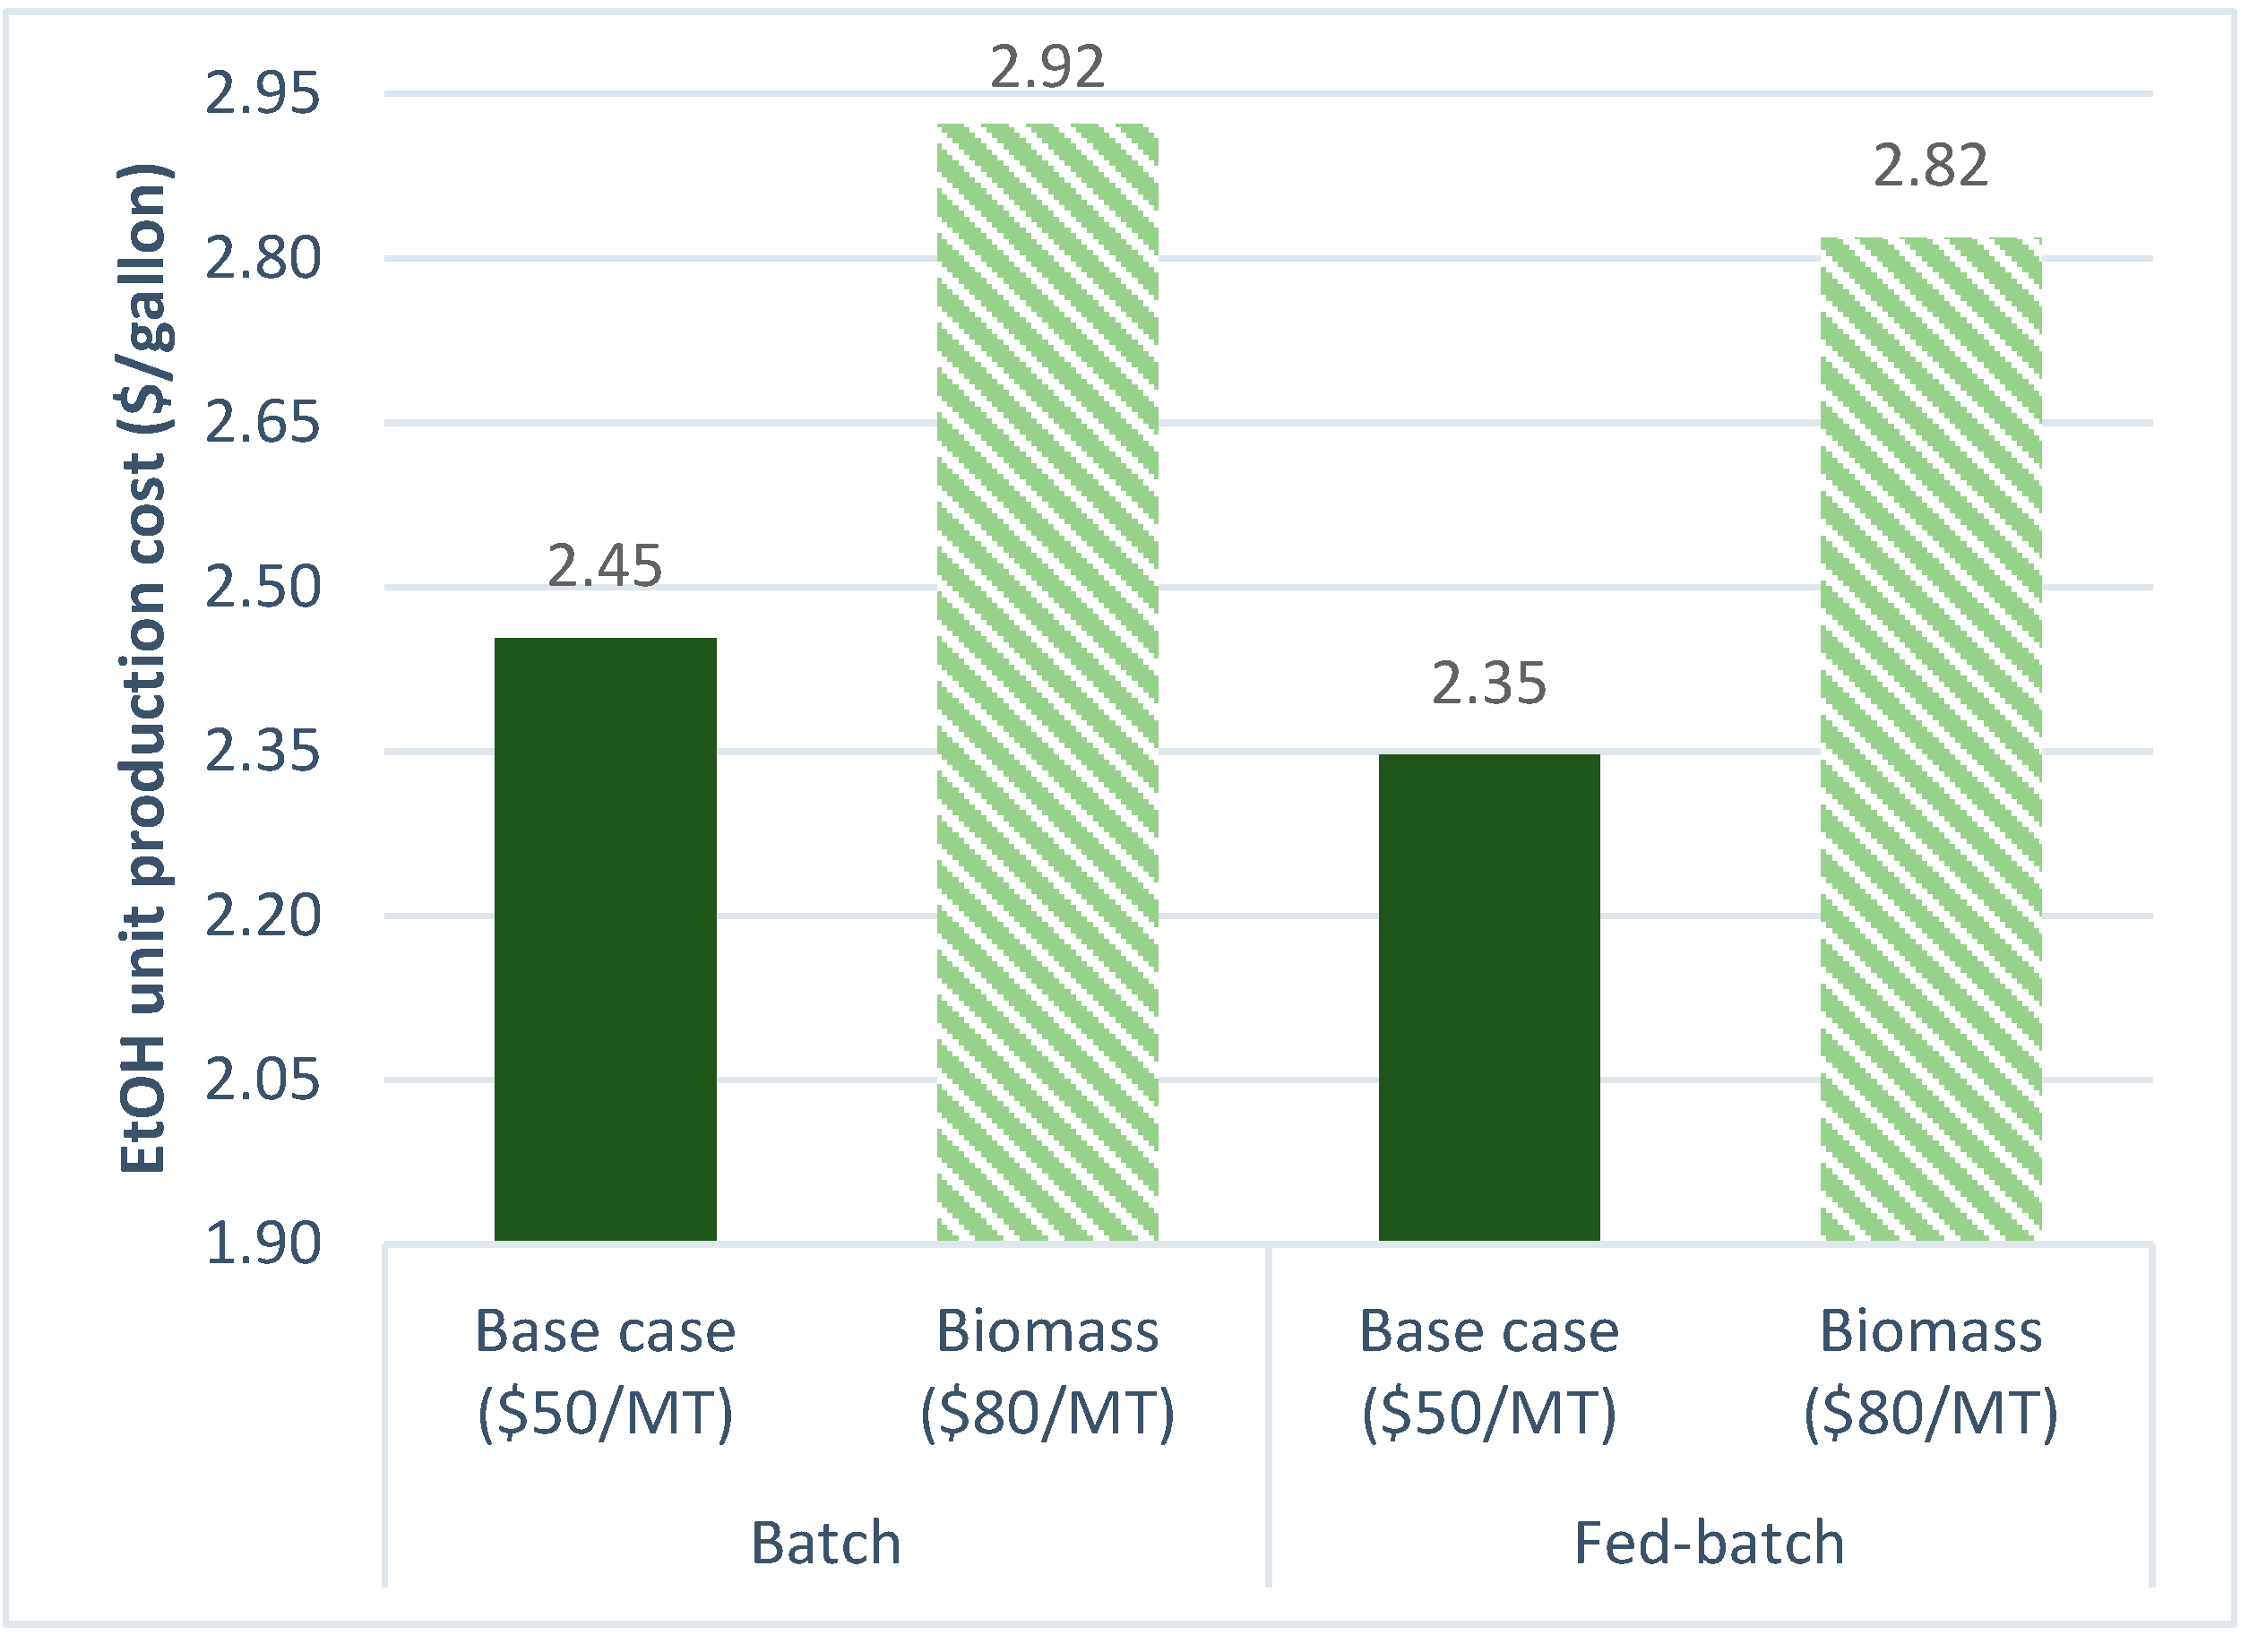
3.2.3. Biomass Cost
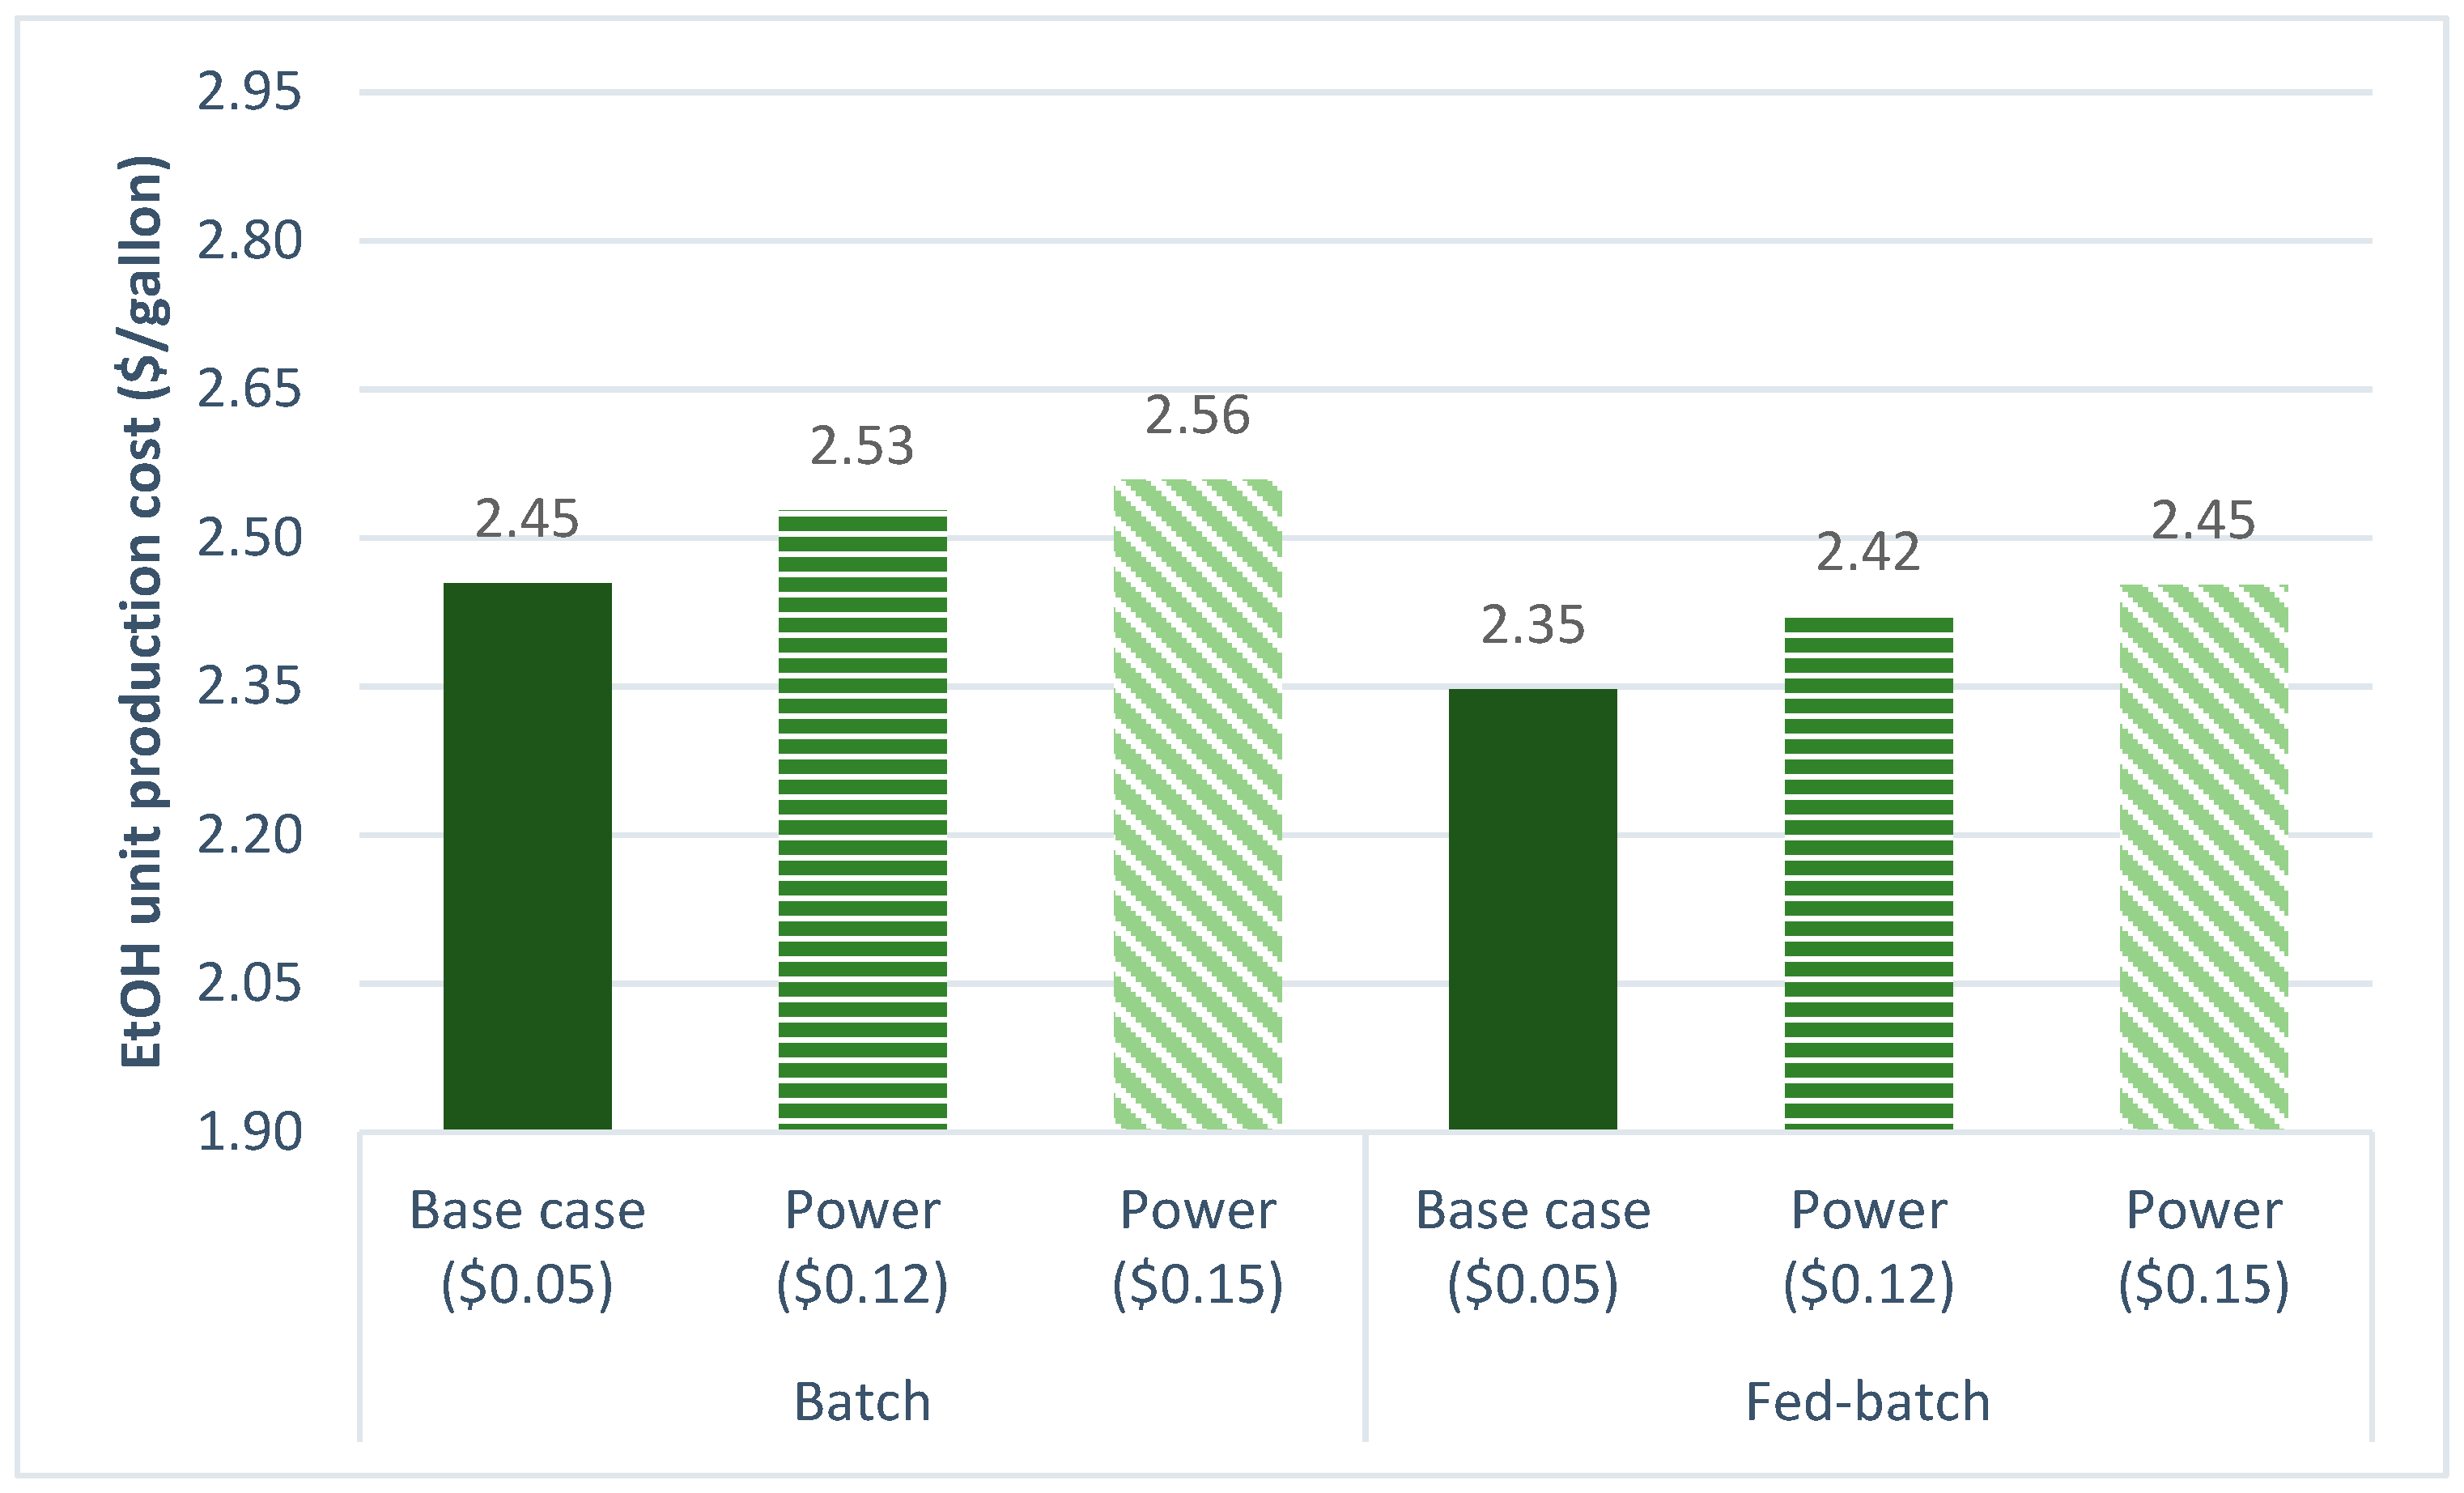
3.2.4. Power Cost
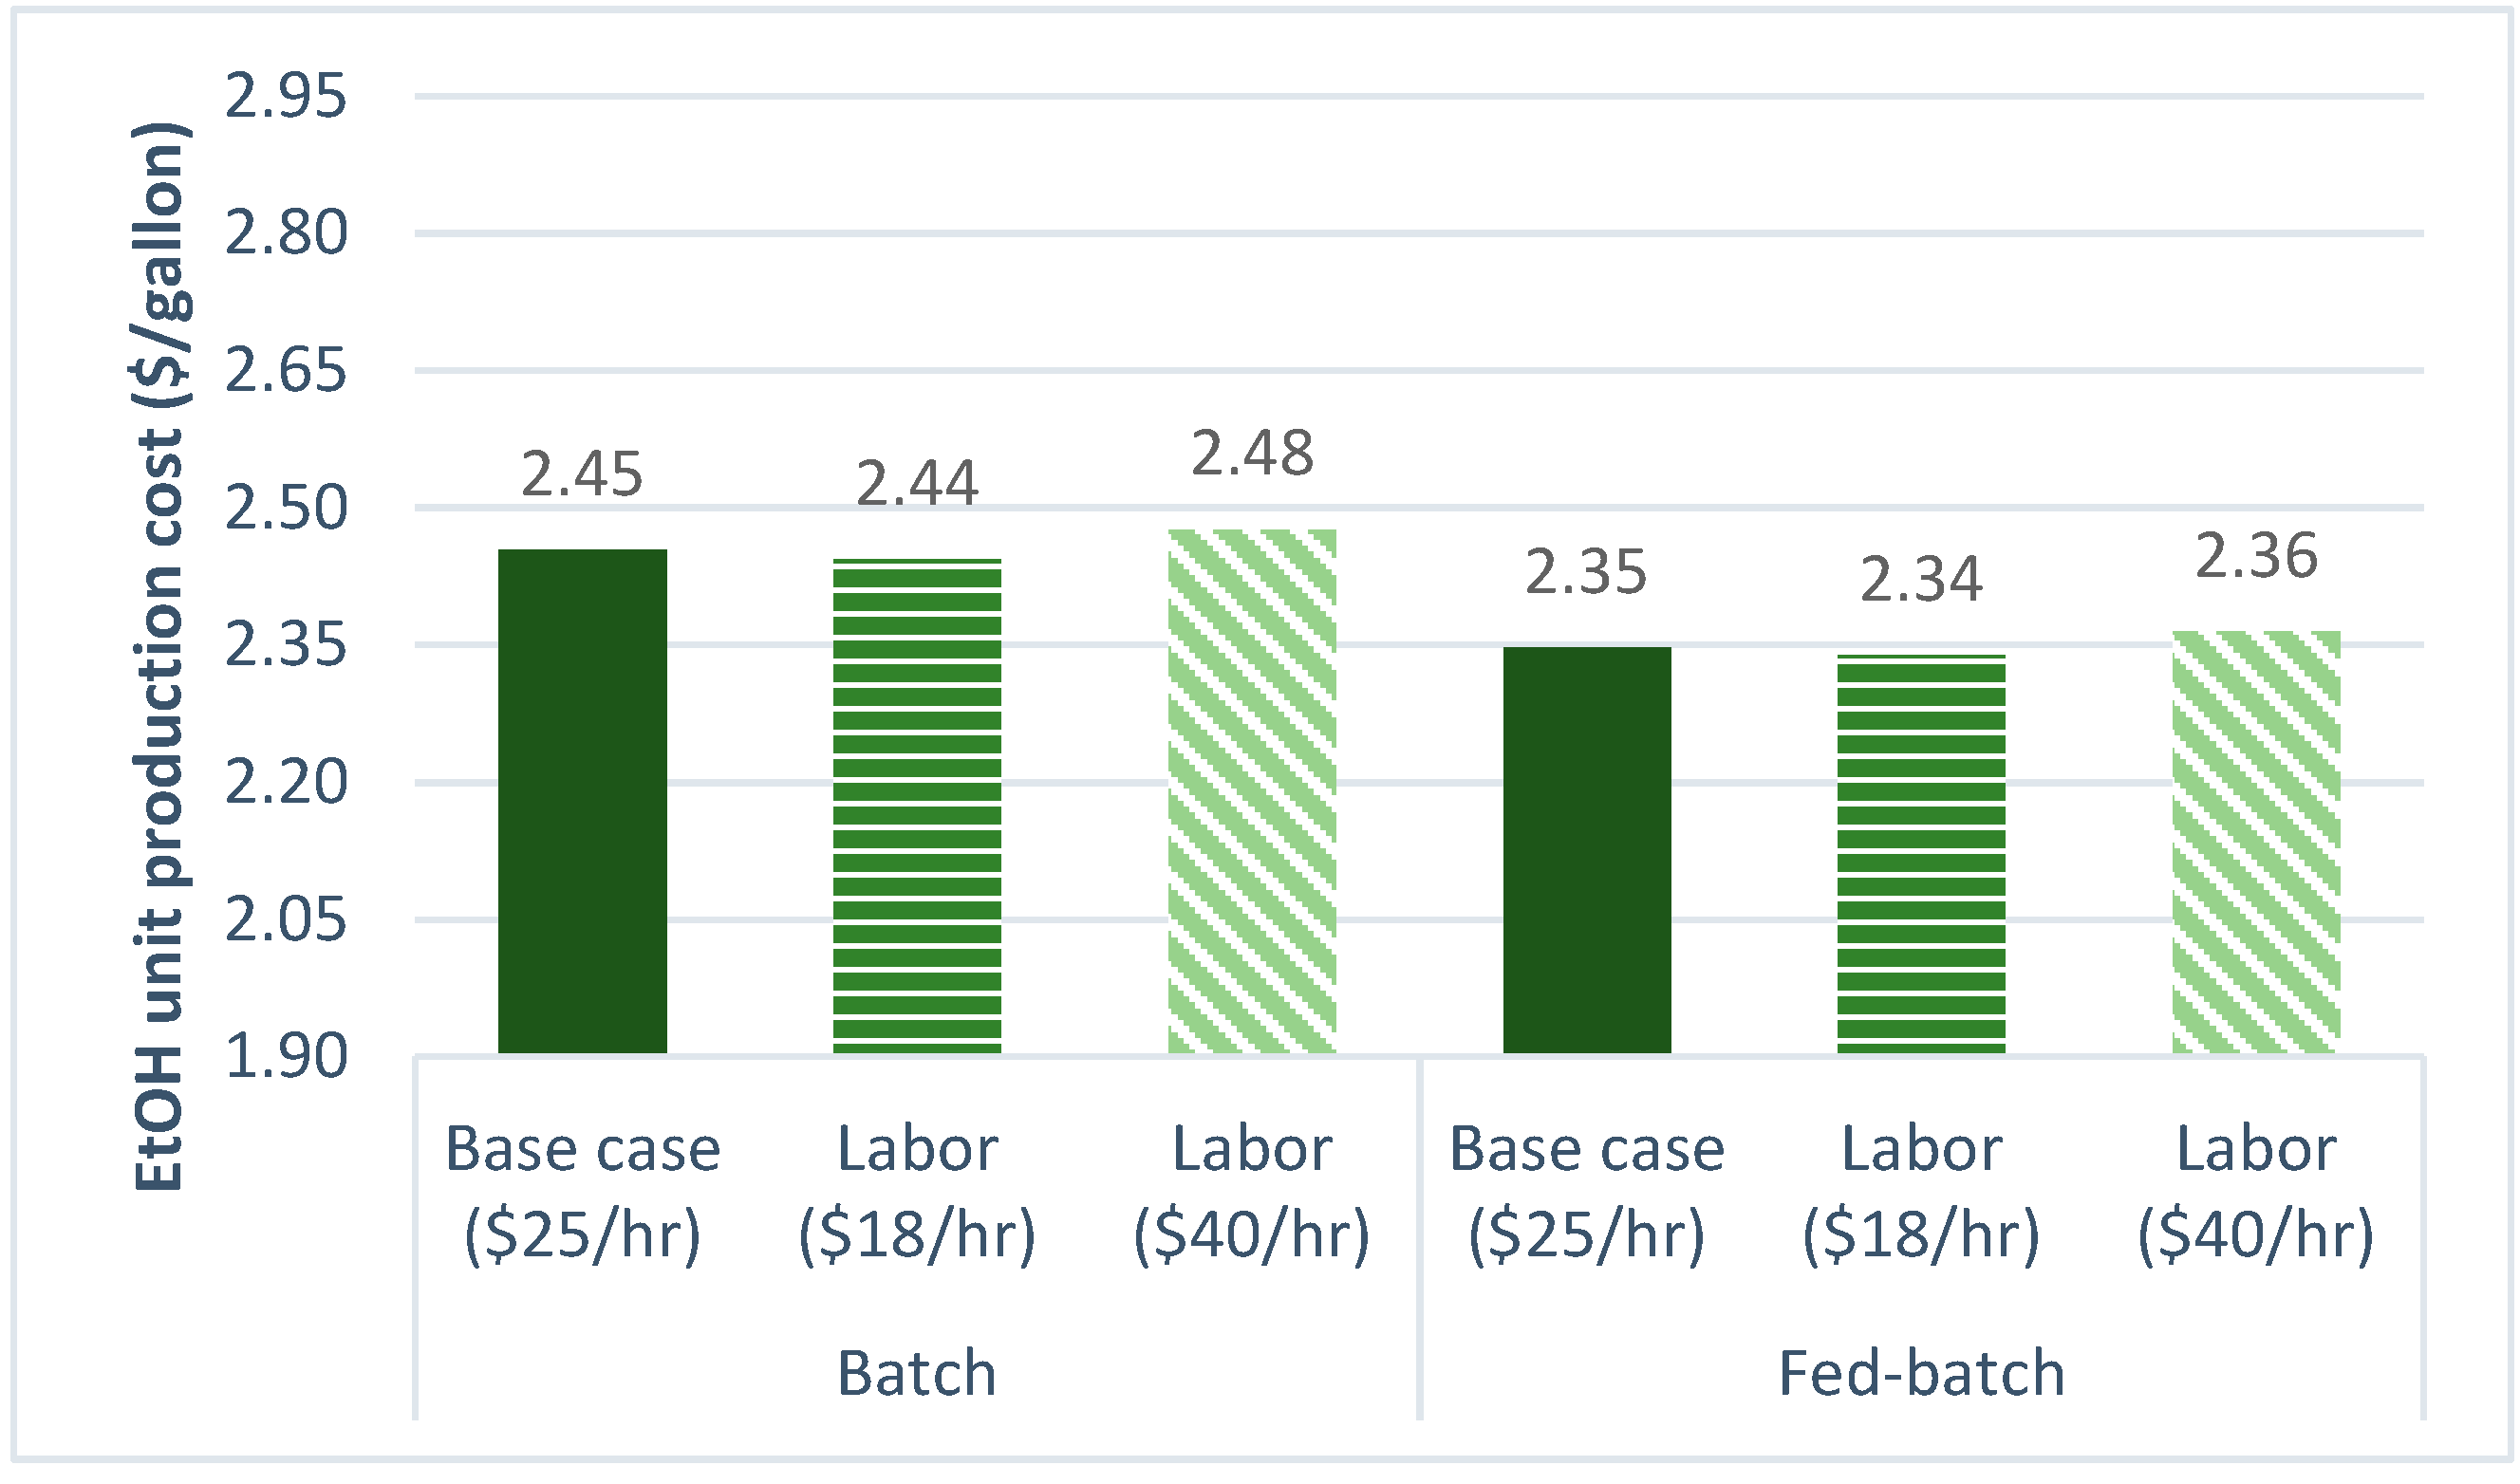
3.2.5. Labor Cost
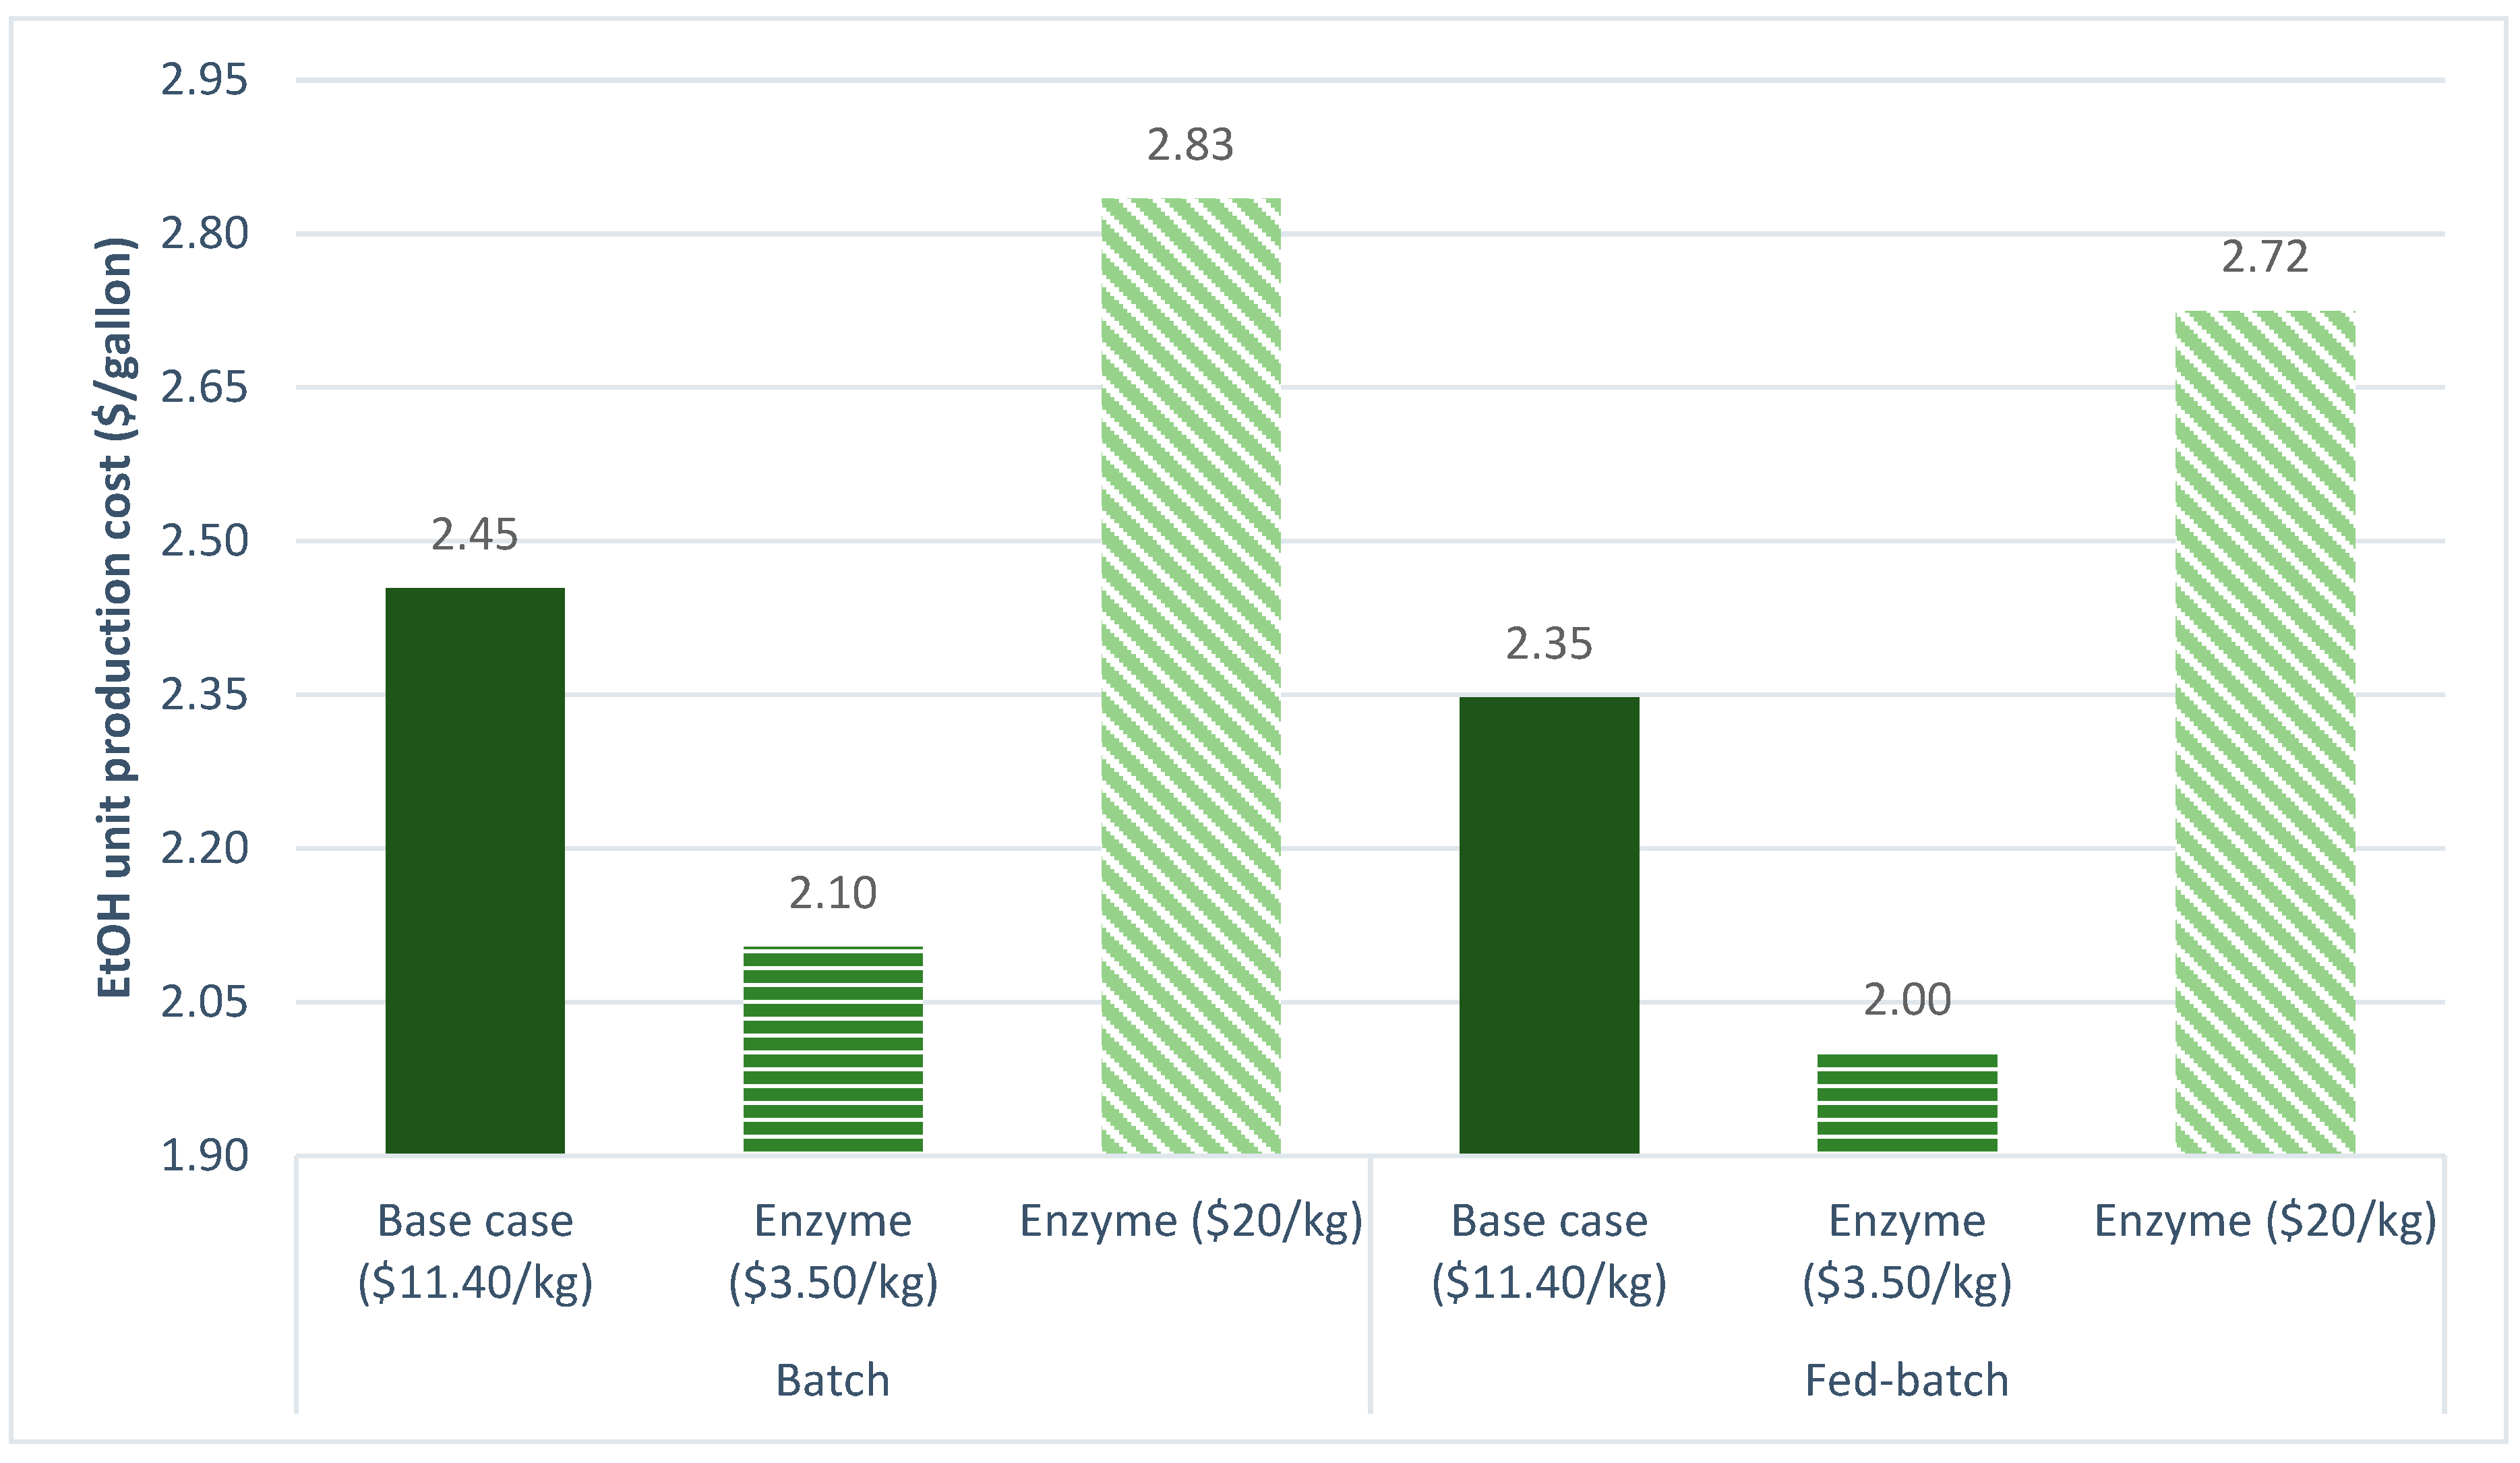
3.2.6. Enzyme Cost
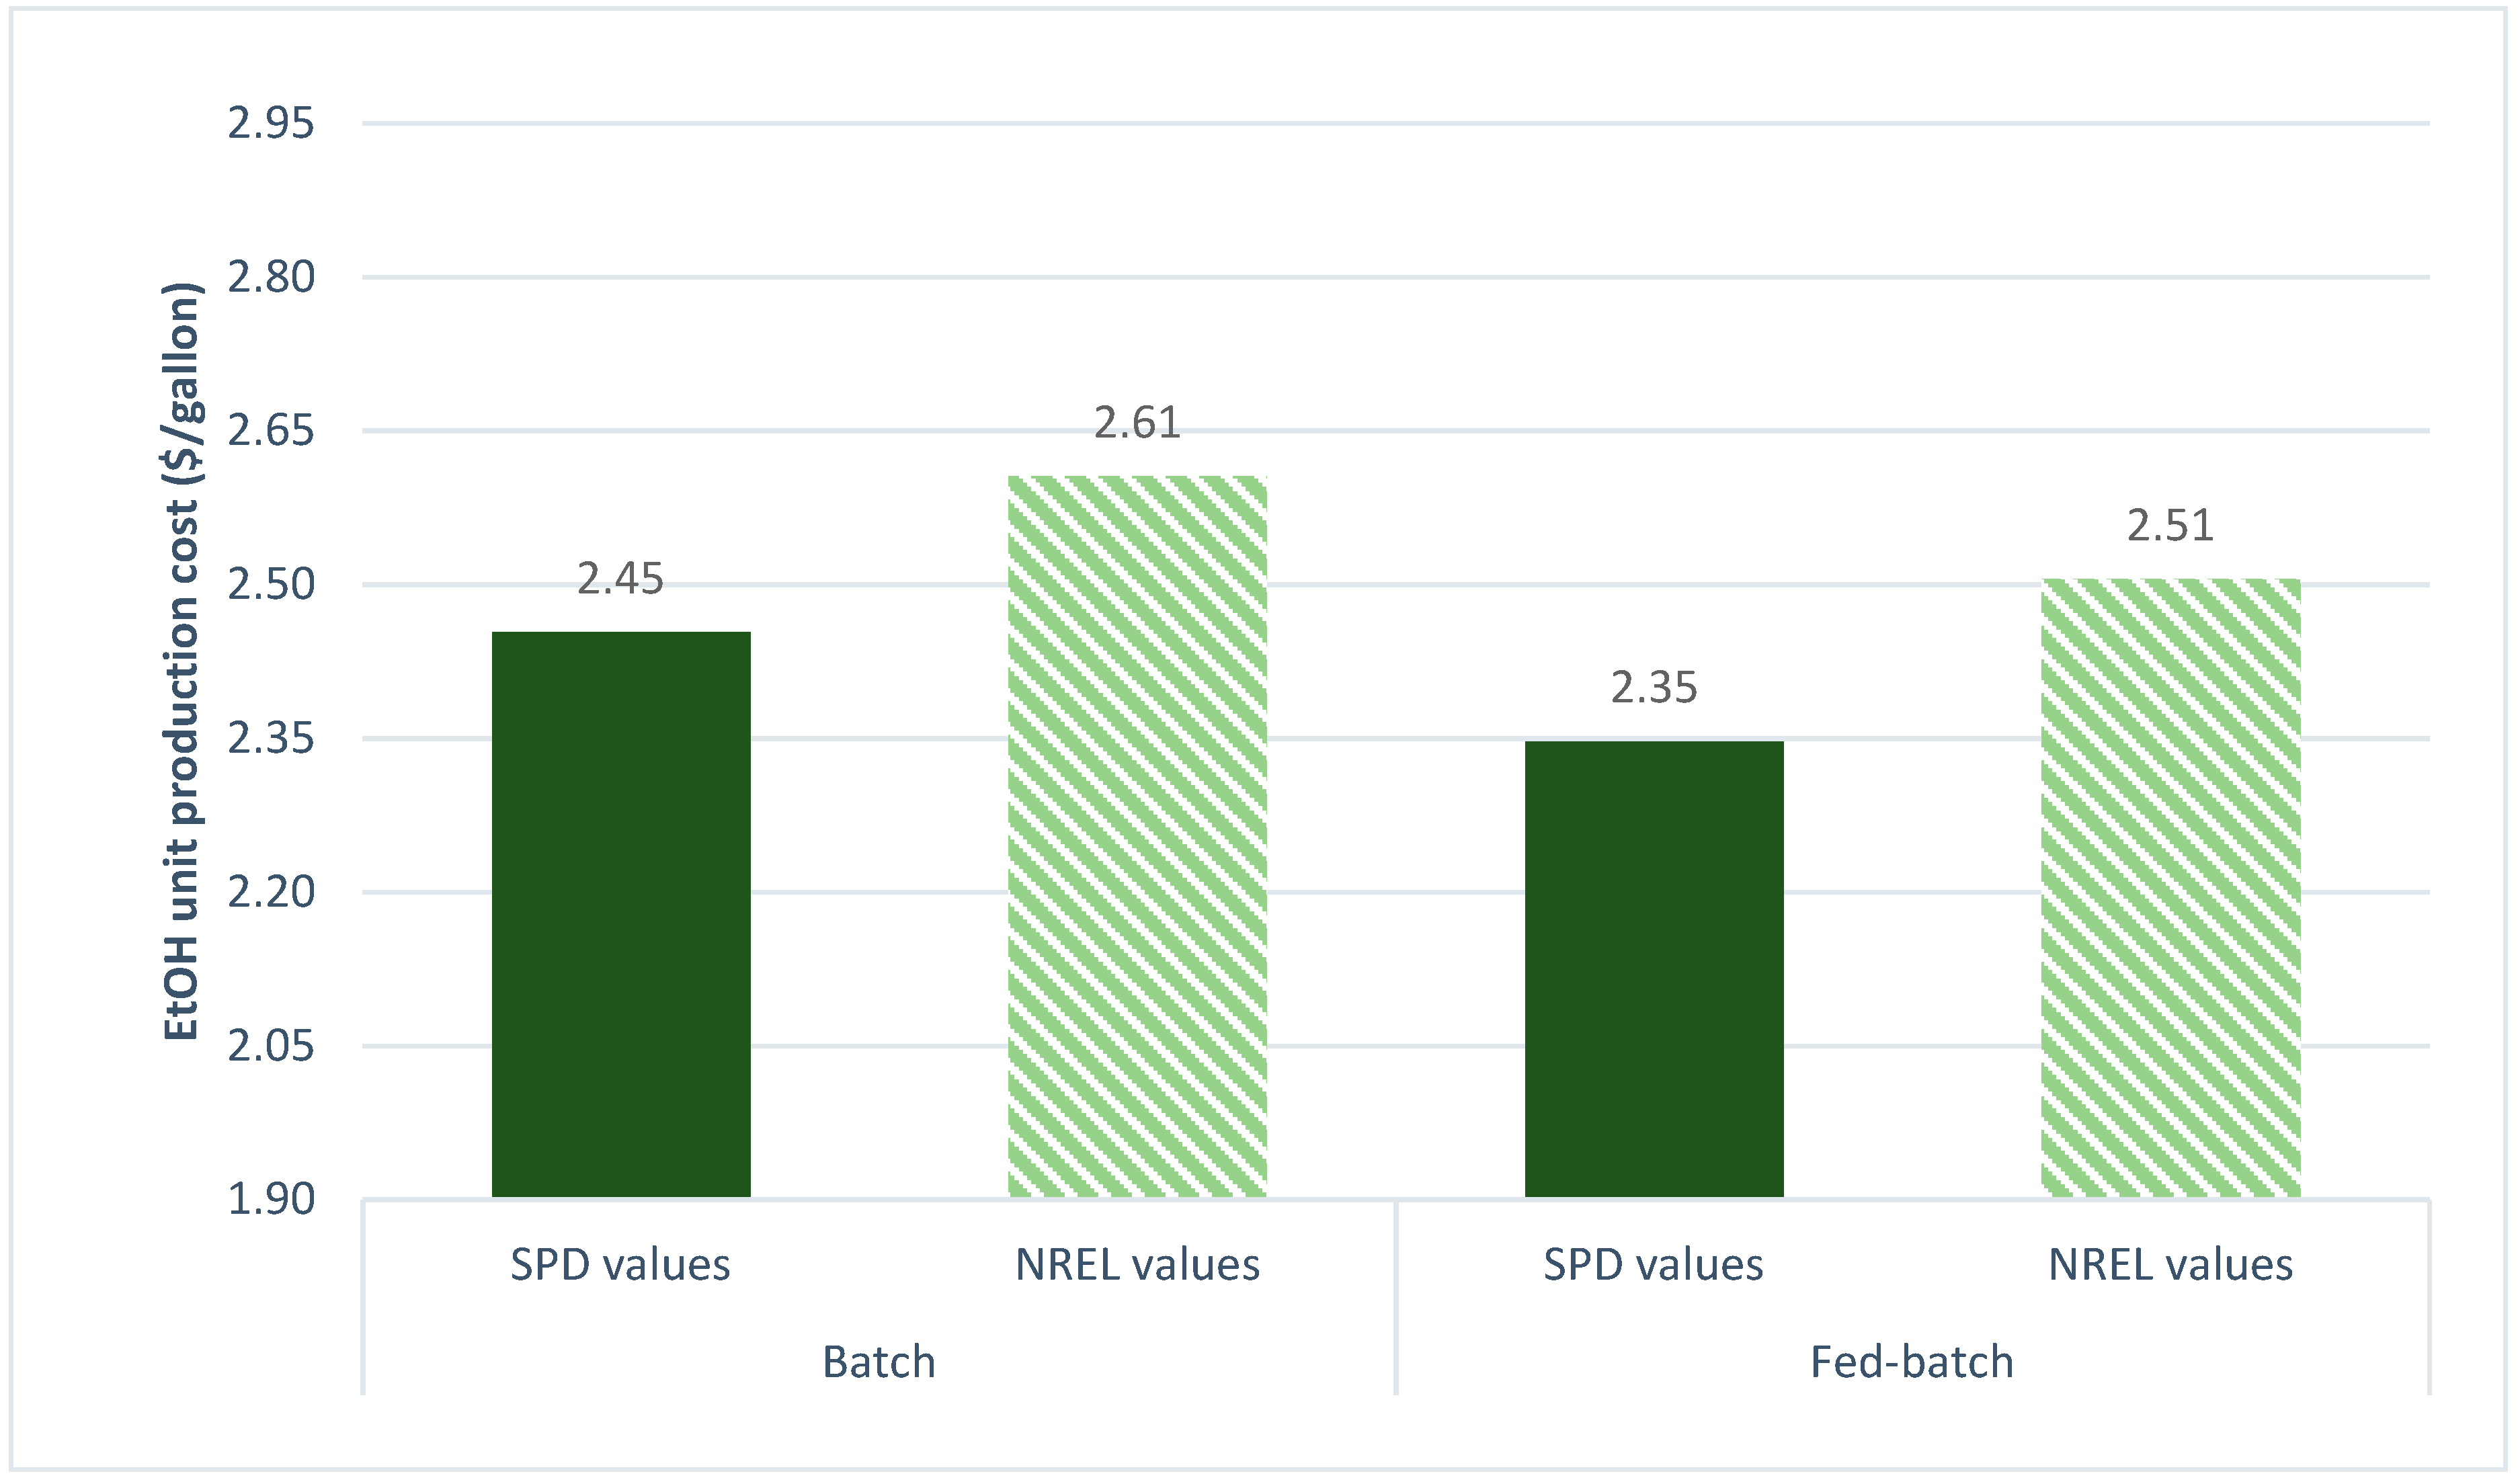
3.2.7. SPD Parameters vs. NREL Parameters
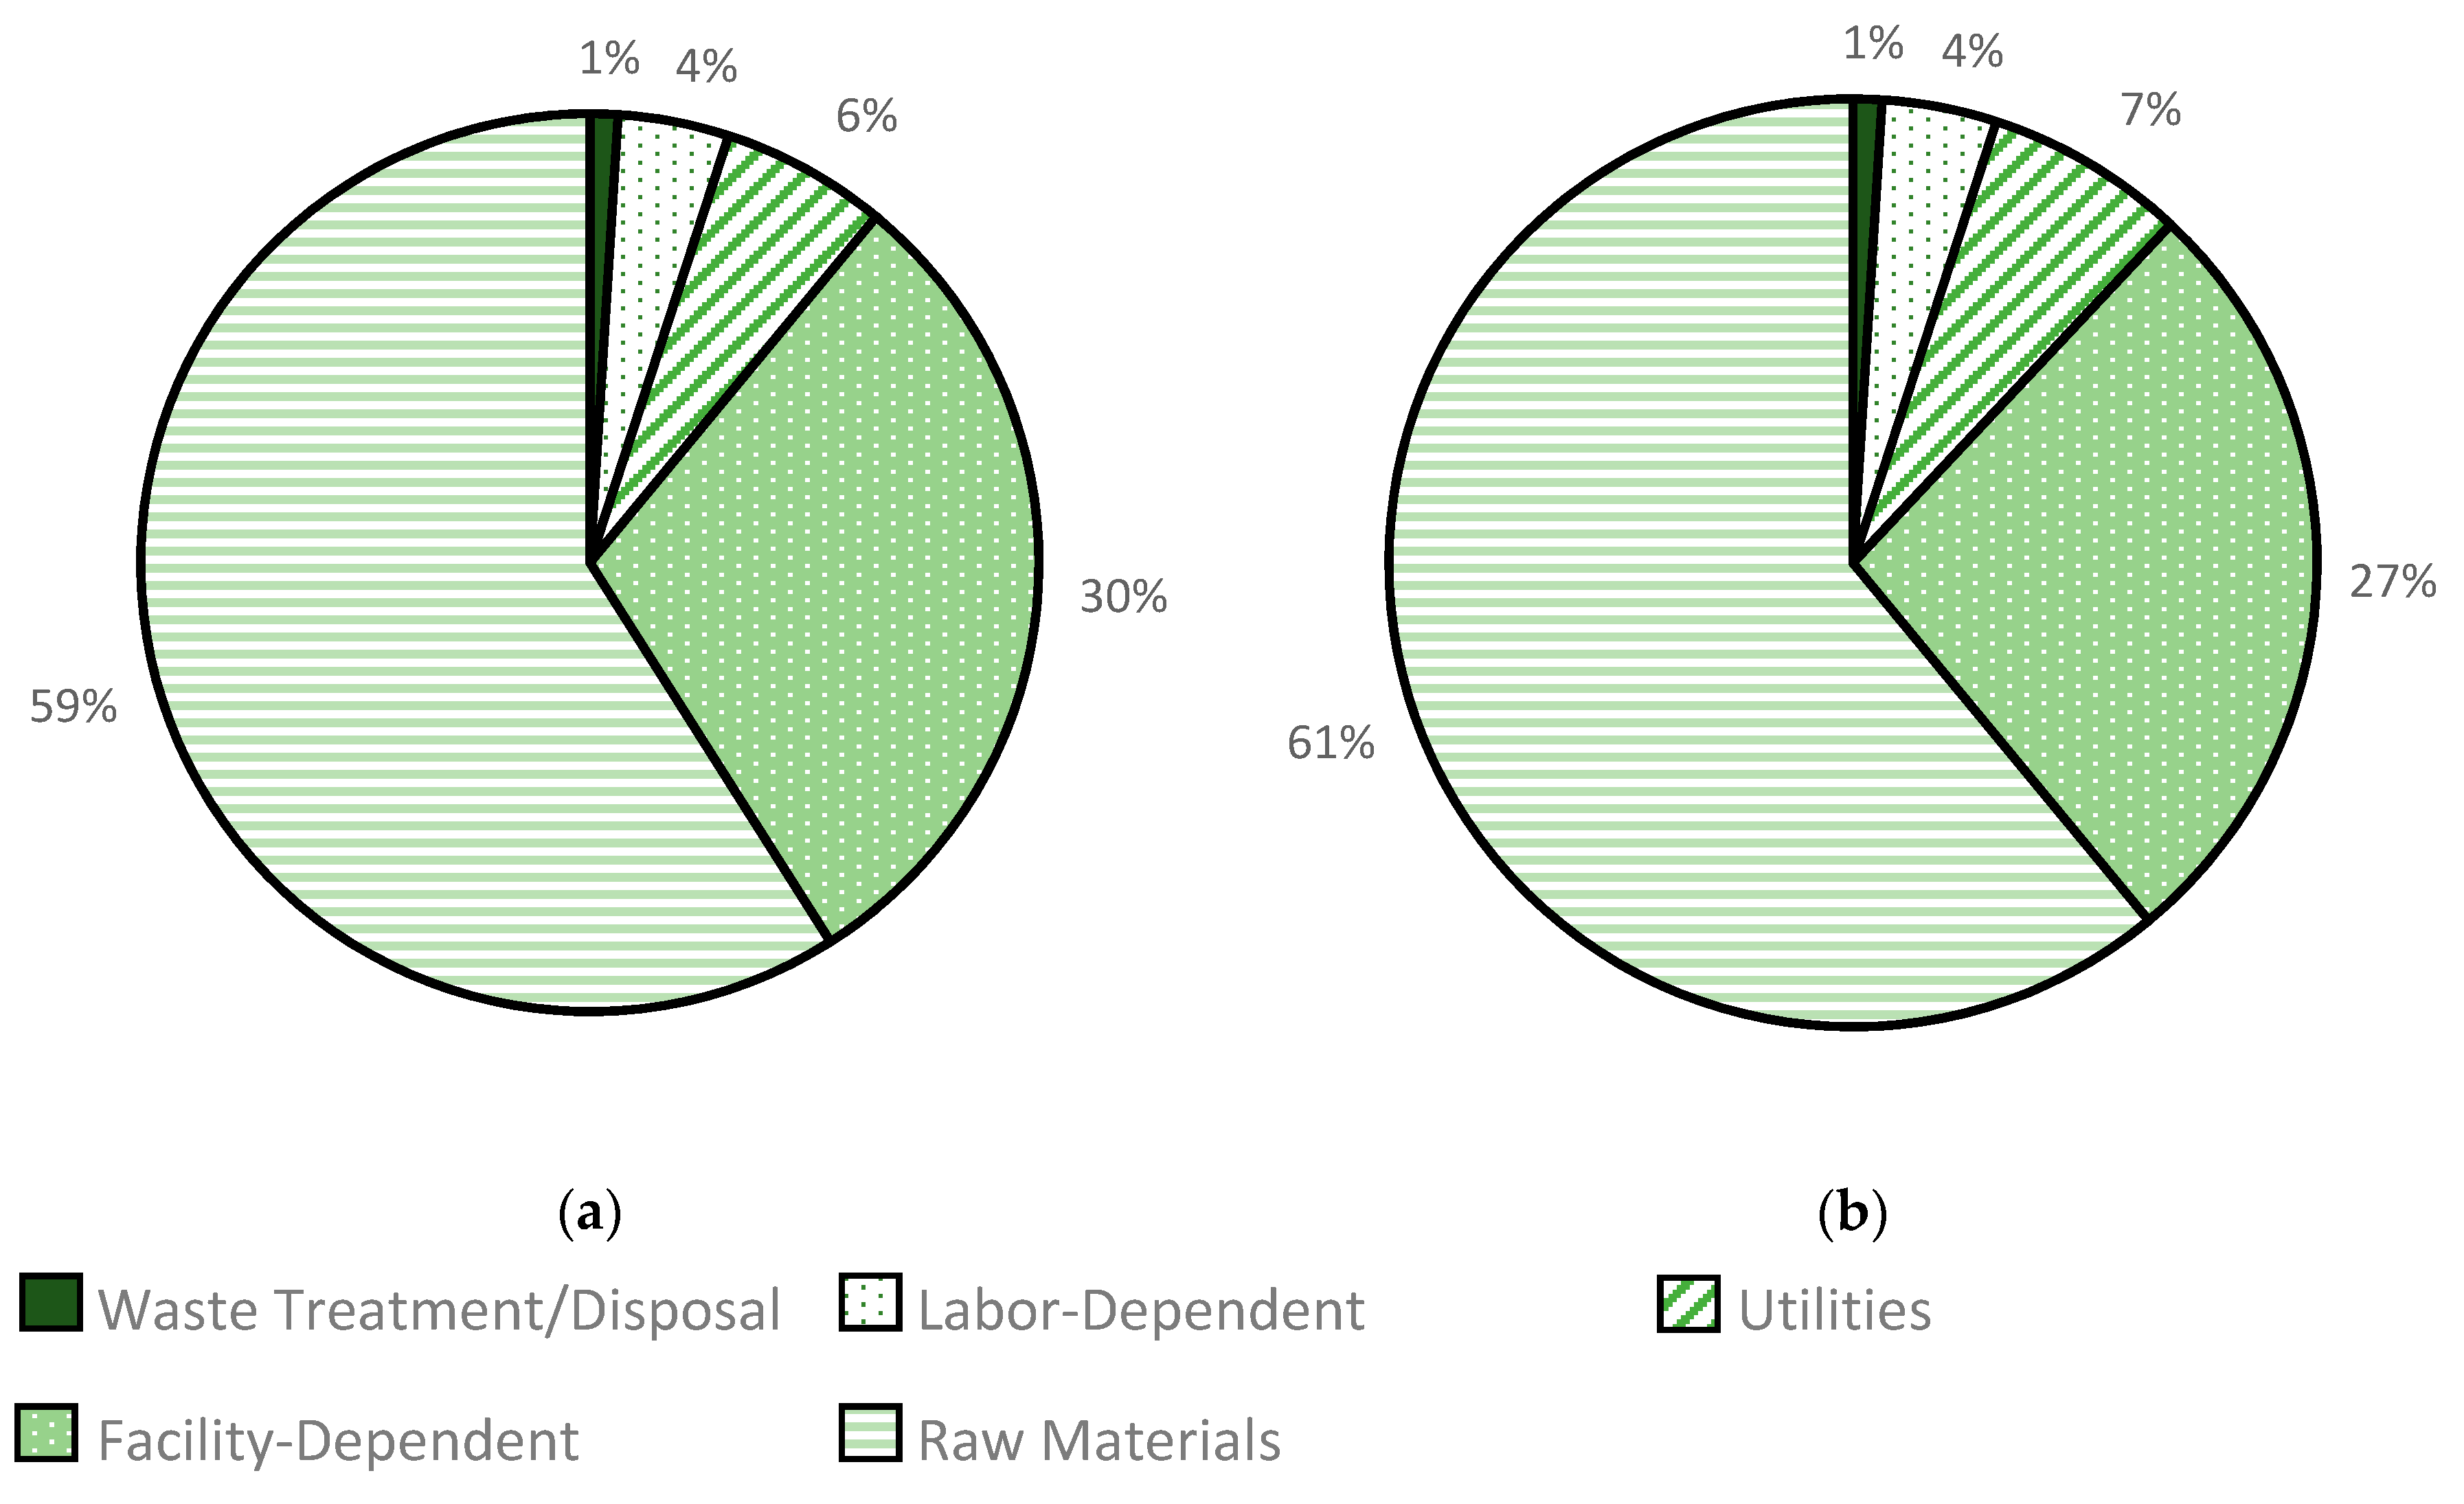
3.2.8. Sensitivity Analysis Results
4. Conclusions
Author Contributions
Funding
Acknowledgments
Conflicts of Interest
Appendix A
References
- Hill, S.; Hanson, S. Rising Corn Prices and Oversupply Push Ethanol Operating Margins to Multiyear Lows-Today in Energy-U.S. Energy Information Administration (EIA). Available online: https://www.eia.gov/todayinenergy/detail.php?id=40813 (accessed on 3 October 2019).
- Hanson, S.; Hill, S. EPA Finalizes Renewable Fuel Standard for 2019, Reflecting Cellulosic Biofuel Shortfalls-Today in Energy-U.S. Energy Information Administration (EIA). Available online: https://www.eia.gov/todayinenergy/detail.php?id=37712 (accessed on 3 October 2019).
- US EPA. Cellulosic Waiver Credits under the Renewable Fuel Standard Program. Available online: https://www.epa.gov/renewable-fuel-standard-program/cellulosic-waiver-credits-under-renewable-fuel-standard-program (accessed on 4 October 2019).
- Ballesteros, M.; Oliva, J.M.; Manzanares, P.; Negro, M.J.; Ballesteros, I. Ethanol Production from Paper Material Using a Simultaneous Saccharification and Fermentation System in a Fed-Batch Basis. World J. Microbiol. Biotechnol. 2002, 18, 559–561. [Google Scholar] [CrossRef]
- Hodge, D.B.; Karim, M.N.; Schell, D.J.; McMillan, J.D. Model-Based Fed-Batch for High-Solids Enzymatic Cellulose Hydrolysis. Appl. Biochem. Biotechnol. 2008, 152, 88. [Google Scholar] [CrossRef] [PubMed]
- Rudolf, A.; Alkasrawi, M.; Zacchi, G.; Lidén, G. A Comparison between Batch and Fed-Batch Simultaneous Saccharification and Fermentation of Steam Pretreated Spruce. Enzyme Microb. Technol. 2005, 37, 195–204. [Google Scholar] [CrossRef]
- Tai, C.; Arellano, M.G.; Keshwani, D.R. Epidemic Based Modeling of Enzymatic Hydrolysis of Lignocellulosic Biomass. Biotechnol. Prog. 2014, 30, 1021–1028. [Google Scholar] [CrossRef] [PubMed]
- Bansal, P.; Hall, M.; Realff, M.J.; Lee, J.H.; Bommarius, A.S. Modeling Cellulase Kinetics on Lignocellulosic Substrates. Biotechnol. Adv. 2009, 27, 833–848. [Google Scholar] [CrossRef] [PubMed]
- Gan, Q.; Allen, S.J.; Taylor, G. Kinetic Dynamics in Heterogeneous Enzymatic Hydrolysis of Cellulose: An Overview, an Experimental Study and Mathematical Modelling. Process Biochem. 2003, 38, 1003–1018. [Google Scholar] [CrossRef]
- Laureano-Perez, L.; Teymouri, F.; Alizadeh, H.; Dale, B.E. Understanding Factors That Limit Enzymatic Hydrolysis of Biomass. Appl. Biochem. Biotechnol. 2005, 124, 1081–1099. [Google Scholar] [CrossRef]
- Zhang, Y.-H.P.; Lynd, L.R. Toward an Aggregated Understanding of Enzymatic Hydrolysis of Cellulose: Noncomplexed Cellulase Systems. Biotechnol. Bioeng. 2004, 88, 797–824. [Google Scholar] [CrossRef] [PubMed]
- Kazi, F.K.; Fortman, J.A.; Anex, R.P.; Hsu, D.D.; Aden, A.; Dutta, A.; Kothandaraman, G. Techno-Economic Comparison of Process Technologies for Biochemical Ethanol Production from Corn Stover. Fuel 2010, 89, 20–28. [Google Scholar] [CrossRef]
- Intelligen, Inc. SuperPro Designer; Intelligen Suite; Intelligen, Inc.: Scotch Plains, NJ, USA, 2016. [Google Scholar]
- Intelligen, Inc. SuperPro Designer User Guide; Intelligen Suite, Inc.: Scotch Plains, NJ, USA, 1991. [Google Scholar]
- Aden, A.; Ruth, M.; Ibsen, K.; Jechura, J.; Neeves, K.; Sheehan, J.; Wallace, B.; Montague, L.; Slayton, A.; Lukas, J. Process Design Report for Stover Feedstock: Lignocellulosic Biomass to Ethanol Process Design and Economics Utilizing Co-Current Dilute Acid Prehydrolysis and Enzymatic Hydrolysis for Corn Stover; NREL/TP-510-32438; National Renewable Energy Lab. (NREL): Golden, CO, USA, 2002. [Google Scholar] [CrossRef]
- Davis, R.; Tao, L.; Scarlata, C.; Tan, E.C.D.; Ross, J.; Lukas, J.; Sexton, D. Process Design and Economics for the Conversion of Lignocellulosic Biomass to Hydrocarbons: Dilute-Acid and Enzymatic Deconstruction of Biomass to Sugars and Catalytic Conversion of Sugars to Hydrocarbons; NREL/TP-5100-62498; National Renewable Energy Lab. (NREL): Golden, CO, USA, 2015. [Google Scholar] [CrossRef]
- Aden, A.; Foust, T. Technoeconomic Analysis of the Dilute Sulfuric Acid and Enzymatic Hydrolysis Process for the Conversion of Corn Stover to Ethanol. Cellulose 2009, 16, 535–545. [Google Scholar] [CrossRef]
- Anex, R.P.; Aden, A.; Kazi, F.K.; Fortman, J.; Swanson, R.M.; Wright, M.M.; Satrio, J.A.; Brown, R.C.; Daugaard, D.E.; Platon, A.; et al. Techno-Economic Comparison of Biomass-to-Transportation Fuels via Pyrolysis, Gasification, and Biochemical Pathways. Fuel 2010, 89, 29–35. [Google Scholar] [CrossRef]
- Eggeman, T.; Elander, R.T. Process and Economic Analysis of Pretreatment Technologies. Bioresour. Technol. 2005, 96, 2019–2025. [Google Scholar] [CrossRef] [PubMed]
- Klein-Marcuschamer, D.; Oleskowicz-Popiel, P.; Simmons, B.A.; Blanch, H.W. Technoeconomic Analysis of Biofuels: A Wiki-Based Platform for Lignocellulosic Biorefineries. Biomass Bioenergy 2010, 34, 1914–1921. [Google Scholar] [CrossRef]
- 2015 Utility Bundled Retail Sales-Industrial. Available online: http://www.neo.ne.gov/statshtml/114_Industrial_Sector.pdf (accessed on 9 September 2017).
- Chemical Equipment Operators and Tenders. Available online: https://www.bls.gov/oes/current/oes519011.htm (accessed on 23 September 2017).
- Juneja, A.; Kumar, D.; Murthy, G.S. Economic Feasibility and Environmental Life Cycle Assessment of Ethanol Production from Lignocellulosic Feedstock in Pacific Northwest U.S. J. Renew. Sustain. Energy 2013, 5, 023142. [Google Scholar] [CrossRef]
- Kumar, D.; Murthy, G.S. Impact of Pretreatment and Downstream Processing Technologies on Economics and Energy in Cellulosic Ethanol Production. Biotechnol. Biofuels 2011, 4, 27. [Google Scholar] [CrossRef] [PubMed]
- Tao, L.; Aden, A.; Elander, R.T.; Pallapolu, V.R.; Lee, Y.Y.; Garlock, R.J.; Balan, V.; Dale, B.E.; Kim, Y.; Mosier, N.S.; et al. Process and Technoeconomic Analysis of Leading Pretreatment Technologies for Lignocellulosic Ethanol Production Using Switchgrass. Bioresour. Technol. 2011, 102, 11105–11114. [Google Scholar] [CrossRef] [PubMed]


| BATCH BASE CASE | FED-BATCH BASE CASE | |
|---|---|---|
| PROCESS TYPE | Continuous | Continuous |
| HOURS OF OPERATION PER YEAR | 7920 | 7920 |
| PLANT CAPACITY | 2000 metric tons/day | 2000 metric tons/day |
| DEPRECIATION | 10 years, straight-line method | 10 years, straight-line method |
| % EQUITY FINANCED | 100 | 100 |
| PROJECT LIFE | 20 years | 20 years |
| IRR (AFTER TAX) | 3.52% | 6.33% |
| STARTUP PERIOD | 4 months | 4 months |
| CONSTRUCTION PERIOD | 30 months | 30 months |
| YEAR OF ANALYSIS | 2013 | 2013 |
| INFLATION | 4.00% | 4.00% |
| Batch | Fed-Batch | |
|---|---|---|
| Total capital investment ($) | 196,487,072 | 167,194,736 |
| Annual operation cost ($/year) | 117,650,740 | 111,650,689 |
| Annual ethanol revenue ($/year) | 116,565,239 | 115,657,243 |
| Ethanol unit production cost ($/gal) | 2.4537 | 2.3469 |
| Ethanol unit production revenue ($/gal) | 2.4848 | 2.4855 |
| ROI (%) | 9.27 | 11.29 |
| IRR (after tax) (%) | 3.52 | 6.33 |
| Input target ethanol sell price ($/gal) | 2.50 | 2.50 |
| Batch | Fed-Batch | |
|---|---|---|
| Capital cost ($) | 196,487,072 | 167,194,736 |
| Ethanol produced (gallons/year) | 47,900,000 | 47,600,000 |
| Power required (kW-h/year) | 50,386,181 | 50,151,126 |
| Power cost ($/year) | 2,519,309 | 2,507,556 |
| Total utilities cost ($/year) | 7,254,020 | 7,323,292 |
| Labor requirement (hours/year) | 189,541 | 182,941 |
| Total labor cost ($/year) | 4,957,604 | 4,578,098 |
| Facilities costs ($/year) | 34,888,000 | 29,634,000 |
| Amount of enzyme used (metric tons per year) | 2123 | 2091 |
| Cost of enzyme ($/year) | 24,202,200 | 23,837,400 |
| Ethanol unit production cost ($/gallon) | 2.4537 | 2.3469 |
| SuperPro Designer Base Values | NREL Base Values | |
|---|---|---|
| Labor ($/h) | 25 | 23 |
| Standard power ($/kW-h) | 0.05 | 0.06 |
| Enzyme cost ($/kg) | 11.40 | 4.00 |
| Corn stover cost ($/metric ton) | 50 | 80 |
| Annual operating hours (h/year) | 7920 | 7880 |
| Ethanol production cost ($/gallon) | 2.4537 (2.3469) | 2.6059 (2.5053) |
© 2019 by the authors. Licensee MDPI, Basel, Switzerland. This article is an open access article distributed under the terms and conditions of the Creative Commons Attribution (CC BY) license (http://creativecommons.org/licenses/by/4.0/).
Share and Cite
Argo, E.; Keshwani, D.R. Techno-Economic Implications of Fed-Batch Enzymatic Hydrolysis. Processes 2019, 7, 847. https://doi.org/10.3390/pr7110847
Argo E, Keshwani DR. Techno-Economic Implications of Fed-Batch Enzymatic Hydrolysis. Processes. 2019; 7(11):847. https://doi.org/10.3390/pr7110847
Chicago/Turabian StyleArgo, Ellen, and Deepak R. Keshwani. 2019. "Techno-Economic Implications of Fed-Batch Enzymatic Hydrolysis" Processes 7, no. 11: 847. https://doi.org/10.3390/pr7110847
APA StyleArgo, E., & Keshwani, D. R. (2019). Techno-Economic Implications of Fed-Batch Enzymatic Hydrolysis. Processes, 7(11), 847. https://doi.org/10.3390/pr7110847