Article

Bubble Motion and Interfacial Phenomena during Bubbles Crossing Liquid–Liquid Interfaces

1
School of Metallurgical and Ecological Engineering, University of Science and Technology Beijing, Beijing 100083, China
2
Beijing Key Laboratory of Green Recycling and Extraction of Metal, Beijing 100083, China
3
School of Mechanical Engineering, Dongguan University of Technology, Dongguan 523808, China
*
Author to whom correspondence should be addressed.
Processes 2019, 7(10), 719; https://doi.org/10.3390/pr7100719
Submission received: 11 September 2019 / Revised: 1 October 2019 / Accepted: 3 October 2019 / Published: 10 October 2019
(This article belongs to the Special Issue Process Modeling in Pyrometallurgical Engineering)

Abstract

:
In metallurgical and chemical engineering processes, the gas–liquid–liquid multiphase flow phenomenon is often encountered. The movement of bubbles in the liquid, and the influence of bubbles on the liquid–liquid interface, have been the focus of extensive research. In the present work, an air–water–oil system was used to explore the movement of bubbles and the phenomenon that occurs when bubbles pass through an interface with various oil viscosities at various gas flow rates. The results show that bubble movement is greatly influenced by the viscosity of the oil at low gas flow rates. The type of phase entrainment and the jet height was changed when increasing the gas flow rate. The stability of the water–oil interface was enhanced with increasing viscosity of the oil phase.

1. Introduction

The gas-injection technique has been widely adopted in the pyrometallurgy smelting processes of ferrous and nonferrous metals and in the recovery of secondary resources, as well as in chemical engineering processes, such as extraction processes. All the above processes generally involve a complex gas–liquid–liquid multiphase system in the vessel. The flow, mixing, transfer, and reaction among the components of the multicomponent fluid play important roles in increasing smelting efficiency and improving product quality. One phenomenon involves the gas bubbles crossing the liquid–liquid interface. Experimentally investigating bubble motion and interfacial phenomena during the blowing–smelting process at high temperatures is difficult [1,2,3], except in a few simple cases [4,5]. Most research on this subject has been carried out using cold-water model experiments, theoretical analysis, and numerical simulation techniques.
Reiter et al. [6,7] studied the interaction between single bubbles and a liquid–liquid interface system. The bubble motion at the interface (e.g., residence time and velocity), the interfacial phenomena (e.g., liquid “jet” and interfacial area), and the phase entrainment (e.g., number and size of droplets) were measured using high-speed photography. Dietrich et al. [8] used the Particle Image Velocimetry (PIV) technique to describe the flow fields around a bubble crossing the interface. Dayal [9] analyzed slag specimens collected from the slag–metal interface in an industrial 65-ton ladle furnace and explained the slag–metal interface phenomenon on the basis of cold-water experiment results. Kobyas [10] established a model to explain iron droplet formation and behavior in slag when gas bubbles pass through the molten iron–slag interface. Ueda [11] and Kochi [12] used a CFD model based on the finite volume method to predict the flow field and the penetration stage when a bubble rises through a water–oil interface. Some other simulation methods, including smoothed particle hydrodynamics (SPH) [13] and the multiphase particle method [14], have also been used to model gas bubbles passing through liquid–liquid interfaces.
In the current study, we simulated a slag–metal system using a water–oil system under cold experimental conditions and investigated the movement of bubbles and their behavior when they passed at various flow rates through a water–oil interface. The effects of different oil viscosities on bubble behavior were studied. We found that bubble movement is greatly influenced by the viscosity of the oil at low gas flow rates, whereas the movement of bubbles is more complex at high flow rates.

2. Experimental

A cold-water model was established for investigating both bubble motion (e.g., the path of movement, rising velocity, breakage, and coalescence) for a bubble crossing the liquid–liquid interface and the variation of the interfacial phenomena with bubble motion. Water and silicone oil were selected to investigate the liquid–liquid movement. Air was injected from a bottom nozzle to the lower phase (water). The nozzle diameter was 2 mm. The vessel was 500 mm in length (L) and 100 mm in width (W). The liquid height was 210 mm, and the height ratio between the water and silicone oil was 2:1. Silicone oils with different viscosities (shown in Table 1) were used [15,16], and the water was colored red to obtain a clear interface. The bubble and interface movements were recorded with a high-speed camera (HiSpec 5). The gas dispersion process was recorded from the moment of injection and 500 frames per second were captured until the flow field was stable for a duration of 30 s. The experimental system is shown in Figure 1.

3. Results and Discussions

3.1. Bubble Shape and Moving Path

Figure 2 shows the bubbles’ shape changing with the gas flow rate. At a low gas flow rate of 20–40 mL/min, the bubbles with diameters of 2–3 mm were spherical in shape. At an increased gas flow rate of 60–500 mm, the shape of the injected bubbles changed to be ellipsoidal and the bubbles’ diameters were 3–5 mm. With a further increase of gas flow (1000–1500 mL/min), the bubbles became mushroom-shaped and more irregular. The bubbles’ sizes were about 10–20 mm.
Figure 3 shows the bubble movement path and the interface fluctuation when it passed through the water–oil interface. The gas formed spherical bubbles after being ejected through the nozzle, and the shape of the bubbles subsequently changed from ellipsoidal or coronal during ascension because of the difference in internal and external pressures. When a bubble was close to the water–oil interface, its movement path deviated, resulting in a different ascending trajectory because of interface fluctuation caused by the impact of previous bubbles. The velocity of a bubble decreased rapidly, and the bubble surface pressure became uniform when it passed through the water–oil interface. It then ascended in a spherical shape while driving the interface upward. In addition, when the bubble entered the oil phase from the water, the surface of the bubble covered the water-phase liquid film, resulting in entrainment.

3.2. Bubble Residence Time at Liquid–Liquid Interface

Figure 4 shows that the heights to which the bubble rose varied with time when oil phases with different viscosities were used. The difference in density and interfacial tension between the oil phases is very small (Table 1). Parameters T1, T2, and T3 are the times for a bubble to cross the water–oil interface. The interface is more easily broken when the oil has a low kinematic viscosity, thus, the bubble would cross using a shorter route and in less time. With an increase in the oil kinematic viscosity, the “elasticity” of the interface is enhanced, where bubbles should overcome the higher viscous resistance to rising. The bubbles require more time to cross an oil phase with higher viscosity.

3.3. Bubble Rising Velocity

Figure 5 shows the distribution of bubble velocity at different heights with a low gas flow rate Q = 50 mL/min. As a result of the low gas flow rate, bubbles formed with lower frequency, lower velocity, and a smaller size after the gas was emitted from the nozzle. Thus, small bubbles interacted one by one with the water–oil interface. This figure reveals that the velocity of bubbles increased linearly in the water-phase (black points) and decreased when they began to pass through the interface (red points). When a bubble left the surface, its velocity was minimum. It then entered the oil phase. However, the velocity was lower in the oil phase than in the water-phase because of the high viscosity of the silicone oil (blue points). In addition, region 2 became larger with increasing oil viscosity.
As shown in Figure 6, about five bubbles were tracked to measure the bubbles’ rising velocity. The blue points show the bubbles with a decreasing velocity caused by interface interaction, the red points show bubbles with a decreasing velocity caused by bubble breakage and the green points show the bubbles with an increasing velocity caused by bubble aggregation. When the gas flow rate was increased, the bubble flow was no longer one by one but rather continuous and even. The shape of the interface, therefore, changed dramatically. Because of the instability of the bubble shape, fragmentation, accumulation, and the influence of interface fluctuation, the change in large-bubble velocity can be divided into four stages during the rising process. The bubble velocity varied with height. In region 1, the bubbles’ velocity increased during the rising process. When the bubble moved to region 2, the velocity of a bubble was reduced because the shape of the bubble changed during ascent. The shape and velocity of the bubble affected each other, so the velocity changed periodically. In region 3, the improvement in bubble shape caused the increasing of bubbles’ velocity. The velocity was hampered by the fluctuation of the interface in region 4. As the viscosity increases, the difference in velocity between the bubbles at the top and bottom becomes smaller and the location of bubble aggregation becomes closer to the nozzle.

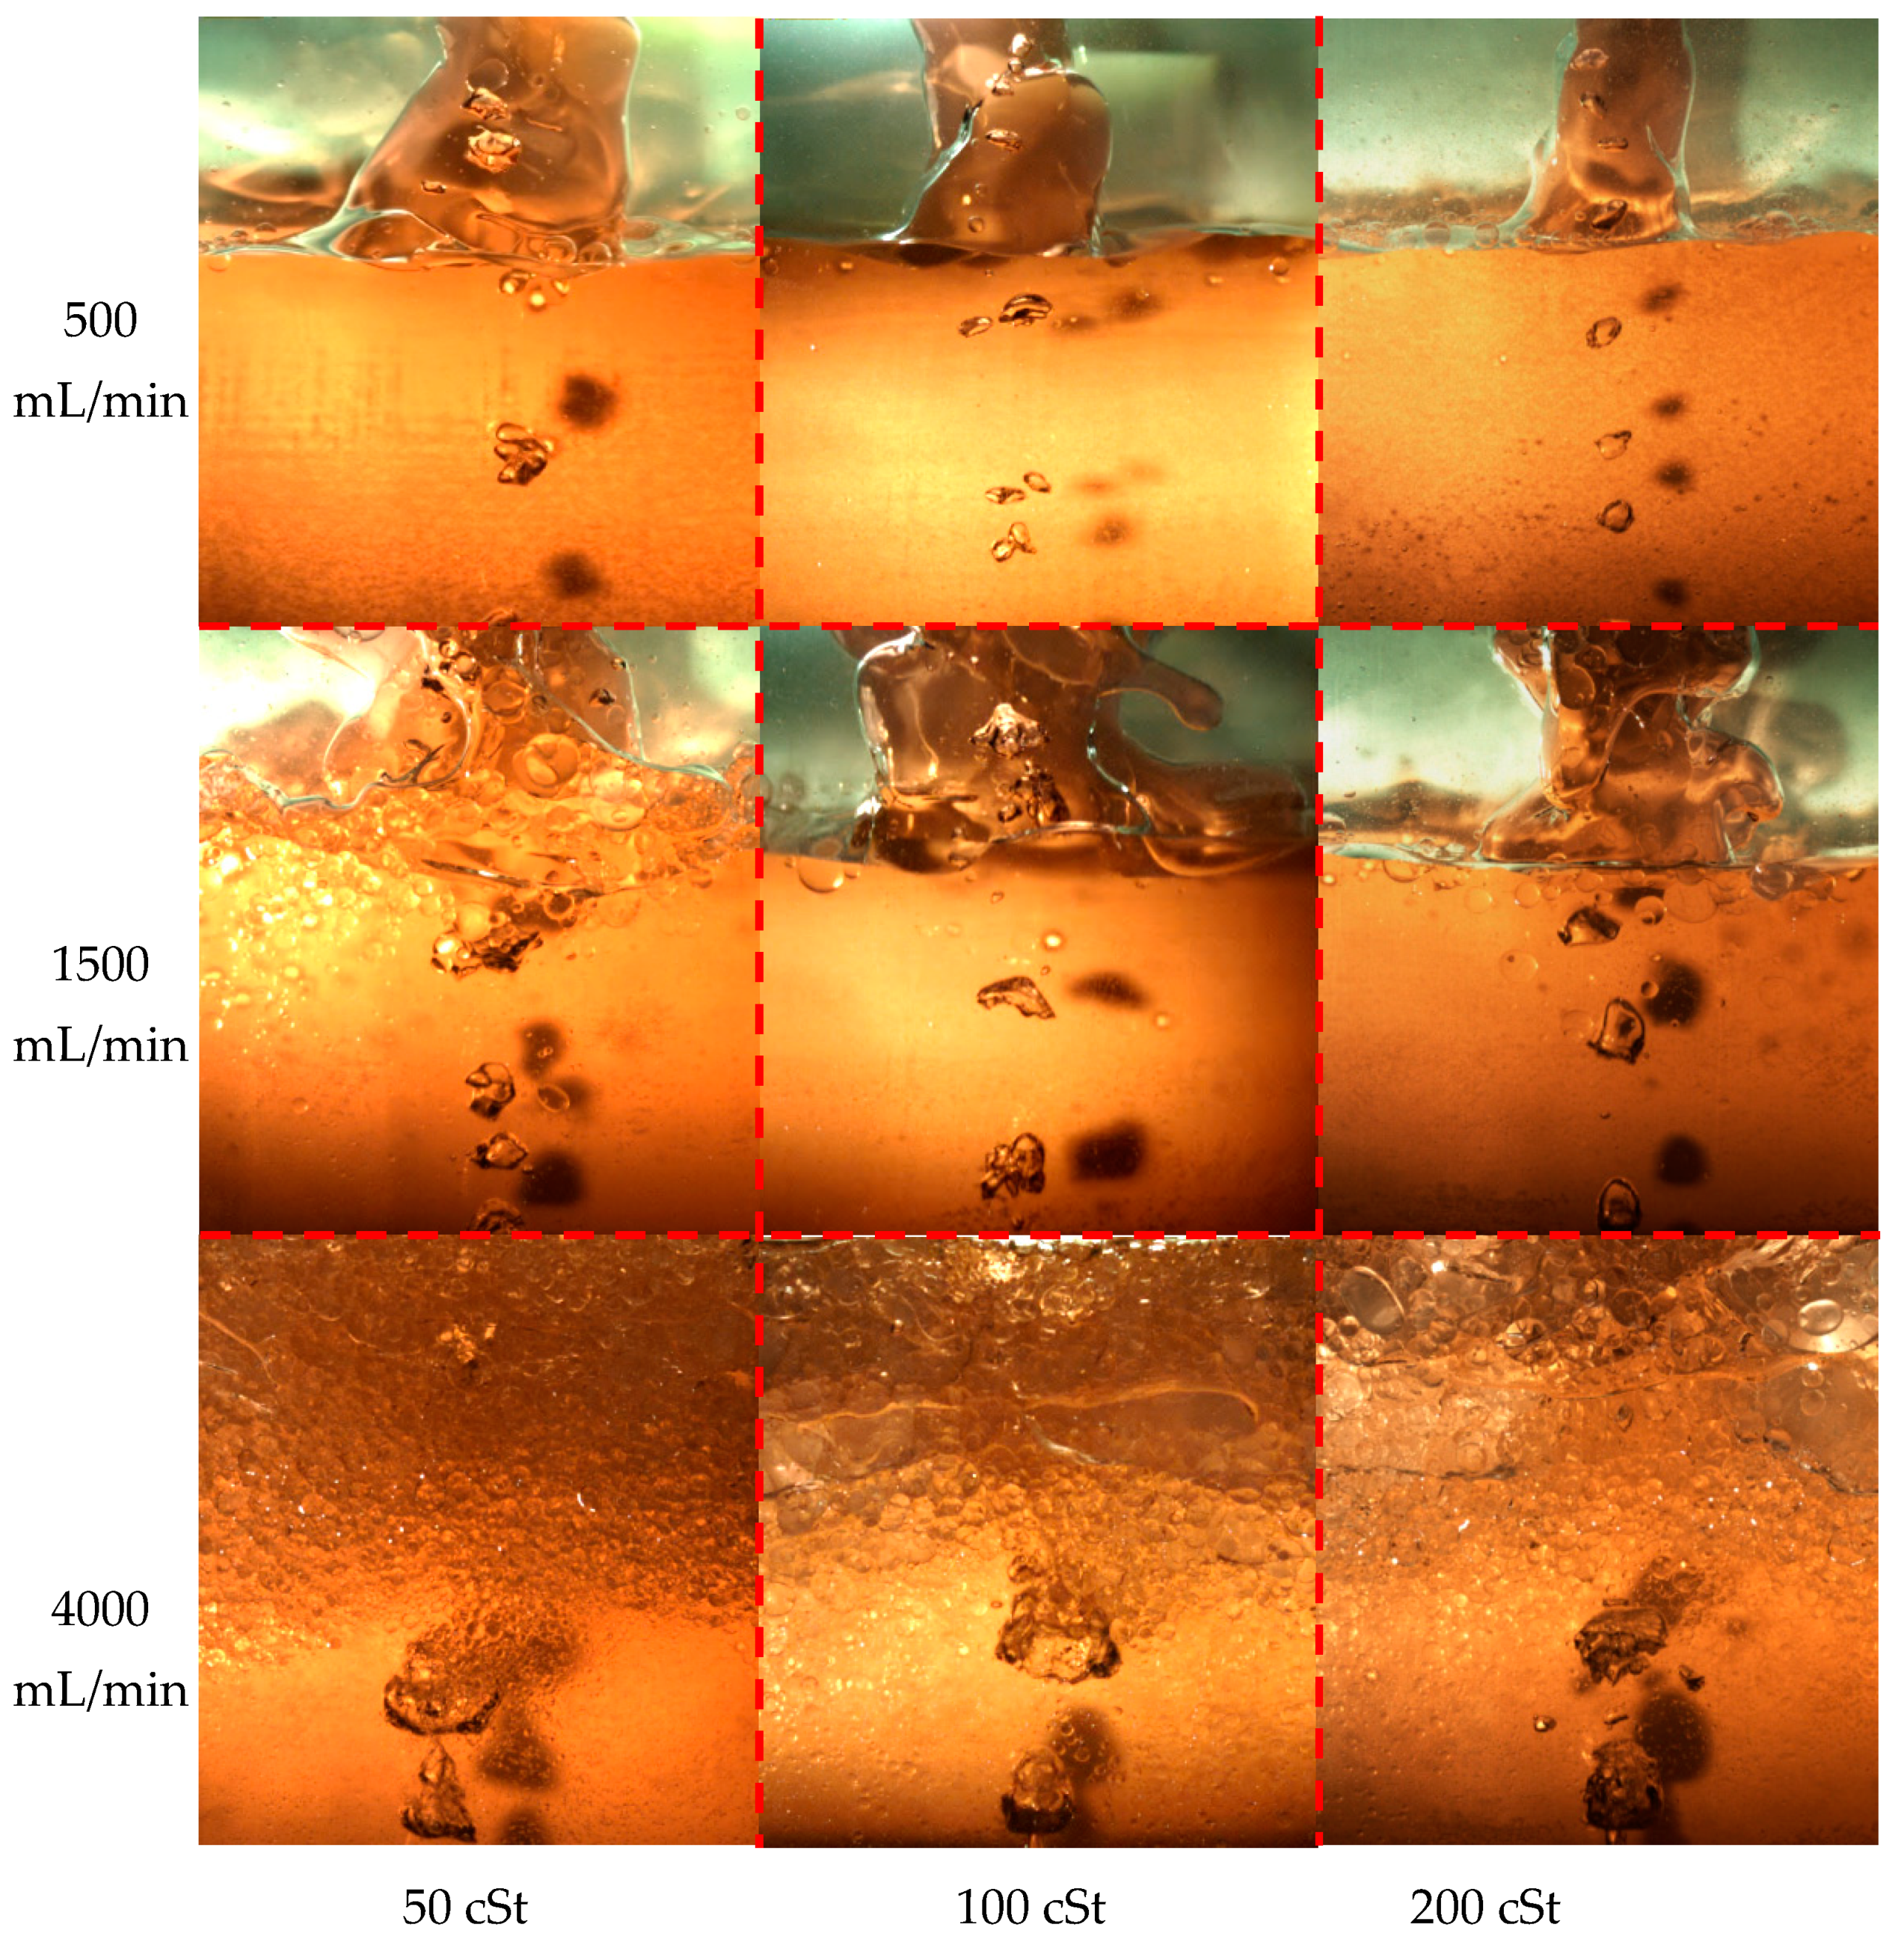
3.4. Liquid–Liquid Interface Distribution and Phase Entrainment

Entrainment occurs when a bubble enters a new phase. Entrainment occurs via four main mechanisms, as shown in Figure 7:
(a)
Firstly, as shown in Figure 7a, the micro water-phase entrainment in the oil phase was generated by the interfacial fracture when a bubble crosses the interface at a low gas flow rate (Q < 50 mL/min). The micro water-phase entrainment generated in this case was sensitively disturbed by the fluid flow and dropped very slowly without gas injection. The micro water-phase entrainment is difficult to separate from the oil phase layer. When increasing oil viscosity, the micro water-phase entrainment will be intensified.
(b)
The second mechanism of water-phase entrainment at the mesoscale was an oil film escaping from the bubble surface, as shown in Figure 7b. This path was the main entrainment generation method at gas flow rates of <100 mL/min. The size of the mesoscale entrainment increases when increasing the gas flow rate and separates from the oil phase layer quickly without gas injection.
(c)
As shown in Figure 7c, at large gas flow rates (100–500 mL/min), the unstable water/oil interface generated would reach the top surface of the oil phase. Large-scale water-phase entrainment occurred via breakage of the column interface. The large-scale entrainment in this case would quickly drop to the water phase. Increasing the oil viscosity could strengthen the water/oil interface, which is more difficult to break.
(d)
The last mechanism was associated with higher gas flow rates (>1000 mL/min). The oil and water mixed and penetrated each other with strong stirring of the gas phase, as shown in Figure 7d. There was no clear water/oil interface. The mixed entrainment took a long time to separate.
In summary, entrainment in the oil phase was mainly produced via mechanisms (a) microscale entrainment, (b) mesoscale entrainment, (c) large-scale entrainment and (d) mixed entrainment with an increased gas flow rate.

3.5. Phase Distribution

Figure 8 showed the phase distribution of gas–water–oil at different viscosities and gas flow rates. With an increased gas flow rate, the frequency with which bubbles impacted the interface also increased. When the gas flow rate was increased to 500 mL/min, the bubble size increased, bubble breakage and aggregation increased, and a stable cylindrical interface formed between these two phases. When the gas flow rate was increased to 1500 mL/min, the cylindrical interface became unstable. When it was increased to 4000 mL/min, the interface disappeared, and the two phases were completely mixed. At the same gas flow rate, with an increased oil viscosity, the interface was more stable and fluctuated less; similarly, less water entrainment occurred (50–100 mL/min), the bubble column became more narrow and stable (500–1500 mL/min), and the two phases mixed less thoroughly (4000 mL/min).
The height of the water–oil interface changed as the bubble crossed the water–oil interface and was defined as the difference between the height of static water–oil interface and the interface height when bubbles had just separated from the water–oil interface. The jet height, h, could be measured from the high-speed images shown in Figure 9.
Figure 10 shows the jet height of the water–oil interface caused by rising bubbles. The interface was impinged with continuous single bubbles when the gas flow rate was less than Q1, Q2, and Q3 for different oils. When the gas flow rate was increased beyond Qi, the aggregation between bubbles was improved, thus, the impingement was changed by multiple bubbles and the jet height was also substantially increased. The stability of the water–oil interface was enhanced, and the Qi was also increased with increasing viscosity of the oil phase.
When the gas flow rate was less than Qi, the jet height and gas flow rate showed a certain linear relationship and the slope approximated to 0.01. The intercept, b, was related to viscosity and decreased with an increase in oil phase viscosity. When the gas flow rate was greater than Qi, the jet height increased exponentially with an increase in gas flow rate. The exponential factor approximated to 0.01 and the coefficient K changed slightly with the increase in oil phase viscosity. The relationship between h and Q could be approximately expressed as follows:
{ h   0.01 Q + b   h   K ( Q Q i ) 0.6 ( Q < Q i ) ( Q > Q i )

4. Conclusions

Through observation of the phenomenon of bubbles crossing the water–air interface under cold-water model conditions, we deduced the following:
(1).
The second phase (oil phase) can reduce the rise rate of a bubble as it passes through the liquid–liquid interface. The greater the viscosity, the more time required for a bubble to pass through the interface.
(2).
The bubble rise rate decreases sharply as it crosses the interface because it must overcome interfacial tension and viscous drag during this process. Therefore, when the atmospheric amount is used, the bubble is mainly affected by the “liquid column” and deformation during ascension. The velocity distribution is M-shaped at this time.
(3).
Phase entrainment can occur via four mechanisms, and increasing the viscosity of the second phase (oil phase) can suppress the generation of the fine entrained phase.

Author Contributions

Project Administration and Writing—Original Draft Preparation, H.Z.; Data Analysis, J.W.; Experiment and Investigation, W.Z.; Supervision, F.L.; Writing—Review & Editing, X.C., Formal Analysis and Methodology, M.X.

Funding

This research was funded by “The Fundamental Research Funds for the Central Universities, grant number FRF-TP-19-016A3”, “The Guangxi Innovation-Driven Development Project, grant number AA18242042-1” and “The University in Guangdong Province Grant, grant number 2015KQNCX157”.

Conflicts of Interest

The authors declare no conflicts of interest.

References

  1. Su, C.J.; Chou, J.M.; Liu, S.H. Effect of gas bottom blowing condition on mixing molten iron and slag inside ironmaking smelter. Mater. Trans. 2009, 50, 1502–1509. [Google Scholar] [CrossRef]
  2. Ma, J.; Sun, Y.S.; Li, B.W. Spectral collocation method for transient thermal analysis of coupled conductive, convective and radiative heat transfer in the moving plate with temperature dependent properties and heat generation. Int. J. Heat Mass Transf. 2017, 114, 469–482. [Google Scholar] [CrossRef]
  3. Ma, J.; Sun, Y.S.; Li, B.W. Simulation of combined conductive, convective and radiative heat transfer in moving irregular porous fins by spectral element method. Int. J. Therm. Sci. 2017, 118, 475–487. [Google Scholar] [CrossRef]
  4. Han, Z.; Holappa, L. Mechanisms of iron entrainment into slag due to rising gas bubbles. ISIJ Int. 2003, 43, 292–297. [Google Scholar] [CrossRef]
  5. Beskow, K.; Dayal, P.; Björkvall, J.; Nzotta, M.; Sichen, D. A new approach for the study of Slag–Metal interface in steelmaking. Ironmak. Steelmak. 2006, 33, 74–80. [Google Scholar] [CrossRef]
  6. Reiter, G.; Schwerdtfeger, K. Characteristics of entrainment at liquid/liquid interfaces due to rising bubbles. ISIJ Int. 1992, 32, 57–65. [Google Scholar] [CrossRef]
  7. Reiter, G.; Schwerdtfeger, K. Observations of physical phenomena occurring during passage of bubbles through liquid/liquid Interfaces. ISIJ Int. 1992, 32, 50–56. [Google Scholar] [CrossRef]
  8. Dietrich, N.; Poncin, S.; Pheulpin, S.; Li, H.Z. Passage of a bubble through a Liquid–Liquid interface. AICHE J. 2008, 54, 594–600. [Google Scholar] [CrossRef]
  9. Delobelle, P.; Oytana, C. Study of Slag-Metal interface in ladle treatment. Ironmak. Steelmak. 2006, 33, 454–464. [Google Scholar]
  10. Kobayashi, S. Iron droplet formation due to bubbles passing through molten iron/slag interface. ISIJ Int. 1993, 33, 577–582. [Google Scholar] [CrossRef]
  11. Ueda, Y.; Kochi, N.; Uemura, T.; Ishii, T.; Iguchi, M. Numerical observation of flow field around the water column behind a rising bubble through an oil water interface. ISIJ Int. 2011, 51, 1940–1942. [Google Scholar] [CrossRef]
  12. Kochi, N.; Ueda, Y.; Uemura, T.; Ishii, T.; Iguchi, M. Numerical simulation on penetration stage of a rising bubble through an Oil-Water Interface. ISIJ Int. 2011, 51, 1011–1013. [Google Scholar] [CrossRef]
  13. Grenier, N.; Touzé, D.L.; Colagrossi, A.; Antuono, M.; Colicchio, G. Viscous bubbly flows simulation with an interface SPH model. Ocean. Eng. 2013, 69, 88–102. [Google Scholar] [CrossRef]
  14. Natsui, S.; Takai, H.; Kumagai, T.; Kikuchi, T.; Suzuki, R.O. Multiphase particle simulation of gas bubble passing through liquid/liquid interfaces. Mater. Trans. 2014, 55, 1707–1715. [Google Scholar] [CrossRef]
  15. Dehkordi, P.B.; Colombo, L.P.M.; Mohammadian, E.; Arnone, D.; Azdarpour, A.; Sotgia, G. Study of viscous Oil-Water-Gas slug flow in a horizontal pipe. J. Pet. Sci. Eng. 2019, 178, 1–13. [Google Scholar] [CrossRef]
  16. Kajero, O.T.; Mukhtar, A.; Lokman, A.; James, A.B. Experimental study of viscous effects on flow pattern and bubble behavior in small diameter bubble column. Phys. Fluids 2018, 30, 093101. [Google Scholar] [CrossRef]
Figure 1. Experimental setup.
Processes 07 00719 g001
Figure 2. Bubble shape at different gas flow rate with oil phase viscosity of 50 cSt.
Processes 07 00719 g002
Figure 3. Bubble shape, movement path, and interfluctuation.
Processes 07 00719 g003
Figure 4. Bubble rising heights at different times (Q = 50 mL/min).
Processes 07 00719 g004
Figure 5. Rising-bubble velocity distribution (Q = 50 mL/min).
Processes 07 00719 g005
Figure 6. Rising-bubble velocity distribution (Q = 1000 mL/min).
Processes 07 00719 g006
Figure 7. Four mechanisms of liquid entrainment with an oil–oil viscosity of 50 cSt for (a) Q = 50 mL/min; (b) Q = 100 mL/min; (c) Q = 250 mL/min and (d) Q = 4000 mL/min.
Processes 07 00719 g007
Figure 8. Gas–liquid–liquid distribution with different gas flow rates and different silicone oil viscosities.
Processes 07 00719 g008
Figure 9. Measuring method of water–oil interface jet height.
Processes 07 00719 g009
Figure 10. Jet height with different gas flow rates.
Processes 07 00719 g010
Table 1. Properties of the silicone oils used in the experiments.
No.Kinematic Viscosity, cStDensity, kg/m3Interface Tension, mN/m
15095630.6
210095730.7
320096136.9

