Article

Simulating the Filtration Effects of Cement-Grout in Fractured Porous Media with the 3D Unified Pipe-Network Method

1
School of Civil and Transportation Engineering, Hebei University of Technology, 5340 Xiping Road, Beichen District, Tianjin 300130, China
2
State Key Laboratory for Geo-Mechanics and Deep Underground Engineering, China University of Mining and Technology, 1 Daxue Road, Xuzhou 221116, China
3
School of Public Health, Peking University, 38 Xueyuan Road, Beijing 100191, China
*
Author to whom correspondence should be addressed.
Processes 2019, 7(1), 46; https://doi.org/10.3390/pr7010046
Submission received: 8 December 2018 / Revised: 9 January 2019 / Accepted: 14 January 2019 / Published: 16 January 2019
(This article belongs to the Special Issue Fluid Flow in Fractured Porous Media)

Abstract

:
In grouting process, filtration is the retention and adsorption of cement-grout particles in a porous/fractured medium. Filtration partly/even completely blocks the transportation channels in the medium, greatly decreasing its permeability. Taking into account filtration effects is essential for accurately estimating the grout penetration region. In this paper, the 3D unified pipe-network method (UPM) is adopted for simulating 3D grout penetration process in a fractured porous medium, considering filtration effects. The grout is assumed to exhibit two-phase flow, and the filtration effects depend on not only the concentration and rheology of the grout but also the porosity and permeability of the fractured porous medium. By comparing the model with the experimental results, we firstly verify the proposed numerical model. Then sensitivity analysis is conducted, showing the influences of grout injection pressures, the water–cement ratios of grout (W/C) and the grout injection rates on filtration effect. Finally, the grout filtration process in a complex 3D fractured network is simulated, indicating that the size of the grout penetration region is limited due to filtration.

1. Introduction

Cement grouting is a widely used method for sealing underground water and improving the mechanical characteristics of surrounding media, such as fractured rocks, in geotechnical engineering. Over the past few decades, many on-site experiments have been conducted to assess the grouting quality [1,2,3,4,5,6] and to improve the strength and penetration distance. Some researchers remarked that cement particles can accumulate and deposit on the surfaces of pores/fractures [7,8,9], thereby blocking transport channels within the porous/fractured medium and terminating any further penetration of the grout. This phenomenon is called filtration, an irreversible process that significantly reduces the permeability of the porous/fractured medium [10,11,12]. Hence, assessments of the distance over which grout has penetrated will be greatly overestimated if the effects of filtration are ignored.
Researchers have experimentally investigated the influences of filtration on grouting with one-dimensional column injection tests considering constant grout injection pressures, injection rates, or cement grout particle concentrations. These researchers found that the cessation of cement grout penetration depends not only on the physical characteristics of the grout [13,14,15], such as the concentration of the cement grout particles and rheology of the grout, but also on the properties of the porous/fractured medium [16,17], such as the pore shape and fracture distribution. Furthermore, the permeability of the grouted medium decreases substantially in penetration zones [18,19,20]. Nevertheless, while the results of experimental investigations make it possible to verify proposed analytical and numerical models, their main disadvantage is that the influencing factors are very difficult to control as planned [21].
Many numerical and analytical methods, including phenomenological models [22], continuum models [23], trajectory analysis models [24], stochastic models [25], and network models [26,27,28,29,30], have been proposed to analyse the effects of filtration in porous but not fractured media. With these methods, some important conclusions have been drawn; for example, Saada et al. [19] and Maghous et al. [31] found that small variations in the porosity can lead to high variations in the permeability, as the injection of grout towards a void can be stopped by cement particle filtration, after which no significant reduction in the porosity will occur. Researchers have also proposed single [32] and multi-phase [19] models that are all applicable, but they have shown different precisions.
Moreover, research has been presented on the simulation of grout flow considering filtration effects in a fractured, porous medium [13,33]. Generally, fractures exist naturally within rock-like materials; thus, the initiation and propagation of such fracture need to be modelled by sophisticated numerical tools, such as the eXtended Finite Element Method (XFEM) [34,35,36], the strong discontinuity embedded approach [37,38,39,40,41,42], the mixed-mode FEM [43,44,45,46], and the phase-field model [47,48,49]. However, when focusing only on mass/energy transport within existing fractures and not their mechanical evolution, much simpler models can be used instead of these sophisticated techniques. The unified pipe-network method (UPM) is one of these simplified methods; it uses equivalent pipe networks to simulate the mass/energy transport processes within a porous/fractured medium. With the UPM, 2D and 3D mass/energy transport problems can be transformed into equivalent 1D problems, similar to the lattice element method (LEM) [50,51,52]. The fractures and porous medium can then be discretized using the same pipe-network system [53,54], which represents a significant advantage that provides a higher computing efficiency and greater numerical stability than other methods.
In this work, the grout filtration process within a 3D porous and fractured rock mass is simulated with a 3D UPM model. The grout flow is assumed to be an incompressible liquid [13,15,27]. In comparison with our former work [55], which focused on grout flow with a considerable time-dependent viscosity, we focus on the blocking effects of cement particles correlated with the microscopic structures of fractured, porous media. The remainder of this paper is organized as follows. In Section 2, the 3D two-phase filtration model is clearly introduced, and both the fluid flow and the mass transportation equations are given. In Section 3, the discretized equations of the filtration model based on the 3D UPM are established, thereby covering the interactions between the grout flow and the rock matrix and fractures. In Section 4, the developed numerical model is verified through a comparison with the experimental results given in [56] in tandem with a sensitivity analysis of the filtration process, including the grout injection pressure, grout injection rate and grout water–cement ratio. In Section 5, grout penetration in a porous and fractured rock is simulated considering different fracture inclination angles and random fracture networks. In Section 6, concluding remarks are provided.

2. Mathematical Model

We consider two-phase (fluid and solid particles) flow to study the filtration processes in a fractured and porous rock. This model is based on the interaction of Darcy’s flow and mass transportation. The cement-based grout is considered to be a Newtonian fluid. The saturated single-phase grout flow in both the fractures and rock matrix obeys Darcy’s law and can be calculated based on a mass conservation equation:
t ( ϕ τ ρ ) + · ( ρ · u ) = ρ q ,
where τ is a sign expressing the different media in the model domain, for example, τ = m expressing a matrix and τ = f expressing a fracture, where ϕ m is the porosity of the rock matrix and ϕ f is the porosity of a fracture; ρ is the grout density; q is the source term; and u is the flow velocity vector, which can be expressed as
u = k τ μ ( P ρ g ) ,
in which μ is the grout fluid viscosity, P is the grout pressure, g is the gravitational acceleration and k τ is the rock matrix and intrinsic fracture permeability tensor. The aperture of the fractures in the current simulation is assumed to be smooth, and the laminar flows of the grout in the fractures can be described by a cubic law; thus, the intrinsic fracture permeability can be calculated as k f = a 2 / 12 , where a is the fracture aperture.
For analyzing the transport of cement grout particles through a porous medium, the advection–dispersion equation is used with an additional term ( σ / t ) , which is defined as the rate of suspended particle mass transfer between the grout and the pore skeleton. Although the hydrodynamic dispersion coefficient is typically non-zero for multiphase flows in porous media [57], researchers have noted that the hydrodynamic dispersion tensors of porous media and fractures can be ignored since the effect of hydrodynamic dispersion on the dilution of grout is generally small [10,19,58,59,60]. Hence, the following relation is obtained for a porous medium:
t ( ϕ m C ) + u · C = σ t = λ C ,
where C is the concentration of transported particles, D m is the hydrodynamic dispersion tensor of the porous medium, λ is the constant deposition coefficient and σ is the mass of grout particles being deposited per initial unit pore volume. In the above equation, the inhibition of particle deposition by inter-particle forces is assumed to be minimal [61], and the filtration process is modeled through a kinetic equation for mass transfer and represented by a first-order relationship [10,18,56].
Similarly, when assuming that filtration cannot proceed after cement grout particles have migrated into the fractures, the following relation is obtained for fractures:
t ( ϕ f C ) + u · C = 0 .
The filtration of cement grout particles is enhanced by a decrease in the volume of the void space. When the grout is injected into the porous medium, the porous medium becomes plugged, and the porosity decreases with space and time. The porosity is thus assumed to decrease in proportion to the mass of filtered particles as follows:
ϕ m = ϕ 0 m σ ρ s ,
where ϕ 0 m is the initial porosity and ρ s is the rock density.
The intrinsic permeability of the porous rock decreases with the clogging of the pore space. The experimental work performed by [19] proved that the permeability is dramatically influenced by the porosity, which means that very low variations in the porosity may induce large variations in the permeability. However, the well-known Kozeny–Carman equation expresses that the change in the permeability is consistent with the change in the porosity. Thus, a hyperbolic function of the (filtration-induced) porosity change is adopted in this paper to express the relationship between the porosity and permeability:
k m = k 0 m 1 + b ( ϕ m ϕ 0 m ) ,
where k 0 m is the initial intrinsic permeability and b is a negative scalar.
The concentration of cement grout particles has a considerable effect on its rheological properties [62]. Except for the porosity ϕ τ and intrinsic permeability k τ , the viscosity μ and the grout density ρ vary with time because of the cement solid filtration. The effective viscosity and density of the grout can be expressed as
μ = μ w ( 1 + 2.5 δ ) ,
ρ = ρ w + ( ρ c ρ w ) δ ,
where μ w is the viscosity of water, ρ w is the density of water, δ is the volume fraction of cement particles, which can be calculated as δ = C / ρ s , and ρ c is the density of the cement particles, where ρ c = ρ s .

3. The Discretization Model for the 3D Unified Pipe-Network Method

In the framework of the 3D UPM, the equivalent hydraulic parameters and diffusion parameters of the fracture and matrix pipes are derived based on discrete unstructured elements.

Matrix Pipe-Network Model

The 3D porous medium is discretized using tetrahedral elements in this model, where each tetrahedron has six edges, and these elements are regarded as the flow pipes of the matrix, as shown in Figure 1a. When assuming that the edges of the tetrahedral elements are equivalent pipes, the mass/energy transport problem in a fractured and porous medium is transformed into an equivalent transport problem in the pipe network system. To obtain the equivalent parameters of the flow matrix pipes, the center of the sphere circumscribed around the tetrahedron (point o) and the circumcenters of the four faces of the tetrahedron (points c n , ( n = 1 , 2 , 3 , 4 ) ) are determined as division points (see Figure 1b). Linking the point o to the points c n and to the midpoint of their joint edge in sequence encloses a partition face of the tetrahedron. The tetrahedron will form six partition faces in total, each of which is perpendicular to its respective intersecting edges. The tetrahedron is thus divided into four parts by these six partition faces, and the total pore volume of each part is assigned to its corresponding node, see Figure 1a.
The equations for grout flow and cement grout particle transport through the control volume of a node are derived by formal integration methods, such as the finite volume method (FVM), expressed as follows:
V t ( ϕ τ ρ ) d V + A n · ( ρ · u ) d A = V ρ q d V ,
V ϕ m C t d V + A n · ( u · C ) d A = V σ t d V ,
V ϕ f C t d V + A n · ( u · C ) d A = 0 ,
where V is the nodal control volume and A is the nodal control area generating the 3D Voronoi element.
The pressures and concentrations within a tetrahedral element can be written using the following interpolations:
P ( x , y , z ) = N k p k ( k = i , j , m , n ) ,
C ( x , y , z ) = N k C k ( k = i , j , m , n ) ,
where N k is the linear shape function as in the FEM and P k and C k denote the pressures and grout concentrations, respectively. Here, we would like to emphasize that hydro-mechanical effects are ignored in the UPM; these effects require higher-order shape functions for the displacement field and lower-order shape functions for the pressure/concentration fields, such as the hybrid formulations used in [63,64,65], to avoid numerical instabilities [66,67]. When using the same shape functions for the pressure/concentration fields in our examples, we do not encounter any numerical problems.
The grout fluid flow Q i j m in pipe i j is equal to the flow through the area o c 1 f c 2 , see Figure 1a, and can be calculated as
Q i j m = Q o c 1 f c 2 m = A o c 1 f c 2 n o c 1 f c 2 · u = K i j m ( P i P j ) ,
where n o c 1 f c 2 is the unit normal vector, A o c 1 f c 2 is the area of the face o c 1 f c 2 , P i and P j are the pressures at nodes i and j, respectively, and K i j m is the equivalent conductance coefficient of pipe i j , which can be written as [68,69,70]
K i j m = A o c 1 f c 2 k m l i j μ ,
where l i j is the length of pipe i j . Furthermore, fractures in the 3D domain are represented as 2D disks. The equivalent hydraulic parameters of the pipes are derived from unstructured triangular elements, as shown in Figure 1b. The conductance coefficient K i j f for fracture pipe i j in the 3D domain is derived as [55]
K i j f = A o f k f l i j μ = l o f a 3 l i j μ .
The grout flow in each node obeys Darcy’s law. Thus, within the framework of the UPM, for each node i, the governing equation for single-phase saturated flow is
( ϕ i m V i m ) t + j = 1 n i Q i j m = Q s i ,
where ϕ i m is the porosity of node i, V i is the control volume of node i, the subscript n i denotes the total number of connected pipes, and Q s i is the source term of node i.
The effective diffusion coefficient in a 3D porous medium can be derived using the same discretization method used for the aforementioned equivalent conductance coefficient. The mass of the grout particles m ˙ i j m transported in pipe i j is also equal to the mass being transported through the area o c 1 f c 2 and can be calculated as
m ˙ i j m = m ˙ o c 1 f c 2 m = A o c 1 f c 2 n o c 1 f c 2 · u · C = Q i j m C i + C j 2 ,
where C i and C j are the concentrations at nodes i and j, respectively. The grout particles being transported through each node obey the nodal laws. For each node i, the governing equation for mass transport is
( ϕ i m V i m C i ) t + j = 1 n i m ˙ i j m + λ V i C i = 0 .
In the 3D fractured and porous rock, the fractures and rock matrix are reconstructed using 1D pipes. The pipes with the start and end nodes belonging to both the matrix and fracture pipes are defined as interface pipes, which means that both the fracture and matrix pipes will possess the same nodes at the interface. The nodal control volumes and the equivalent conductance coefficient and diffusion coefficients of the interface pipes are calculated by the superposition of the respective values of the fracture pipes and matrix pipes. In addition, the pore pressures and particle concentrations are assumed to be continuous at the interface without interaction between fractures and the matrix. Finally, the governing equations for each node are written as
( ϕ i τ V i τ ) t + j = 1 n i Q i j τ = Q s i ,
M i τ t + j = 1 n i m ˙ i j τ + λ V i m C i = 0 .

4. Model Verification

4.1. Experimental Verification

Bouchelaghem [56] conducted a series of experiments on the flow and transport of microscopic to fine cement in sand using 1D column tests. These experiments use a well-graded and medium to coarse sand; thus, the porous medium can be considered to be homogeneous. A diagram of the grout injection experiment is given in Figure 2a. Following Bouchelaghem’s experiments, the current numerical simulation uses a column with dimensions of 35 × 35 × 820 mm for a comparison with Bouchelaghem’s results.
The coupled model of fluid flow and mass transport is used to simulate the grout filtration process. The parameters are listed in Table 1. In this model, the grout injection rate and grout concentration are constant at the inlet boundary, while the pressure is a constant at the outlet boundary and is defined as zero. The initial conditions at the four other transverse boundaries are such that n · P = 0 and n · C = 0 .
Figure 3 shows the pore pressures at four elevations at different times under a constant injection velocity from both the experimental and the simulation results. The pore pressure evidently increases with time, and the pore pressures closer to the injection point are larger than those farther from the injection point. The pressure changes slowly far away from the injection point. The numerical results are in good agreement with the experimental results for the four elevations and are consistent with the numerical results obtained by Kim et al. [59] in comparison with the same experimental results. In summary, the key parameter causing the differences between the numerical simulations and experiments is the filtration rate, λ .

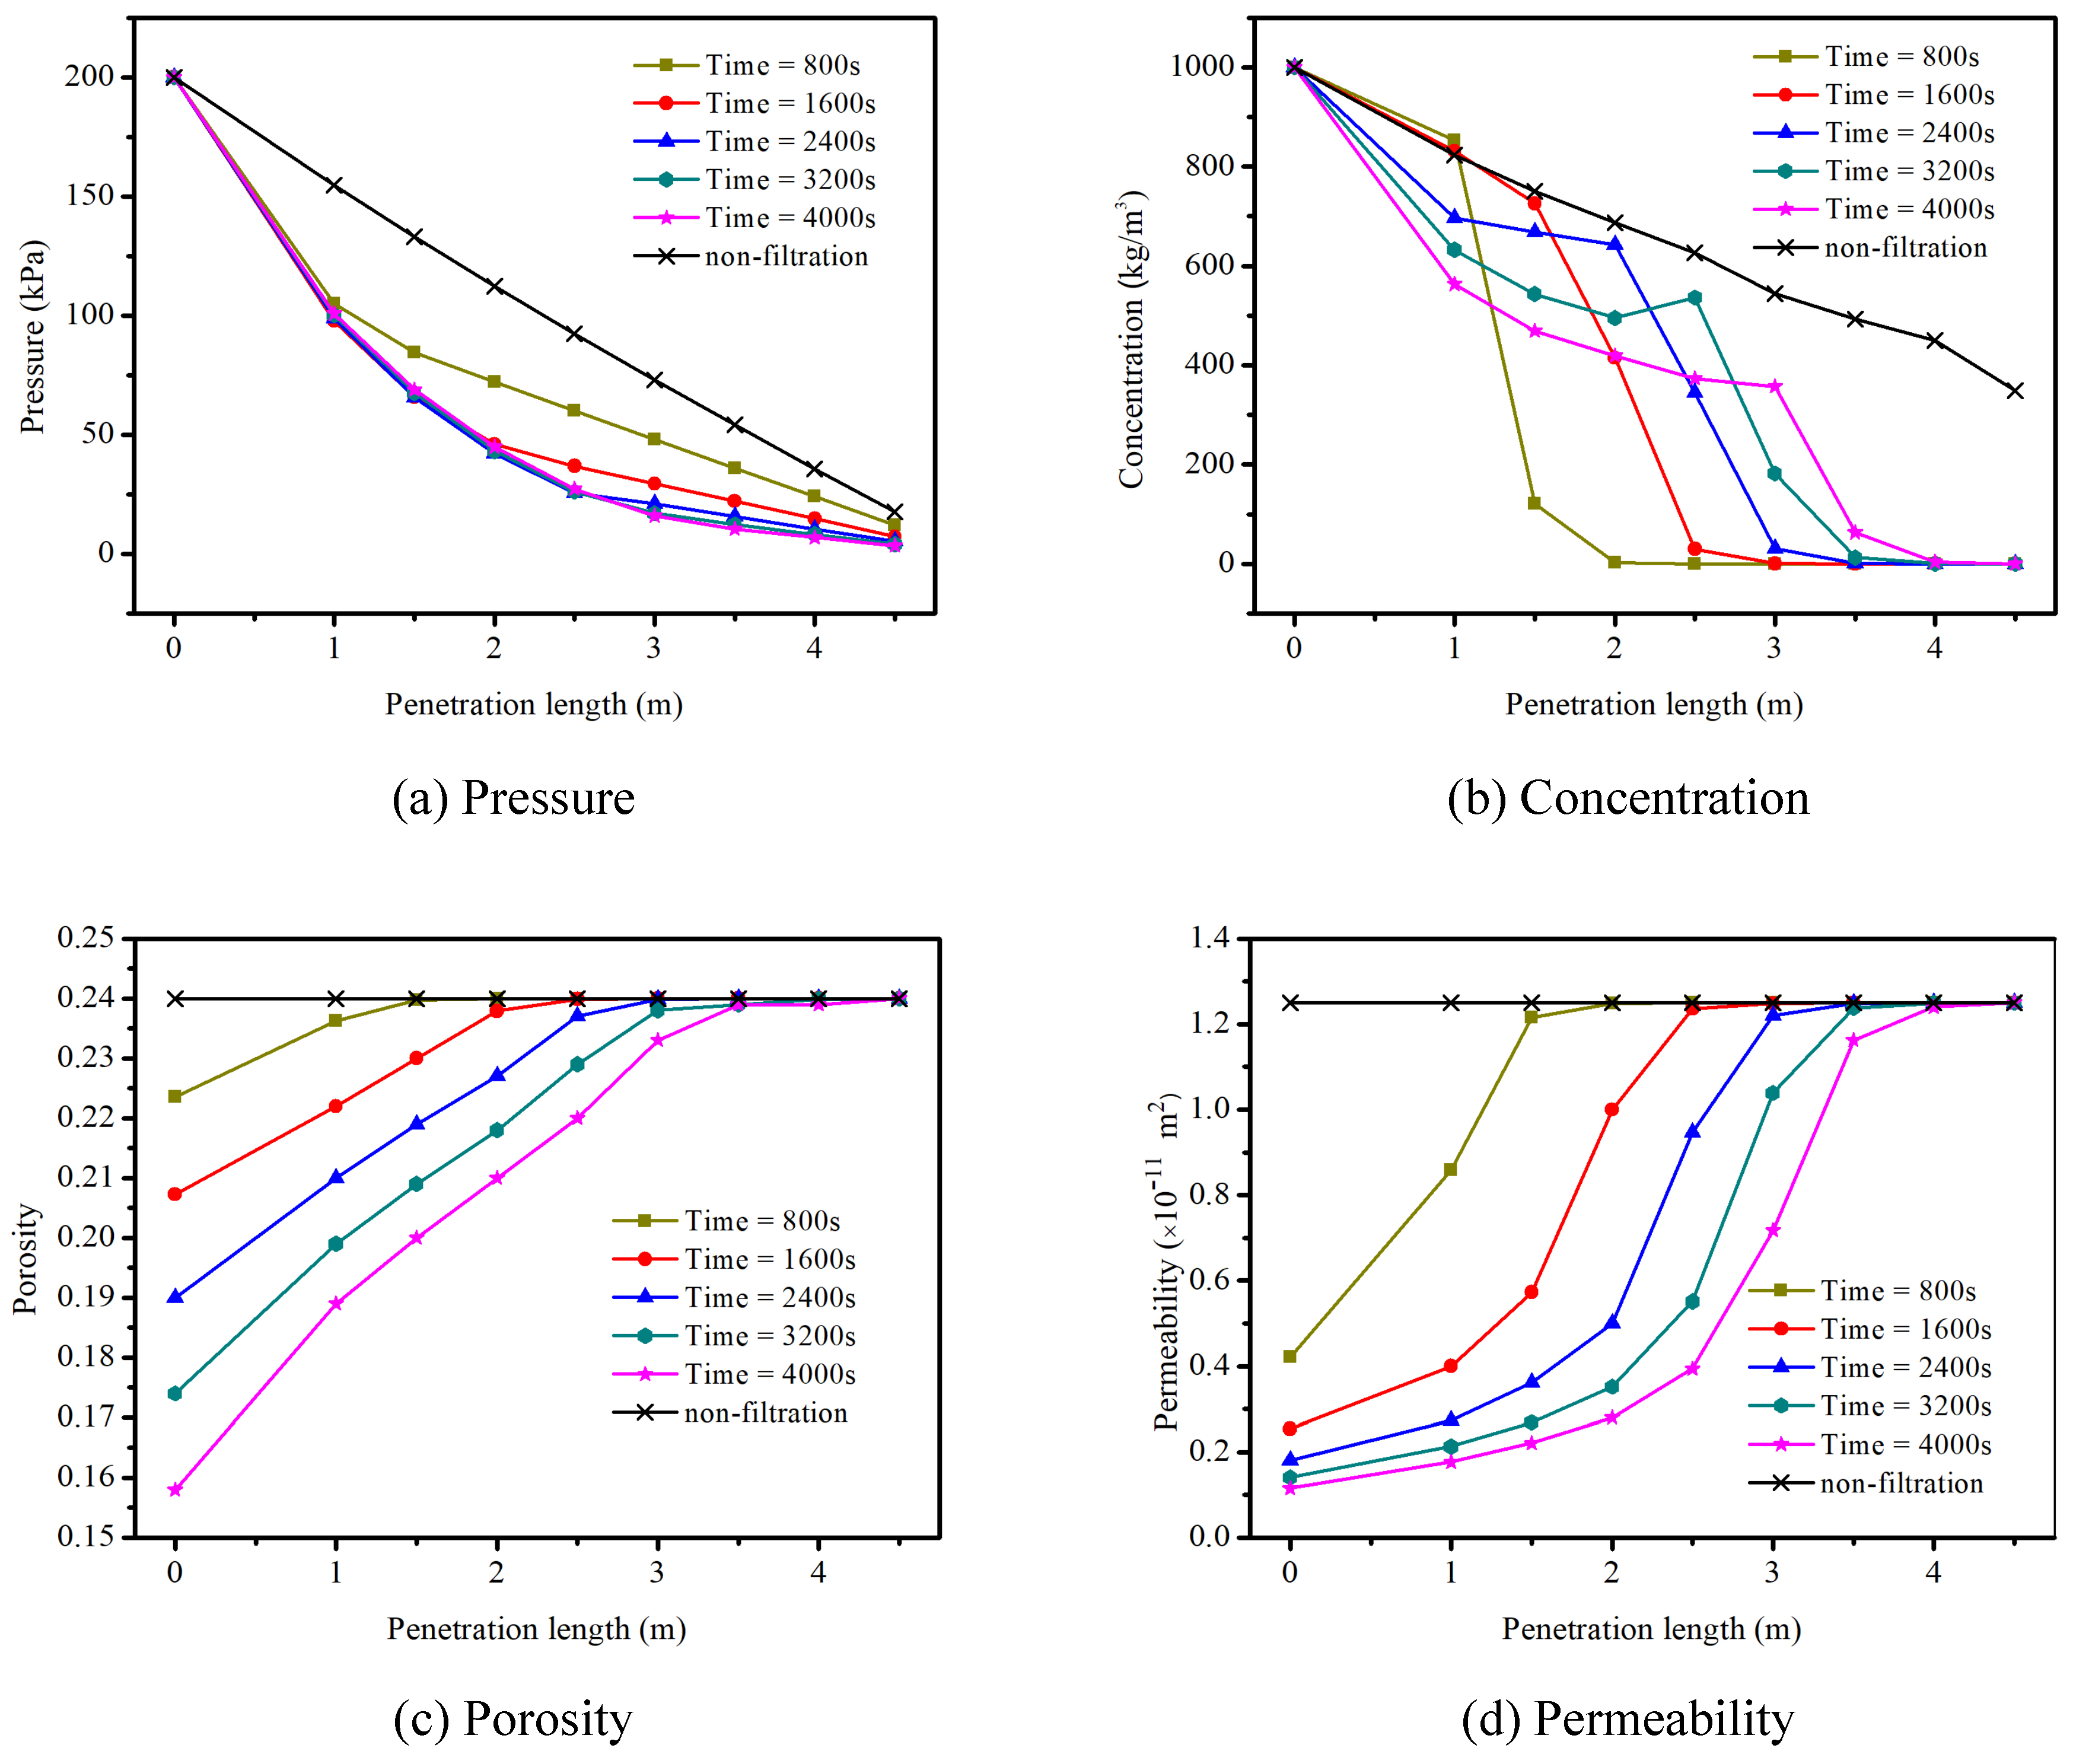
4.2. Sensitivity Analysis of Grout Filtration

The grout injection pressure, injection rate and water–cement ratio of grout are three significant engineering parameters influencing the grouting effect, and all three are usually considered before engineering projects are initiated. In this sensitivity study, the grout filtration process with different grouting operations is modeled. The model is a column with dimensions of 5 × 2 × 2 m, as shown in Figure 4. The meshes are generated by self-developed mesh techniques [71], and the total number of grids in this model is 103,792. The transient flow pressure, mass concentration, porosity and permeability of rock are obtained and compared in time and space. The results are compared by analyzing the points’ values along line AB, as shown in Figure 4, which is defined as the central line of the simulation model.
In the current simulation, grout is injected into a cuboid domain under a constant pressure and constant concentration at the inlet boundary, while the pressure at the outlet boundary is zero. The parameters used in this case study are listed in Table 2. Figure 5 compares the variations in the pore pressure, particle concentration, rock porosity and permeability under two conditions, namely, (i) filtration and (ii) non-filtration, for the purpose of studying the influence of filtration on the grout penetration process. Under the first condition, the grout penetration parameters and rock characteristic parameters are extracted at time steps of t = 800 s, t = 1600 s, t = 2400 s, t = 3200 s and t = 4000 s, whereas, under the second condition, they are extracted at a time step of t = 4000 s.
When ignoring the filtration effects, the porosity and permeability of the rock matrix are constant, and the pore pressure and particle concentration decrease linearly. However, in reality, the filtration makes these parameters vary nonlinearly. When considering the filtration effects, Figure 5a shows that the pore pressure decreases quickly with increases in the penetration length and injection time, indicating that it is necessary to increase the injection pressure with time to ensure the designed grout penetration size. A remarkable decrease in the cement concentration is observed, and the position at which this decrease occurs moves away from the injection position with time, as shown in Figure 5b. Furthermore, the concentration of cement particles also decreases quickly with time, which means that, under the same injection concentration, the grout particles move more slowly with time. Figure 5c,d show that the porosity and permeability decrease with time and increase with the distance from the injection position, indicating that the variation rate of the permeability is larger than that of the porosity.

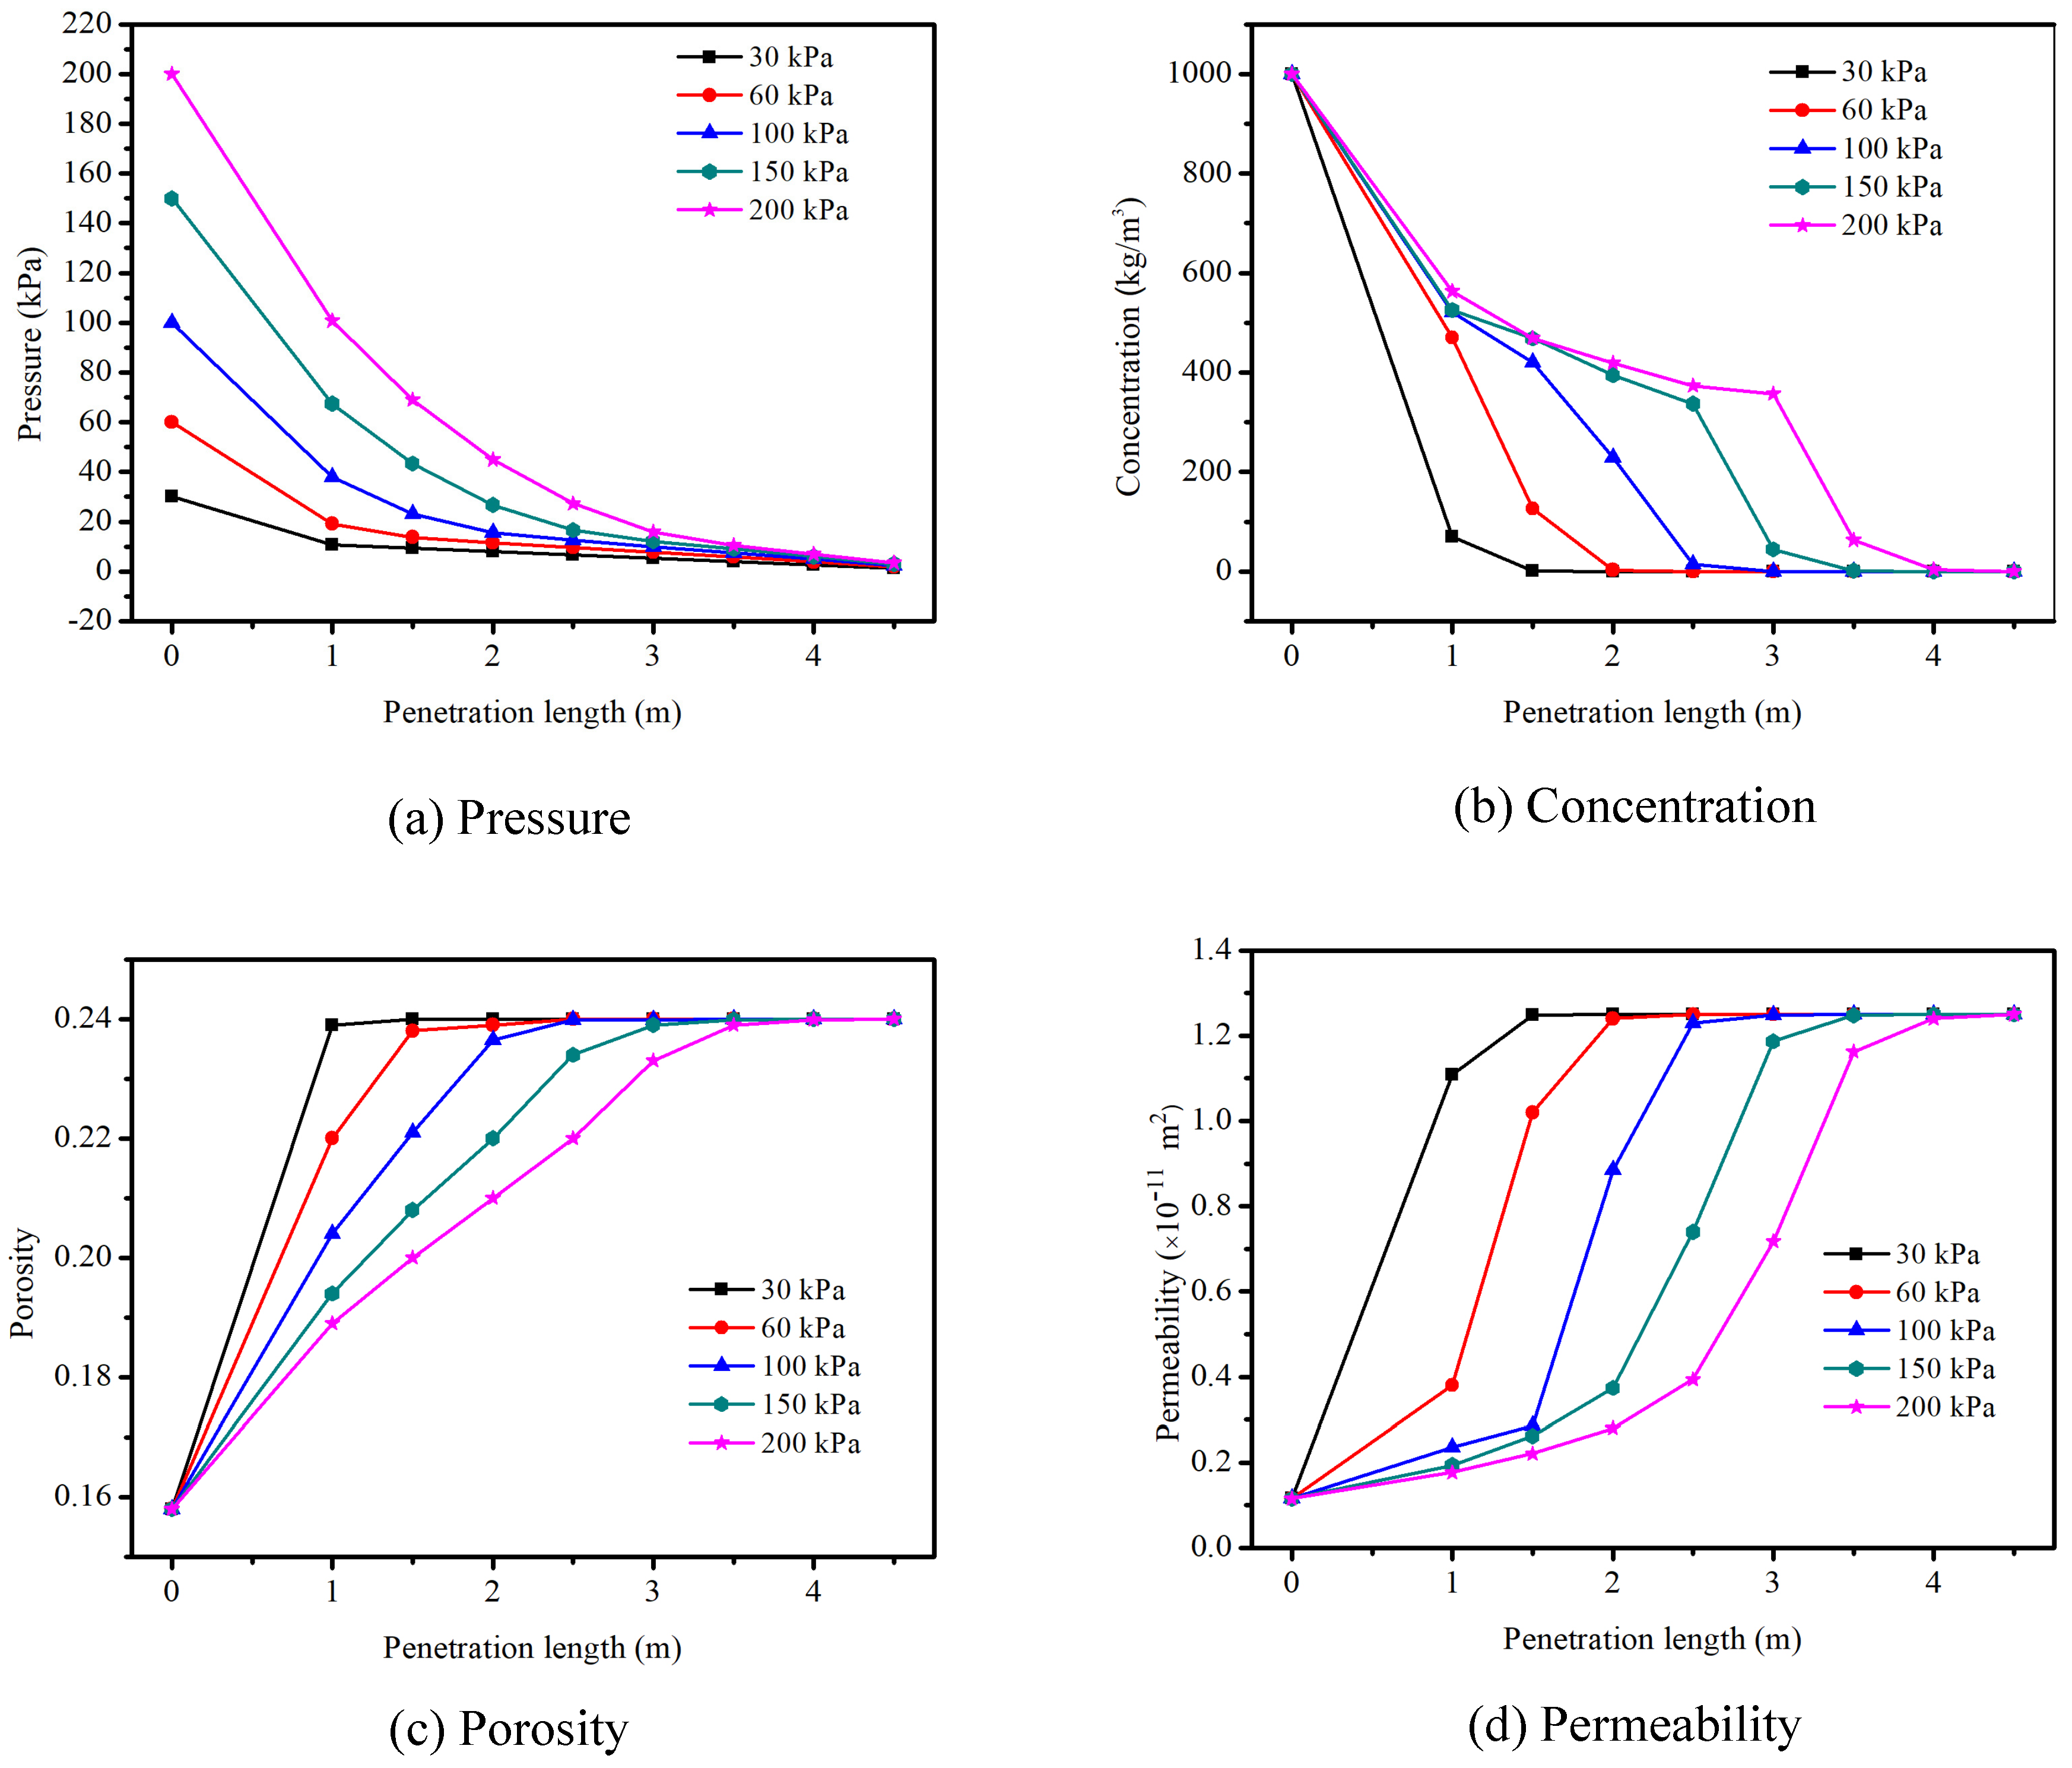
4.2.1. Effects of the Grout Injection Pressure

To analyze the influence of the grout injection pressure on the filtration, the injection pressure is varied from 30 kPa to 60 kPa, 100 kPa, 150 kPa and 200 kPa with a total injection time of 4000 s. As shown in Figure 6a, the pore pressure decreases quickly with increasing injection pressure. Figure 6b shows that the concentration decreases with the injection pressure. Although the injection pressures are different, the porosity and permeability of the rock matrix at the inlet boundary are the same, as shown in Figure 6c,d. This indicates that the injection pressure cannot influence the minimum porosity. The porosity and permeability decrease with increasing injection pressure at the same position, which explains the fact that the increase in injection pressure will increase the effect of pore sealing. Thus, in the same position, it is more difficult to inject the grout into the rock under the same constant pressure.

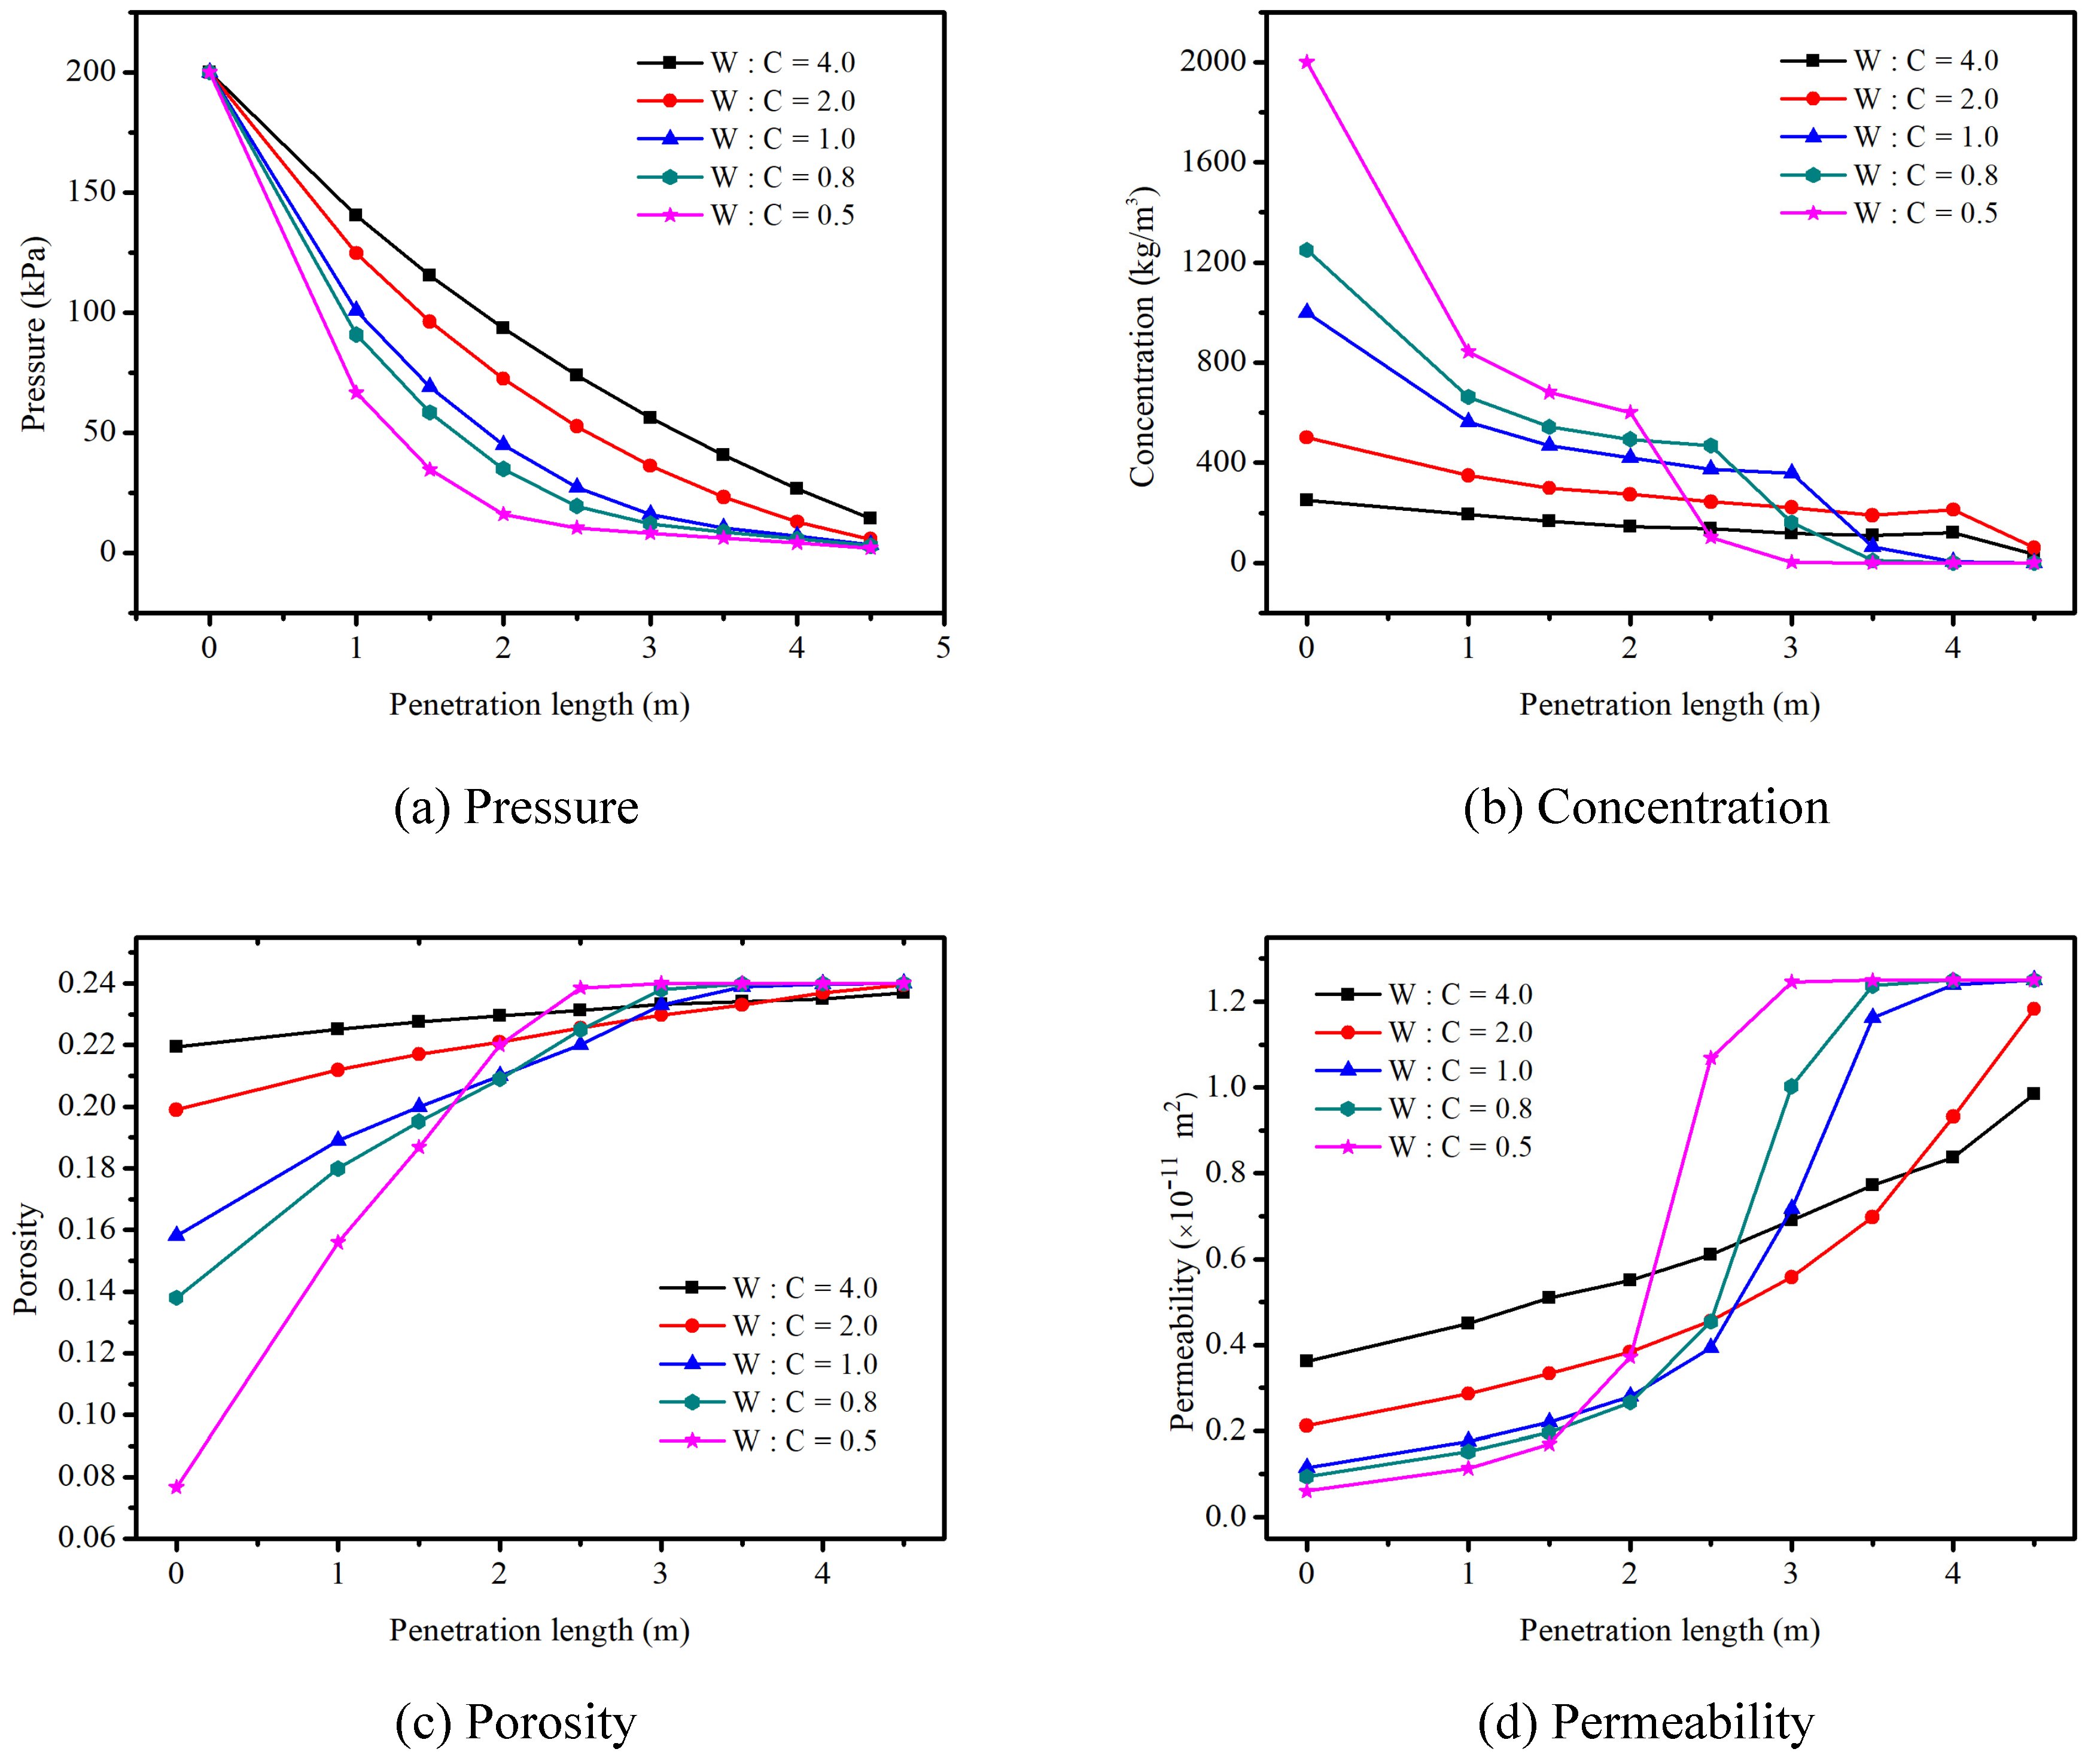
4.2.2. Effects of the Water–Cement Ratio

Figure 7 shows the influence of the water–cement ratio on the filtration. In the simulation, the water–cement ratio is varied from 0.5 to 0.8 , 1.0 , 2.0 and 4.0 . The simulation time is 4000 s. The change in the water–cement ratio is defined as the variation in the initial concentration of injected cement grout particles in the current model. As shown in Figure 7a, the pore pressure decreases with decreasing water–cement ratio. The variation in the pore pressure is almost linear when the grout is relatively dilute. There is a notable breaking point in Figure 7b when the water–cement ratio is lower, expressing that the penetration length of the grout will decrease with decreasing water–cement ratio. The grout with lower water–cement ratio shows more severe filtration effects, which are also indicated by the results of porosities and permeabilities (see Figure 7c,d)

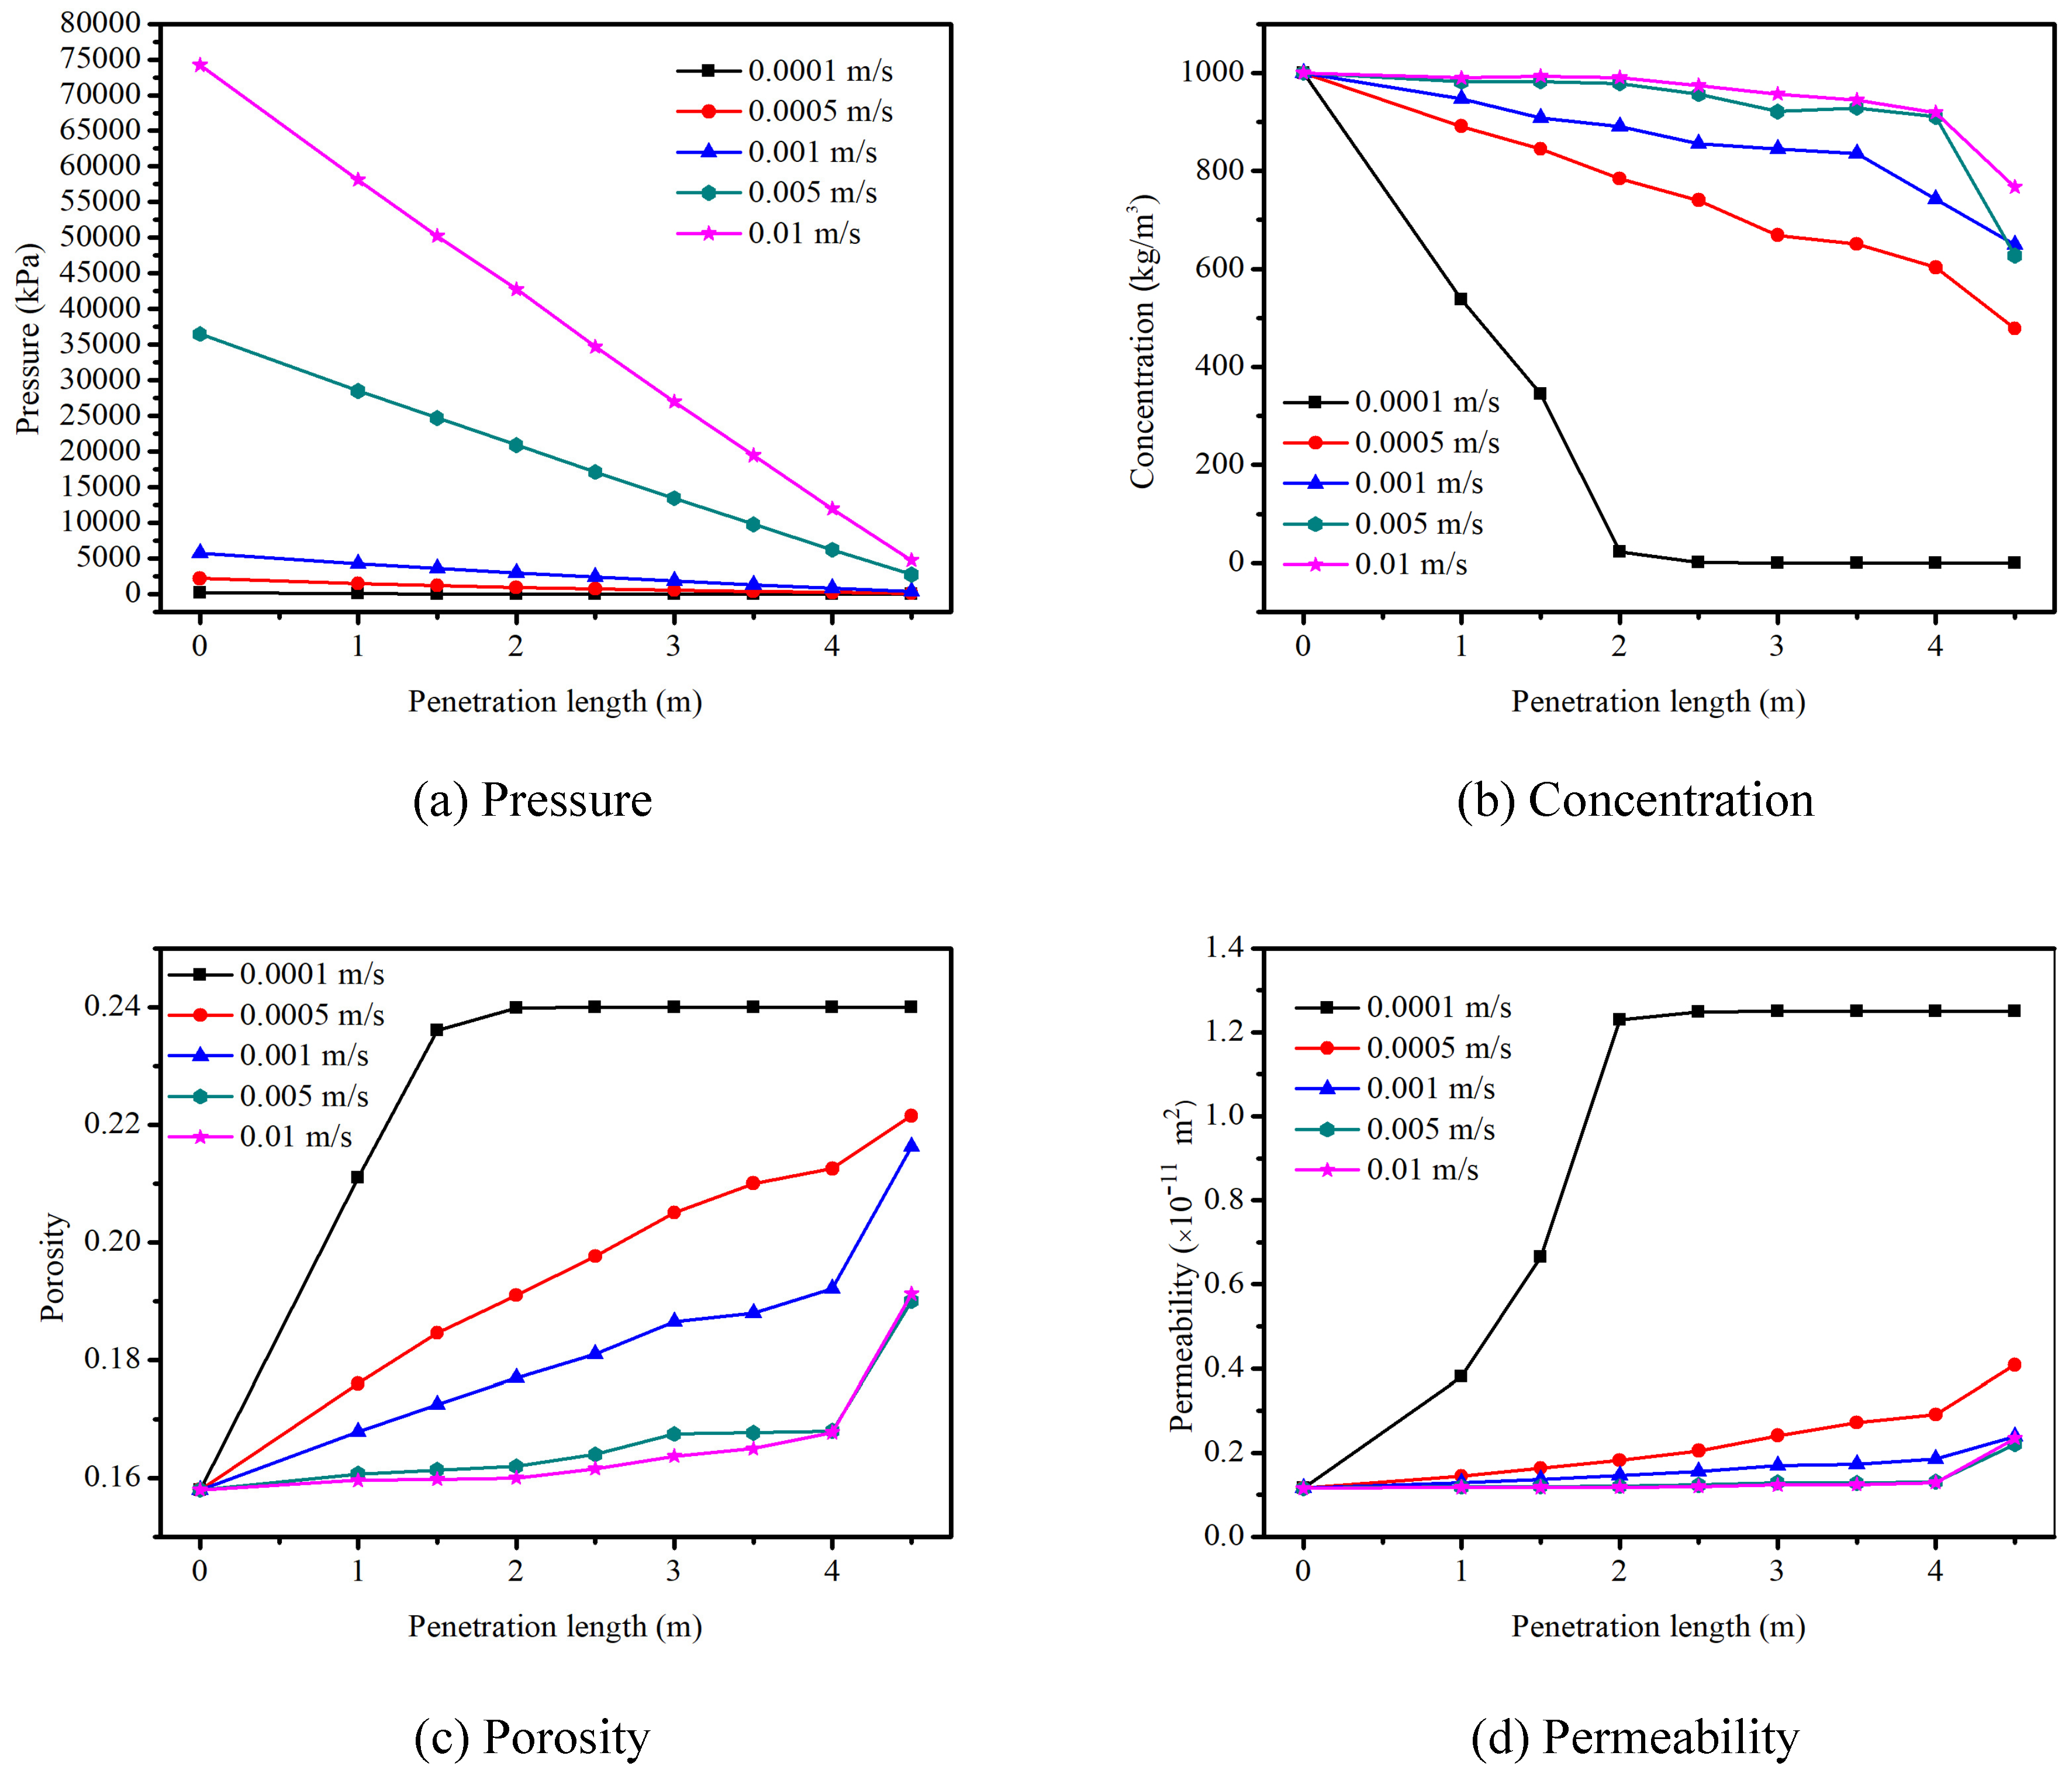
4.2.3. Effects of the Grout Injection Rate

In this simulation model, the grout is injected into the rock at a constant rate. The injection rate is chosen as 0.0001 , 0.0005 , 0.001 , 0.005 and 0.01 m/s. When the injection rate is constant, although filtration has occurred, the pore pressure decreases almost linearly with the penetration length (Figure 8a). In addition, the pressure drops quickly with increasing injection rate. Furthermore, a small variation in the rate produces a significantly large variation in the pressure. Figure 8b shows that the concentration decreases with decreasing injection velocity, and Figure 8c,d show that the porosity and permeability increases with decreasing injection velocity. These observations show that the cement particles can move a longer distance and form a plug over a larger region when the grout velocity is higher. In addition, when the injection rate is low, the filtration needs substantially more time to occur. Thus, increasing the injection velocity can increase the influence of the filtration.

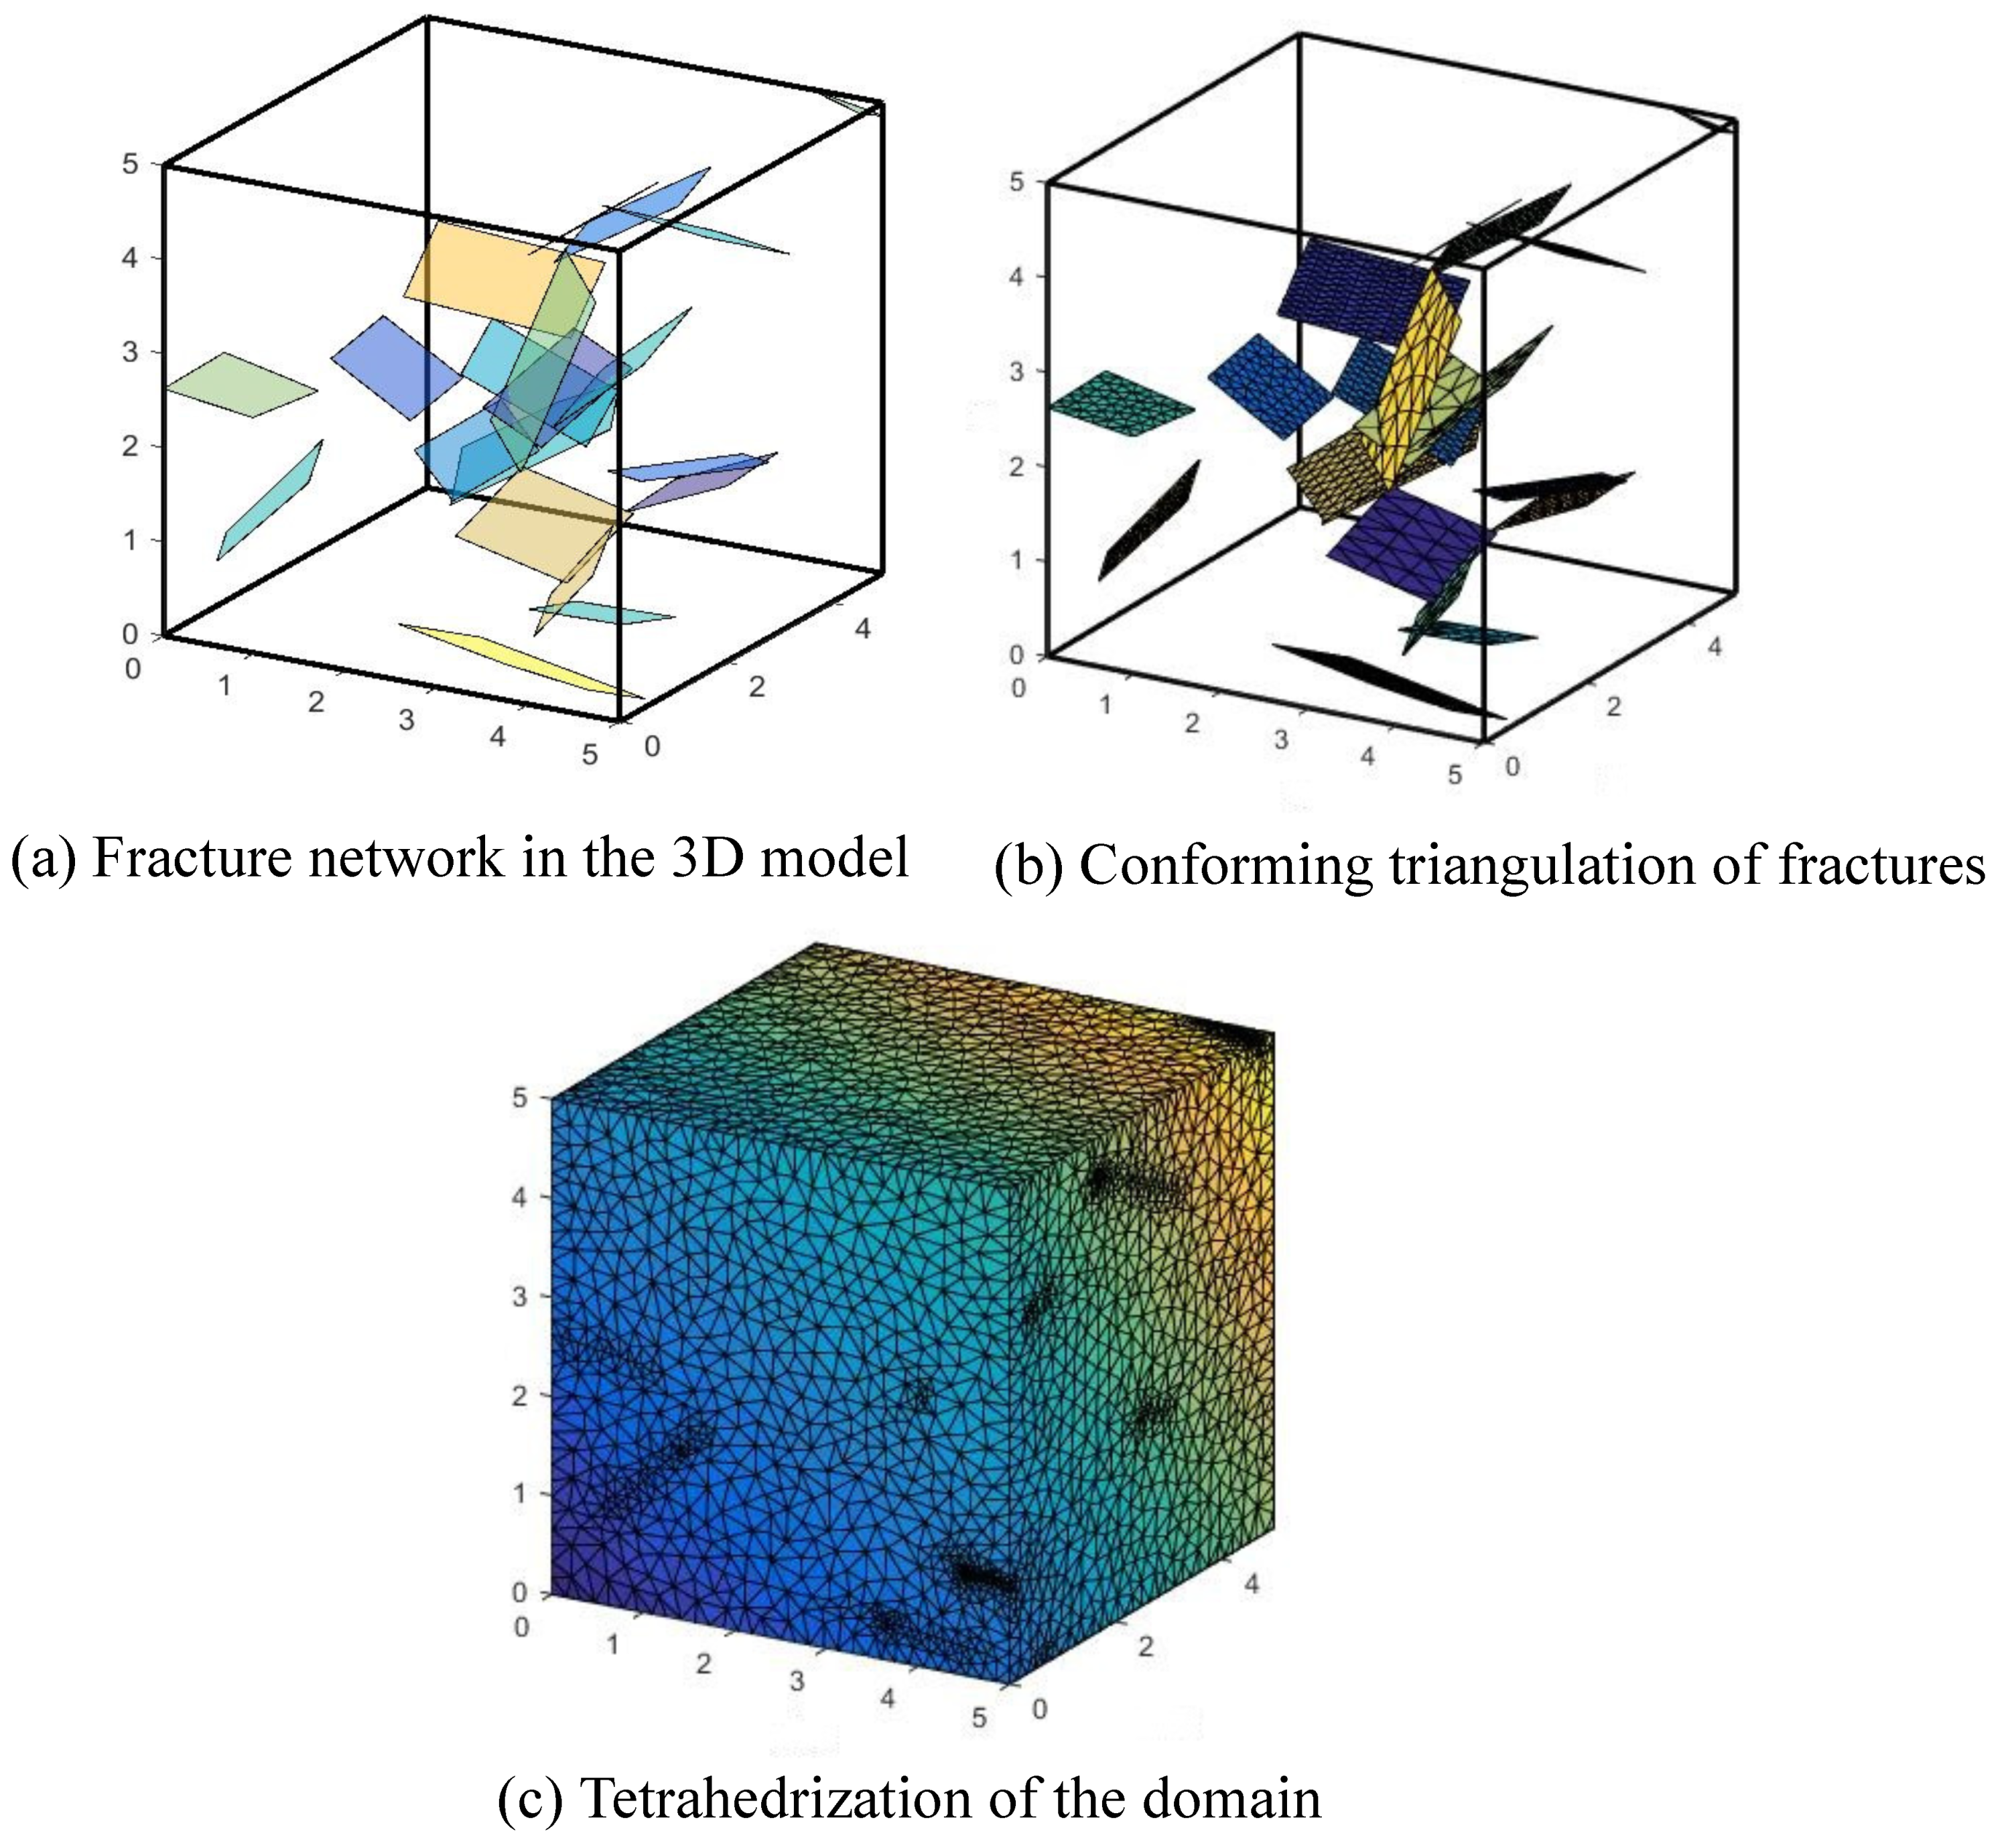
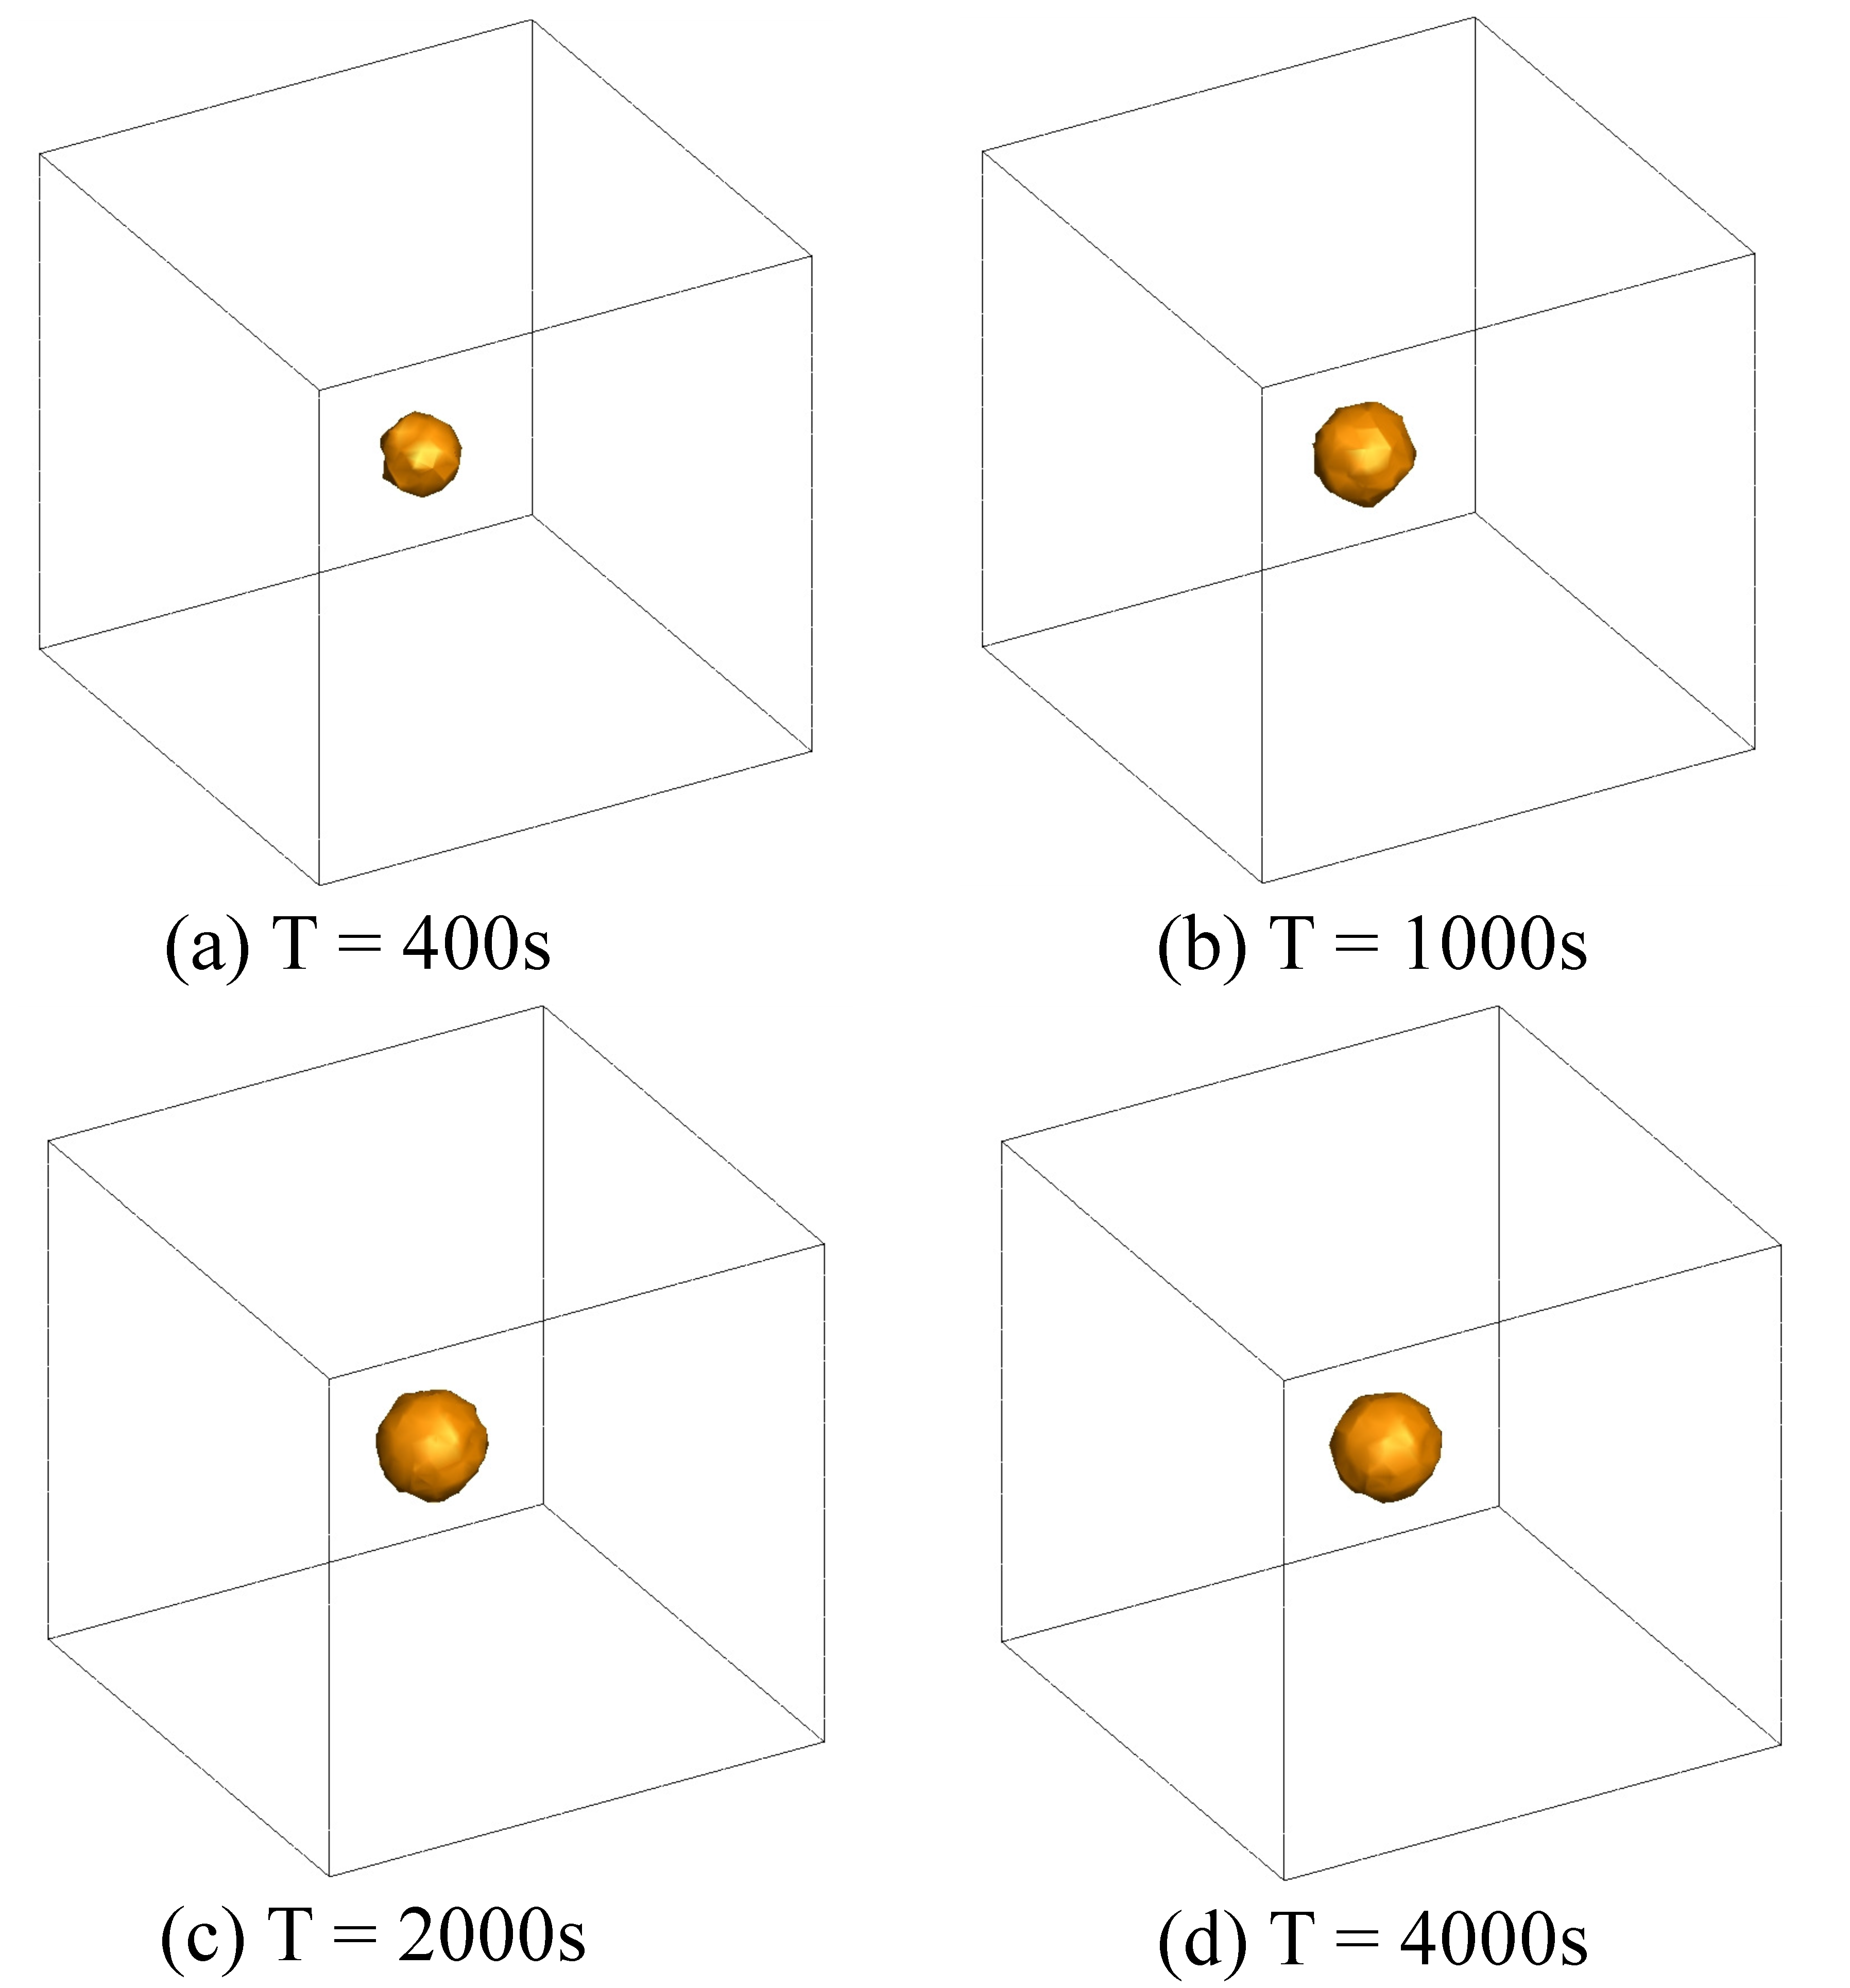
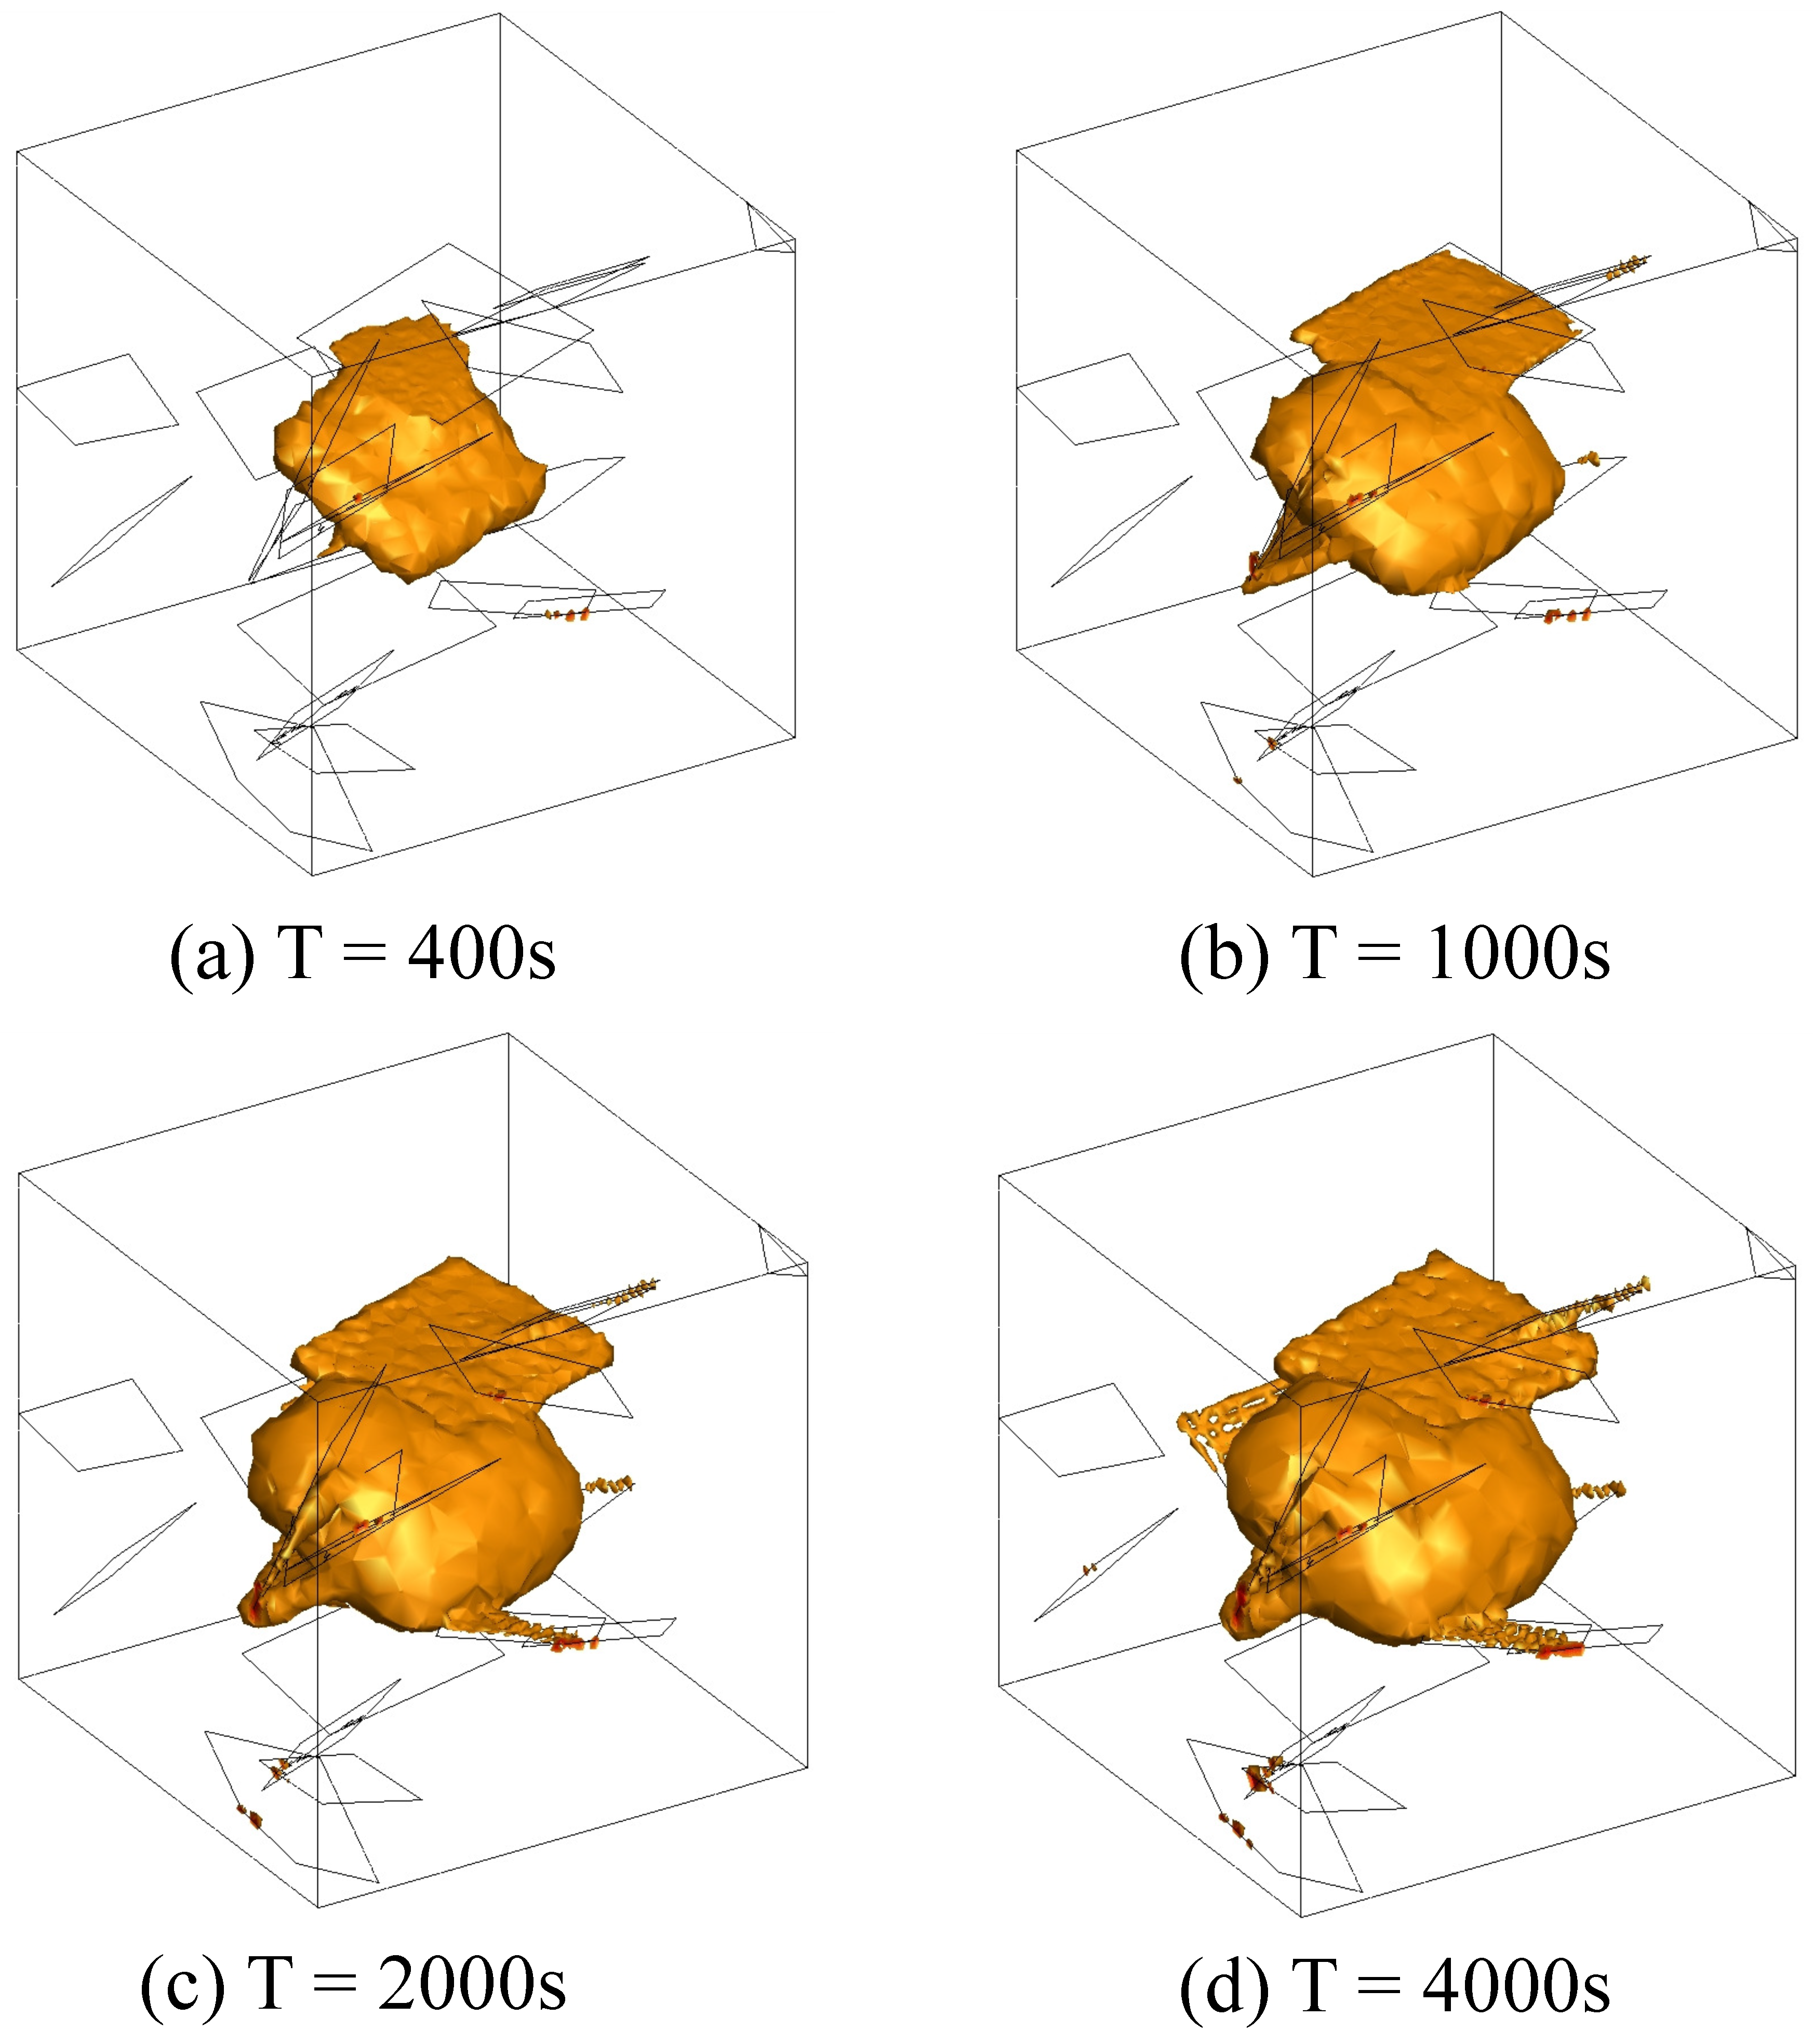
5. Filtration in 3D Fractured Rock

The physical and mechanical properties of the fractures are important geologic features, therein influencing the penetration and filtration of the grout. In this section, the physical parameters of the fracture are varied by changing the inclination angle ( α ), the dip direction ( β ) and the aperture. The effects of the physical properties of a fracture on the grout penetration considering filtration are tested and analyzed. Furthermore, the fracture network is generated, and the grout filtration process in a porous medium with a random distribution of fractures is simulated. When the cement particle concentration of grout is lower, the grout becomes relatively dilute and can be regarded as water. Thus, in the current model, the grout penetration range is described as the zone in which the concentration is greater than 450 kg/ m 3 .

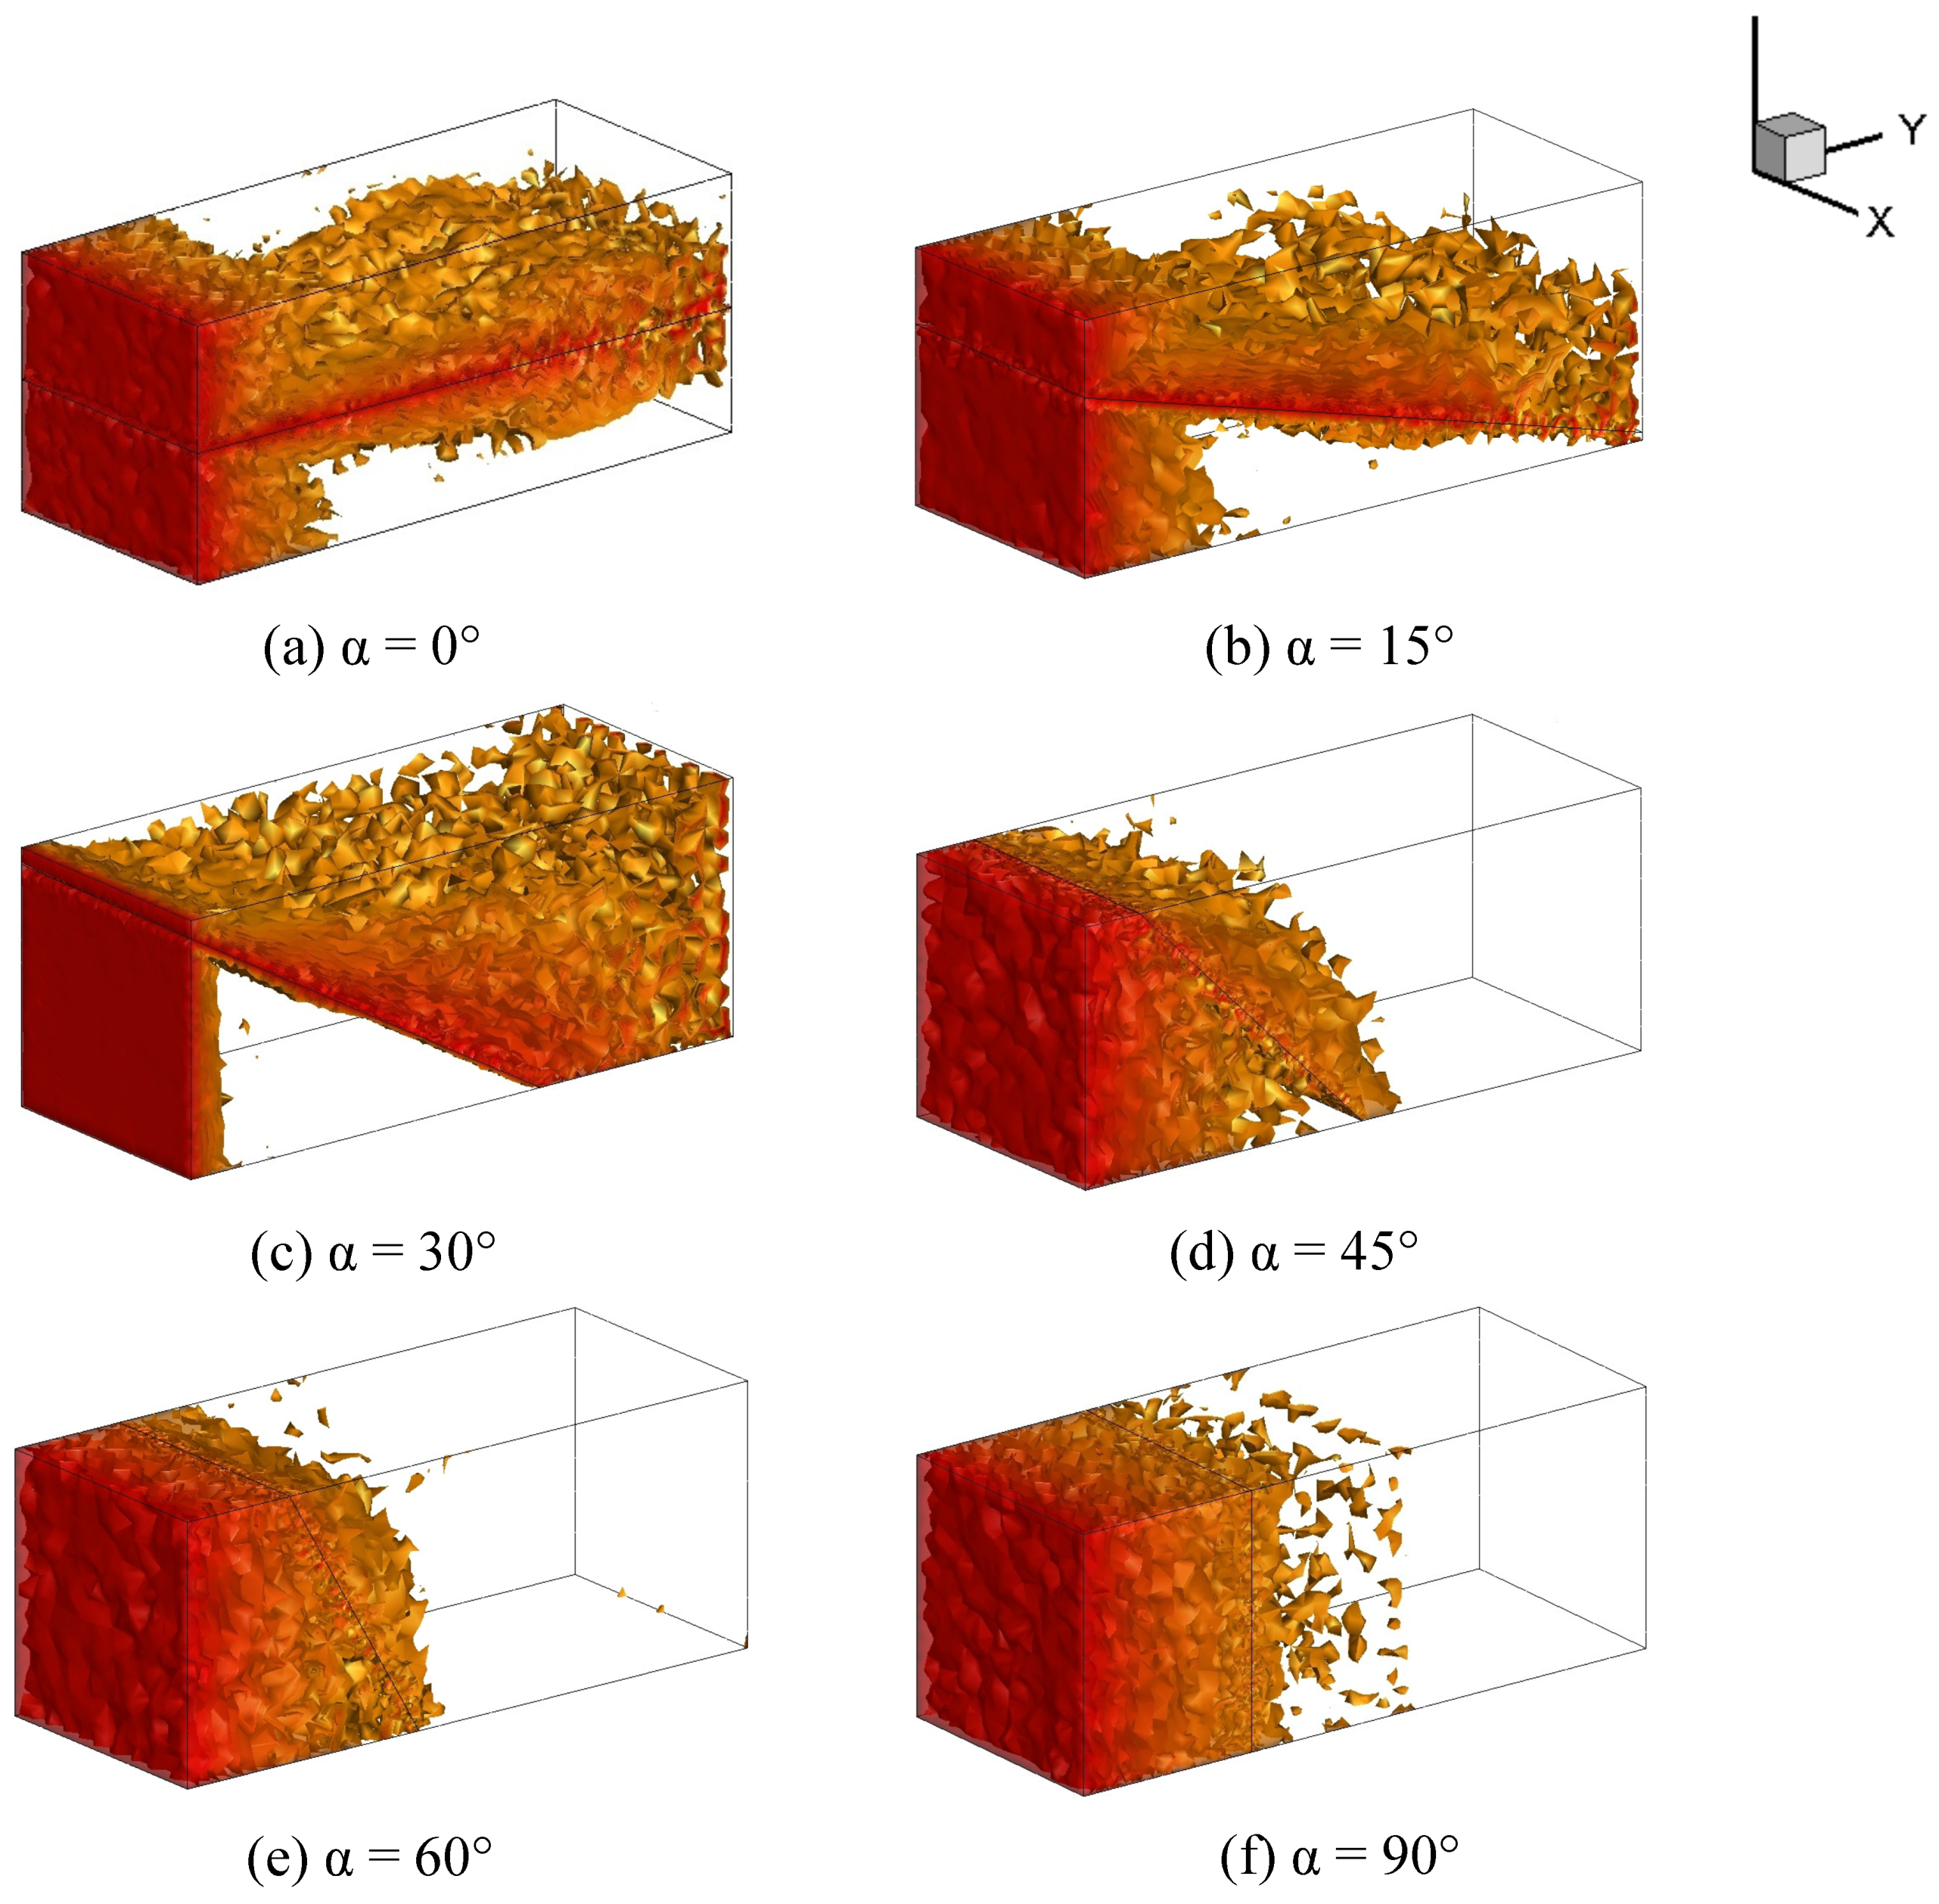
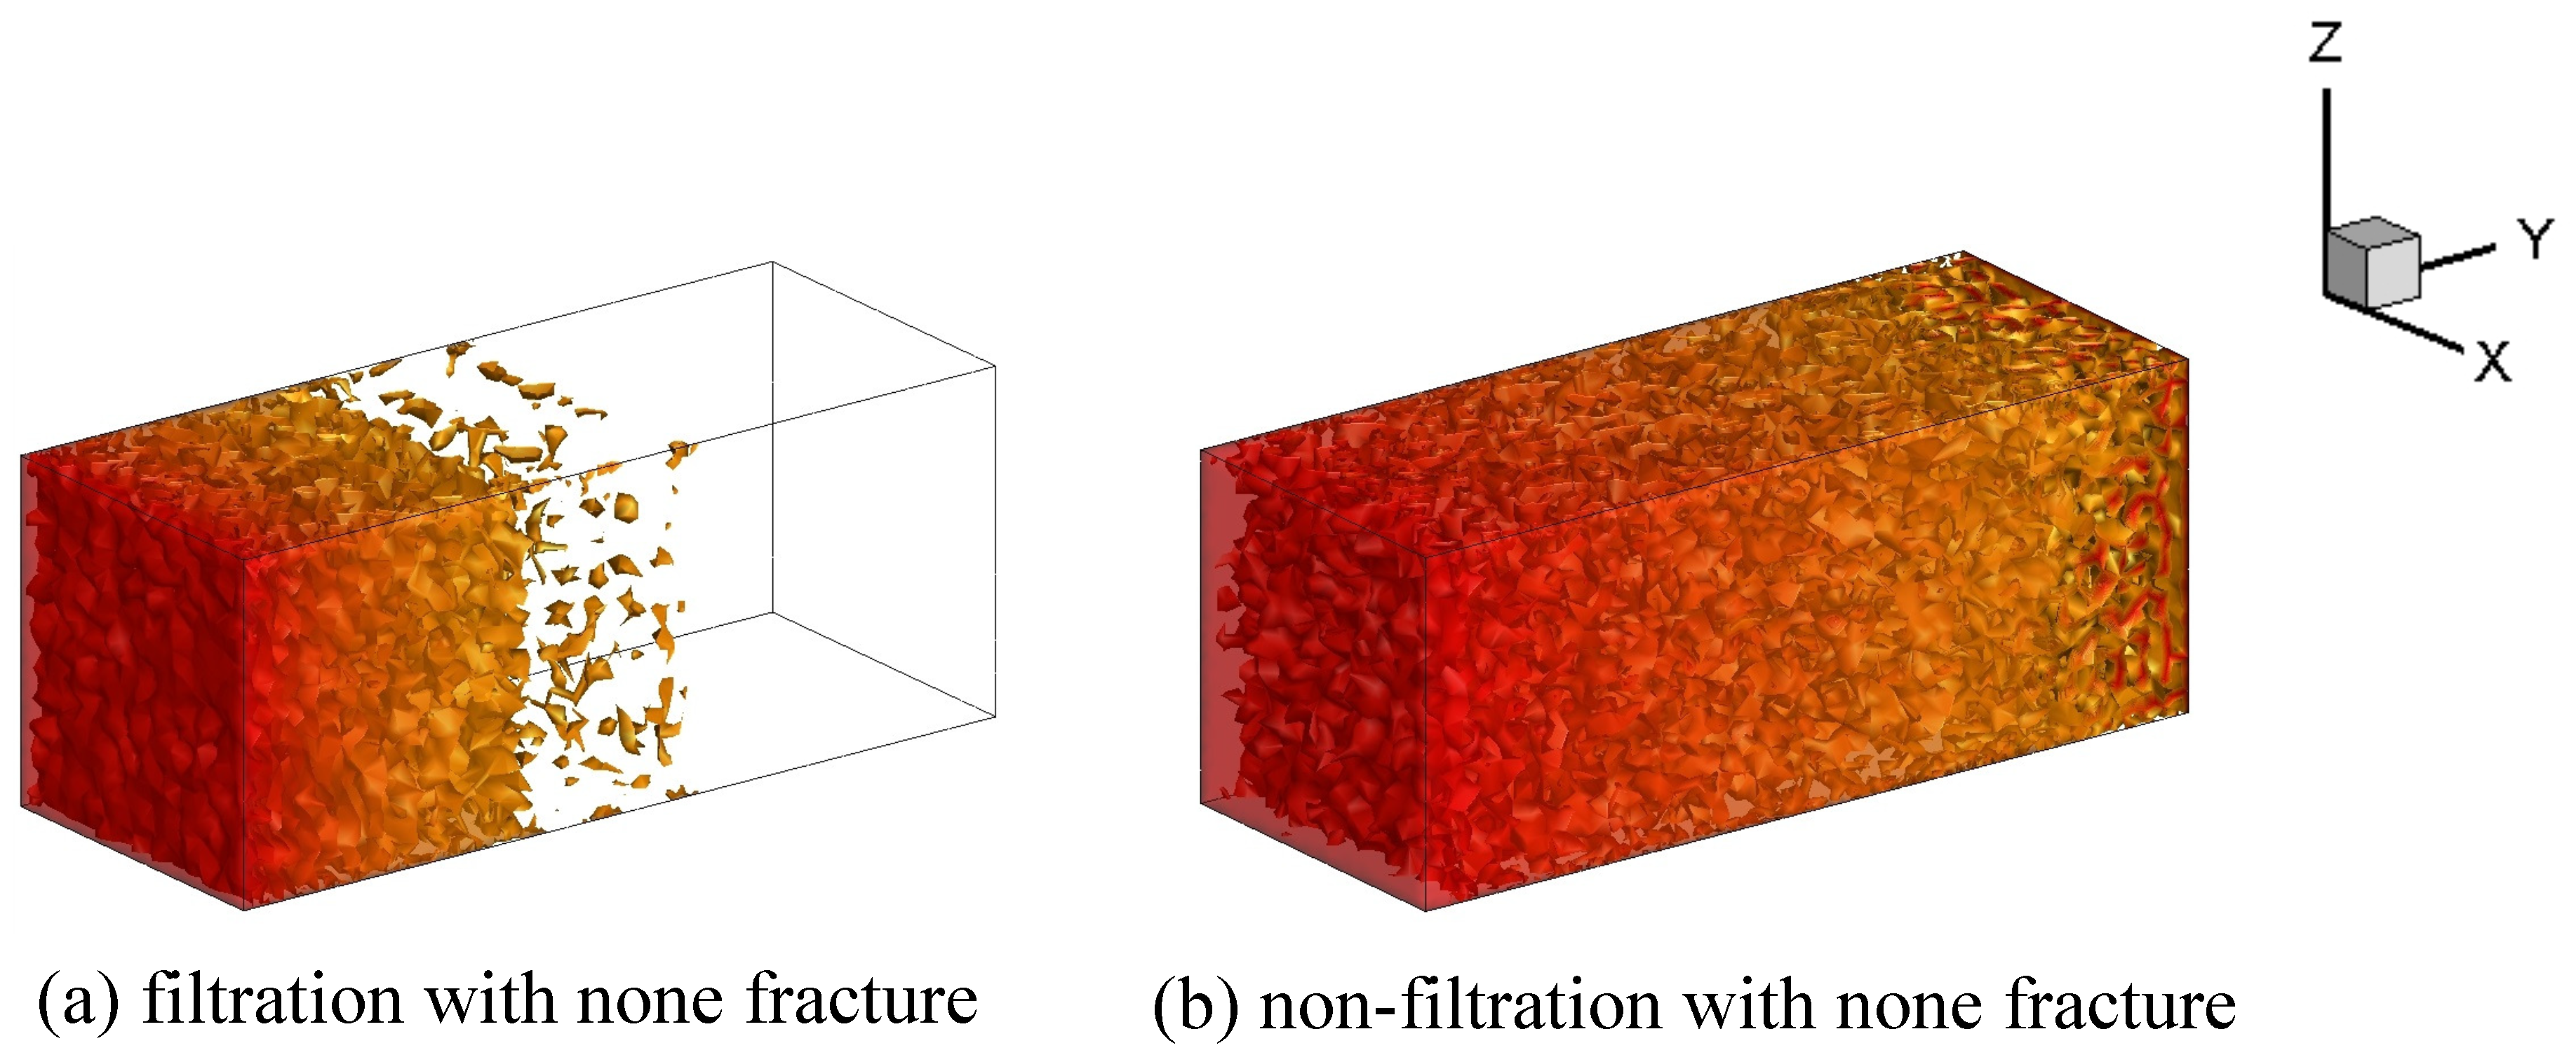
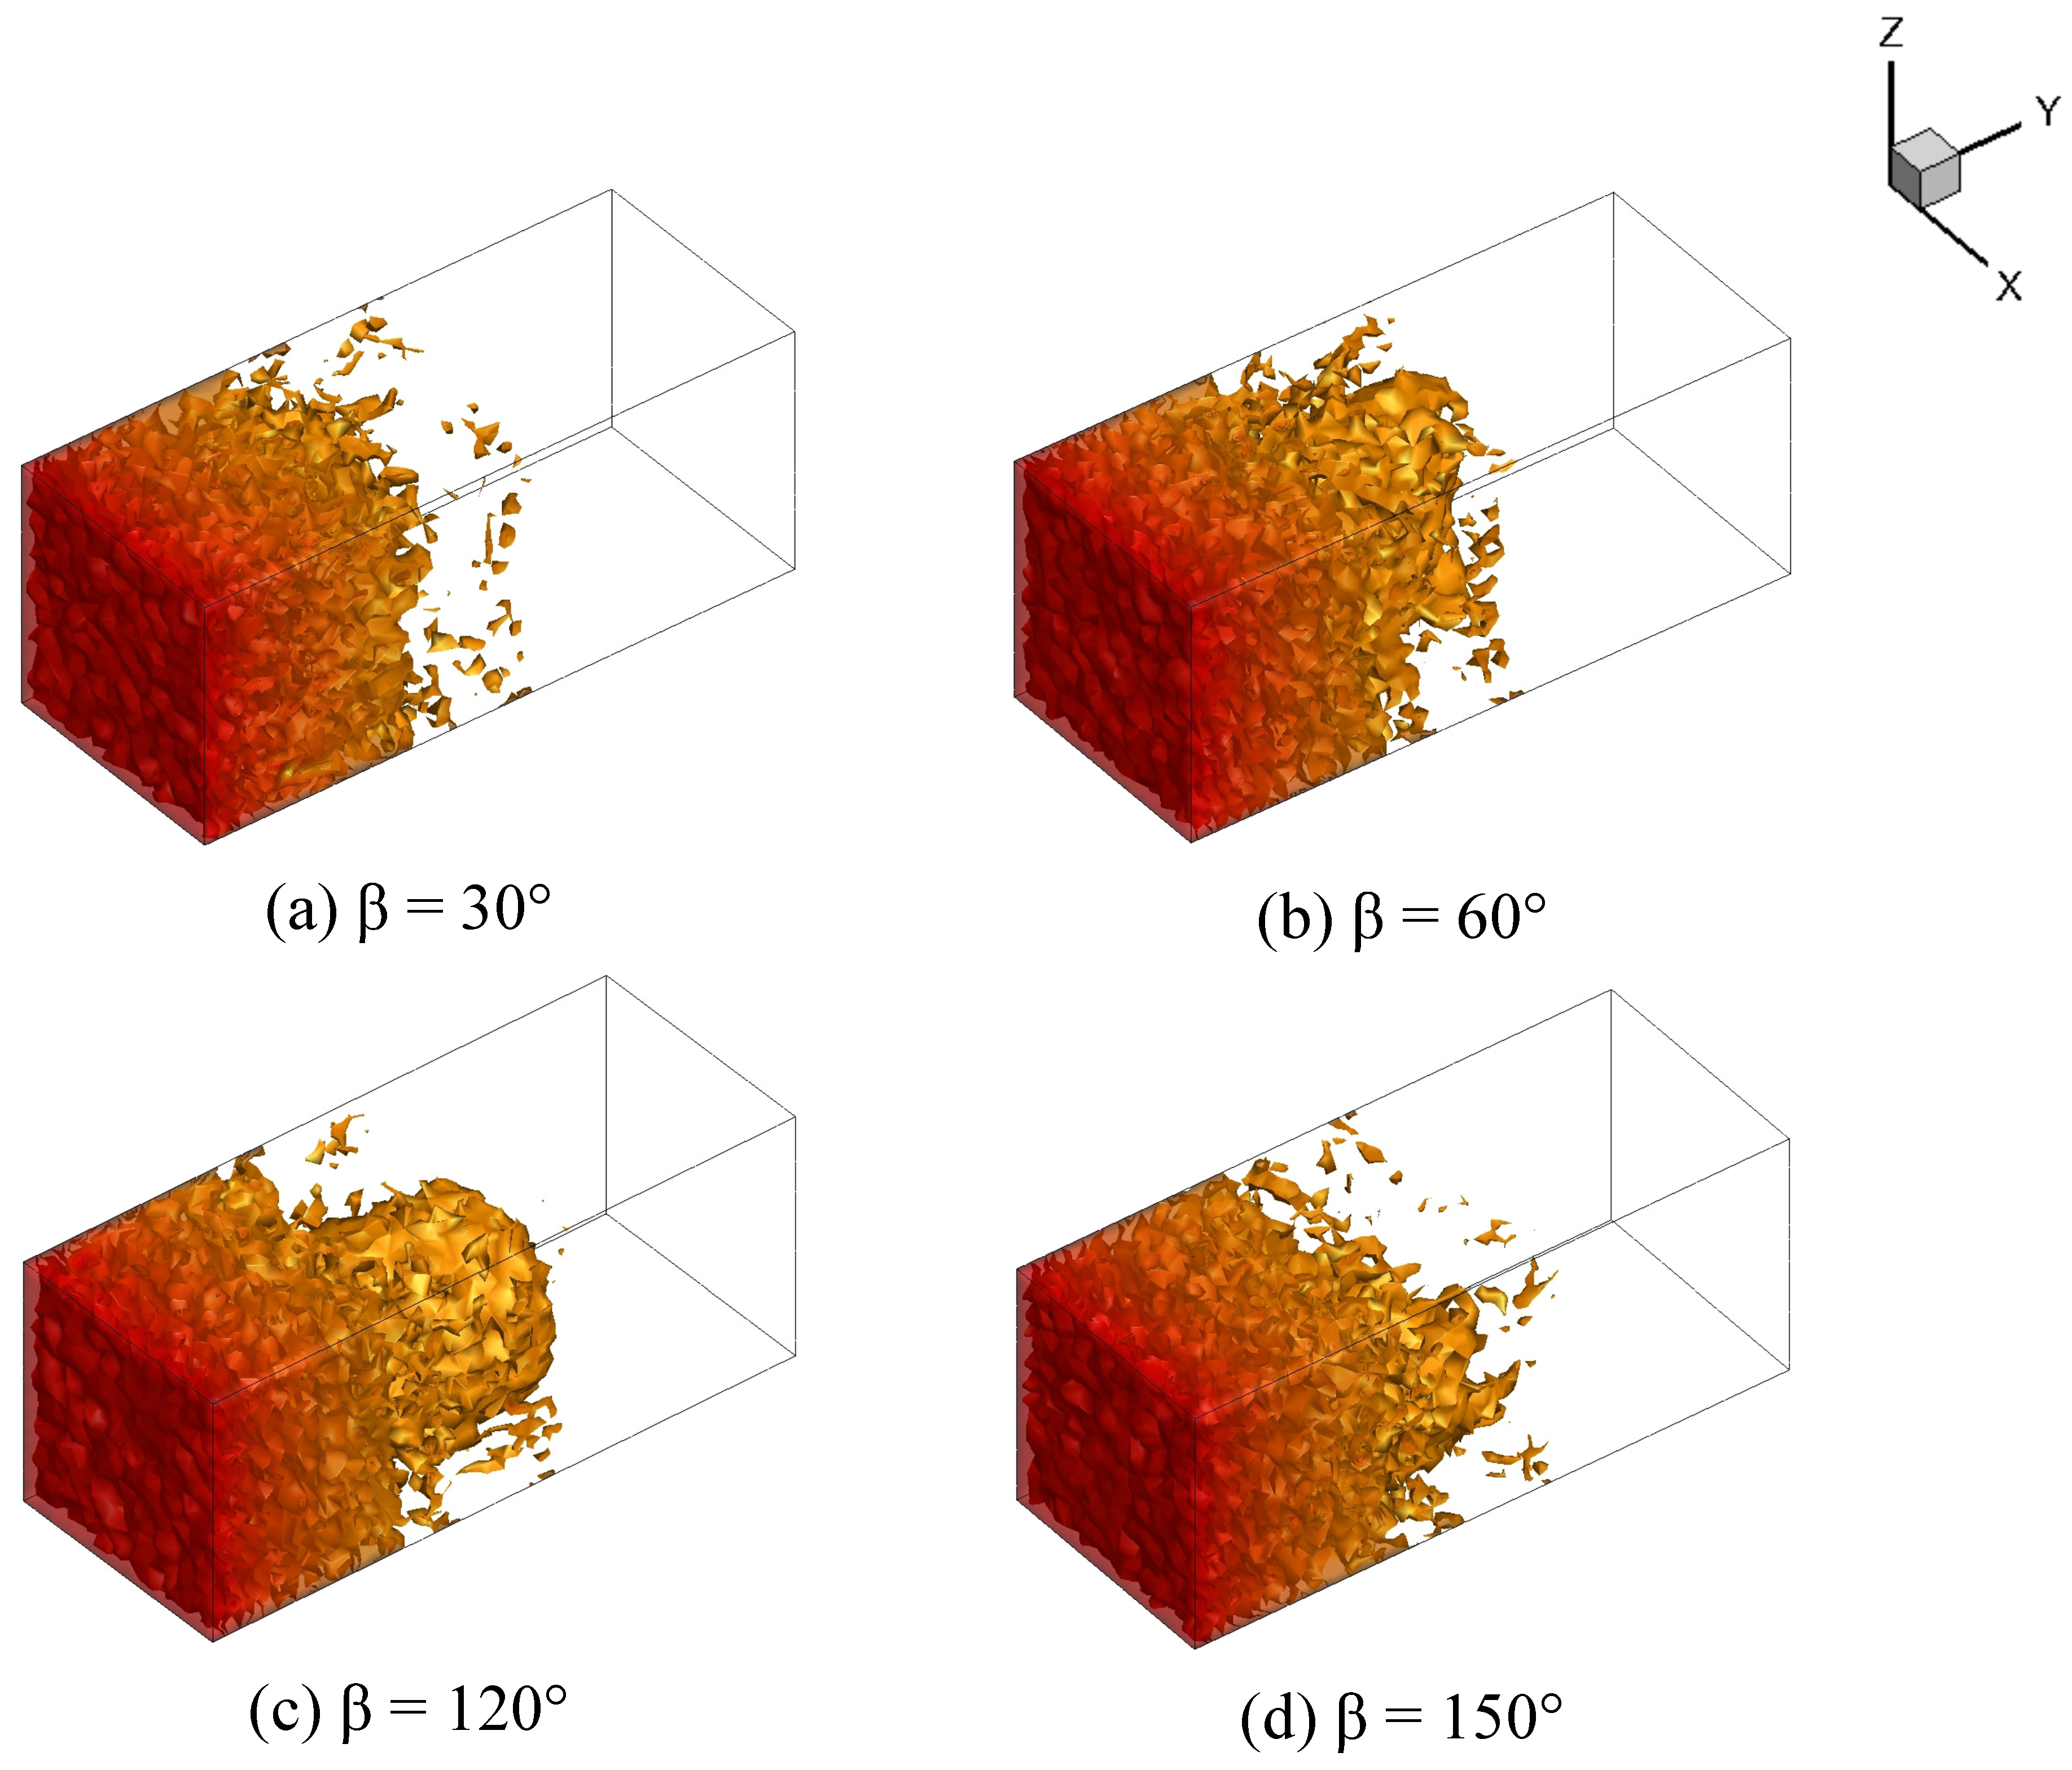
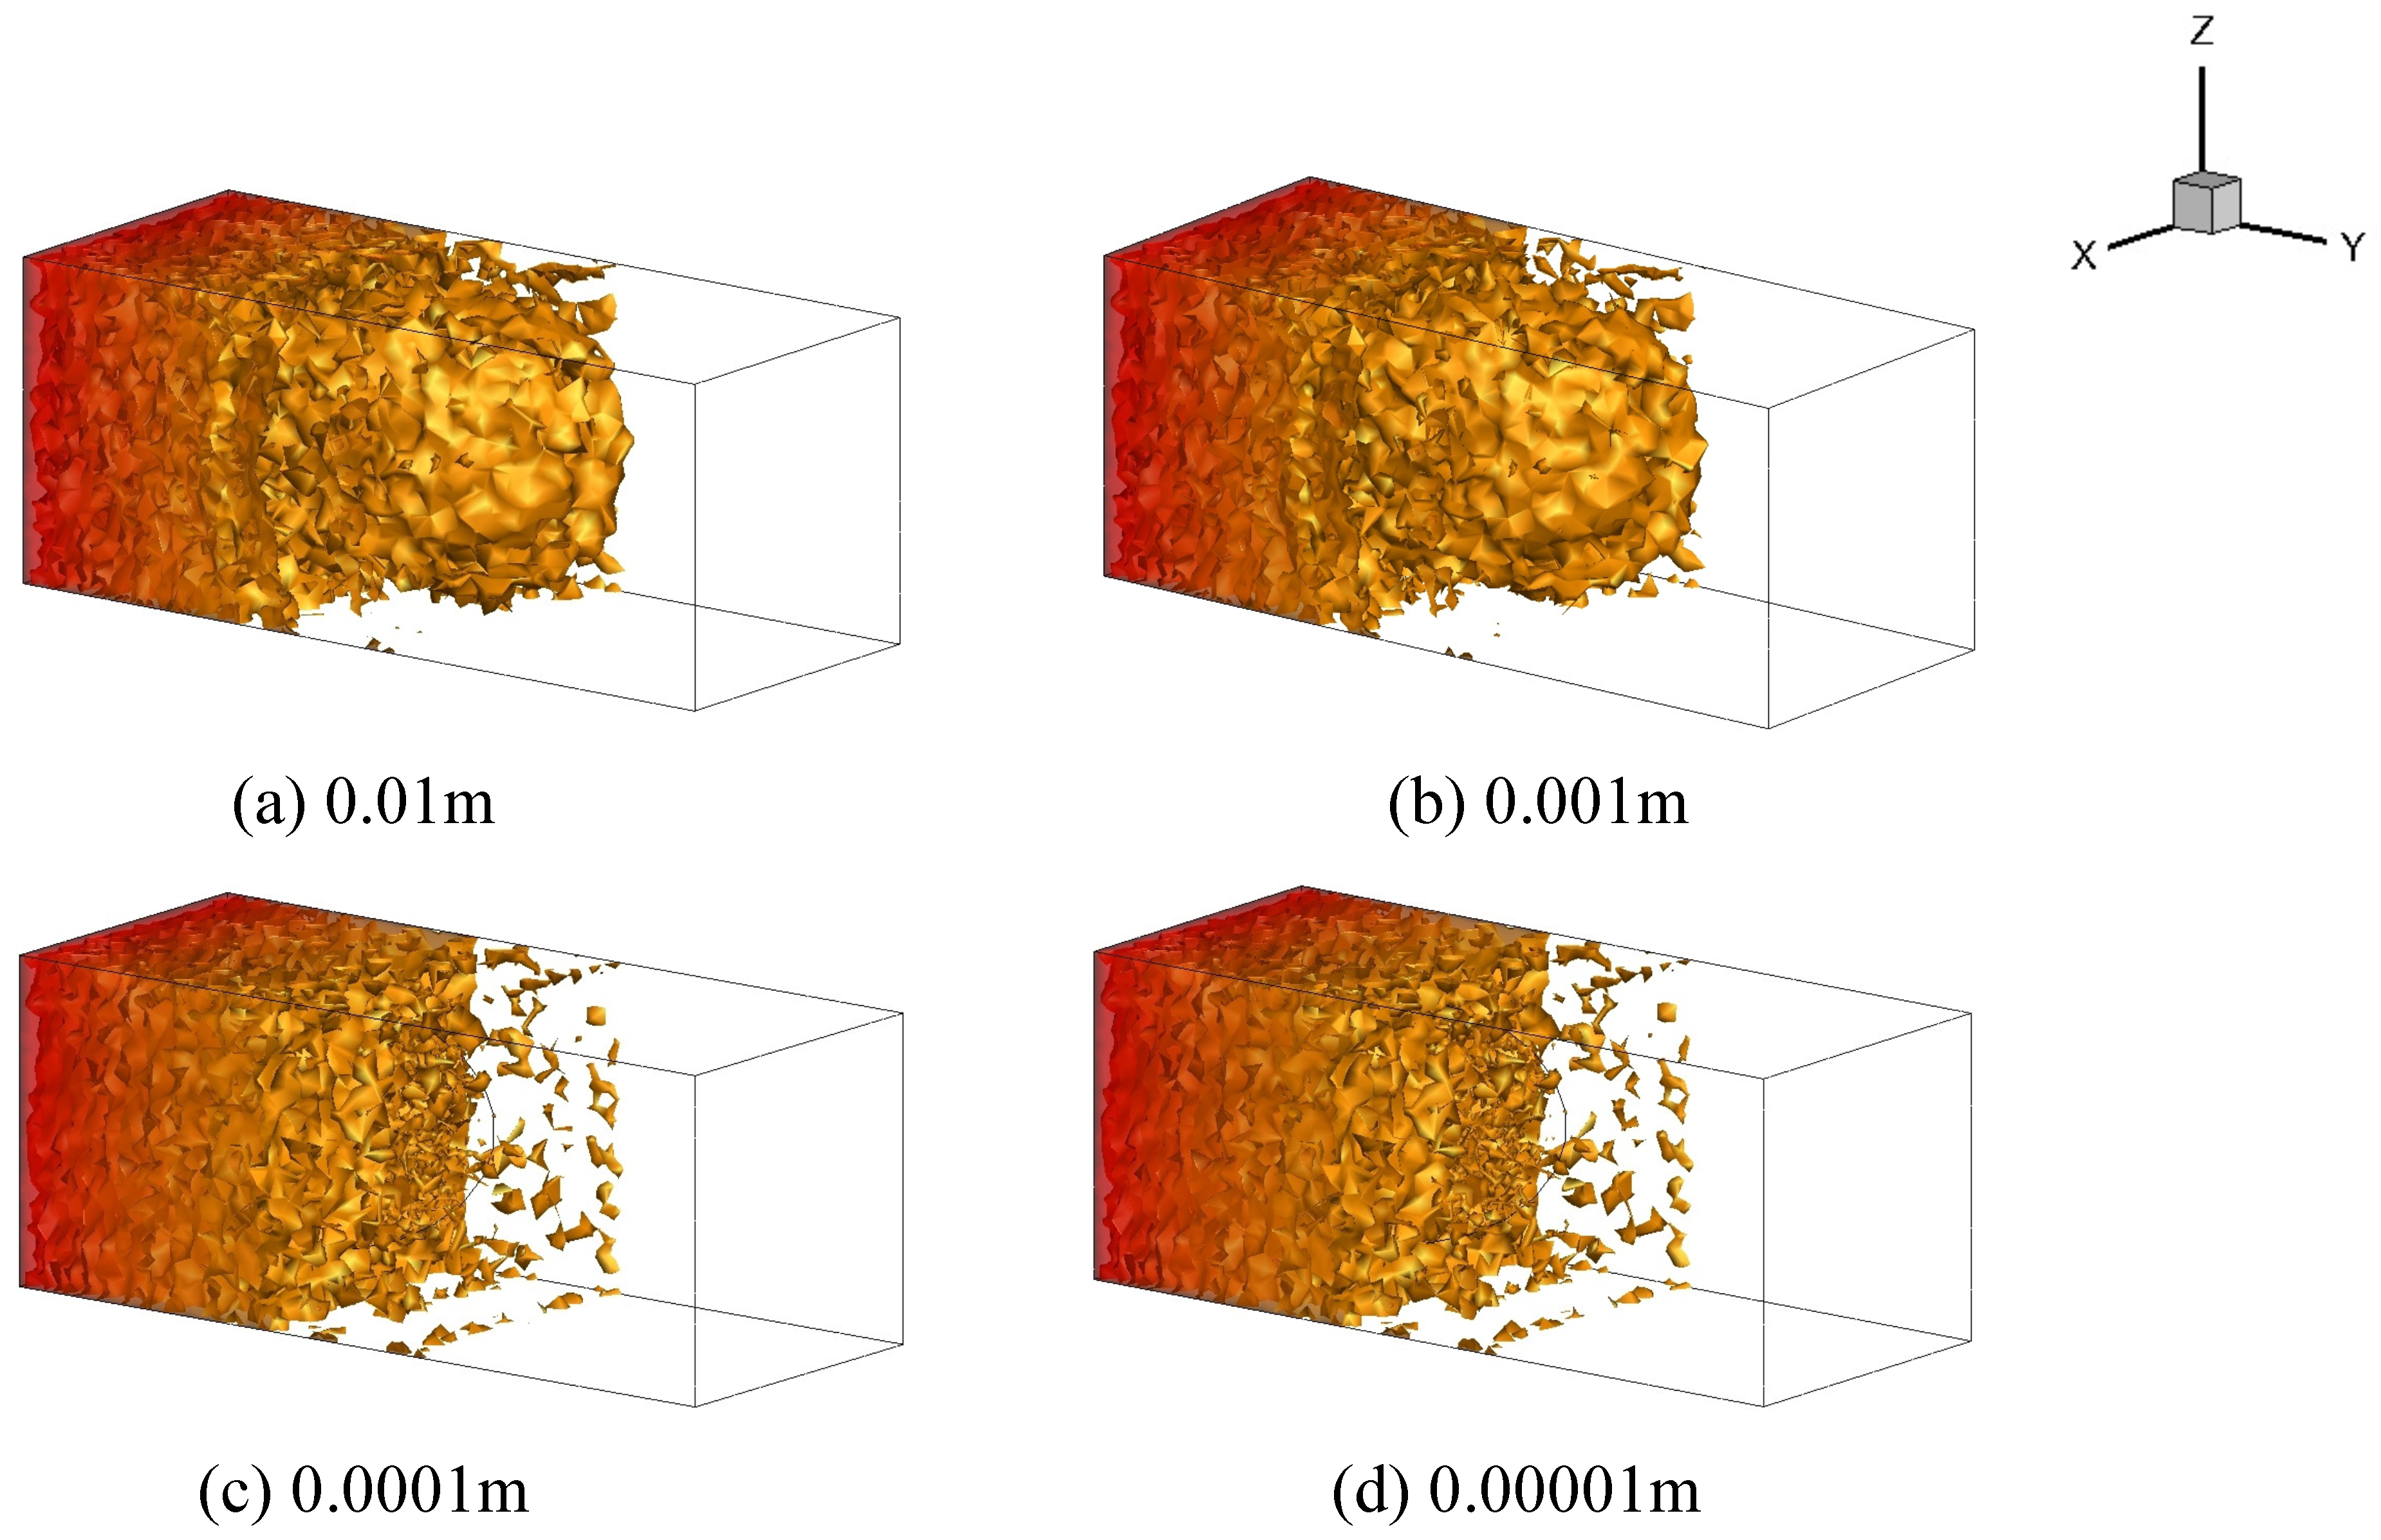
5.1. Effects of the Physical Properties of Fractures

In this simulation, the grout is injected into the rock with a constant injection pressure, and the parameters are as listed in Table 2. The simulation time is set as 4000 s.
The results of grout flow in a single fracture with different inclination angles are given in Figure 9. The fracture extends through the rock. The fracture inclination angle ( α ) varies from 0 to 15 , 30 , 45 , 60 and 90 . The dip direction of the fracture is 0 , and the aperture is 1 mm. As shown in Figure 9, the existence of a fracture has considerable influences on the filtration process. The grout flows mainly along the fracture, and it flows quickly when approaching the fracture because the conductance of the fracture is much larger than that of the matrix. The inclination angle of the fracture changes the region of grout penetration in the domain, and the distribution of cement particles in the voids changes. In contrast, the filtration effect is inconspicuous in the fracture, as the porosity and permeability of the fracture do not change with the cement concentration or time.
Figure 10 shows the grout penetration distance in the porous medium under two scenarios: (i) considering the filtration effects and (ii) ignoring the filtration effects. Comparing Figure 10a with Figure 10b, the filtration has an obvious and remarkable influence on the grout penetration length. Filtration will stop the grout from flowing, resulting in a maximum grout penetration distance. Figure 11 shows the grout penetration in a porous medium with a single fracture in different dip directions. The dip direction of the fracture is defined to be 30 , 45 , 60 and 75 . The inclination angle is 90 , and the aperture of the fracture is 1 mm. The trend characterizing the grout flow is similar to that in the fractures at different inclination angles. A fracture with a different dip direction will redirect the flow of grout.
The permeability of the fracture is related to the aperture of the fracture. Figure 12 shows the influence of the fracture aperture on the grout penetration. In this simulation, the inclination angle and dip direction of the fracture are 90 and 60 , respectively. The aperture of the fracture is varied from 0.01 mm to 0.1 mm, 1 mm and 10 mm. In the cases where the permeability of the fracture is substantially larger than that of the rock matrix, the grout flows quickly along the fracture and completely fills the fracture. The matrix pores along the fracture wall become completely clogged by the cement particles. The fracture with a large aperture acts as a path for grout flow, whereas the larger aperture cannot influence the final grout penetration region, as shown in Figure 12a,b because, although the grout penetration into a fracture with a larger aperture can spread quickly, the filtration process in the matrix porosity stops the grout from further penetrating. When the aperture of the fracture is small, the permeability of the fracture is almost the same or less than that of the rock matrix. The velocity of the grout penetration into the fracture is equal to that into the rock matrix; therefore, the fracture cannot redirect the flow of the grout (see Figure 12c,d). Hence, a fracture with a smaller aperture has a minimal effect on the grout filtration process.

5.2. Effects of the Fracture Network

The size, dip angle, shape and distribution of fractures in a rock mass are very complicated and diverse. In the current simulation model, a fracture network using a cube model with a size of 5 × 5 × 5 m is generated for exploring the grout penetration in a complicated fractured andporous rock. The aperture of the fracture is set as 0.1 mm. As shown in Figure 13a, two sets of fractures (with ten in each group) are generated randomly. The center coordinate of the fractures follows a normal distribution, and the widths and lengths of the rectangular fractures follow logarithmic distributions. The Fisher coefficient is 22. The randomly distributed parameters for the fracture geometries in this numerical model are listed in Table 3. All fractures are meshed with triangles (shown in Figure 13b), and the rock matrix is meshed with a tetrahedron (shown in Figure 13c) based on the conforming mesh techniques proposed by Wang [71].
The grout is injected into the rock mass with an injection borehole located in the center of the model. The grout flow is modeled and analyzed under conditions with and without fracture networks at a constant injection pressure. The boundary conditions for the top and bottom faces are n · P = 0 and n · C = 0 . The outlet boundaries are considered open boundaries. The pressure is defined as zero, and the concentration gradients are also defined as zero in the normal directions of these boundaries. The constant injection pressure (50 kPa) and the constant cement concentration (1000 kg/m 3 ) are set in the injection borehole.
Figure 14 and Figure 15 show the grout flow processes influenced by filtration at four time steps. As shown in Figure 14, in the case without fractures, the grout penetration into the matrix is uniform near the injection borehole and forms a spherical grout area because the distribution of the porosity is homogeneous. The grout flow spreads outward from the borehole with time. However, the grout flow almost stops after 2000 s, as it is affected by filtration. When fractures exist in the domain, the range of the grout penetration and the grout direction change significantly, as shown in Figure 15. In the case with fractures, the grout initially penetrates along the fractures upon reaching them, and the grout spread speed is higher in the fractures than in the rock matrix. The grout fills the entire fracture and then flows along the direction of the fracture walls. The grout flow in the matrix stops when the calculation time exceeds 2000 s, while it continues to penetrate into nearby fractures (see Figure 15c,d). The fracture is less influenced by filtration. Thus, a larger pressure or more injection boreholes are needed for the grout to reach the expected point in such a domain.

6. Conclusions

In this study, we propose a numerical 3D UPM to simulate grout flow in fractured and porous rocks considering the effects of filtration. A two-phase model is used for the grout flow. A hyperbolic function is used to determine the relationship between the porosity and permeability that is consistent with experimental results [19]. The proposed model is validated by comparing the numerically obtained results with the experimental results. Then, sensitivity analyses in consideration of the injection pressure, the water–cement ratio of the grout and the injection rate are conducted, thereby demonstrating the reliability of the proposed numerical method. Finally, the influences of the inclination angle, the dip direction, the aperture of the fracture and the complex fracture network on the filtration process are analyzed.
The simulation results indicate that filtration will stop the grout from penetrating farther into the porous and fractured medium. A high grouting pressure, a high water–cement ratio and a high grout injection rate can each increase the retention of cement particles while prolonging the penetration process. Furthermore, the existence of fractures in the domain has considerable influences on the grout flow. The inclination angle and dip direction of the fracture can redirect the flow of the grout and the grout penetration region can change because the permeability of the fracture is much larger than that of the rock matrix; thus, the grout flows quickly along the fracture and completely fills the fracture. When the grout flows into a randomly distributed fracture network, the fractures play a prominent role and influence the flow path of the grout. Although the grout stops penetrating into the rock matrix, it continues spreading into the fractures near it and extends along the fracture edges.

Author Contributions

Conceptualization, G.M. and Z.S.; Methodology, Z.S., X.Y. and Y.Z.; Software, Z.S. and X.Y.; Validation, Z.S. and X.Y.; Formal Analysis, Z.S., X.Y. and W.H.; Investigation, Z.S.; Resources, G.M.; Data Curation, Z.S. and X.Y.; Writing—Original Draft Preparation, X.Y., Z.S. and W.H.; Writing—Review and Editing, Z.S., W.H. and Y.Z.; Visualization, X.Y.; Supervision, G.M.; Project Administration, G.M.; Funding Acquisition, G.M.

Funding

The authors gratefully acknowledge the financial support offered by NSFC 51809069 and Hebei key research and development program 18216110D.

Conflicts of Interest

The authors declare no conflict of interest.

Abbreviations

The following abbreviations are used in this manuscript:
UPMUnified Pipe network Method

References

  1. Arenzana, L.; Krizek, R.; Pepper, S. Injection of dilute microfine cement suspensions into fine sands. In Proceedings of the 12th International Conference on Soil Mechanics and Foundation Engineering, Rio de Janeiro, Brazil, 13–18 August 1989. [Google Scholar]
  2. Eriksson, M. Grouting field experiment at the äspö hard rock laboratory. Tunnel. Undergr. Space Technol. 2002, 17, 287–293. [Google Scholar] [CrossRef]
  3. Lees, E.L.D.; Naudts, A. New developments in permeation grouting: Design and evaluation. Concr. Int. 2000, 22, 47–52. [Google Scholar]
  4. Nikbakhtan, B.; Osanloo, M. Effect of grout pressure and grout flow on soil physical and mechanical properties in jet grouting operations. Int. J. Rock Mech. Min. Sci. 2009, 46, 498–505. [Google Scholar] [CrossRef]
  5. Ding, W.; Duan, C.; Zhu, Y.; Zhao, T.; Huang, D.; Li, P. The behavior of synchronous grouting in a quasi-rectangular shield tunnel based on a large visualized model test. Tunnel. Undergr. Space Technol. 2019, 83, 409–424. [Google Scholar] [CrossRef]
  6. Axelsson, M.; Gustafson, G. The penetracone, a new robust field measurement device for determining the penetrability of cementitious grouts. Tunnel. Undergr. Space Technol. 2010, 25, 1–8. [Google Scholar] [CrossRef]
  7. Zebovitz, S.; Krizek, R.; Atmatzidis, D. Injection of fine sands with very fine cement grout. J. Geotechn. Eng. 1989, 115, 1717–1733. [Google Scholar] [CrossRef]
  8. McDowell-Boyer, L.M.; Hunt, J.R.; Sitar, N. Particle transport through porous media. Water Resour. Res. 1986, 22, 1901–1921. [Google Scholar] [CrossRef]
  9. Sharma, M.; Yortsos, Y. Transport of particulate suspensions in porous media: model formulation. AIChE J. 1987, 33, 1636–1643. [Google Scholar] [CrossRef]
  10. Kim, Y.S.; Whittle, A.J. Filtration in a porous granular medium: 1. Simulation of pore-scale particle deposition and clogging. Transp. Porous Med. 2006, 65, 53–87. [Google Scholar] [CrossRef]
  11. Axelsson, M.; Gustafson, G.; Fransson, A. Stop mechanism for cementitious grouts at different water-to-cement ratios. Tunnel. Undergr. Space Technol. 2009, 24, 390–397. [Google Scholar] [CrossRef]
  12. Hwang, H.; Yoon, J.; Rugg, D.; El Mohtar, C. Hydraulic conductivity of bentonite grouted sand. In Geo-Frontiers 2011: Advances in Geotechnical Engineering; American Society of Civil Engineers: Reston, VA, USA, 2011; pp. 1372–1381. [Google Scholar]
  13. Eriksson, M.; Stille, H.; Andersson, J. Numerical calculations for prediction of grout spread with account for filtration and varying aperture. Tunnel. Undergr. Space Technol. 2000, 15, 353–364. [Google Scholar] [CrossRef]
  14. Abichou, T.; Benson, C.H.; Edil, T.B. Micro-structure and hydraulic conductivity of simulated sand-bentonite mixtures. Clays Clay Min. 2002, 50, 537–545. [Google Scholar] [CrossRef]
  15. Dupla, J.-C.; Canou, J.; Gouvenot, D. An advanced experimental set-up for studying a monodirectional grout injection process. Proc. Inst. Civ. Eng.-Ground Improv. 2004, 8, 91–99. [Google Scholar] [CrossRef]
  16. Draganović, A.; Stille, H. Filtration and penetrability of cement-based grout: Study performed with a short slot. Tunnel. Undergr. Space Technol. 2011, 26, 548–559. [Google Scholar] [CrossRef]
  17. Eriksson, M.; Stille, H. A Method for Measuring and Evaluating the Penetrability of Grouts. In Proceedings of the Third International Conference on Grouting and Ground Treatment, New Orleans, LA, USA, 10–12 February 2003; pp. 1326–1337. [Google Scholar]
  18. Bouchelaghem, F.; Vulliet, L.; Leroy, D.; Laloui, L.; Descoeudres, F. Mathematical and numerical filtration-advection-dispersion model of miscible grout propagation in saturated porous media. Int. J. Numer. Anal. Methods Geomech. 2001, 25, 1195–1227. [Google Scholar] [CrossRef]
  19. Saada, Z.; Canou, J.; Dormieux, L.; Dupla, J.; Maghous, S. Modelling of cement suspension flow in granular porous media. Int. J. Numer. Anal. Methods Geomech. 2005, 29, 691–711. [Google Scholar] [CrossRef]
  20. Yoneda, S.; Okabayashi, S.; Baba, O.; Tamura, M.; Mori, A. Permeating properties of ultra-fine cement grout. In Grouting and Deep Mixing; Balkema: Rotterdam, The Netherlands, 1996; pp. 107–113. [Google Scholar]
  21. Choo, C.-U.; Tien, C. Analysis of the transient behavior of deep-bed filtration. J. Colloid Interface Sci. 1995, 169, 13–33. [Google Scholar] [CrossRef]
  22. Herzig, J.; Leclerc, D.; Goff, P.L. Flow of suspensions through porous media-application to deep filtration. Ind. Eng. Chem. 1970, 62, 8–35. [Google Scholar] [CrossRef]
  23. Chupin, O.; Saiyouri, N.; Hicher, P.-Y. Modeling of a semi-real injection test in sand. Comput. Geotech. 2009, 36, 1039–1048. [Google Scholar] [CrossRef]
  24. Rege, S.; Fogler, H. A Network Model for Deep Bed Filtration of Solids And Emulsions; Tech. Rep.; American Institute of Chemical Engineers: New York, NY, USA, 1988. [Google Scholar]
  25. Tarafdar, S.; Dey, A.; Gupta, B.S. A multiple state stochastic model for deep-bed filtration. Chem. Eng. Technol. Ind. Chem.-Plant Equip.-Process Eng.-Biotechnol. 1992, 15, 44–50. [Google Scholar] [CrossRef]
  26. Ghidaglia, C.; de Arcangelis, L.; Hinch, J.; Guazzelli, E. Transition in particle capture in deep bed filtration. Phys. Rev. E 1996, 53, R3028. [Google Scholar] [CrossRef]
  27. Nikiforov, A.; Nikanshin, D. Simulation of transfer of solid particles by a filtration flow. J. Eng. Phys. Thermophys. 1998, 71, 933–938. [Google Scholar] [CrossRef]
  28. Lee, J.; Koplik, J. Network model for deep bed filtration. Phys. Fluids 2001, 13, 1076–1086. [Google Scholar] [CrossRef]
  29. Liu, R.; Li, B.; Jiang, Y.; Jing, H.; Yu, L. Relationship between equivalent permeability and fractal dimension of dual-porosity media subjected to fluid–rock reaction under triaxial stresses. Fractals 2018, 26, 1850072. [Google Scholar] [CrossRef]
  30. Liu, R.; Li, B.; Yu, L.; Jiang, Y.; Jing, H. A discrete-fracture-network fault model revealing permeability and aperture evolutions of a fault after earthquakes. Int. J. Rock Mech. Min. Sci. 2018, 107, 19–24. [Google Scholar] [CrossRef]
  31. Maghous, S.; Saada, Z.; Dormieux, L.; Canou, J.; Dupla, J. A model for in situ grouting with account for particle filtration. Comput. Geotech. 2007, 34, 164–174. [Google Scholar] [CrossRef]
  32. Bouchelaghem, F. Multi-scale modelling of the permeability evolution of fine sands during cement suspension grouting with filtration. Comput. Geotech. 2009, 36, 1058–1071. [Google Scholar] [CrossRef]
  33. Eriksson, M. Prediction of Grout Spread and Sealing Effect. Ph.D. Thesis, KTH Byggvetenskap, Stockholm, Switzerland, 2002. [Google Scholar]
  34. Areias, P.M.; Song, J.; Belytschko, T. Analysis of fracture in thin shells by overlapping paired elements. Comput. Methods Appl. Mech. Eng. 2006, 195, 5343–5360. [Google Scholar] [CrossRef]
  35. Moës, N.; Belytschko, T. Extended finite element method for cohesive crack growth. Eng. Fract. Mech. 2002, 69, 813–833. [Google Scholar] [CrossRef]
  36. Wu, J.-Y.; Li, F.-B. An improved stable xfem (is-xfem) with a novel enrichment function for the computational modeling of cohesive cracks. Comput. Methods Appl. Mech. Eng. 2015, 295, 77–107. [Google Scholar] [CrossRef]
  37. Saloustros, S.; Pela, L.; Cervera, M.; Roca, P. Finite element modelling of internal and multiple localized cracks. Comput. Mech. 2017, 59, 299–316. [Google Scholar] [CrossRef]
  38. Saloustros, S.; Cervera, M.; Pela, L. Challenges, tools and applications of tracking algorithms in the numerical modelling of cracks in concrete and masonry structures. Arch. Comput. Methods Eng. 2018, 1–45. [Google Scholar] [CrossRef]
  39. Cervera, M.; Pela, L.; Clemente, R.; Roca, P. A crack-tracking technique for localized damage in quasi-brittle materials. Eng. Fract. Mech. 2010, 77, 2431–2450. [Google Scholar] [CrossRef]
  40. Zhang, Y.; Lackner, R.; Zeiml, M.; Mang, H.A. Strong discontinuity embedded approach with standard sos formulation: Element formulation, energy-based crack-tracking strategy, and validations. Comput. Methods Appl. Mech. Eng. 2015, 287, 335–366. [Google Scholar] [CrossRef]
  41. Zhang, Y.; Zhuang, X. Cracking elements: A self-propagating strong discontinuity embedded approach for quasi-brittle fracture. Finite Elem. Anal. Des. 2018, 144, 84–100. [Google Scholar] [CrossRef]
  42. Nikolić, M.; Ibrahimbegovic, A.; Miscevic, P. Brittle and ductile failure of rocks: Embedded discontinuity approach for representing mode i and mode ii failure mechanisms. Int. J. Numer. Methods Eng. 2015, 102, 1507–1526. [Google Scholar] [CrossRef]
  43. Cervera, M.; Barbat, G.; Chiumenti, M. Finite element modeling of quasi-brittle cracks in 2d and 3d with enhanced strain accuracy. Comput. Mech. 2017, 60, 767–796. [Google Scholar] [CrossRef]
  44. Cervera, M.; Chiumenti, M.; Codina, R. Mixed stabilized finite element methods in nonlinear solid mechanics: Part I: Formulation. Comput. Methods Appl. Mech. Eng. 2010, 199, 2559–2570. [Google Scholar] [CrossRef]
  45. Cervera, M.; Chiumenti, M.; Codina, R. Mixed stabilized finite element methods in nonlinear solid mechanics: Part II: Strain localization. Comput. Methods Appl. Mech. Eng. 2010, 199, 2571–2589. [Google Scholar] [CrossRef]
  46. Cervera, M.; Chiumenti, M.; Benedetti, L.; Codina, R. Mixed stabilized finite element methods in nonlinear solid mechanics. Part III: Compressible and incompressible plasticity. Comput. Methods Appl. Mech. Eng. 2015, 285, 752–775. [Google Scholar] [CrossRef] [Green Version]
  47. Wu, J.-Y.; Nguyen, V.-P. A length scale insensitive phase-field damage model for brittle fracture. J. Mech. Phys. Solids 2018. [Google Scholar] [CrossRef]
  48. Wu, J.-Y. Robust numerical implementation of non-standard phase-field damage models for failure in solids article. Comput. Methods Appl. Mech. Eng. 2018. [Google Scholar] [CrossRef]
  49. Wu, J.; McAuliffe, C.; Waisman, H.; Deodatis, G. Stochastic analysis of polymer composites rupture at large deformations modeled by a phase field method. Comput. Methods Appl. Mech. Eng. 2016, 312, 596–634. [Google Scholar] [CrossRef]
  50. Nikolić, M.; Karavelić, E.; Ibrahimbegovic, A.; Miščević, P. Lattice element models and their peculiarities. Arch. Comput. Methods Eng. 2018, 25, 753–784. [Google Scholar] [CrossRef]
  51. Grassl, P. A lattice approach to model flow in cracked concrete. Cem. Concr. Compos. 2009, 31, 454–460. [Google Scholar] [CrossRef] [Green Version]
  52. Nikolić, M.; Do, X.N.; Ibrahimbegovic, A.; Nikolić, Ž. Crack propagation in dynamics by embedded strong discontinuity approach: Enhanced solid versus discrete lattice model. Comput. Methods Appl. Mech. Eng. 2018, 340, 480–499. [Google Scholar] [CrossRef]
  53. Ren, F.; Ma, G.; Fu, G.; Zhang, K. Investigation of the permeability anisotropy of 2d fractured rock masses. Eng. Geol. 2015, 196, 171–182. [Google Scholar] [CrossRef]
  54. Ren, F.; Ma, G.; Wang, Y.; Fan, L. Pipe network model for unconfined seepage analysis in fractured rock masses. Int. J. Rock Mech. Min. Sci. 2016, 88, 183–196. [Google Scholar] [CrossRef]
  55. Sun, Z.; Yan, X.; Liu, R.; Xu, Z.; Li, S.; Zhang, Y. Transient analysis of grout penetration with time-dependent viscosity inside 3d fractured rock mass by unified pipe-network method. Water 2018, 10, 1122. [Google Scholar] [CrossRef]
  56. Bouchelaghem, F.; Vulliet, L.; Leroy, D.; Laloui, L.; Descoeudres, F. Real-scale miscible grout injection experiment and performance of advection–dispersion–filtration model. Int. J. Numer. Anal. Methods Geomech. 2001, 25, 1149–1173. [Google Scholar] [CrossRef]
  57. Bear, J.; Bachmat, Y. Introduction to Modeling of Transport Phenomena in Porous Media; Kluwer Academic Publishers: Dordrecht, The Netherlands, 1990. [Google Scholar]
  58. Kim, Y.S.; Whittle, A.J. Filtration in a porous granular medium: 2. Application of bubble model to 1-d column experiments. Transp. Porous Media 2006, 65, 309–335. [Google Scholar] [CrossRef]
  59. Kim, Y.S.; Whittle, A.J. Particle network model for simulating the filtration of a microfine cement grout in sand. J. Geotech. Geoenviron. Eng. 2009, 135, 224–236. [Google Scholar] [CrossRef]
  60. Yoon, J.; Mohtar, C.S.E. A filtration model for evaluating maximum penetration distance of bentonite grout through granular soils. Comput. Geotech. 2015, 65, 291–301. [Google Scholar] [CrossRef]
  61. Bai, R.; Tien, C. Particle detachment in deep bed filtration. J. Colloid Interface Sci. 1997, 186, 307–317. [Google Scholar] [CrossRef] [PubMed]
  62. Probstein, R.F. Physicochemical Hydrodynamics: An Introduction; John Wiley & Sons: New York, NY, USA, 2005. [Google Scholar]
  63. Zhang, Y.; Pichler, C.; Yuan, Y.; Zeiml, M.; Lackner, R. Micromechanics-based multifield framework for early-age concrete. Eng. Struct. 2013, 47, 16–24. [Google Scholar] [CrossRef]
  64. Zhang, Y.; Zeiml, M.; Pichler, C.; Lackner, R. Model-based risk assessment of concrete spalling in tunnel linings under fire loading. Eng. Struct. 2014, 77, 207–215. [Google Scholar] [CrossRef]
  65. Zhang, Y.; Zeiml, M.; Maier, M.; Yuan, Y.; Lackner, R. Fast assessing spalling risk of tunnel linings under rabt fire: From a coupled thermo-hydro-chemo-mechanical model towards an estimation method. Eng. Struct. 2017, 142, 1–19. [Google Scholar] [CrossRef]
  66. Babuška, I. Error-bounds for finite element method. Numer. Math. 1971, 16, 322–333. [Google Scholar] [CrossRef]
  67. White, J.A.; Borja, R.I. Stabilized low-order finite element for coupled solid-deformation/fluid-diffusion and their application to fault zone transients. Comput. Methods Appl. Mech. Eng. 2008, 197, 4353–4366. [Google Scholar] [CrossRef]
  68. Ren, F.; Ma, G.; Wang, Y.; Li, T.; Zhu, H. Unified pipe network method for simulation of water flow in fractured porous rock. J. Hydrol. 2017, 547, 80–96. [Google Scholar] [CrossRef]
  69. Ren, F.; Ma, G.; Wang, Y.; Fan, L.; Zhu, H. Two-phase flow pipe network method for simulation of CO2 sequestration in fractured saline aquifers. Int. J. Rock Mech. Min. Sci. 2017, 98, 39–53. [Google Scholar] [CrossRef]
  70. Chen, Y.; Ma, G.; Li, T.; Wang, Y.; Ren, F. Simulation of wormhole propagation in fractured carbonate rocks with unified pipe-network method. Comput. Geotech. 2018, 98, 58–68. [Google Scholar] [CrossRef]
  71. Wang, Y.; Ma, G.; Ren, F.; Li, T. A constrained delaunay discretization method for adaptively meshing highly discontinuous geological media. Comput. Geosci. 2017, 109, 134–148. [Google Scholar] [CrossRef]
Figure 1. Discrete elements within fractured and porous media.
Processes 07 00046 g001
Figure 2. A schematic of grouting in sand. (a) 1D column injection test [56]; (b) the numerical verification model.
Processes 07 00046 g002
Figure 3. Comparison between the UPM model and the results obtained by Bouchelaghem [56].
Processes 07 00046 g003
Figure 4. 3D porous rock medium.
Processes 07 00046 g004
Figure 5. Variations in the pore pressure, concentration, porosity and permeability with the penetration length.
Processes 07 00046 g005
Figure 6. Influences of the injection pressure on the pore pressure, concentration, porosity and permeability.
Processes 07 00046 g006
Figure 7. Influences of the water–cement ratio on the pore pressure, concentration, porosity and permeability.
Processes 07 00046 g007
Figure 8. Influences of the injection velocity on the pore pressure, concentration, porosity and permeability.
Processes 07 00046 g008
Figure 9. Grout penetration with a single fracture at different inclination angles in the porous medium considering the filtration process.
Processes 07 00046 g009
Figure 10. Grout penetration in a porous medium.
Processes 07 00046 g010
Figure 11. Grout penetration with a single fracture with different dip directions in the porous medium considering the filtration process.
Processes 07 00046 g011
Figure 12. Grout penetration with a single fracture under different apertures in the porous medium considering the filtration process.
Processes 07 00046 g012
Figure 13. Distribution of fractures in the porous, fractured rock mass.
Processes 07 00046 g013
Figure 14. Grout penetration processes at different time steps with a constant injection pressure (P = 50 kPa) in a homogeneous, porous rock considering filtration.
Processes 07 00046 g014
Figure 15. Grout penetration processes at different time steps with a constant injection pressure (P = 50 kPa) in a fractured and porous rock considering filtration.
Processes 07 00046 g015
Table 1. Parameters for the experimental verification simulation.
ParameterSymbolUnitValue
Injection grout velocityu m / s 0.00117
Injection grout concentrationC k g / m 3 1150
Water viscosity μ w P a · s 0.001
Water density ρ w k g / m 3 1000
Rock density ρ s k g / m 3 3000
Initial matrix porosity ϕ 0 m 0.34
Intrinsic matrix permeability k 0 m m 2 2 × 10 11
Hydrodynamic dispersion tensor of D m m 2 / s 0
Constant deposition coefficient λ 1 / s 6 × 10 5
Constant negative scalarb 120
Gravitational acceleration constantg m / s 2 9.8
Table 2. Parameters for the sensitivity analysis.
ParameterSymbolUnitValue
Injection grout pressureP k P a 200
Injection grout concentrationC k g / m 3 1000
Water viscosity μ w P a · s 0.001
Water density ρ w k g / m 3 1000
Rock density ρ s k g / m 3 2940
Initial matrix porosity ϕ 0 m 0.24
Intrinsic matrix permeability k 0 m m 2 1.25 × 10 11
Hydrodynamic dispersion tensor of D m m 2 / s 0
Constant deposition coefficient λ 1 / s 6 × 10 5
Constant negative scalarb 120
Gravitational acceleration constantg m / s 2 9.8
Table 3. Parameters adopted for the generation of the fracture models.
GroupFracture NumberMean Length (m)St devDip Angle (Degree)Dip Direction (Degree)
110x-axis1.20.51640
y-axis10.5
210x-axis1.20.540250
y-axis10.5
Note: St dev denotes the standard deviation.

