A Strain-Based Percolation Model and Triaxial Tests to Investigate the Evolution of Permeability and Critical Dilatancy Behavior of Coal


Abstract

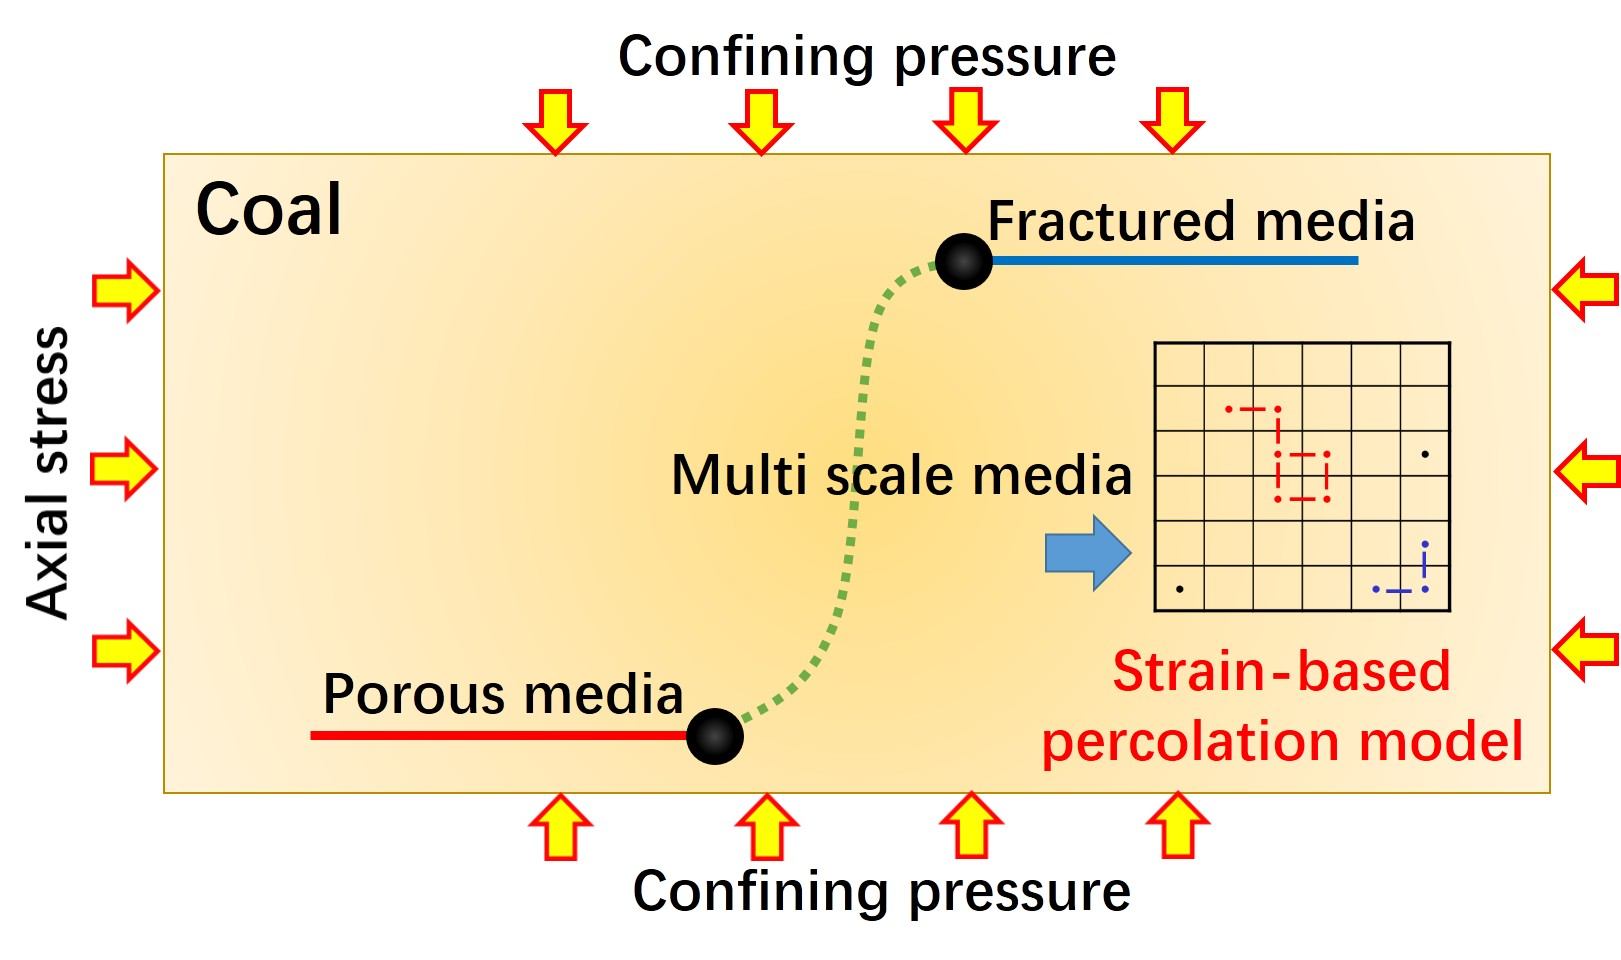
1. Introduction
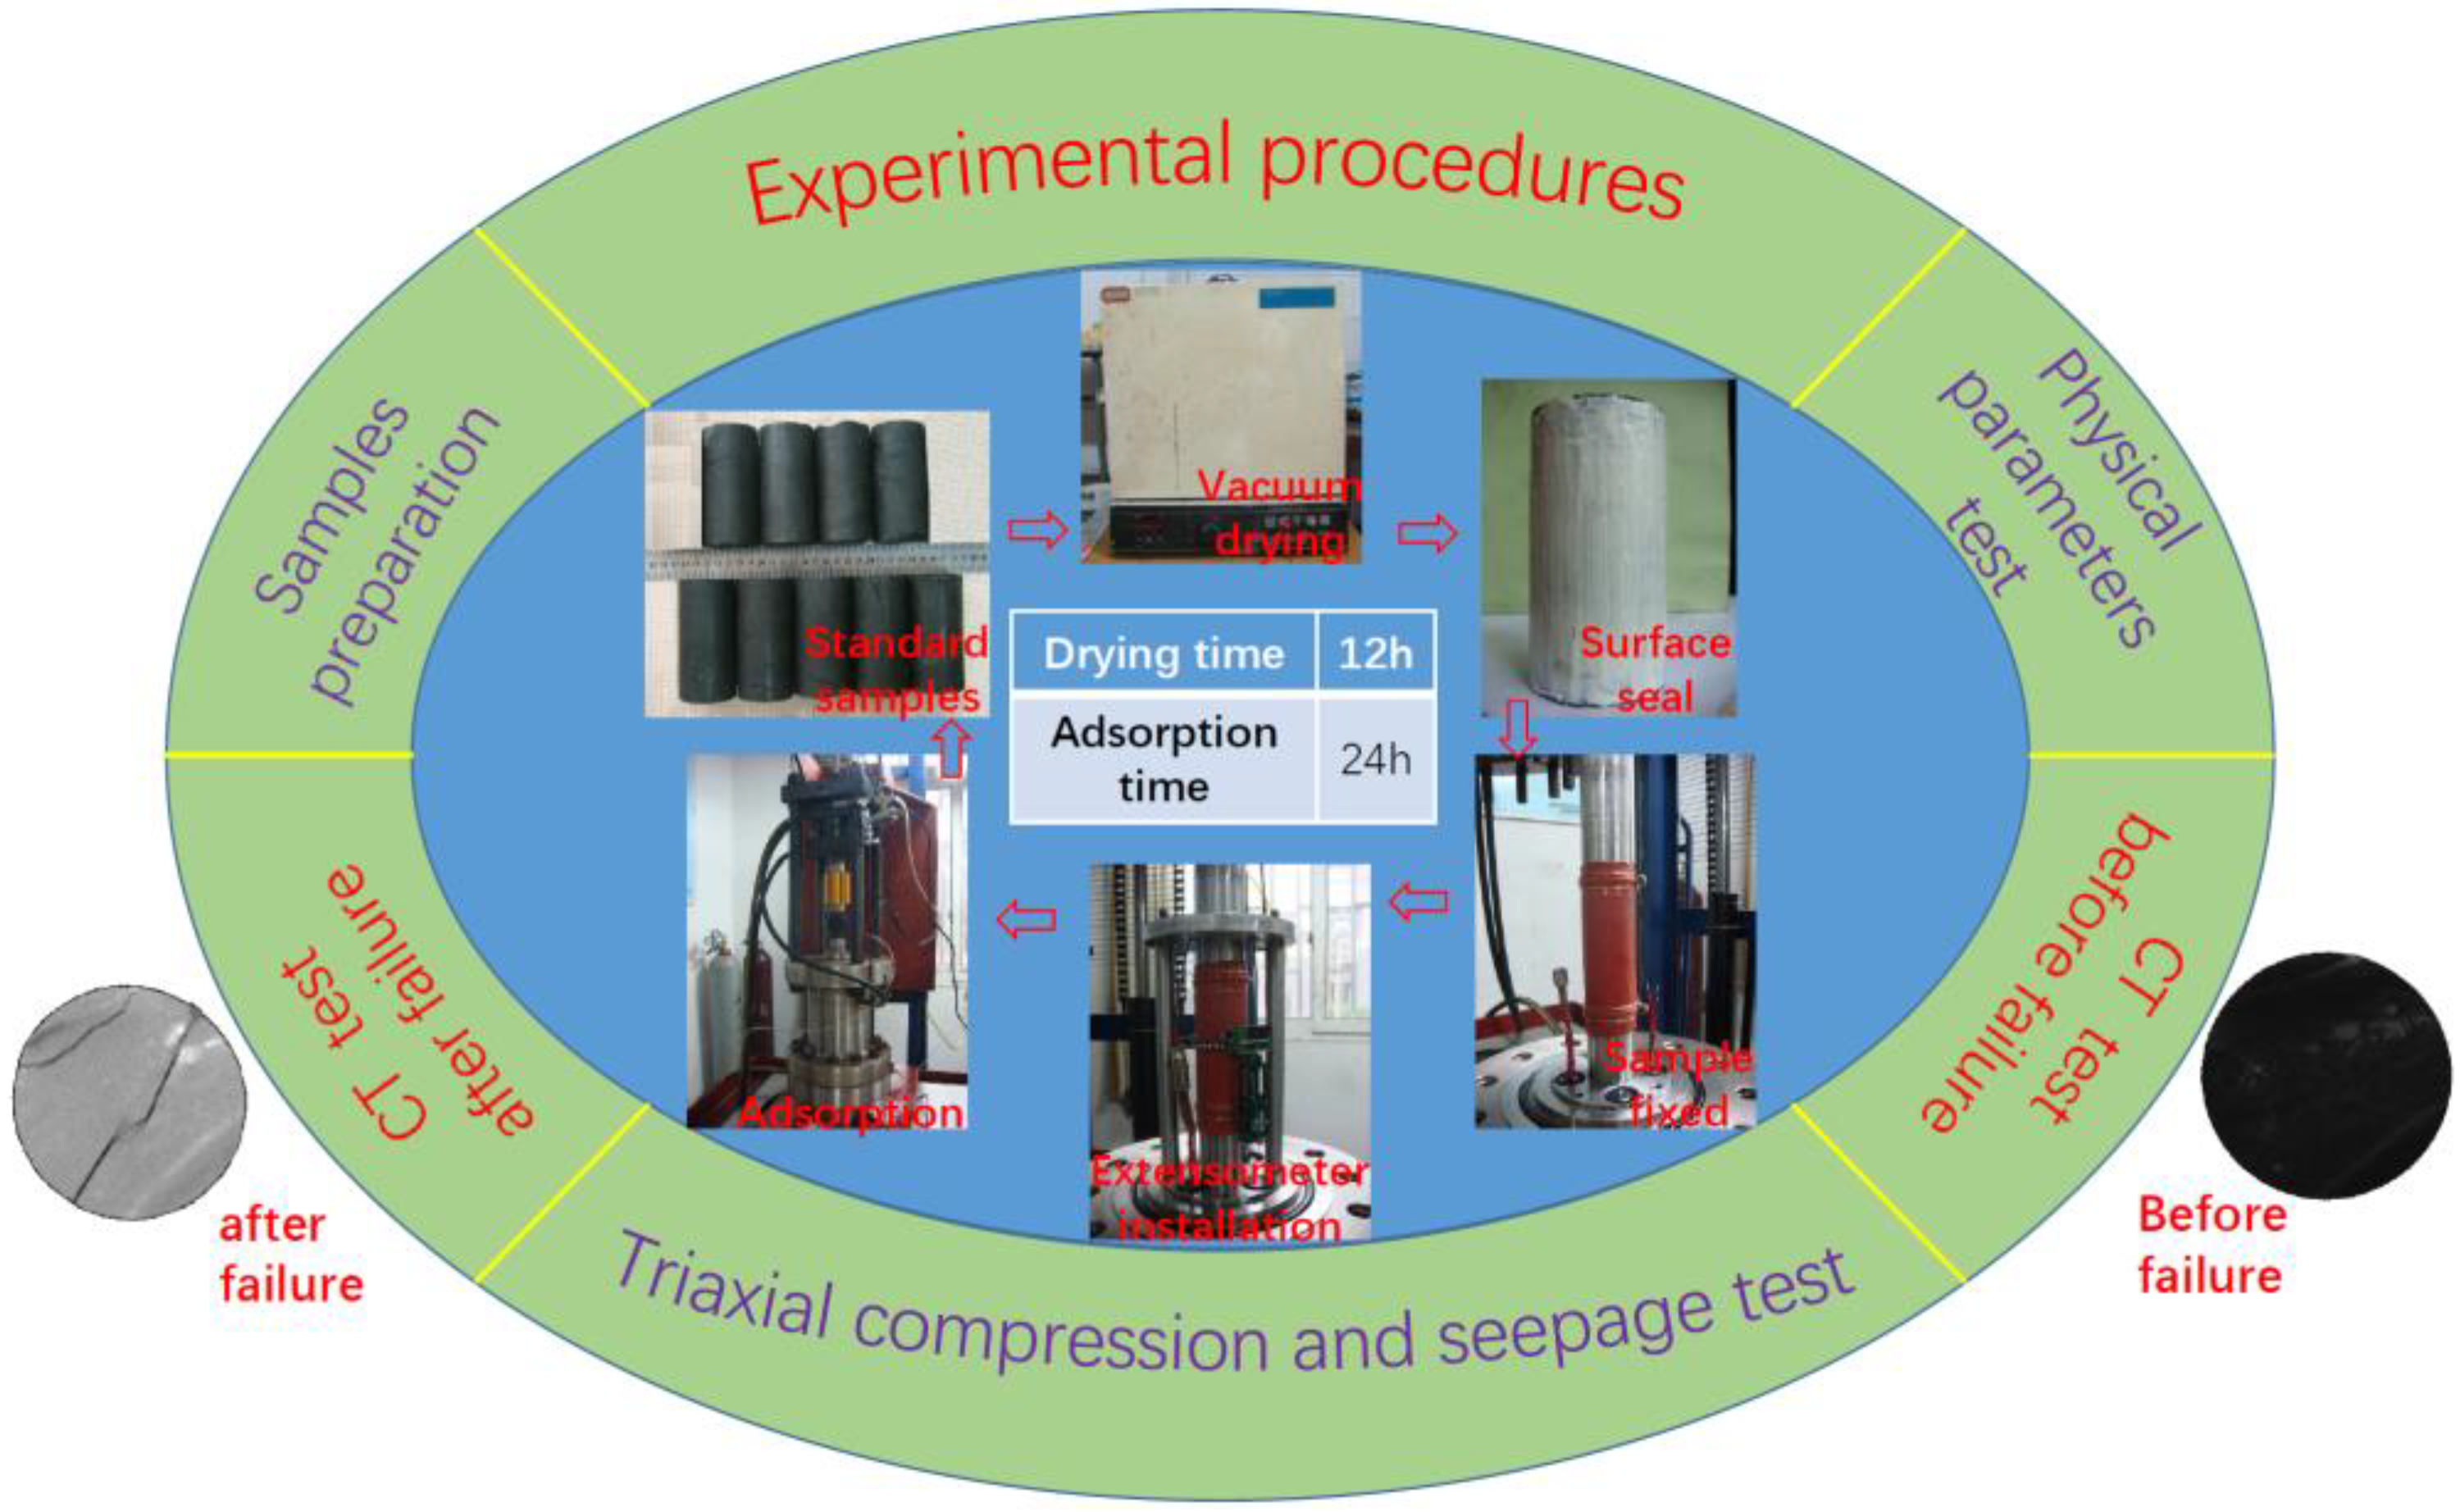
2. Materials and Experimental Methods
2.1. Coal Sample Preparation for Orthogonal Experiments
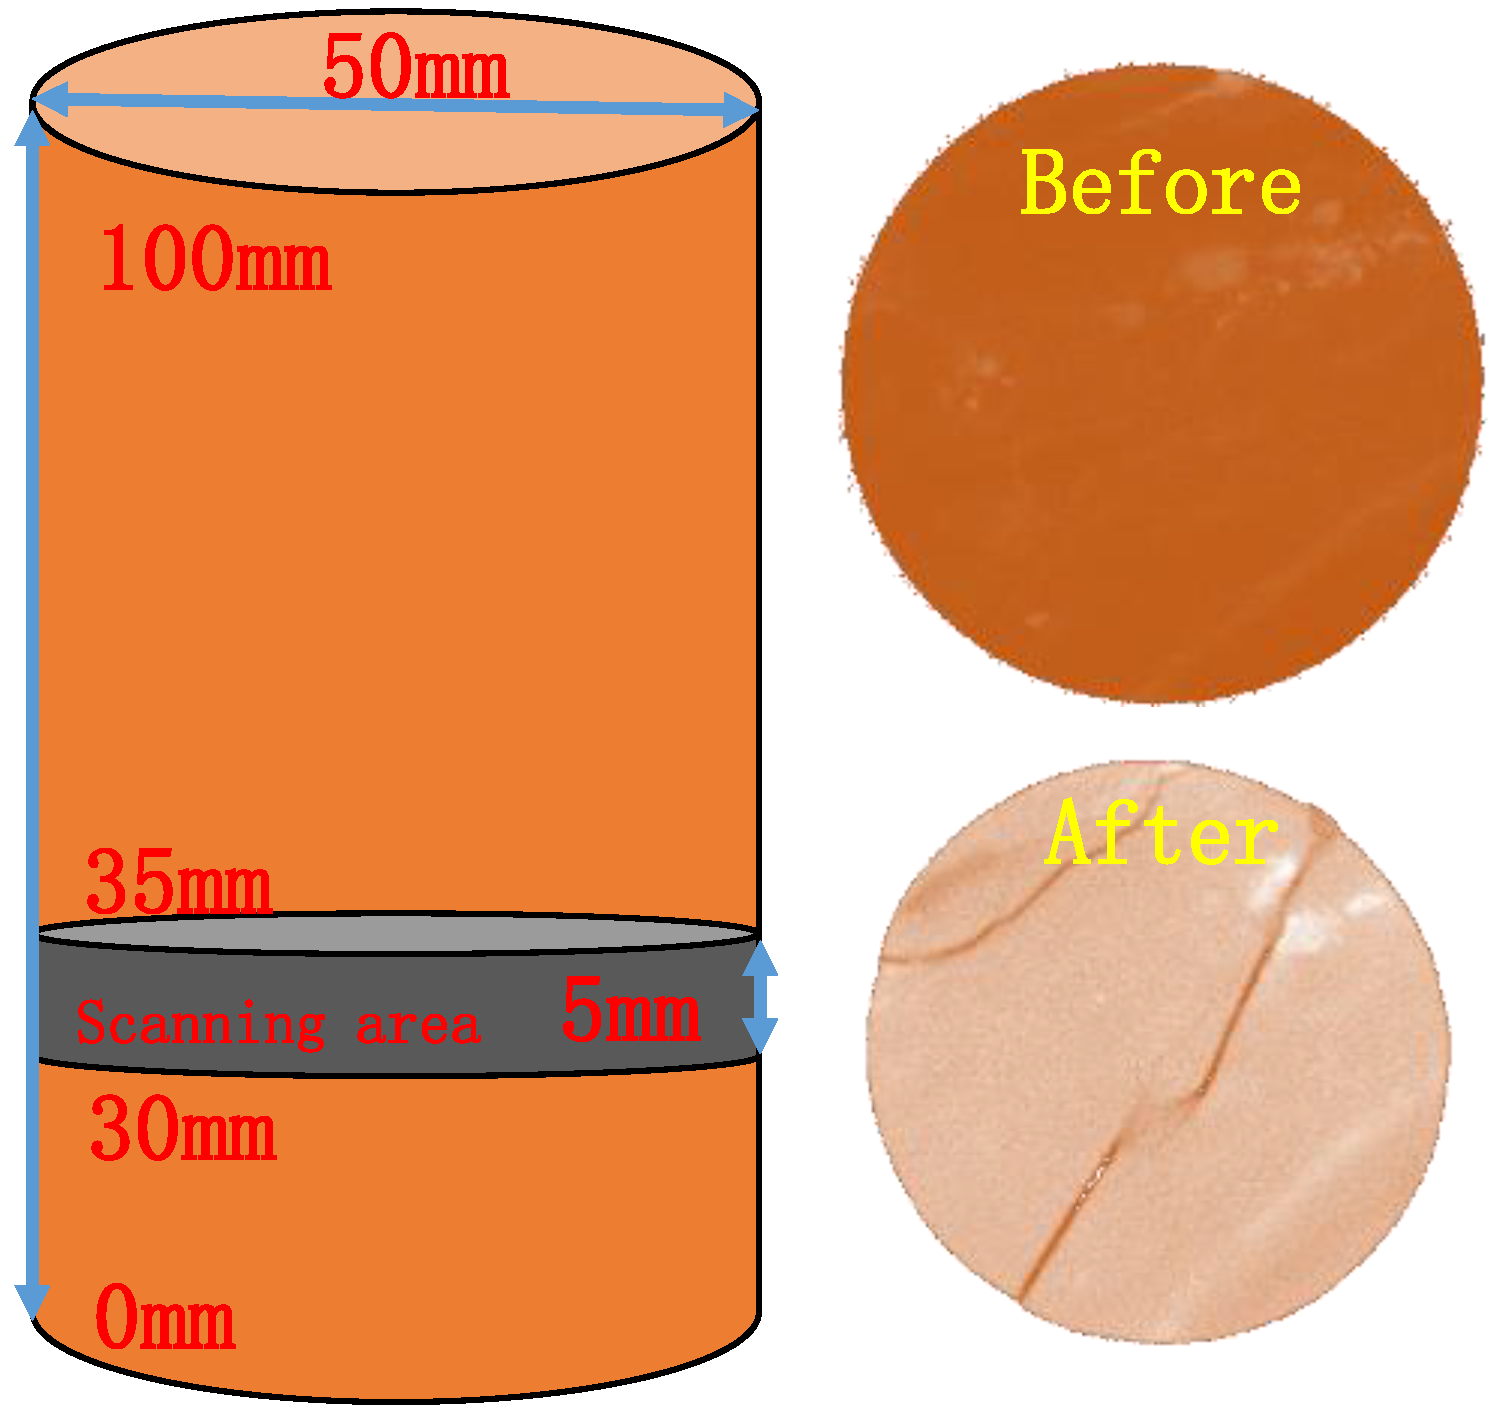
2.2. CT Observation of Multiscale Structures
2.3. Theory of CH4 Seepage in Coal
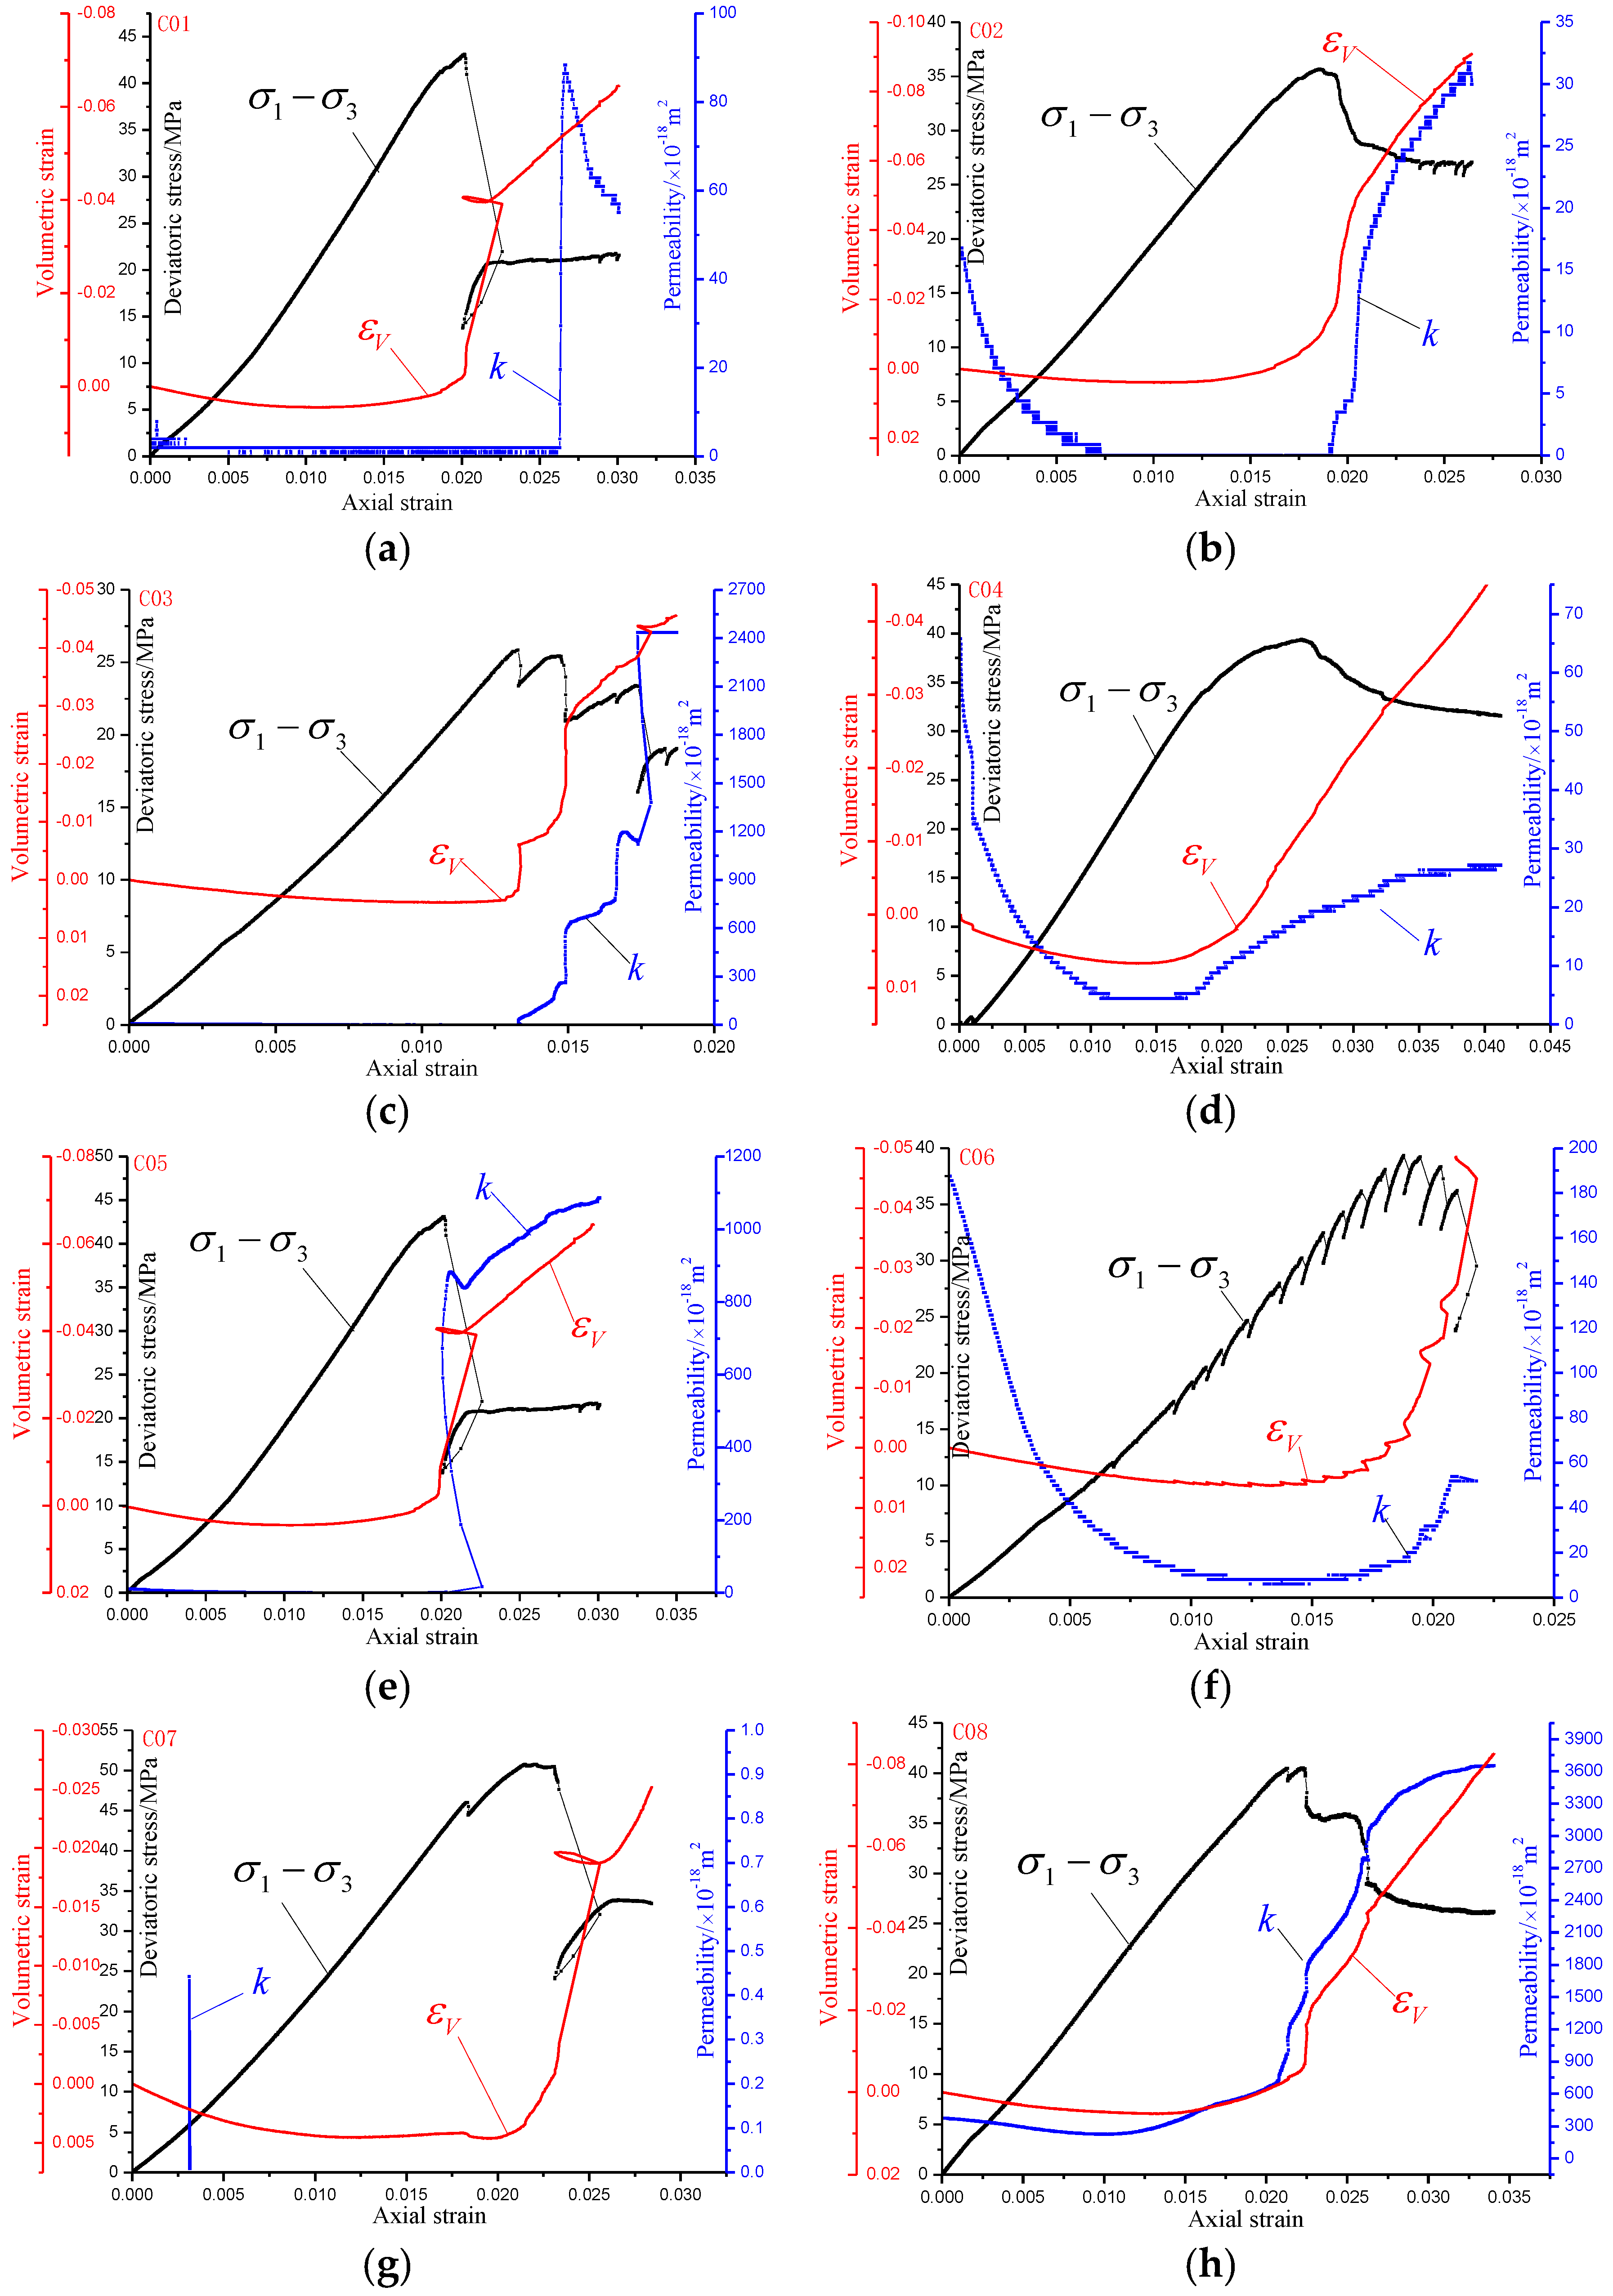
3. Experimental Results and Analysis
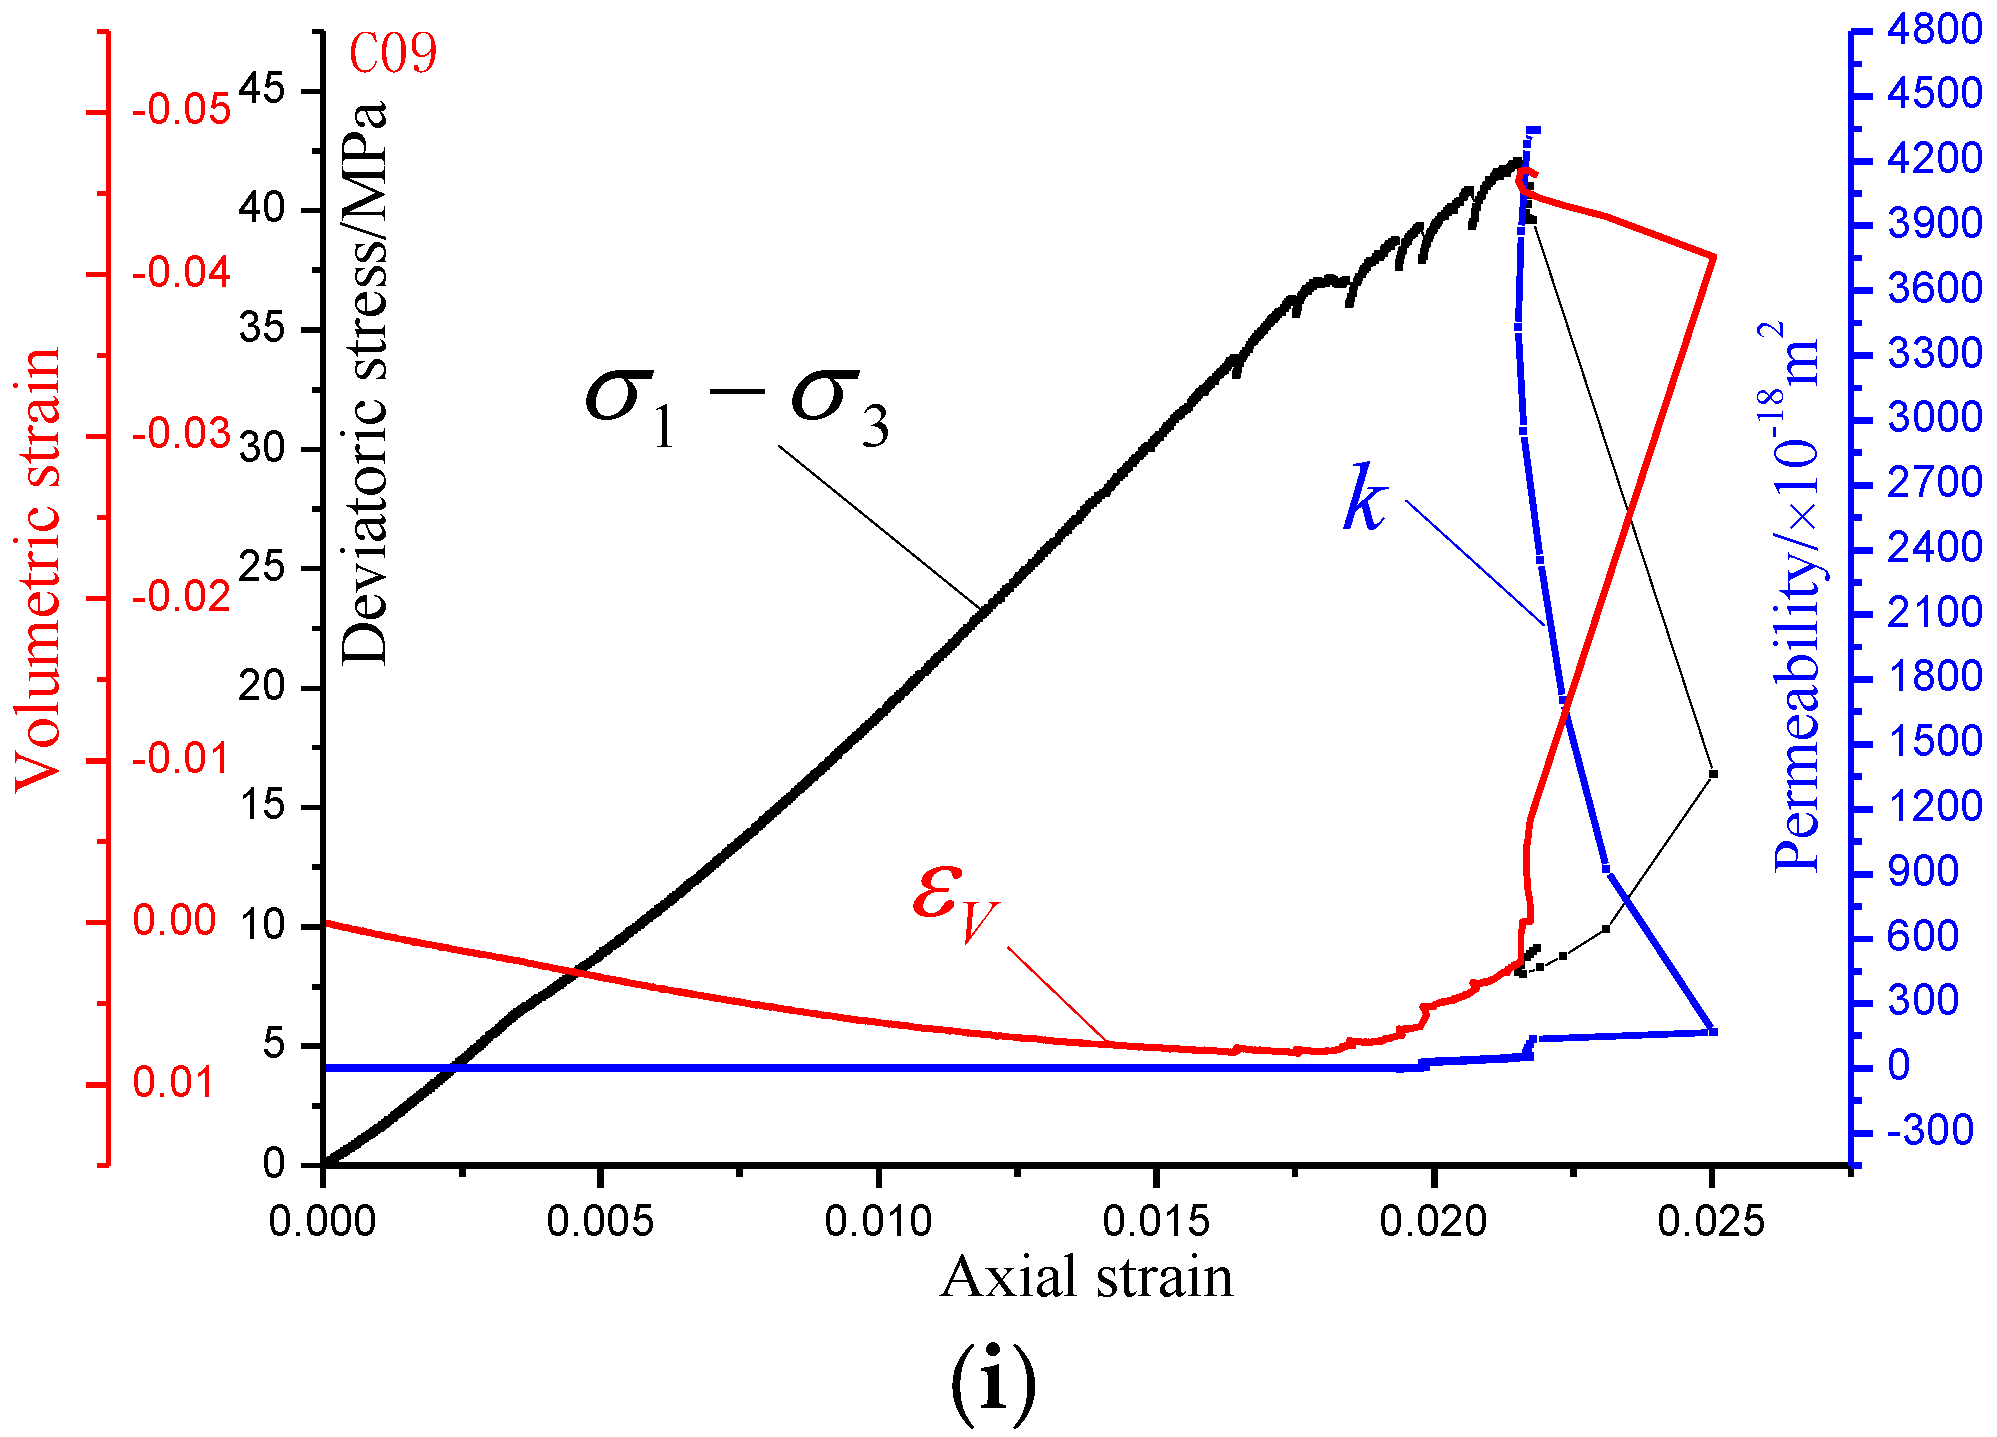
3.1. Effect of Volumetric Deformation on CH4 Seepage
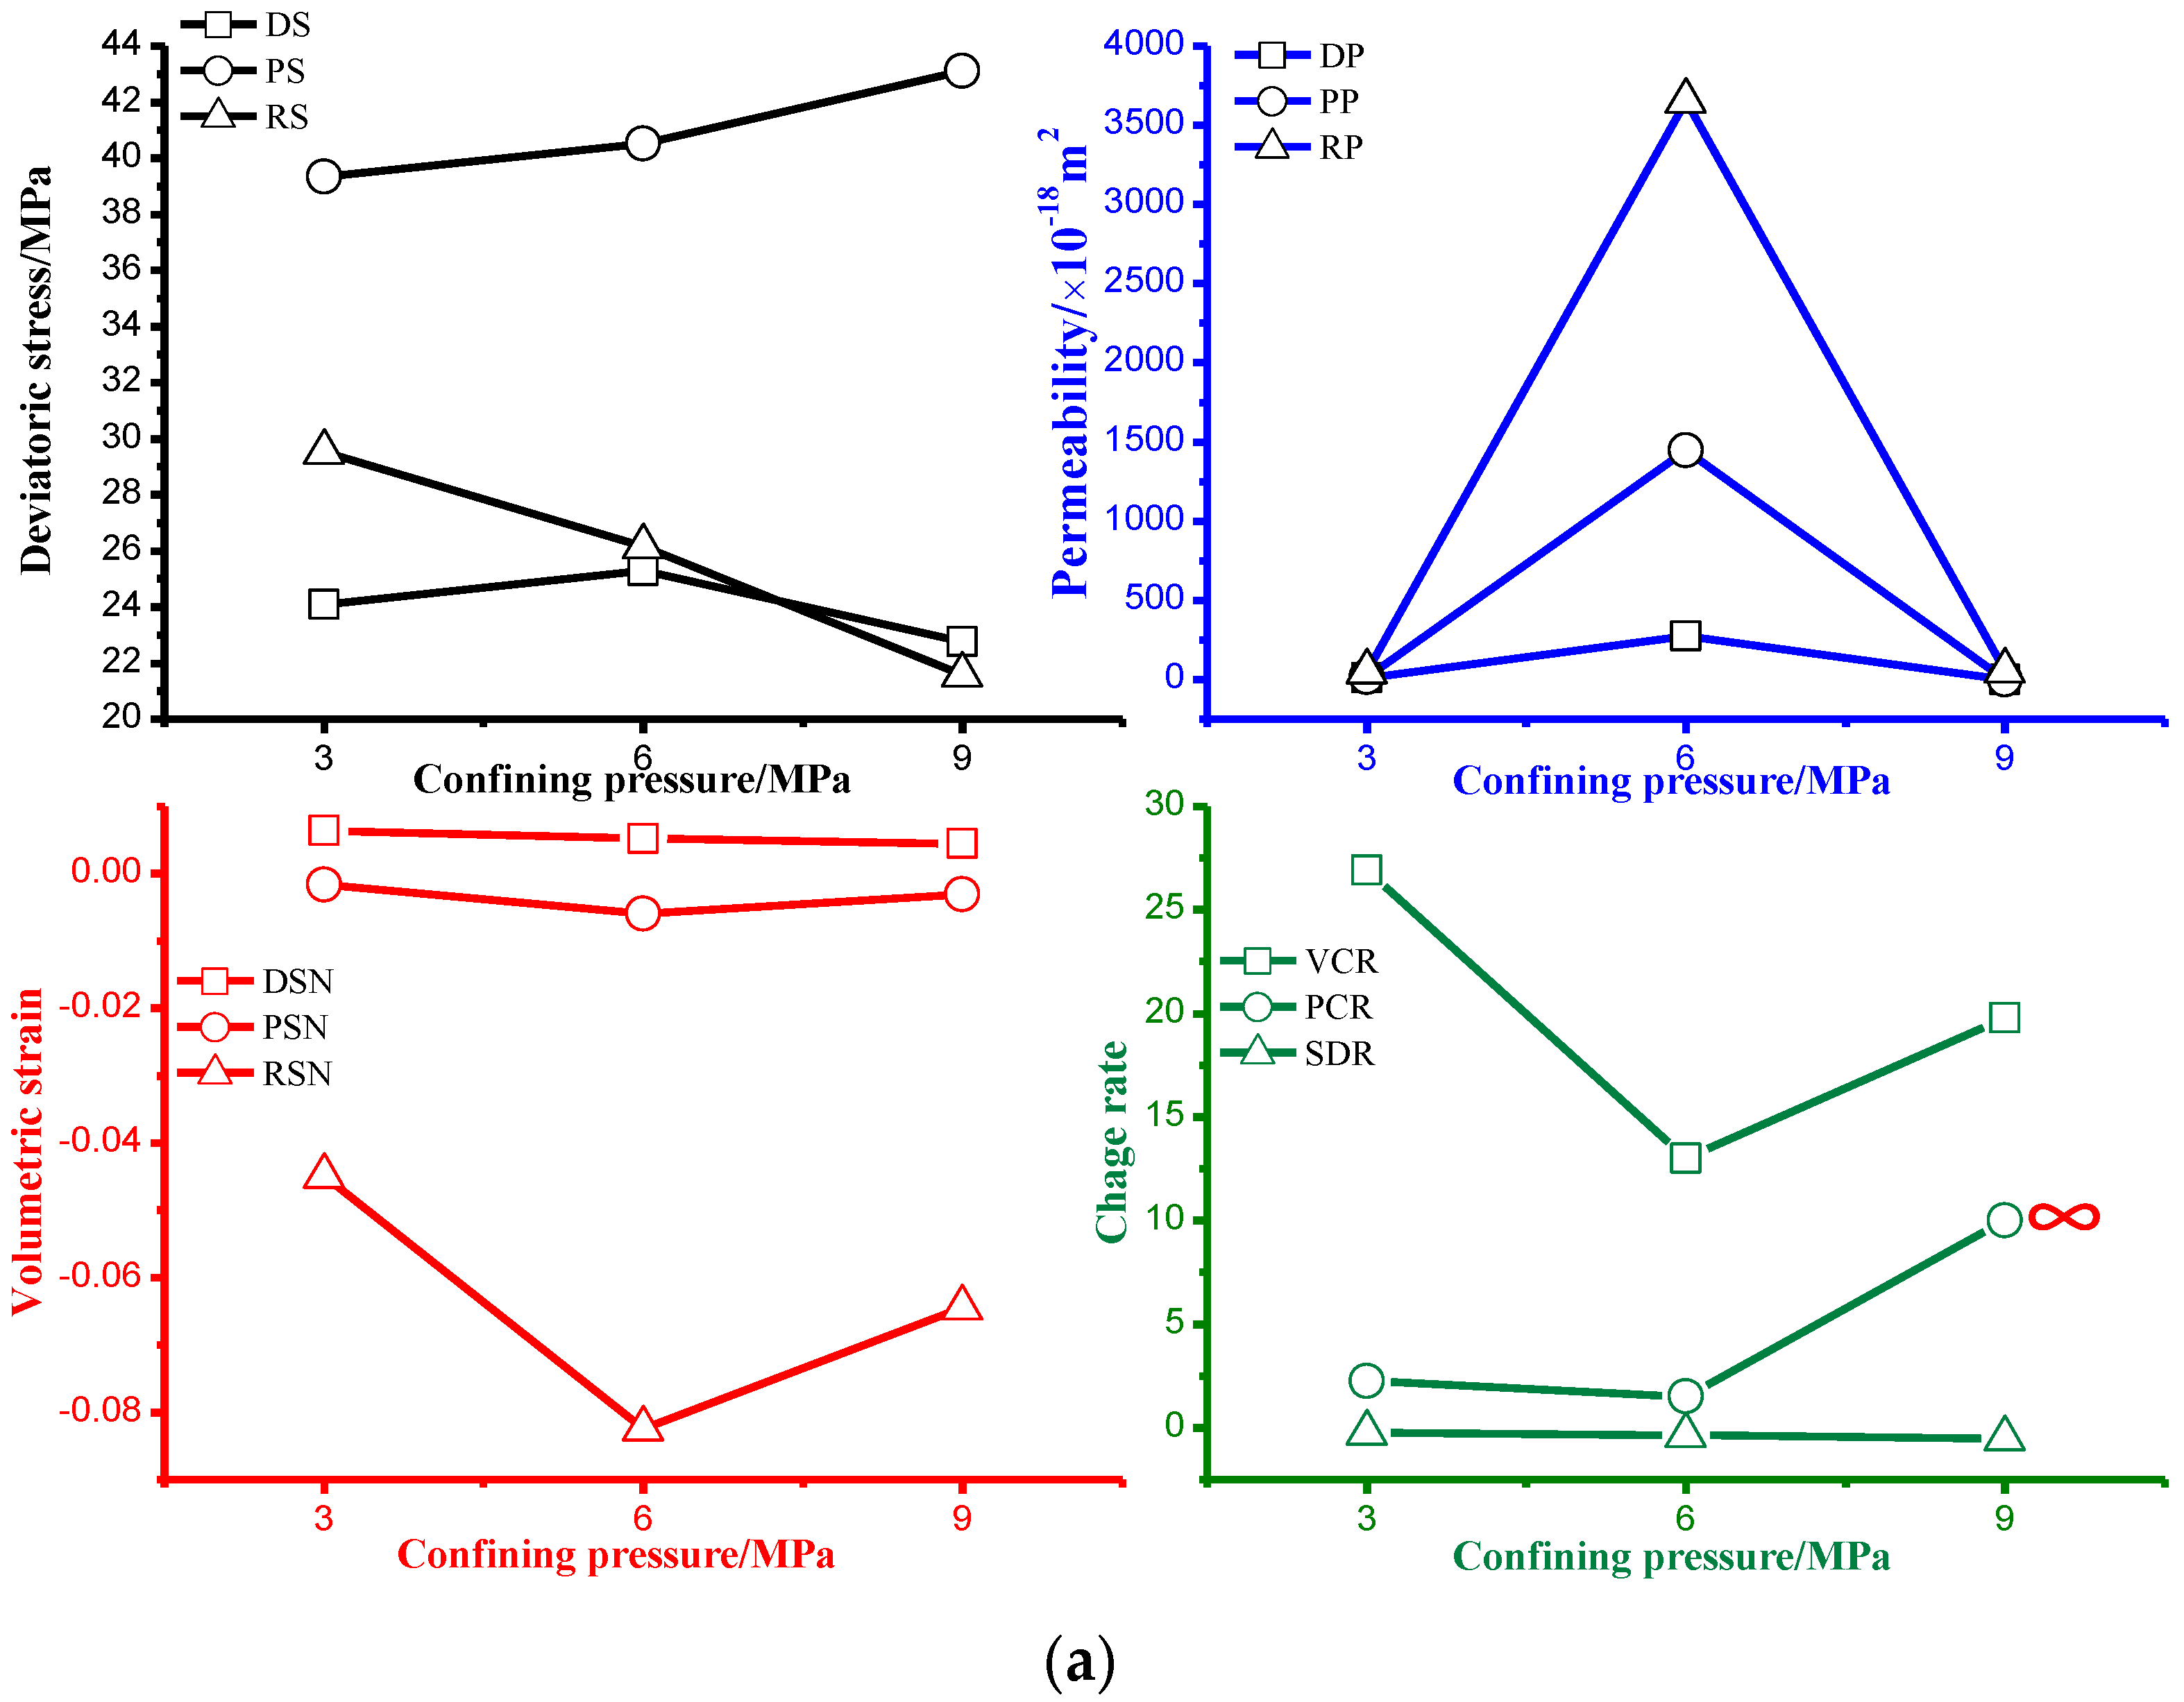
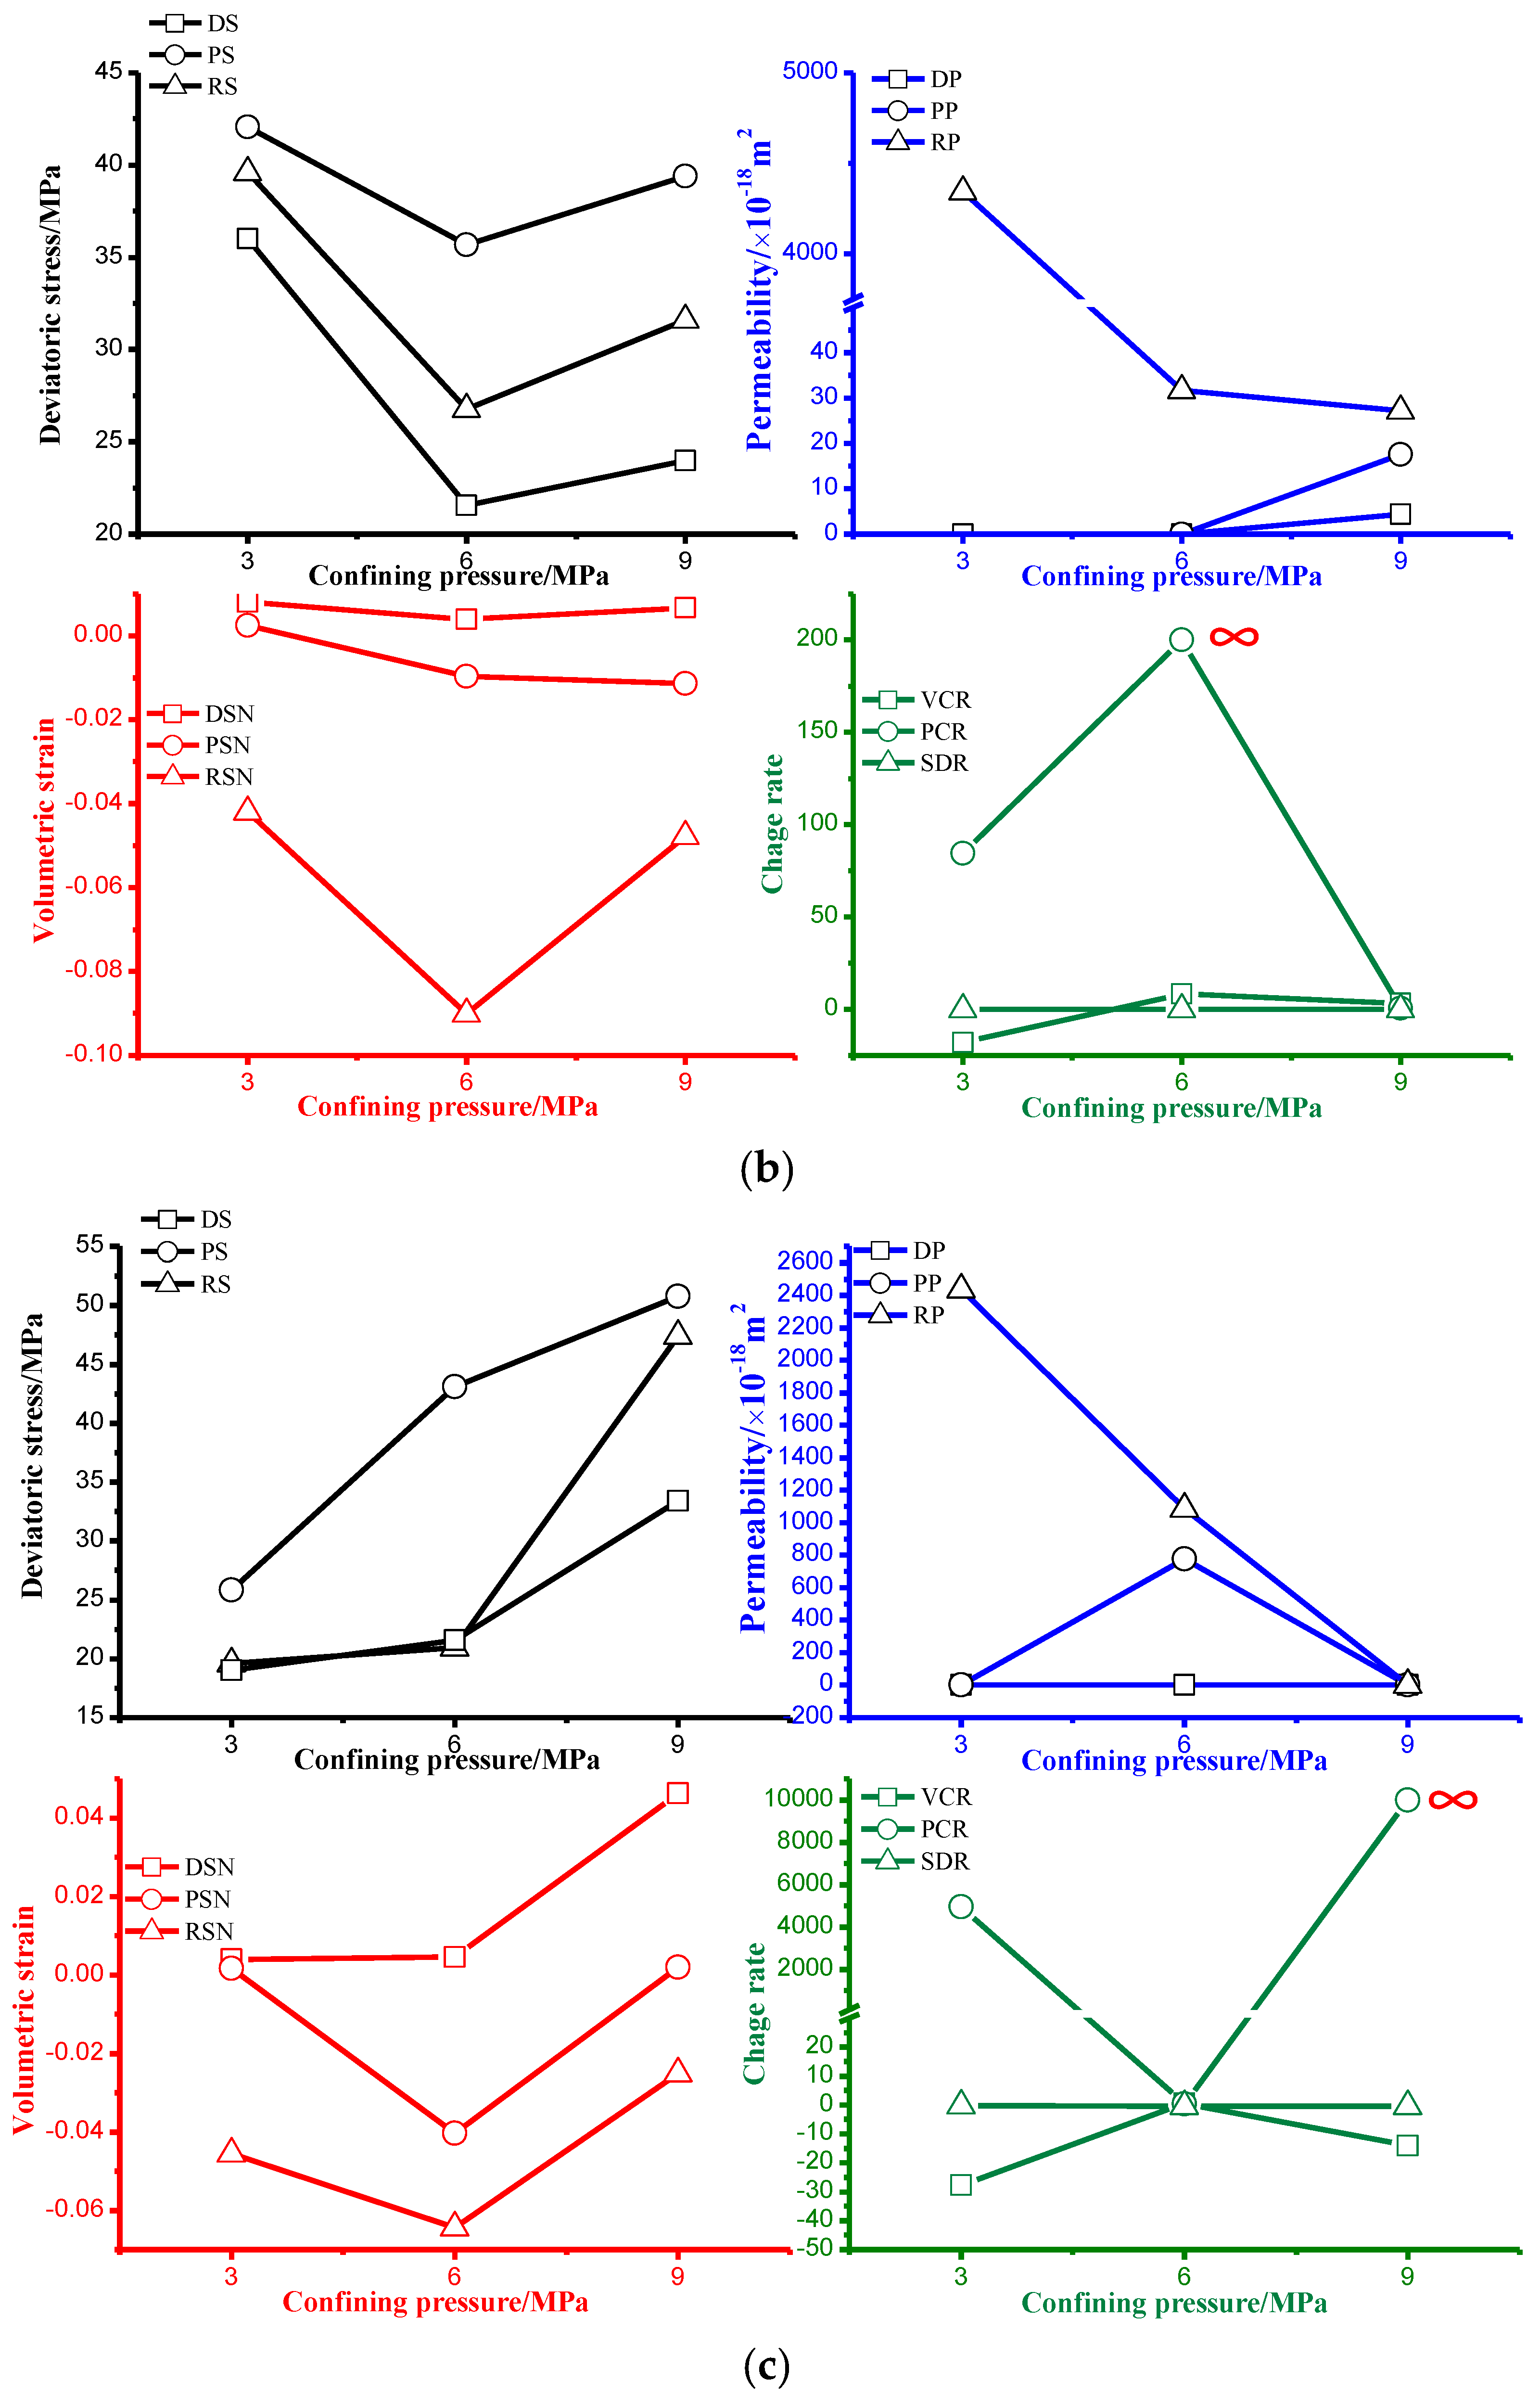
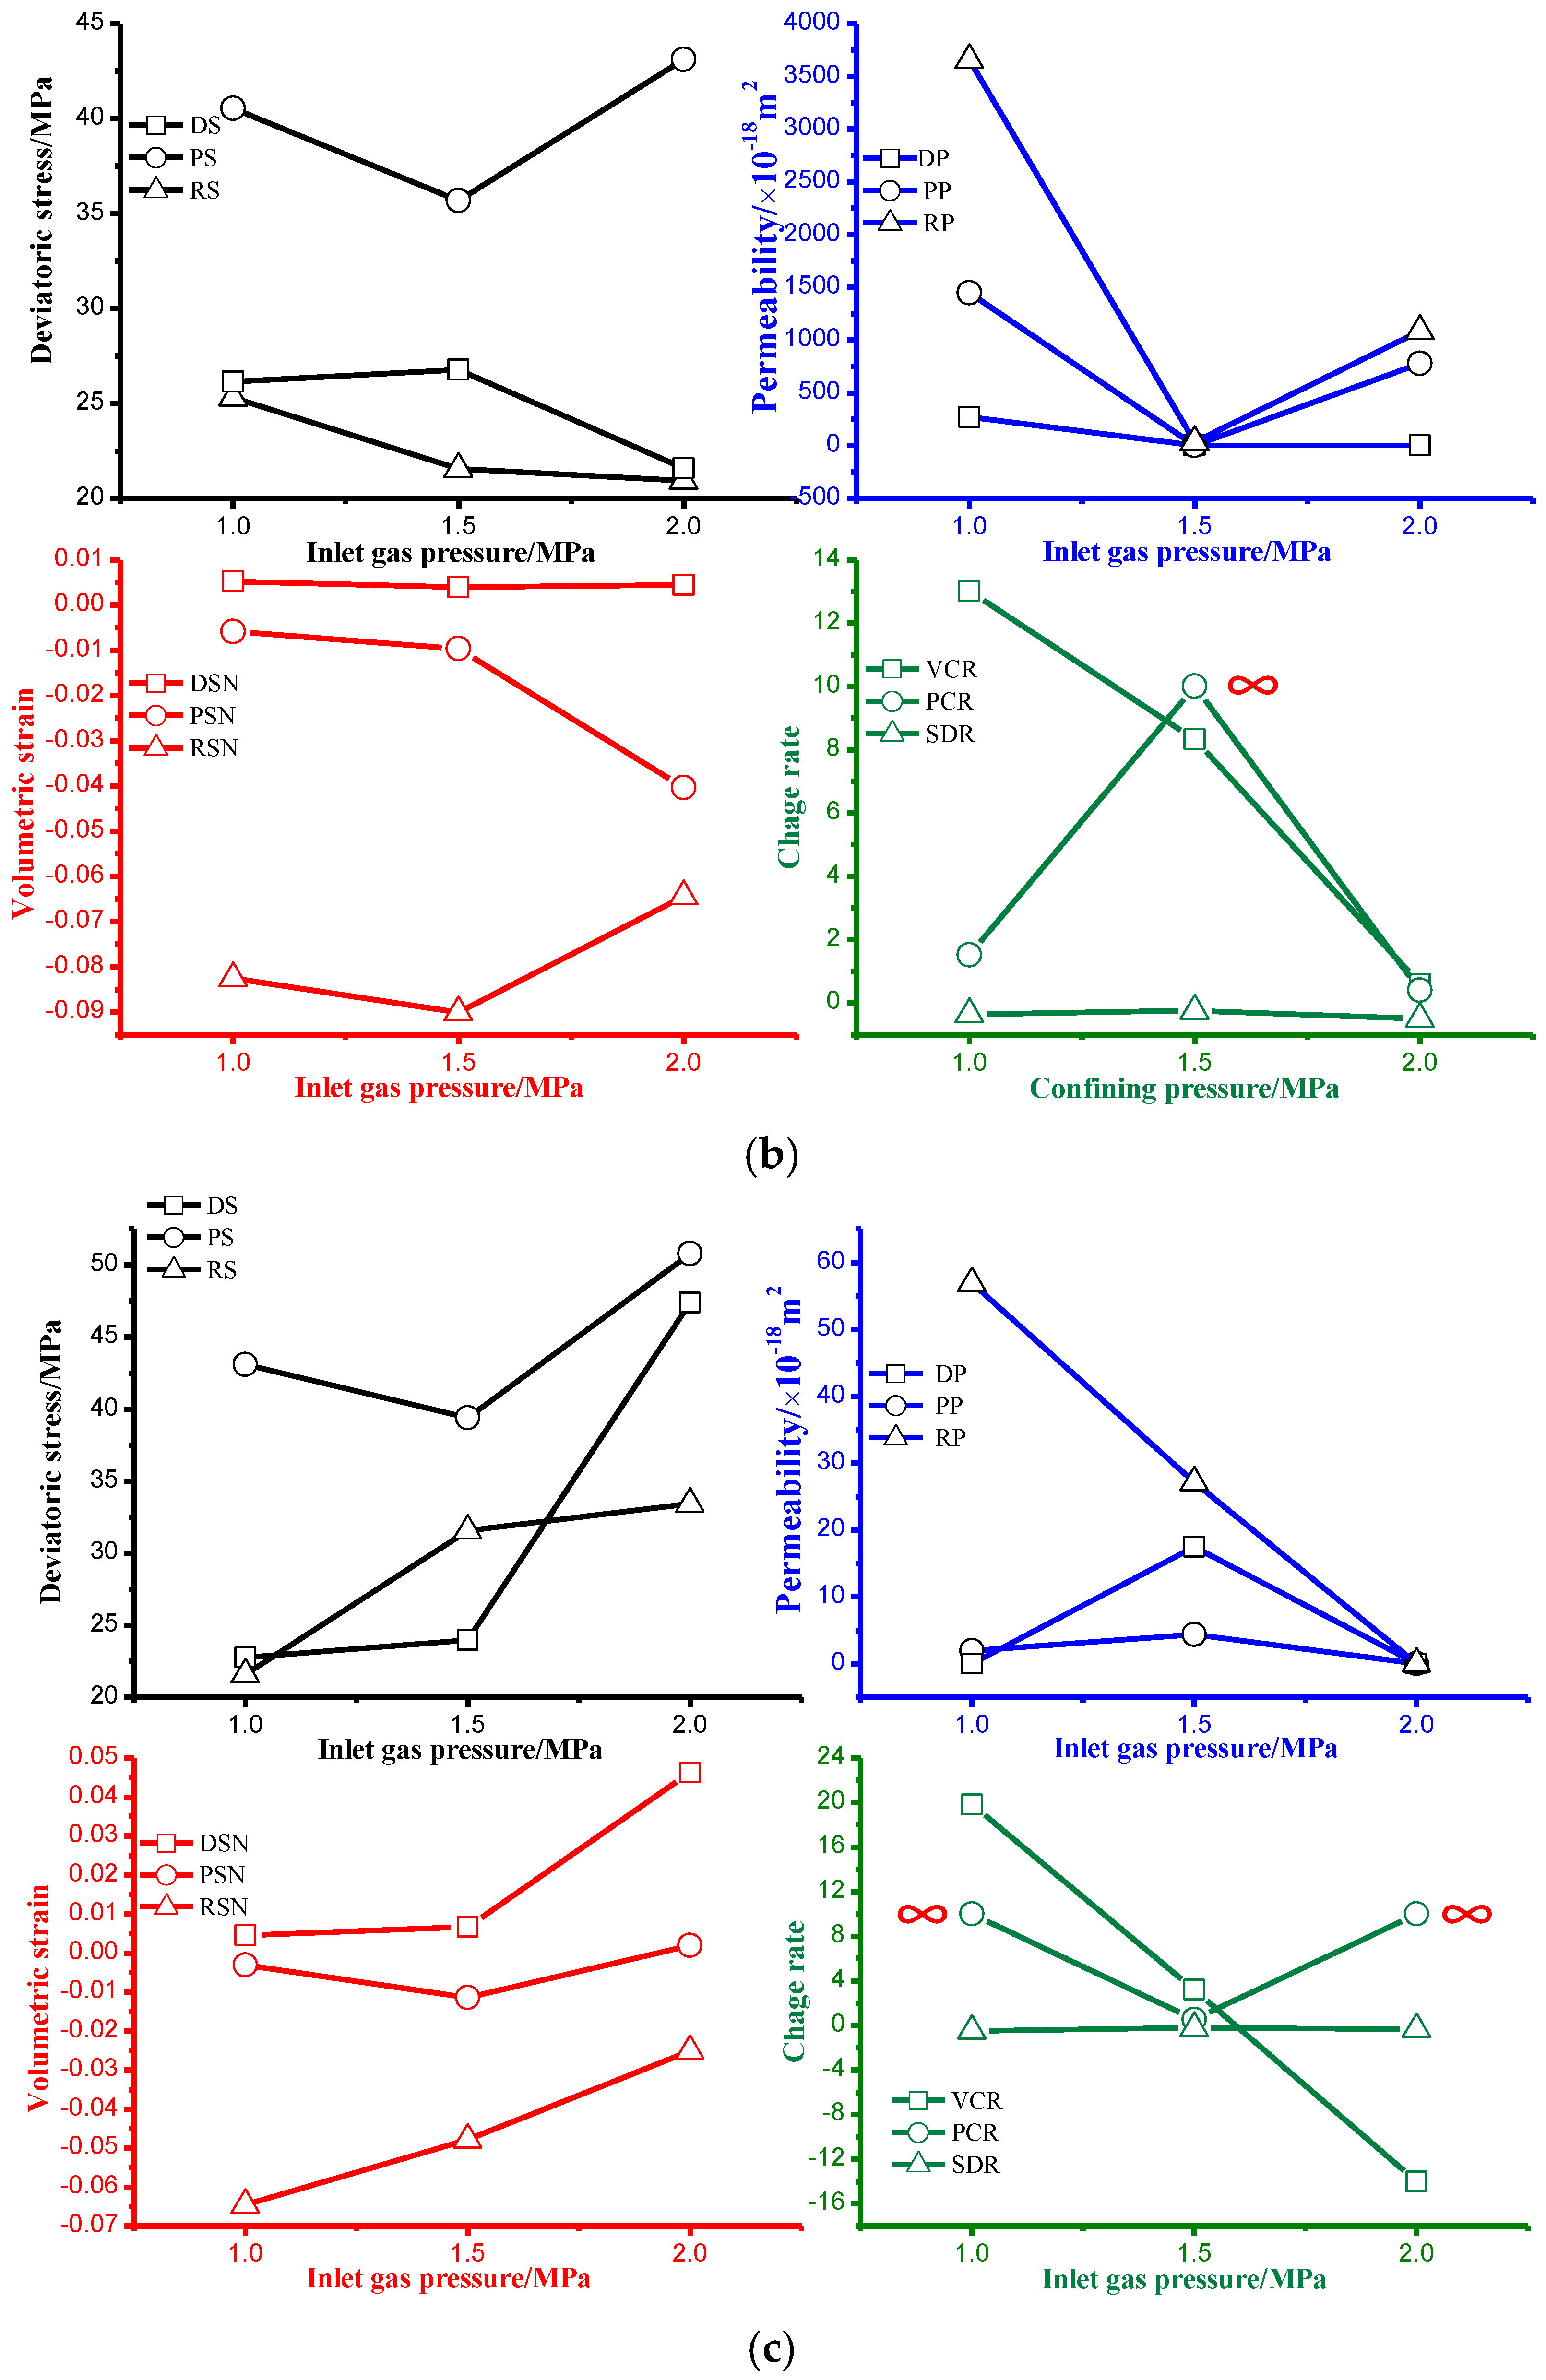
3.2. Effect of Confining Pressure on Deformation and CH4 Seepage
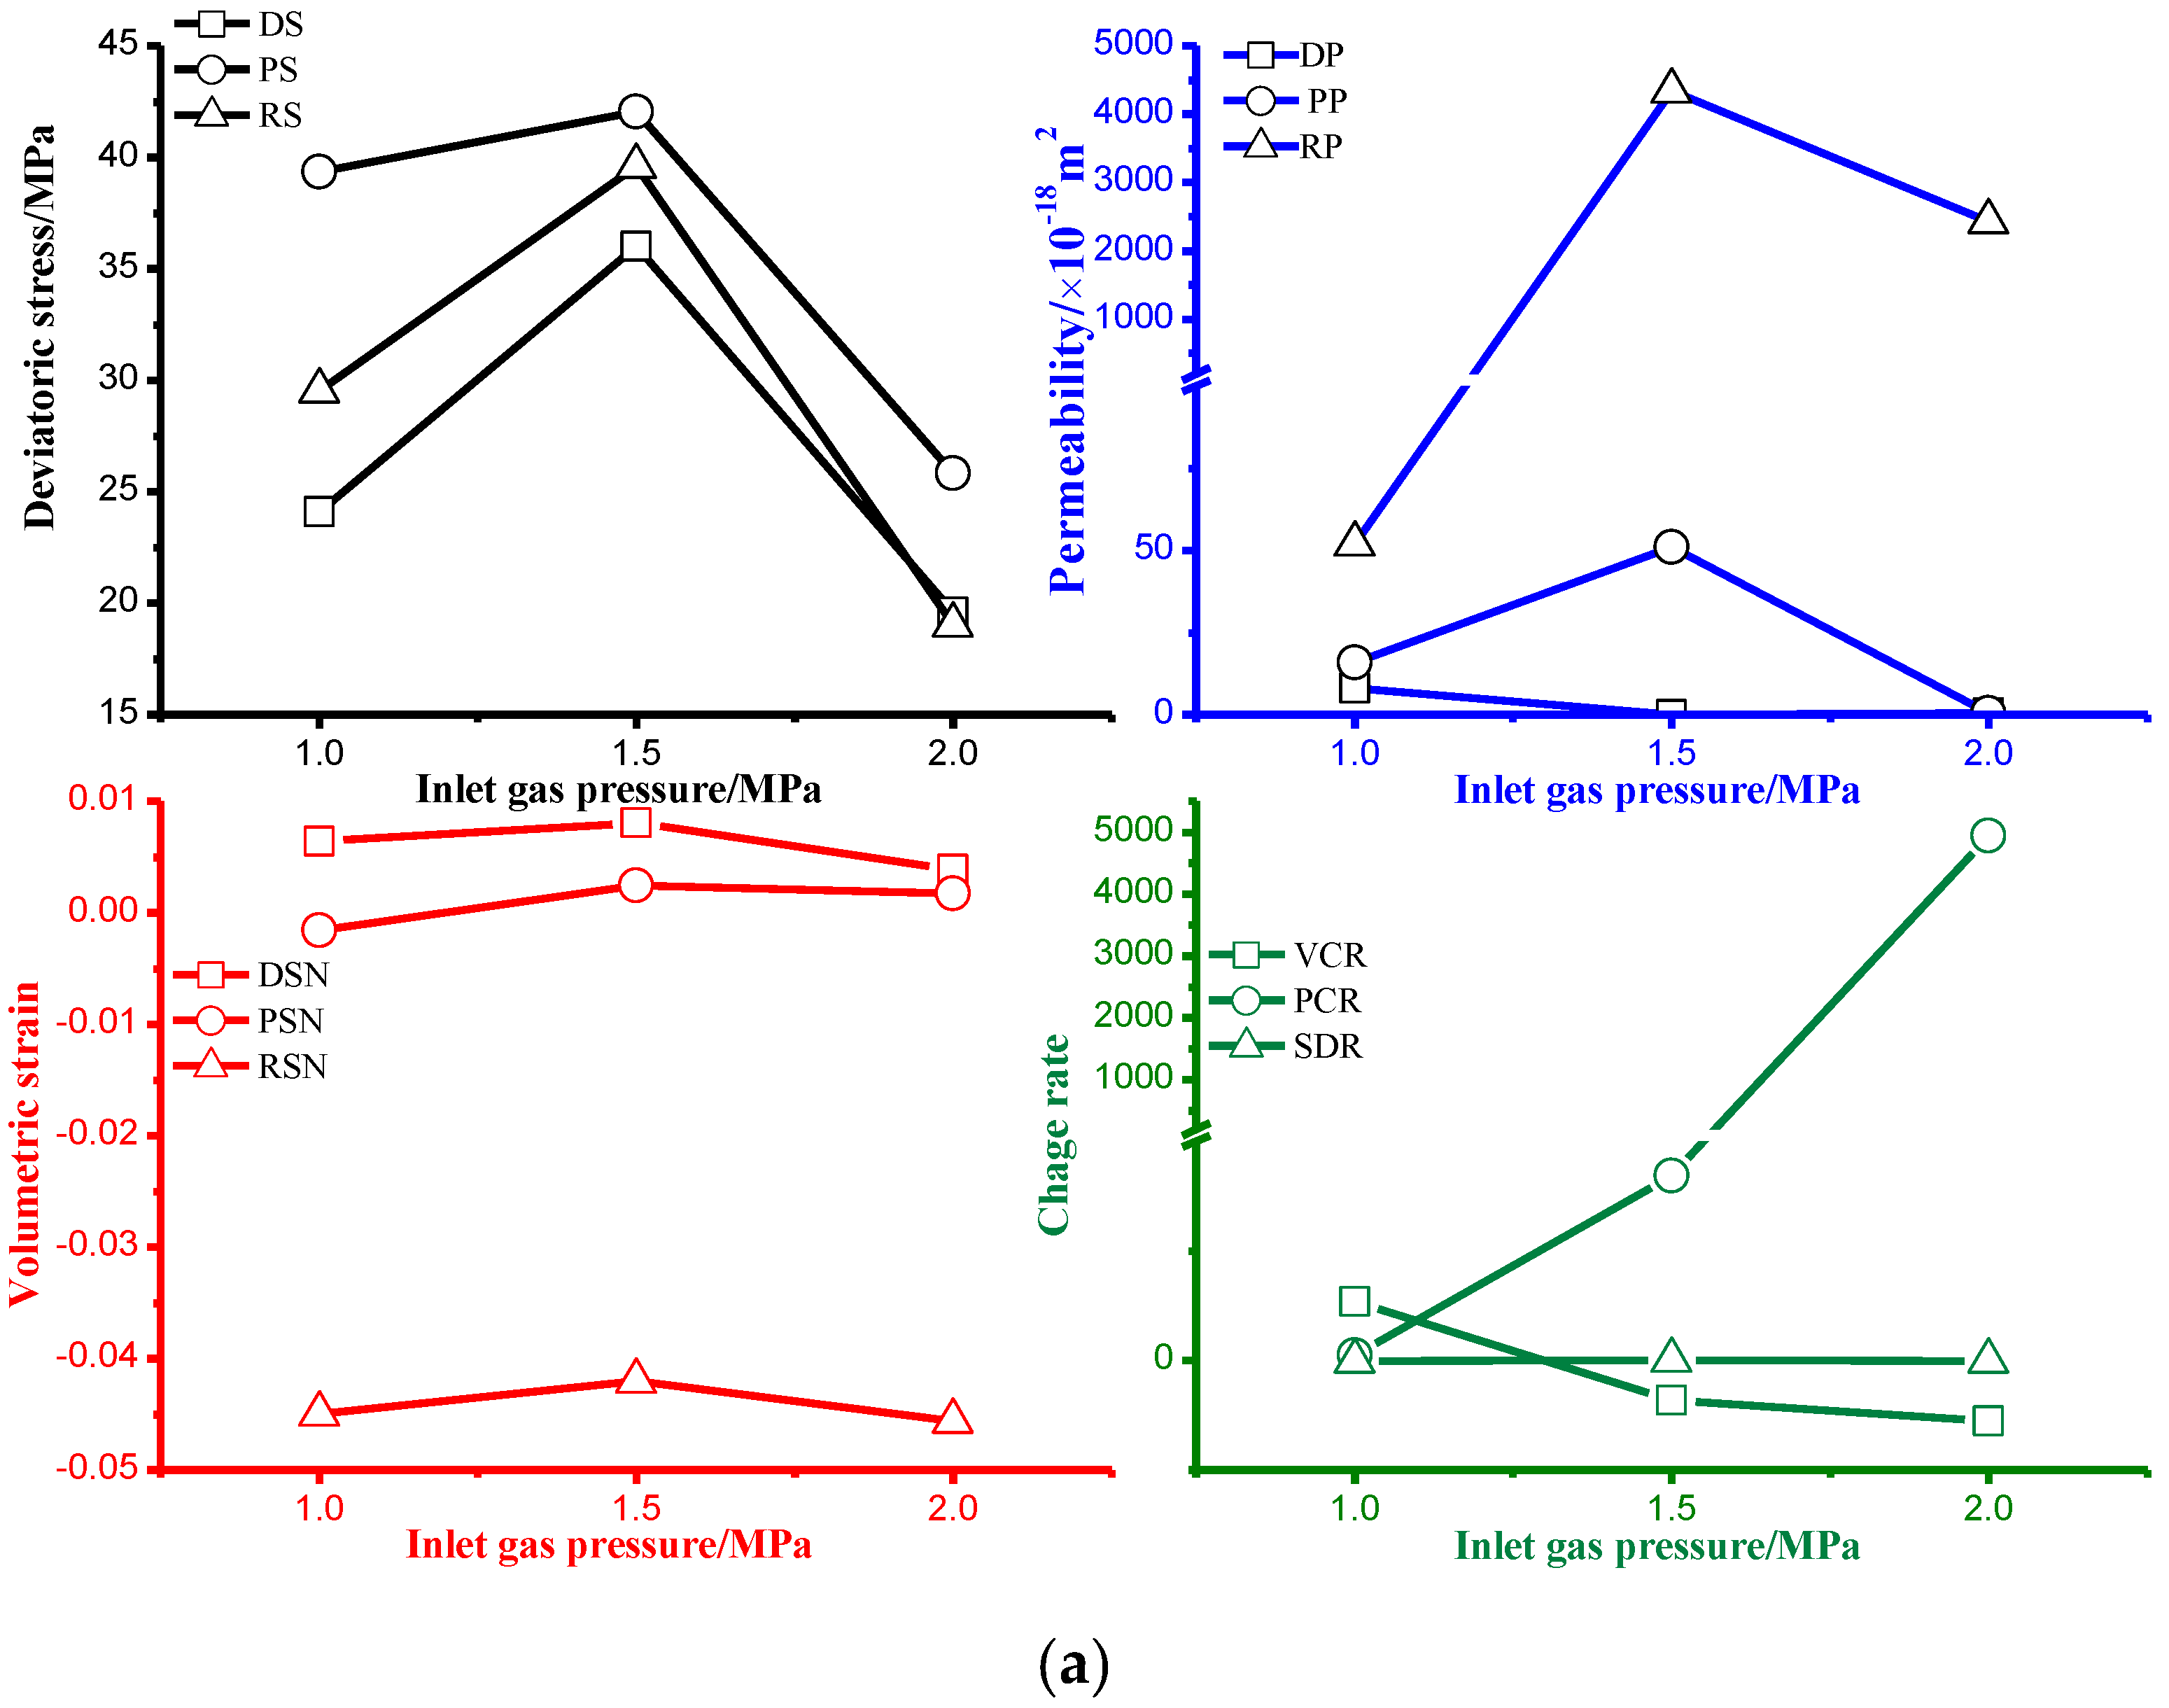
3.3. Effect of Gas Pressure on Deformation and CH4 Seepage
4. Percolation Model for Critical Behavior of CH4 Seepage
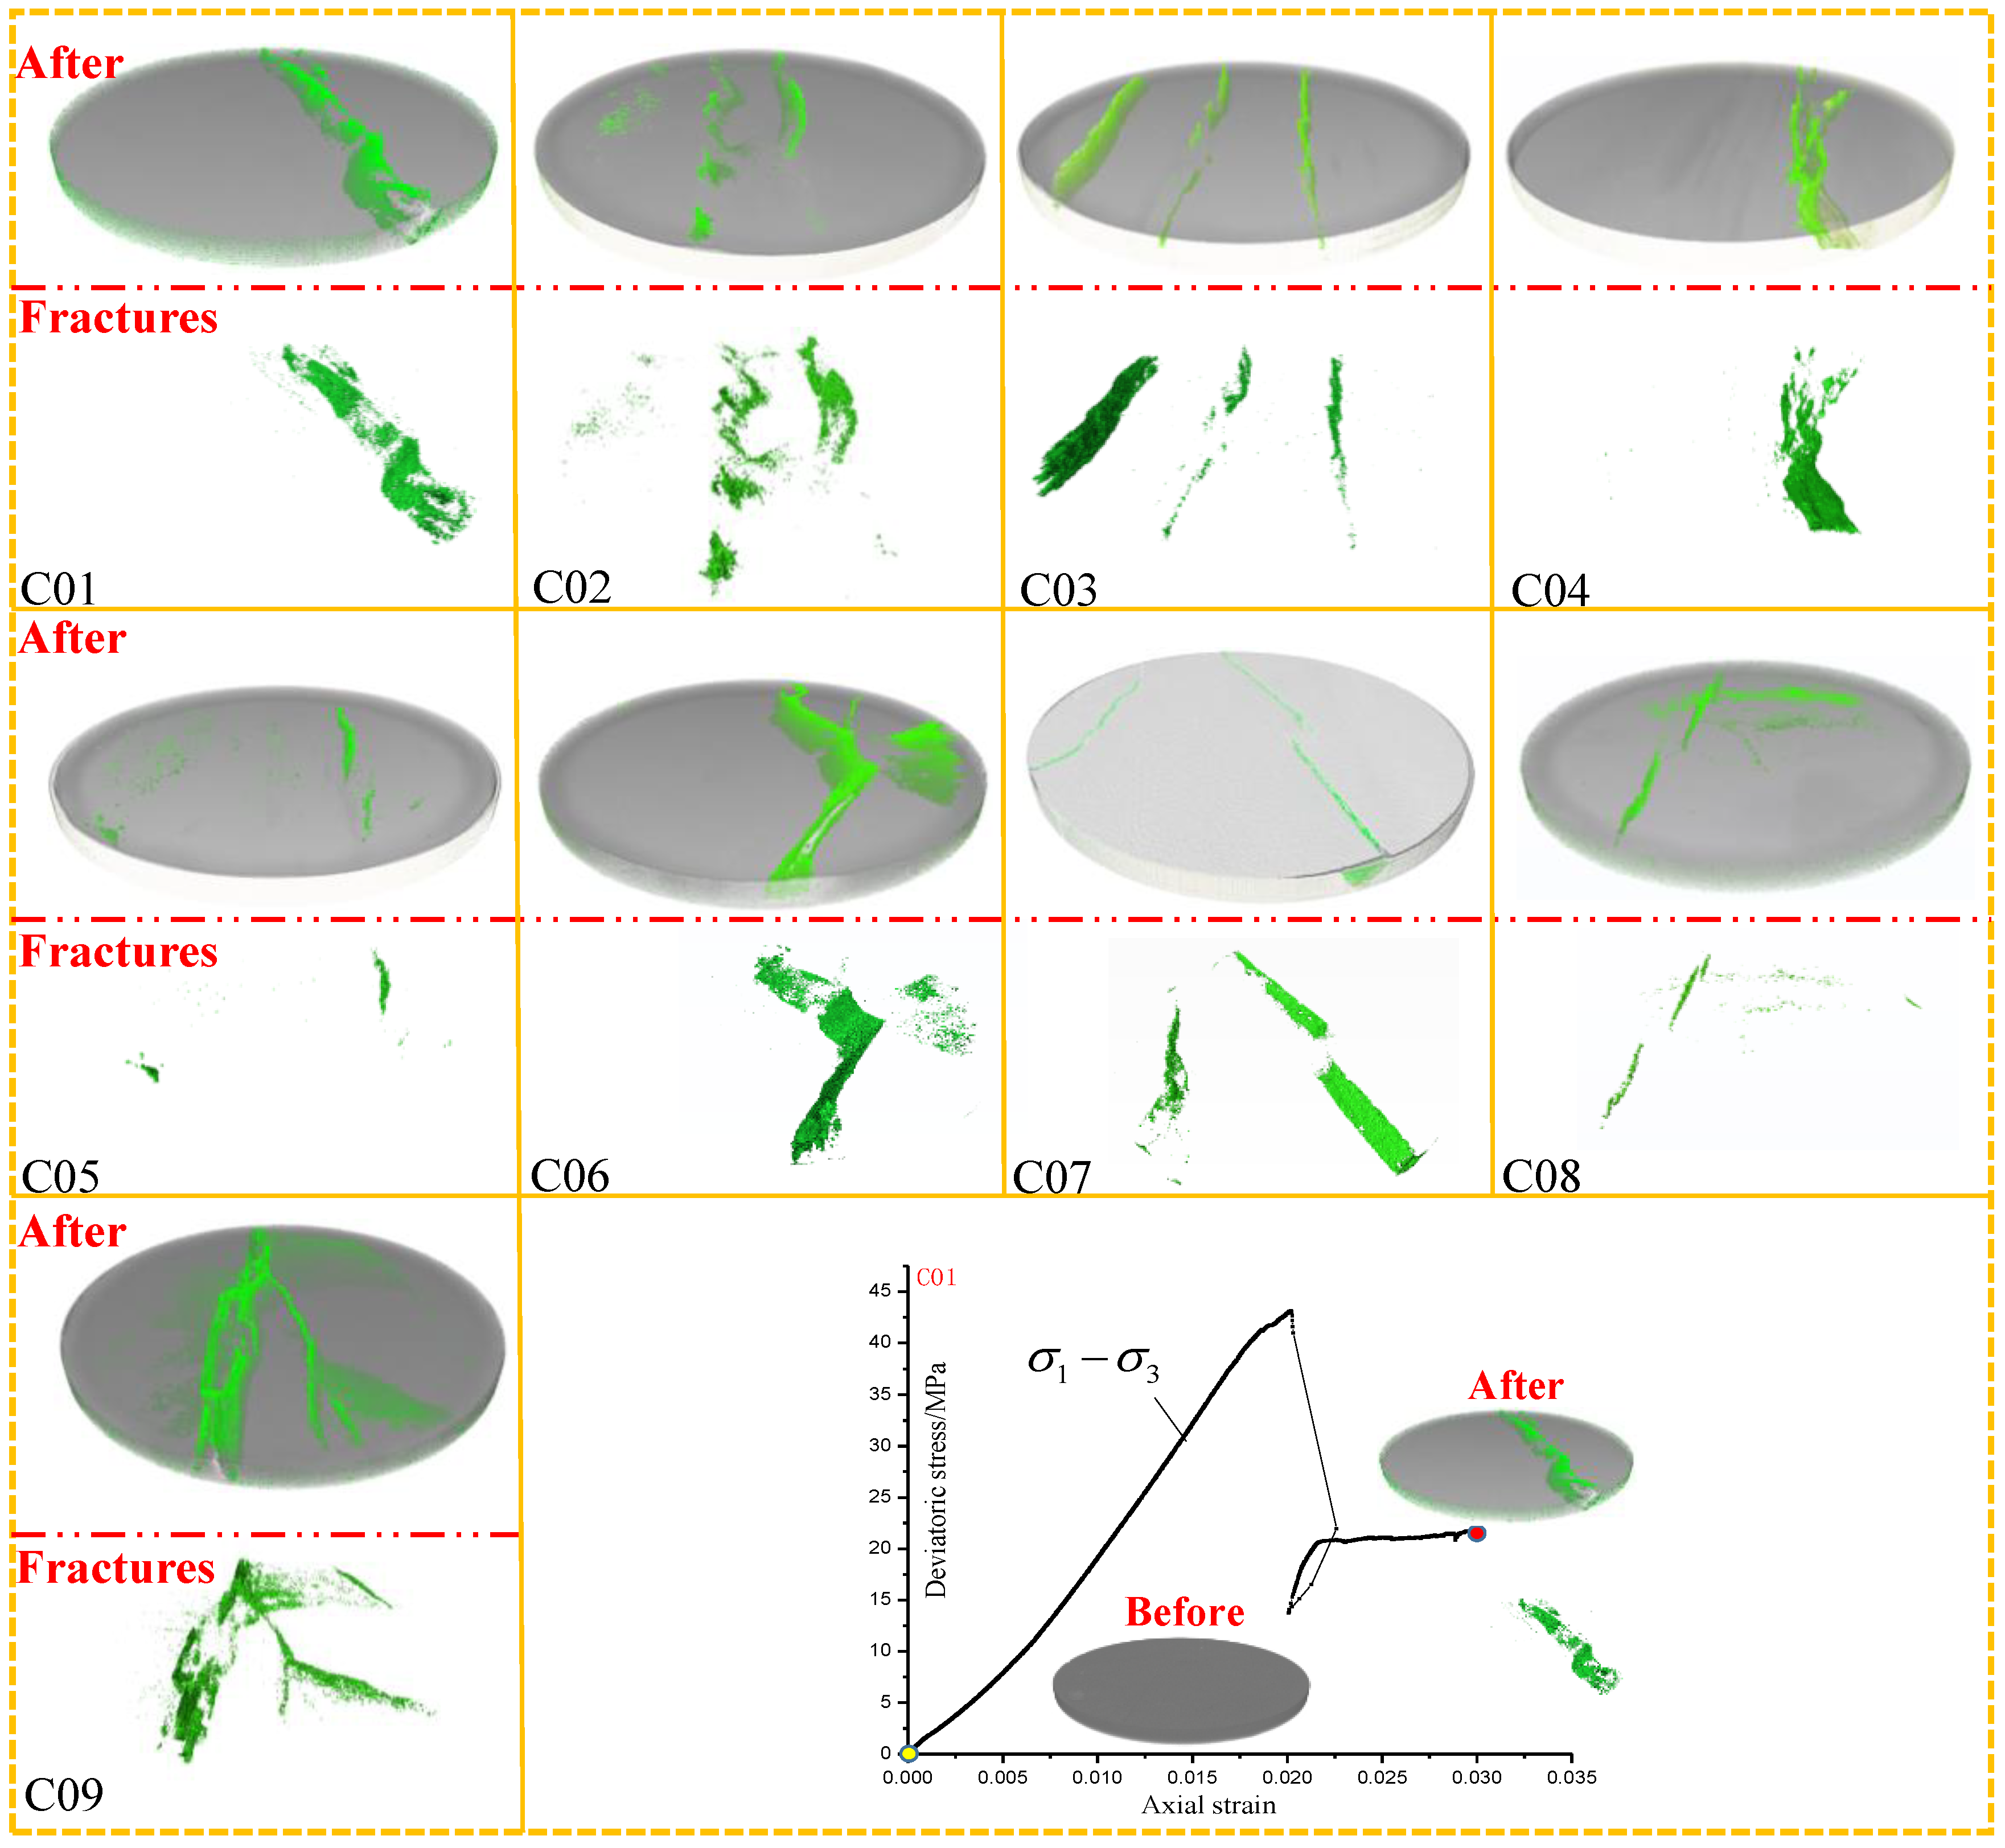
4.1. CT Reconstruction of Network and Determination of Fractal Dimension
4.2. Probability of Multiscale Connectivity Denfined by Strain-Based Damage
4.3. Percolation Model for Transition Behavior of CH4 Seepage
5. Conclusions
- The gas-stress coupled experiment was carried out for ineffectiveness of the stress-dependent model of permeability at the dilatant boundary. The results show that before failure, coal, as a porous medium, can be coupled with CH4 seepage by the Darcy’s flow, and after failure, coal as a fractured medium can be solved by the cubic law. The closed space before and after failure is the key controlling the assumptions for the law. The stress-dependent model is only effective based on the representative volume element as the continuous medium. The results also show that breakage of the closed space at the dilatant boundary will cause the multiscale behavior, with a sudden increase in volumetric strain and permeability.
- The coupled strain-permeability of orthogonal experiments on confining pressure and gas pressure was investigated. The results show that there is not good agreement between deviatoric stress, volumetric strain, permeability, change rate, and confining pressure and pore pressure. Almost all the samples have a highly consistent relationship between volumetric strain and permeability at the dilatant point, peak point, and residual point of the stress-strain curve.
- CT-based reconstruction of multiscale networks in coal at the dilatant boundary is proposed. The results of all samples show various kinds of multiscale networks, and the isolated micropores can be neglected in the linear deformation for the transition of permeability. The shear stress induced by nonlinear deformation of the network should receive more attention.
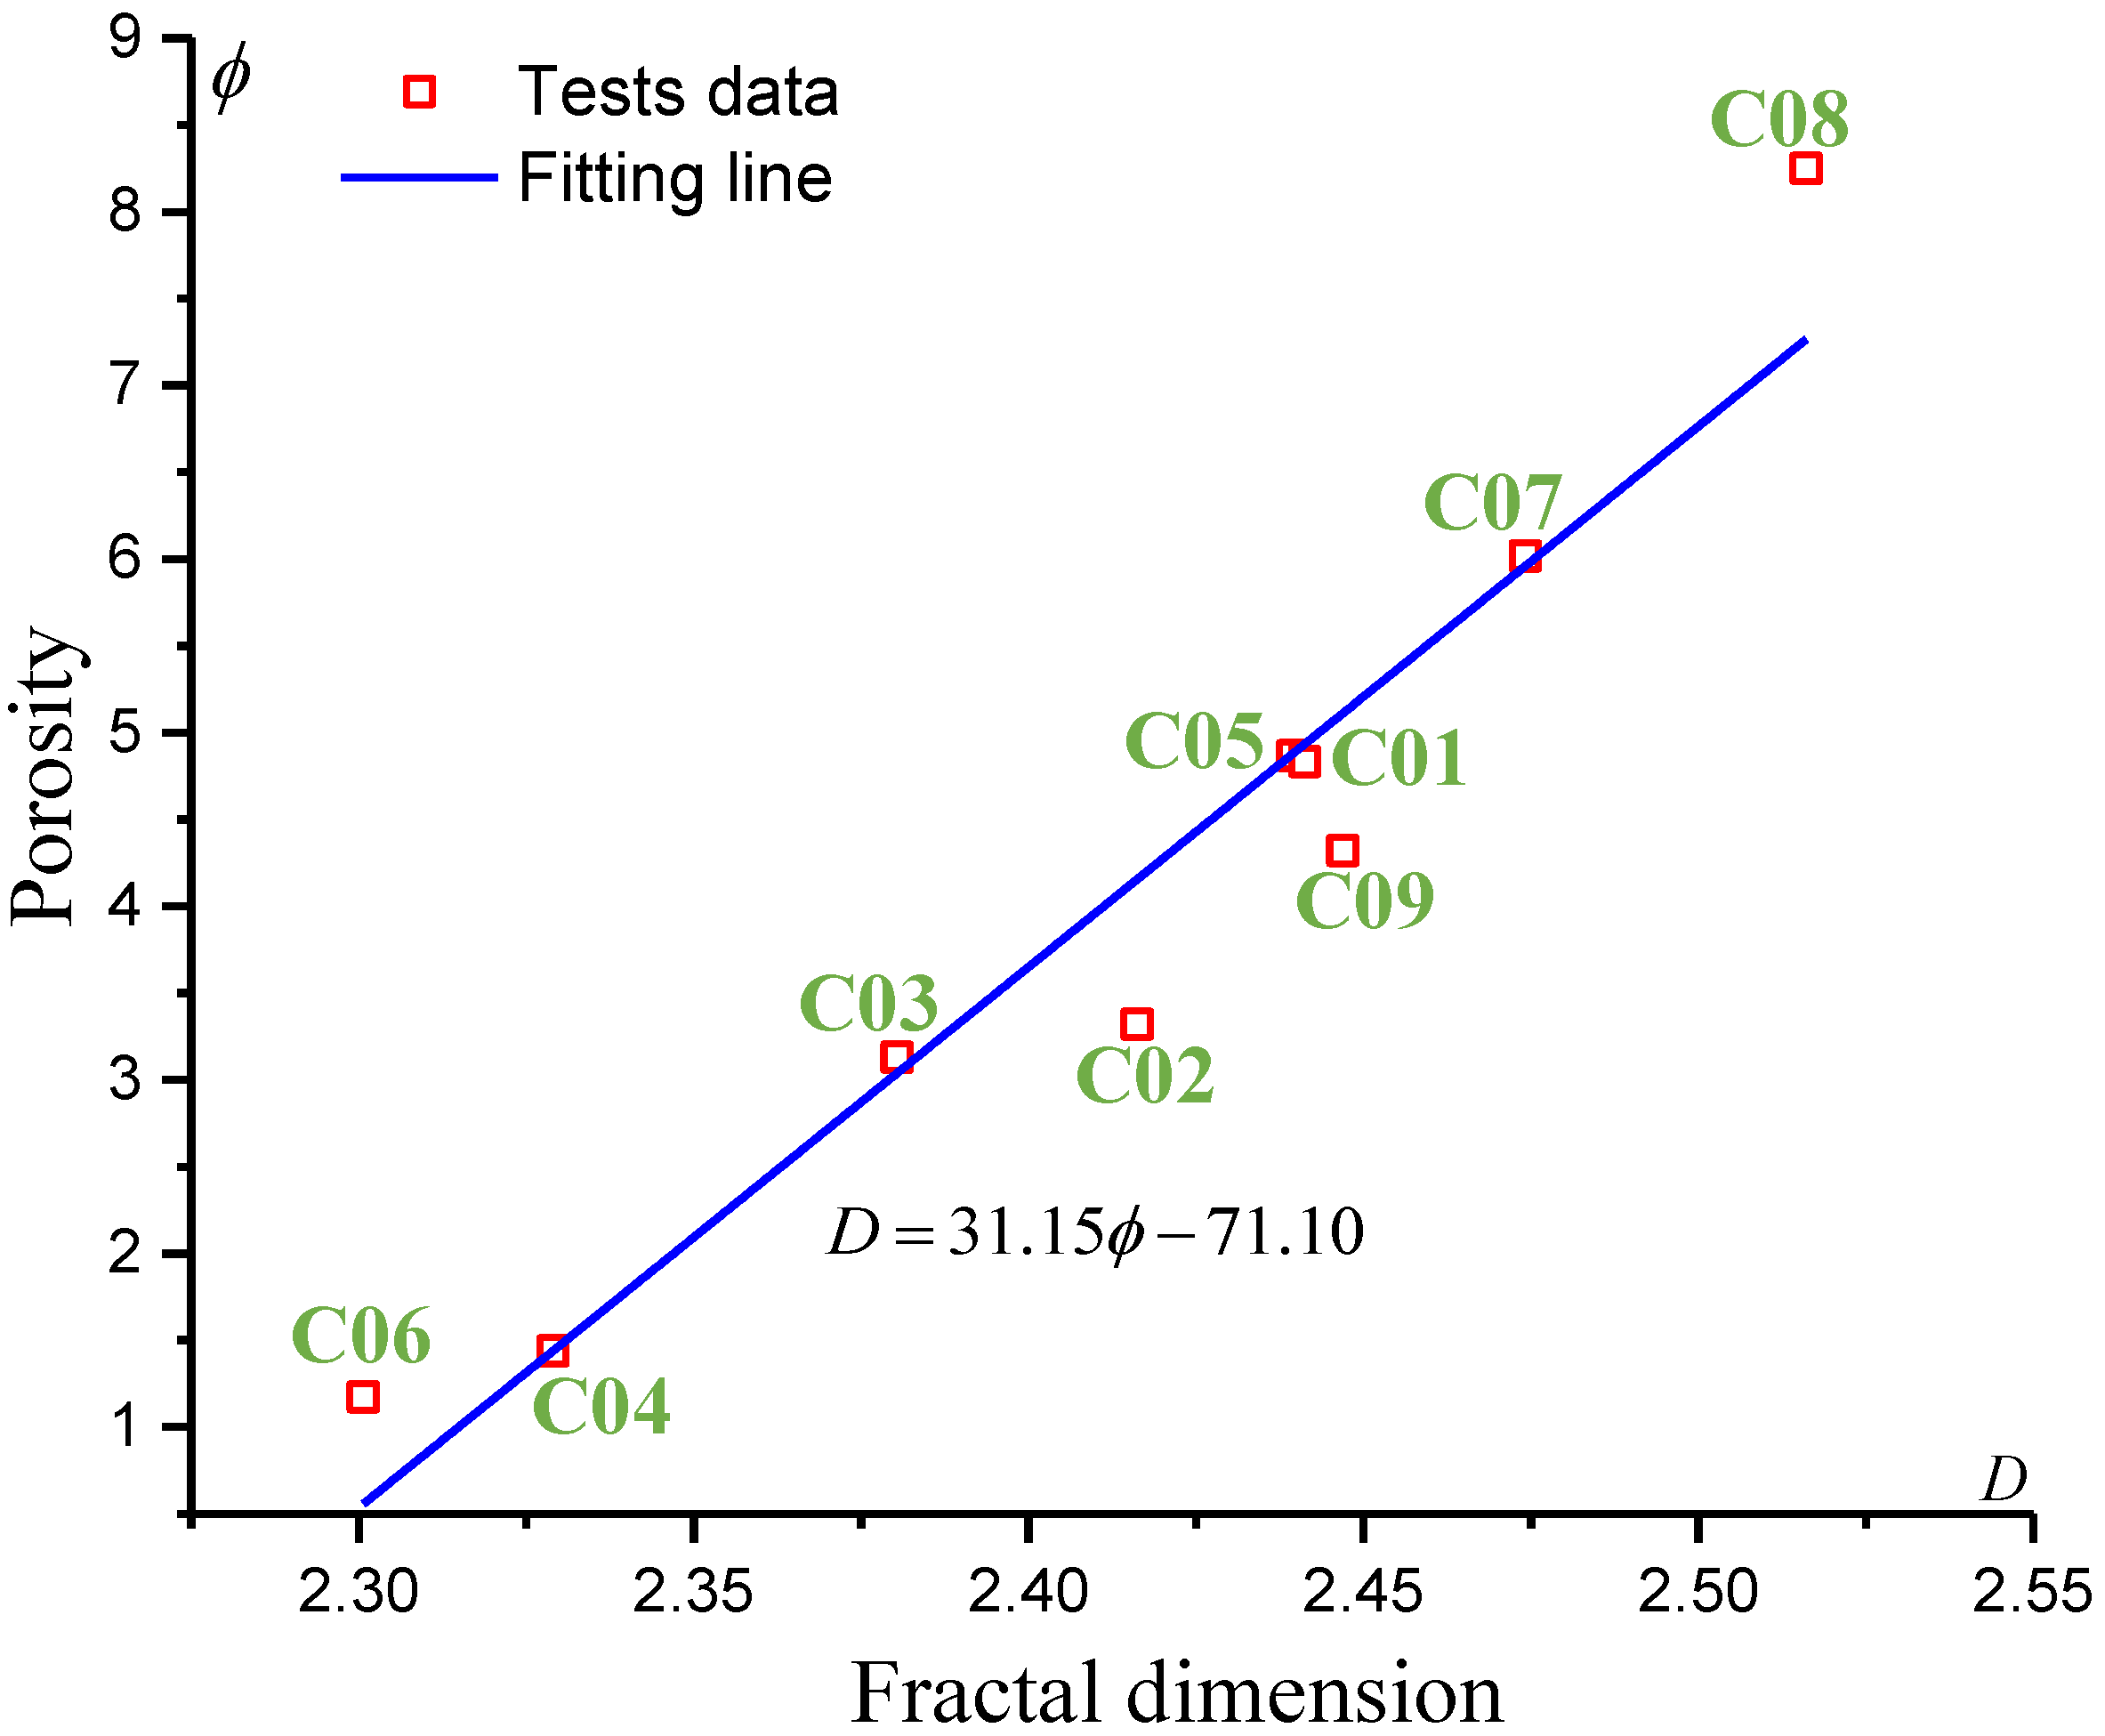
- The fractal percolation model of the multiscale network by shear stress is verified by the volume-covering method. The linear relationship between porosity and fractal dimension by the volume-covering method shows the multiscale effect and effective description by fractal theory. The scale invariance of void density, connectivity, and conductivity suggests the percolation model’s understanding of the coupled behavior of gas-stress-induced behavior.
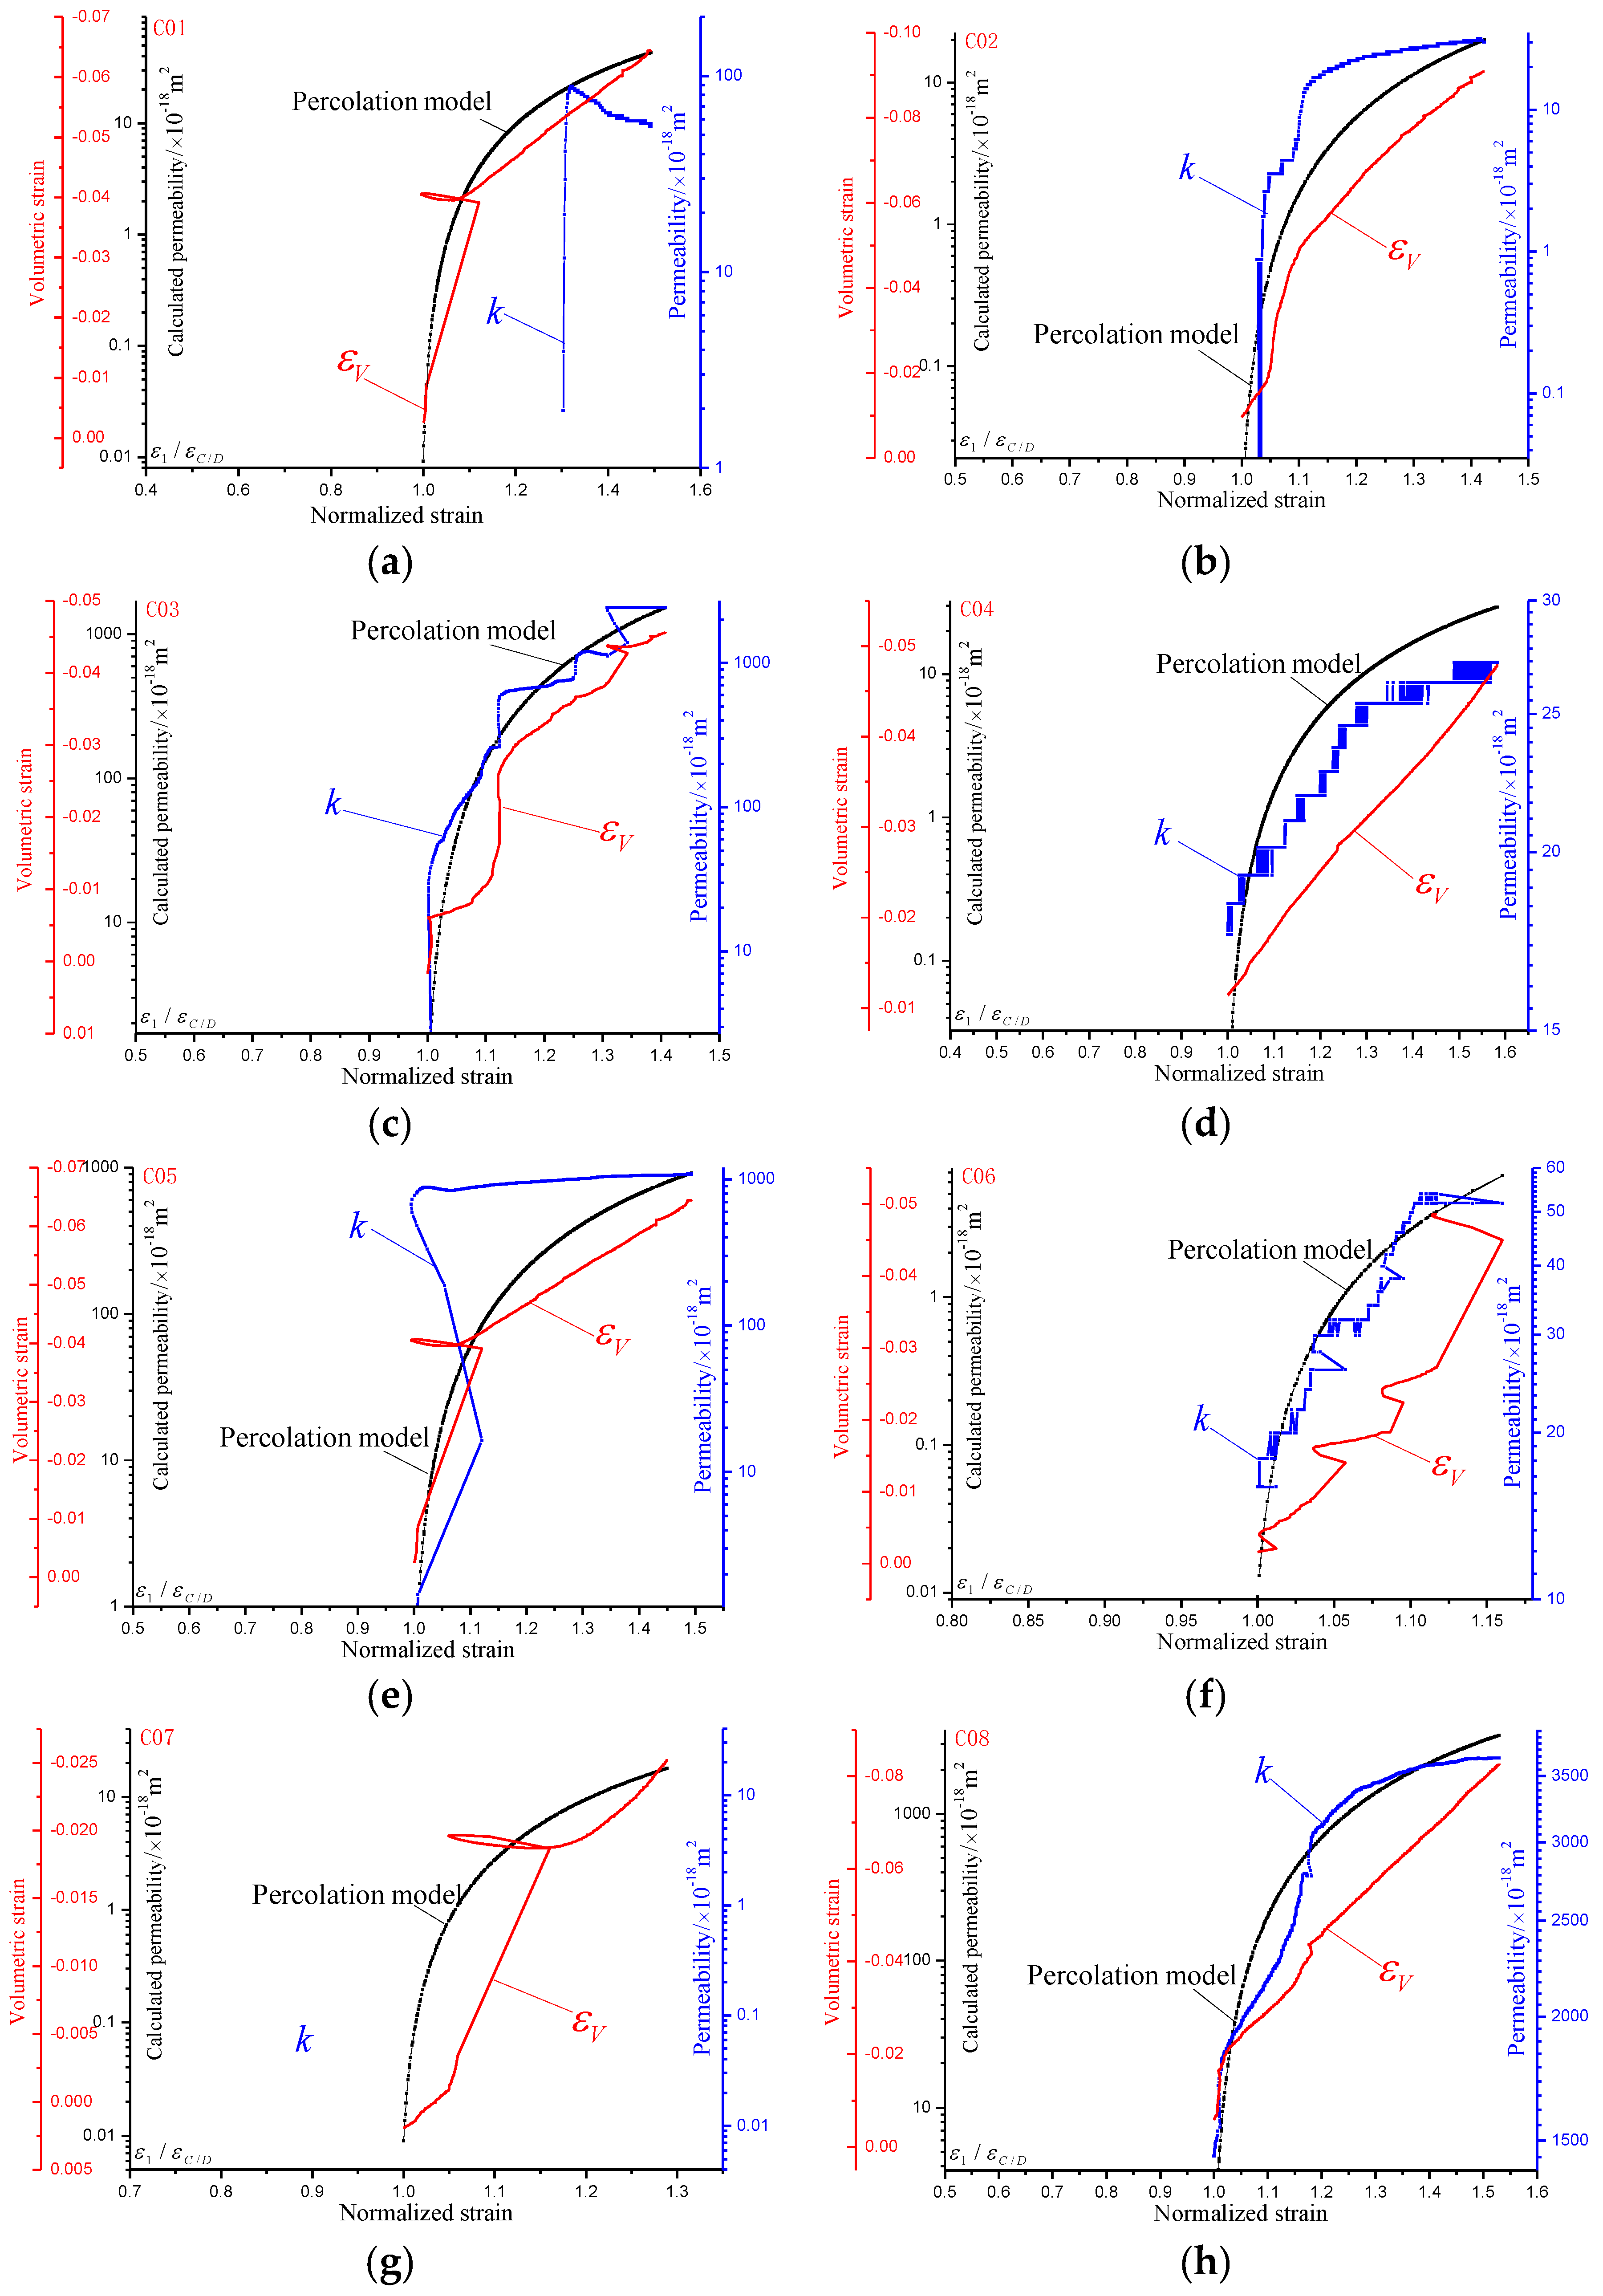
- The strain-based percolation model of permeability evolution under triaxial compression is proposed. The volumetric strain of connected clusters in triaxial compression dominates the transition behavior. The evolution of permeability with volumetric strain shows a good correlation. The results show that the percolation model is very effective at illustrating and predicting the sudden transition behavior of CH4 seepage in coal by high agreement with the experimental data.
Author Contributions
Funding
Acknowledgments
Conflicts of Interest
Abbreviations
| DS | Dilatant stress (deviatoric stress) |
| PS | Peak stress (deviatoric stress) |
| RS | Residual stress (deviatoric stress) |
| DP | Dilatant permeability |
| PP | Peak permeability |
| RP | Residual permeability |
| DSN | Dilatant strain |
| PSN | Peak strain |
| RSN | Residual strain |
| SDR | Stress drop rate |
| PCR | Permeability change rate |
| VCR | Volumetric strain change rate |
| EDZ | Excavation damaged zone |
| CT | X-ray computed tomography |
Symbol List
| , , | permeability, initial permeability, final permeability |
| atmospheric pressure, 0.1 MPa | |
| , | inlet and outlet gas pressure |
| flow rate | |
| cross-sectional area | |
| gas viscosity coefficient | |
| length | |
| fractal set | |
| parallel body with distance | |
| distance | |
| center coordinates | |
| Cartesian coordinates | |
| volume in n-dimensional space | |
| dimension of | |
| -dimensional tolerance in set | |
| prism-like volume | |
| grid coordinate | |
| total amount of volume covering one prism-like volume | |
| total amount of volume covering all prism-like volume | |
| damage | |
| porosity | |
| probability of connectivity | |
| probability of occupied lattice | |
| critical probability | |
| conductivity index | |
| , | maximum and minimum principal stress |
| , | maximum and minimum principal strain |
| , | maximum and minimum principal strain at critical dilatant boundary |
| a constant obtained from the fitting curve |
References
- Qin, Y.; Tong, F.; Yang, G.; Mauzerall, D.L. Challenges of using natural gas as a carbon mitigation option in China. Energy Policy 2018, 117, 457–462. [Google Scholar] [CrossRef]
- Li, H.; Lau, H.C.; Huang, S. China’s coalbed methane development: A review of the challenges and opportunities in subsurface and surface engineering. J. Pet. Sci. Technol. 2018, 166, 621–635. [Google Scholar] [CrossRef]
- Li, Q.; Lin, B.; Zhai, C. A new technique for preventing and controlling coal and gas outburst hazard with pulse hydraulic fracturing: A case study in Yuwu coal mine, China. Nat. Hazards 2015, 75, 2931–2946. [Google Scholar] [CrossRef]
- Yuan, L. Theory of pressure-relieved gas extraction and technique system of integrated coal production and gas extraction. J. China Coal Soc. 2009, 34, 1–8. [Google Scholar]
- Xue, D.J.; Zhou, H.W.; Chen, C.F.; Jiang, D.Y. A combined method for evaluation and prediction on permeability in coal seams during enhanced methane recovery by pressure-relieved method. Environ. Earth Sci. 2015, 73, 5963–5974. [Google Scholar] [CrossRef]
- Somerton, W.H.; Söylemezoḡlu, I.M.; Dudley, R.C. Effect of stress on permeability of coal. Int. J. Rock. Mech. Min. Sci. Geomech. Abstr. 1975, 12, 129–145. [Google Scholar] [CrossRef]
- Durucan, S.; Edwards, J.S. The effects of stress and fracturing on permeability of coal. Min. Sci. Technol. 1986, 3, 205–216. [Google Scholar] [CrossRef]
- McKee, C.R.; Bumb, A.C.; Koenig, R.A. Stress-dependent permeability and porosity of coal and other geologic formations. SPE Form. Eval. 1988, 3, 81–91. [Google Scholar] [CrossRef]
- Seidle, J.P.; Jeansonne, M.W.; Erickson, D.J. Application of matchstick geometry to stress dependent permeability in coals. Soc. Petrol. Eng. J. 1992, 1–11. [Google Scholar] [CrossRef]
- Liu, H.H.; Rutqvist, J.; Berryman, J.G. On the relationship between stress and elastic strain for porous and fractured rock. Int. J. Rock. Mech. Min. Sci. 2009, 46, 289–296. [Google Scholar] [CrossRef]
- Liu, H.H.; Rutqvist, J. A new coal-permeability model: Internal swelling stress and fracture—Matrix interaction. Transp. Porous Media 2010, 82, 157–171. [Google Scholar] [CrossRef]
- Shi, J.Q.; Durucan, S. Drawdown induced changes in permeability of coalbeds: A new interpretation of the reservoir response to primary recovery. Transp. Porous Media 2004, 56, 1–16. [Google Scholar] [CrossRef]
- Witherspoon, P.A.; Wang, J.S.Y.; Iwai, K.; Gale, J.E. Validity of Cubic Law for fluid flow in a deformable rock fracture. Water Resour. Res. 1980, 16, 1016–1024. [Google Scholar] [CrossRef]
- Valdes-Parada, F.J.; Ochoa-Tapia, J.A.; Alvarez-Ramirez, J. Validity of the permeability Carman–Kozeny equation: A volume averaging approach. Phys. A Stat. Mech. Appl. 2009, 388, 789–798. [Google Scholar] [CrossRef]
- Kruczek, B. Carman–Kozeny Equation. In Encyclopedia of Membranes; Springer: Berlin, Germany, 2014; pp. 1–3. [Google Scholar]
- Brush, D.J.; Thomson, N.R. Fluid flow in synthetic rough-walled fractures: Navier-Stokes, Stokes, and local cubic law simulations. Water Resour. Res. 2003, 39, 1–5. [Google Scholar] [CrossRef]
- Zhu, W.; Wong, T.F. The transition from brittle faulting to cataclastic flow: Permeability evolution. J. Geophys. Res. Solid Earth 1997, 102, 3027–3041. [Google Scholar] [CrossRef]
- Zhu, W.; Wong, T.F. Network modeling of the evolution of permeability and dilatancy in compact rock. J. Geophys. Res. Solid Earth 1999, 104, 2963–2971. [Google Scholar] [CrossRef]
- Isichenko, M.B. Percolation, statistical topography, and transport in random media. Rev. Mod. Phys. 1992, 64, 961–1043. [Google Scholar] [CrossRef]
- Hunt, A.; Ewing, R.; Ghanbarian, B. Percolation Theory for Flow in Porous Media; Springer: Berlin, Germany, 2014. [Google Scholar]
- Broadbent, S.R.; Hammersley, J.M. Percolation Processes: I. Crystals and Mazes; Cambridge University Press: London, UK, 1957; pp. 629–641. [Google Scholar]
- Shante, V.K.S.; Kirkpatrick, S. An introduction to percolation theory. Adv. Phys. 1971, 20, 325–357. [Google Scholar] [CrossRef]
- Chelidze, T.L. Percolation and fracture. Phys. Earth Planet. Inter. 1982, 28, 93–101. [Google Scholar] [CrossRef]
- Bebbington, M.; Vere-Jones, D.; Zheng, X. Percolation Theory: A model for rock fracture? Geophys. J. Int. 1990, 100, 215–220. [Google Scholar] [CrossRef]
- Sahimi, M. Flow phenomena in rocks: From continuum models to fractals, percolation, cellular automata, and simulated annealing. Rev. Mod. Phys. 1993, 65, 1393–1534. [Google Scholar] [CrossRef]
- Alkan, H. Percolation model for dilatancy-induced permeability of the excavation damaged zone in rock salt. Int. J. Rock Mech. Min. Sci. 2009, 46, 716–724. [Google Scholar] [CrossRef]
- ASTM D2664. Standard Test Method for Triaxial Compressive Strength of Undrained Rock Core Specimens without Pore Pressure Measurement. 1986. Available online: https://www.astm.org/DATABASE.CART/HISTORICAL/D2664-95A.htm (accessed on 10 August 2018).
- Hsieh, P.A.; Tracy, J.V.; Neuzil, C.E.; Bredehoeft, J.D.; Silliman, S.E. A transient laboratory method for determining the hydraulic properties of “tight” rocks—I. Theory. Int. J. Rock Mech. Min. Sci. Geomech. Abstr. 1981, 18, 245–252. [Google Scholar] [CrossRef]
- Neuzil, C.E.; Cooley, C.; Silliman, S.E.; Bredehoeft, J.D.; Hsieh, P.A. A transient laboratory method for determining the hydraulic properties of “tight” rocks—II. Application. Int. J. Rock Mech. Min. Sci. Geomech. Abstr. 1981, 18, 253–258. [Google Scholar] [CrossRef]
- Zhou, H.W.; Xue, D.J.; Jiang, D.Y. On fractal dimension of a fracture surface by volume covering method. Surf. Rev. Lett. 2014, 21, 1–11. [Google Scholar] [CrossRef]
- Stauffer, D.; Aharony, A. Introduction to Percolation Theory: Revised Second Edition; CRC Press: London, UK, 2014. [Google Scholar]
- Sahini, M. Applications of Percolation Theory; CRC Press: London, UK, 2014; pp. 23–40. [Google Scholar]
- Hestir, K.; Long, J.C.S. Analytical expressions for the permeability of random two-dimensional Poisson fracture networks based on regular lattice percolation and equivalent media theories. J. Geophys. Res. Solid Earth 1990, 95, 21565–21581. [Google Scholar] [CrossRef]
- Sakhaee-Pour, A.; Agrawal, A. Integrating acoustic emission into percolation theory to predict permeability enhancement. J. Pet. Sci. Eng. 2018, 160, 152–159. [Google Scholar] [CrossRef]
- Louis, C. A study of groundwater flow in jointed rock and its influence on the stability of rock masses. Rock Mech. Res. Rep. 1969, 10, 1–90. [Google Scholar]
- Lomize, G.M. Flow in fractured rocks. Gosenergoizdat 1951, 127, 496. (In Russian) [Google Scholar]
- Xue, D.J.; Zhou, H.W.; Liu, Y.T.; Deng, L.S.; Zhang, L. Study of drainage and percolation of nitrogen-water flooding tight coal by NMR Imaging. Rock Mech. Rock Eng. 2018, 1–17. [Google Scholar] [CrossRef]


| Model | Classification | Gas | Lithological Type | Related Theory |
|---|---|---|---|---|
| Theory and measured data (Somerton et al., 1975) | Coal | Darcy’s law | ||
| Measured data (Durucan and Edwards, 1986) | Coal | Darcy’s law | ||
| Theory and measured data (McKee et al., 1988) | Coal | Carman-Kozeny equation | ||
| Theoretical solution (Seidle et al., 1992) | Coal | Carman-Kozeny equation | ||
| Theoretical solution (Liu et al., 2009, 2010) | Coal | Cubic law |
| Samples | Height | Cross-Section Area | Volume | Dry Weight | Density | Porosity |
|---|---|---|---|---|---|---|
| /cm | /cm2 | /cm3 | /g | g/cm3 | % | |
| C01 | 10.40 | 19.63 | 204.15 | 279.0 | 1.37 | 4.83 |
| C02 | 10.56 | 19.63 | 207.29 | 281.5 | 1.36 | 3.32 |
| C03 | 10.50 | 19.63 | 206.12 | 276.7 | 1.34 | 3.13 |
| C04 | 10.50 | 19.63 | 206.12 | 269.8 | 1.31 | 1.44 |
| C05 | 10.27 | 19.63 | 201.60 | 299.0 | 1.48 | 4.87 |
| C06 | 10.56 | 19.63 | 207.29 | 279.3 | 1.35 | 1.17 |
| C07 | 9.44 | 19.63 | 185.31 | 250.2 | 1.35 | 6.02 |
| C08 | 10.40 | 19.63 | 204.15 | 269.2 | 1.32 | 8.25 |
| C09 | 10.52 | 19.63 | 206.51 | 278.9 | 1.35 | 4.32 |
| Sample | Confining Pressure | Inlet Gas Pressure | Dilatant Stress and Strain | Peak Stress and Strain | Residual Stress and Strain | Permeability | Stress Ratio | ||||
|---|---|---|---|---|---|---|---|---|---|---|---|
| C01 | 9 | 1 | 22.77 | 0.45 | 43.12 | −0.31 | 21.58 | −6.45 | 3.93 | 56.96 | 0.53 |
| C02 | 6 | 1.5 | 17.30 | 0.38 | 35.62 | −1.05 | 26.77 | −9.01 | 16.75 | 31.73 | 0.49 |
| C03 | 3 | 2 | 18.08 | 0.39 | 25.83 | 0.17 | 19.04 | −4.56 | 0 | 2434 | 0.70 |
| C04 | 9 | 1.5 | 25.25 | 0.67 | 39.39 | −1.14 | 31.59 | −4.78 | 65.75 | 27.17 | 0.64 |
| C05 | 6 | 2 | 22.01 | 0.44 | 43.12 | −4.03 | 21.58 | −6.44 | 11.07 | 1086 | 0.51 |
| C06 | 3 | 1 | 24.37 | 0.63 | 39.20 | −0.14 | 29.53 | −4.50 | 187.5 | 51.87 | 0.62 |
| C07 | 9 | 2 | 27.38 | 0.45 | 50.78 | 0.19 | 33.43 | −2.51 | 0 | Failed | 0.54 |
| C08 | 6 | 1 | 27.36 | 0.51 | 40.53 | −0.59 | 26.15 | −8.25 | 375.2 | 3653 | 0.68 |
| C09 | 3 | 1.5 | 35.90 | 0.80 | 42.06 | 0.25 | 39.60 | −4.20 | 0 | 4343 | 0.85 |
© 2018 by the authors. Licensee MDPI, Basel, Switzerland. This article is an open access article distributed under the terms and conditions of the Creative Commons Attribution (CC BY) license (http://creativecommons.org/licenses/by/4.0/).
Share and Cite
Xue, D.; Zhou, J.; Liu, Y.; Zhang, S. A Strain-Based Percolation Model and Triaxial Tests to Investigate the Evolution of Permeability and Critical Dilatancy Behavior of Coal. Processes 2018, 6, 127. https://doi.org/10.3390/pr6080127
Xue D, Zhou J, Liu Y, Zhang S. A Strain-Based Percolation Model and Triaxial Tests to Investigate the Evolution of Permeability and Critical Dilatancy Behavior of Coal. Processes. 2018; 6(8):127. https://doi.org/10.3390/pr6080127
Chicago/Turabian StyleXue, Dongjie, Jie Zhou, Yintong Liu, and Sishuai Zhang. 2018. "A Strain-Based Percolation Model and Triaxial Tests to Investigate the Evolution of Permeability and Critical Dilatancy Behavior of Coal" Processes 6, no. 8: 127. https://doi.org/10.3390/pr6080127
APA StyleXue, D., Zhou, J., Liu, Y., & Zhang, S. (2018). A Strain-Based Percolation Model and Triaxial Tests to Investigate the Evolution of Permeability and Critical Dilatancy Behavior of Coal. Processes, 6(8), 127. https://doi.org/10.3390/pr6080127