Article

Effects of Cyclic Wetting-Drying Conditions on Elastic Modulus and Compressive Strength of Sandstone and Mudstone

1
Key Laboratory of Hydraulic and Waterway Engineering of the Ministry of Education, Chongqing Jiaotong University, Chongqing 400074, China
2
National Engineering Research Center for Inland Waterway Regulation, Chongqing Jiaotong University, Chongqing 400074, China
3
Department of Engineering and Ecological Geology, Faculty of Geology, Lomonosov Moscow State University, Moscow 119991, Russia
*
Authors to whom correspondence should be addressed.
Processes 2018, 6(12), 234; https://doi.org/10.3390/pr6120234
Submission received: 29 October 2018 / Revised: 14 November 2018 / Accepted: 16 November 2018 / Published: 22 November 2018
(This article belongs to the Special Issue Fluid Flow in Fractured Porous Media)

Abstract

:
The influence of water on the mechanical properties of rock is vital for determining the rock stability when subjected to changes of water conditions. In this paper, a series of uniaxial compression tests were conducted to investigate effects of cyclic wetting and drying on the mechanical properties of sandstone and mudstone collected from Chongqing city, China. The results showed that both elastic modulus and uniaxial compressive strength of sandstone and mudstone were reduced by wetting and drying cycles, and that the degradation rate of the two mechanic parameters of mudstone was always larger than sandstone. The parameters, including water adsorption, degradation degree of elastic modulus, degradation degree of uniaxial compressive strength, increase with the increase of the wetting-drying cycles (N). The relationship between these three parameters and the value of N + 1 could be well fitted by logarithmic curves. The average degradation degree was also used to describe the degradation of per time wetting-drying cycles. It is found that the average degradation degree of elastic modulus and uniaxial compressive strength decrease with the increase of wetting-drying cycles. Moreover, the relationships between the mechanical properties and the porosity are presented, which can be fitted by linear curves. In the cyclic wetting-drying process, the elastic modulus and the uniaxial compressive strength decreased with the porosity increasing, and the degradation rates of sandstone mechanic parameters were higher than those of mudstone.

1. Introduction

Sandstone and mudstone are two common sedimentary rocks. It is well known that sandstone has been the most common construction material through human history all over the world due to its high strength, while mudstone is characterized by low permeability and high hydrophily, as well as easy softening and decay [1]. In Chongqing city of China, the strata composed of interbedded red sandstone and mudstone are widely distributed. Because they are difficult to divide [2], the mixture of sandstone and mudstone particles is often used as a main fill material in many hydraulic and civil engineering works in Chongqing city [3]. While this material is filled in or along a large reservoir bank, it could be subjected to cyclic wetting and drying caused by cyclic lowering and rising of water level, which may affect the mechanical behavior of the mixture, and then reduces stability of filled structures [4,5,6]. The mechanical properties of the sandstone and mudstone particles mixture mainly depend on its parent rocks (sandstone and mudstone). In order to use the mixture of sandstone and mudstone particles reasonably in the civil engineering, the effect of cyclic wetting and drying on the mechanic properties of the parent rocks need to be studied first.
In recent years, the water-interaction has been viewed as a crucial factor which influences the stability of geotechnical engineering constructions and it’s becoming an important research hotspot. The effect of cyclic wetting and drying on the physical and mechanical properties of geotechnical materials such as rock and soil have been studied by many researchers, including bulk density, porosity, weight loss [7], water absorption [7], wave velocity [8], elastic modulus [9,10,11], fracture toughness [12], tensile strength [13,14], static uniaxial or triaxial compressive strength [15,16,17], dynamic uniaxial compressive strength [18], shear strength [9,10,19], granulometric change [20,21,22,23], etc. The results indicated that the degradation with different degrees of the physical and mechanic properties of rock materials occurred after cyclic wetting and drying.
Table 1 shows the recent experimental research by different scholars of the effects of cyclic wetting-drying on the mechanical parameters of various rocks. The mechanical parameters deteriorate to different degrees under the cyclic wetting-drying conditions. Hua et al. [12] found an obvious reduction in static tensile strength after cyclic wetting-drying treatment. Zhou et al. [18] found an obvious decrease in dynamic tensile strength of sandstone under cyclic wetting-drying treatment. Yao et al. and Deng et al. [9,10,11] found an evident reduction in the elastic modulus (EM) and the uniaxial compressive strength (UCS) of sandstone after cyclic wetting-drying treatment. However, some scholars [15,17] did not find an obvious decrease in the mechanical parameters of different sandstones due to cyclic wetting-drying treatment, but they indicated that the possible small strength reduction could be covered up by the inter-sample variability inherent in the strength measurements. Moreover, Lin et al. [13] observed that the UCS of sandstone with 11% chlorite reduced by 20% after 60 wetting-drying cycles, while for sandstone with 1% chlorite, the reduction was not obvious. Their study found that chlorite is dissolved and leached out more easily and that the porosity of sandstone increases, which leads to a strength reduction, with the chlorite content of the sandstone as the critical factor.
These differences mentioned above indicate that sandstone mineralogy may decide its sensitivity to cyclic wetting-drying treatments. However, the investigations have been mainly concentrated on sandstone, and the report on the effect of cyclic wetting and drying on the mechanic properties of mudstone is scarce. In this present study, the effect of cyclic wetting-drying conditions on the physical and mechanic properties of sandstone and mudstone were investigated by uniaxial compression tests.

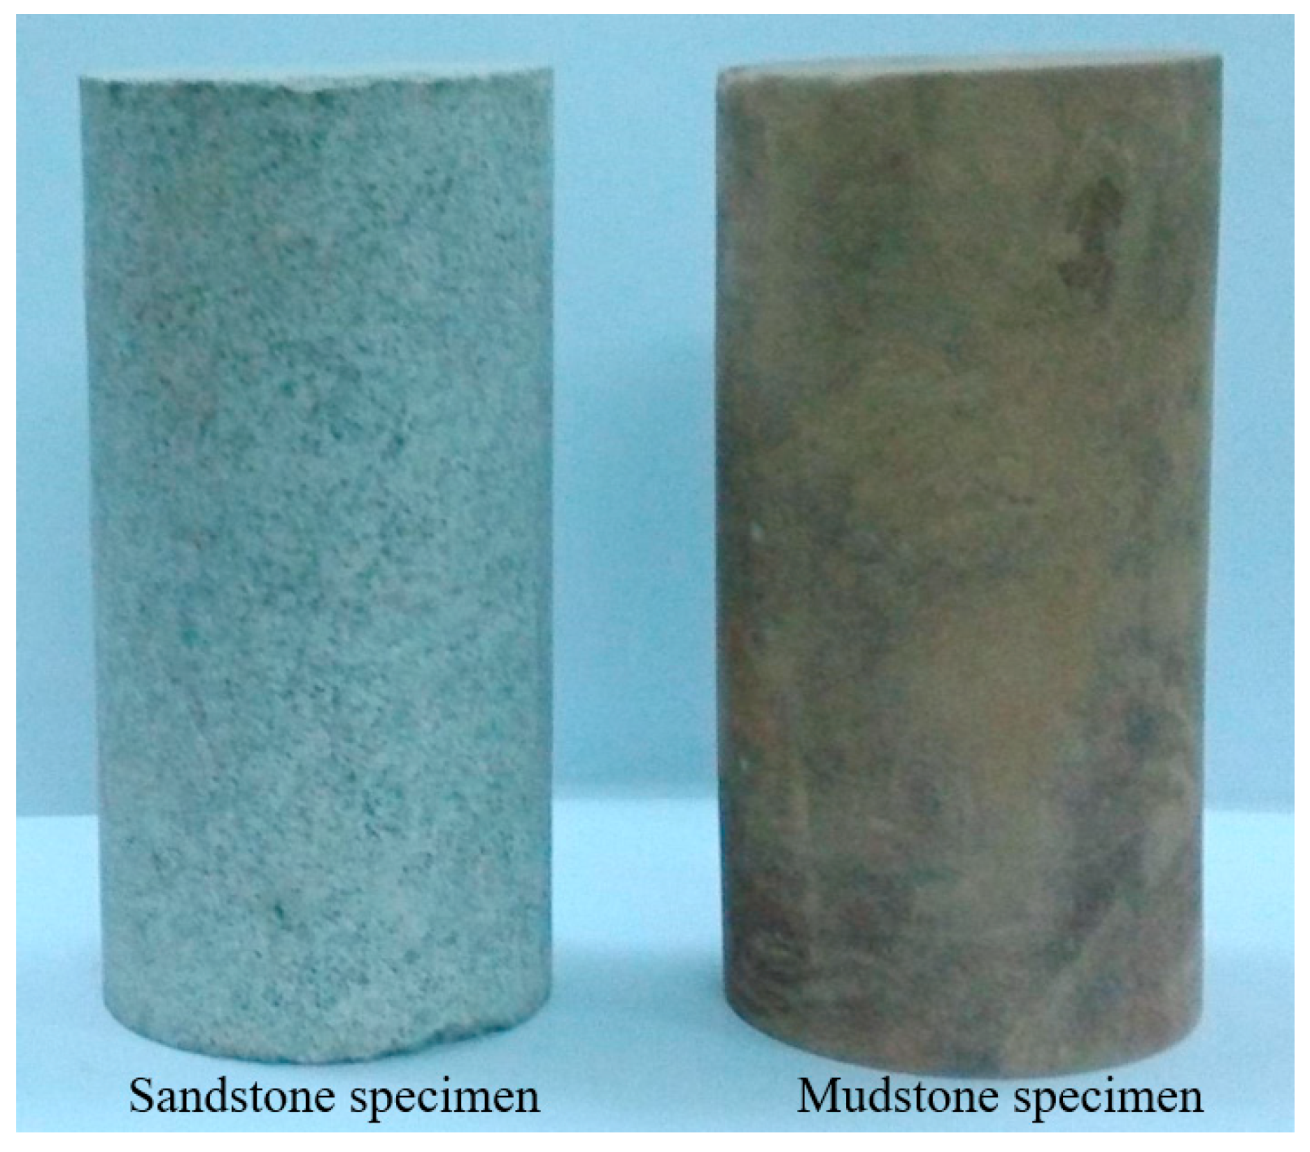
2. Test Material and Specimen Preparation

The test materials in this study came from Chongqing Jiaotong University, Chongqing city, China. The selected sandstone and mudstone were formed in Mesozoic, and the colors were fresh gray and aubergine, respectively. According to ISRM [24], specimen processing was conducted as follows: Initially, the sandstone and mudstone cylinders were obtained from the rock mass by drilling cores; later, the cylinders were made into pieces of size 50 mm in diameter and 100 mm in thickness (Figure 1). The initial water content (w), natural density (ρn) and dry density (ρd) of the sandstone specimens are 1.41%, 2.46 g/cm3, and 2.43 g/cm3, respectively. The w, ρn and ρd of the mudstone specimens are 1.75%, 2.42 g/cm3, and 2.37 g/cm3, respectively. Before testing, the specimens were stored in dry conditions with a temperature of 20 °C.

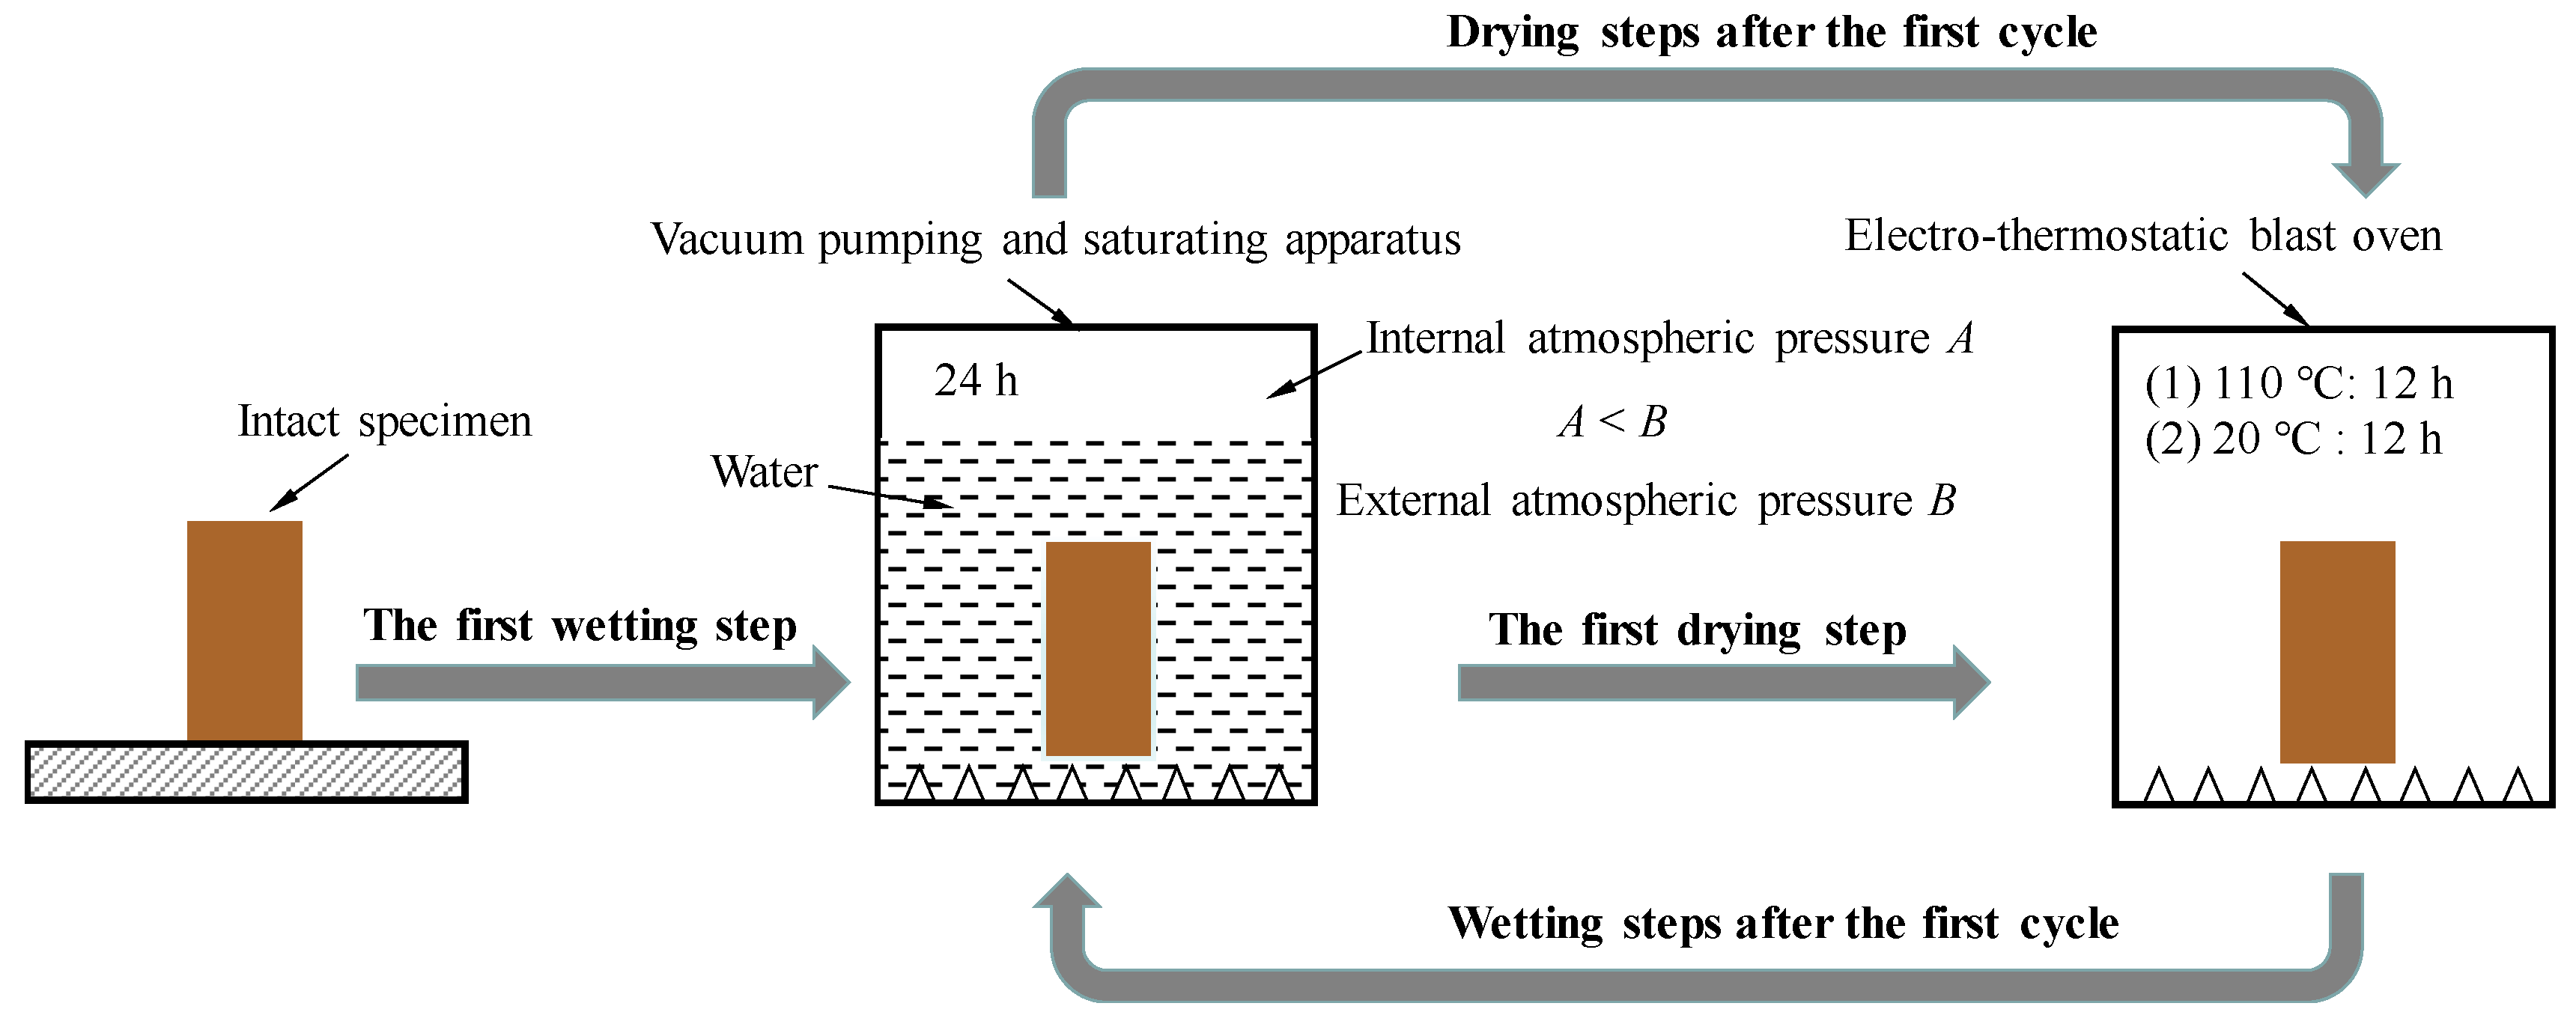
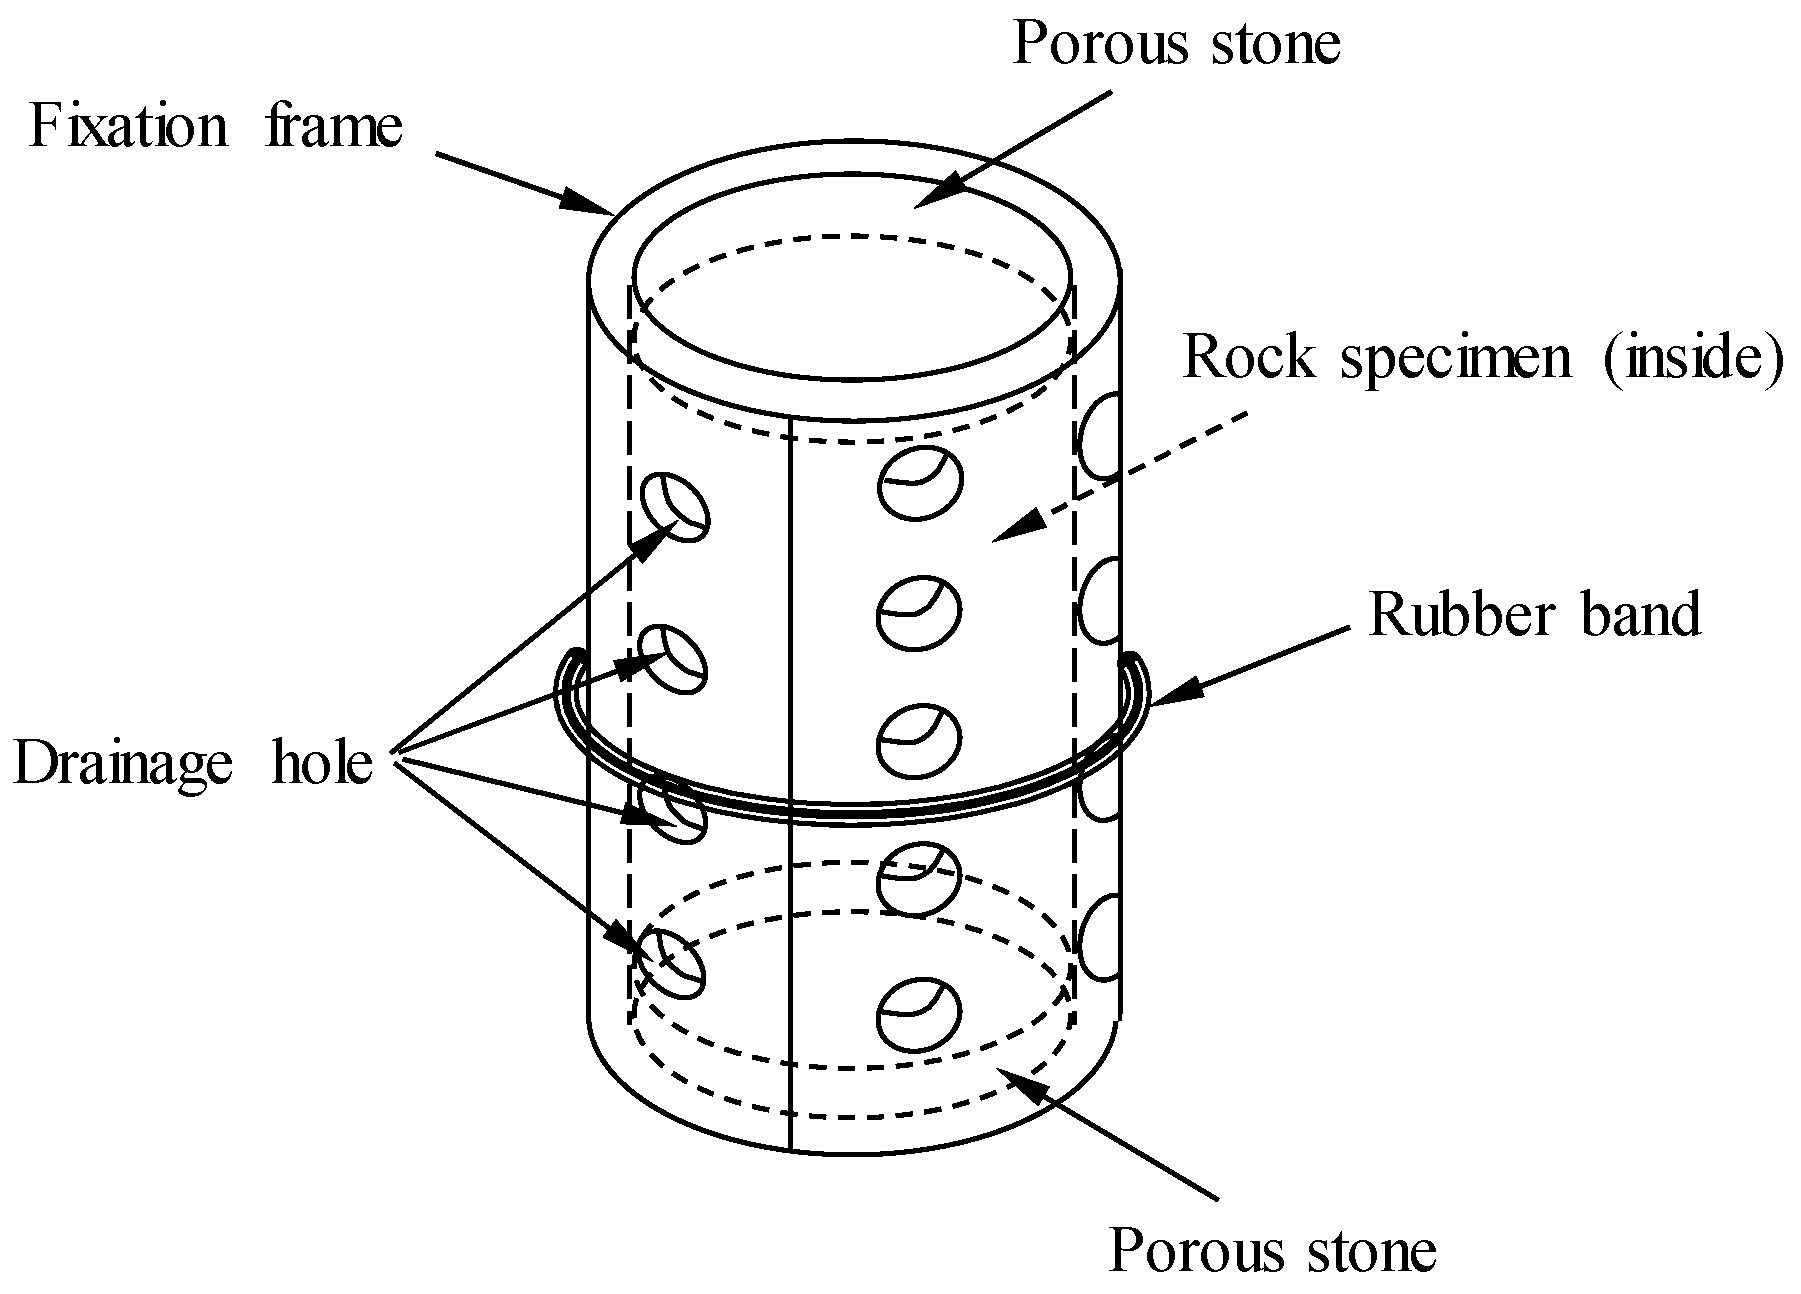
3. Testing Scheme and Testing Procedure

Wetting-drying cycle process, as an important factor affecting the mechanical properties of rocks, is focused on in this study. A uniaxial compression test in the laboratory was carried out, it is used to observe the effects of cyclic wetting-drying on rocks, which is called as wetting-drying uniaxial compression test (WDUCT).
In the WDUCT, the selected specimens were submerged in water for 24 h firstly, then these specimens were then dried in an electro-thermostatic blast oven at 110 °C for 12 h. Later, they were cooled to temperature of 20 °C for 12 h. The whole process is regarded as a single wetting-drying cycle (see Figure 2).
Before the test, both sandstone and mudstone specimens were subjected to 1, 5, 10, 15, 20 and 40 wetting and drying cycles, and 3 specimens were subjected to each of the above treatments. Meanwhile, 3 untreated sandstone specimens and 3 untreated mudstone specimens were also tested to determine the initial mechanical properties of the specimens without wetting-drying cycles.
In addition, because of the material composition, mudstone is sensitive to moisture [25,26]. When a mudstone specimen immerged into water, it will be swelled, and as time goes on, it will be disintegrated. In the process of the wetting and drying, mudstone specimens will be disturbanced unavoidably, which will fail to complete a whole uniaxial compression test. Therefore, a protection device for mudstone was designed (shown in Figure 3), it was made up of a fixation frame, two porous stones and a rubber spring. This device could ensure the specimen was completely immersed in water without particles flaking, and the garter spring will not limit the deformation of the specimen in the wetting and drying process.
However, as the tests went on, it was found that after 13 wetting and drying cycles, the selected mudstone specimens were crumbed seriously which can not be tested further, so the values of wetting and drying cycles (N) of mudstone specimens were corrected as 1, 5, 10, 12. The testing schemes are summarized in Table 2. In total, 21 sandstone specimens and 15 mudstone specimens were tested in wetting and drying cycles. Then, uniaxial compressive tests were performed under drying condition for the wetting-drying specimens. These tests were conducted in the Fundamental Mechanical Laboratory of Chongqing Jiaotong University, where the RMT-150C rock mechanic uniaxial compression testing system(Institute of Rock and Soil Mechanics, Chinses Academy of Sciences, Wuhan, China.) was used for loading (Figure 4).

4. Results and Analyses

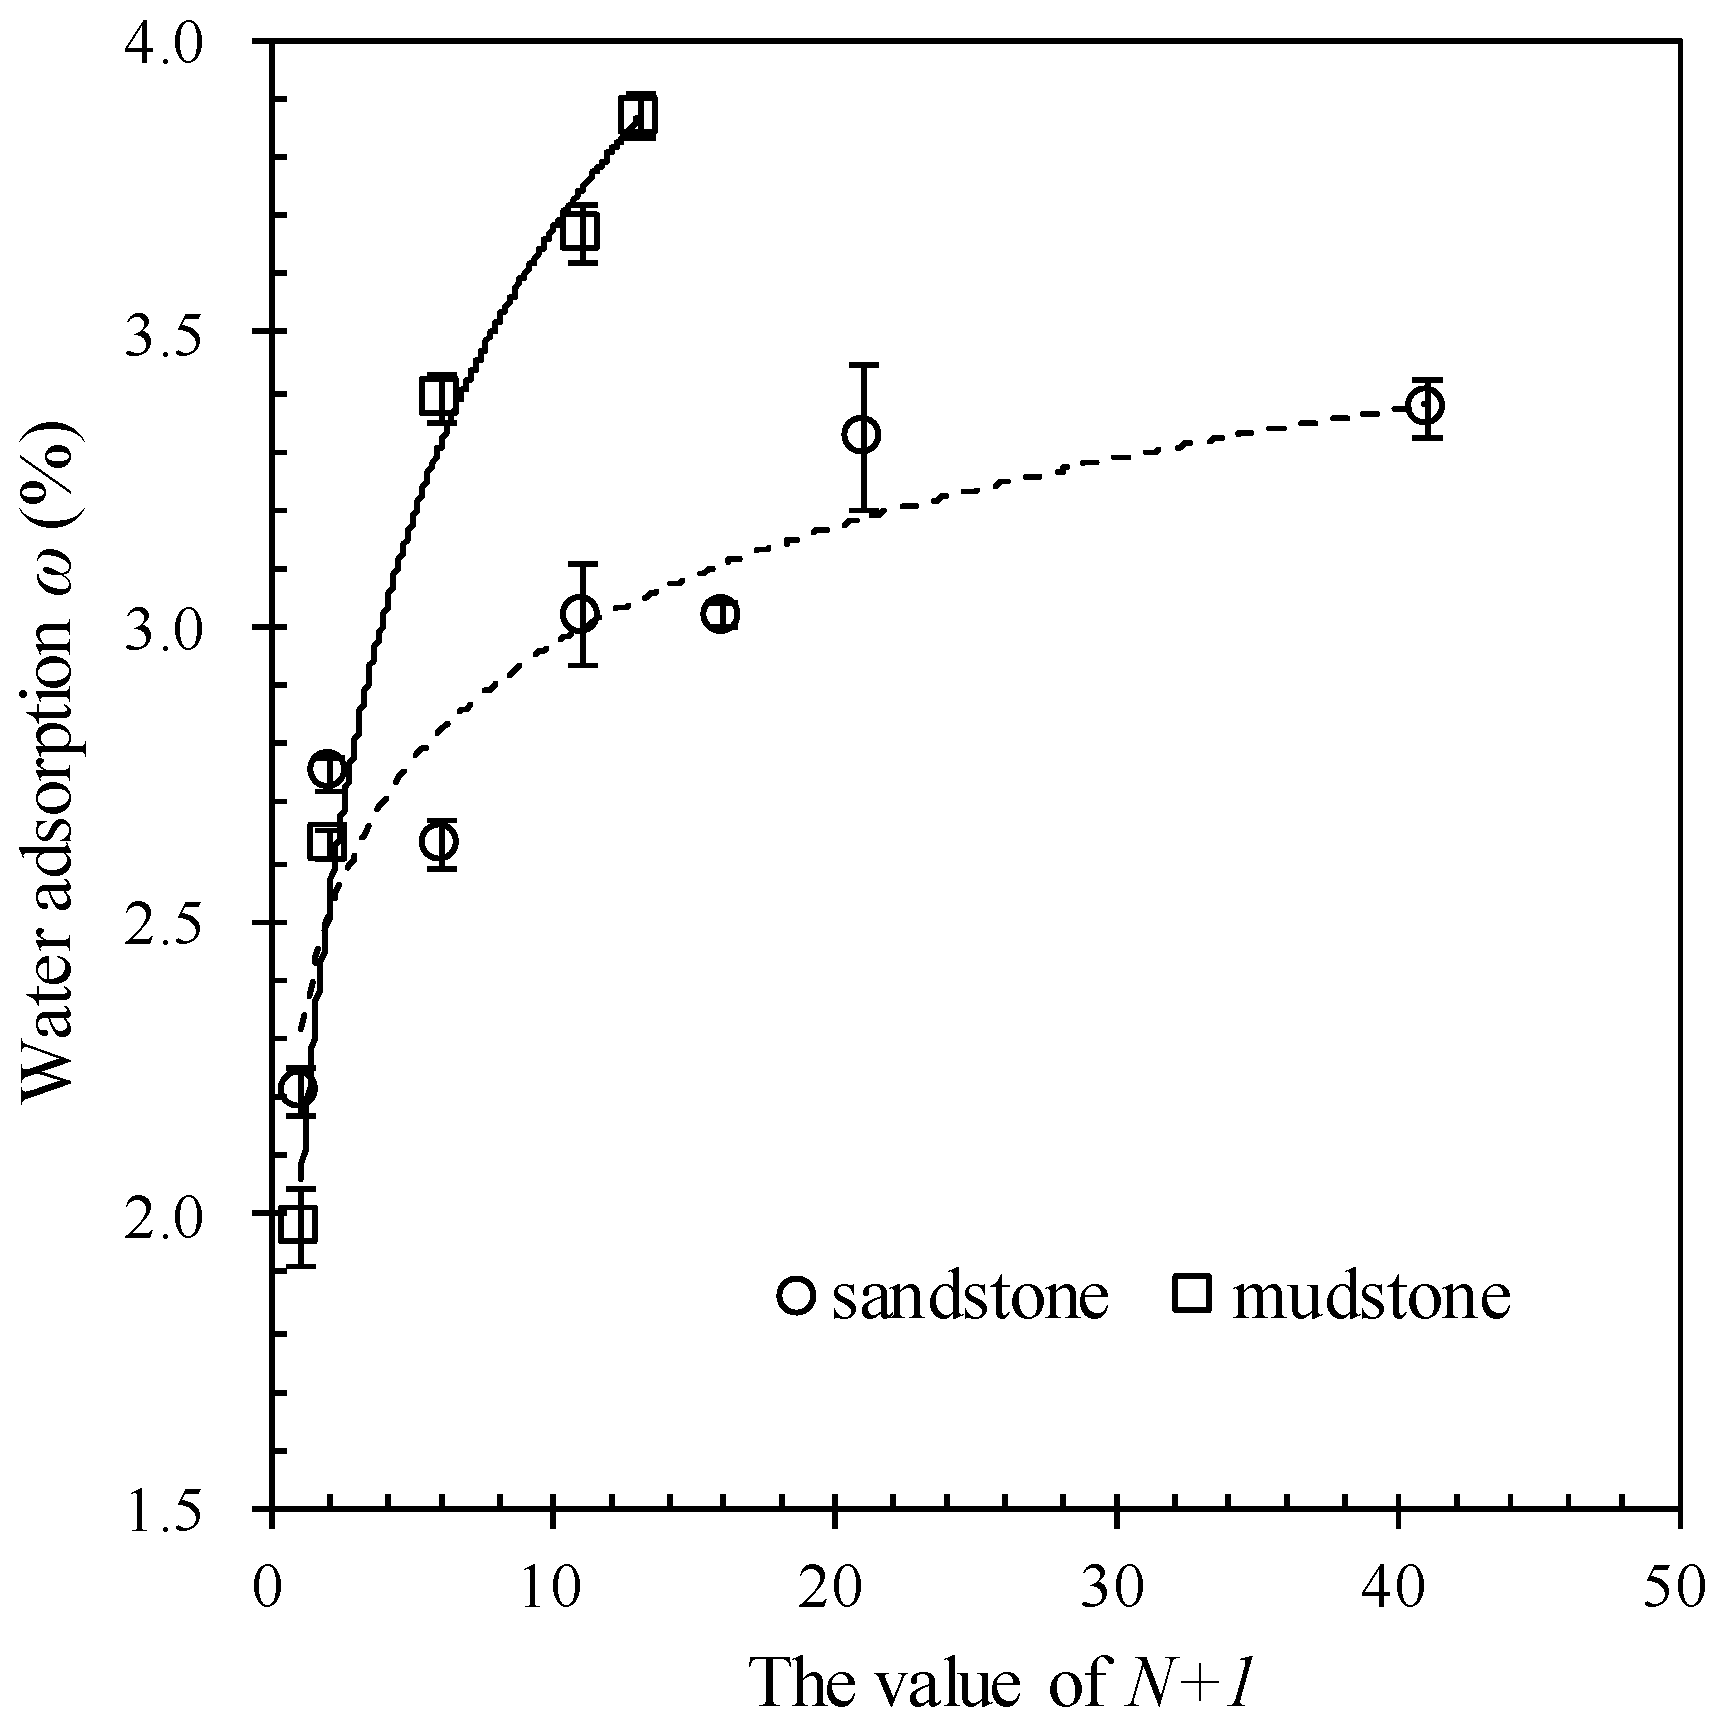
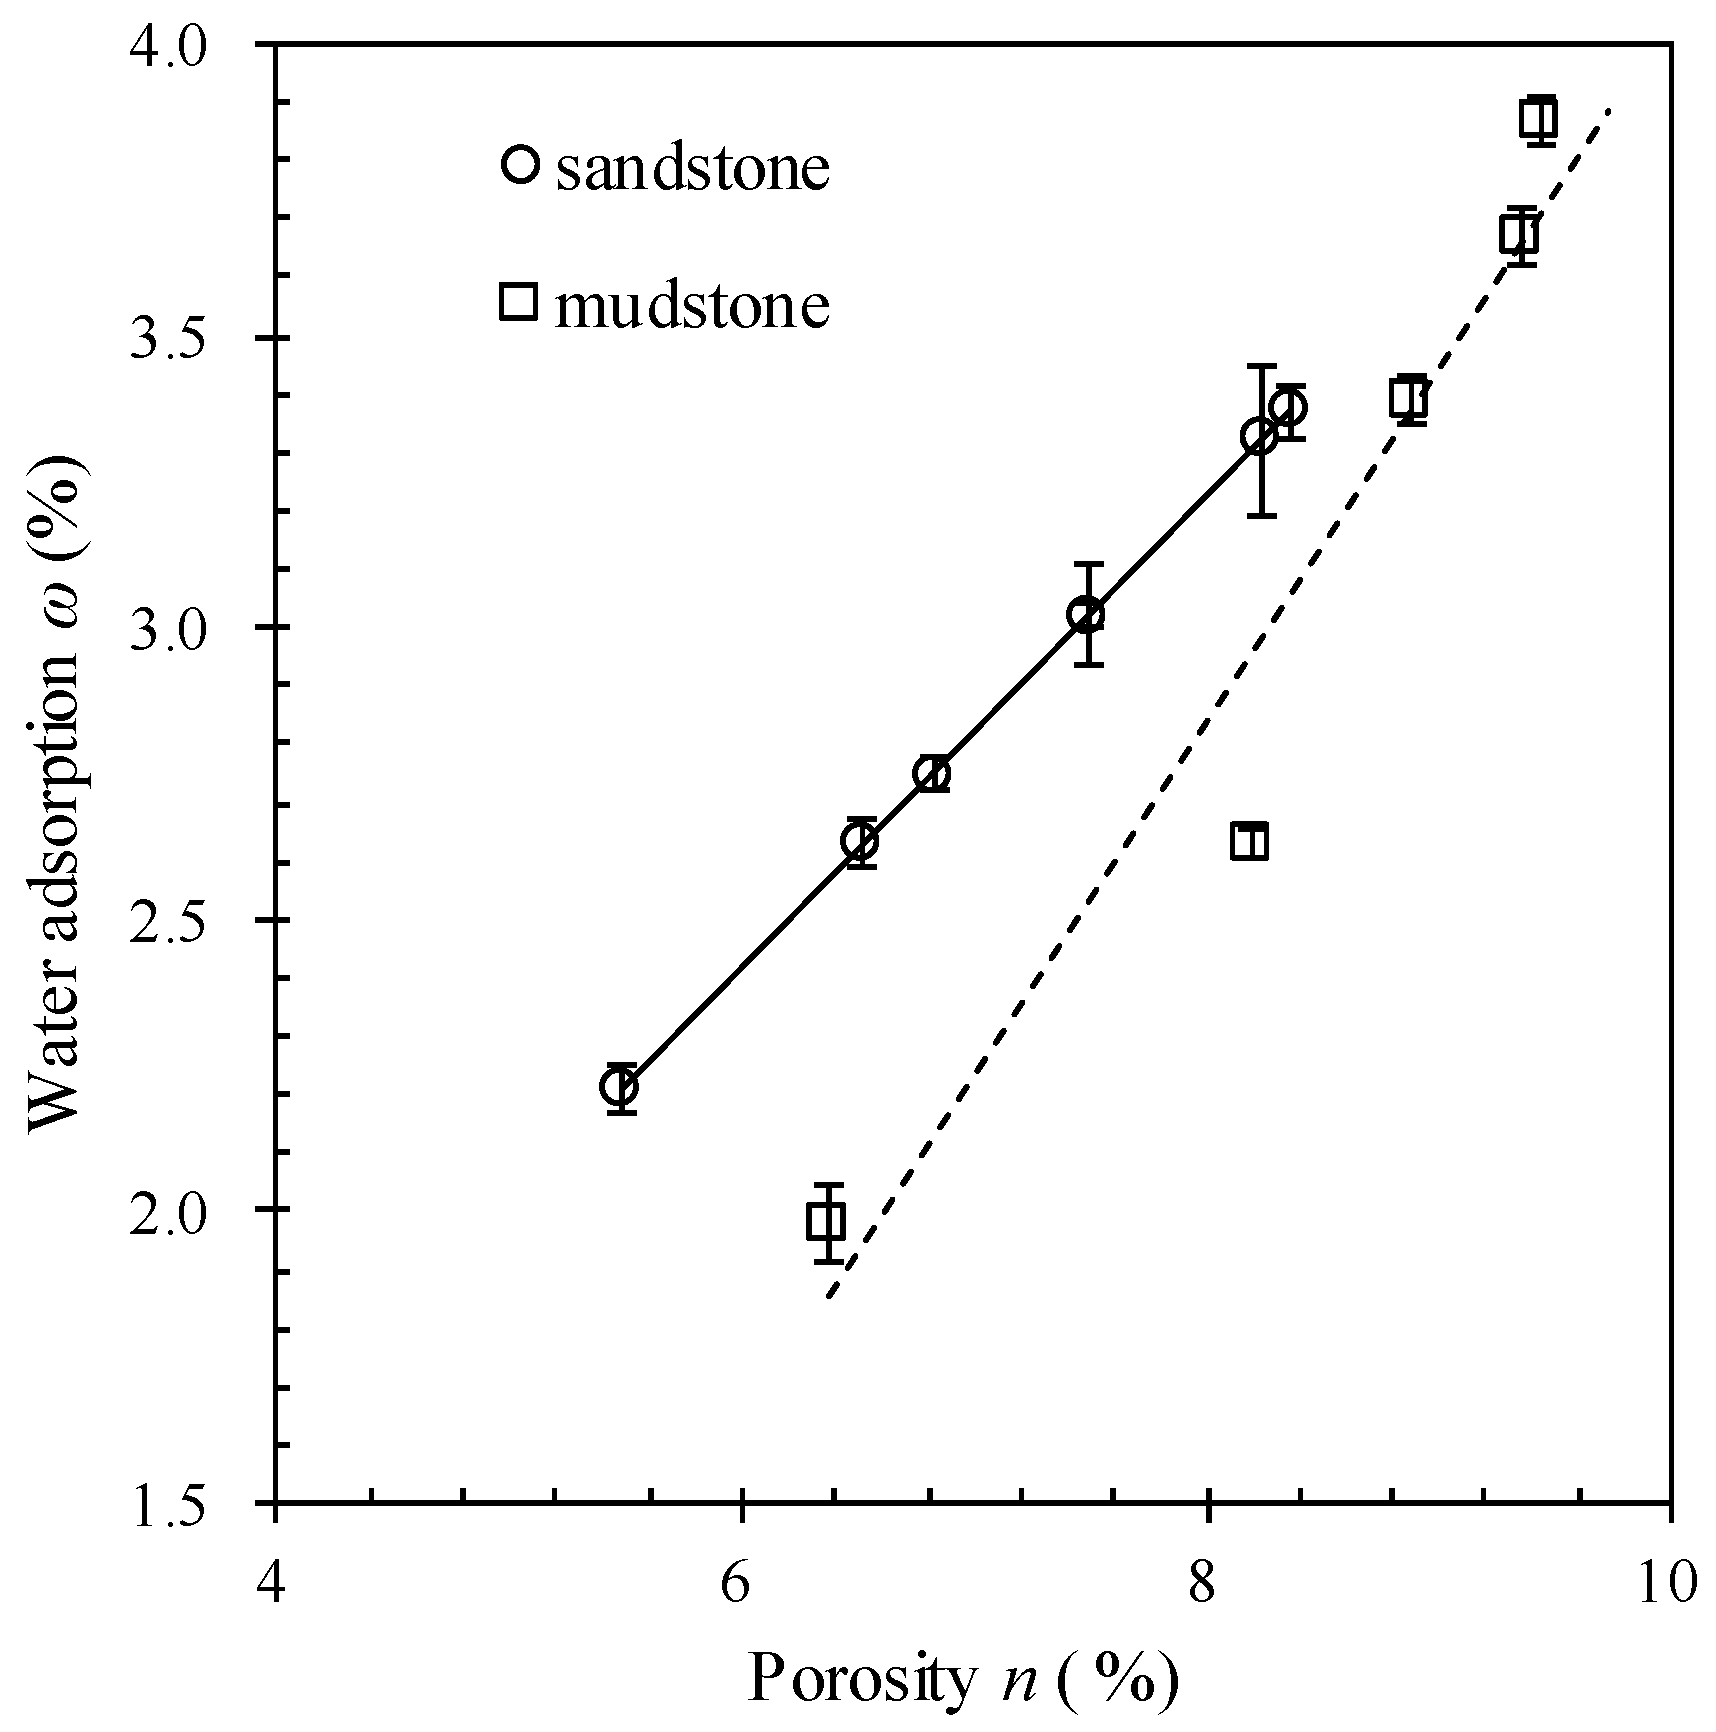
4.1. Effects of Cyclic Wetting-Drying on Water Adsorption

Before uniaxial compressive tests, the water absorption of each specimen could be calculated according to the weight variation at different wetting-drying cycles:
w = m w m d m d × 100 %
where w (%) is the water adsorption of the specimen, mw is the mass of the saturated specimen, md is the mass of the dried specimen, respectively.
Through Equation (1), the water adsorption of sandstone and mudstone could be obtained. The water adsorption of sandstone was respectively 2.21%, 2.75%, 2.63%, 3.02%, 3.02%, 3.32% and 3.37%, corresponding to the value of N is 0, 1, 5, 10, 15, 20 and 40. And the water adsorption of sandstone was respectively 1.98%, 2.63%, 3.39%, 3.67% and 3.87%, corresponding to the value of N is 0, 1, 5, 10 and 12. With the value of N increasing, the water adsorption of sandstone and mudstone increased gradually.
Figure 5 shows the effects of the cyclic wetting and drying on the water absorption of sandstone and mudstone. The water adsorption increased along a logarithmic curve with the increment of the value of N + 1. The variation of water adsorption with the increment of the value of N + 1 could be fitted by a logarithmic curve as follows:
Sandstone ws(N) = 0.287ln(N + 1) + 2.312 R2 = 0.87
Mudstone wm(N) = 0.706ln(N + 1) + 2.057 R2 = 0.99
where ws(N), wm(N) is the water adsorption of sandstone and mudstone after N times wetting and drying, %; N is the number of cyclic wetting and drying, and the range of N for sandstone is from 0 to 40, for mudstone is from 0 to 12; R2 is a coefficient of determination, which indicates the mudstone is more sensitive to the water.
Meanwhile, the porosity of the specimens after different wetting-drying cycles were measured by water saturation method [27]. According to the weight and volume of the specimens which were measured in the wetting-drying process, the porosity was calculated from the equation as follows:
n = V v V × 100 % = m w m d m w m s u b × 100 %
where n is the porosity of the rock specimen, V is the volume of the rock specimen, Vv is the volume of pores, mw is the mass of the saturated specimen, md is the mass of the dried specimen and msub is the mass of the saturated specimen submerged in water.
Figure 6 shows the relationship between porosity and water absorption of these specimens after different wetting-drying cycles, which indicates that the water absorption and the porosity have a good linear relationship (Equations (5) and (6)) in both sandstone and mudstone specimens.
Sandstone ws = 0.4034n − 0.0012 R2 = 0.99
Mudstone wm = 0.6052n − 2.0041 R2 = 0.93
where w is the water adsorption of the rock specimen, %; n is the porosity of the rock specimen.
As is known, the water storage capacity depends on the porosity of the rock specimens, and water absorption is the external manifestation of the size and distribution of cracks in the rock. The increase of water absorption indicates that the cracks in the rock samples increase and extend.
During the wetting and drying processes, both the water adsorption and porosity of these specimens increased, in which that of mudstone changed greater. FU [28] investigated the relationship between the water adsorption of moderate weathered sandstone specimens and the value of N + 1, shown in Equation (7).
ws(N) = 0.3226ln(N + 1) + 3.2344 R2 = 0.99
It is found that the change rate of water adsorption of moderate weathered sandstone is lower than the slightly weathered sandstone in this work, which indicated that the water adsorption and the porosity were related to the weathering degree of rock materials.

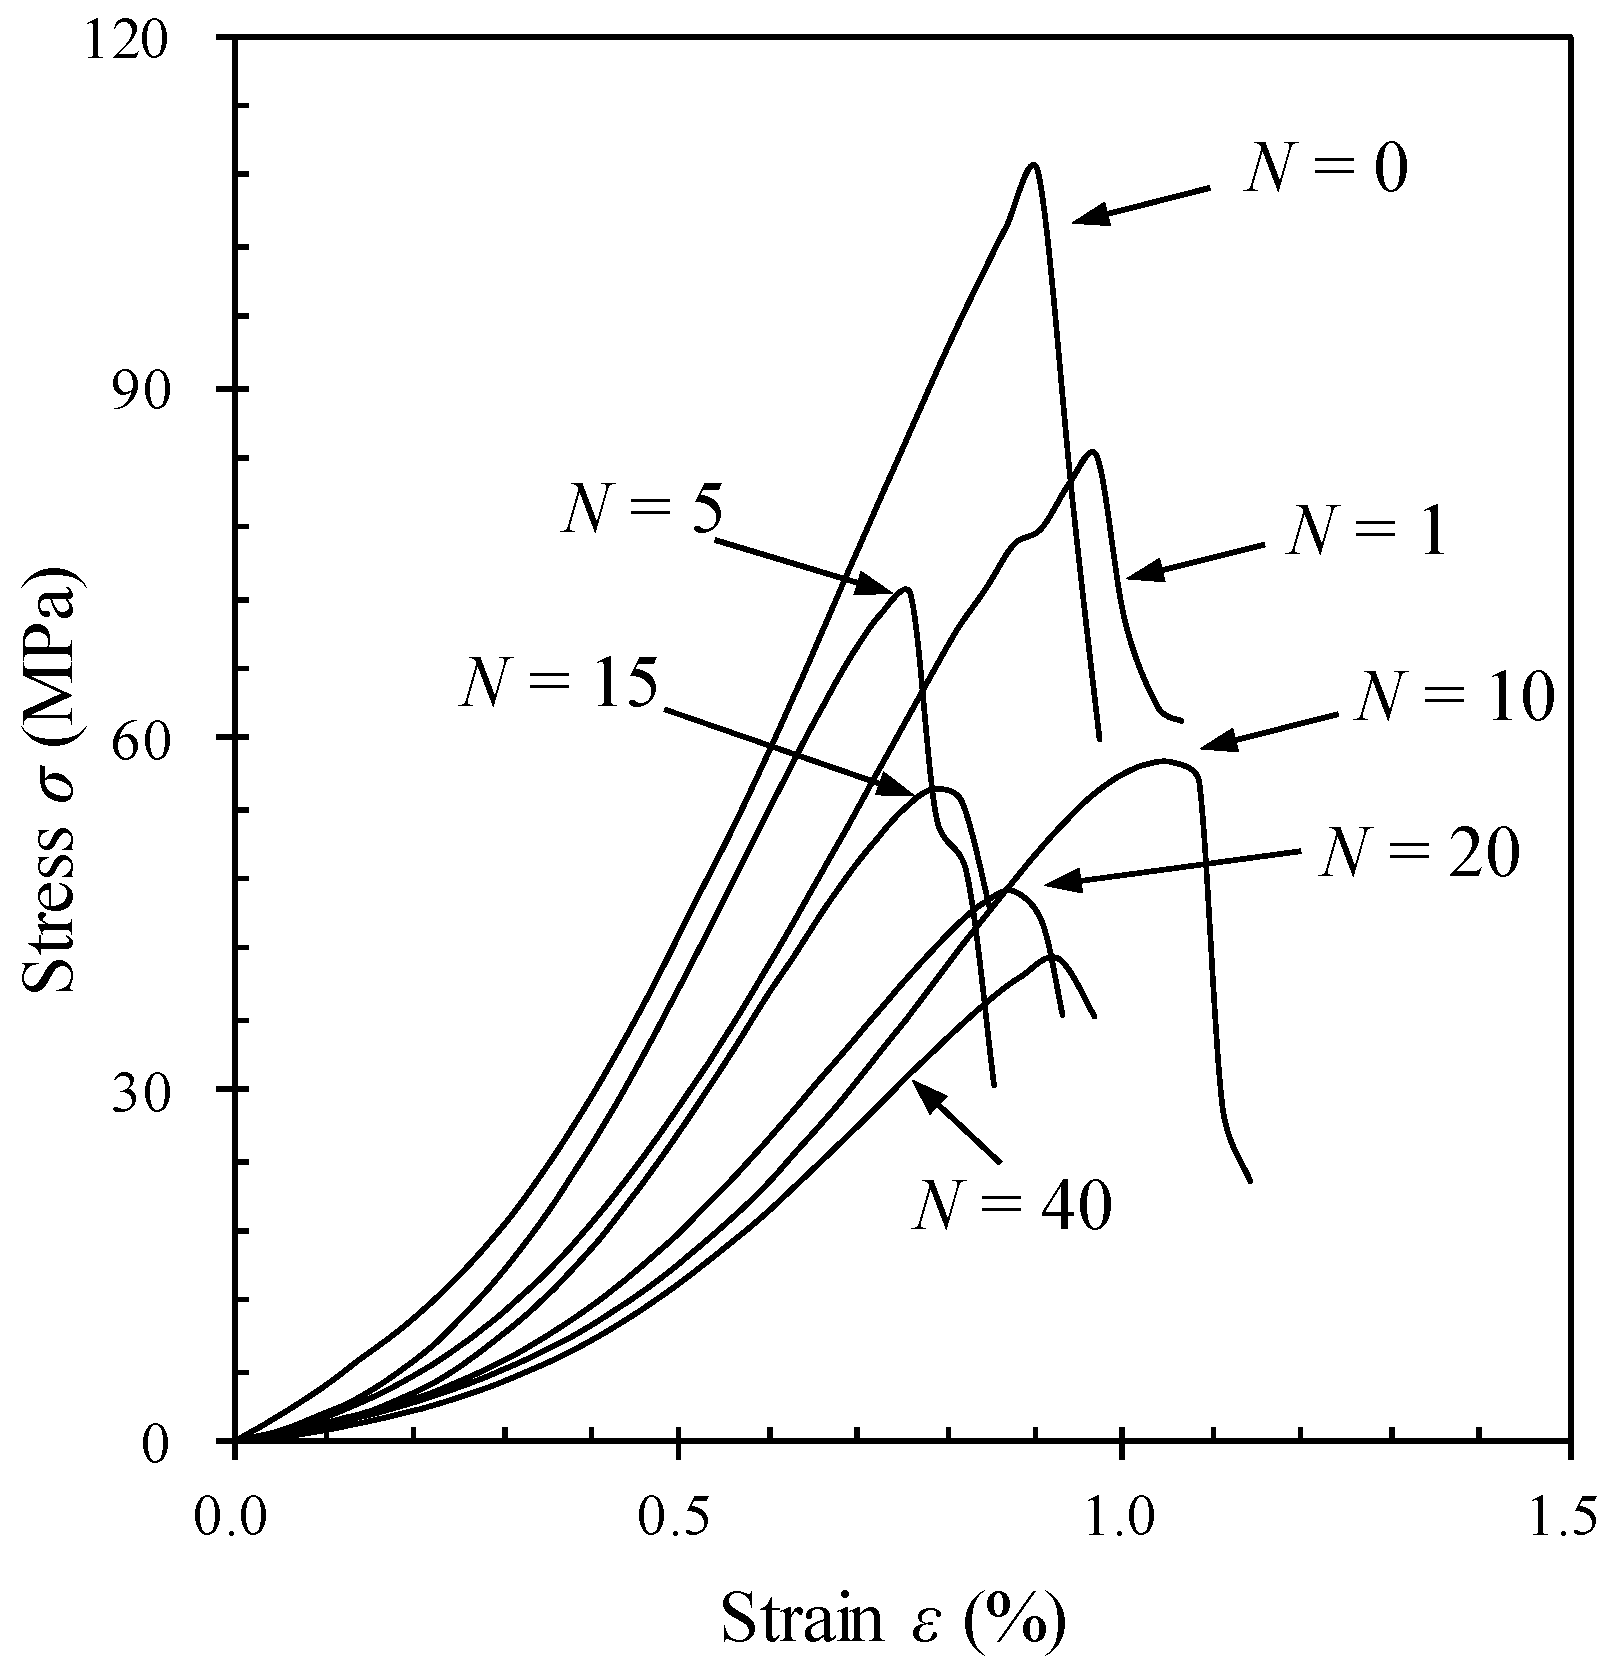
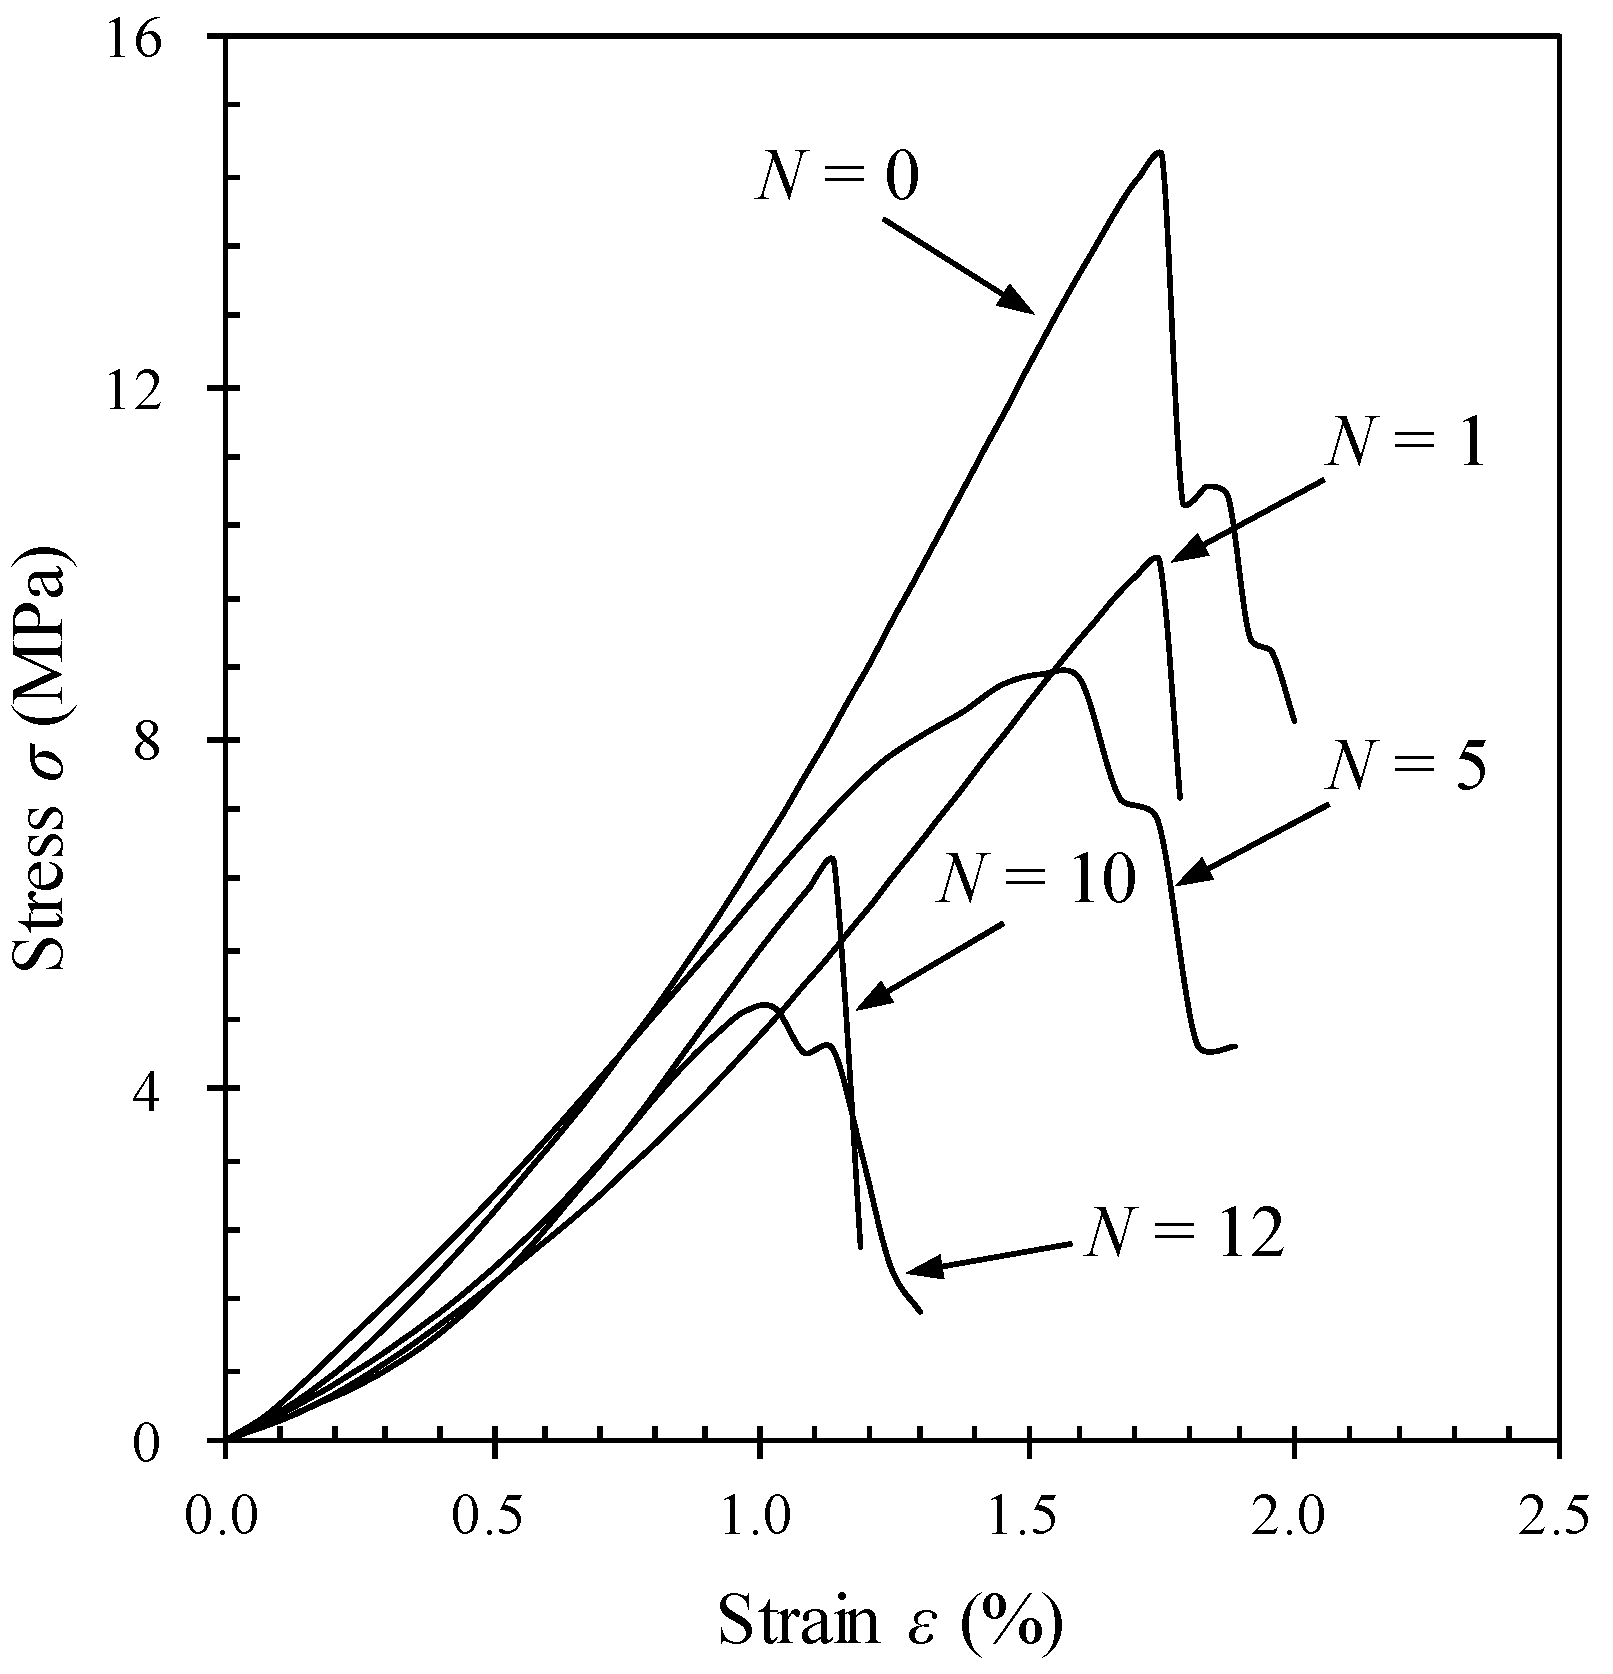
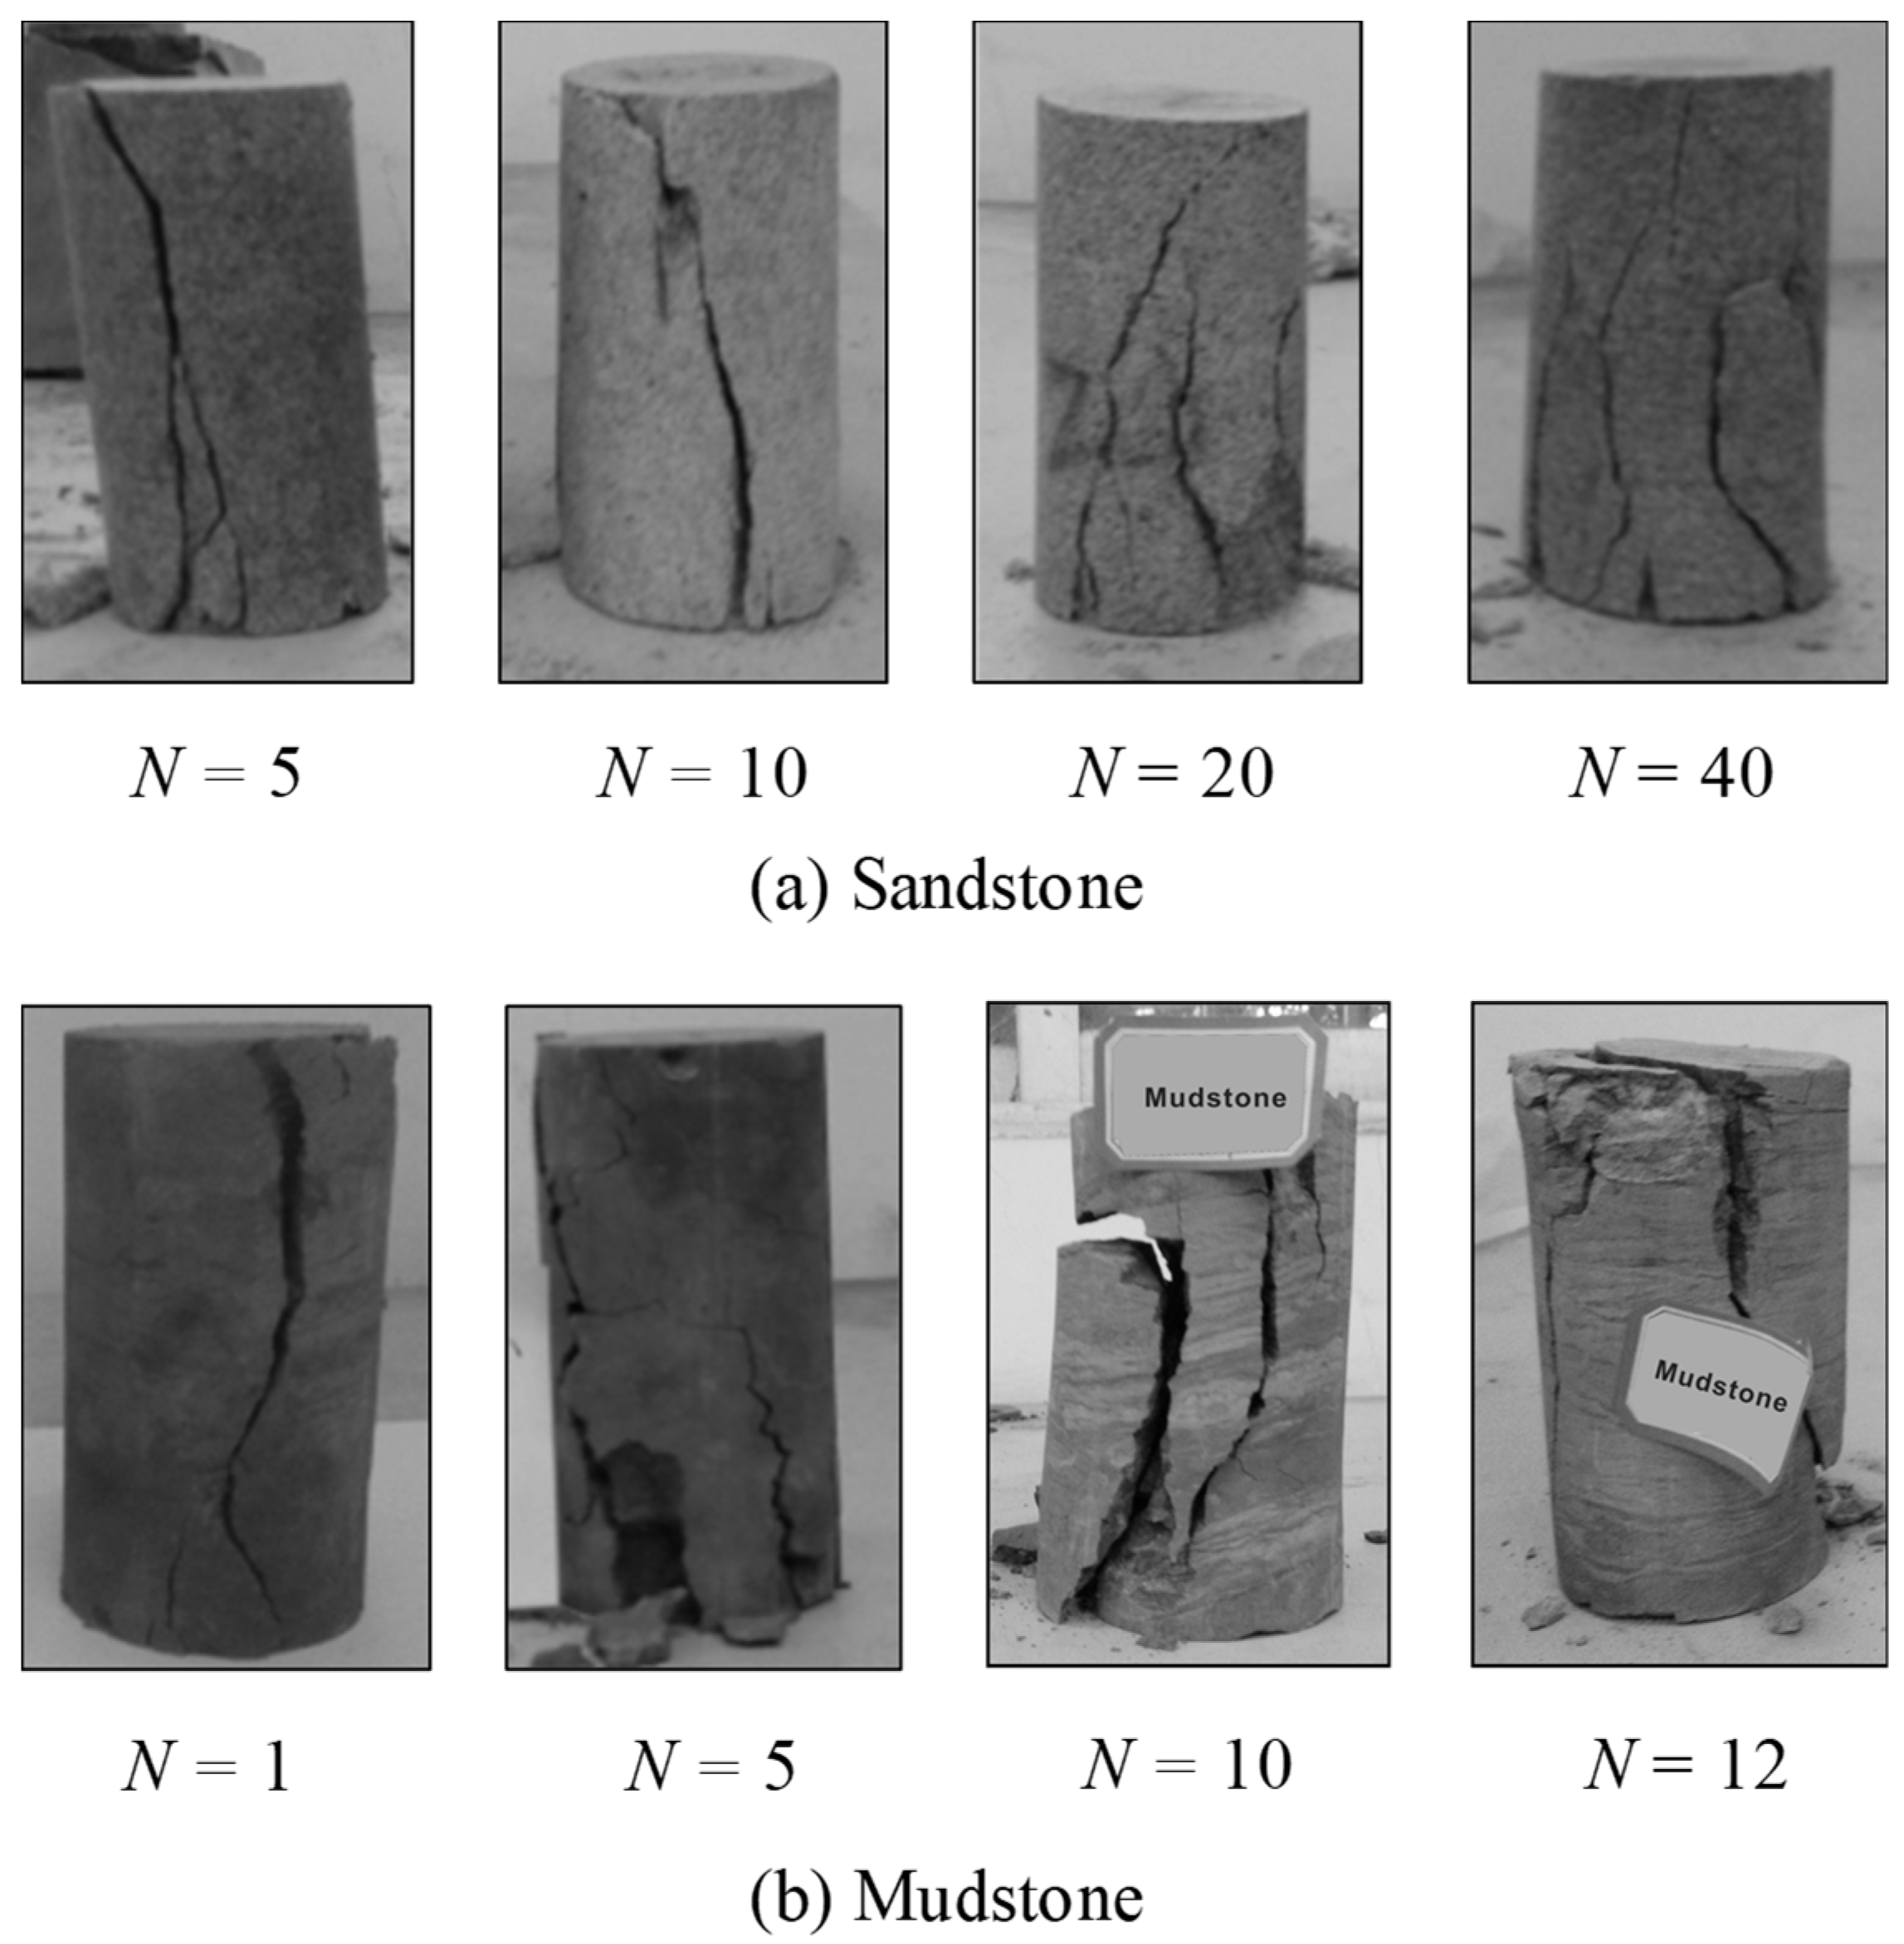
4.2. Stress-Strain Curves

The deformation and failure process of a rock generally undergoes five stages: (1) The micro-cracks compaction stage: The rock is compacted in the initial loading and the stress-strain curve is supposed to be concave, this can be due to the micro-cracks inside the rock closing under the external force; (2) The elastic deformation stage: The stress-strain curve shows an approximate linear relationship up to the yield strength; (3) The yield stage: The micro crack developed and accumulated until the rock specimen is completely failed, while the strength reaches the peak strength. (4) The strain softening stage: after the rock reaches the peak strength, the stress decreases with the strain increasing rapidly, the macroscopic fracture surface is formed with the development of the cracks. (5) The plastic flow stage: After the rock fractures, it still has bearing capacity, which is named residual strength.
The stress-strain curves of the selected specimens after cyclic wetting and drying from WDUCT are shown in Figure 7 and Figure 8. The letter N represents the number of cyclic wetting and drying.
Due to the limitation of the test apparatus, these curves here did not always follow the above 5 stages, and it was difficult to obtain a complete plastic flow stage. For the sandstone specimens, with increment of N value, the micro-cracks compaction stage (stage 1) becomes wider and the slope of the stress-strain curve in the elastic deformation stage (stage 2) was reduced significantly. This is mainly because of the internal micro-crack growth and expansion during wetting-drying cycles. When the number of wetting and drying cycles reaches 15, it’s clear that the plastic property of sandstone was obviously enhanced, the yield platform was obvious and the yield stage (stage 3) became longer. For the mudstone specimens, the effect of wetting-drying cycles on the stress-strain curves was not obvious. However, it could be found that the peak strength of both sandstone and mudstone after cyclic wetting and drying was less than that of intact specimens, the peak strength of both sandstone and mudstone decreased with the increase of the value of N.
Based on the results presented in Figure 9, the fracture patterns of these specimens showed obvious brittle fractures for specimens under less wetting-drying cycles, the fracture surfaces distributed vertically. However, with the increase of N value, the sandstone specimens and mudstone specimens became more softened respectively, the angles of the fracture surfaces changed, with obvious sloping fractures, showing shear failure mode. Thus, the cyclic wetting and drying process had a significant influence on the failure features of sandstone that change from brittle pattern to ductile pattern.

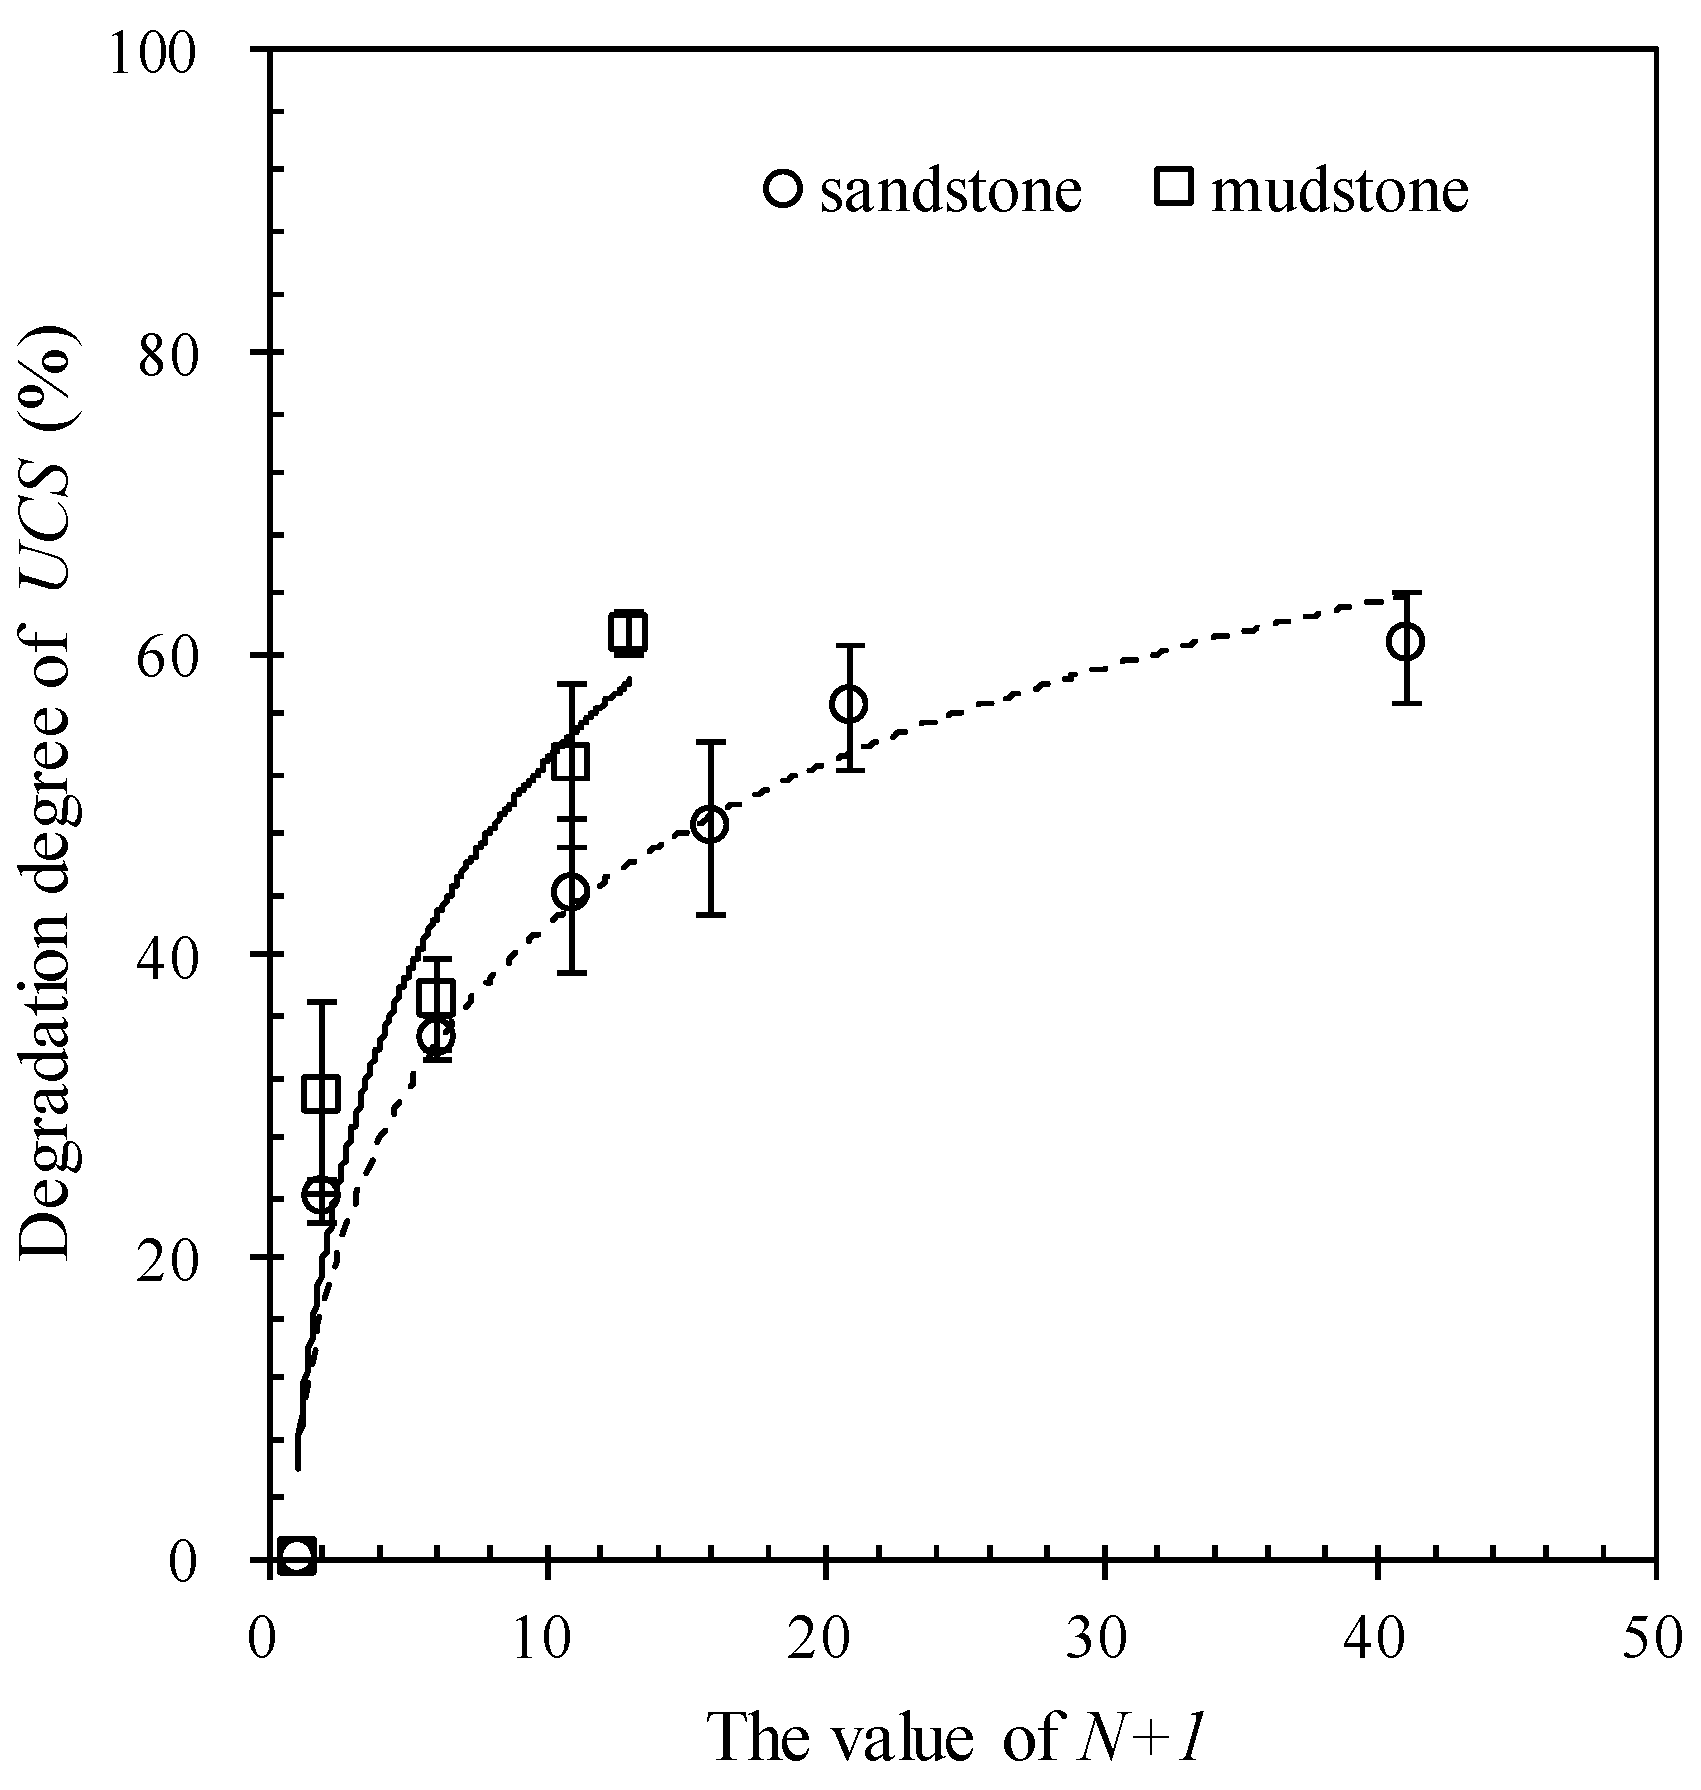
4.3. Effects of Cyclic Wetting-Drying on Uniaxial Compressive Strength

From Figure 7 and Figure 8, it is found that the UCS decreases with the increase of the value of N, especially for the first cycle.
The damage of any material due to cyclic wetting and drying could be expressed as a value of “Degradation Degree (D)”, D indicates the change in the material strength. The mechanical properties based on D have been used in the past to measure the changes in rock strength due to cyclic wetting and drying conditions, freeze-thaw conditions, and thermal treatment [29]. Here this method was used, in which Degradation Degree was calculated as:
DUCS = (1 − UCSN/UCS0) × 100%
where DUCS is the total degradation degree of UCS, UCSN is the compressive strength of specimens after N wetting and drying cycles, and UCS0 is the uniaxial compressive strength without wetting and drying. According to the test results, the UCS decreased with the increase in the value of N. When the value of N was respectively 1, 5, 10, 15, 20 and 40, the UCS of sandstone was reduced by 50.00%, 23.75%, 34.53%, 43.88%, 48.43% and 56.45%, 60.46%. When the value of N was respectively 1, 5, 10 and 12, the UCS of mudstone was reduced by 30.63%, 36.87%, 52.55% and 61.29%. At the beginning of testing, the UCS degenerated significantly, with the increase in the number of wetting-drying cycles, the water-rock interaction weakened gradually, and the decrease rates of UCS of sandstone and mudstone tended to slow down.
Figure 10 shows the degradation degree of UCS of sandstone and mudstone calculated by Equation (7). The evolution of the DUCS indicated that sandstone and mudstone had undergone continuous but different amount of degradation after cyclic wetting and drying. The DUCS of mudstone is larger than that of sandstone. For example, when the value of N reached 10, the DUCS of sandstone and mudstone were 43.88%, 52.55%, respectively. In addition, the relationship between the DUCS of sandstone and mudstone and the value of N + 1 could be fitted by a logarithmic curve as follows:
Sandstone DUCS = 15.548 ln(N + 1) + 6.198 R2 = 0.96
Mudstone DUCS = 20.381 ln(N + 1) + 5.909 R2 = 0.91
The differential coefficients of the above equations can describe the degradation rates of the UCS, which can be expressed as follows:
D′ = r/(N + 1)
where the coefficient r represents the degradation rate. It was clear that the degradation rate of mudstone (r = 20.381) was higher than that of sandstone (r = 15.548).

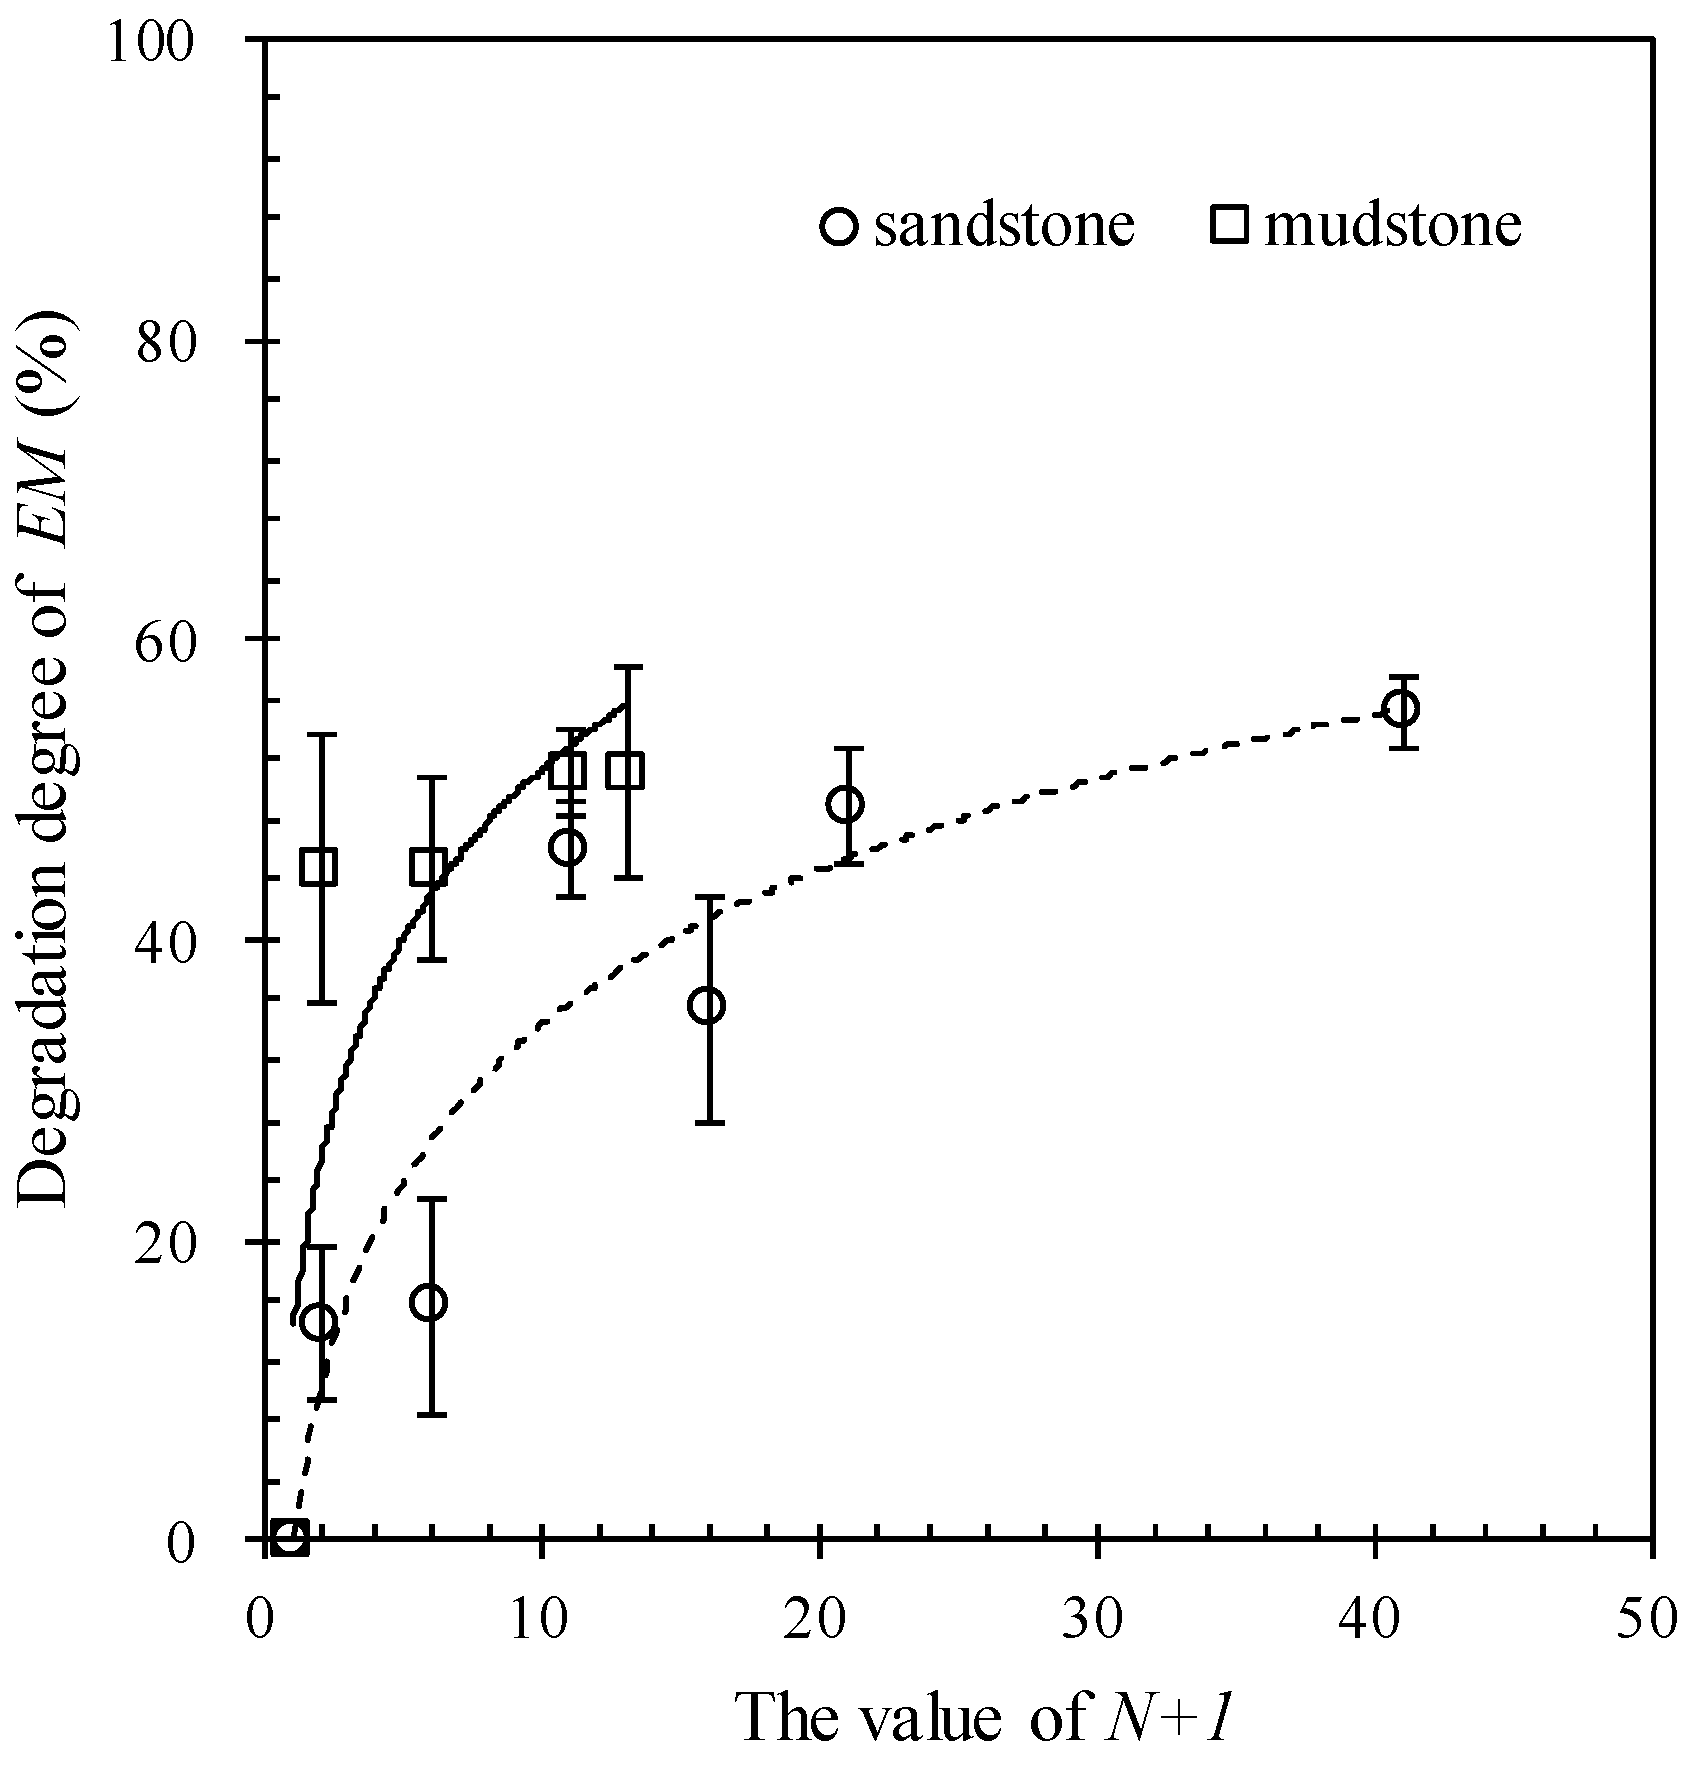
4.4. Effects of Cyclic Wetting-Drying on the Elastic Modulus

From Figure 7 and Figure 8, it can be seen that with the value of N increasing, the EM (elastic modulus) decreased gradually. At the first wetting and drying cycle, the EM of sandstone and mudstone degenerated rapidly. With the increase in the value of N, the rate of EM decrease tended to slow down. The degradation degree of EM is defined by the following formula:
DEM = (1 − EMN/EM0) × 100%
where DEM is the total degradation degree of EM, EMN is the elastic modulus after N wetting and drying cycles, and EM0 is the elastic modulus of the intact specimen without wetting and drying action.
According to the test results, the EM decreased with the increase of the value of N. When the value of N was respectively 1, 5, 10, 15, 20 and 40, the EM of sandstone was reduced by 14.55%, 15.68%, 45.92%, 35.38%, 48.92% and 55.22%. When the value of N was respectively 1, 5, 10 and 12, the EM of mudstone was reduced by 44.74%, 44.74%, 51.13% and 51.13%.
Figure 11 shows the degradation degree of EM of sandstone and mudstone calculated by Equation (13). The change of the DEM indicated that sandstone and mudstone had undergone continuous but different amount of degradation after cyclic wetting and drying. The relationship of the DUCS of sandstone and mudstone and “N + 1” could be fitted by a logarithmic curve as follows:
Sandstone DEM = 14.872 ln(N + 1) + 6.198 R2 = 0.89
Mudstone DEM = 16.102 ln(N + 1) + 14.362 R2 = 0.68
It was clear that the degradation rate of mudstone (r = 16.102) was larger than that of sandstone (r = 14.548). Obviously, the effects of cyclic wetting and drying on the UCS and EM of mudstone were more intense than that of sandstone. Gautam et al. [30] indicated that rocks with higher clay contents slake more rapidly and extensively than those with lower clay contents. As is known, mudstone is a fine-grained sedimentary rock, and its original constituents were clays or muds, while most sandstone is composed of quartz or feldspar.

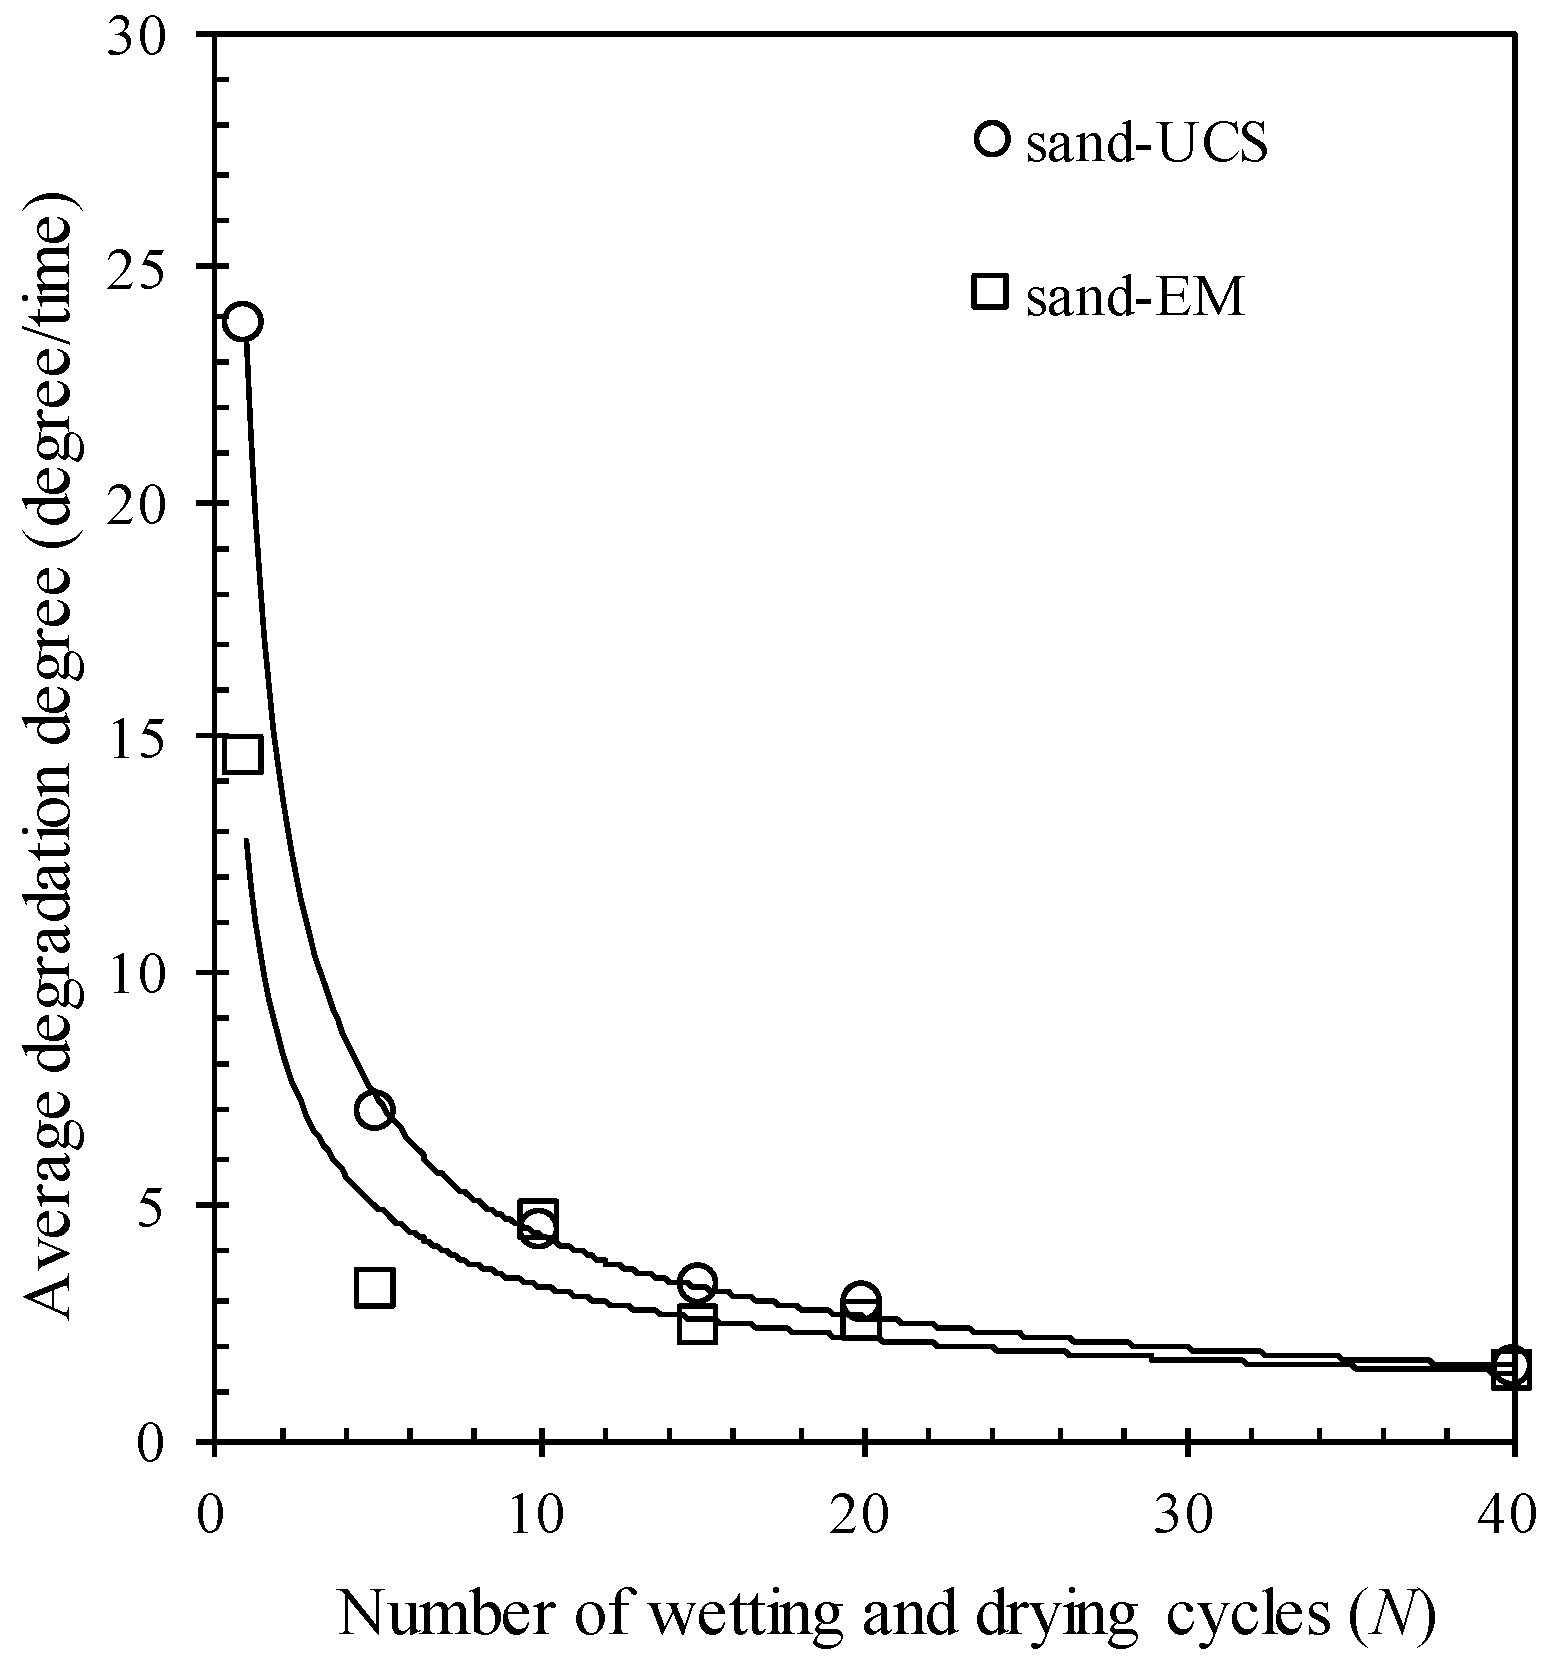
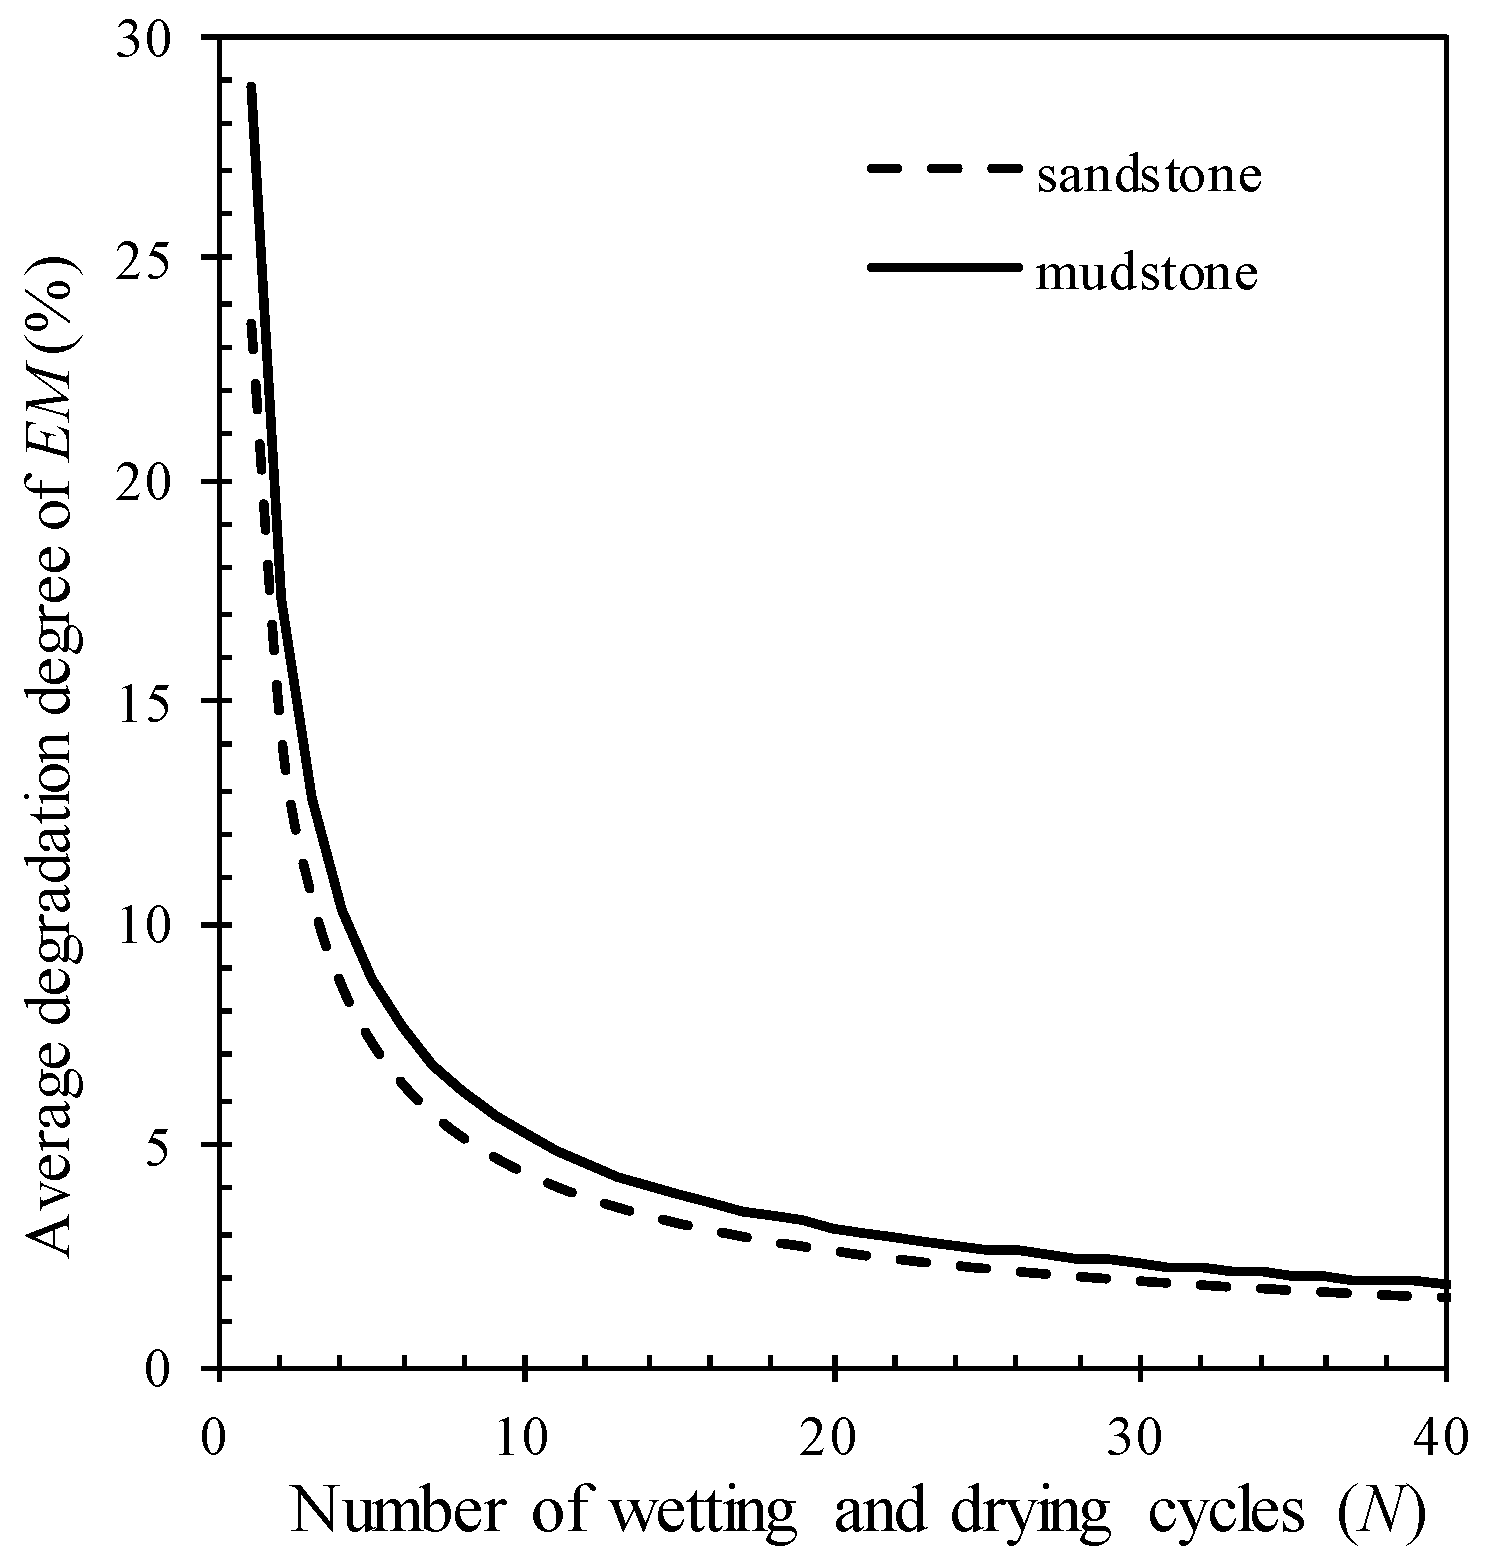
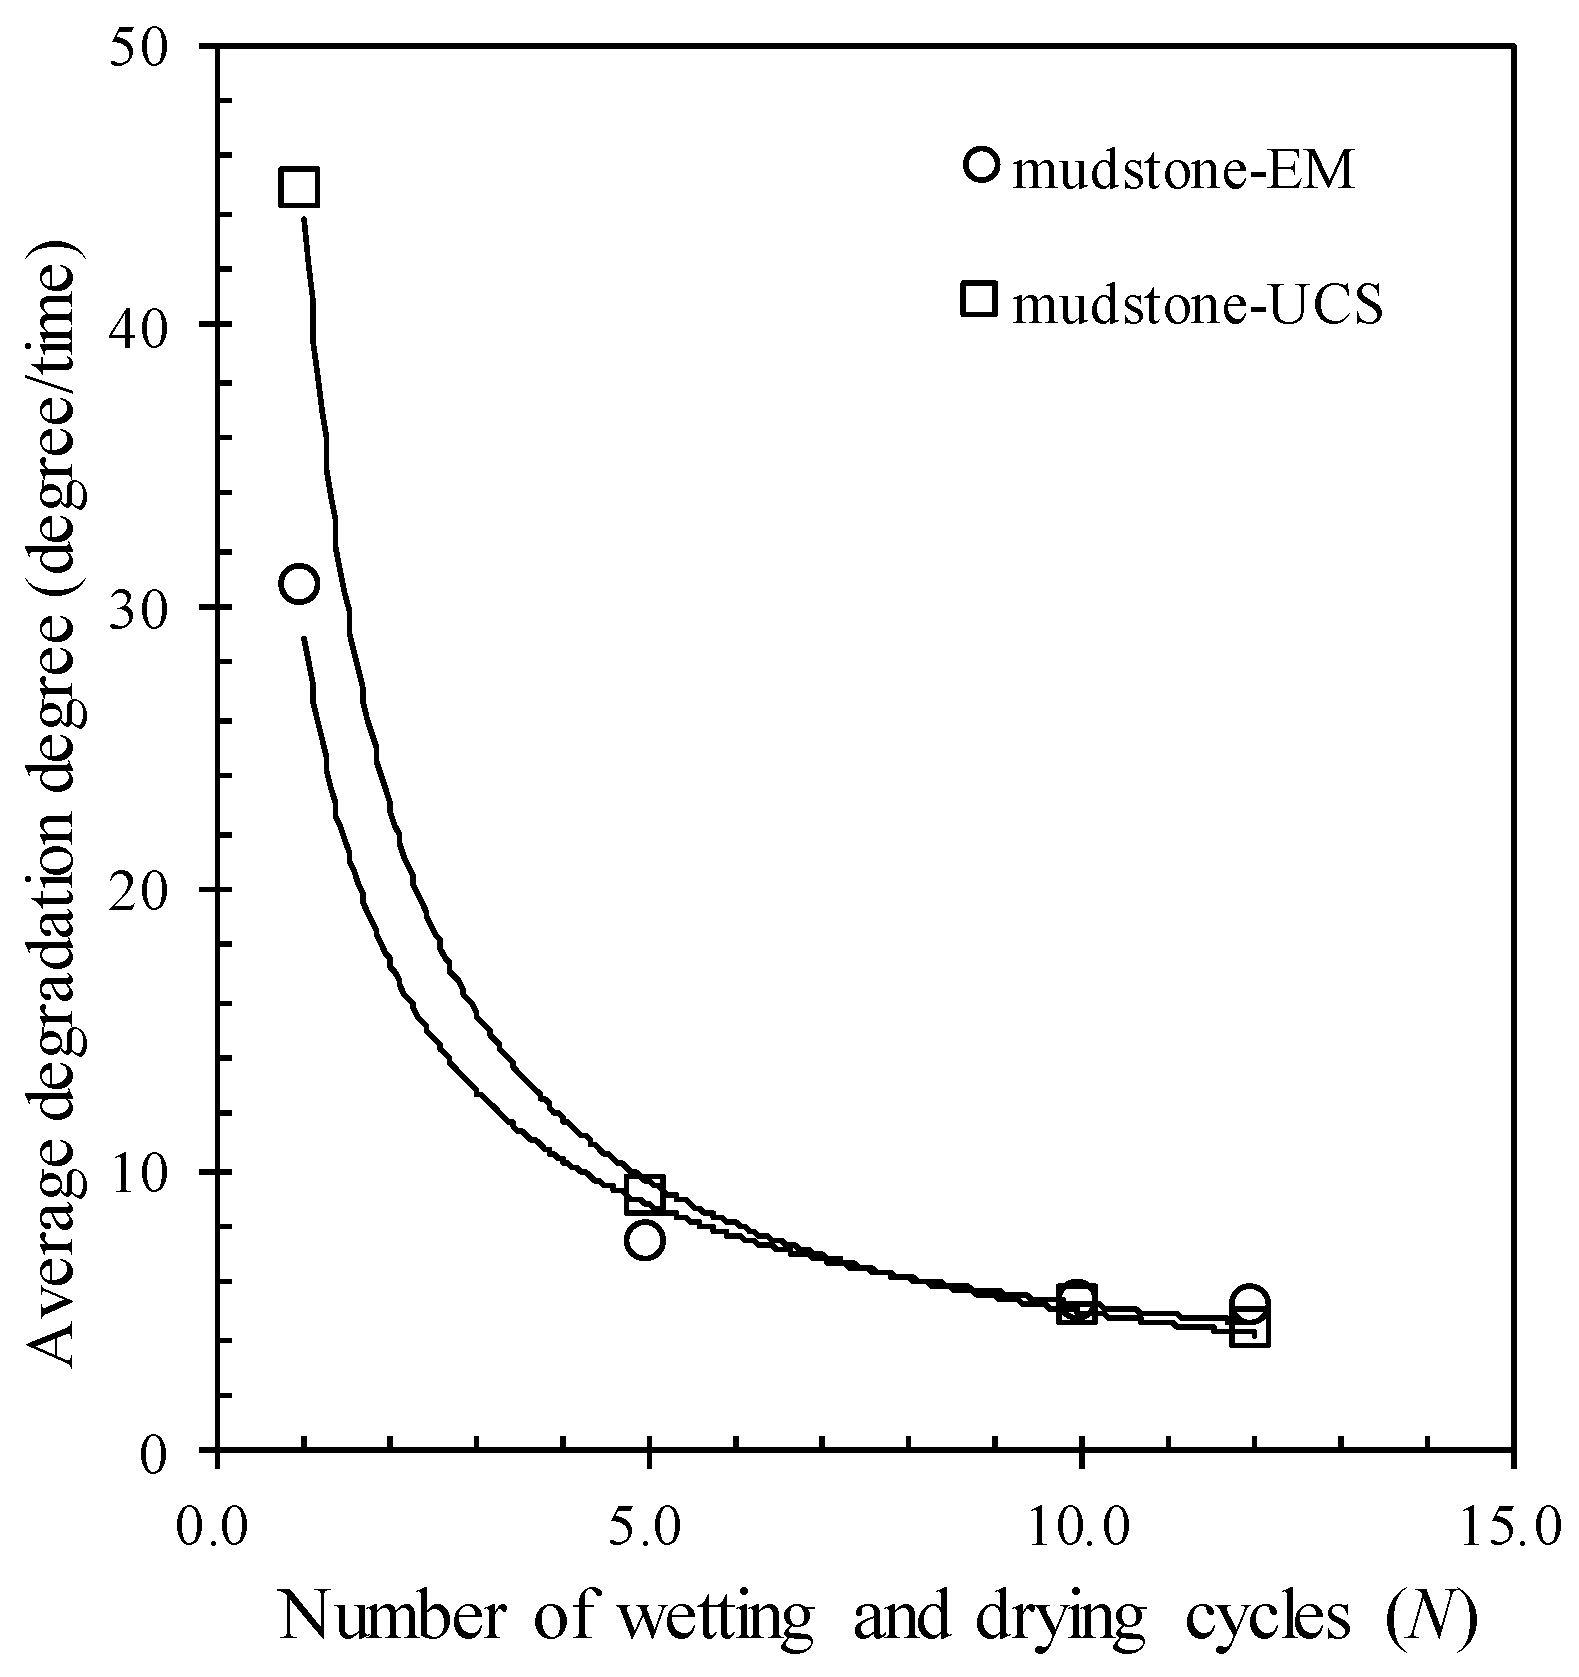
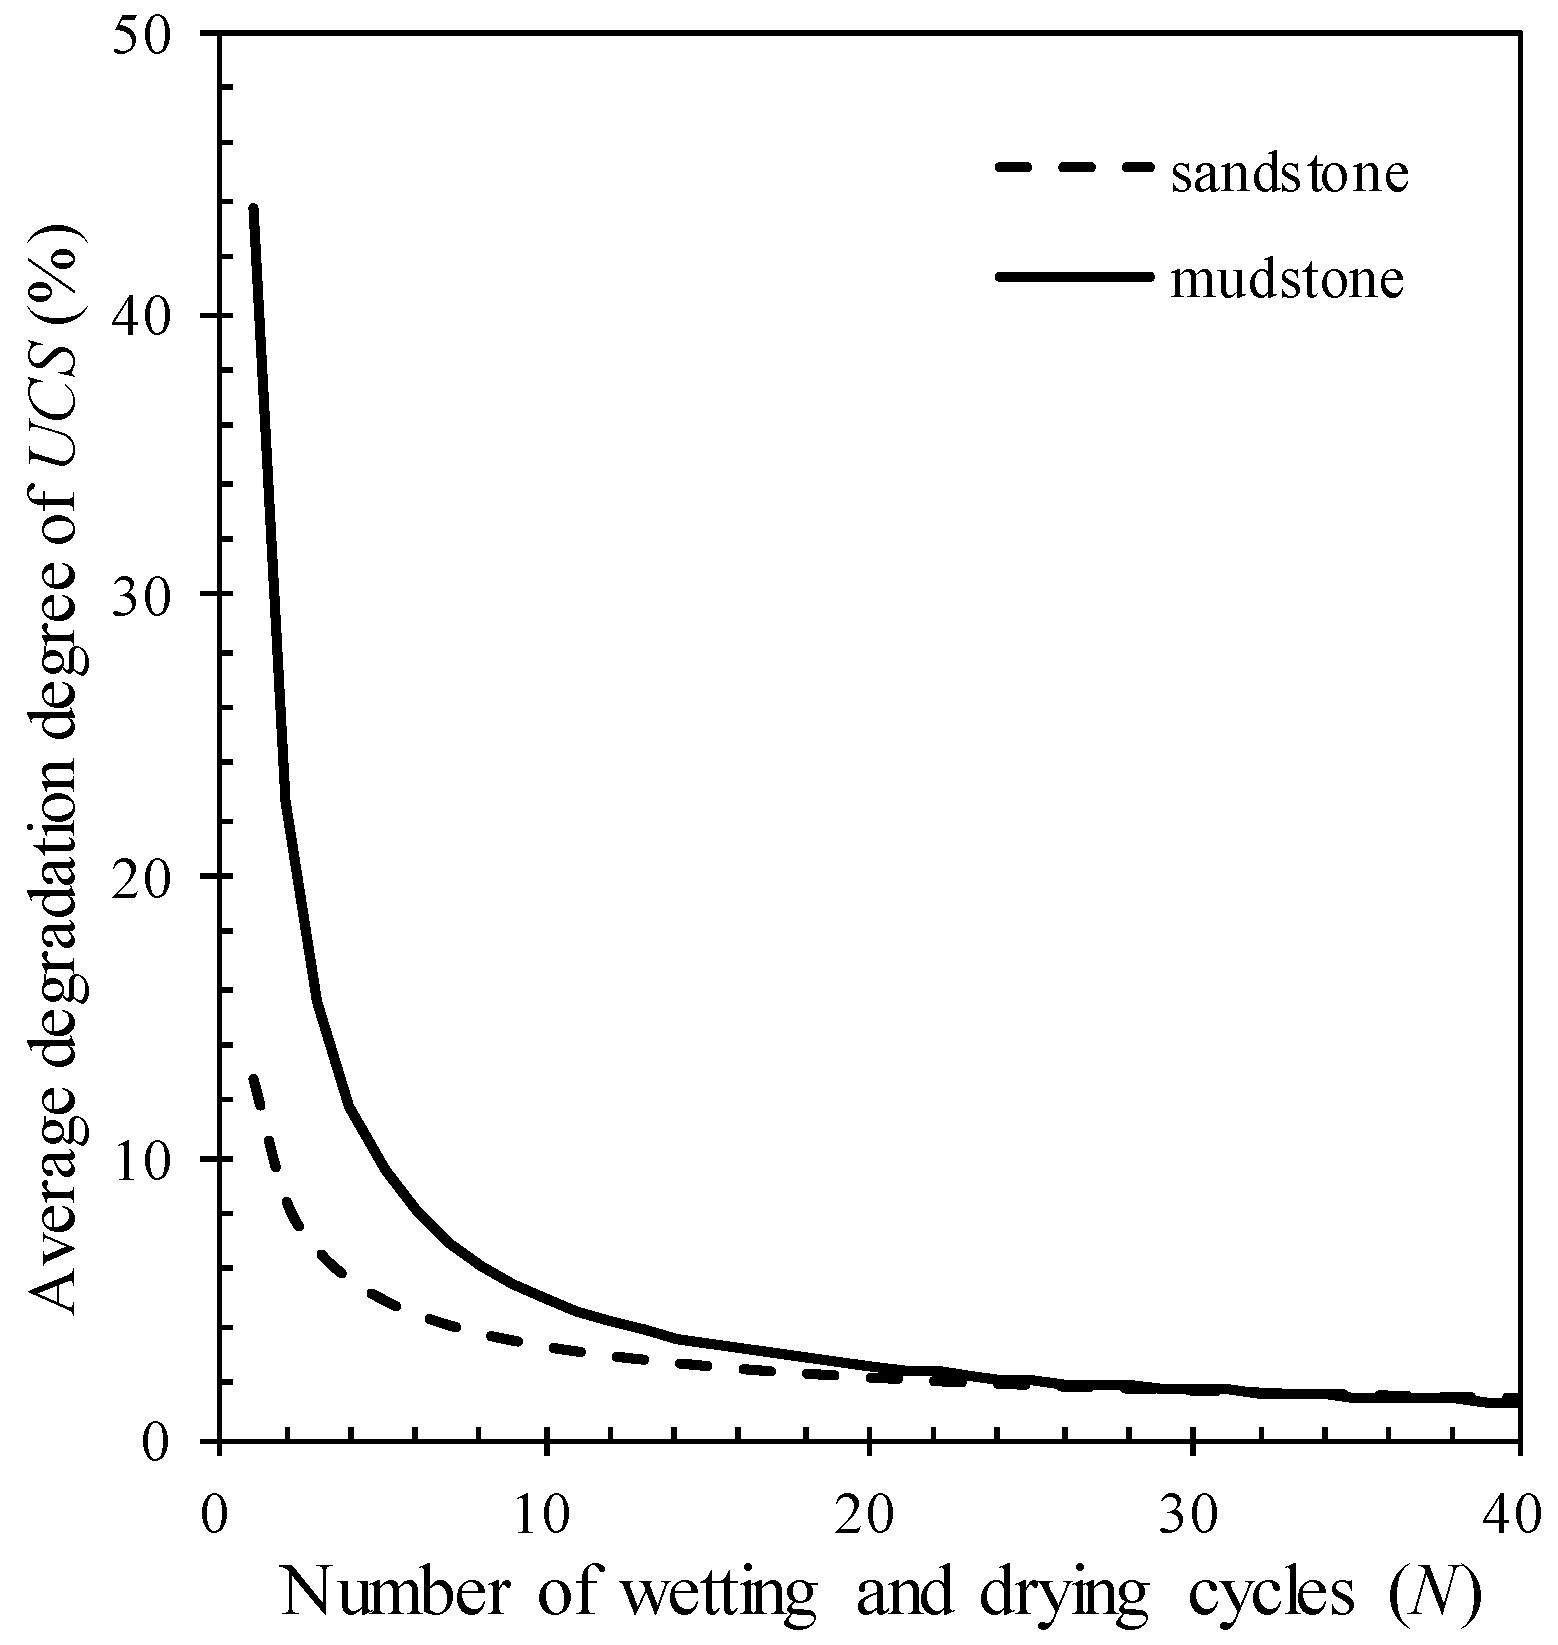
4.5. Average Degradation Degree

From Figure 10 and Figure 11, the average degradation degree (AD), which represents the degradation degree of per wetting and drying cycle, can be easily calculated, shown in Figure 12 and Figure 13. While N value increased from 1 to 40, the DUCS value of sandstone reduced from 23.75% to 1.51%, the DEM value of sandstone reduced from 14.55% to 1.38%. While the N value increased from 1 to 12, the DUCS value of mudstone reduced from 30.63% to 5.11%, the DEM value of mudstone reduced from 44.74% to 4.26%. The relationships between the average degradation degree (degree/time) of the two properties and the N value can be expressed by a power function as shown in Equation (15) to Equation (18).
Sandstone ADUCS = 23.512 N − 0.732 R2 = 0.99
Sandstone ADEM = 12.779 N − 0.591 R2 = 0.89
Mudstone ADUCS =43.778 N − 0.945 R2 = 0.99
Mudstone ADEM = 28.833 N − 0.740 R2 = 0.98
For the mudstone specimens, the maximum value of N is 12 in WDUCT, which is much less than that of sandstone specimens. In order to make an overall comparison of ADUCS and ADEM in sandstone and mudstone, several curves are plotted by Equation (15) to Equation (18), which are shown in Figure 14 and Figure 15. From these figures, the range of N value is the same, and it is clear that ADUCS and ADEM of sandstone and mudstone all decrease with the increment of N value. As shown in Figure 14, it can be seen that at the beginning of wetting and drying cycles, the difference between the ADUCS value of sandstone and the ADUCS value of mudstone was large, which showed the ADUCS value of mudstone was larger than the ADUCS value of mudstone, with the value of N increasing, the two values tended to converge. While from Figure 15, the difference between the ADEM value of sandstone and ADEM value of mudstone is basically the same with the value of N increasing, which shows that the ADEM value of sandstone is always larger than that of mudstone.

5. Discussion

As mentioned above, the UCS and the EM of the selected specimens could be calculated by the value of N, but it was hard to know the specific value of N in the practical engineering. As is known, the water absorption and porosity represent the volume of void and cracks in rock specimens, therefore they can be used to define the damage induced by wetting and drying cycles. Also, because of the good linear relationship between the two parameters as mentioned above, the water absorption and the porosity could be considered equivalent. Figure 16 further shows the relationship between the UCS and the porosity of selected specimens, and Figure 17 shows the relationship between the EM and the porosity of selected specimens, both of them can be fitted by linear curves as follows:
UCS = an + b
EM = cn + d
where n is the porosity of the specimen measured after N times wetting and drying cycles, a, b, c and d are the coefficients of these equations.
From Figure 16 and Figure 17, it is clear that both of the EM and the UCS of sandstone and mudstone were decreasing along linear curves with the porosity increasing. With the porosity value increasing, the EM and the UCS of sandstone decreased more rapidly than those of mudstone, which indicated that the deterioration in the mechanical properties of mudstone does not depend on the difference of water content during wetting and drying processes.
As is known, sandstone is a kind of sedimentary rock, composed of quartz and/or feldspar. While mudstone is a fine-grained sedimentary rock of which original constituents is clay. Therefore, it can be assumed that as the porosity value increases, the mechanical properties of a rock which has more clay decrease more rapidly.

6. Conclusions

In order to investigate the effects of cyclic wetting-drying conditions on elastic modulus and compressive strength of sandstone and mudstone, a series of uniaxial compression tests in laboratory were carried out. Based on analyses of experimental data, the following conclusions can be drawn:
(1)
Wetting-drying cycles have a remarkable influence on physical and mechanical properties of sandstone and mudstone. The elastic modulus (EM) and uniaxial compressive strength (UCS) of sandstone and mudstone are reduced by wetting and drying cycles, while the water adsorption and porosity increase.
(2)
With the increment of the number of wetting-drying cycles (N), the water adsorption, the degradation degree of EM and the degradation degree of UCS increase, and the relationship between these three parameters and the value of N + 1 could be fitted by logarithmic curves.
(3)
While using the average degradation degree (AD) to describe the degradation degree of every wetting-drying cycle, it is found that as the value of N increased, the AD of EM and UCS decreased.
(4)
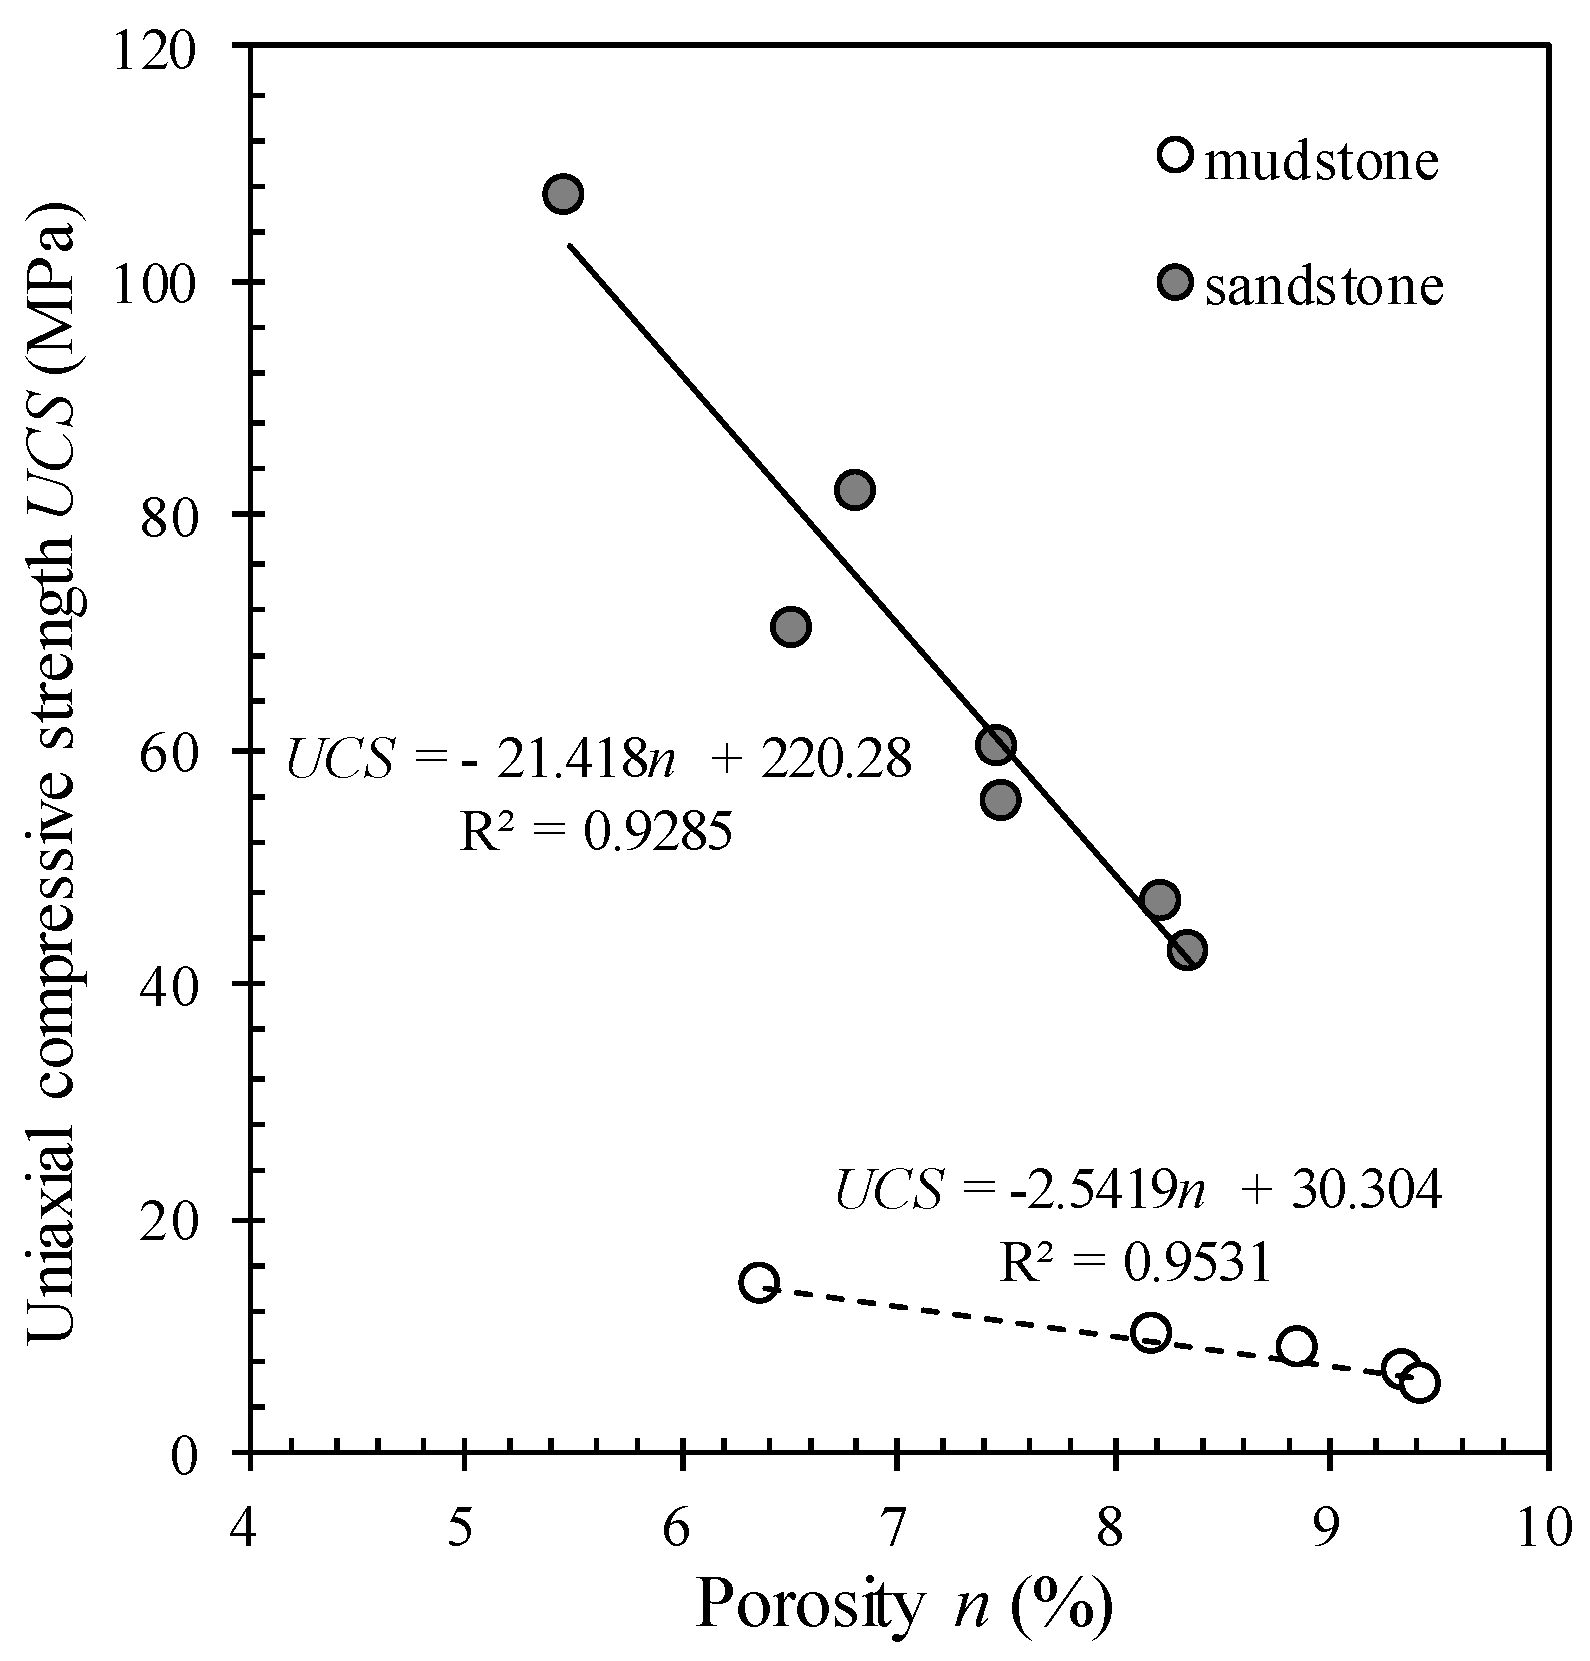
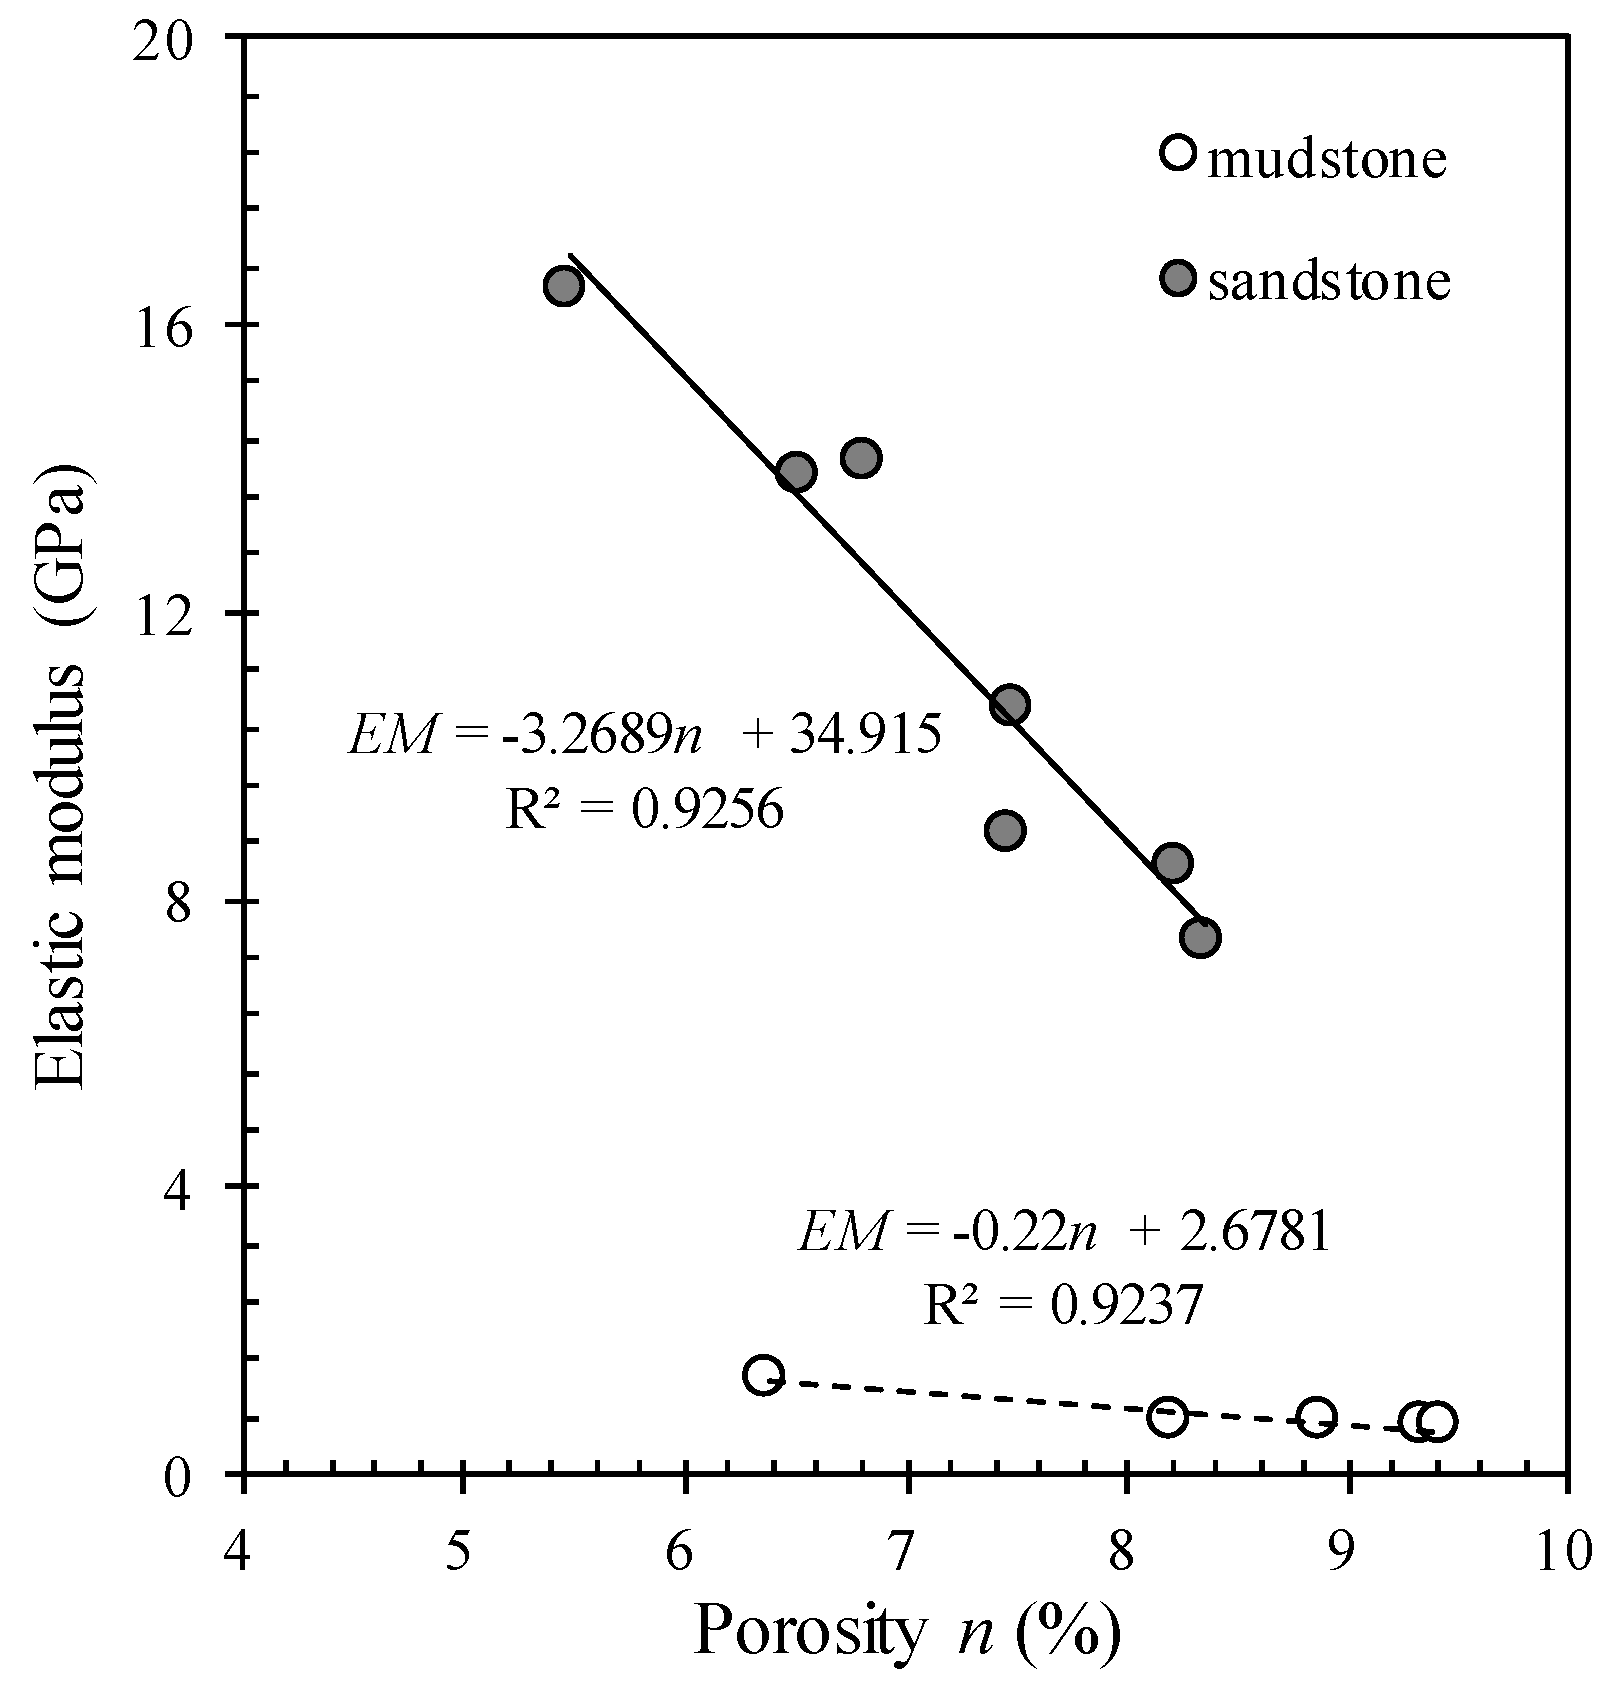
The relationships between the mechanical properties and the porosity can be fitted by linear curves. In the cyclic wetting-drying process, the EM and the UCS decrease with the porosity increasing, and the decay rates of sandstone are rapider than those of mudstone.

Author Contributions

S.H. conceived the experiments, S.H. and J.W. designed the experiments and wrote the initial draft of the manuscript. S.H., J.W. and Z.Q. analyzed the data and wrote the final manuscript. K.K. was working on revising the content of the manuscript. S.H., J.W. and K.K. made revisions of the manuscript.

Funding

This work was funded by the Graduate Education Innovation Fund of Chongqing, China (Grant nos. CYB17126), the Open Fund of Key Laboratory of Hydraulic and Waterway Engineering of the Ministry of Education of China (Grant nos. SLK2018B07) and the National Natural Science Foundation of China (Grant no. 51479012, U1865103).

Conflicts of Interest

The authors declare no conflict of interest.

References

  1. Hammon, W.S.; Zeng, X.; Corbeanu, R.M.; Mcmechan, G.A. Estimation of the spatial distribution of fluid permeability from surface and tomographic gpr data and core, with a 2-d example from the ferron sandstone, utah. Geophysics 2002, 67, 1505–1515. [Google Scholar] [CrossRef]
  2. Chongqing Geological and Mineral Resource Exploration and Development Corporation (CGMREDC). Chongqing Geological Map (Scale 1:500,000); Chongqing Yangtze River Map Printing Factory: Chongqing, China, 2013. (In Chinese) [Google Scholar]
  3. Wang, J.; Qiu, Z.; Deng, W. Shear Strength of a Crushed Sandstone-Mudstone Particle Mixture. Mar. Georesour. Geotechnol. 2014, 1, 33–37. [Google Scholar] [CrossRef]
  4. Jia, G.W.; Zhan, T.L.T.; Chen, Y.M.; Fredlund, D.G. Performance of a large-scale slope model subjected to rising and lowering water levels. Eng. Geol. 2009, 106, 92–103. [Google Scholar] [CrossRef]
  5. Gao, Y.; Zhu, D.; Leig, H.; Qin, H. Stability analysis of three-dimensional slopes under water drawdown conditions. Can. Geotech. J. 2014, 51, 1355–1364. [Google Scholar] [CrossRef]
  6. Luo, F.; Zhang, G. Progressive failure behavior of cohesive soil slopes under water drawdown conditions. Environ. Earth Sci. 2016, 75, 973. [Google Scholar] [CrossRef]
  7. Sumner, P.D.; Loubser, M.J. Experimental sandstone weathering using different wetting and drying moisture amplitudes. Earth Surf. Process. Landf. 2010, 33, 985–990. [Google Scholar] [CrossRef]
  8. Kassab, M.A.; Weller, A. Study on p-wave and s-wave velocity in dry and wet sandstones of tushka region, egypt. Egypt. J. Pet. 2015, 24, 1–11. [Google Scholar] [CrossRef]
  9. Yao, H.; Zhang, Z.; Zhu, C.; Shi, Y.; Yuan, L. Experimental study of mechanical properties of sandstone under cyclic drying and wetting. Rock Soil Mech. 2010, 31, 3704–3708, 3714. (In Chinese) [Google Scholar]
  10. Deng, H.; Li, J.; Zhu, M.; Wang, K.; Wang, L.; Deng, C. Experimental research on strength deterioration rules of sandstone under “saturation-air dry” circulation function. Rock Soil Mech. 2012, 33, 3306–3312. (In Chinese) [Google Scholar]
  11. Deng, H.; Zhou, M.; Li, J.; Sun, X.; Huang, Y. Creep degradation mechanism by water-rock interaction in the red-layer soft rock. Arab. J. Geosci. 2016, 9, 601. [Google Scholar] [CrossRef]
  12. Hua, W.; Dong, S.; Li, Y.; Xu, J.; Wang, Q. The influence of cyclic wetting and drying on the fracture toughness of sandstone. Int. J. Rock Mech. Min. Sci. 2015, 78, 331–335. [Google Scholar] [CrossRef]
  13. Lin, M.L.; Jeng, F.S.; Tsai, L.S.; Huang, T.H. Wetting weakening of tertiary sandstones—Microscopic mechanism. Environ. Geol. 2005, 48, 265–275. [Google Scholar] [CrossRef]
  14. Zhao, Z.; Yang, J.; Zhang, D.; Peng, H. Effects of wetting and cyclic wetting-drying on tensile strength of sandstone with a low clay mineral content. Rock Mech. Rock Eng. 2016, 50, 485–491. [Google Scholar] [CrossRef]
  15. Hale, P.A. A laboratory investigation of the effects of cyclic heating and cooling, wetting and drying, and freezing and thawing on the compressive strength of selected sandstones. Environ. Eng. Geosci. 2003, 9, 117–130. [Google Scholar] [CrossRef]
  16. Özbek, A. Investigation of the effects of wetting-drying and freezing–thawing cycles on some physical and mechanical properties of selected ignimbrites. Bull. Eng. Geol. Environ. 2014, 73, 595–609. [Google Scholar] [CrossRef]
  17. Khanlari, G.; Abdilor, Y. Influence of wet–dry, freeze–thaw, and heat–cool cycles on the physical and mechanical properties of upper red sandstones in central iran. Bull. Eng. Geol. Environ. 2015, 74, 1287–1300. [Google Scholar] [CrossRef]
  18. Zhou, Z.; Cai, X.; Chen, L.; Cao, W.; Zhao, Y.; Xiong, C. Influence of cyclic wetting and drying on physical and dynamic compressive properties of sandstone. Eng. Geol. 2017, 220, 1–12. [Google Scholar] [CrossRef]
  19. Zhang, B.; Zhang, J.; Sun, G. Deformation and shear strength of rockfill materials composed of soft siltstones subjected to stress, cyclical drying/wetting and temperature variations. Eng. Geol. 2015, 190, 87–97. [Google Scholar] [CrossRef]
  20. Esposito, L.; Esposito, A.W.; Pasculli, A.; Sciarra, N. Particular features of the physical and mechanical characteristics of certain Phlegraean pyroclastic soils. Catena 2013, 104, 186–194. [Google Scholar] [CrossRef]
  21. Pasculli, A.; Sciarra, N.; Esposito, L.; Esposito, A.W. Effects of wetting and drying cycles on mechanical properties of pyroclastic soils. Catena 2017, 156, 113–123. [Google Scholar] [CrossRef]
  22. Bonn, D.; Eggers, J.; Indekeu, J.; Meunier, J.; Rolley, E. Wetting and spreading. Rev. Modern Phys. 2009, 81, 739–805. [Google Scholar] [CrossRef]
  23. Cascini, L.; Sorbino, G.; Cuomo, S.; Ferlisi, S. Seasonal effects of rainfall on the shallow pyroclastic deposits of the Campania region (southern Italy). Landslides 2014, 11, 779–792. [Google Scholar] [CrossRef]
  24. Brown, E.T. Rock Characterization Testing and Monitoring: ISRM Suggested Methods; Pergamon Press: Oxford, UK, 1981. [Google Scholar]
  25. Tan, Y.; Mo-Zhen, H.; Zhou, W.; Zuo, Q.; Wang, H.; Bo, Y. Effects of drying-wetting cycle and loading on compressive property of mudstone. Rock Soil Mech. 2016, 37, 2165–2171. [Google Scholar]
  26. Zhang, D.; Chen, A.; Xiong, D.; Liu, G. Effect of moisture and temperature conditions on the decay rate of a purple mudstone in southwestern china. Geomorphology 2013, 182, 125–132. [Google Scholar] [CrossRef]
  27. Chen, T.C.; Yeung, M.R.; Mori, N. Effect of water saturation on deterioration of welded tuff due to freeze-thaw action. Cold Reg. Sci. Technol. 2004, 38, 127–136. [Google Scholar] [CrossRef]
  28. Fu, Y. Study on Water-Rock Interaction with the Cyclic Drying-Wetting Effect on Rock. Doctor’s Thesis, Chongqing University, Chongqing, China, 2010. [Google Scholar]
  29. Talukdar, M.; Roy, D.G.; Singh, T.N. Correlating mode-I fracture toughness and mechanical properties of heat-treated crystalline rocks. J. Rock Mech. Geotech. Eng. 2018, 10, 91–101. [Google Scholar] [CrossRef]
  30. Gautam, T.P.; Shakoor, A. Comparing the slaking of clay-bearing rocks under laboratory conditions to slaking under natural climatic conditions. Rock Mech. Rock Eng. 2016, 49, 19–31. [Google Scholar] [CrossRef]
Figure 1. Typical sandstone and mudstone specimens.
Processes 06 00234 g001
Figure 2. Schematic experimental process of the cyclic wetting-drying treatment.
Processes 06 00234 g002
Figure 3. A protection device for mudstone specimen.
Processes 06 00234 g003
Figure 4. RMT-150C Rock mechanics testing system.
Processes 06 00234 g004
Figure 5. Relationship between the water adsorption and the value of N + 1.
Processes 06 00234 g005
Figure 6. Relationship between the water adsorption and porosity of specimens.
Processes 06 00234 g006
Figure 7. Stress-strain curves of sandstone specimens after wetting-drying cycles.
Processes 06 00234 g007
Figure 8. Stress-strain curves of mudstone specimens after wetting-drying cycles.
Processes 06 00234 g008
Figure 9. Failure forms of the specimens.
Processes 06 00234 g009
Figure 10. Relationship between the degradation degree of the UCS and the value of N + 1.
Processes 06 00234 g010
Figure 11. Relationship between the degradation degree of the EM and the value of N + 1.
Processes 06 00234 g011
Figure 12. Average degradation degree of UCS and EM of sandstone after wetting-drying cycles (UCS represents uniaxial compressive strength, EM represents elastic modulus).
Processes 06 00234 g012
Figure 13. Average degradation degree of UCS and EM of mudstone after wetting-drying cycles.
Processes 06 00234 g013
Figure 14. Fitted curves of average degradation degree of UCS and wetting and drying cycles.
Processes 06 00234 g014
Figure 15. Fitted curves of average degradation degree of EM and wetting and drying cycles.
Processes 06 00234 g015
Figure 16. Relationship between the UCS and the porosity.
Processes 06 00234 g016
Figure 17. Relationship between the EM and the porosity.
Processes 06 00234 g017
Table 1. Effects of cyclic wetting-drying on the mechanical properties of various sandstone by different researchers.
ResearchesSpecimen TypeSpecimen Size (mm)Wetting and Drying MethodsNmaxTest Method and Testing ConditionMechanical Properties
Hale et al. (2003) [15]Six kinds of sandstones from northeastern Ohio and western PennsylvaniaΦ54 × 108Wetting method: submerged in water for 24 h
Drying method: oven-dried at 110 °C for 24 h
50Uniaxial compression tests under dry conditionUCS: no obvious decreasing trend
Lin et al. (2005) [13]Tertiary sandstones from northern TaiwanΦ55 × 125Wetting method: submerged in water for 24 h
Drying method: not specified
60Uniaxial compression tests under dry conditionUCS (sandstone with 11% chlorite): decrease obviously,
UCS (sandstone with 1% chlorite): no obvious decreasing trend
Yao et al. (2010) [9]Red sandstone from ChinaΦ50 × 100Wetting method: forced saturation for 8 h, then immersed in water for 24 h
Drying method: oven-dried at 105 °C for 24 h, then cooled to room temperature
8Uniaxial compression tests under wet conditionUCS: decrease obviously,
EM: decrease obviously
Deng et al. (2012) [10,11]Sandstone from Three Gorges Reservoir Region of ChinaΦ50 × 100Wetting method: submerged in water from Yangtze river for 30 days
Drying method: air-dried at room temperature for 5 days
6Uniaxial compression tests under wet conditionUCS: decrease obviously,
EM: decrease obviously
Hua et al. (2015) [12]Sandstone from Ziyang of ChinaΦ75 × 25Wetting method: submerged in water for 48 h
Drying method: oven-dried at 105 °C for 24 h
7Cracked Brazilian disk splitting tests under wet conditionTS: decrease obviously,
FT: decrease obviously,
Khanlari et al. (2015) [17]Red sandstones from central IranΦ54 × 108Wetting method: submerged in water for 24 h
Drying method: oven-dried at 110 °C for 24 h
40Uniaxial compression tests under dry conditionUCS: no obvious decreasing trend
Zhao et al. (2016) [14]Sandstone with a low clay mineral content from Chongqing of ChinaΦ50 × 25Wetting method: submerged in water for 18 h
Drying method: air-dried at room temperature for 72 h
15Brazilian tensile tests under dry conditionTS: no obvious decreasing trend
Zhou et al. (2017) [18]Fine-grained sandstone from Kunming of ChinaΦ50 × 25Wetting method: submerged purified water for 48 h at 25 °C
Drying method: air-dried at 25 °C for more than 100 h
50Dynamic compression tests under dry conditionDEM: decrease obviously
DUCS: decrease obviously
UCS represents uniaxial compressive strength, EM represents elastic modulus, TS represents tensile strength, FT represents fracture toughness, DUCS represents dynamic uniaxial compressive strength, DEM represents dynamic tensile strength.
Table 2. Testing scheme.
Test MaterialNumber of Wetting-Drying Cycles (N)
Sandstone1, 5, 10, 15, 20, 40
Mudstone1, 5, 10, 12

