Article

Preparation, Characterization, and Sludge Conditioning of Cationic Polyacrylamide Synthesized by a Novel UVA-Initiated System

1
Department of the Environmental Engineering, Nanjing Institute of Technology, 1 Hongjing Avenue, Nanjing 211167, China
2
College of Civil Engineering, Hunan University of Science & Technology, Xiangtan 411201, China
3
Department of Civil Engineering, Sichuan University of Science and Engineering, Zigong 643000, China
*
Author to whom correspondence should be addressed.
Processes 2018, 6(12), 233; https://doi.org/10.3390/pr6120233
Submission received: 30 October 2018 / Revised: 18 November 2018 / Accepted: 19 November 2018 / Published: 22 November 2018
(This article belongs to the Special Issue Wastewater Treatment Processes)

Abstract

:
Controlling the concentration of free radicals in polymerization systems is advantageous for preparing cationic polyacrylamide (CPAM) with a high molecular weight and acceptable dissolvability. In this study, a novel ultraviolet (UVA)-initiated system characterized by an adjustable light intensity and a redox-azo complex initiator was used to synthesize a CPAM flocculant named NP. Comparatively, another CPAM flocculant named SP with a stable UVA light intensity and a single initiator was prepared. Their chemical structure, morphology, and thermal stability were analyzed through instrumental analysis. 1H NMR indicated that NP was successfully prepared, and a small fraction of a cationic homopolymer was mixed in the product. Polymerization conditions of NP were optimized, and polymerization mechanism was determined by investigating the effects of various parameters on intrinsic viscosity, conversion, and dissolvability. Results showed that the best performance was obtained at indices of 0.45 wt‰ redox initiator concentration, 0.2 wt‰ azo initiator concentration, 40.0 wt% cationic monomer, 3 wt‰ urea, and first- and second-stage light intensities of 8.5 and 13 mW/cm2, respectively. The sludge conditioning performances of NP and SP were comparatively evaluated, and the mechanism was determined by examining sedimentation behavior and floc size distribution. High intrinsic viscosity, porous morphology structure, and mixed NP cationic homopolymer contributed to the improvement of sludge conditioning performance.

Graphical Abstract

1. Introduction

Activated sludge processing is an important treatment technology for a wide range of wastewaters from residential and industrial sources. Unfortunately, the high annual increase in excess sludge recovered from treatment facilities represents 1–2% of the total waste water. The sludge comprises 50–80% of the isolated pollutants along with trapped water which must be separated prior to disposal. Sludge is difficult to dewater because small negatively charged particles are consistently distributed in the form of a stable colloidal suspension. Sludge conditioning prior to mechanical dewatering should be conducted to destabilize particulate systems [1,2,3].
Cationic polyacrylamide (CPAM) has been widely used for sludge conditioning because it can neutralize the surface charge of solid and bridge particles through its long polymer chain to form large flocs that can reduce the specific resistance and cake compressibility of sludge [4,5,6]. The molecular weight (MW) of CPAM, which can be characterized by intrinsic viscosity, is closely related to bridging mechanism. With increasing polymer chain length, an increase in intrinsic viscosity leads to an increase in bridging performance, involving numerous particles [7]. Zheng et al. [5,6,8] reported that a low-filter cake moisture content (FCMC) is achieved with high-MW polymers at the same dosage of flocculants. Zhu et al. [4] determined that the best sludge dewatering performance is obtained by CPAM with the highest MW. Zhou et al. [9] indicated that the optimum dosage of CPAM is negatively correlated with its MW if the MW of CPAM reaches above five million. Thus, studies focusing on the preparation technology of CPAM constantly optimize MW synthesis conditions [10,11]. Dissolving time should also be considered, although high-MW CPAM contributes to sludge dewatering. The dissolving time for existing CPAM products can reach several hours, which is considerably long in practical applications [4]. Thus, MW and dissolving time of CPAM should be considered simultaneously.
Dissolving time highly depends on molecular configuration. Commonly, CPAM will be nearly insoluble if molecular chains are cross-linked, whereas it will dissolve easily when the chain is linear [12]. The molecular configuration of CPAM in solution is closely related to its polymerization. Radical concentration is a valuable tool to control organic polyelectrolyte chemical structure and achieve varying intrinsic viscosity and dissolving time. The concentration of free radicals at appropriate levels should be conducted appropriately as molecular chains will cross-link if the free radical concentration is high, whereas polymerization reaction cannot proceed well at low levels. High-MW CPAM could be prepared to control the amounts of free radicals in polymerization systems. Agarwal et al. [13] investigated the graft copolymerization of guar-g-(acrylamide (AM)-co-diallyl dimethylammonium chloride) with cerous sulfate and potassium persulfate as complex initiators. The grafting ratio of grafted copolymer was higher than those of similar studies, as shown in reactions (1) and (2) (GG stands for guar gum, Ce statands for cerium):
Ce 4 + + GG Ce 3 + + GG ,
S 2 O 8 2 + 2 Ce 3 + 2 SO 4 2 + 2 Ce 4 +
A certain concentration of Ce4+ with initiating activity can be maintained in the polymerization system with the above reactions. Polymerization can be completely conducted; therefore, grafting ratio increases. Zhao et al. [14] prepared high-MW CPAM by using redox materials and azo salt as complex initiators and controlled it at a low temperature for specific times. They subjected the prepared material to increasing temperature. The decomposition activation energy of redox initiators were approximately 40 kJ/mol, whereas the decomposition activation energy of azo initiators reached more than 100 kJ/mol [15,16]. Free radicals generated from redox initiator reaction at low temperatures undergo copolymerization, whereas azo salt produces free radicals at high temperatures when redox initiators are exhausted. Therefore, high-MW CPAM polymerizes. Nevertheless, polymerization and the effects of complex initiation on flocculant dissolvability have yet to be elaborated. The polymerization mechanism and control on radical concentration should be investigated. These studies have involved heating, which is time and energy consuming and difficult to control [17]. Ultraviolet (UVA) initiation features low reaction temperature, short polymerization time, high polymer MW, and environmental friendliness. Ultraviolet light intensity can be altered immediately and is easily controlled [10,18]. In the present study, a novel UVA initiating system characterized by adjustable light intensity and redox-azo complex initiators was established and used to prepare CPAM flocculant (The name is NP and it is the flocculant prepared by the novel UVA initiating system) by maintaining a certain concentration of free radicals. The polymerization characteristics and mechanism of this novel complex UVA initiation system were comprehensively determined by investigating the effects of various parameters on intrinsic viscosity, conversion, and dissolvability.
The primary objectives of this study were as follows: (1) to reveal the chemical structures, morphology, and thermal stability using a Fourier transform infrared spectrometer (FT-IR), a proton nuclear magnetic resonance spectrometer (1H NMR), a thermogravimetric analysis–differential scanning calorimeter (TGA-DSC), a scanning electron microscope (SEM), an X-ray photoelectron spectroscope (XPS), and an elemental analyzer; (2) to prepare NP with high intrinsic viscosity and acceptable dissolvability with this novel UVA initiation system by using acrylamide (AM) and acryloxyethyltrimethyl ammonium chloride (DAC) as monomers; (3) to determine the polymerization mechanism and optimum preparation conditions by investigating the key aspects of initiating conditions, such as redox initiator concentration, azo initiator concentration, mass ratio between AM and DAC, urea concentration, light intensity at different stages on conversion, intrinsic viscosity, and dissolving time; and (4) to evaluate NP sludge dewatering performance and mechanism by examining dosage dependence, sedimentation behavior, and floc distribution.

2. Materials and Methods

2.1. Materials

Acrylamide (98.5%, w/w) was obtained from Lanjie Tap Water Co., Ltd. (Chongqing, China). Cationic DAC (80% in water) was supplied by Luyue Chemical Co., Ltd. (Shandong, China). 2,2′-Azobis(2-methylpropionamide)dihydrochloride (V50) as a photoinitiator was procured from Ruihong Biological Technology (Shanghai, China). Acrylamide, DAC, and V50 were industrial grade. Other reagents, including ammonium persulfate (Wokai Biological Technology Co., Ltd., Shanghai, China), sodium bisulfate ethanol (Wokai Biological Technology Co., Ltd., Shanghai, China), urea (CO(NH2)2) (Wokai Biological Technology Co., Ltd., Shanghai, China), hydrochloric acid (HCl) (Chuandong Chemical Co., Ltd., Chongqing, China), and sodium hydroxide (NaOH) (Chuandong Chemical Co., Ltd., Chongqing, China), were analytical grade. The purity of nitrogen gas was higher than 99.9%. All reagents were used directly without any further purification.
Raw waste sludge from the thickener of Jiangning Development Zone Drainage Co., Ltd. (Nanjing, China) was used for this study. The samples were collected, stored in a refrigerator at 4 °C to minimize microbial activity, and analyzed within 3 days. The characteristics of the sludge are listed in Table 1.

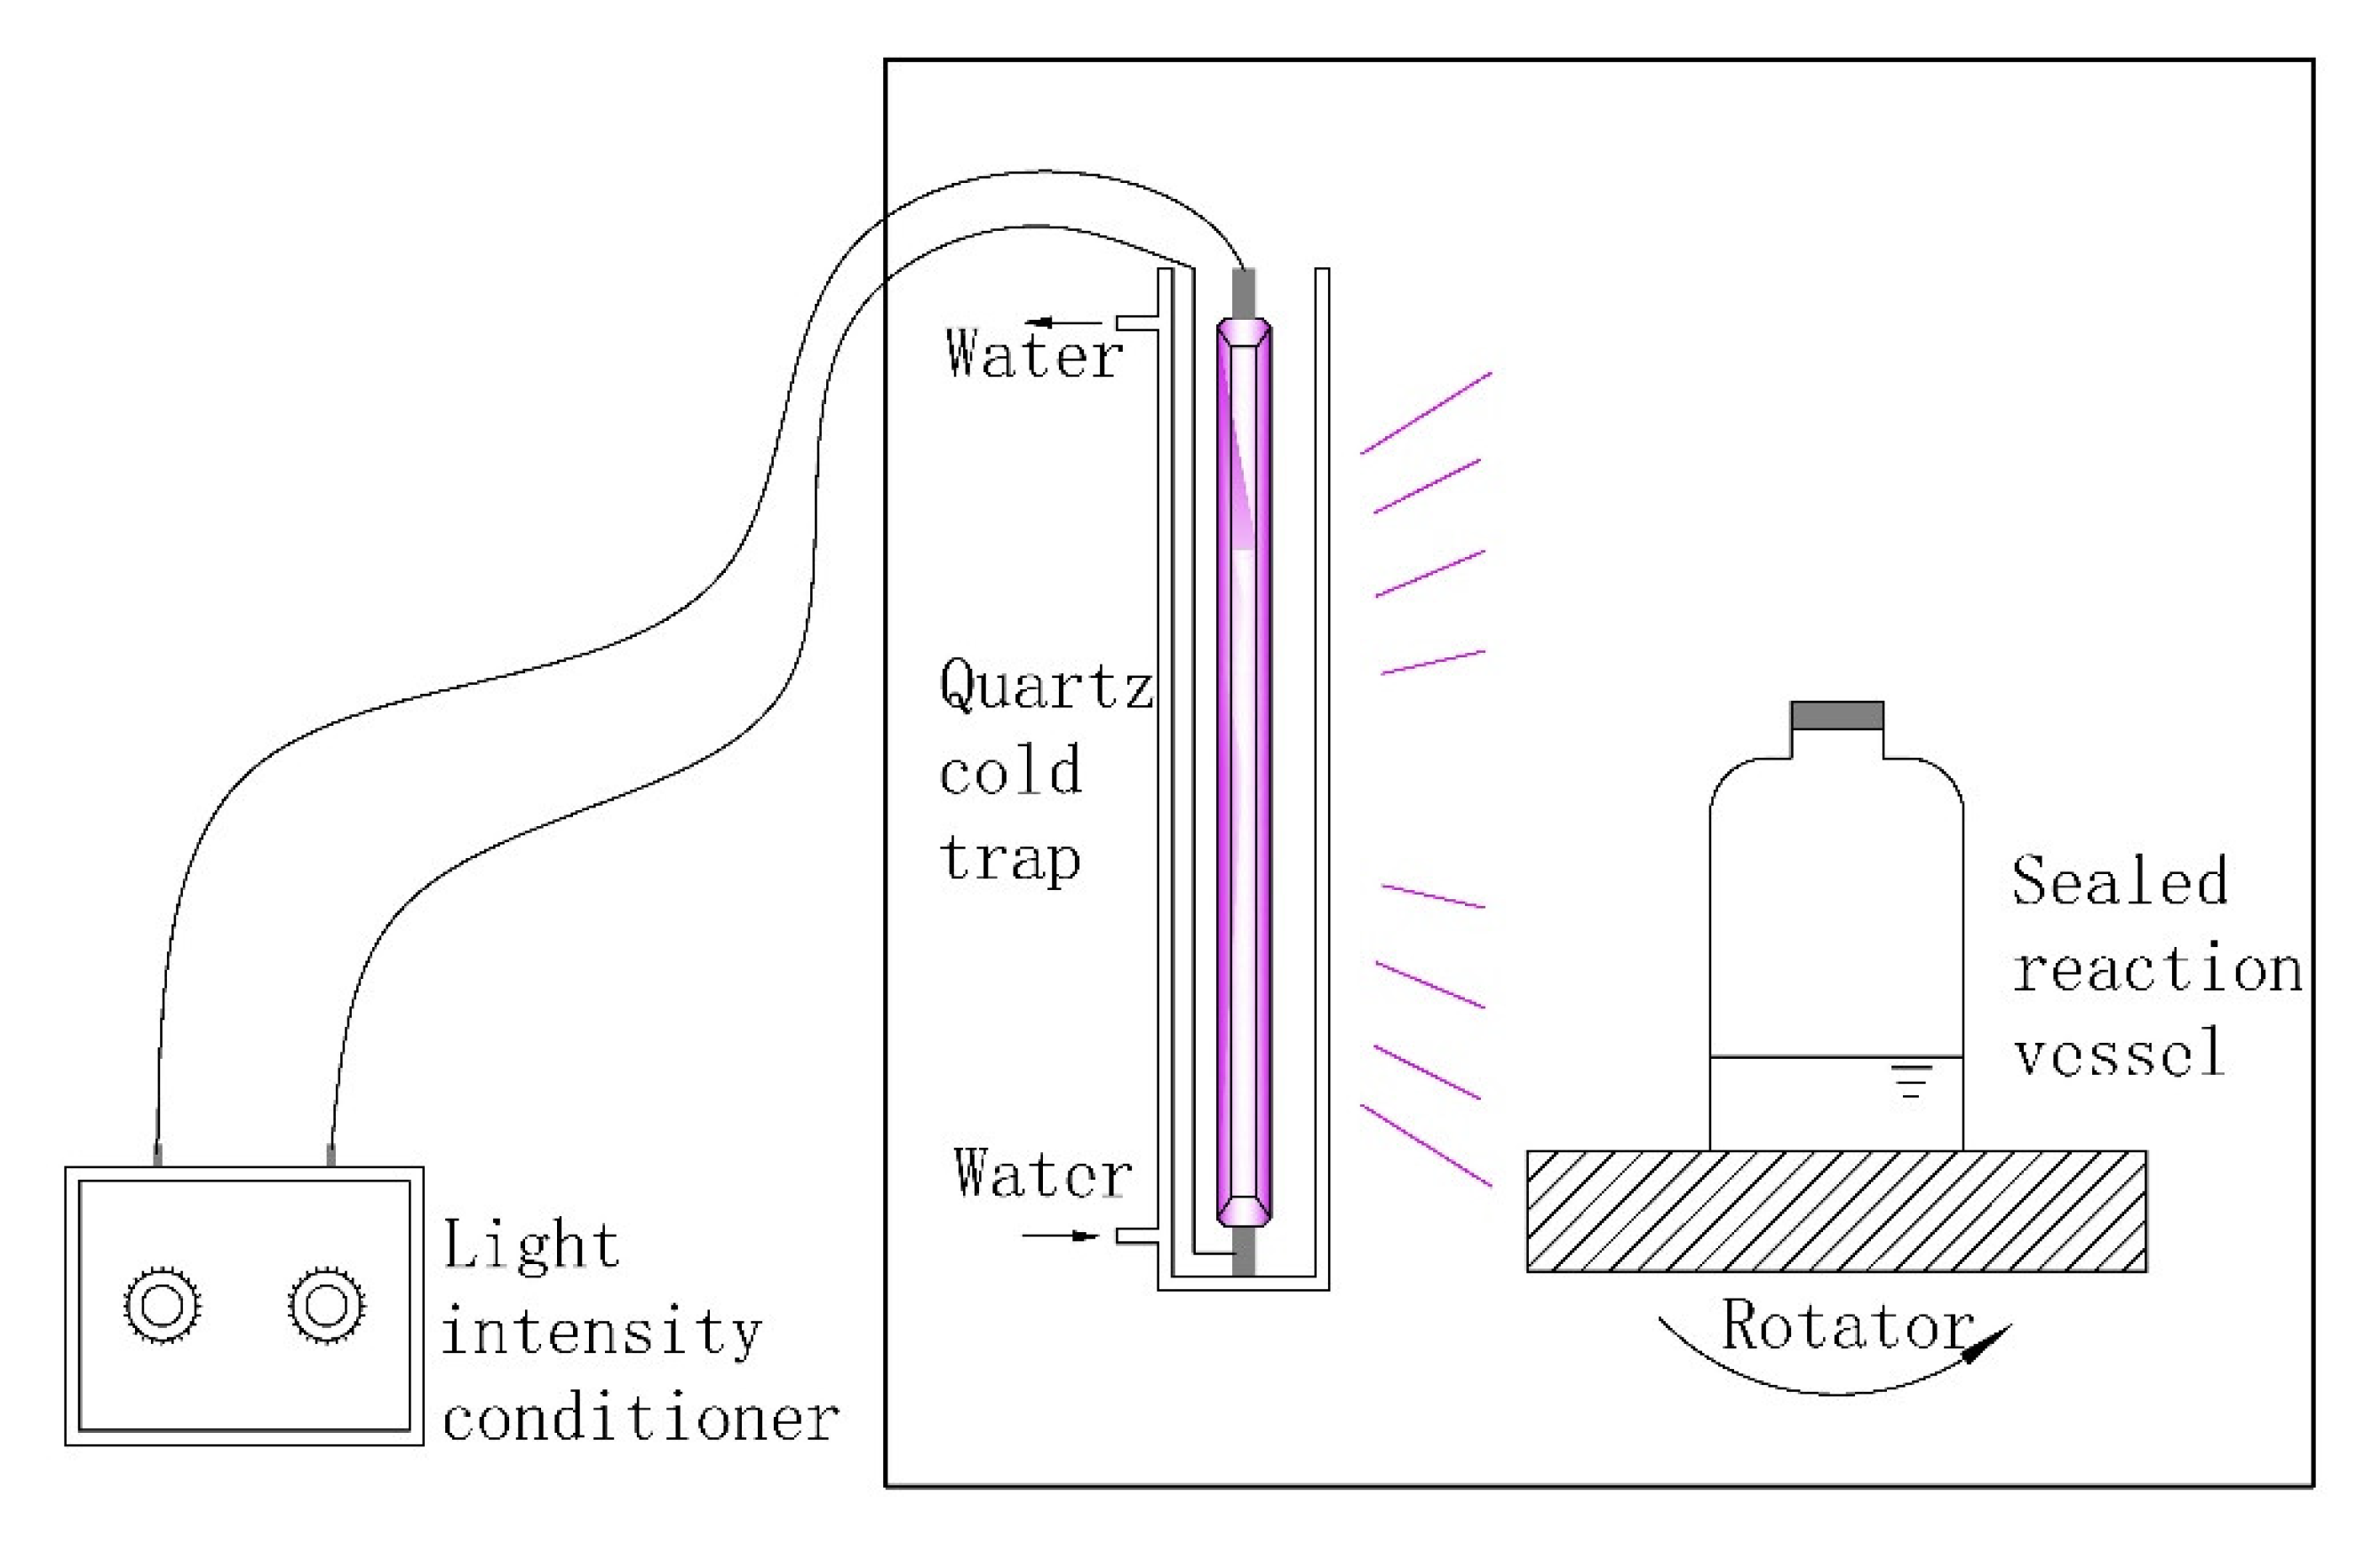
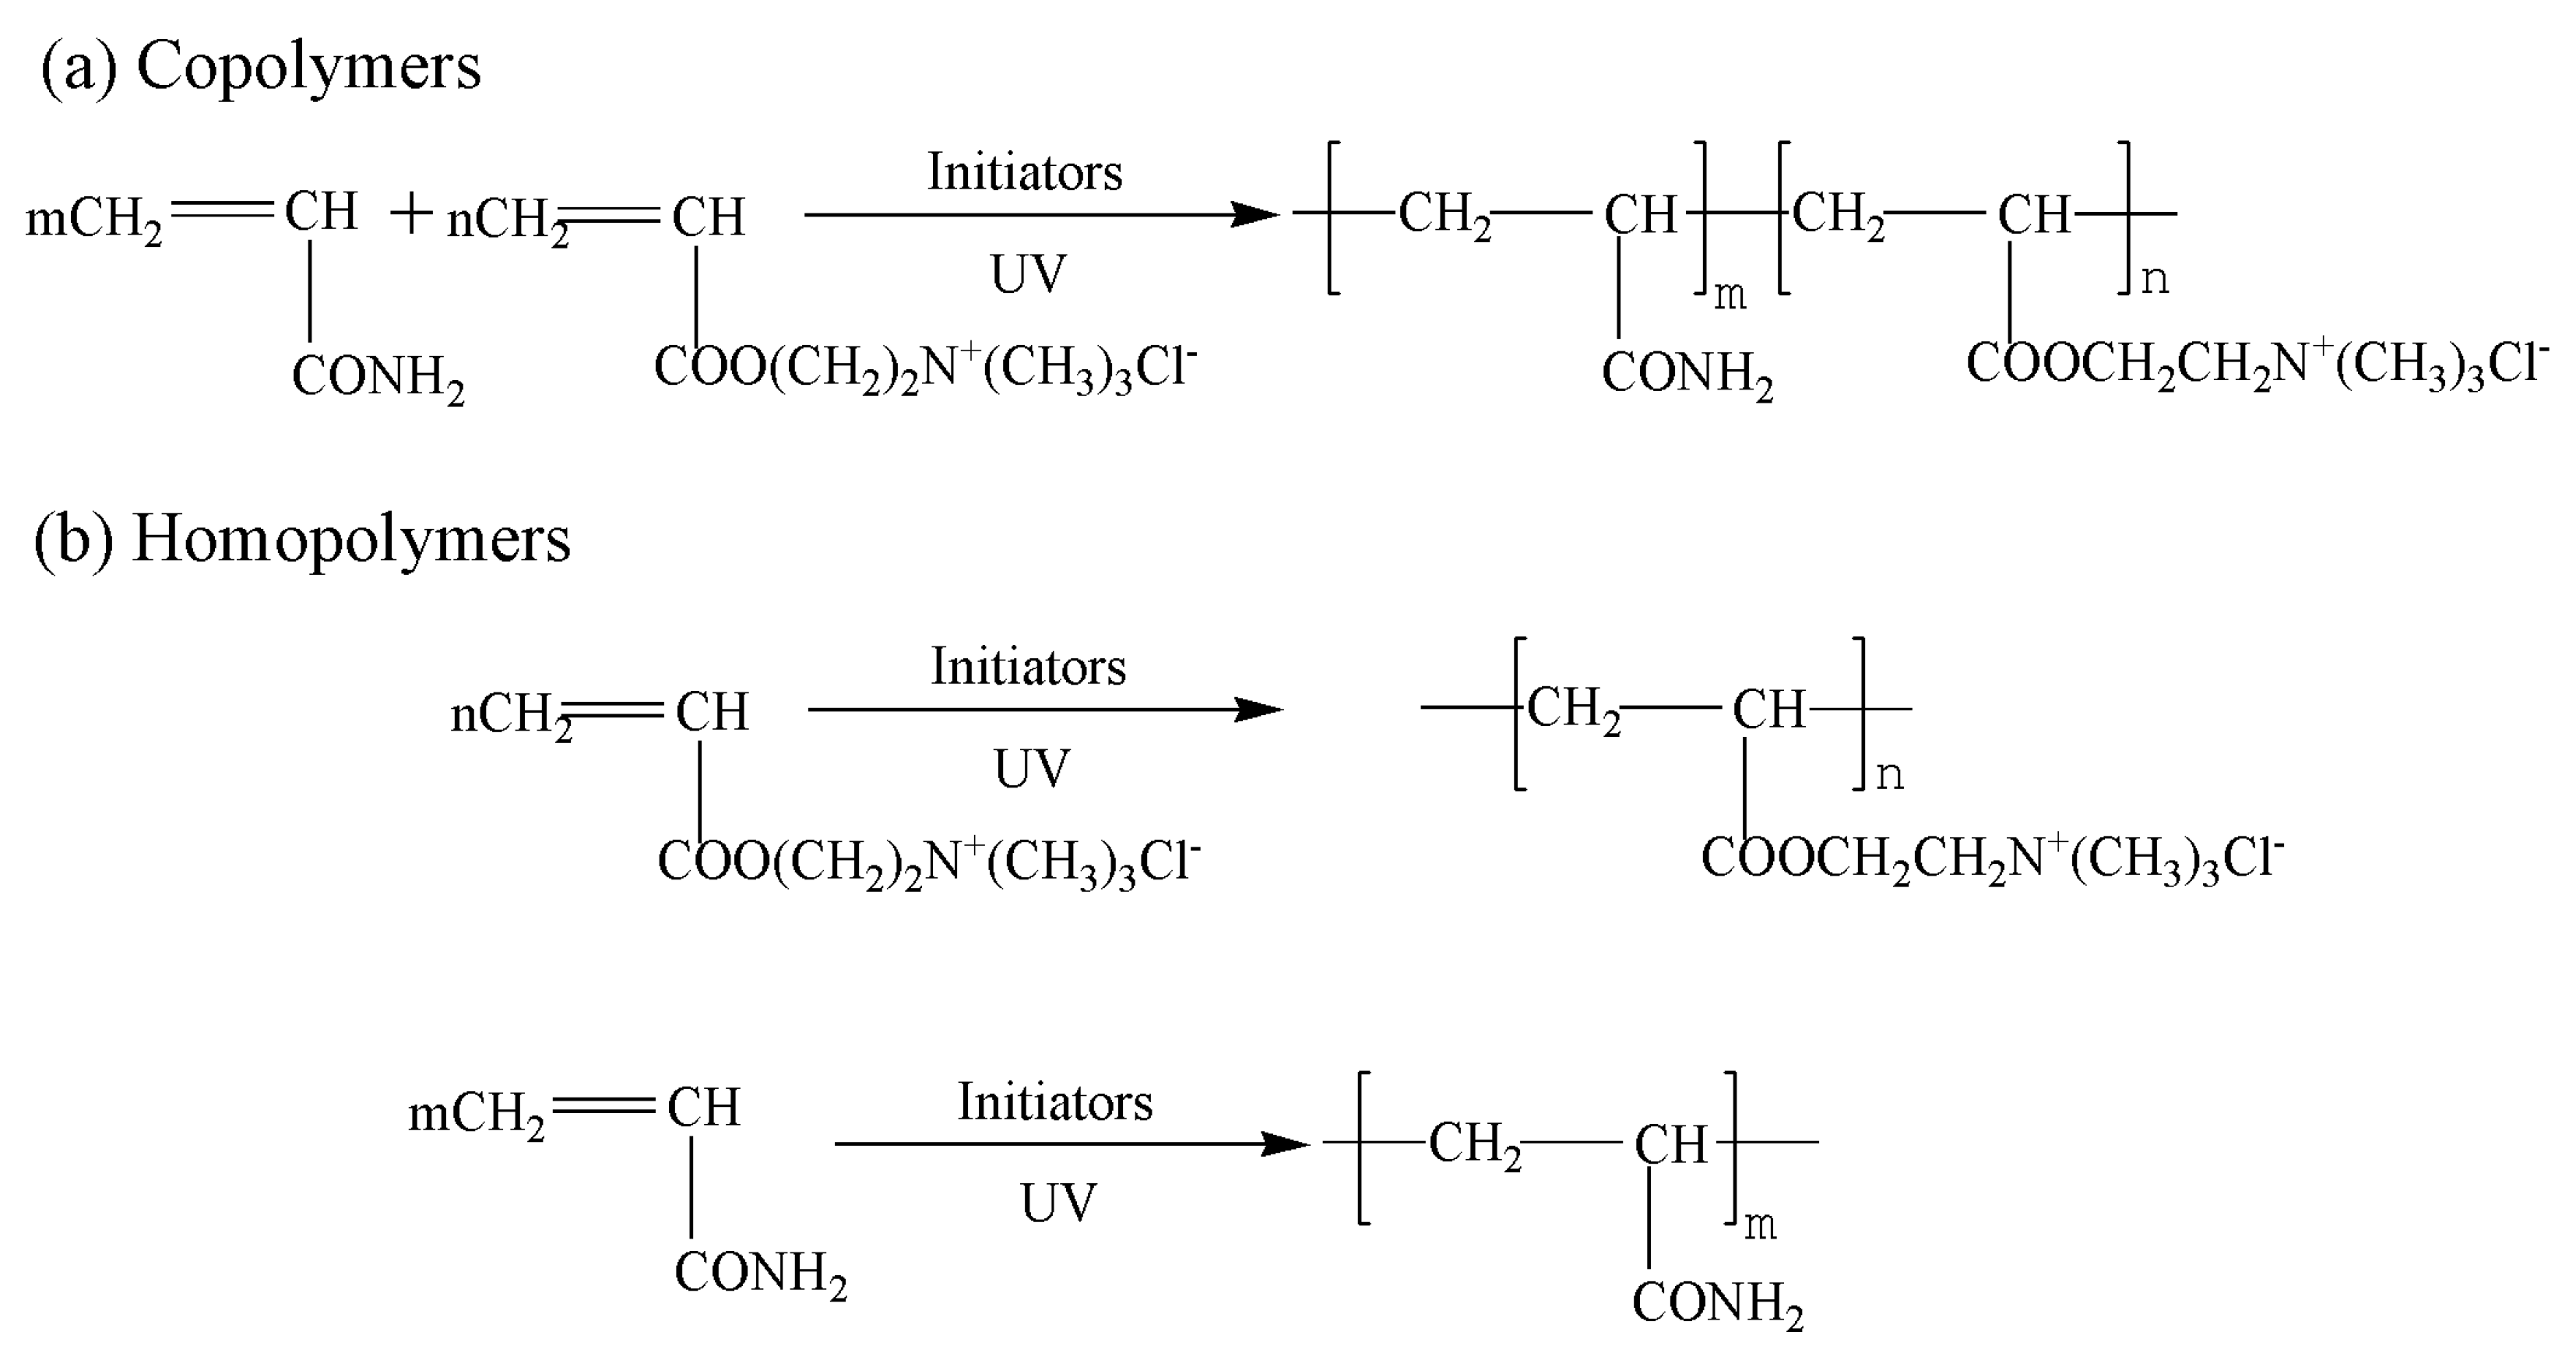
2.2. Preparation Method

The scheme of our preparation device is shown in Figure 1. The NP was prepared as follows. Acrylamide, DAC, deionized water, and urea, which acted as a cosolvent, were added to a reaction vessel made of silicate glass. Ammonium persulfate, V50, and sodium bisulfate were added during the purging of nitrogen gas for 30 min prior to UVA activation. Ultraviolet light (Jiguang Special Lighting Electric Factory, Shanghai, China) was generated using a 500 W high-pressure mercury lamp (wavelength in the range of 300 to 400 nm and main wavelength at 365 nm) and a light intensity conditioner. As shown in Figure 1, light intensity can be adjusted through a conditioner and an irradiance meter to a specific value. Light intensity was controlled for a specific period, and the intensity was adjusted for another specific period. Flocculant was produced, and the aqueous solution was changed into a translucent colloid. Scheme 1 showed the copolymerization reaction of AM and DAC. During polymerization, some poly acrylamide (PAM) and poly (acryloxyethyltrimethyl ammonium chloride) PDAC may be produced. The products were purified with acetone and ethanol for several times to remove residual monomers. The purified products were then dried and ground into powder. The procedure and conditions of CPAM prepared by a stable UVA light intensity and a single initiator system (SP), PAM, and PDAC preparation were based on previous studies [6,19].

2.3. Characterization of the Copolymer

The FT-IR of the copolymer and the monomers was conducted using a 550 Series II infrared spectrometer (Mettler–Toledo, Greifensee, Switzerland). The interval of the measured wave numbers was from 500 cm−1 to 4000 cm−1.
The 1H NMR spectra of the flocculant were obtained using a Bruker AVANCE-500 spectrometer (Bruker Company, Karlsruhe, Germany) in D2O solvent.
The TGA-DSC was conducted with a DTG-60H synchronal thermal analyzer (Shimadzu, Kyoto, Japan) at a heating rate, a nitrogen flow rate, and a temperature range of 10 °C/min, 20 mL/min, and 20 °C–600 °C, respectively.
Samples for electron microscopy were prepared by shattering, planishing, and spraying. They were then dried, and SEM images were recorded with a VEGA II LMU instrument (TESCAN Company, Brno, Czech Republic).
The XPS was performed using an ESCALAB 250 Xi XPS spectrometer (Thermo Fisher Scientific, Waltham, MA, USA).
Elemental analysis was carried out to examine NP and SP by using an elemental analyzer with Elementar Vario MACRO cube (Elementar, Langenselbold, Germany).
The conversion and the intrinsic viscosity of NP or SP were determined via gravimetric and one point methods, respectively [11]. The intrinsic viscosity was expressed in deciliter per gram (dL/g) and measured in 1.0 mol/L NaCl solution with an Ubbelohde capillary viscometer (Shenyi Glass Instrument Co., Ltd., Shanghai, China) at 30.00 ± 0.05 °C.
The dissolving time was conducted as follows. NP (0.040 ± 0.002 g) was added to a 200 mL beaker and used as a reaction vessel. Afterward, 100 mL of distilled water was added to the reaction vessel, which was placed in an oscillator. The temperature of the oscillator was controlled at 30 °C, whereas the electrode of a conductivity meter was inserted into the beaker to determine whether the products were completely dissolved. If the conductance value remained unchanged in 3 min, the sample was considered completely dissolved. Finally, the time required for completely dissolving the sample was recorded.
Charge density (CD) was determined through colloid titration [19].

2.4. Sludge Conditioning Experiment

In this study, a Buchner funnel test was applied to examine the conditioning ability of the polymers. The measurement procedures of residual turbidity (RT), zeta potential, filter cake moisture content (FCMC) and specific resistance of filtration(SRF) were referred to as in References [8,20].

3. Results and Discussion

3.1. Characterization

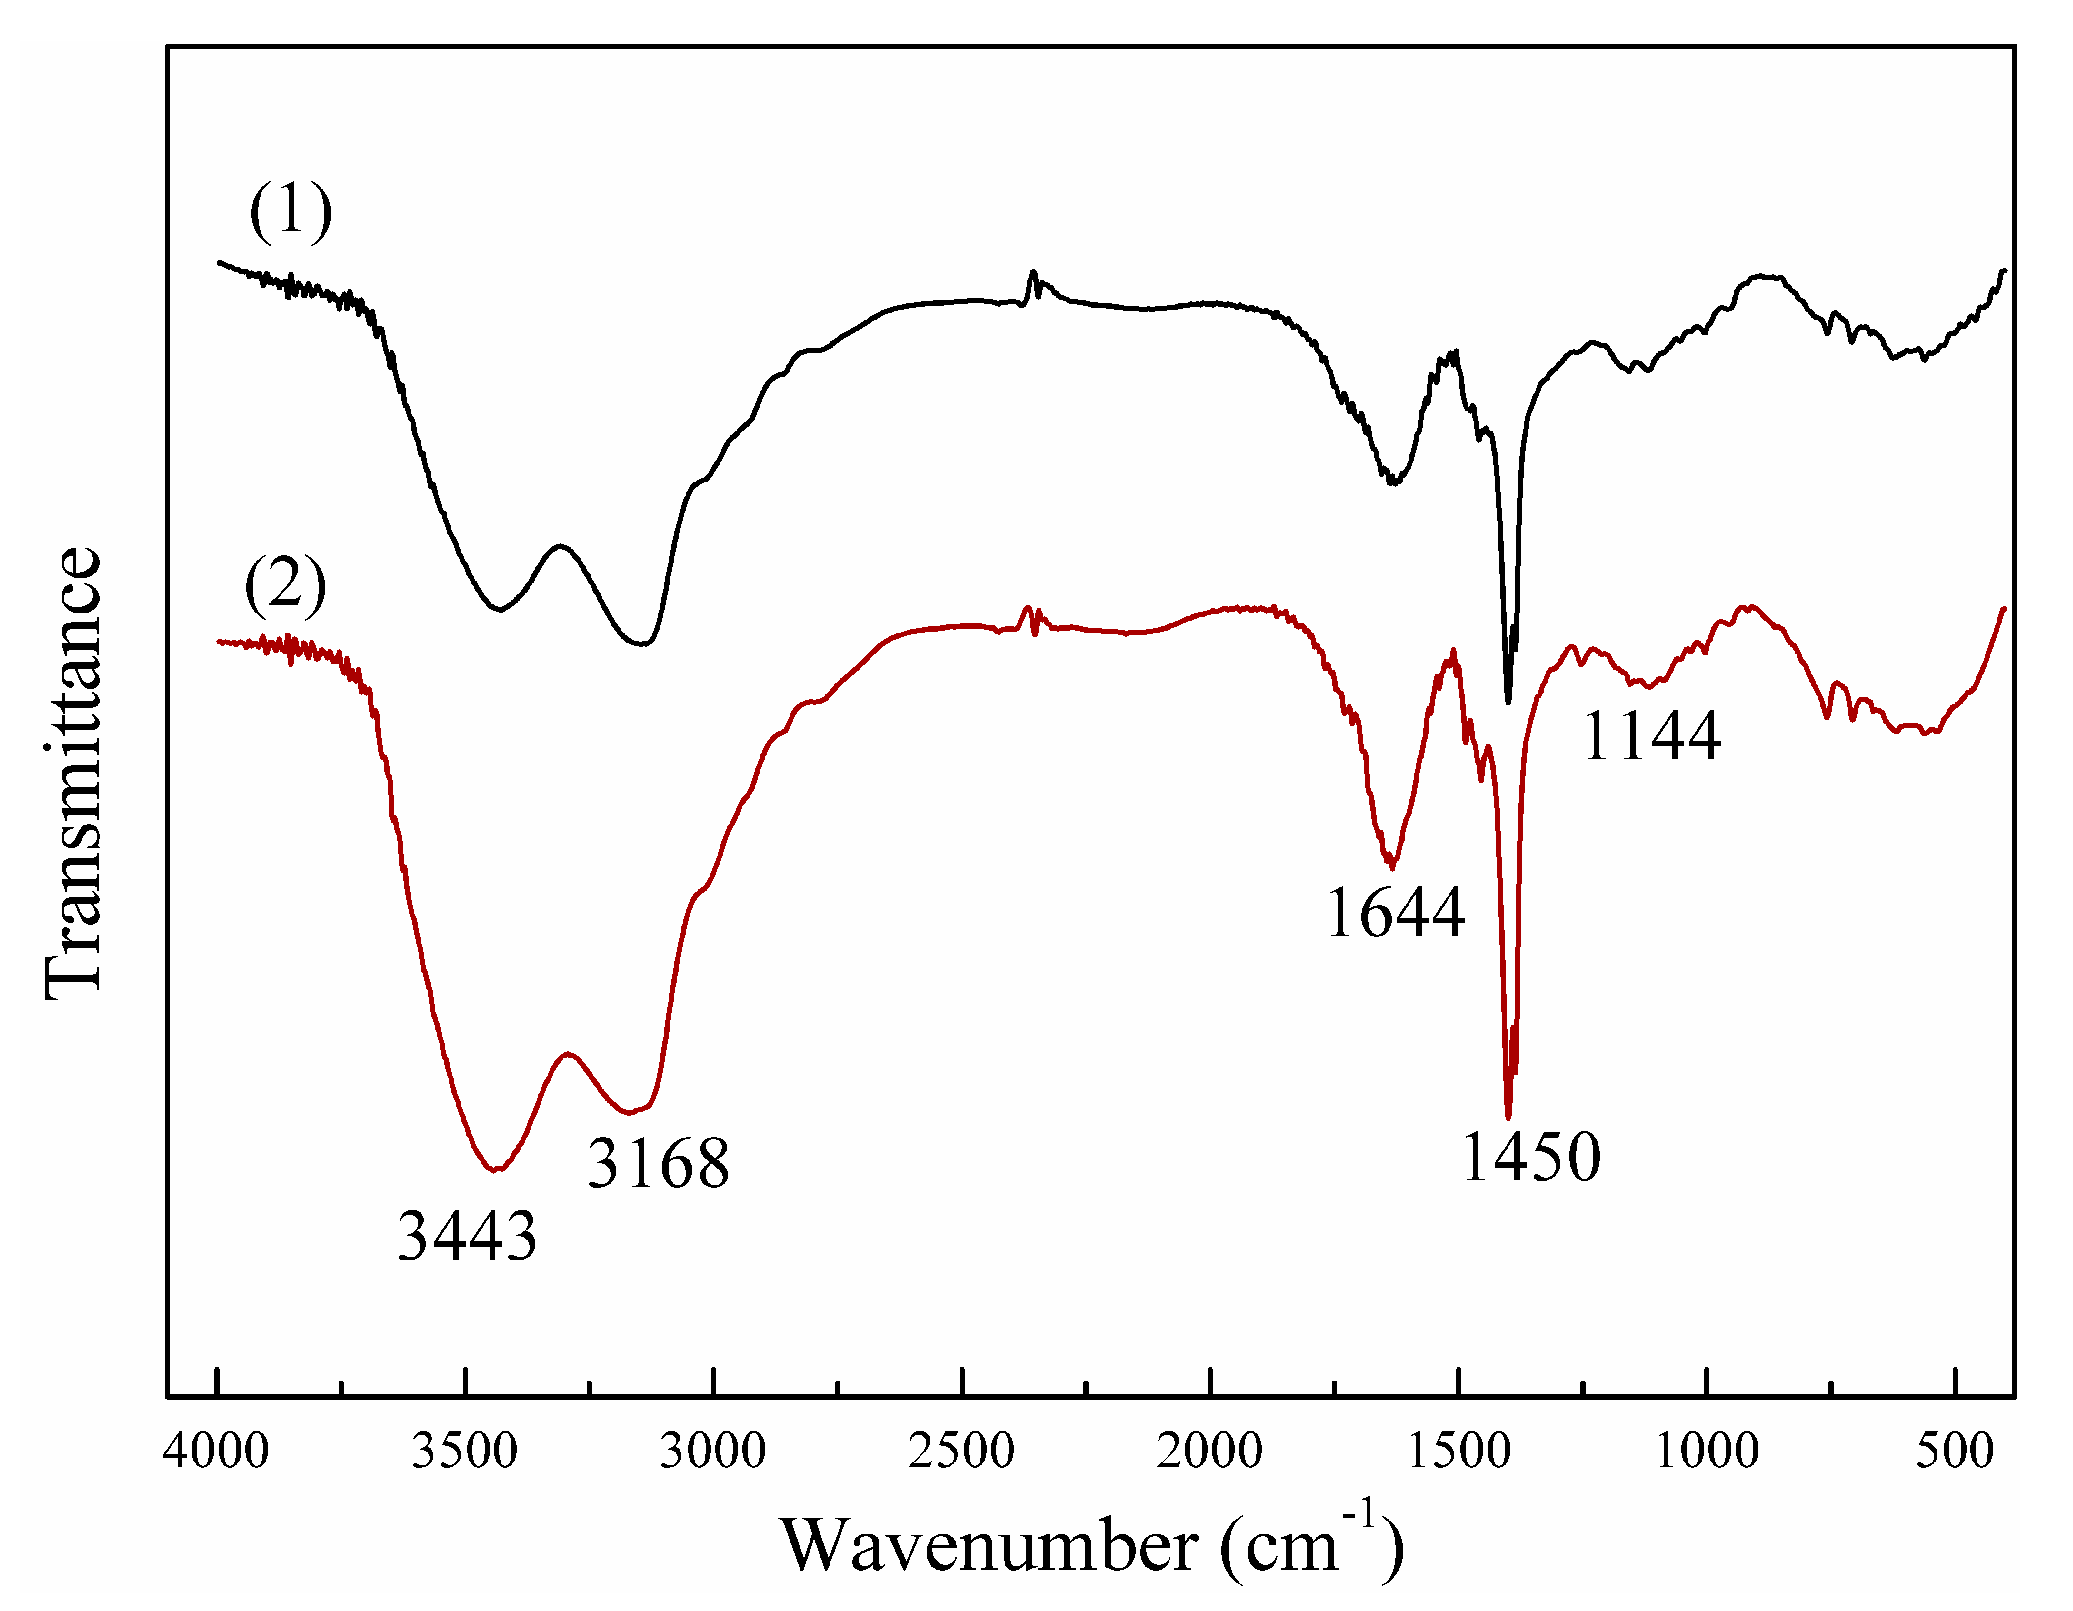
3.1.1. FT-IR Spectra

Figure 2 shows the FT-IR spectra of NP and SP. Obviously, the adsorption peaks of NP and SP were almost the same, thus indicating that possible chemical bonds were the same. In other words, this novel UVA initiating system did not change the chemical structures of the copolymers. The adsorption peaks at 3443 cm−1 and 3168 cm−1 were assigned to the stretching vibrations of -NH2 in the amide groups. The adsorption peak at 1450 cm−1 represented for C=O in the amide groups. The adsorption peak at 1144 cm−1 corresponded to that of C–O in ester groups. The adsorption peak at 1450 cm−1 corresponded to CH2- flexural vibrations in -CH2-N+. The minor adsorption peaks at >3700 cm−1 stood for -OH stretching vibrations. These overlapped peaks can be attributed to the small amount of bound water in the polymers as several chemical bonds were hydrophilic. The FT-IR spectra indicated that AM and DAC were reacted [18].

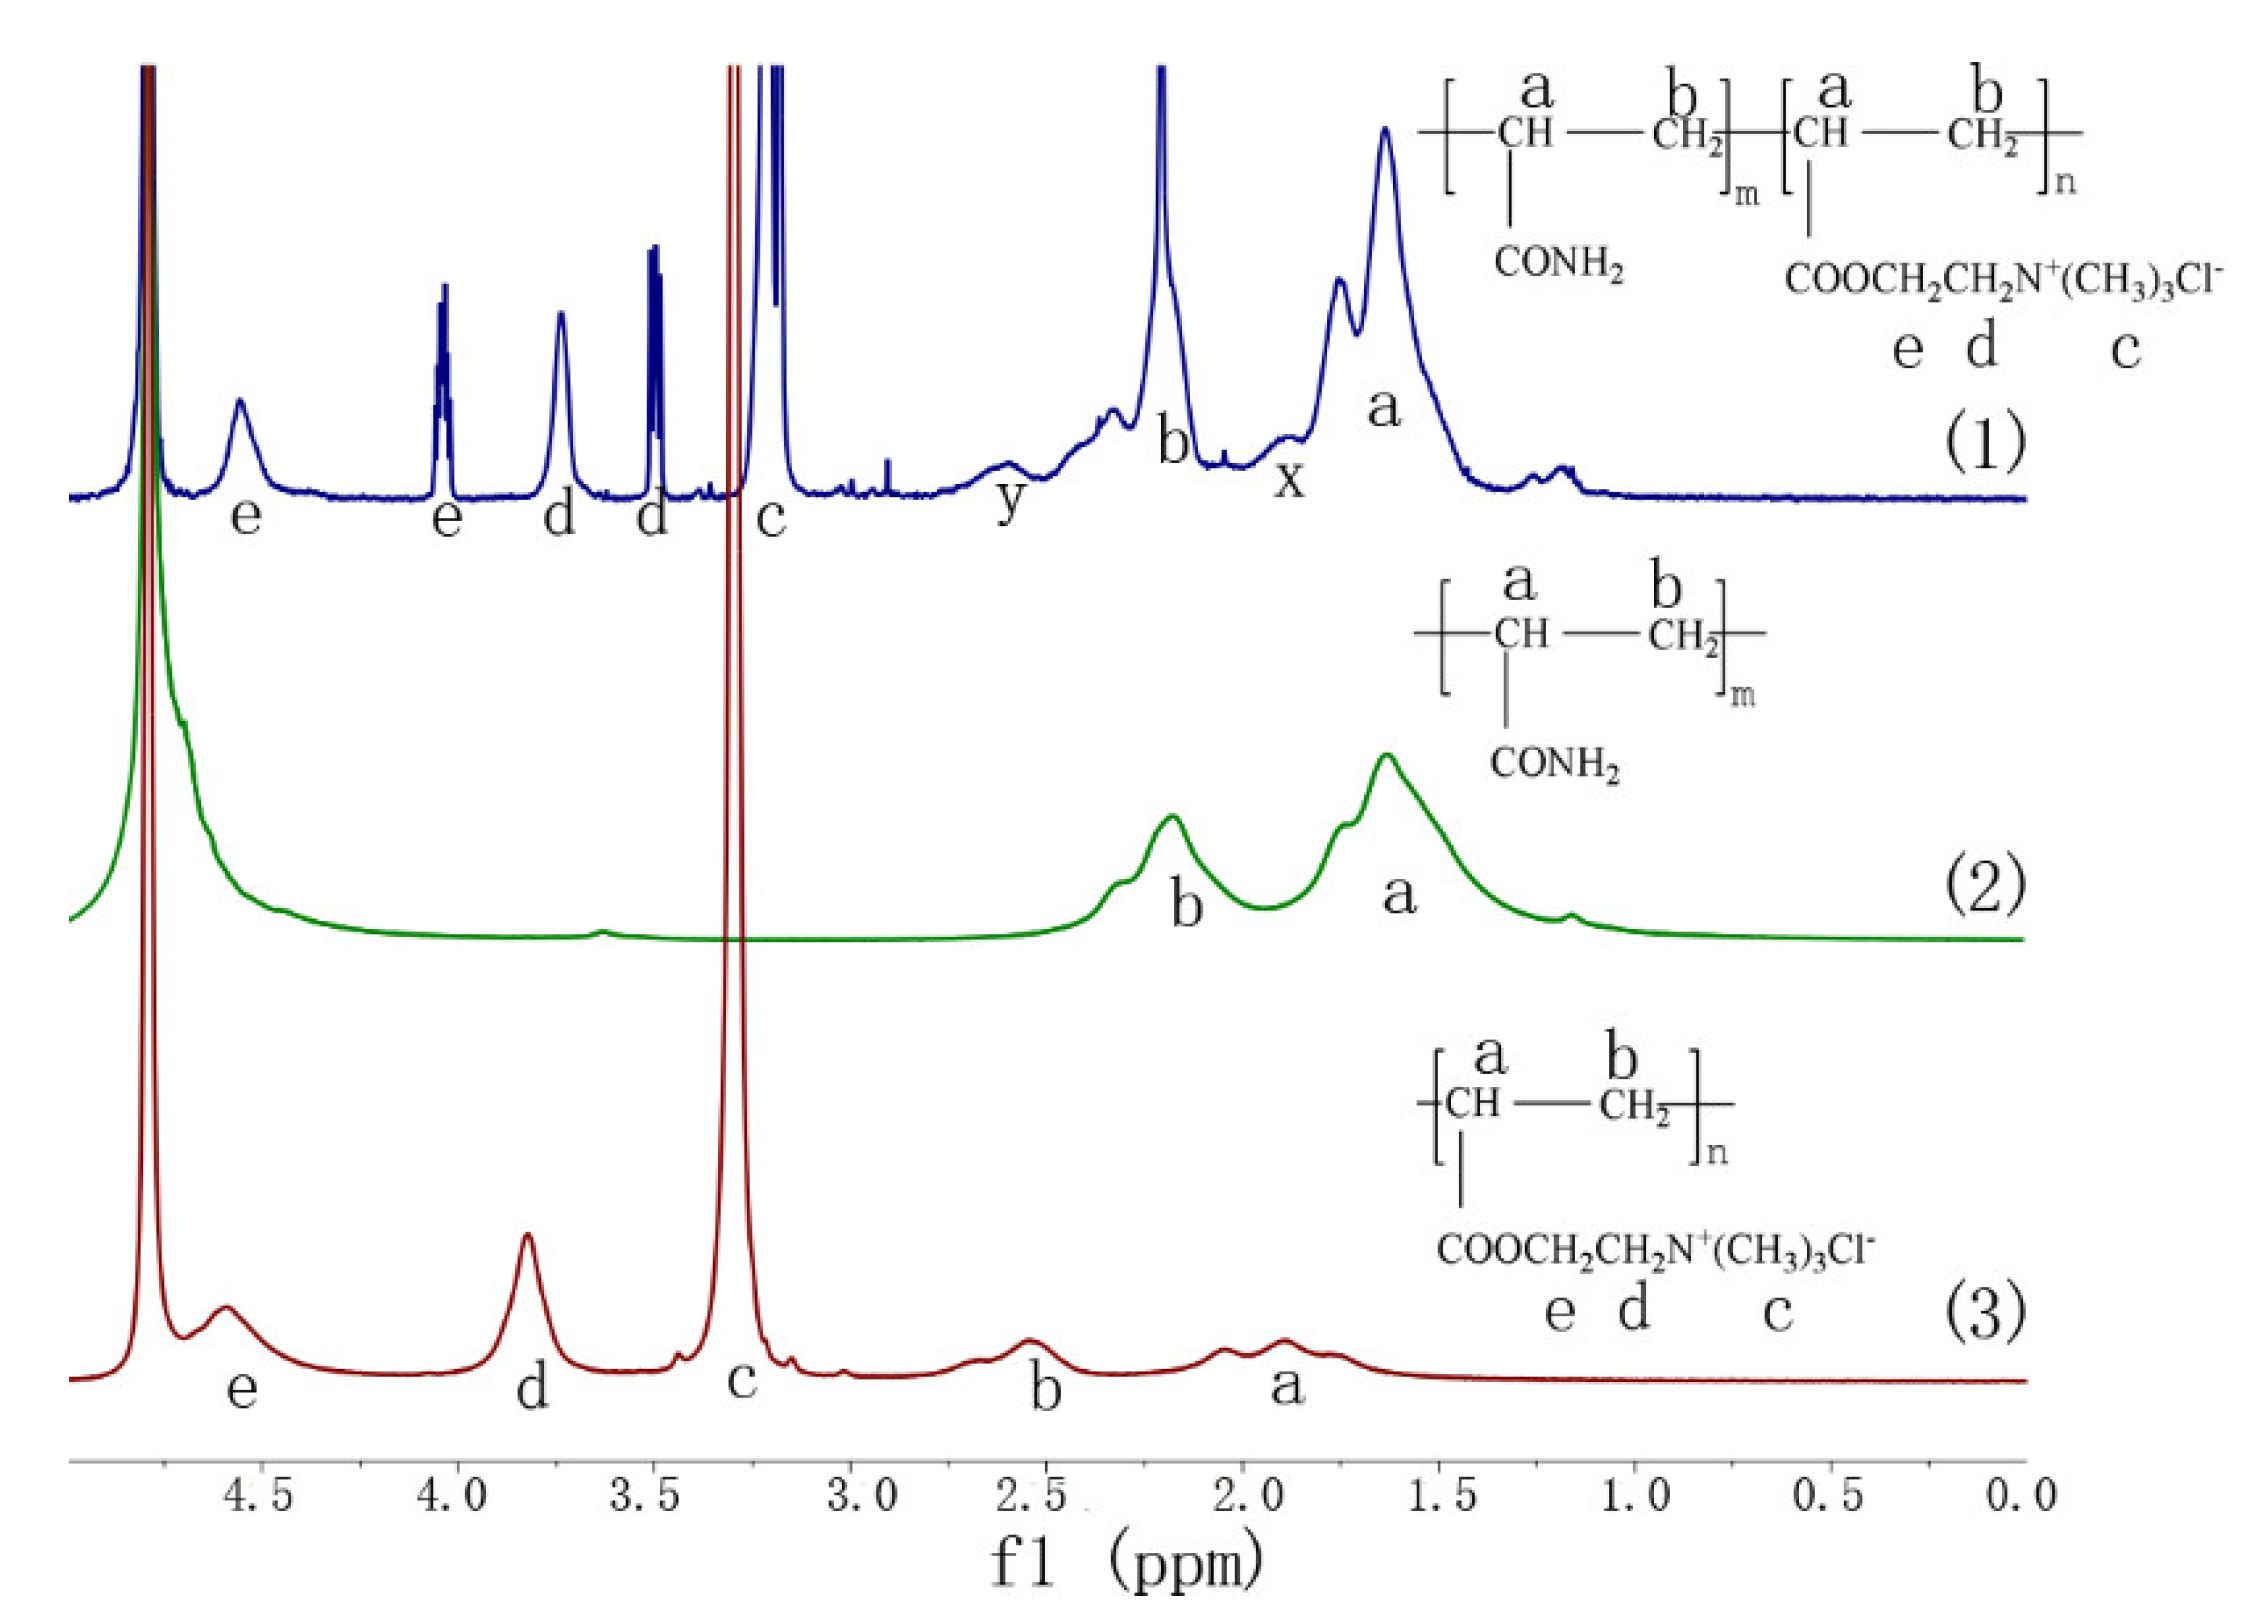
3.1.2. 1H NMR Spectra

Figure 3 shows the 1H NMR spectra of NP, PAM, and PDAC. Several similarities were observed among NP, PAM, and PDAC, although the differences cannot be ignored. The asymmetric peaks of NP at δ = 1.64 ppm and sharp peak at δ = 2.21 ppm were due to the protons at the backbone of methylene and methine groups-CH2-(a) and -CH-(b), respectively. However, the protons in the structures of Figure 3(2) shifted to δ = 1.63 ppm and δ = 2.18 ppm, whereas the triplet and asymmetric peaks of -CH2-(a) and -CH-(b) in Figure 3(3) shifted to δ = 1.89 ppm and δ = 2.54 ppm, respectively. The sharp peak at δ = 3.21 ppm in Figure 3(1) was assigned to the protons of -N+-(CH3)3 (c) and was displayed at δ = 3.30 ppm in Figure 3(3). The peak of NP at approximately δ = 3.74 ppm was assigned to the protons of -CH2-N+-(d), whereas it shifted to δ = 3.89 ppm in PDAC. The chemical shift of NP at approximately δ = 4.66 ppm was ascribed to the protons of -O-CH2-(e), and it shifted to 4.79 ppm in PDAC. These minor chemical shift differences for the same group among NP, PAM, and PDAC and the extra peaks indicated the successful preparation of NP using AM and DAC. The sharp peaks of the three polymers at δ = 4.79 ppm were identified as the solvent D2O. Two more peaks at δ = 3.50 ppm and δ = 4.05 ppm, which were assigned to -CH2-N+-(d) and -O-CH2-(e) in the 1H NMR spectra of NP, respectively, were observed by comparing with PDAC spectra. Previous studies proposed that the two peaks were attributed to the stereochemistry of the copolymer after copolymerization [21]. The chemical shifts in Figure 3(1) at approximately δ = 1.90 ppm (x) and δ = 2.59 ppm (y) were not observed in 1H NMR spectra of copolymer prepared by stable UV initiation system in our previous study [19]. The two peaks were nearly identical with those at δ = 1.89 ppm and δ = 2.54 ppm in Figure 3(3). This result indicated that a small fraction of PDAC homopolymer was mixed in NP. A probable explanation is proposed as follows: Our previous research indicated that the reactivity ratios of AM and DAC in solution polymerization are 2.27 and 0.38, respectively [19]. The conventional copolymerization equation, which describes the instantaneous copolymer composition and composition of the copolymer formed from a particular feed composition, was established by the reactivity ratios. This equation depicts that AM with high reactivity ratio significantly participated in copolymerization at the initial phase. In other words, the copolymers generated at such conditions featured low charge density (CD). The prepared polymers with high CD or PDAC can be obtained with continuous depletion of AM monomers. In our novel UVA initiation system, DAC monomers can be sufficiently copolymerized with the complexation of different initiators with different activation energies and varying UVA light intensities, that is, the radicals were distributed during copolymerization. Therefore, the copolymers generated at the end of polymerization exhibited high CD, or PDAC can be obtained. A small fraction of PDAC in NP copolymer caused the chemical shift at δ = 1.90 ppm (x) and δ = 2.59 ppm (y) in Figure 3(1). These PDAC homopolymers significantly contributed to sludge conditioning.

3.1.3. XPS

The XPS fully-scanned spectra of the samples are illustrated in Figure 4a. In NP and SP, O, N, C, and Cl existed. The occurrence of Cl from DAC confirmed the successful copolymerization. The XPS spectra of C 1s for NP and SP ae shown in Figure 4b,c, respectively. The C 1s spectrum of NP and SP can be divided into three peaks with binding energies (BE) at approximately 287.9, 286.0, and 284.4 eV, which corresponded to the C–H/C–C, C–O, and O–C–O species, respectively. For O 1s spectra in Figure 4d,e, only one peak at about 531.8 eV corresponding to the C–O structure was observed. The XPS spectra of N 1s for NP and SP ae shown in Figure 4f,g, respectively. Two peaks at about 399.2 and 402.2 eV were attributed to CO–NH2 from the AM unit and -N+-(CH3)3 from the DAC unit, respectively. Furthermore, the integral of each peak could be calculated using Thermo Fisher Scientific Avantage 5.52 (Thermo Fisher Scientific, Waltham, MA, USA), and the ratio between AM and DAC units could be obtained. The area percentages of peak at about 402.2 eV were 20.54% and 18.21% as shown in Figure 4f,g, respectively. In other words, NP and SP had a CD of 20.54% (m/m) or 41.33% (w/w) and 18.21% (m/m) or 37.76% (w/w), respectively. These results indicated that this novel UVA initiated system facilitated the polymerization of DAC monomers and produced copolymers with a high CD. The conclusion corresponded well with that of 1H NMR spectra in Figure 3.

3.1.4. Elemental Analysis

The elemental contents of NP and SP are presented in Table 2. The results depicted that chlorine from DAC units could be observed in the copolymers. The ratio between AM and DAC units could be calculated because only DAC possessed chlorine. Charge densities of NP and SP were 40.6% (w/w) and 36.3% (w/w), respectively. The result was close to that revealed by the XPS spectra, further confirming the advantage of the novel UVA initiation system.

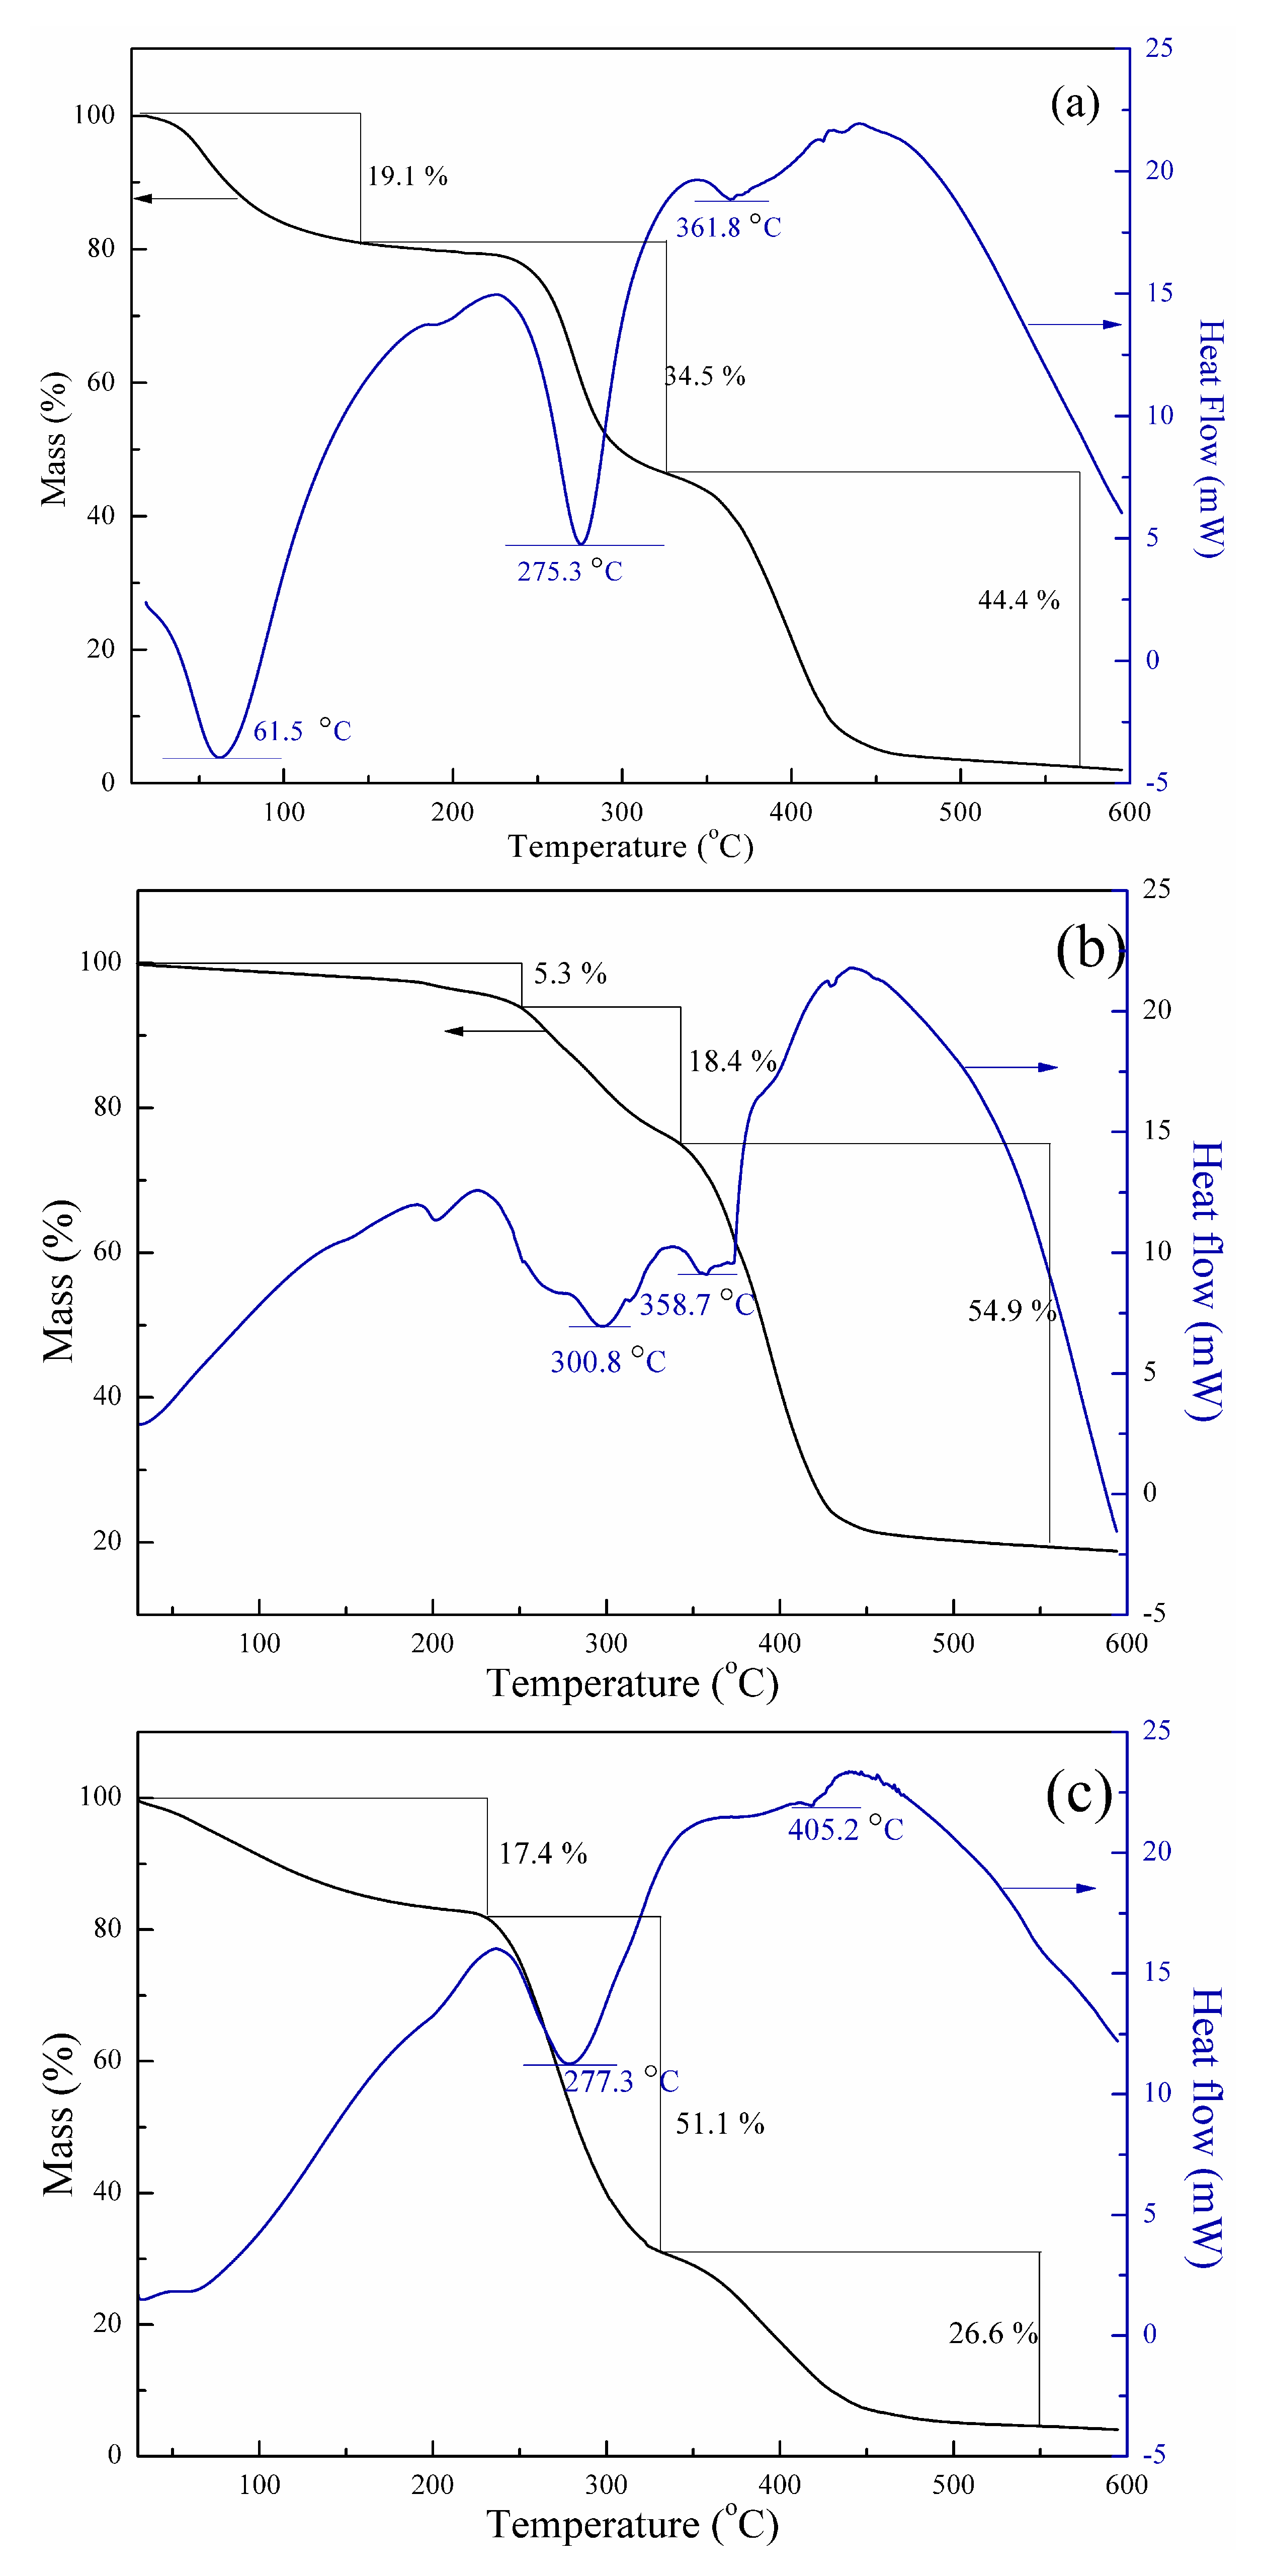
3.1.5. TGA-DSC Analysis
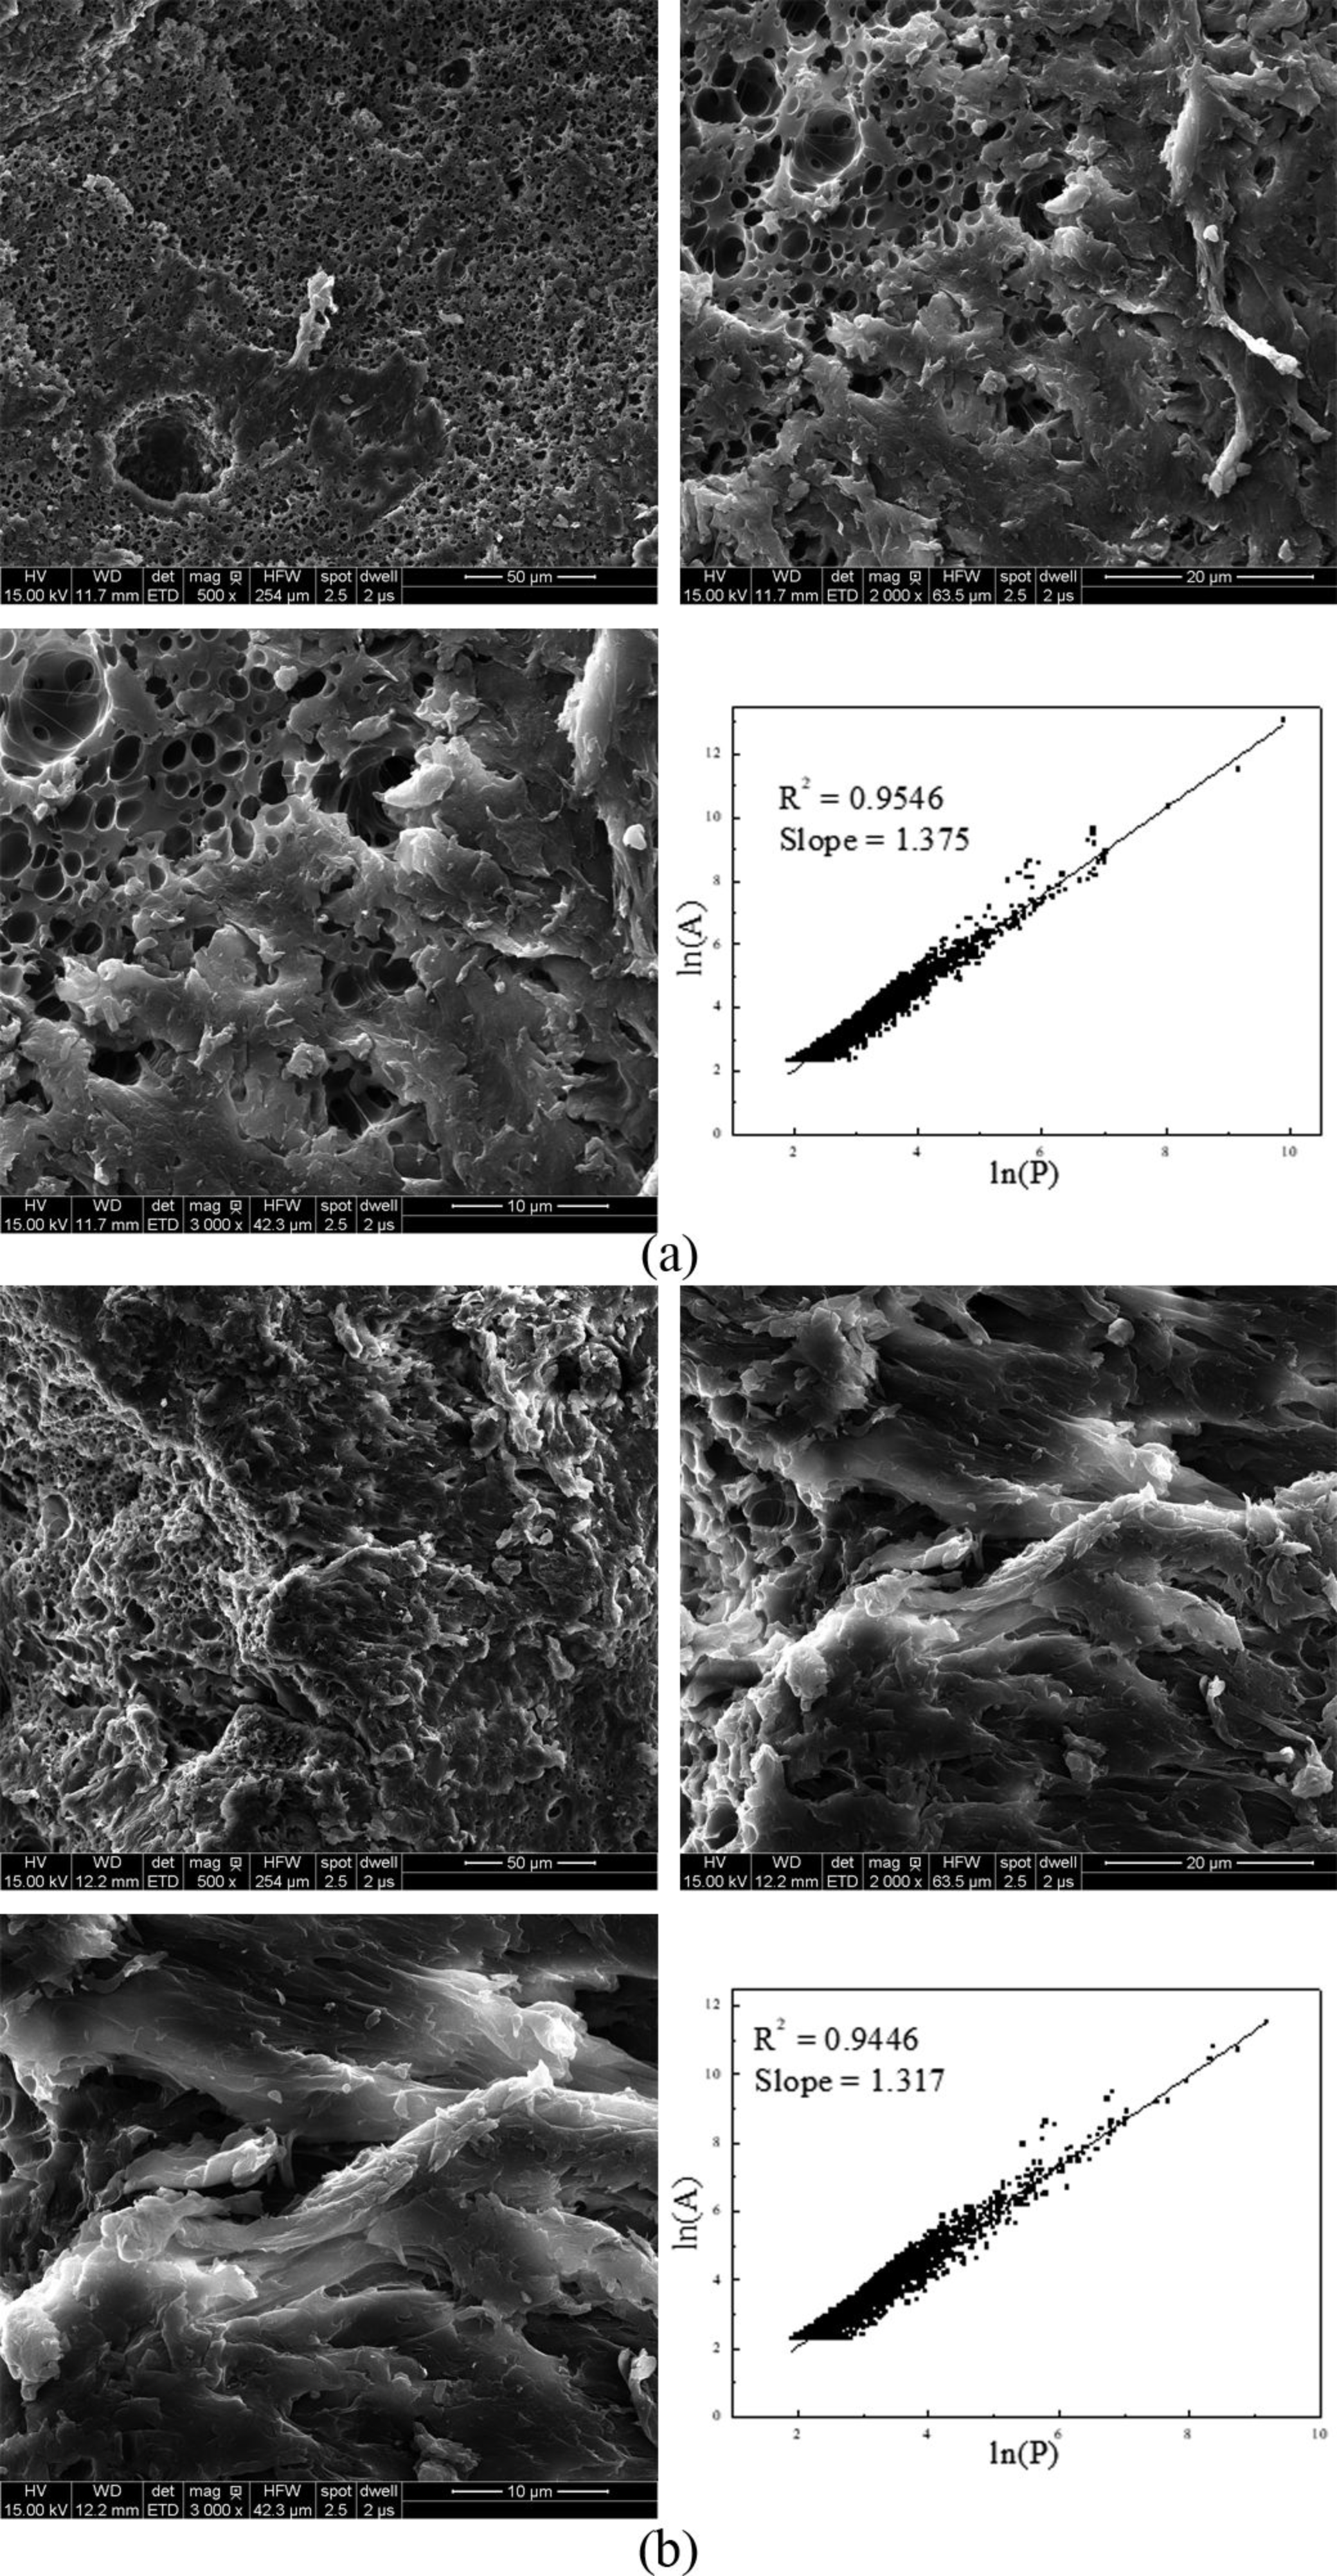
The thermal stability of polymers can be characterized by TGA-DSC which is achievedby monitoring weight changes as a function of temperature. Figure 5 shows the TGA-DSC curves of NP, PAM, and PDAC. The three main stages on copolymer thermal decomposition, which corresponded to weight reduction, were observed. In the initial stage, weight losses of approximately 19.1% (w/w) in the range of 20 °C–145 °C for NP, 5.3% in the range of 20 °C–250 °C for PAM, and 17.4% in the range of 20 °C–230 °C for PDAC occurred. The losses can be ascribed to the water molecules from air and which were absorbed by the hydrophilic groups of copolymers in polymerization. The water molecules vaporized at 100 °C, leading to a decrease in weight. During the second stage, weight losses of approximately 34.5%, 18.4%, and 51.1% were observed within the ranges of 145 °C–325 °C, 250 °C–340 °C, and 230 °C–330 °C, respectively. These losses corresponded to imidization of the amide group and thermal decomposition of methyl in the quaternary ammonium groups. All these polymers exhibited favorable thermal stability [22]. The final stage of thermal decomposition occurred above 325 °C, 340 °C, and 330 °C, with weight losses of approximately 44.4%, 54.9%, and 26.6%, respectively. These weight losses were due to thermal decomposition of the polymer backbone. As shown in Figure 5, the heat adsorption peak of NP at the final stage reached 361.8 °C, which was between those of PAM and PDAC. Such a result also indicated that AM and DAC had been successfully copolymerized.

3.1.6. SEM

Figure 6 illustrates the SEM images of NP and SP. Two different surface morphologies were observed. A porous structure with a large surface area can be observed in Figure 6a of NP, whereas the surface structure of SP was less porous (Figure 6b). In addition, the inserted figures in Figure 6 also display the linear correlation of the natural logarithms of the perimeter (L) and the area (A), indicating that the fractal dimension of the polymer surface could be calculated using Image-Pro Plus 6.0 (Version 6.0, Media Cybernetics, Rockville, MD, USA, 2013). Fractal dimension refers to the slope of the fitted curve. The results showed that the fractal dimensions of NP and SP were 1.375 and 1.317, respectively. The morphological structure of NP resulted in several kinds of surface modification induced by the novel UVA initiation system. The porous structure favored water penetration in the polymeric network. Thus, product solubility can be improved. Previous studies have indicated that such structure favors flocculation of colloidal particles and formation of bridge aggregation among flocs. Compared with the smooth structure, such porous structure proves better for adsorption-bridging behavior between the flocculants and particles in sludge dewatering [5,23].

3.2. Synthesis Condition Optimization

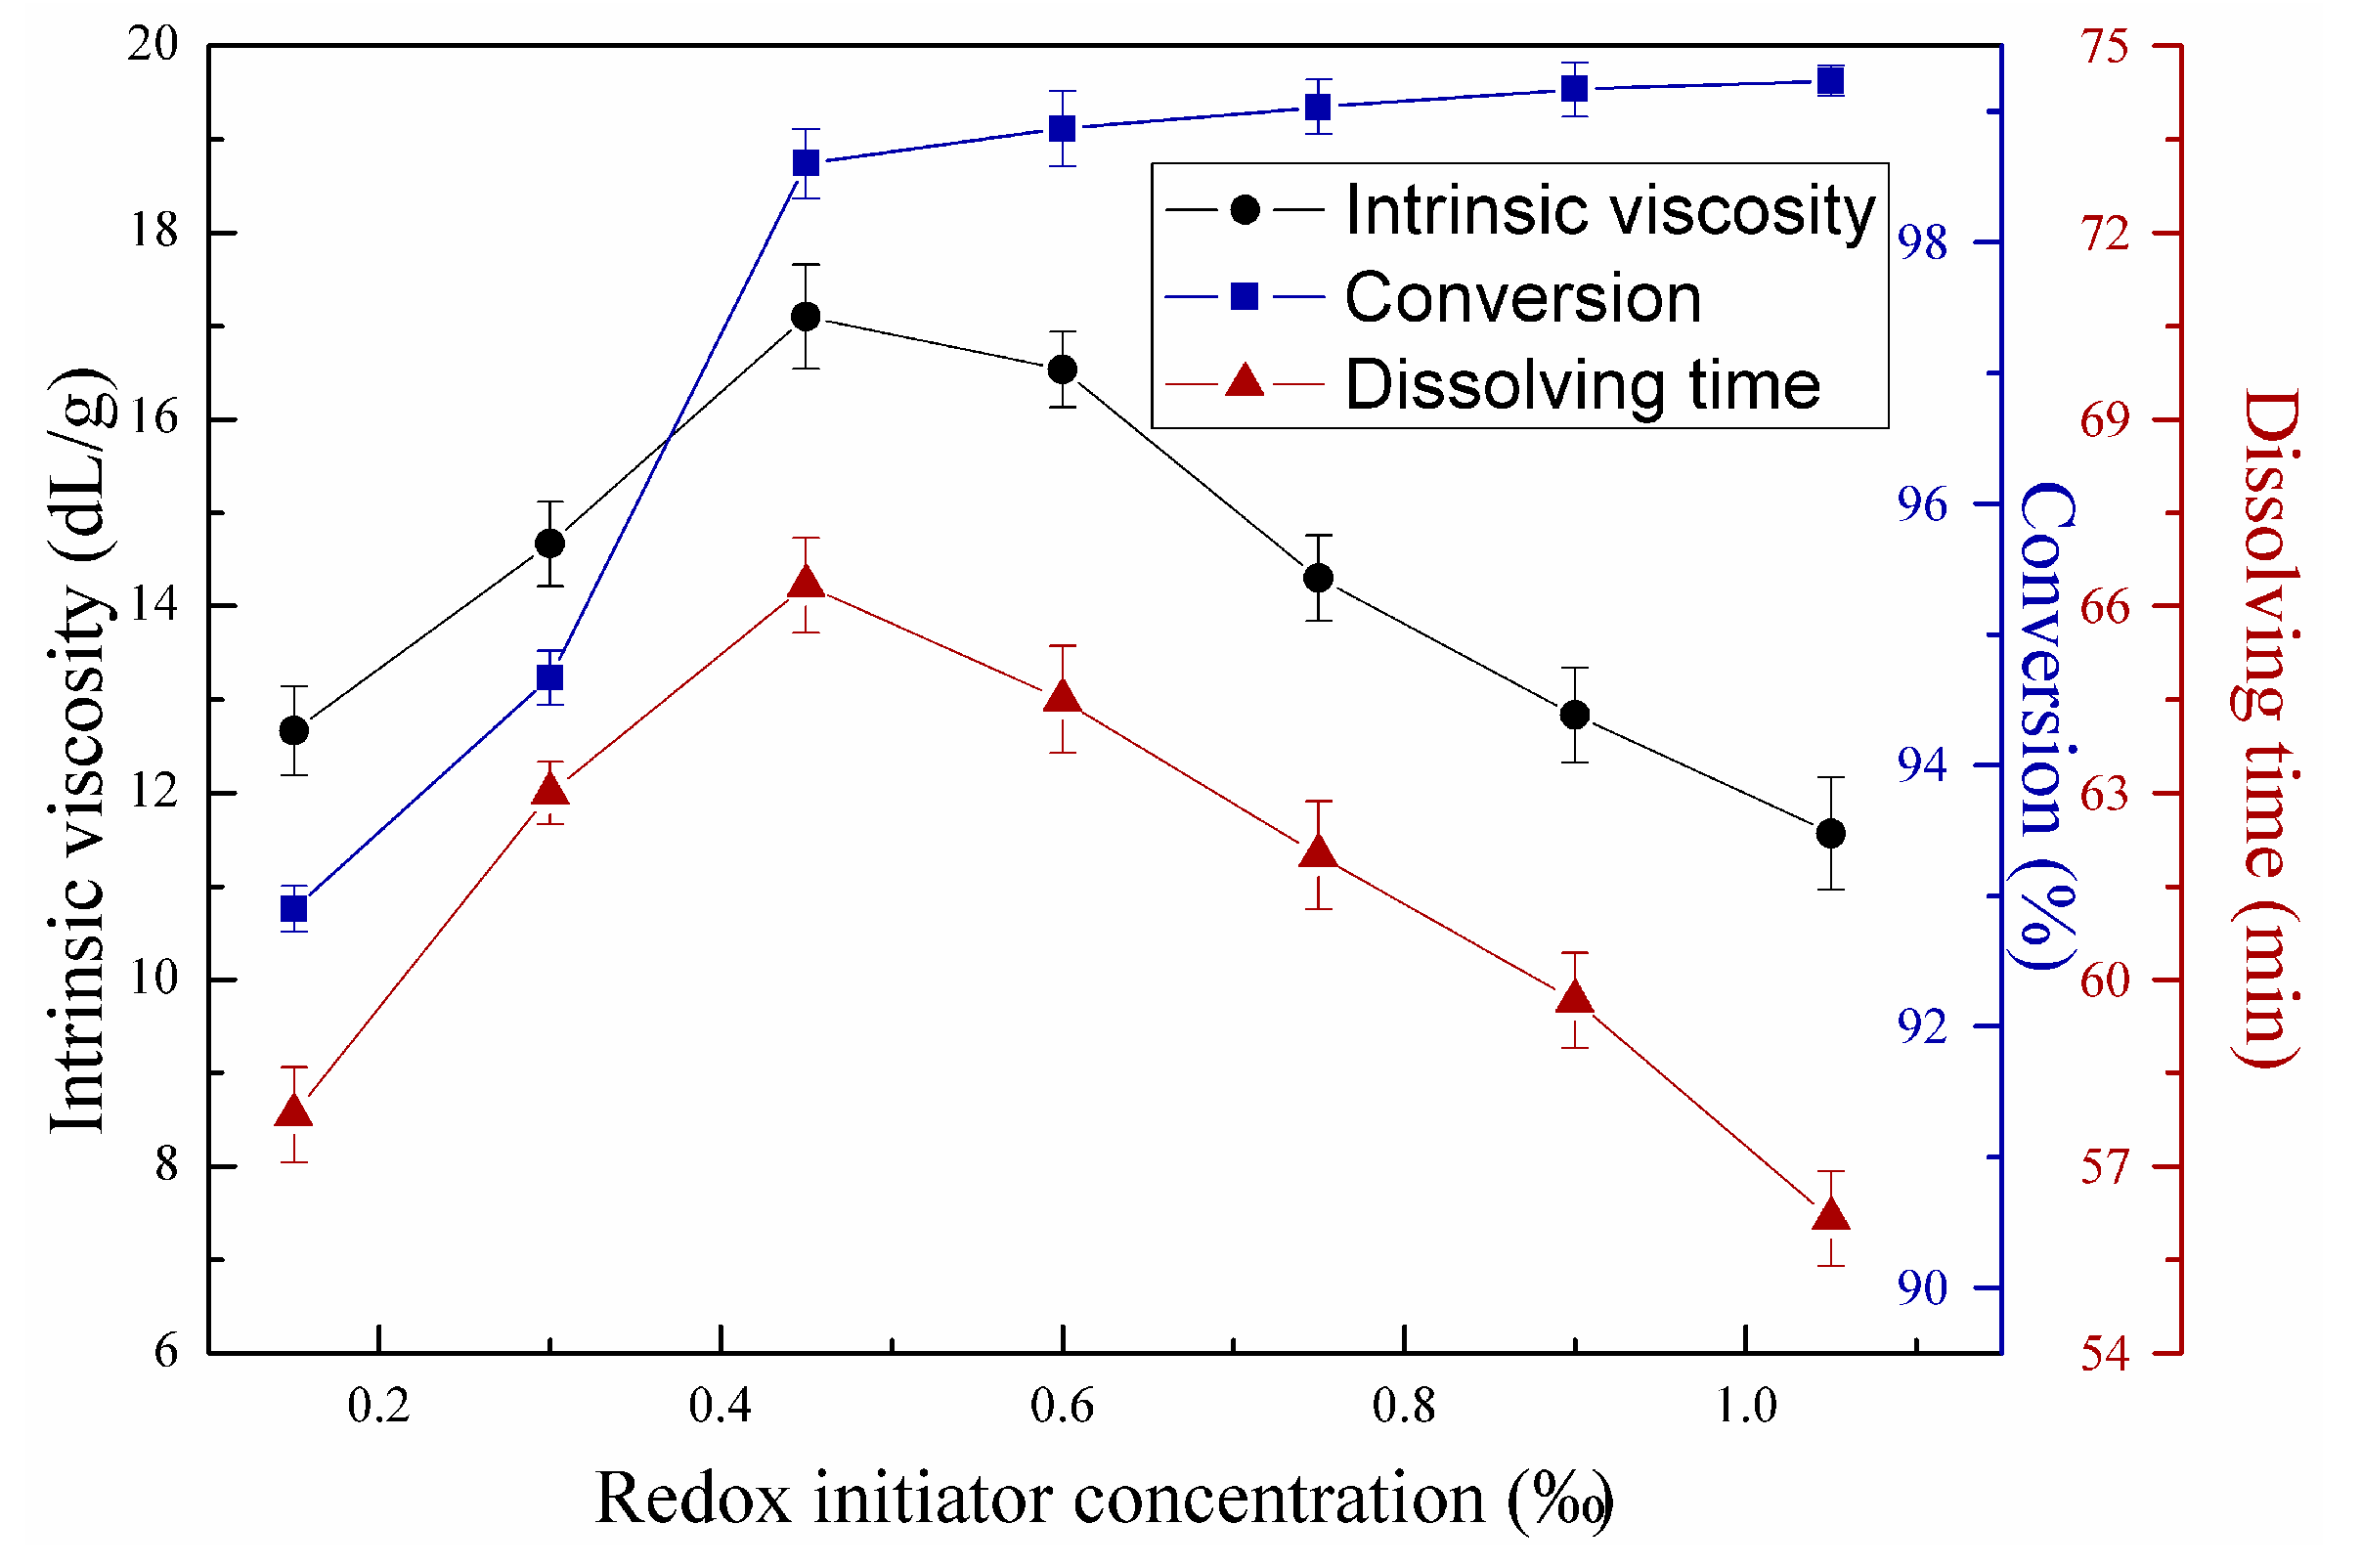
3.2.1. Effect of Initiator Concentration on Copolymerization

Figure 7 illustrates the effects of redox initiator concentration on copolymerization using first-stage light intensity of 7 mW/cm2, second-stage light intensity of 14.5 mW/cm2, mass ratio between AM and DAC of 7:3, urea concentration of 2 wt‰, and azo initiator concentration of 0.3 wt‰. Figure 8 shows the effects of azo initiator concentration on copolymerization under the same reaction conditions in Figure 7, except that redox initiator concentration equaled 0.45 wt‰. Copolymer intrinsic viscosity and dissolving time increased with increasing initiator concentration after reaching maximum at redox initiator of 0.45 wt‰ and azo initiator concentration of 0.2 wt‰, but decreased with further increase in initiator concentration based on Figure 7 and Figure 8. Conversion continually increased in the entire initiator concentration range, featuring a notable decreasing speed. Seabrook et al. proved that classical free-classical polymerization kinetics provides an acceptable quantitative description for photo-initiated polymerization of AM in water [24]. This phenomenon occurs due to the complex formation, cage effect, or primary radical termination with macro-radicals. When the redox or azo initiator concentrations were insufficient, the cage effect may lead to low polymer yields and low intrinsic viscosity due to the predominating termination of growing chains inside the cage as few monomer units contributed to propagation. Considerable primary radicals escaped from their “cages” to react with monomers, leading to the continuous growth of molecular chain with increasing initiator concentrations. In these conditions, conversion also increased remarkably. However, chain termination and transfer will occur more easily with increasing redox initiator concentration above 0.45 wt‰ and azo initiator concentration above 0.2 wt‰ as radical concentration in the polymerization system increased [25]. This trend accorded well with the classical kinetic theory, which predicts that kinetic chain length depends on the square root of initiator concentration. Additionally, monomers still feature high chances to convert into copolymers with the numerous produced radicals. The gel effect hampered the increase in monomers without limitation [26].

3.2.2. Effects of Mass Ratio between AM and DAC on Copolymerization

Figure 9 shows the effects of mass ratio between AM and DAC on copolymerization. The experiment was conducted with 0.45 wt‰ redox initiator concentration, 0.2 wt‰ azo initiator concentration, 7 mW/cm2 first-stage light intensity, 14.5 mW/cm2 second-stage light intensity, and urea concentration of 2 wt‰. Cationic polyacrylamide features wide applications because it can neutralize the surface charge of colloid particles to form large flocs. Charge density is directly related to charge neutralization efficiency and flocculation performance. Moreover, intrinsic viscosity, conversion, and dissolving time all decreased with increasing DAC ratio, as shown in Figure 9. As mentioned above, the reactivity ratio of AM was higher than that of DAC in solution polymerization [19]. The DAC monomers were less likely to polymerize with increasing molecular chains than AM monomers. In addition, the large steric hindrance and cationic charge repulsion caused by the quaternary ammonium groups in DAC caused difficulty in preparation of copolymers with ultrahigh intrinsic viscosity and conversion [6]. However, the dissolving time of produced copolymers decreased with increasing DAC mass ratio, facilitating their application in water treatment. The hydrophilic quaternary ammonium groups in DAC and low intrinsic viscosity resulted in the above phenomena. The intrinsic viscosity of 6:4 mass ratio was lower than that of 7:3 mass ratio, but better charge neutralization performance and shorter dissolving time were found. Thus, in this study, the optimum mass ratio between AM and DAC was 6:4.

3.2.3. Effects of Urea Concentration on Copolymerization

Figure 10 illustrates the effects of urea concentration, where the redox initiator, azo initiator, first-stage light intensity, second-stage light intensity, and mass ratio between AM and DAC reached 0.45 wt‰, 0.2 wt‰, 7 mW/cm2, 14.5 mW/cm2, and 6:4, respectively. As mentioned above, short dissolving time will facilitate the actual CPAM application. However, significant differences in size and velocity between the water and polymer inhibited water to seep in the polymer molecular chain of the copolymer solution. Urea can weaken hydrogen bonding between the side groups of CPAM molecular chain, resulting in the decreased intermolecular forces and chance of crosslinking. Therefore, urea was used as solubilizer in polymerization to reduce the dissolving time. Despite the decreased dissolving time with increased urea concentration, urea influenced intrinsic viscosity. This condition was observed as urea acted as a reducing agent to increase the kinetic chain length, and this effect can be observed when urea concentration measured below 3‰. However, the negative effect of urea is that it can transfer growing chains to cause radical termination, thus decreasing intrinsic viscosity and conversion [12,27]. In the present study, the optimum urea concentration reached 3 wt‰.

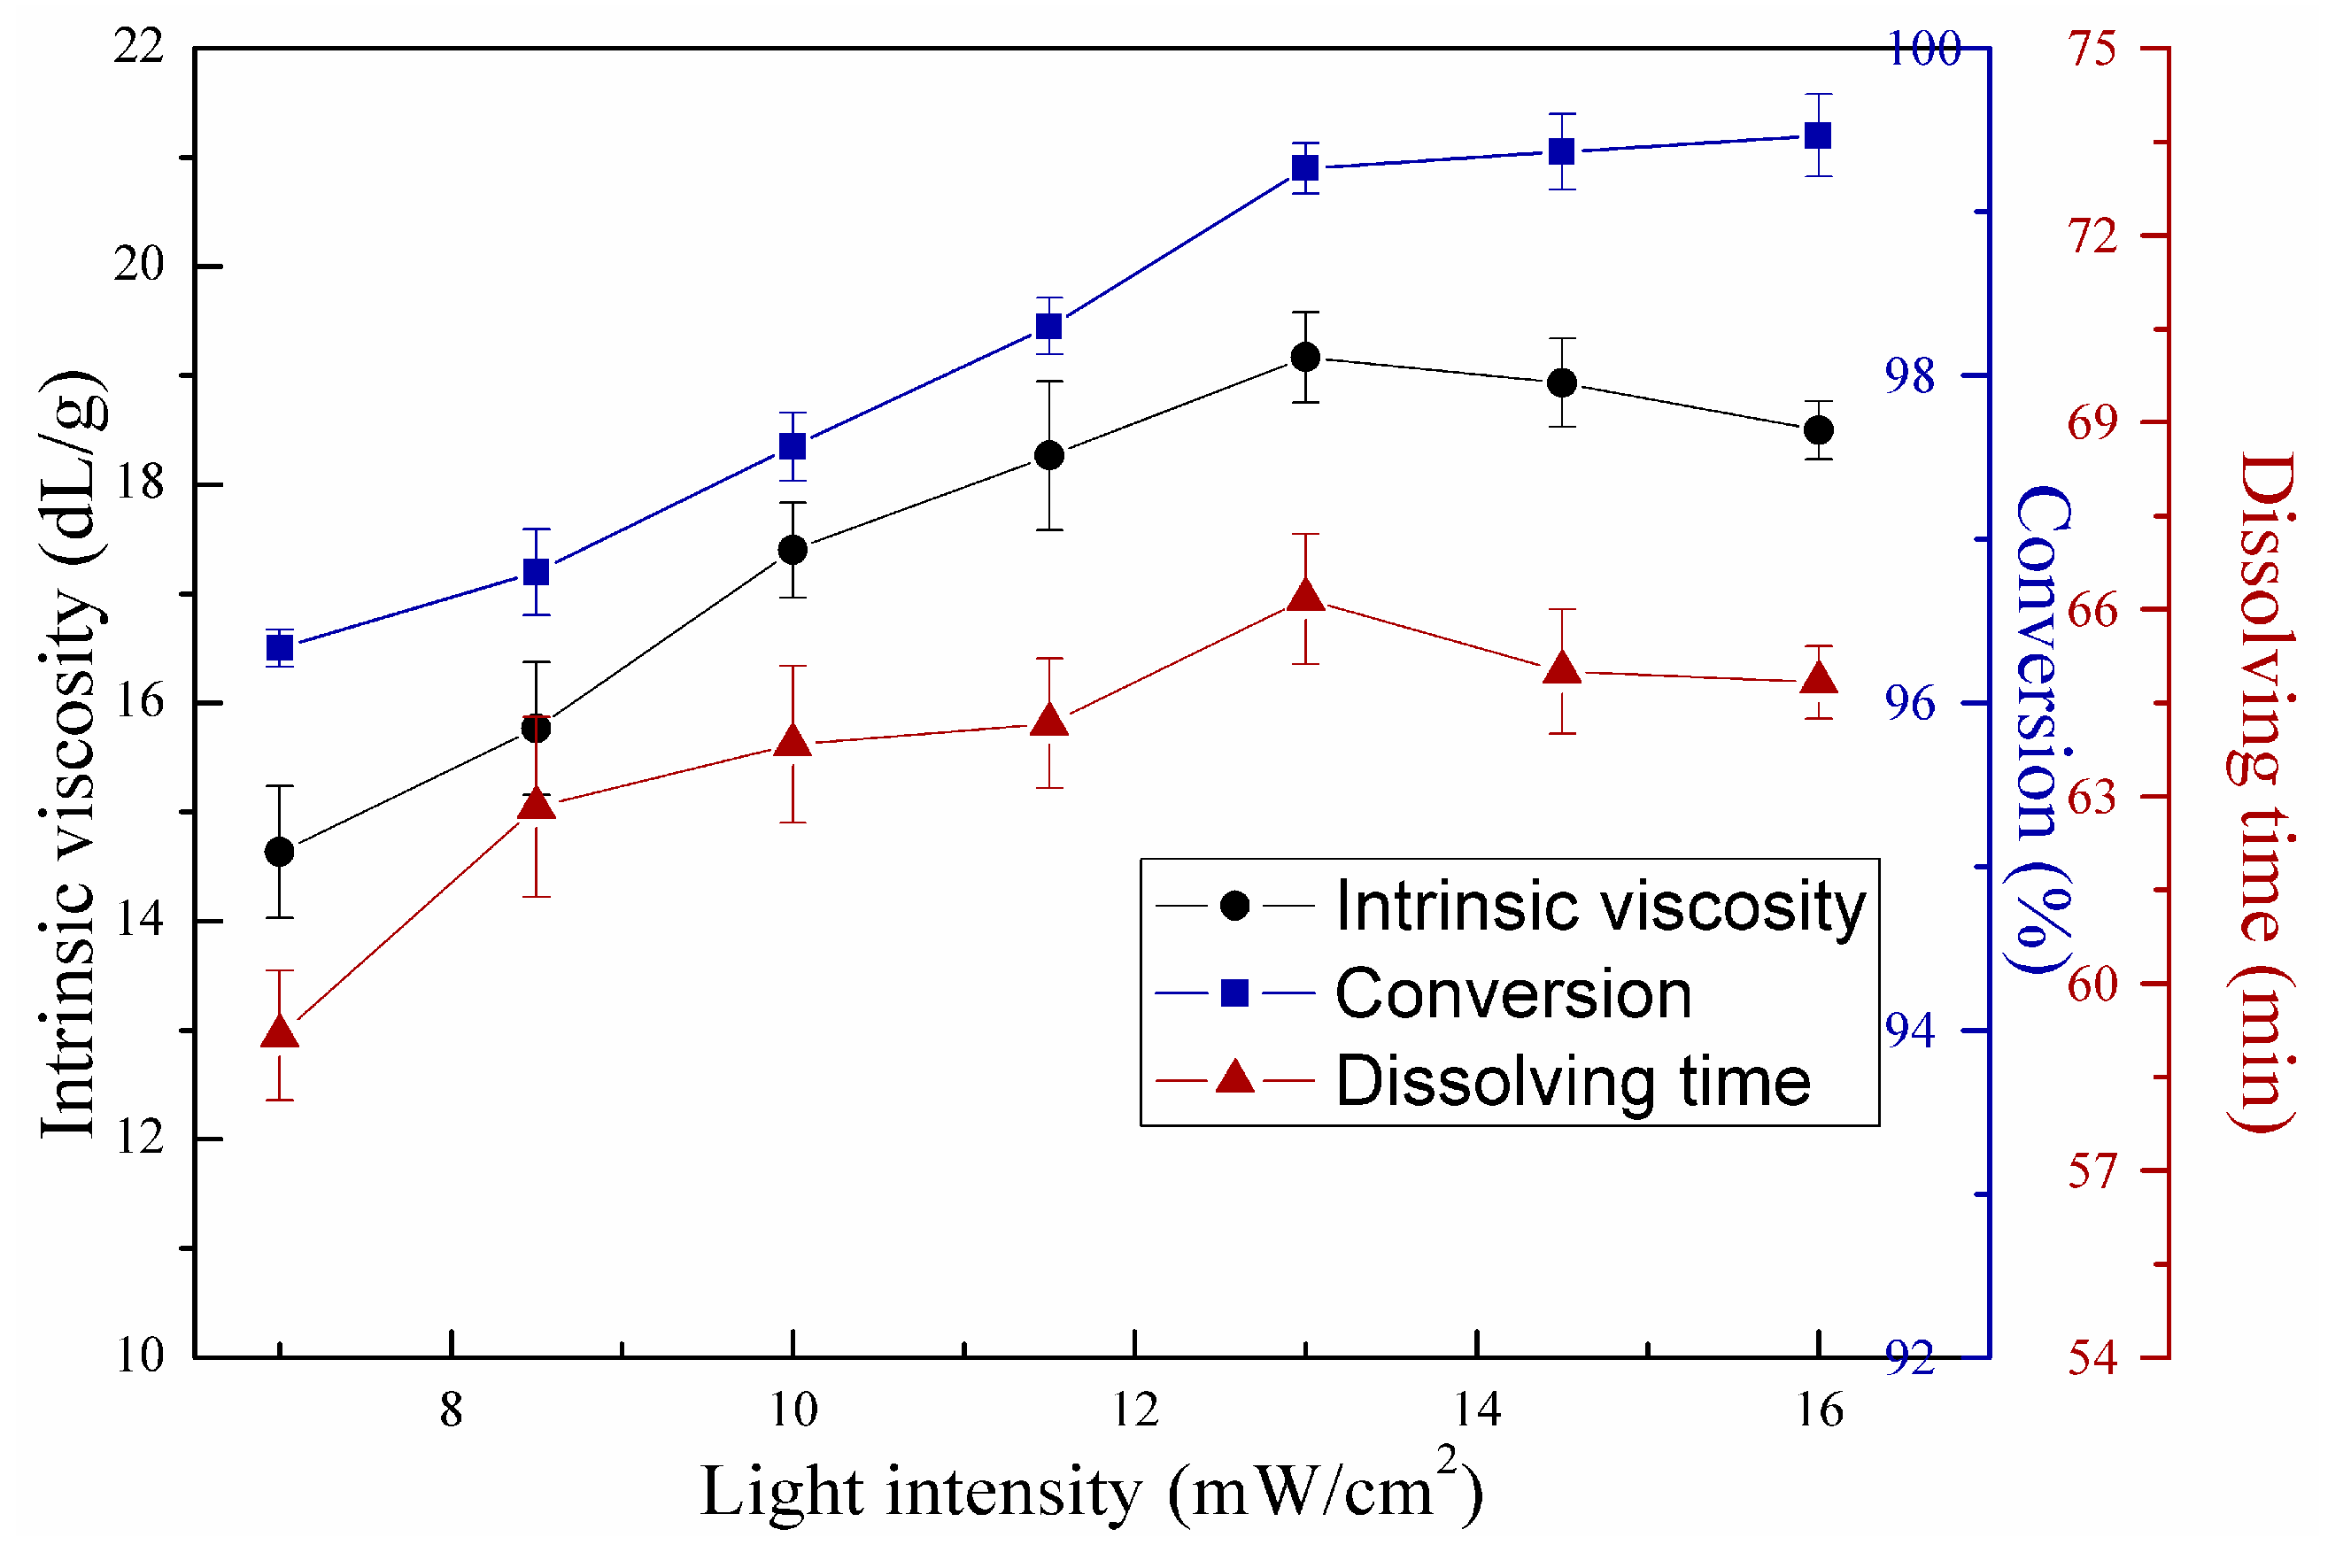
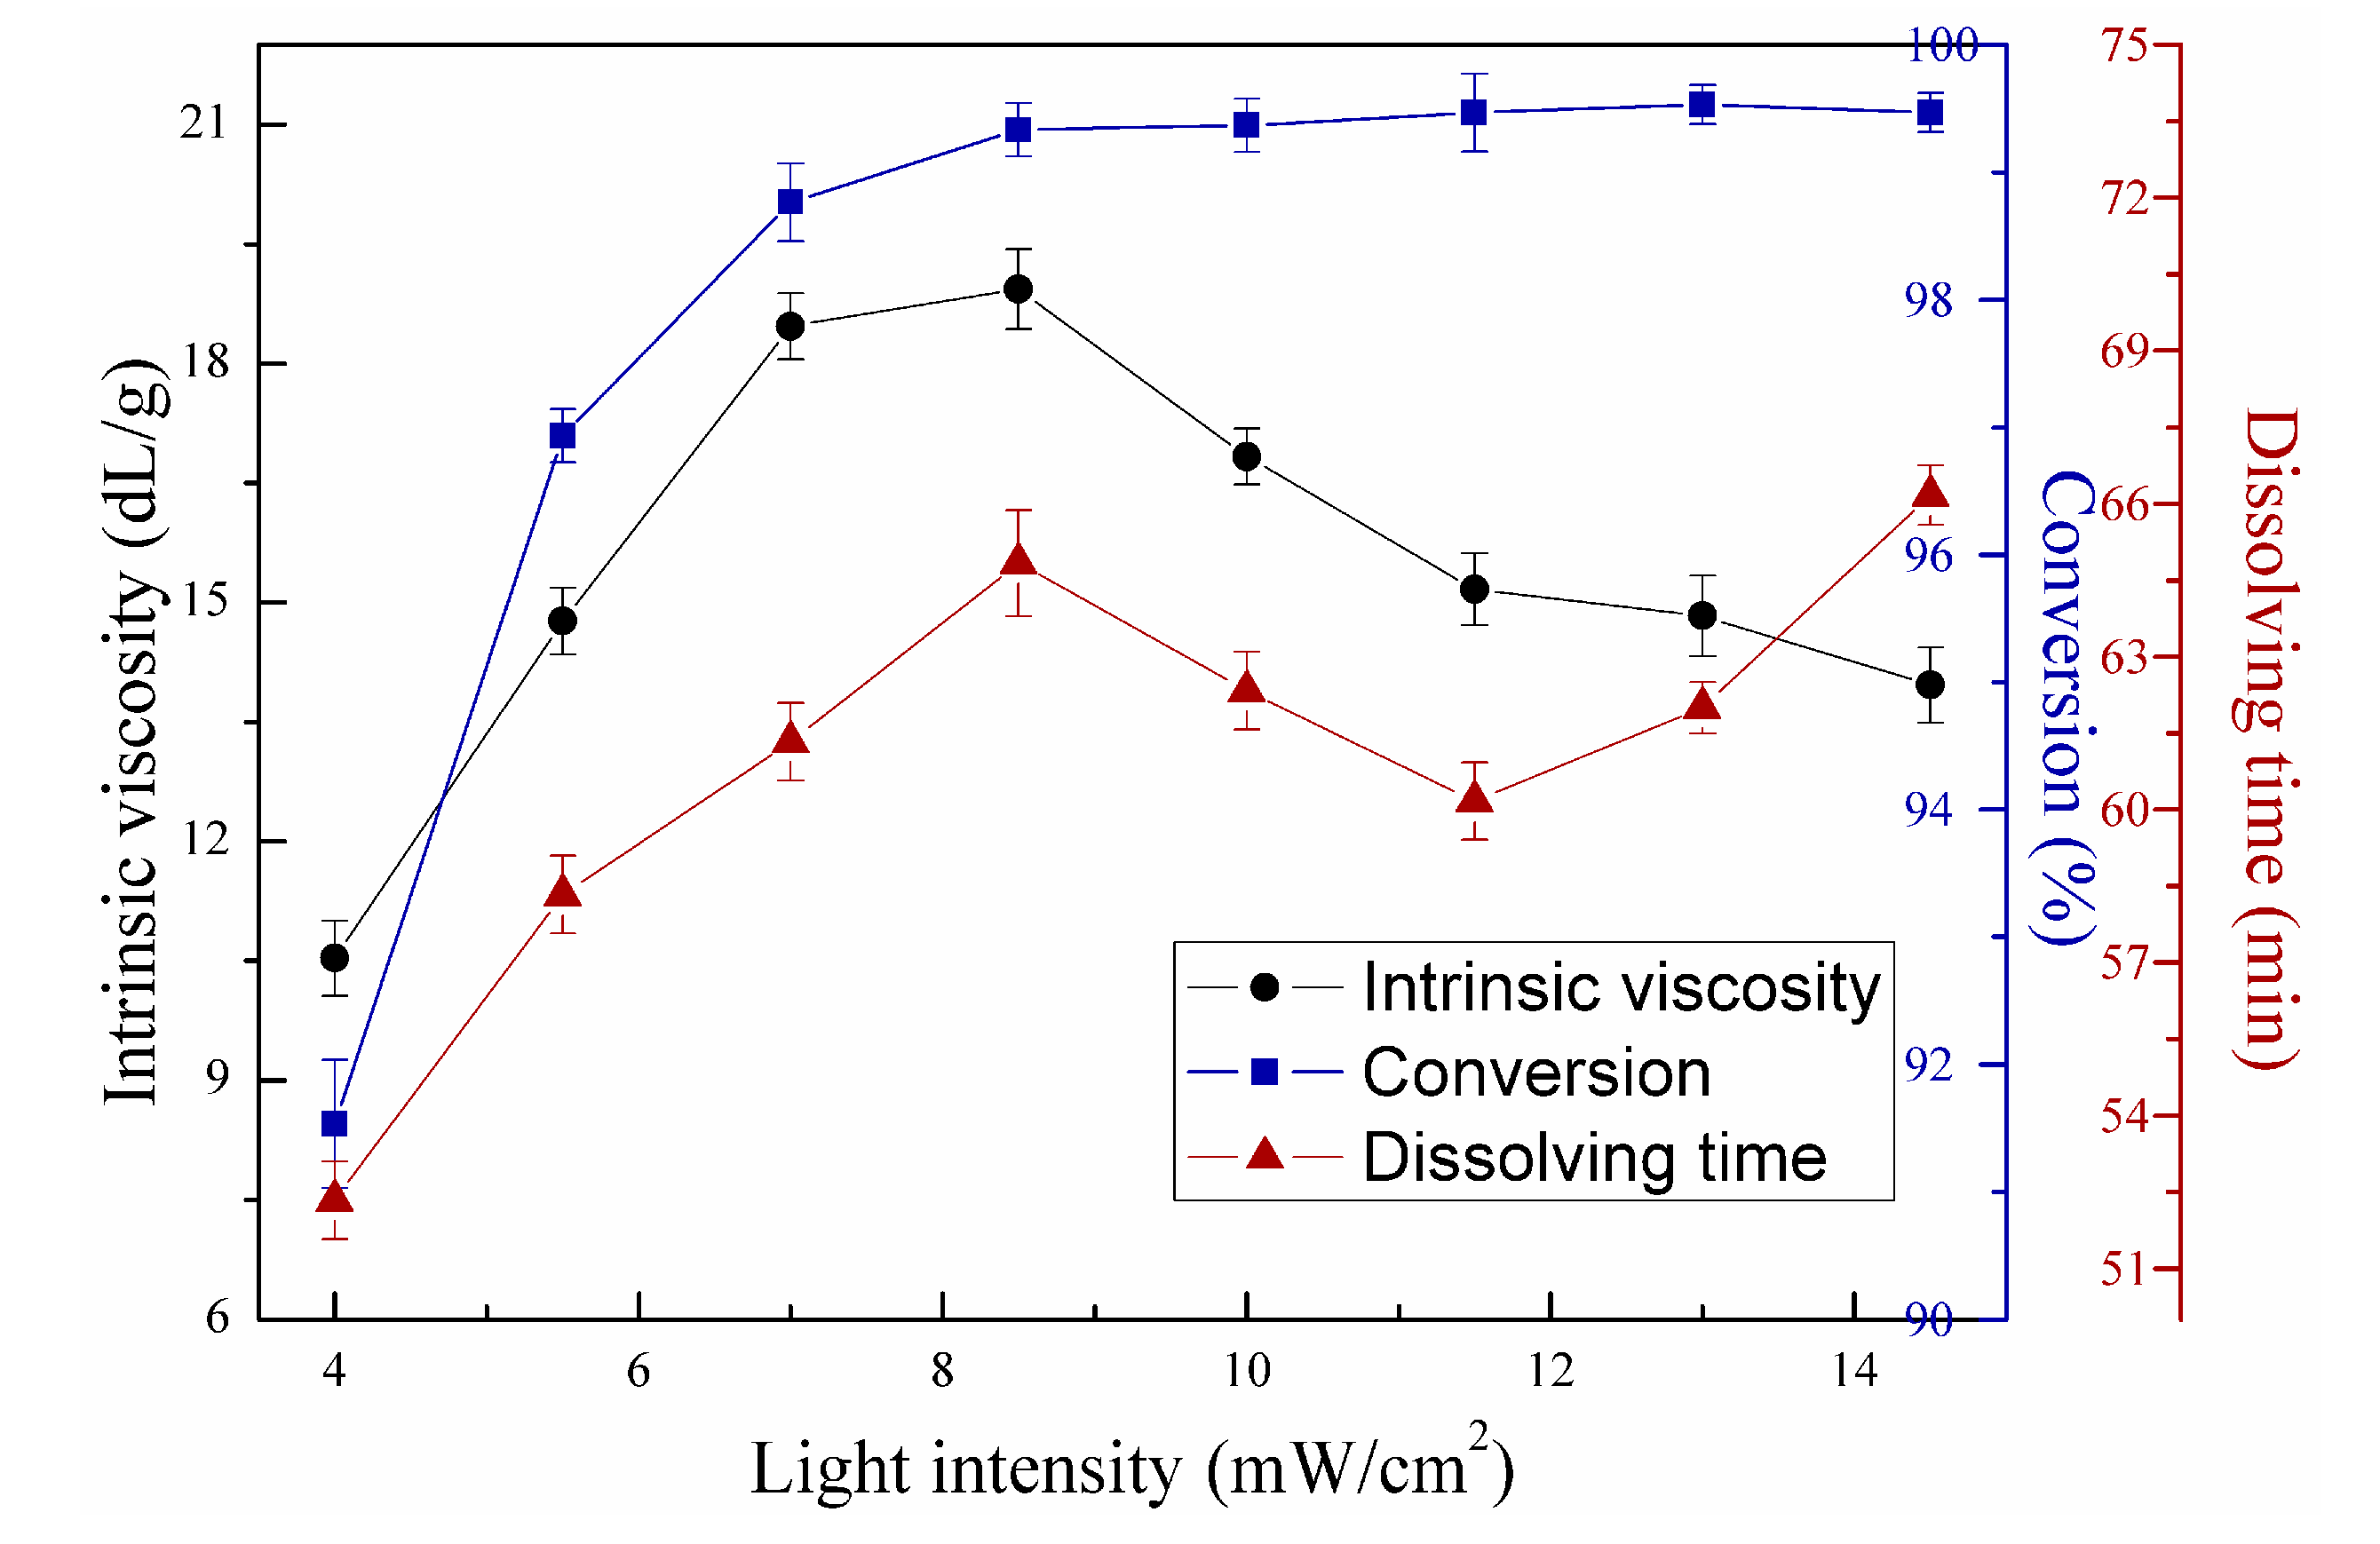
3.2.4. Effects of Light Intensity on Copolymerization

Figure 11 shows the effects of first-stage light intensity on copolymerization. Second-stage light intensity, redox initiator concentration, V-50 concentration, mass ratio between AM and DAC, and urea concentration were fixed at 14.5 mW/cm2, 0.45 wt‰, 0.2 wt‰, 6:4, and 2 wt‰, respectively. Figure 12 shows the effects of second-stage light intensity on copolymerization under the same reaction conditions in Figure 11, except that the first-stage light intensity measured 8.5 mW/cm2. As shown in Figure 11, the intrinsic viscosity, conversion, and dissolving time of copolymer all increased with increasing first-stage light intensity from 4 mW/cm2 to 8.5 mW/cm2. However, intrinsic viscosity strongly increased, conversion ratio constantly remained, and dissolving time decreased, reached a bottom, and increased again with increasing first-stage light intensity. These trends can also be illustrated by the radical copolymerization theory. Initiators can be decomposed and used to generate primary free radicals by UVA light. Free radical concentration is positively correlated with UVA light intensity [5]. Therefore, intrinsic viscosity and conversion (Figure 11) presented a similar trend with those in Figure 6 and Figure 7. The cage effect may lead to low copolymer yields when light intensity is relatively low [23]. The increase in light intensity above 8.5 mW/cm2 will increase termination and chain transfer rate, leading to decreased intrinsic viscosity. Accordingly, the first-stage light intensity reached 8.5 mW/cm2. Monomers can be adequately copolymerized with increasing radical concentration. Therefore, conversion still increased when light intensity was above 8.5 mW/cm2. In addition, the dissolving time showed different trends with intrinsic viscosity when light intensity increased above 13 mW/cm2. The molecular chain may be slightly cross-linked, thus inducing gelling behavior and increasing the dissolving time in Figure 11 [28]. These results indicate that dissolving time mainly relies on intrinsic viscosity when cross-linking is small.
As shown in Figure 12, the curves showed similar trends with those in Figure 11. Intrinsic viscosity and dissolving time increased and decreased with increasing second-stage light intensity, and conversion followed a continuously increasing trend. The highest intrinsic viscosity was observed at second-stage light intensity of 13 mW/cm2. However, differences were observed between the two figures. First, in Figure 12, no vast decreasing range was observed in intrinsic viscosity after reaching the maximum. Second, the dissolving time still correlated well with intrinsic viscosity although light intensity was higher than 13 mW/cm2, indicating that the copolymer was not cross-linked at such condition. Different polymerization stages caused the above differences. The increasing second-stage light intensity below 13 mW/cm2 contributed to high conversion and increase in intrinsic viscosity. However, after the first-stage UVA illumination, a certain number of monomers were reacted, and a semi-solid or solid product can be produced, i.e., the polymer chains were not in aqueous solution state. The radical concentration at the middle or last phase will not reach as high as that in the initial phase with the same light intensity given that radical concentration is influenced by monomer concentration. And the semi-solid or solid state of the product may also inhibit cross-linking [23]. As mentioned above, chain termination and transfer rate were directly affected by radical concentration. Therefore, intrinsic viscosity was less influenced by increasing light intensity above 13 mW/cm2, and molecular chain cross-linking was also less likely to occur.

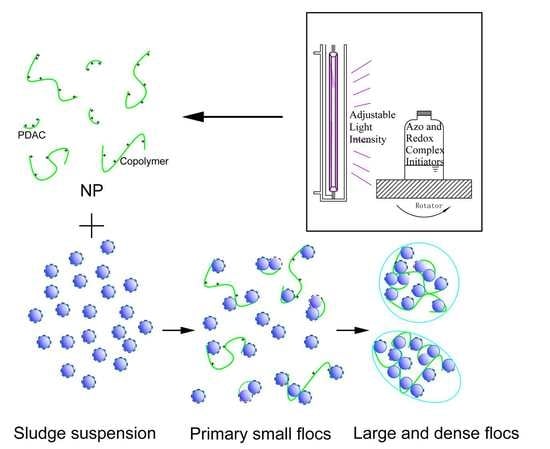
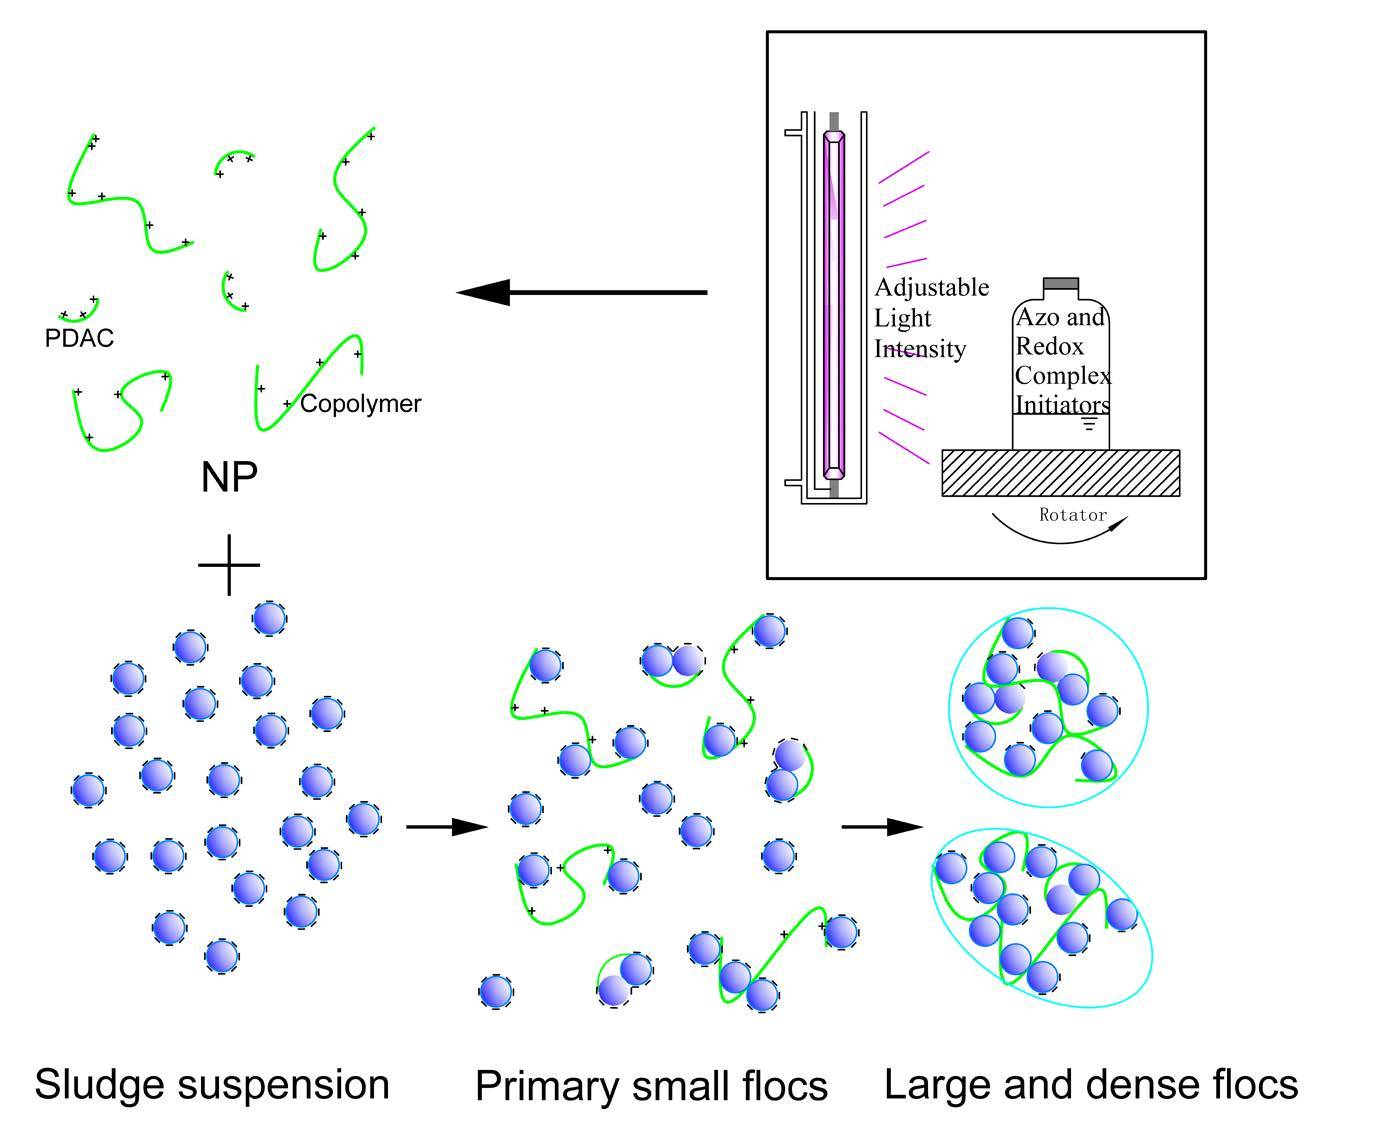
3.2.5. Mechanism and Advantages of the Novel UVA Initiation System

As shown in Table 3, the intrinsic viscosity of NP was higher than that of SP, whereas the dissolving time of NP was lower than that of SP. These findings indicated that NP flocculated more efficiently and was more applicable than SP. The differences between the initiation systems resulted in the above experimental results. First, radical concentration was differently distributed during polymerization. Chain termination and transfer rate, which were directly affected by radical concentration, resulted in a decisive effect on copolymer intrinsic viscosity. In the novel UVA initiation system, most redox initiators with low activation energy reacted to produce radicals at the first low-light-intensity stage of copolymerization, and most azo initiators with high activation energy decomposed in the second light stage. Radicals were generated and controlled at relatively low levels during the entire copolymerization. On the contrary, radicals cannot be generated nor regularly distributed during copolymerization in traditional stable light intensity and single UVA initiation system. Chain termination and transfer rate of our novel UVA initiation system were lower than those of SP. Second, radicals were insufficient to polymerize all the monomers for the stable light intensity system as the initiators were exhausted at the end of polymerization. Notably, the initiator concentration should be low because cross-linking will occur due to high concentration of radicals. By contrast, radicals can still be generated with increasing light intensity, which can lead to decomposition of azo initiators. Therefore, the monomers were sufficiently polymerized in this novel UVA initiation system, as shown in the conversion rates in Table 3. Table 3 also shows that the CD of NP was significantly higher than that of SP which has already confirmed by XPS spectra and elemental analysis. As mentioned above, the reactivity ratio of DAC is lower than that of AM [19]. In other words, the polymerization activity of DAC was insufficient for complete reaction in a single initiator and stable light intensity system. As shown in Table 3, the unreacted percentage of DAC monomer reached 4.2% ± 0.4 for SP, whereas that of NP totaled 0.4% ± 0.3. This finding indicated that the novel UVA initiation system is efficient and cost-effective. In addition, the extra 3.8% ± 0.7 was converted to PDAC considering the 1H NMR spectra of NP in Figure 3. This PDAC will significantly facilitate sludge conditioning. Third, the increasing light intensity of the novel UVA initiation system can mitigate the gel effect in inhibiting radical generation. Monomers are transferred into copolymers, and a gel product can be produced with copolymerization. Light intensity decreased along the radiation path due to light absorption of initiator and scattering effect in reaction medium. This variance will lead to the spatially inhomogeneous distribution of free radicals in the system. Thus, conversion rate and intrinsic viscosity of various layers in the reaction vessel differed in the stable UVA light intensity system. However, in this study, a closely homogeneous distribution of free radicals can be achieved by increasing the utilized UVA light intensity. Consequently, monomers in different radiation paths can be copolymerized thoroughly, and average conversion rate and intrinsic viscosity increased.
For the low dissolving time of NP, the low possibility of copolymer chain cross-linking may explain why this experimental result was obtained although the intrinsic viscosity of NP was high. As mentioned above, radicals were generated and controlled during polymerization through different initiators and light intensities used in our novel UVA system. Therefore, radical concentration was controlled at low level during copolymerization, and cross-linking was avoided. In addition, a porous morphology favored water penetration in the polymeric network structure based on Figure 6. Therefore, NP was dissolved better than SP.
The implications of our novel UVA initiation system bear significance. One of the major obstacles in applying UVA initiation technology in preparing organic flocculants is the light-hindering effect of the gel product. The heterogeneous distribution of free radicals along the radiation path may pose a negative effect on polymerization. Such effect is unremarkable at the laboratory-scale as the radiation path is often short. However, the hindering effect cannot be ignored at the large industrial scale. The novel UVA initiation system makes it theoretically possible by increasing light intensity and complexing of initiators with different activation energies.

3.3. Sludge Conditioning Performance and Mechanism

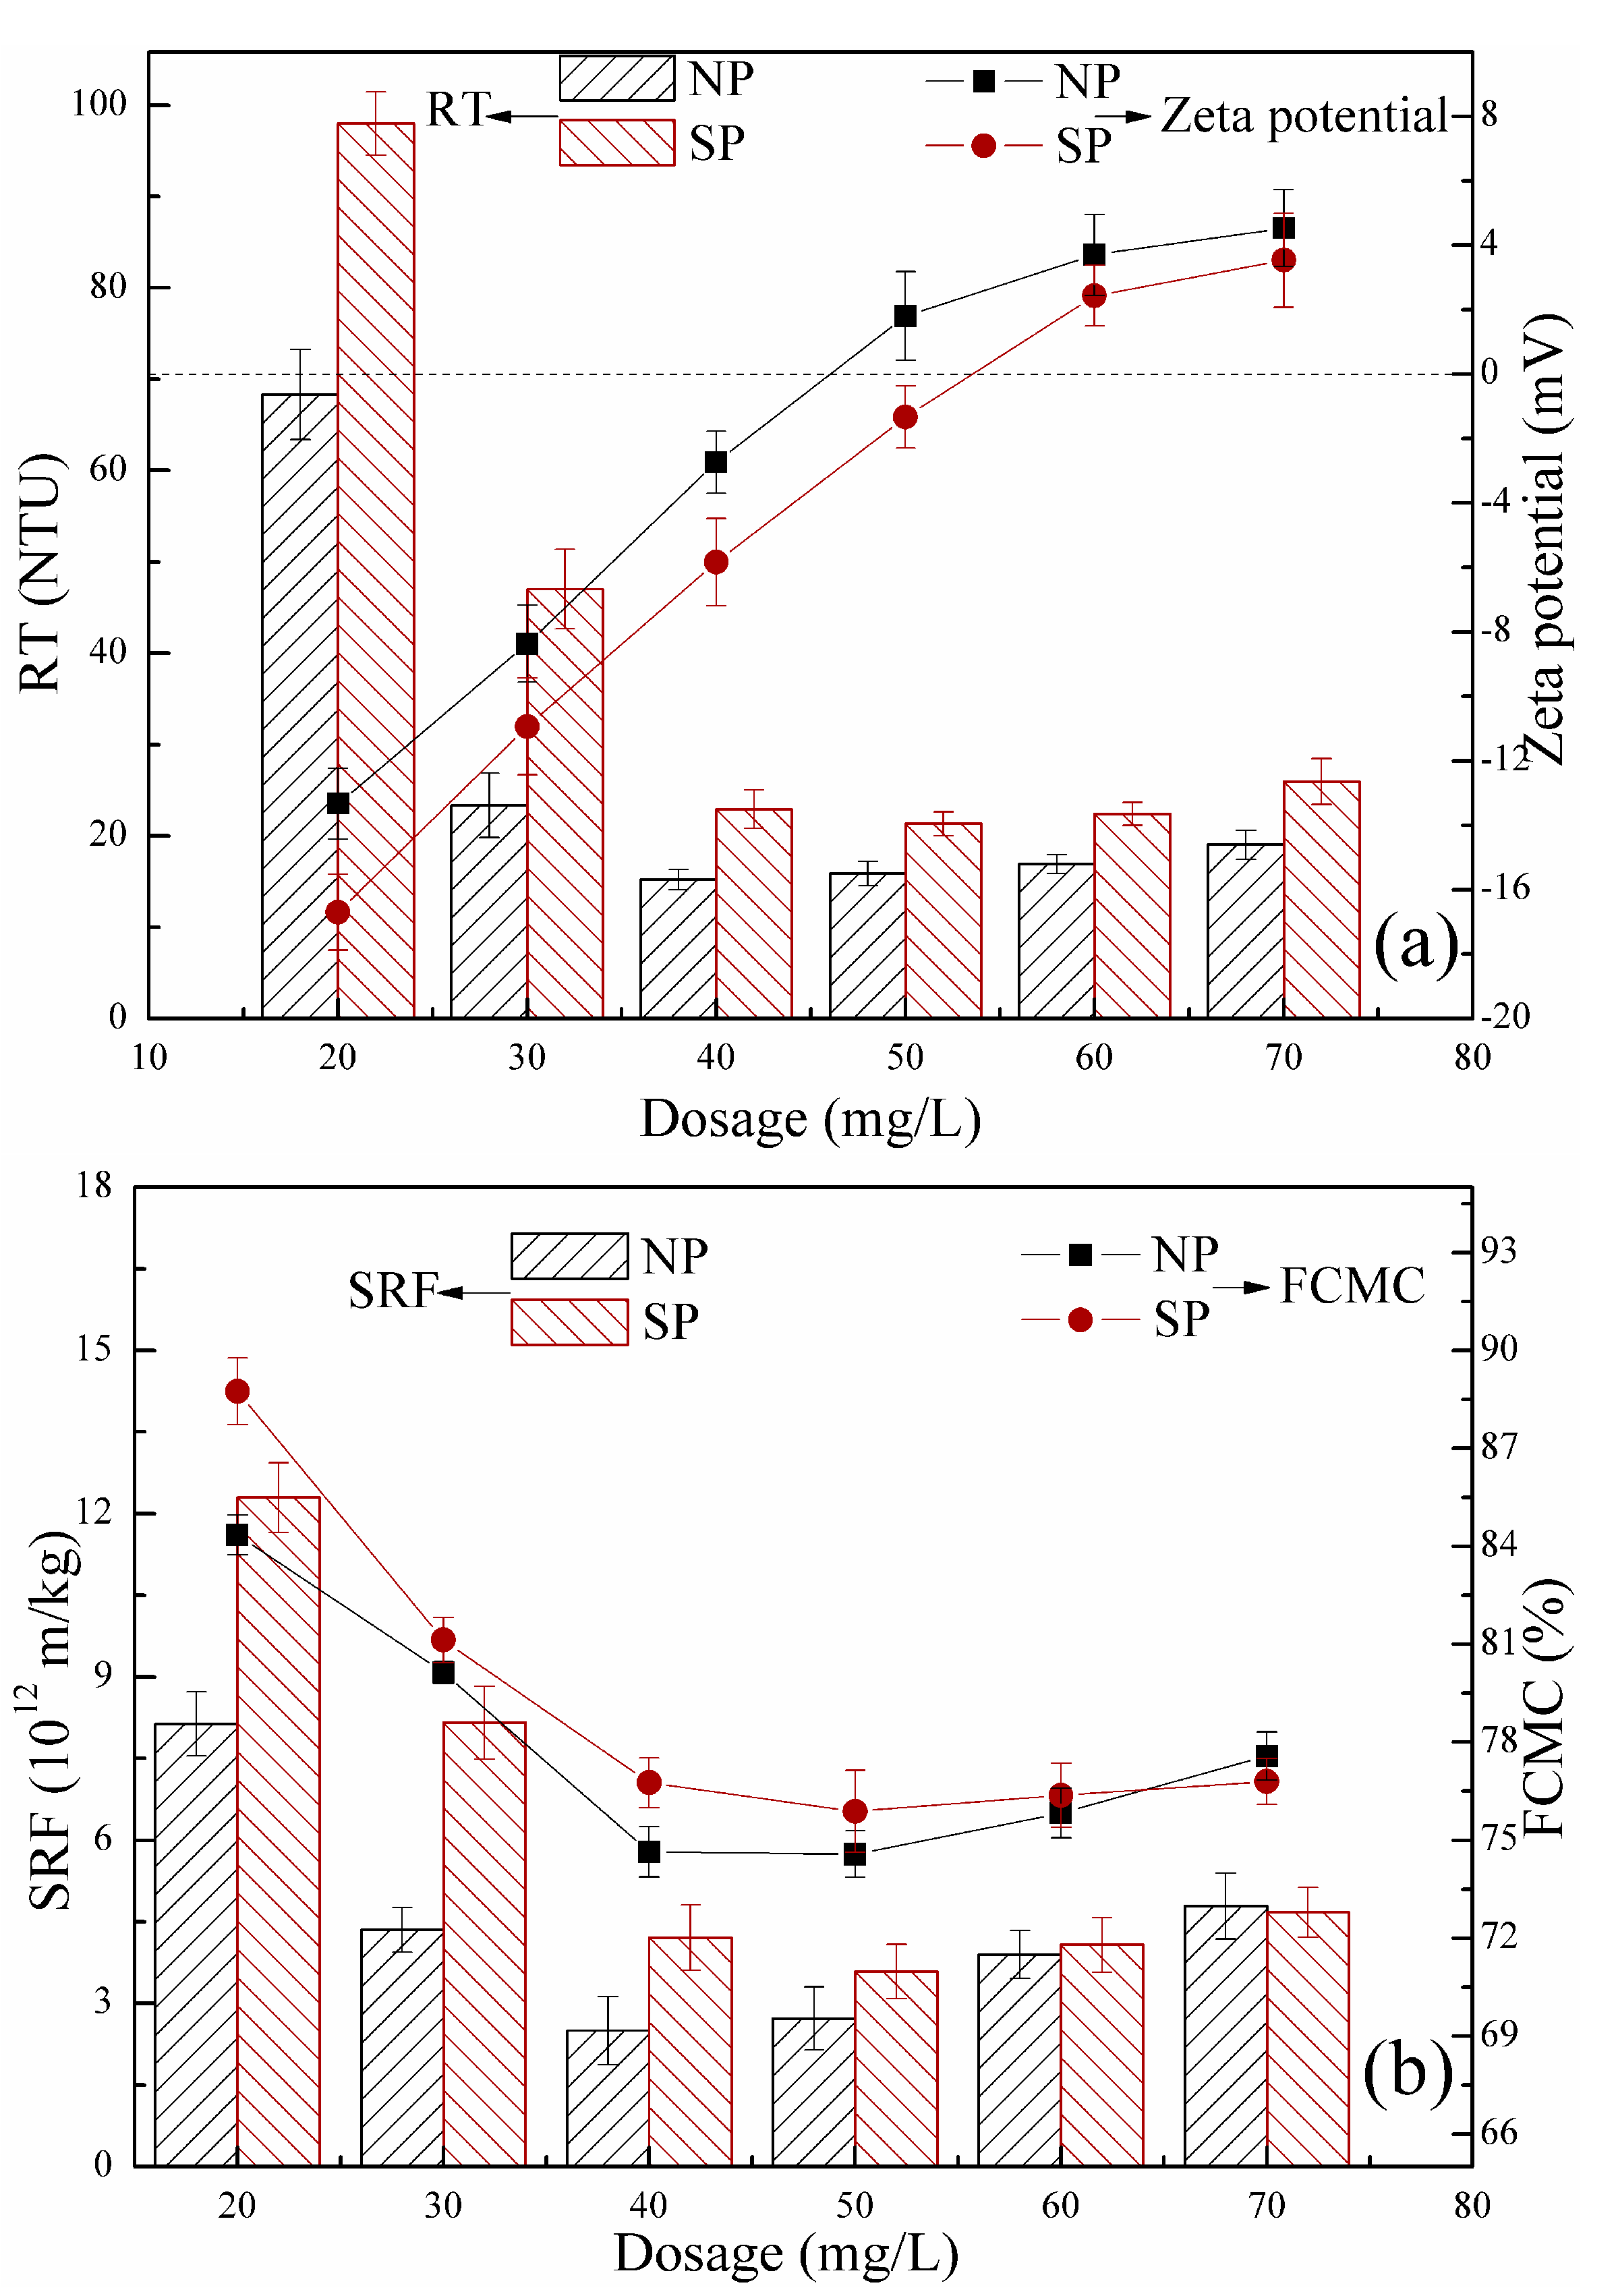
3.3.1. Effects of Flocculant Dosage on Sludge Conditioning Performance

The conditioning efficiency of flocculants is significantly influenced by flocculant dosage. Turbidity is widely used to explain the performance of a polymer sample in various flocculation fields because it indicates the content of suspended particles in the liquid phase. The index of FCMC is an important aspect to be considered in compressible sludge dewatering. High FCMC is not desirable because it results in large sludge volumes that increase the following treatment costs. The index of SRF is widely used to evaluate sludge filtration performance, and small SRF reflects a good performance in sludge dewatering. Zeta potential plays an important role in analyzing the charge interactions between the polyelectrolyte and oppositely charged particles [20]. Figure 13 shows the effect of NP and SP dosages on RT, zeta potential, FCMC, and SRF. Clear solid-liquid separation was achieved when the dosage was higher than 40 mg/L for NP and SP, as shown in Figure 13a. This result corresponded well with that of FCMC and SRF, as shown in Figure 13b. Such experimental results indicated that the optimum dosage was 40 mg/L for the two polyelectrolytes. Lower RT, FCMC, and SRF ratios of NP was observed than that of SP. A good sludge conditioning performance of NP was obtained, and this condition was closely related to CD, intrinsic viscosity, and morphological porous structure.
The indices RT, FCMC, and SRF for the two flocculants rapidly decreased with increasing flocculant dosage, gradually reached the minimum, and slowly increased with increasing flocculant dosage, respectively. These trends were consistent with the typical behavior of polyelectrolytes in the flocculation process reported in previous studies. The trends in the three indices corresponded with the changes in zeta potential of the supernatant in Figure 13a. The negative charge on the sludge surface was gradually neutralized, and colloid particles in the sludge destabilized and aggregated with the addition of positively charged flocculants. Correspondingly, the RT, FCMC, and SRF all decreased. High CD of NP favored charge neutralization as numerous cationic sites were provided. Negatively charged sites of sludge particles were sufficiently neutralized, and good conditioning performance may be achieved. This finding was ascertained by the high zeta potential of NP in Figure 13a and initially explains the good conditioning performance. Charge neutralization was the main mechanism when the most favorable flocculation performance occurred at various flocculant dosages, where zeta potential was zero or close to zero. The repulsive forces between suspended charged particles nearly diminished, and efficient flocculation occurred, leading to effective sludge conditioning. However, in this study, zeta potential was lower than zero at a dosage of 40 mg/L, that is, the optimum dosage. This finding proves bridging, which is relatively common for high intrinsic viscosity polyelectrolytes. The porous morphological structure of NP with a large surface area can crucially enhance the adsorption of polymers on particle surfaces and bridging of particles by polymer chain. In addition, the intrinsic viscosity significantly affects sludge conditioning. At high intrinsic viscosity, the flocculant presented an expanded chain conformation, and molecular chain stretching in the solution was sufficiently long to capture and bridge the colloidal particles [29,30]. An increase in intrinsic viscosity led to molecular chain growth, increased the chance of collision among the colloidal particles, and favored trapping and bridging of particles [31,32]. Therefore, the sludge conditioned by NP was flocculated. Excess flocculants can cause an electrostatic repulsion or a steric effect between the sludge particles, leading to restabilization of sludge particles, a condition that is not conducive to sludge dewatering, as shown in Figure 13.

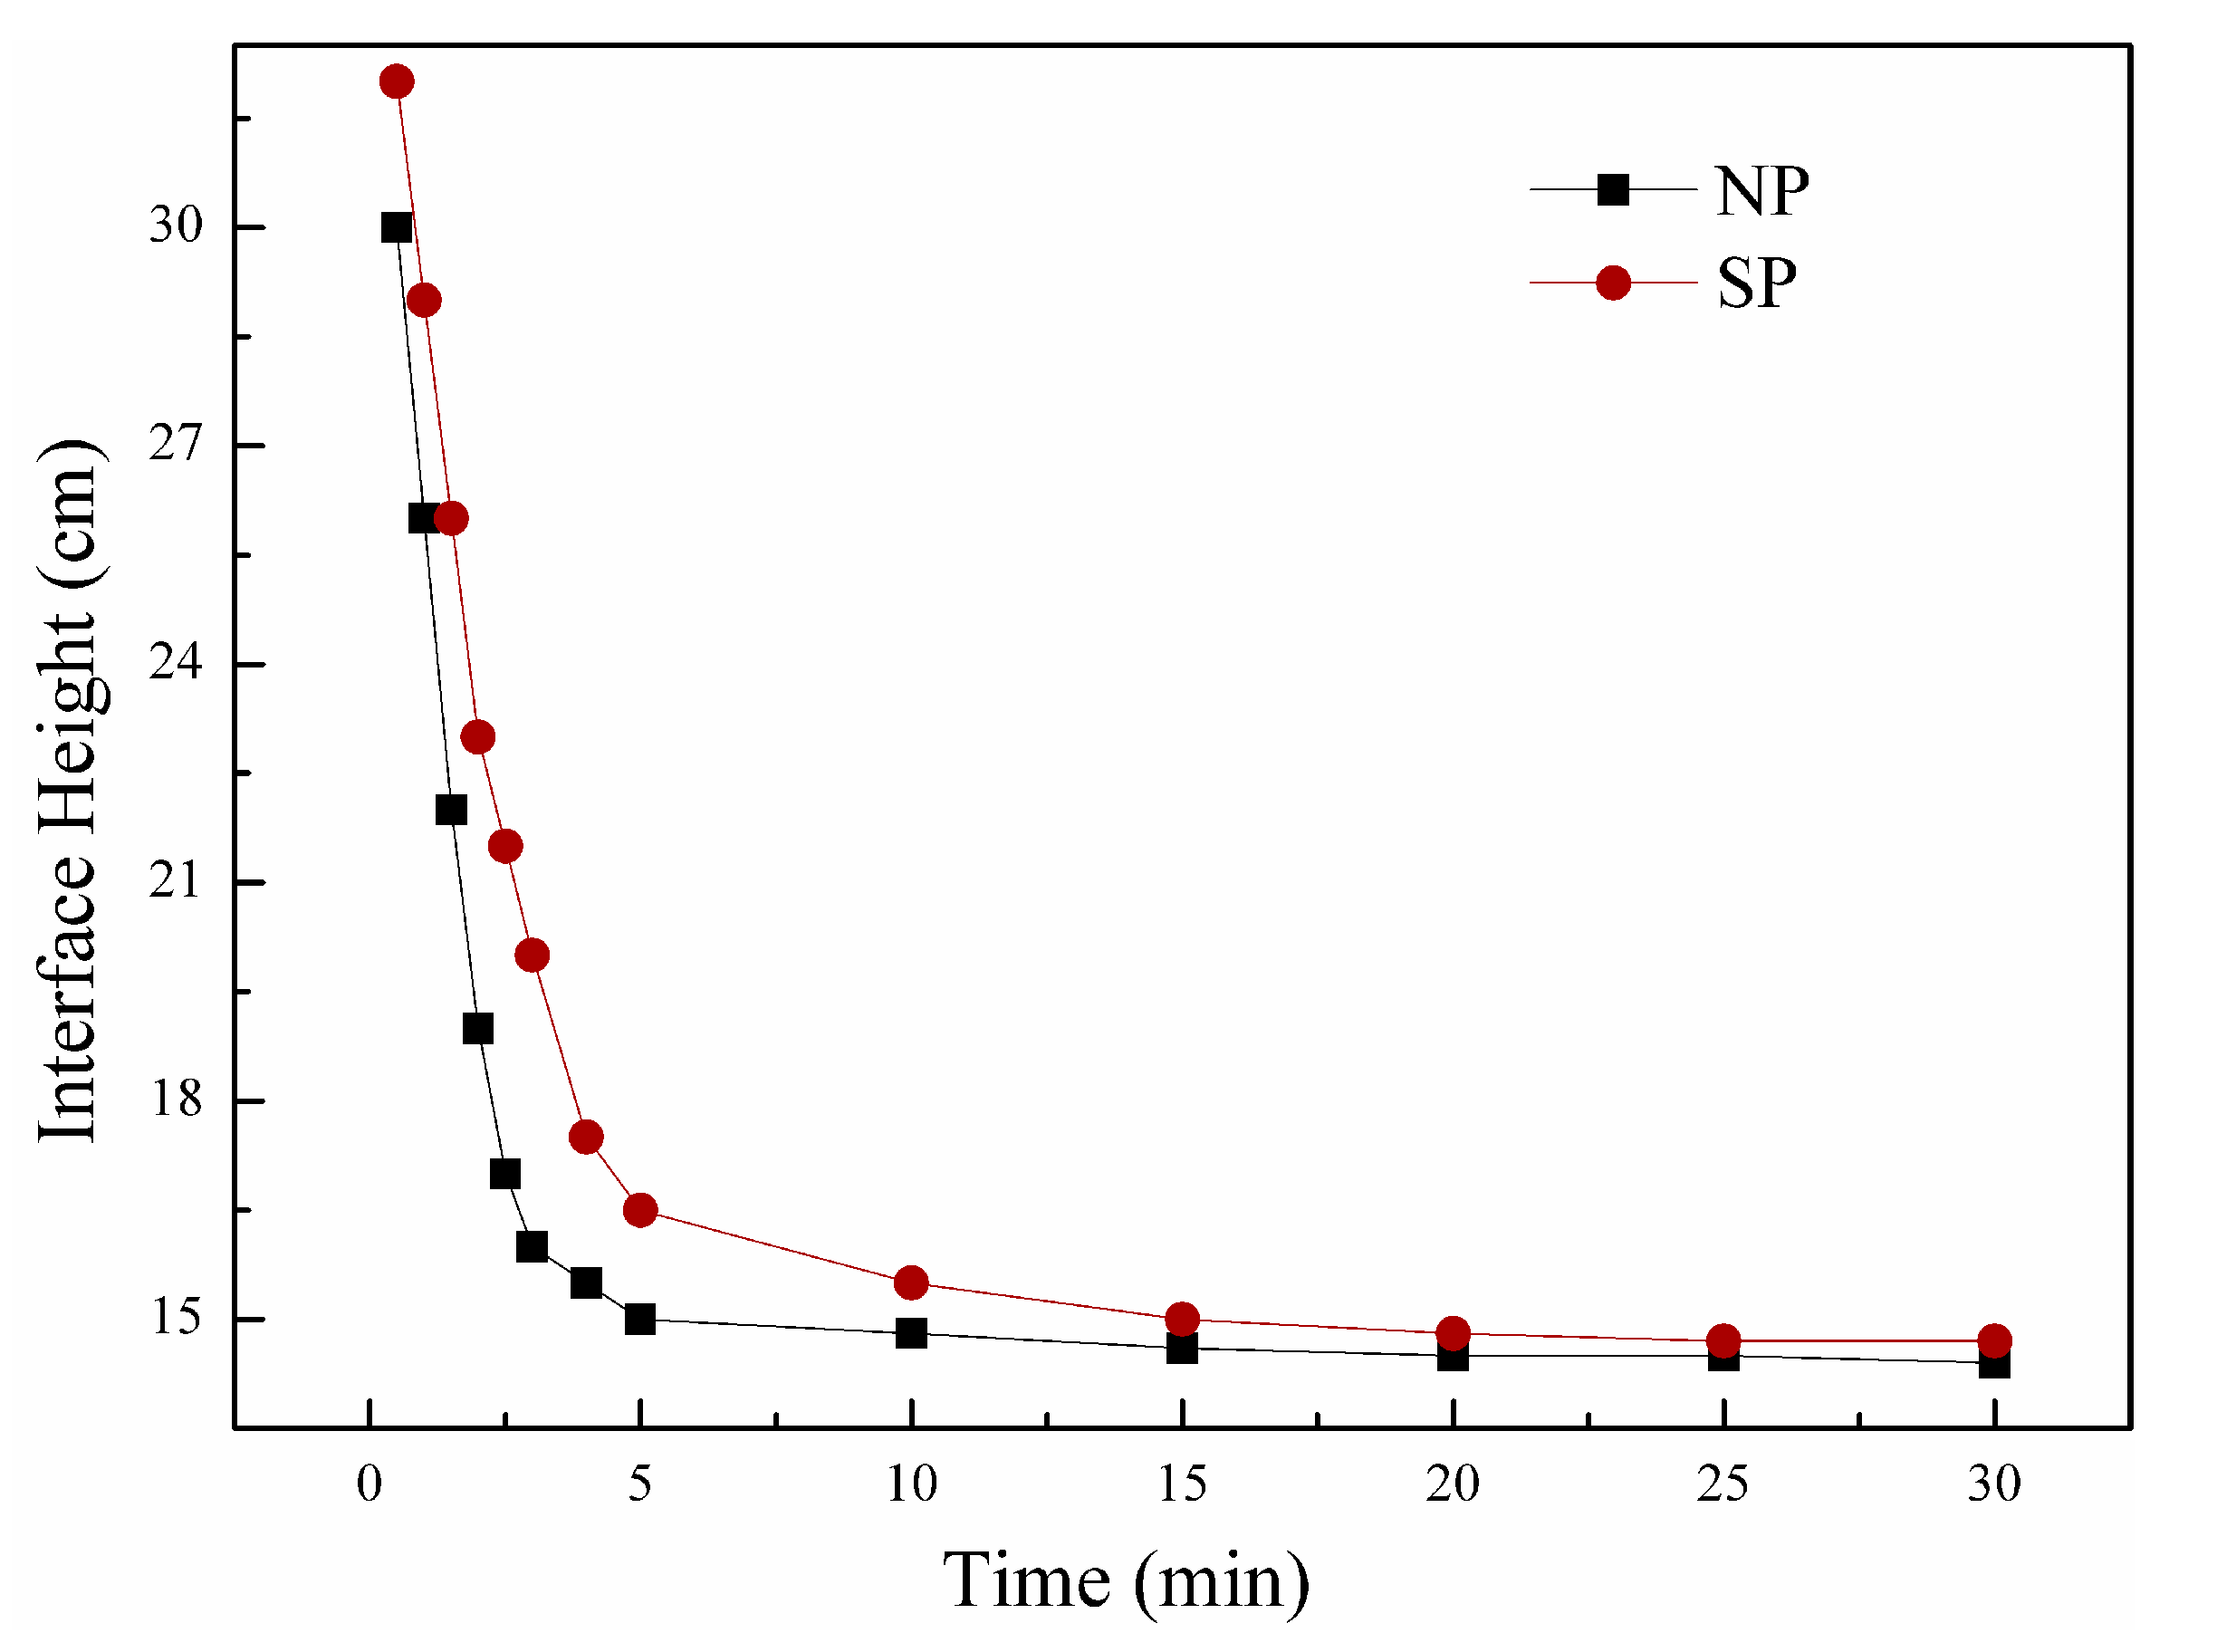
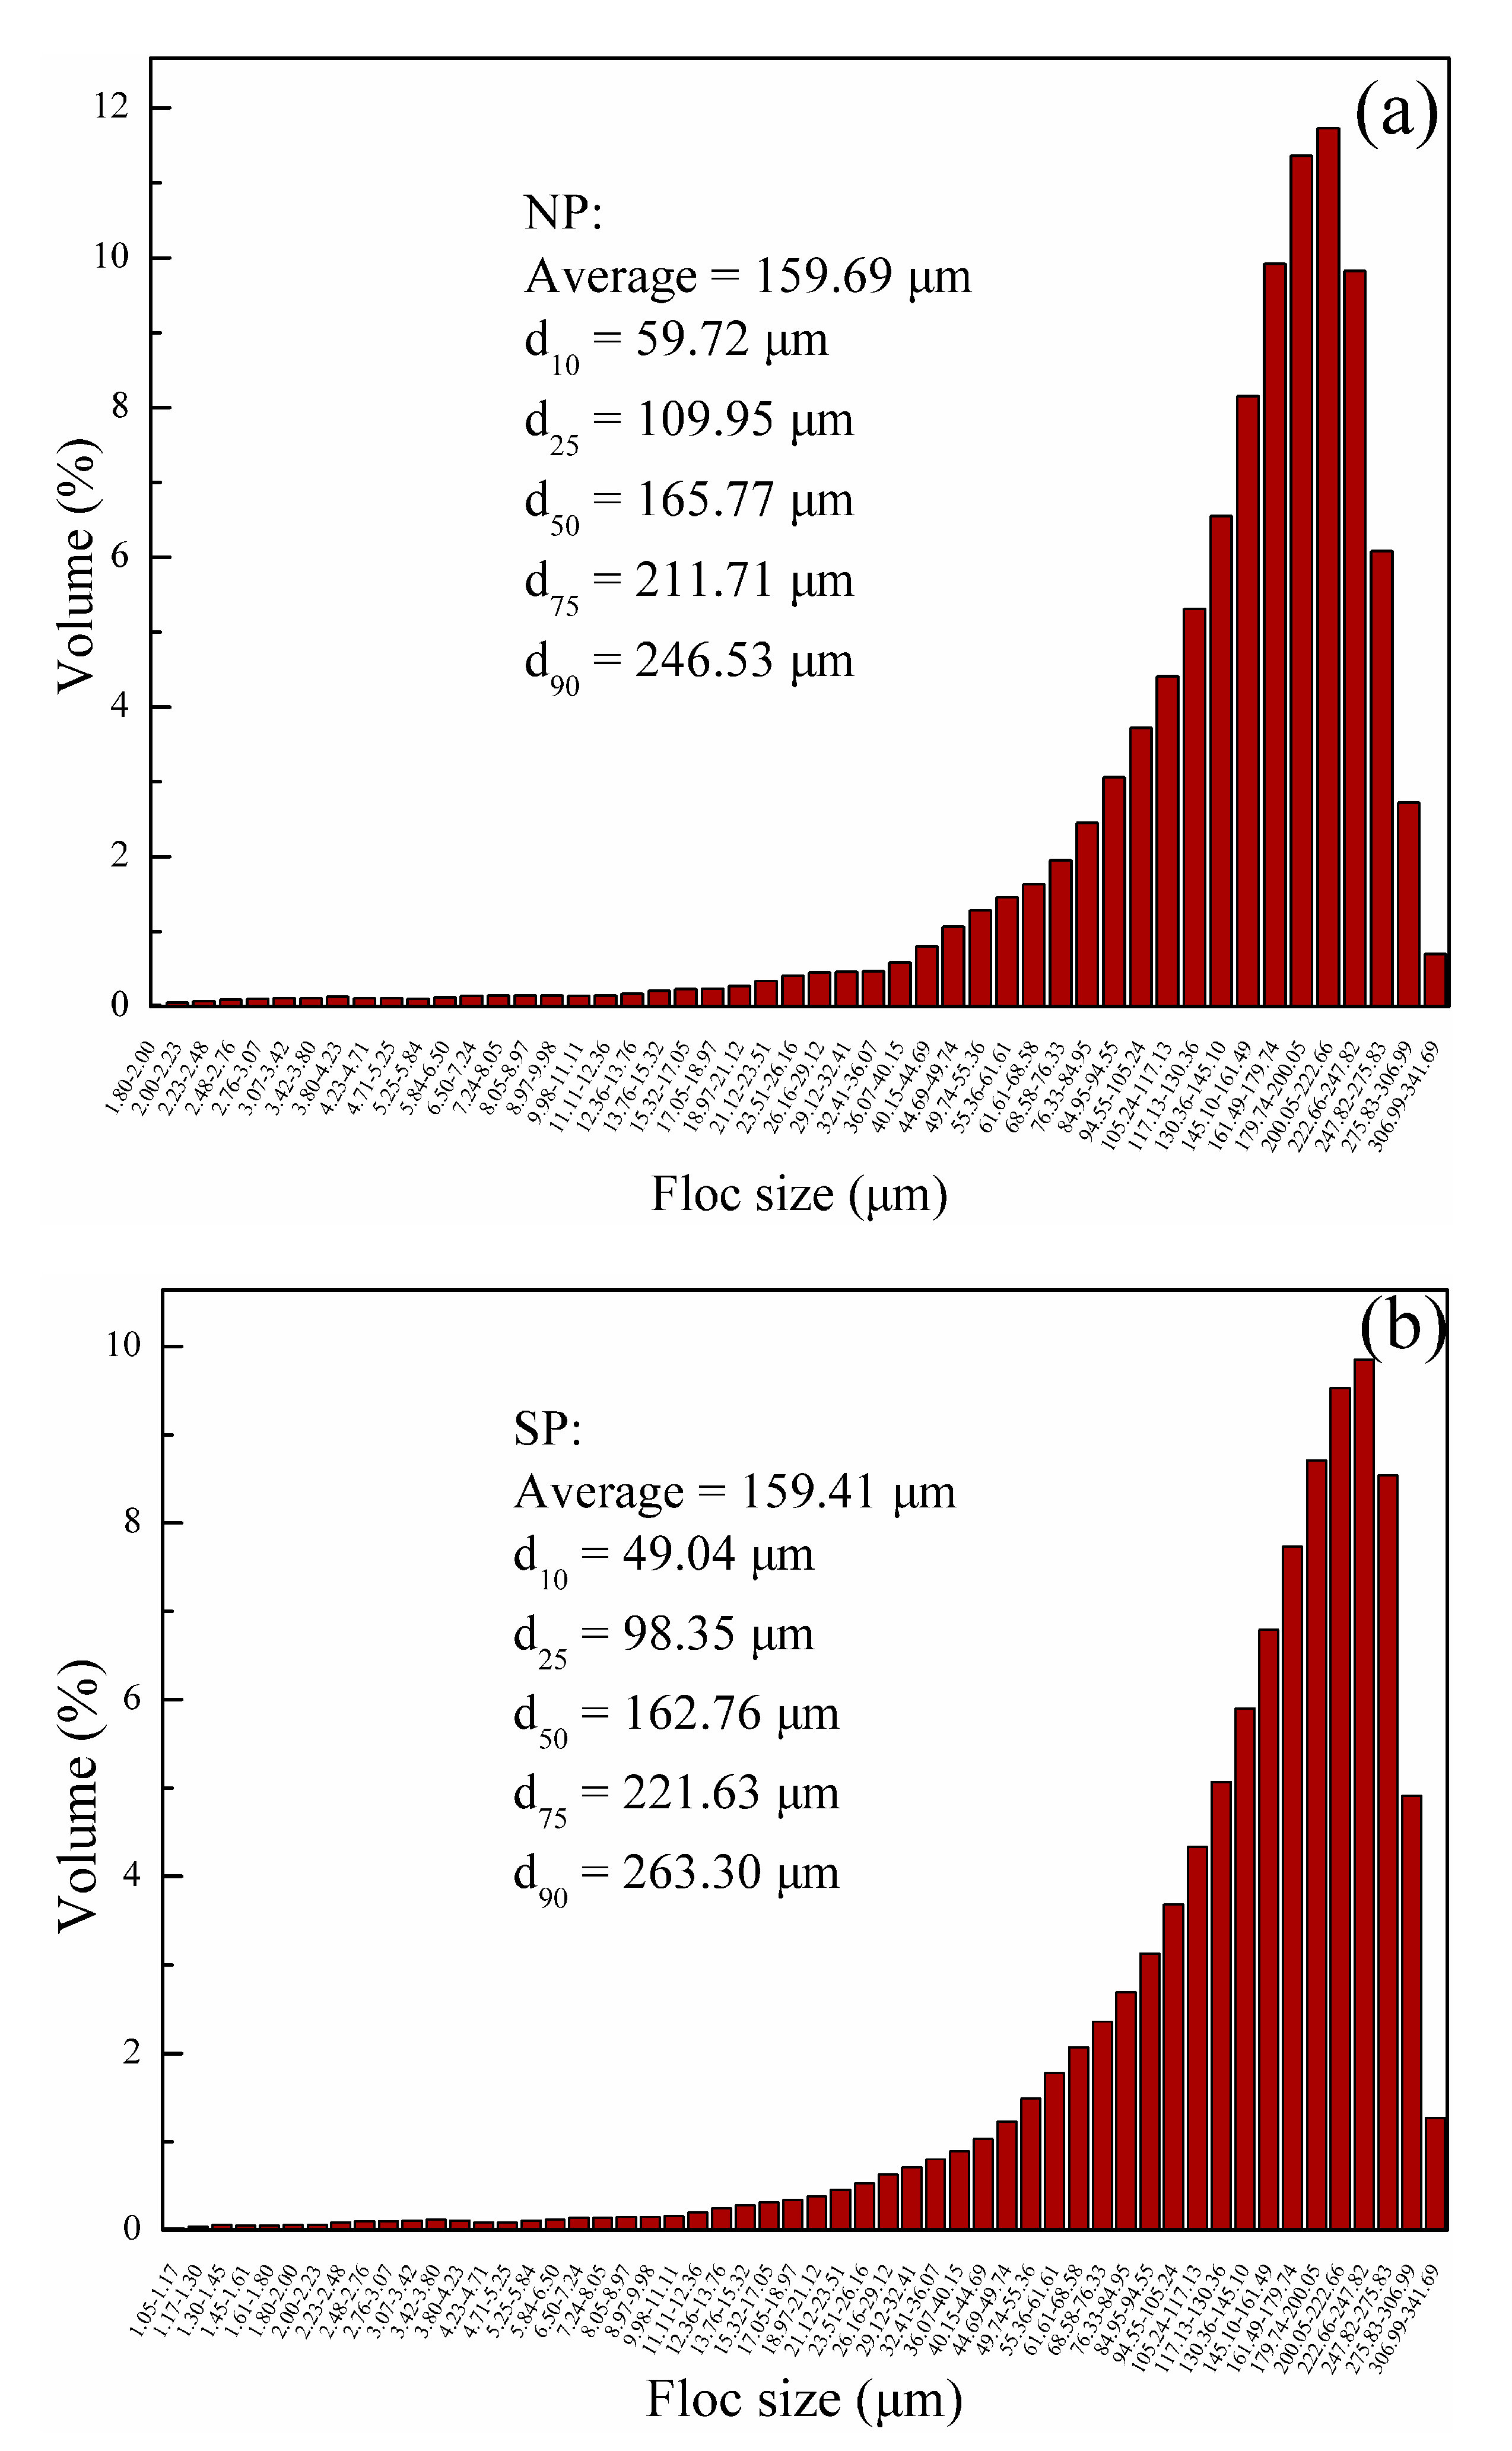
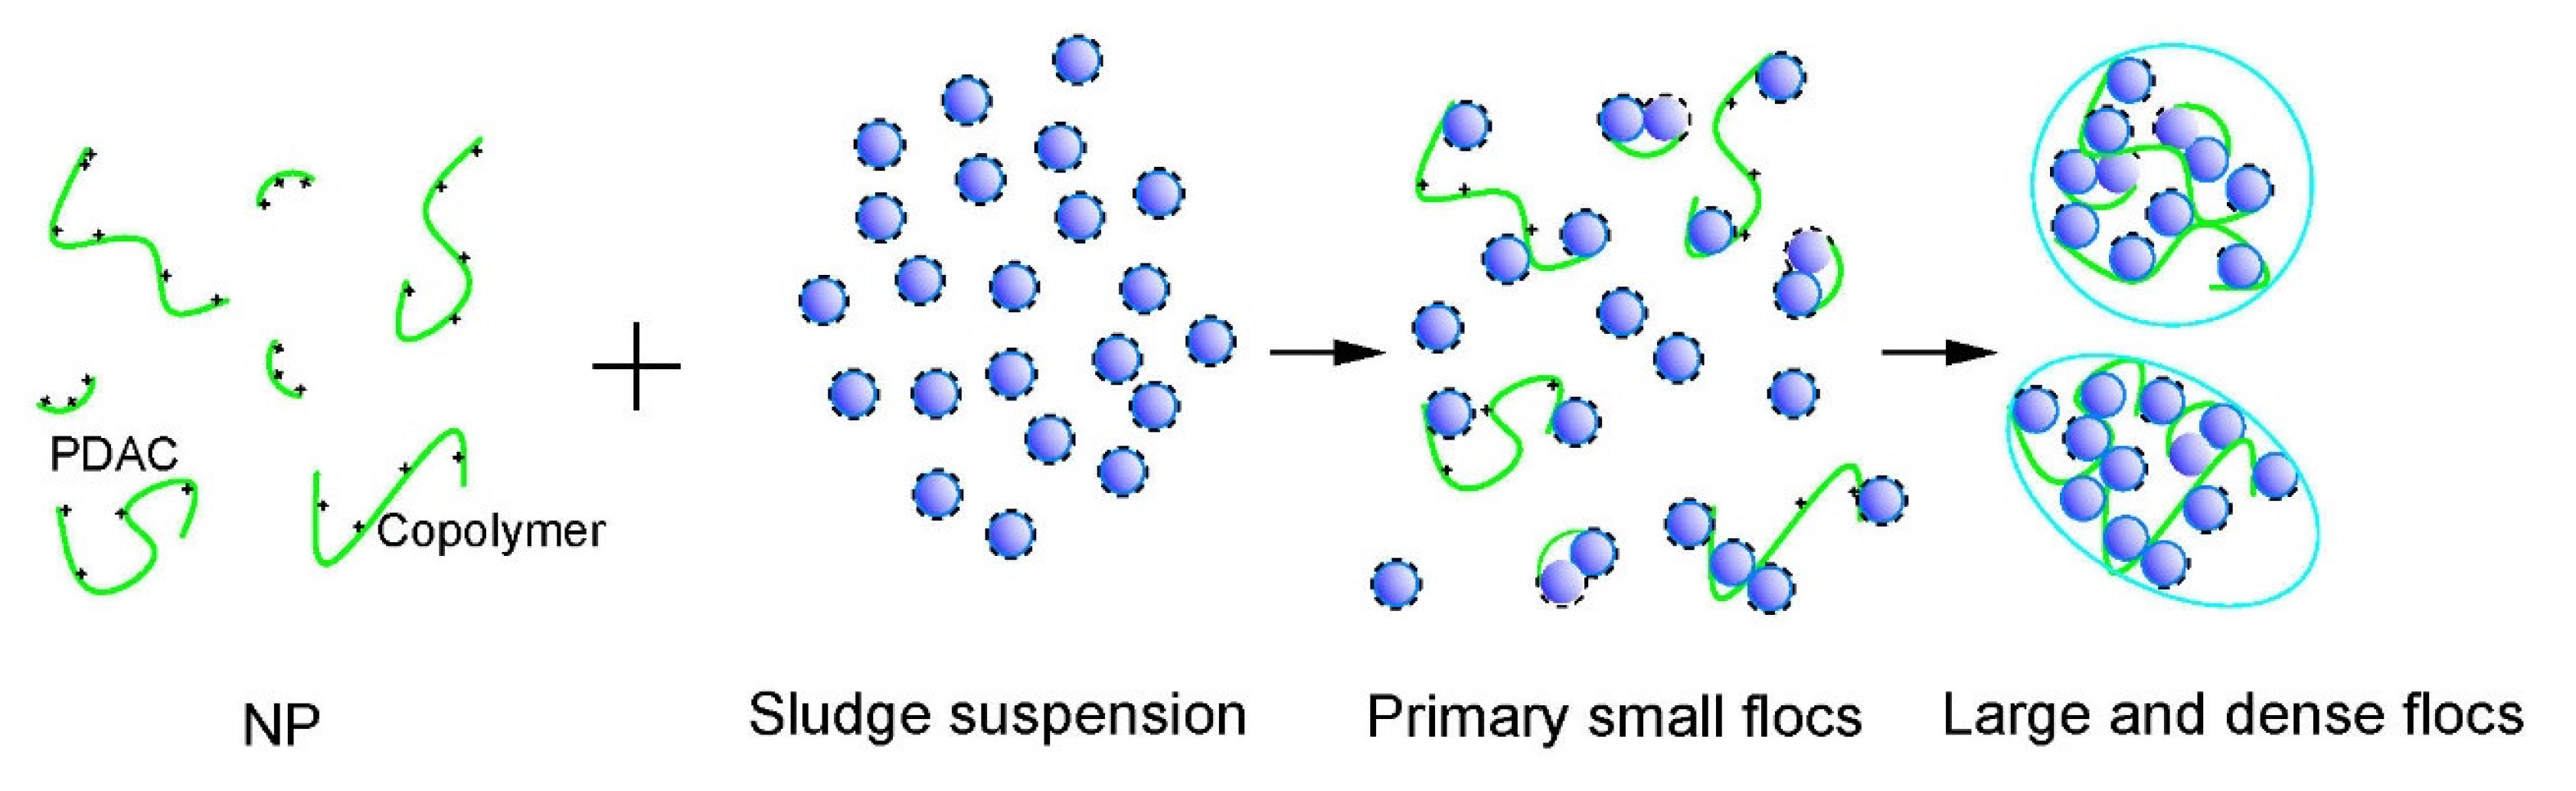
3.3.2. Sludge Floc Properties and Flocculation Mechanism

To examine the effects of the novel UVA initiation system on flocculant sludge conditioning mechanisms, floc characteristics, such as settling behavior and floc size distribution with NP and SP, were comparatively investigated. Figure 14 plots the settling rate of sludge as expressed in terms of the height of the sludge-water interface as a function of time at a dosage of 40 mg/L flocculants. In this study, the rate of variation in the sludge-water interfacial height over 5 min was assumed to be the sludge sedimentation rate. The settling rates reached 4.0 and 3.7 cm/min for the sludge conditioned with NP and SP, respectively. An improved settling capability of NP could be observed. At the end of settling, NP and SP had similar heights of 14.4 and 14.7 cm, respectively. These findings indicated the similar floc sizes of sludge particles conditioned by NP and SP. Nearly the same average floc size of the two polyelectrolytes could be estimated (Figure 15). These different settling behaviors might be attributed to floc density and size distribution. In Figure 15, d10 and d25 of NP were higher than those of SP, indicating that less small floc particles existed in NP-conditioned sludge. Few small particles favor sludge dewatering because a cloth filter is less likely to be clogged [33], implying the low SRF of NP (Figure 13). However, d75 and d90 of NP were smaller than those of SP. Bridging plays an important role in sludge conditioning for SP because the bridging mechanism is constantly characterized by a large floc size [34]. Nevertheless, a large floc size could be disadvantageous for sludge dewatering. Large and loose flocs with a high content of intrafloc water (water from within the floc, comprising loops and tails) [35], which is not easily removed during filtration, were formed, and this phenomenon corresponded well with the high FCMC of SP (Figure 13).
The different initiation systems included the origin of different sludge conditioning performances and mechanisms. Figure 16 shows the sludge flocculation scheme of NP. In Figure 3, several fractions of PDAC existed in NP. After NP was added, the sludge particles were neutralized and destabilized with the existence of PDAC and copolymers. Under this condition, the main flocculation mechanism was charge neutralization, given that the strength between charged sites is higher than Van der Waals force or hydrogen bonds [7]. Flocs are assumed to form through charge neutralization and characterized by compactness and low intrafloc water. However, numerous negative sites were still found on sludge particles because the zeta potential was lower than 0 mV at 40 mg/L (Figure 13a). Bridging became the main flocculation mechanism to form large and dense sludge flocs through Van der Waals force, hydrogen bonds, or electrical force. This condition might explain the floc size distribution and sludge conditioning performance of NP. By contrast, in the single initiator and stable light intensity systems, DAC monomers reacted insufficiently, the first step of charge neutralization could not function well, and bridging served as the main mechanism during flocculation. We observed that flocs mainly formed through bridging were loose and featured a wide range of floc size distribution and a high percent of intrafloc water. Therefore, the sludge conditioning performance of SP was poorer than that of NP.

4. Conclusions

In this study, a novel UVA-initiated system characterized with adjustable light intensity and redox-azo complex initiator to maintain a certain concentration of free radicals was used to synthesize NP. Radical concentrations were maintained as redox initiators decomposed at a low activation energy, and azo initiators were generated at a high activation energy. Polymerization can be completely conducted, and polymerization processes can be well controlled. Flocculant prepared by this novel UVA-initiated system was characterized with high intrinsic viscosity, acceptable dissolvability and porous surface structure. In addition, a small fraction of PDAC was mixed in NP which was revealed by 1H NMR spectra. The flocculation mechanism of NP for sludge conditioning is proposed in detail on the basis of flocculation performance and flocs structure. Several fractions of PDAC contributes to well-performed charge neutralization, and the enhanced approachability of the high intrinsic viscosity and porous structure favors further bridging effects.

Author Contributions

Q.G., G.Z., and Y.L. conceived and designed the experiments; J.X. (Jin Xu), X.S., and F.T. performed the experiments; M.L. and J.X. (Jiaxing Xu) analyzed the data; every author contributed to writing the paper.

Funding

The authors are grateful for the financial support provided by the Natural Science Foundation of Jiangsu (Project BK20160779), Natural Science Research of Jiangsu Universities (Project 16KJB610008), Academic Research Foundation of Nanjing Institute of Technology (Project YKJ201527), the Department of Science and Technology of Sichuan Province (Project No. 2017JY0129) and the Education Committee of Sichuan Province (Project No. 17ZB0312).

Conflicts of Interest

The authors declare no conflict of interest.

References

  1. Nguyen, T.P.; Hilal, N.; Hankins, N.P.; Novak, J.T. Characterization of synthetic and activated sludge and conditioning with cationic polyelectrolytes. Desalination 2008, 227, 103–110. [Google Scholar] [CrossRef]
  2. Ma, M.; Zhu, S. Grafting polyelectrolytes onto polyacrylamide for flocculation 2. Model suspension flocculation and sludge dewatering. Colloid Polym. Sci. 1999, 277, 123–129. [Google Scholar] [CrossRef]
  3. Wolski, P.; Zawieja, I. Hybrid conditioning before anaerobic digestion for the improvement of sewage sludge dewatering. Desalination Water Treat. 2014, 52, 3725–3731. [Google Scholar] [CrossRef]
  4. Zhu, J.; Zheng, H.; Jiang, Z.; Zhang, Z.; Liu, L.; Sun, Y.; Tshukudu, T. Synthesis and characterization of a dewatering reagent: Cationic polyacrylamide (P(AM-DMC-DAC)) for activated sludge dewatering treatment. Desalination Water Treat. 2013, 51, 2791–2801. [Google Scholar] [CrossRef]
  5. Zheng, H.; Sun, Y.; Zhu, C.; Guo, J.; Zhao, C.; Liao, Y.; Guan, Q. UV-initiated polymerization of hydrophobically associating cationic flocculants: Synthesis, characterization, and dewatering properties. Chem. Eng. J. 2013, 234, 318–326. [Google Scholar] [CrossRef]
  6. Zheng, H.; Liao, Y.; Zheng, M.; Zhu, C.; Ji, F.; Ma, J.; Fan, W. Photoinitiated Polymerization of Cationic Acrylamide in Aqueous Solution: Synthesis, Characterization, and Sludge Dewatering Performance. Sci. World J. 2014, 2014, 1–11. [Google Scholar] [CrossRef] [PubMed]
  7. Bolto, B.; Gregory, J. Organic polyelectrolytes in water treatment. Water Res. 2007, 41, 2301–2324. [Google Scholar] [CrossRef] [PubMed]
  8. Zheng, H.; Sun, Y.; Guo, J.; Li, F.; Fan, W.; Liao, Y.; Guan, Q. Characterization and Evaluation of Dewatering Properties of PADB, a Highly Efficient Cationic Flocculant. Ind. Eng. Chem. Res. 2014, 53, 2572–2582. [Google Scholar] [CrossRef]
  9. Zhou, J.; Liu, F.; Pan, C. Effects of Cationic Polyacrylamide Characteristics on Sewage Sludge Dewatering and Moisture Evaporation. PLoS ONE 2014, 9, e98159. [Google Scholar] [CrossRef] [PubMed]
  10. Guan, Q.; Zheng, H.; Zhai, J.; Liu, B.; Sun, Y.; Wang, Y.; Xu, Z.; Zhao, C. Preparation, characterization, and flocculation performance of P(acrylamide-co-diallyldimethylammonium chloride) by UV-initiated template polymerization. J. Appl. Polym. Sci. 2015, 132, 41747. [Google Scholar] [CrossRef]
  11. Shang, H.; Zheng, Y.; Liu, J. Synthesis in inverse emulsion and decolorization properties of hydrophobically modified cationic polyelectrolyte. J. Appl. Polym. Sci. 2011, 119, 1602–1609. [Google Scholar] [CrossRef]
  12. Ma, J.; Zheng, H.; Tan, M.; Liu, L.; Chen, W.; Guan, Q.; Zheng, X. Synthesis, characterization, and flocculation performance of anionic polyacrylamide P (AM-AA-AMPS). J. Appl. Polym. Sci. 2013, 129, 1984–1991. [Google Scholar] [CrossRef]
  13. Agarwal, V.; McLean, D.; Horne, J.; Richardson, D.; Stack, K. Chemometric study of graft copolymerization of guar-g-(acrylamide-co-diallyl dimethylammonium chloride). J. Appl. Polym. Sci. 2013, 127, 3970–3979. [Google Scholar] [CrossRef]
  14. Zhao, S.-M.; Liu, K.-Y. Synthesis of copolymer of DMDAAC and AM. Beijing Huagong Daxue Xuebao (Ziran Kexueban)/J. Beijing Univ. Chem. Technol. (Nat. Sci. Ed. ) 2005, 32, 29–32. [Google Scholar] [CrossRef]
  15. Bamford, C.H. 9—Redox Initiators A2—Allen, Geoffrey. In Comprehensive Polymer Science and Supplements; Bevington, J.C., Ed.; Pergamon: Amsterdam, The Netherlands, 1989; pp. 123–139. [Google Scholar]
  16. Pabin-Szafko, B.; Wisniewska, E.; Hefczyc, B.; Zawadiak, J. New azo-peroxidic initiators in the radical polymerization of styrene and methyl methacrylate. Eur. Polym. J. 2009, 45, 1476–1484. [Google Scholar] [CrossRef]
  17. Sun, Y.; Zhu, C.; Xu, Y.; Zheng, H.; Xiao, X.; Zhu, G.; Ren, M. Comparison of initiation methods in the structure of CPAM and sludge flocs properties. J. Appl. Polym. Sci. 2016, 133, 44071. [Google Scholar] [CrossRef]
  18. Guan, Q.; Zheng, H.; Zhai, J.; Zhao, C.; Zheng, X.; Tang, X.; Chen, W.; Sun, Y. Effect of Template on Structure and Properties of Cationic Polyacrylamide: Characterization and Mechanism. Ind. Eng. Chem. Res. 2014, 53, 5624–5635. [Google Scholar] [CrossRef]
  19. Guan, Q.; Zheng, H.; Xu, J.; Tian, F.; Sun, X. Effect of Charge Density on Structural Characteristics of Cationic Polyacrylamide: Models Based on Reactivity Ratio and Characterization. J. Polym. Mater. 2016, 33, 365–377. [Google Scholar]
  20. Guan, Q.; Tang, M.; Zheng, H.; Teng, H.; Tang, X.; Liao, Y. Investigation of sludge conditioning performance and mechanism by examining the effect of charge density on cationic polyacrylamide microstructure. Desalination Water Treat. 2016, 57, 12988–12997. [Google Scholar] [CrossRef]
  21. Abdollahi, Z.; Frounchi, M.; Dadbin, S. Synthesis, characterization and comparison of PAM, cationic PDMC and P(AM-co-DMC) based on solution polymerization. J. Ind. Eng. Chem. 2011, 17, 580–586. [Google Scholar] [CrossRef]
  22. Feng, L.; Zheng, H.; Gao, B.; Zhao, C.; Zhang, S.; Chen, N. Enhancement of textile-dyeing sludge dewaterability using a novel cationic polyacrylamide: Role of cationic block structures. Rsc Adv. 2017, 7, 11626–11635. [Google Scholar] [CrossRef]
  23. Ma, J.; Shi, J.; Ding, H.; Zhu, G.; Fu, K.; Fu, X. Synthesis of cationic polyacrylamide by low-pressure UV initiation for turbidity water flocculation. Chem. Eng. J. 2017, 312, 20–29. [Google Scholar] [CrossRef]
  24. Seabrook, S.A.; Gilbert, R.G. Photo-initiated polymerization of acrylamide in water. Polymer 2007, 48, 4733–4741. [Google Scholar] [CrossRef]
  25. Yuan, Z.; Hu, H. Preparation and characterization of crosslinked glyoxalated polyacrylamide paper-strengthening agent. J. Appl. Polym. Sci. 2012, 126, E458–E468. [Google Scholar] [CrossRef]
  26. Liu, L.Y.; Yang, W.T. Inverse emulsion polymerization of acrylamide initiated by UV radiation. Acta Polym. Sin. 2004, 545–550. [Google Scholar] [CrossRef]
  27. Wang, X.; Tang, X.; Feng, P.; Li, X.; Zhao, C.; Chen, W.; Zheng, H. A novel preparation method of polyaluminum chloride/polyacrylamide composite coagulant: Composition and characteristic. J. Appl. Polym. Sci. 2017, 134, 44500. [Google Scholar] [CrossRef]
  28. Ondaral, S.; Usta, M.; Gumusderelioglu, M.; Arsu, N.; Balta, D.K. The synthesis of water soluble cationic microgels by dispersion polymerization: Their performance in kaolin deposition onto fiber. J. Appl. Polym. Sci. 2009, 116, 1157–1164. [Google Scholar] [CrossRef]
  29. Yoon, D.H.; Jang, J.W.; Cheong, I.W. Synthesis of cationic polyacrylamide/silica nanocomposites from inverse emulsion polymerization and their flocculation property for papermaking. Colloids Surf. A Physicochem. Eng. Asp. 2012, 411, 18–23. [Google Scholar] [CrossRef]
  30. Yang, Z.; Liu, X.; Gao, B.; Zhao, S.; Wang, Y.; Yue, Q.; Li, Q. Flocculation kinetics and floc characteristics of dye wastewater by polyferric chloride–poly-epichlorohydrin–dimethylamine composite flocculant. Sep. Purif. Technol. 2013, 118, 583–590. [Google Scholar] [CrossRef]
  31. Saveyn, H.; Meersseman, S.; Thas, O.; Van der Meeren, P. Influence of polyelectrolyte characteristics on pressure-driven activated sludge dewatering. Colloids Surf. A Physicochem. Eng. Asp. 2005, 262, 40–51. [Google Scholar] [CrossRef]
  32. Chen, Q.; Wang, Y. Influence of single- and dual-flocculant conditioning on the geometric morphology and internal structure of activated sludge. Powder Technol. 2015, 270, 1–9. [Google Scholar] [CrossRef]
  33. Feng, L.; Liu, S.; Zheng, H.; Liang, J.; Sun, Y.; Zhang, S.; Chen, X. Using ultrasonic (US)-initiated template copolymerization for preparation of an enhanced cationic polyacrylamide (CPAM) and its application in sludge dewatering. Ultrason. Sonochem. 2018, 44, 53–63. [Google Scholar] [CrossRef] [PubMed]
  34. Zhao, C.; Zheng, H.; Feng, L.; Wang, Y.; Liu, Y.; Liu, B.; Djibrine, B.Z. Improvement of Sludge Dewaterability by Ultrasound-Initiated Cationic Polyacrylamide with Microblock Structure: The Role of Surface-Active Monomers. Materials 2017, 10, 282. [Google Scholar] [CrossRef] [PubMed]
  35. Xiao, J.; Wu, X.; Yu, W.; Liang, S.; Yu, J.; Gu, Y.; Deng, H.; Hu, J.; Xiao, K.; Yang, J. Migration and distribution of sodium ions and organic matters during electro-dewatering of waste activated sludge at different dosages of sodium sulfate. Chemosphere 2017, 189, 67–75. [Google Scholar] [CrossRef] [PubMed]
Figure 1. Scheme of the preparation device.
Processes 06 00233 g001
Scheme 1. Copolymerization reaction of acrylamide (AM) and acryloxyethyltrimethyl ammonium chloride (DAC). (a) Copolymers of P(AM-co-DAC) and (b) homopolymers of poly (acryloxyethyltrimethyl ammonium chloride) (PDAC) and poly acrylamide (PAM).
Processes 06 00233 sch001
Figure 2. Fourier transform infrared (FT-IR) spectra of (1) CPAM prepared by novel UVA-initiated system (NP) and (2) CPAM prepared by a stable UVA light intensity and a single initiator system (SP).
Processes 06 00233 g002
Figure 3. Proton nuclear magnetic resonance (1H NMR) spectra of (1) NP, (2) poly acrylamide (PAM), and (3) poly (acryloxyethyltrimethyl ammonium chloride) (PDAC).
Processes 06 00233 g003
Figure 4. X-ray photoelectron spectroscope (XPS) (a) fully-scanned spectra; C 1s spectra of (b) NP and (c) SP; O 1s spectra of (d) NP and (e) SP; and N 1s spectra of (f) NP and (g) SP.
Processes 06 00233 g004
Figure 5. Thermogravimetric analysis–differential scanning calorimeter (TGA-DSC) curves of (a) NP; (b) PAM; and (c) PDAC.
Processes 06 00233 g005
Figure 6. Scanning electron microscope (SEM) images of (a) NP and (b) SP.
Processes 06 00233 g006
Figure 7. Effects of redox initiator concentration on copolymerization.
Processes 06 00233 g007
Figure 8. Effects of azo initiator concentration on copolymerization.
Processes 06 00233 g008
Figure 9. Effects of mass ratio between acrylamide (AM) and acryloxyethyltrimethyl ammonium chloride (DAC) on copolymerization.
Processes 06 00233 g009
Figure 10. Effects of urea concentration on copolymerization.
Processes 06 00233 g010
Figure 11. Effects of first-stage light intensity on copolymerization.
Processes 06 00233 g011
Figure 12. Effects of second-stage light intensity on copolymerization.
Processes 06 00233 g012
Figure 13. Effects of NP and SP dosages on residual turbidity (RT) and zeta potential (a), filter cake moisture content (FCMC) and specific resistance of filtration (SRF) (b).
Processes 06 00233 g013
Figure 14. Floc settling behavior of flocculants.
Processes 06 00233 g014
Figure 15. Floc size distribution for (a) NP and (b) SP.
Processes 06 00233 g015
Figure 16. Sludge flocculation mechanism scheme of NP.
Processes 06 00233 g016
Table 1. Waste sludge characteristics.
Moisture Content (%)Mass Density (mL/g)pHZeta Potential (mV)Conductivity (mS/cm)VSS/TSS *SRF (×1012 m/kg) **Appearance
98.8 ± 0.180.983 ± 0.017.29 ± 0.15−21.8 ± 0.41.7 ± 0.40.66 ± 0.1517.2 ± 0.3grayish brown
* Volatile suspended solid/ total suspended solid (VSS/TSS) is the percentage of micro-organisms in the waste sludge. ** specific resistance of filtration (SRF) is specific resistance of the sludge.
Table 2. Elemental analysis of NP and SP.
SampleNPSP
Nitrogen (wt%)14.4515.09
Carbon (wt%)50.6650.41
Hydrogen (wt%)7.247.69
Oxygen (wt%)19.8020.16
Chlorine (wt%)7.456.66
Table 3. NP and SP characteristics at optimum condition.
PolymerIntrinsic Viscosity (dL/mg)Dissolving Time (min)Conversion (%)CD (w/w)Unreacted DAC Monomer ***Unreacted AM Monomer ***
NP19.2 ± 0.466 ± 199.3% ± 0.1539.6% ± 0.30.4% ± 0.30.3% ± 0.45
SP18.3 ± 0.572 ± 195.1% ± 0.1835.8% ± 0.44.2% ± 0.40.7% ± 0.58
*** The unreacted DAC percentage is obtained by 40% (total DAC monomer percentage) minus charge density (CD). The unreacted AM percentage is obtained by 100% minus conversion and unreacted DAC percentage.

