Article

The Effect of Baffle Structure and Rotational Speed on the Flow Field in the Silicon Purification Process via the Rotational Segregation Method: A Water Model Study on Tracer Transport and Concentration Variation

1
College of Materials Science and Engineering, Taiyuan University of Technology, Taiyuan 030024, China
2
School of Metallurgy, Northeastern University, Shenyang 110819, China
3
Department of Mechanical Engineering, Taiyuan Institute of Technology, Taiyuan 030008, China
4
National Engineering Research Center for Green Recycling of Strategic Metal Resources, Institute of Process Engineering, Chinese Academy of Sciences, Beijing 100190, China
*
Authors to whom correspondence should be addressed.
Processes 2026, 14(9), 1500; https://doi.org/10.3390/pr14091500
Submission received: 9 April 2026 / Revised: 1 May 2026 / Accepted: 2 May 2026 / Published: 6 May 2026

Abstract

This study experimentally investigated, using a water-model hydrodynamic analogue, the effects of crystallizer rotational speed and baffle configuration on the flow-field structure, mass transfer, and mixing behavior inside the crucible of a rotational segregation model system relevant to silicon processing. Three configurations were examined: no baffle, straight baffles, and inclined baffles. Flow visualization and stimulus–response tracer experiments were conducted at 200 and 300 rpm to compare their effects on the main flow pattern and mixing characteristics. The results showed that, without baffles, a complete annular main flow formed, and the fluid moved downward spirally along the crystallizer wall. Mixing was relatively fast, indicating limited potential for local tracer retention. With straight baffles, the main flow was strongly obstructed and redistributed, and the mixing time in local bottom regions, especially in front of the 90° baffle, was markedly prolonged. This behavior suggested a more favorable hydrodynamic environment for local retention and accumulation in the model system, and the effect was most evident at 200 rpm. With inclined baffles, transport in the upper region was enhanced, whereas bottom flow was weakened. Although the tracer could move downward along the baffle surface, it was rapidly swept away after reaching the bottom, indicating reduced stability of local accumulation. Increasing the rotational speed from 200 to 300 rpm strengthened the overall flow and shortened the mixing time under all conditions. Overall, straight baffles, particularly at 200 rpm, produced the strongest tendency for local retention in the present model system. These results provide preliminary hydrodynamic insight into flow regulation and transport behavior in rotational segregation systems.

1. Introduction

High-purity silicon is an essential basic material in the fields of new energy and electronic information technology, including photovoltaic cells, semiconductors, and electronic chips [1,2,3,4,5,6,7]. The purification of industrial silicon is a key step in the production of high-purity silicon. At present, the commonly used methods for preparing high-purity silicon are directional solidification and zone melting [8,9]. These methods feature simple equipment, large-scale production capability, and environmental friendliness. However, in both methods, an enrichment layer with a certain thickness forms at the solidification interface during the solidification process [10]. As a result, a relatively low solidification rate is required, which leads to a long solidification time and a complex solidification process. On this basis, Japanese researchers proposed a new method, namely, the rotational segregation method. This method has already been applied to the purification of many high-purity metals, such as Al and Te [11,12]. In the rotational segregation method, a high-speed rotating crystallizer is used to reduce the thickness of the enrichment layer, thereby making it easier for impurities to remain in the liquid phase during purification. Rotational stirring has been widely applied in metallurgy and chemical engineering industries [13,14,15,16,17], such as in stirred tanks and KR stirring systems. In addition, some rotational stirring applications have confirmed that rotation can generate specific flow fields and thereby achieve impurity removal [18,19].
The rotational segregation method was first developed in Japan. In 1984, Arai et al. [20] pioneered a rotational segregation apparatus for aluminum purification. Since then, many researchers have carried out studies on the application of the rotational segregation method to the purification of high-purity metals. In 2022, Shang et al. [21] used a VOF model to simulate silicon purification by the rotational segregation method and investigated the effects of parameters such as crystallizer rotational speed and immersion depth on the segregation coefficients of various impurities. In addition, based on the optimum immersion depth obtained from the numerical simulations, Shang et al. [21] carried out high-temperature experiments. The experimental results showed that, after applying the rotational segregation method, the impurities Fe, Al, and B in silicon were all removed to different extents. Among them, Fe showed the highest removal efficiency, with a removal ratio of about 93.6%. In 2023, Qian et al. [22] found through ProCAST numerical simulations that increasing the crystallizer rotational speed could accelerate the crystal growth rate while reducing the effective segregation coefficient of impurities, and they also preliminarily clarified the relationship between crystallizer rotation and the impurity concentration boundary layer. Qian et al. [22] also carried out silicon purification experiments using the developed IRSP device with a production capacity of 100 kg. Their results showed that, with increasing crystallizer rotational speed, the purity of the refined silicon in the high-temperature experiments gradually increased. By adjusting the crystallizer rotational speed and immersion depth, Shang and Qian et al. regulated the flow-field structure inside the purification crucible, thereby achieving efficient silicon purification with the conventional configuration. In 2025, Liu et al. [23] studied the effects of crystallizer rotational speed on the temperature gradient and crystal growth rate in the rotational segregation method, and found that increasing the rotational speed could reduce both the temperature gradient and the growth rate. Overall, existing studies have mainly focused on process parameters, mass transfer behavior, and purification performance. However, Ohno et al. [24] pointed out that although a high-speed rotating crystallizer can effectively reduce the thickness of the enrichment layer, an excessively high rotational speed may also lead to new problems. On the one hand, the pure aluminum crystal layer newly formed on the crystallizer surface may be thrown away from the interface by the large centrifugal force. On the other hand, obvious backflow is likely to develop inside the melt, which is unfavorable for the effective removal of impurities and thus reduces the purification efficiency. To address these problems, Ohno et al. [24] proposed introducing baffles into the crucible to weaken melt backflow and increase the relative velocity between the crystallizer and the melt, thereby improving the purification process. However, this concept was not investigated further after it was proposed.
As a common flow-control component, baffles can significantly alter the flow path and velocity distribution of fluid within a vessel through obstruction, flow splitting, flow guidance, and the induction of local recirculation [25,26,27,28,29,30,31,32]. In rotating stirring systems in the fields of metallurgy and chemical engineering, baffles have been widely applied [33,34,35,36,37,38]. For example, He et al. [39] used CFD methods in 2019 to study the influence of stirrer tank shape and baffles on turbulent local distribution characteristics. The results showed that regardless of the geometric shape of the stirrer tank, installing baffles effectively suppressed the co-rotation behavior of the fluid and increased the relative velocity between the melt and the stirrer. In 2022, Zhou et al. [40] compared the liquid surface at 450 rpm under conditions with and without baffles in a stirred tank and found that installing baffles effectively reduced the central pit and fluctuations of the free liquid surface caused by fluid movement around the stirrer blades. These studies indicate that baffles play an important role in regulating the structure of rotating flow fields and provide theoretical guidance for their application in rotational segregation systems.
In the rotational segregation method, to further enhance the separation efficiency of impurities, it is necessary to design baffles with different structures and sizes to increase the relative velocity between the crystallizer and the melt, and more effectively reduce the thickness of the enrichment layer. Additionally, baffles can reduce melt backflow, preventing impurities from flowing back to the crystallizer surface. The installation of baffles can create areas behind them with slow or nearly stagnant flow, reducing melt backflow and allowing impurities to accumulate and remain in this “dead zone,” thus lowering the possibility of impurities entering the crystal.
Existing studies on the conventional rotational segregation method [20,21,22,23] have mainly focused on analyzing process parameters, mass transfer behavior, and purification performance through numerical simulations and high-temperature experiments, whereas macroscopic visual observations of the flow-field structure inside the system remain relatively limited. Meanwhile, although Ohno et al. [24] proposed a baffle design concept, subsequent related studies have been scarce. As a result, the influence of baffles on the flow-field structure in the rotational segregation method and the corresponding flow-control mechanism still lack a clear understanding. Based on this, this study focuses on the rotational segregation system and introduces a baffle structure inside the device. A comparative study is conducted on three conditions: no baffle, straight baffles, and inclined baffles. Flow visualization experiments are performed to observe the macroscopic transport path of ink inside the crucible, combined with stimulus–response tracer experiments to analyze the transport and mixing characteristics at different positions. The system reveals the effects of different baffle structures on the flow field distribution inside the crucible and the fluid mixing behavior. The aim of this study is to clarify the differences in flow-field regulation between straight and inclined baffles in a rotational segregation model system, providing experimental evidence and theoretical reference for optimizing baffle structure design and understanding the effects of baffles on localized transport and flow regulation.

2. Materials and Methods

2.1. Model Design

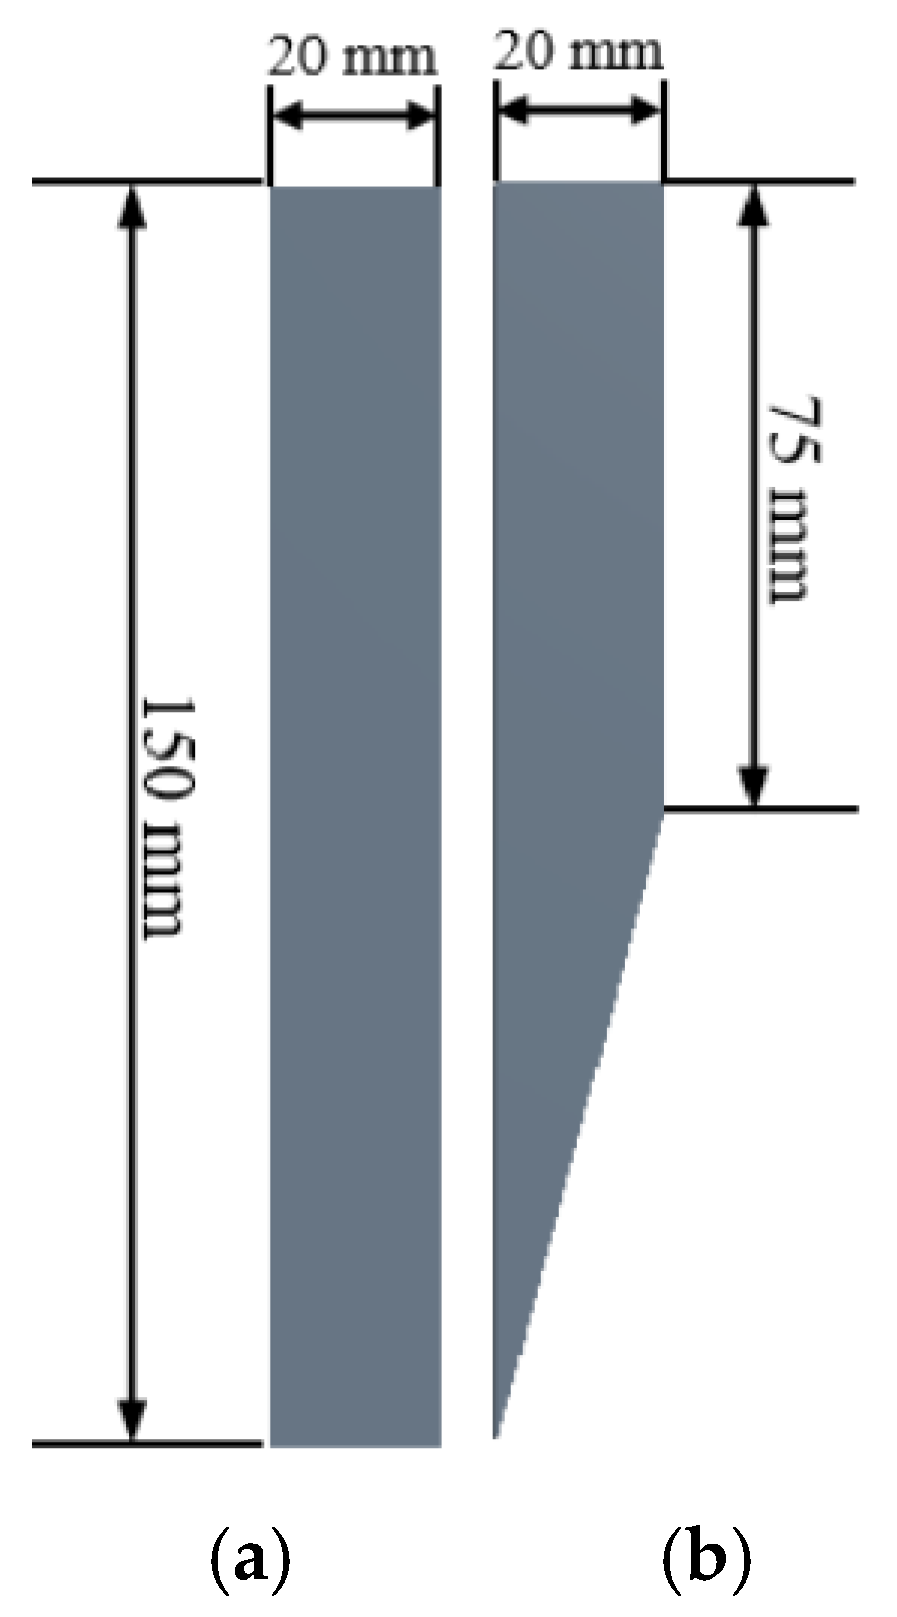
The experimental apparatus in this study was designed based on an industrial prototype. The water model was constructed at a similarity ratio of 2.5:1. The crucible had a diameter of 200 mm and a total height of 150 mm, and the liquid level was maintained at 120 mm. The diameter ratio of the crystallizer to the crucible was 1:3, and the outer diameter of the crystallizer was 66 mm, with a hemispherical bottom. During the experiment, the crystallizer was immersed to a position 24 mm above the bottom of the crucible. Two baffle configurations with different geometries were designed, namely straight baffles and inclined baffles, and the resulting flow fields were compared with that under the no-baffle condition. A schematic of the experimental water model with baffles installed is shown in Figure 1. The angle between adjacent baffles was 90°, and a total of four baffles were installed inside the crucible. The detailed baffle structures are shown in Figure 2. The total length of both the straight baffles and the inclined baffles was 150 mm, equal to the height of the crucible. The width of each baffle was 20 mm, corresponding to one-tenth of the inner diameter of the crucible. After the straight and inclined baffles are arranged around the crucible, both configurations are expected to hinder, to some extent, the motion of the tracer that is thrown from the crystallizer surface and reaches the crucible wall. The tracer is then guided to migrate downward along the baffles. This changes the conventional flow pattern in the rotational segregation method, in which impurities move circumferentially around the crystallizer after being thrown outward, and helps prevent them from approaching the solidification interface again. For the straight baffles, the tracer is more likely to remain in the bottom region of the baffles after reaching the bottom of the crucible. In contrast, for the inclined baffles, the tracer reaching the bottom is more easily carried away by the weak bottom flow. Therefore, the local retention effect of the inclined baffles is relatively weaker.
To further evaluate the effect of viscous forces, the Reynolds number was also considered in this study:
Re = ρ v L / μ
where ρ is the density, v is the characteristic velocity, L is the characteristic length, and μ is the dynamic viscosity. At room temperature, the dynamic viscosity of water is approximately 1.02 mPa·s [41], whereas that of molten silicon near its melting point is 0.76 mPa·s [21]. Based on the model crystallizer diameter of 66 mm and the rotational speed range adopted in this study (200–300 rpm), the Reynolds number of the water model was estimated to be approximately 2.6 × 10⁴ to 1.0 × 10⁵, while that of the corresponding prototype system was approximately 3.0 × 10⁵ to 1.7 × 10⁶. Therefore, both the model and the prototype fall within a flow regime dominated by inertial effects and are far beyond the laminar flow range. Under such conditions, strict equality of the Reynolds number is not the primary requirement. Instead, maintaining Froude similarity is more critical for reproducing the rotating flow with a free surface. Therefore, the scaled water model established in this study can be considered to satisfy the basic hydrodynamic similarity requirements needed to investigate the overall flow field and the near-wall velocity distribution.
The model satisfied Froude number similarity [42,43,44] with the industrial prototype, and the derivation equations for the rotational speed are given in Equations (2)–(6).
( F r ) m = ( F r ) p ,
μ m 2 / g L m = μ p 2 / g L p
μ = Ω R
Ω m = Ω p R p / R m
Ω = 2 π n / 60
where Frm and Frp are the Froude numbers of the model and the prototype, respectively; Lm and Lp are the characteristic lengths of the model and the prototype, respectively, m; Ωm and Ωp are the crystallizer angular velocities of the model and the prototype, respectively, ×9.549 rpm; and n is the crystallizer rotational speed, rpm. The calculated rotational speeds of the water model corresponding to those of the prototype were 200 rpm and 300 rpm.
It should be noted that the present water model was not intended to reproduce phenomena such as crystal growth, latent heat release, or interfacial morphology evolution during the actual solidification of molten silicon. Therefore, the conclusions obtained in this study are mainly applicable to the analysis of flow-field characteristics in the vicinity of the rotating crystallizer, rather than directly representing the thermodynamic and solidification processes at the real solidification interface.

2.2. Experimental Method

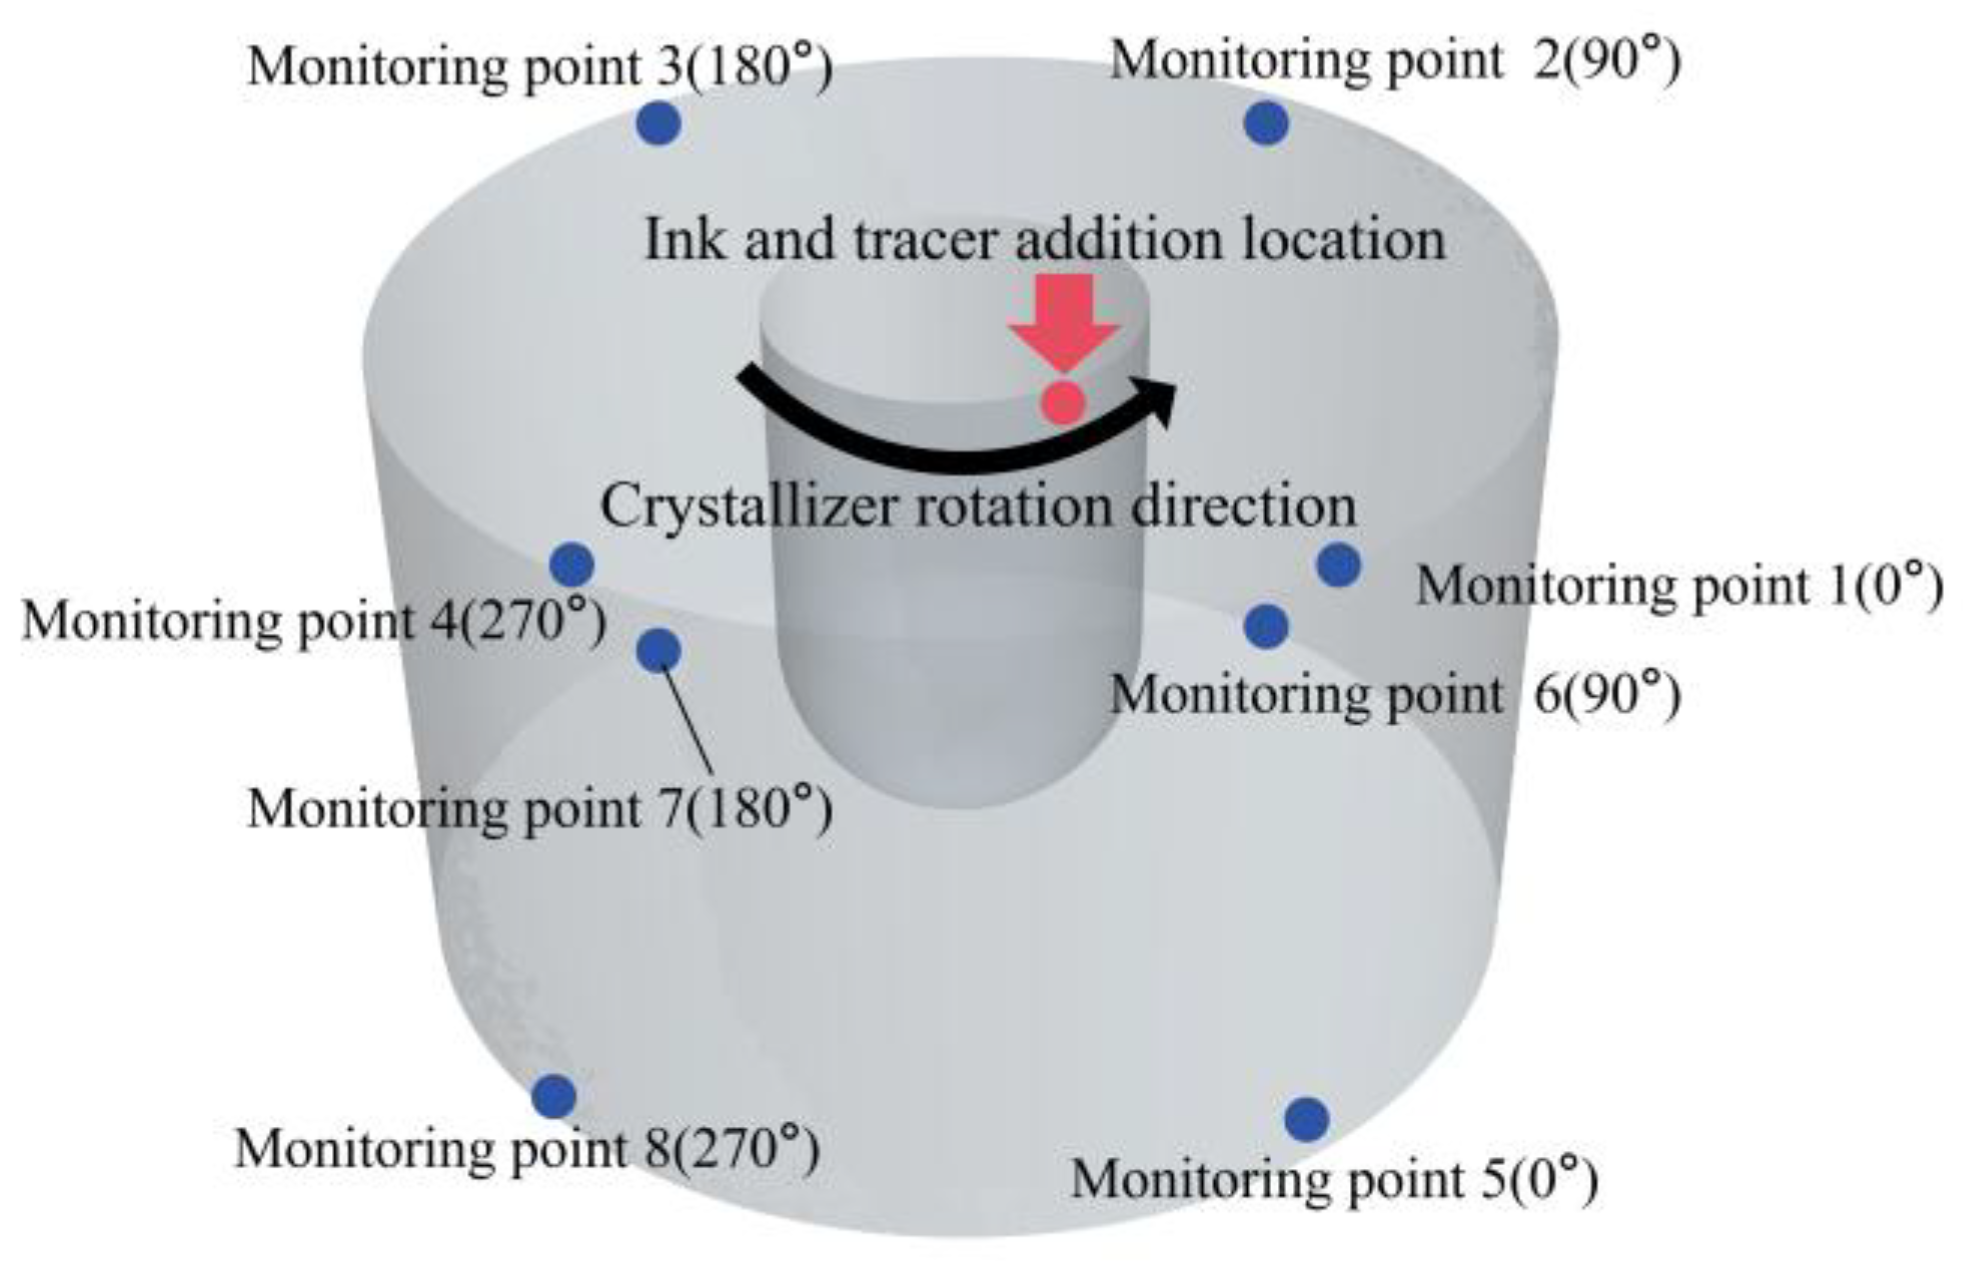
To visually trace the transport path of impurities remaining in the liquid phase near the crystallizer wall, a small amount of red ink was instantaneously added near the crystallizer wall after the flow field became stable. The specific addition location is shown in Figure 3. This method was used to compare the movement paths of the ink under different conditions. To ensure comparability, the same addition position, addition method, and filming angle were maintained for all conditions. Each set of experiments was conducted more than three times, and the macroscopic flow field transport diagrams were drawn based on the ink transport images.
Inside the crucible, the “stimulus-response” method was used to study the impact of the presence or absence of baffles on tracer transport. The improved tracer used in this study was prepared based on references [45,46,47], with a mixing ratio of 800 mL of water, 225 mL of ethanol, and 47.34 g of KCl (The density of the improved tracer was measured to be 1004 kg/m3). The modified tracer was added using a syringe, with 10 mL of the improved tracer injected each time. When performing the experiment using the stimulus-response method, the conductivity information was collected using a DDSJ-308A conductivity meter and a DJS-1D conductivity probe manufactured by Shanghai Instrument Factory.
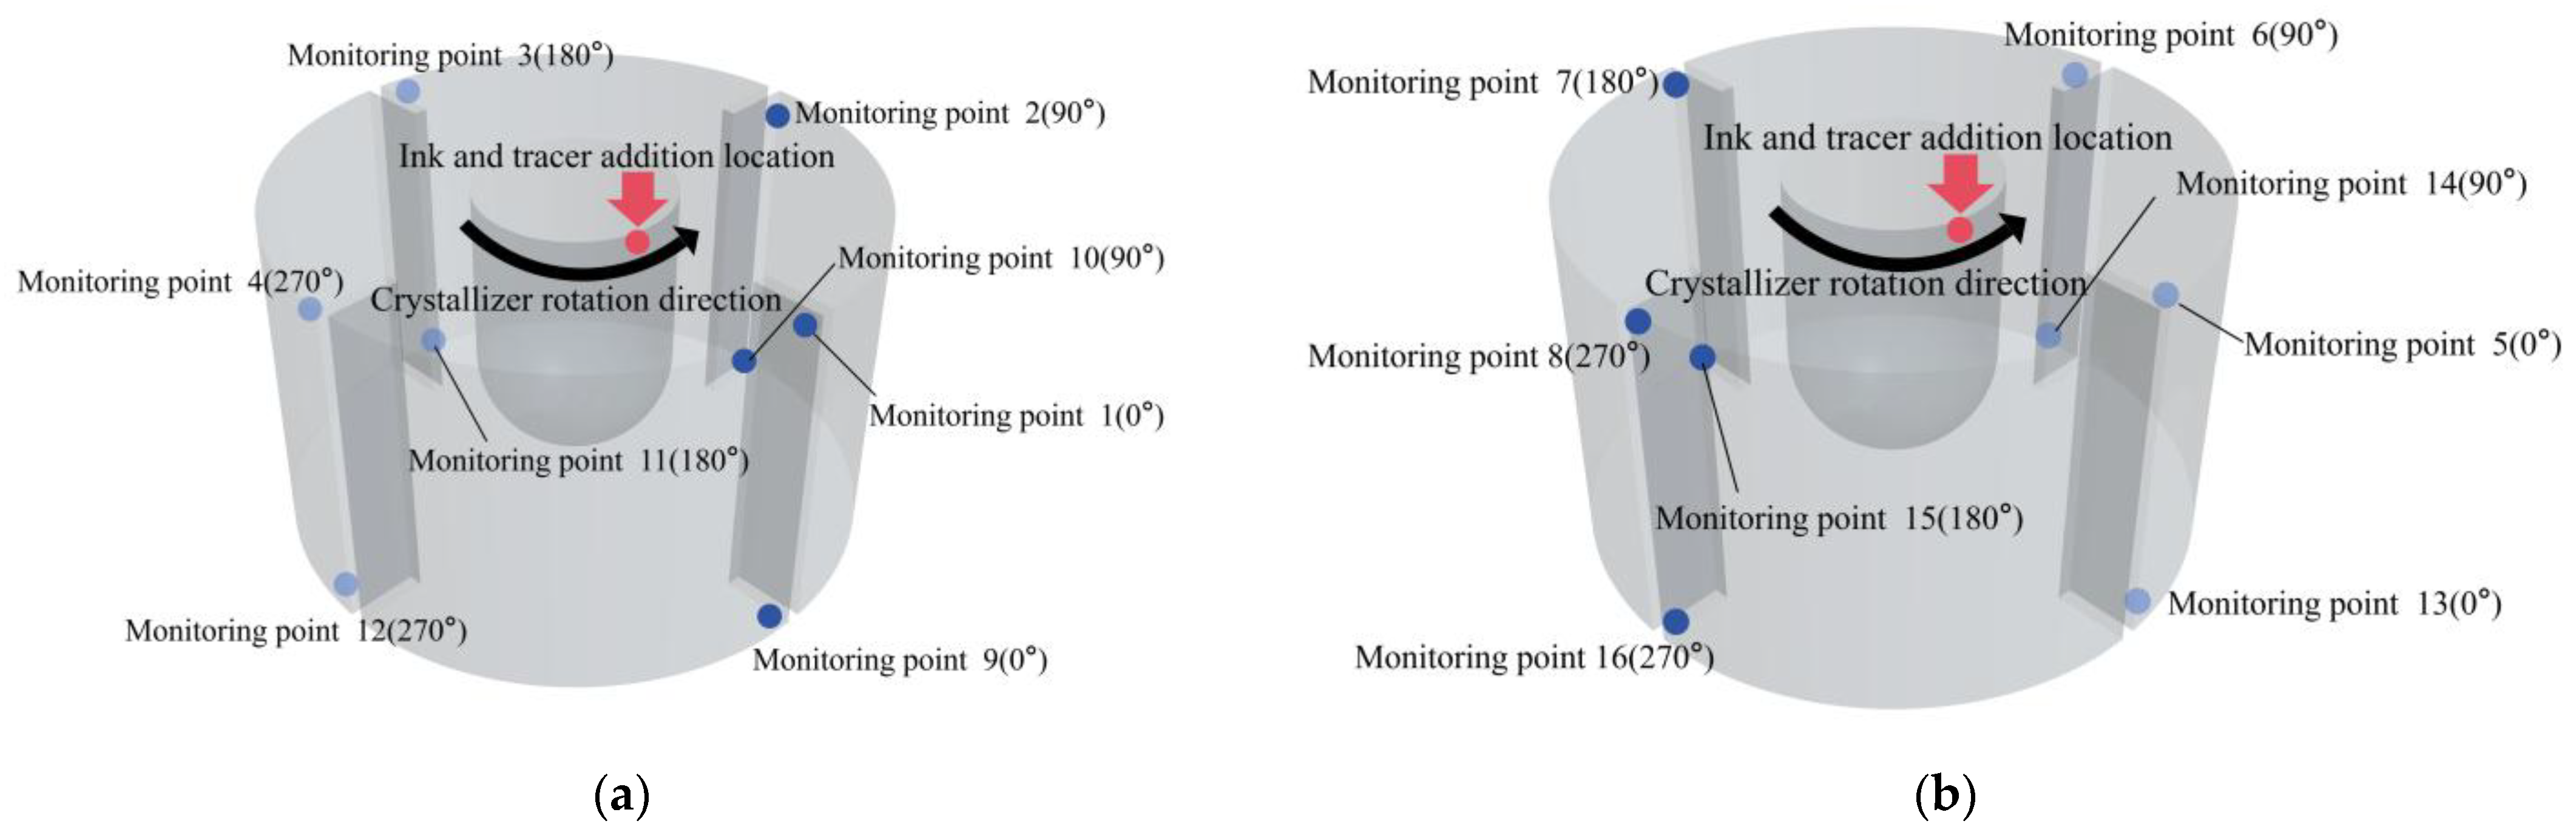
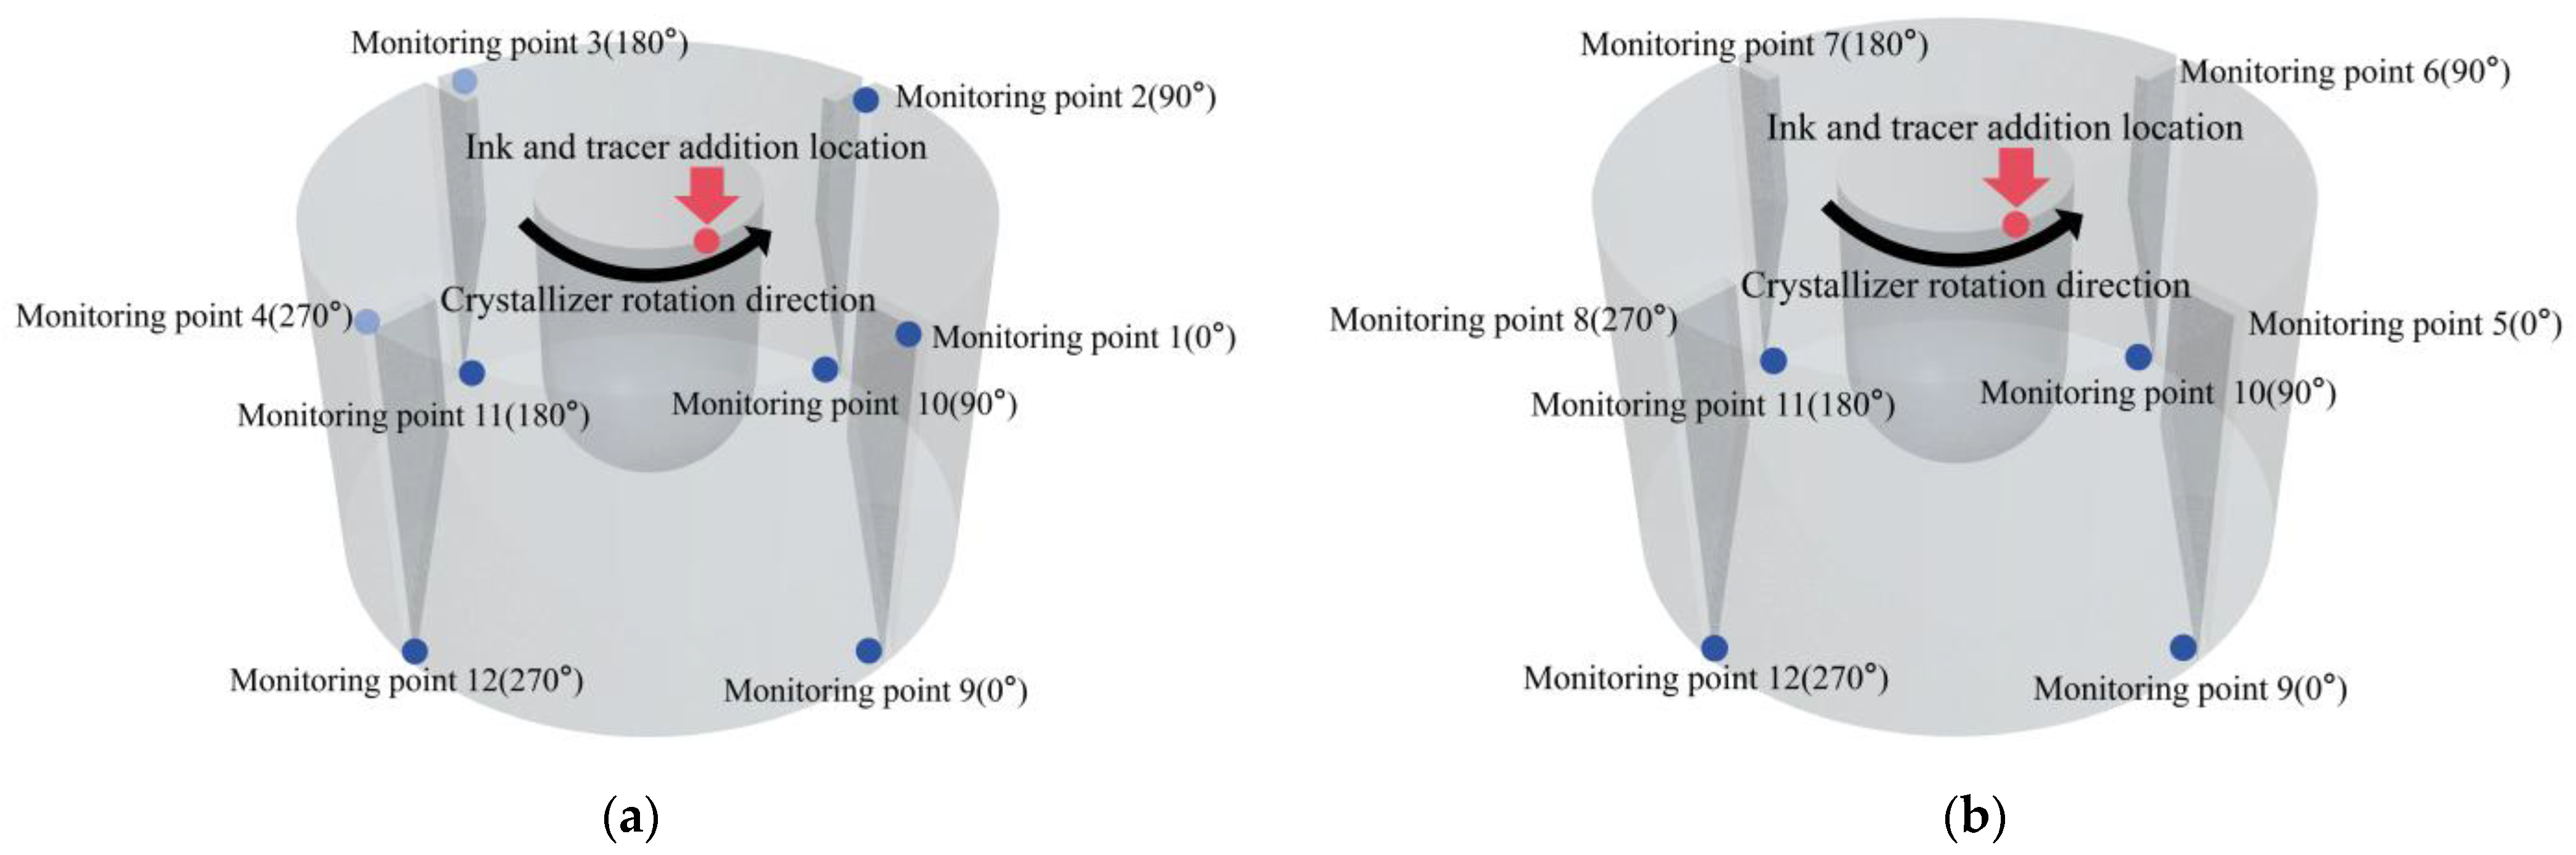
After the flow field inside the crucible stabilized, the tracer was added near the crystallizer wall, as shown in Figure 3, and the conductivity values at different positions inside the crucible were monitored in real time using a conductivity meter. Under the no-baffle condition, 8 monitoring points were set inside the crucible, with 4 points each at the liquid surface and the bottom of the crucible, as shown in Figure 3. Under the straight baffle installation condition, 16 monitoring points were set, located in front and behind the baffles at both the liquid surface and the bottom of the crucible, as shown in Figure 4. Under the inclined baffle installation condition, 12 monitoring points were set, also located in front and behind the baffles at both the liquid surface and the bottom of the crucible, as shown in Figure 5. The measured conductivity values were converted into tracer concentrations in the solution. The experiments were repeated more than three times, with each trial lasting 150 s. Dimensionless tracer concentration curves were used to analyze the flow characteristics.
In the mixing-time analysis, to eliminate the effects of differences in initial conductivity, tracer addition amount, and sensor response under different experimental conditions, the tracer concentration signals obtained at each monitoring point were converted into dimensionless form. In this study, the stable concentration after complete mixing was taken as the reference concentration, and the instantaneous concentration at each monitoring point was normalized into a dimensionless concentration, expressed as:
C i * ( t ) = C i ( t ) C 0 C C 0
where C i * ( t ) is the dimensionless concentration at monitoring point i at time t; C i ( t ) is the instantaneous tracer concentration at that monitoring point; C 0 is the initial background concentration of the system before tracer addition; and C is the stable concentration after the tracer is completely mixed in the vessel, namely the reference concentration. Since the concentration of the salt solution tracer is approximately linearly related to conductivity within the experimental range, the conductivity signal can be directly used for normalization in the actual data processing, as expressed by:
C i * ( t ) = k i ( t ) k 0 k k 0
where k i ( t ) is the conductivity at monitoring point i at time t, k 0 is the initial conductivity before tracer addition, and k is the average conductivity during the stable stage after complete mixing. After normalization, the dimensionless concentration approaches 1 under the fully mixed state. Therefore, in this study, the criterion for complete mixing was defined as the time when the dimensionless concentration entered and remained within the range of 1 ± 0.05, and this time was defined as the mixing time [48,49,50].

3. Results

3.1. Experimental Error Analysis

Followed by the research by Li et al. [51], to further verify the repeatability and reliability of the experimental results, repeated tracer-response experiments were conducted at monitoring point 1 under three typical conditions, and the results are presented in Appendix A. The three conditions were the no-baffle, straight-baffle, and inclined-baffle cases, and three repeated experiments were carried out for each condition. Since the tracer concentration curves investigated in this study are transient response curves that vary continuously with time, adding error bars at every time point would lead to severe overlap among the curves and would reduce the readability of the peak variation, decay process, and mixing-time determination. Therefore, point-by-point error bars were not directly added to the main figures in the text. Instead, the experimental error and result repeatability were characterized by comparing the three repeated concentration curves and their corresponding mixing times in Appendix A.

3.2. Flow Behavior and Mixing in the Crucible Without Baffles

3.2.1. Flow-Field Transport Process Inside the Crucible Under the No-Baffle Condition

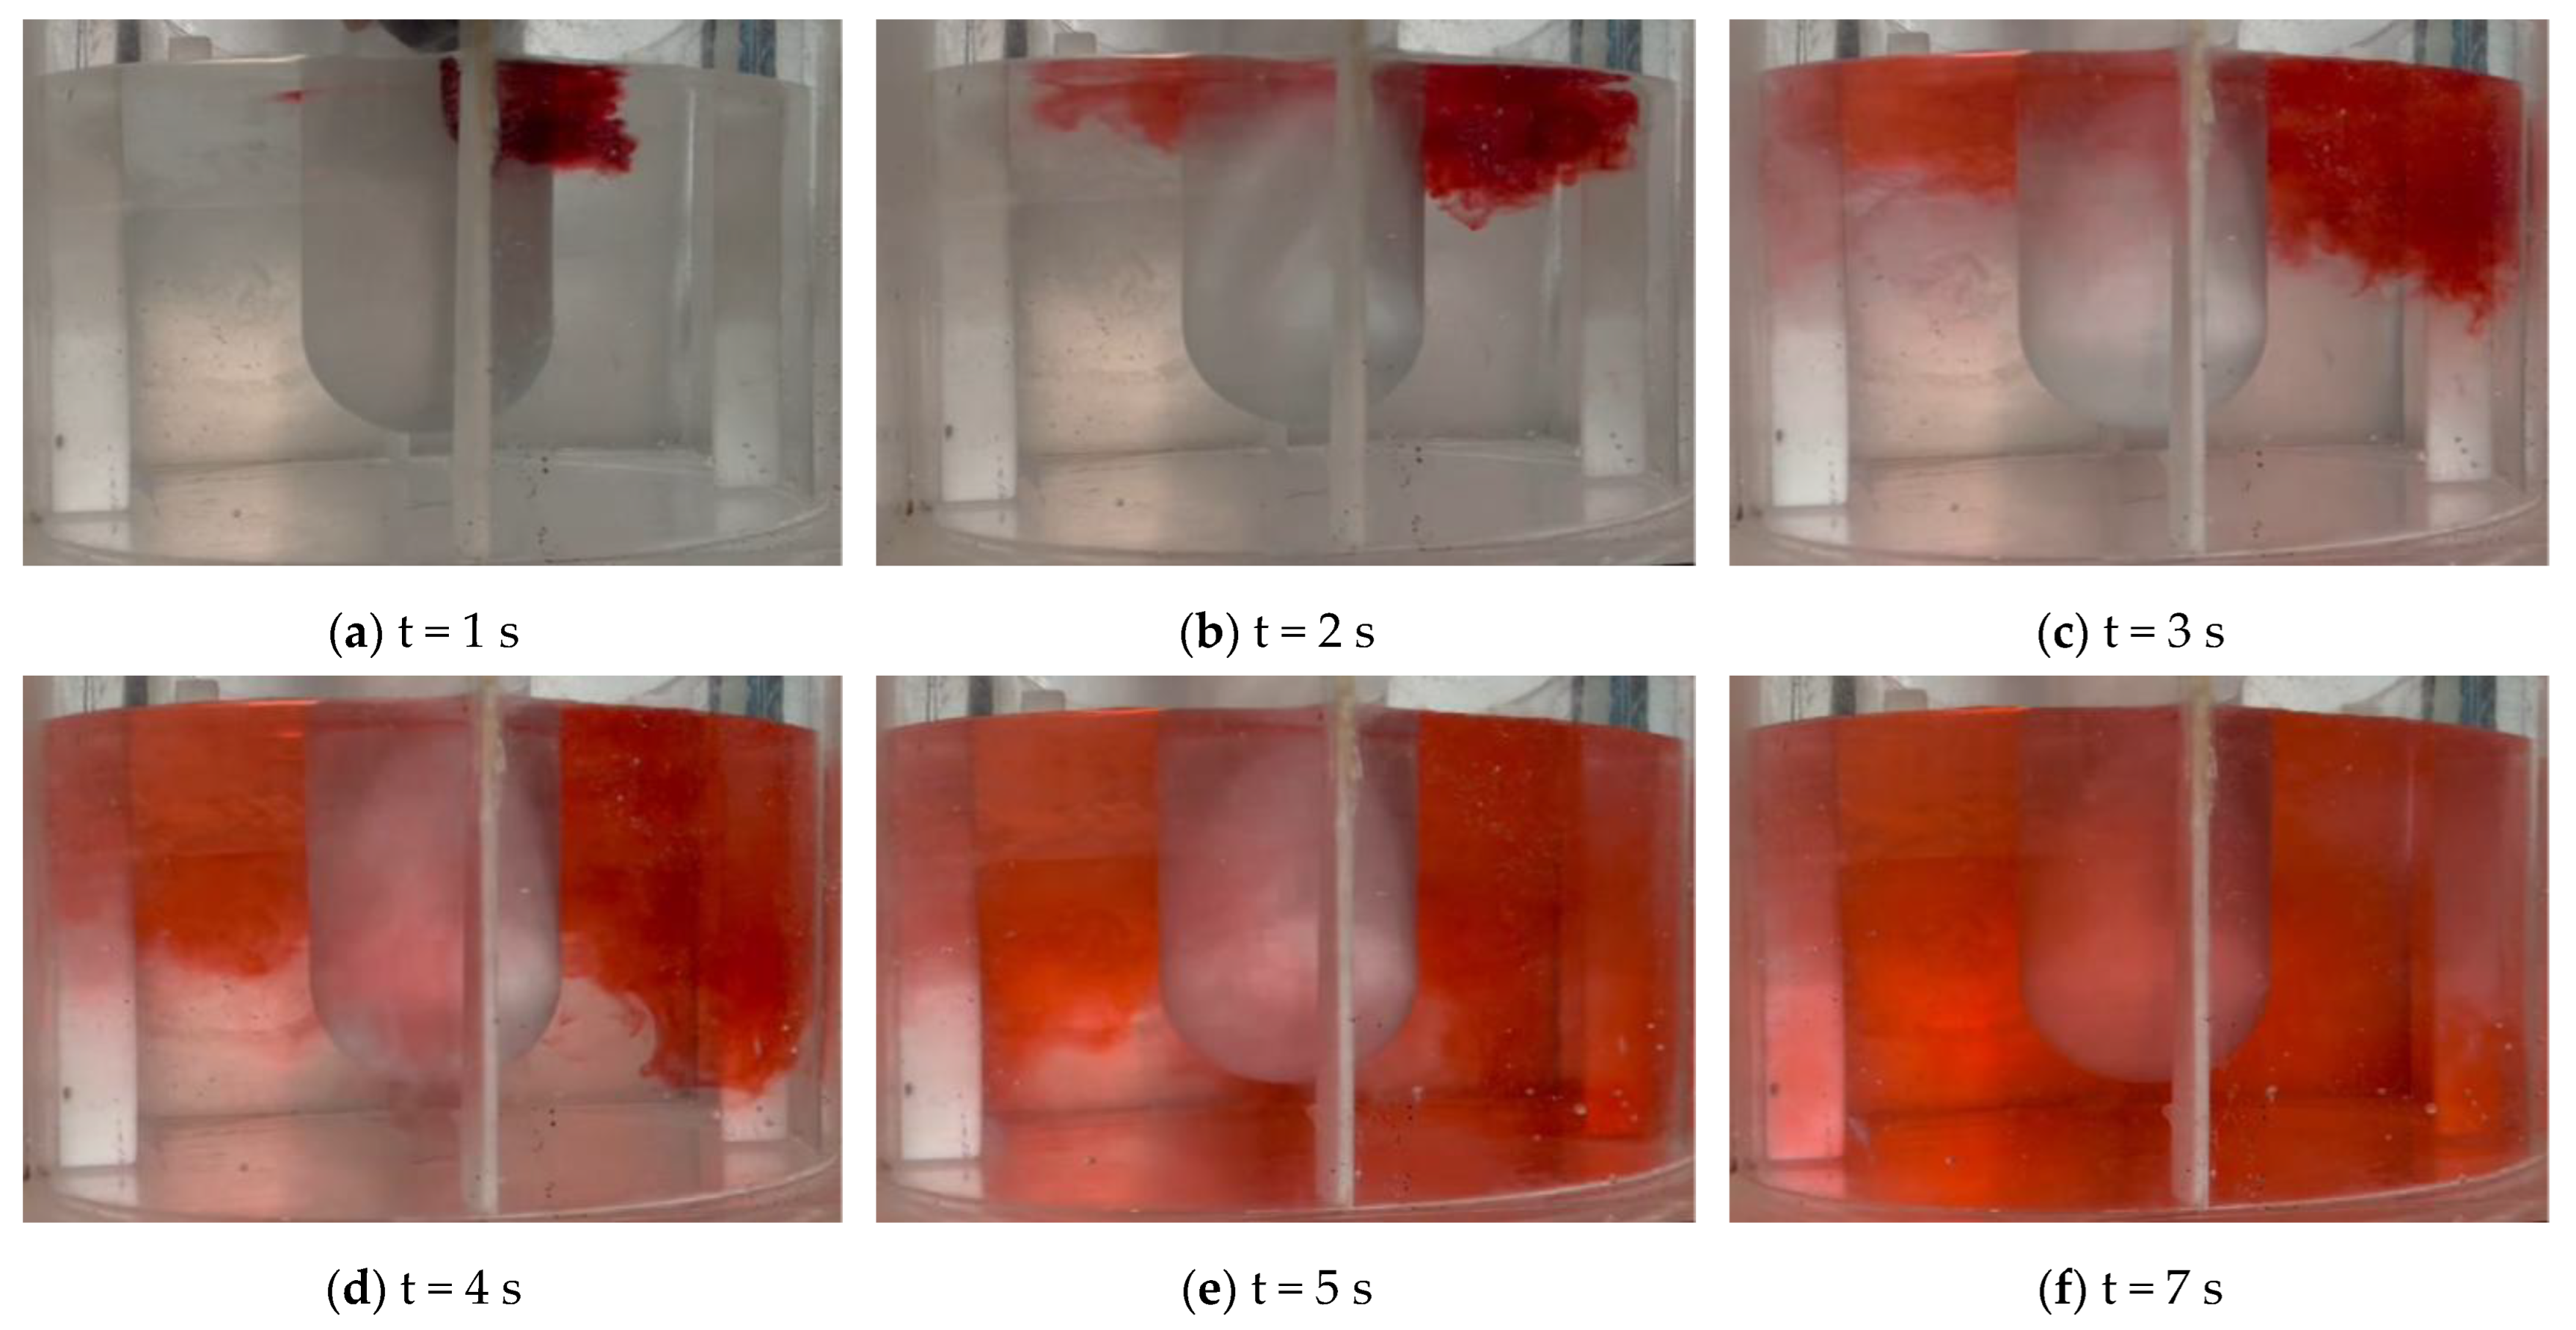
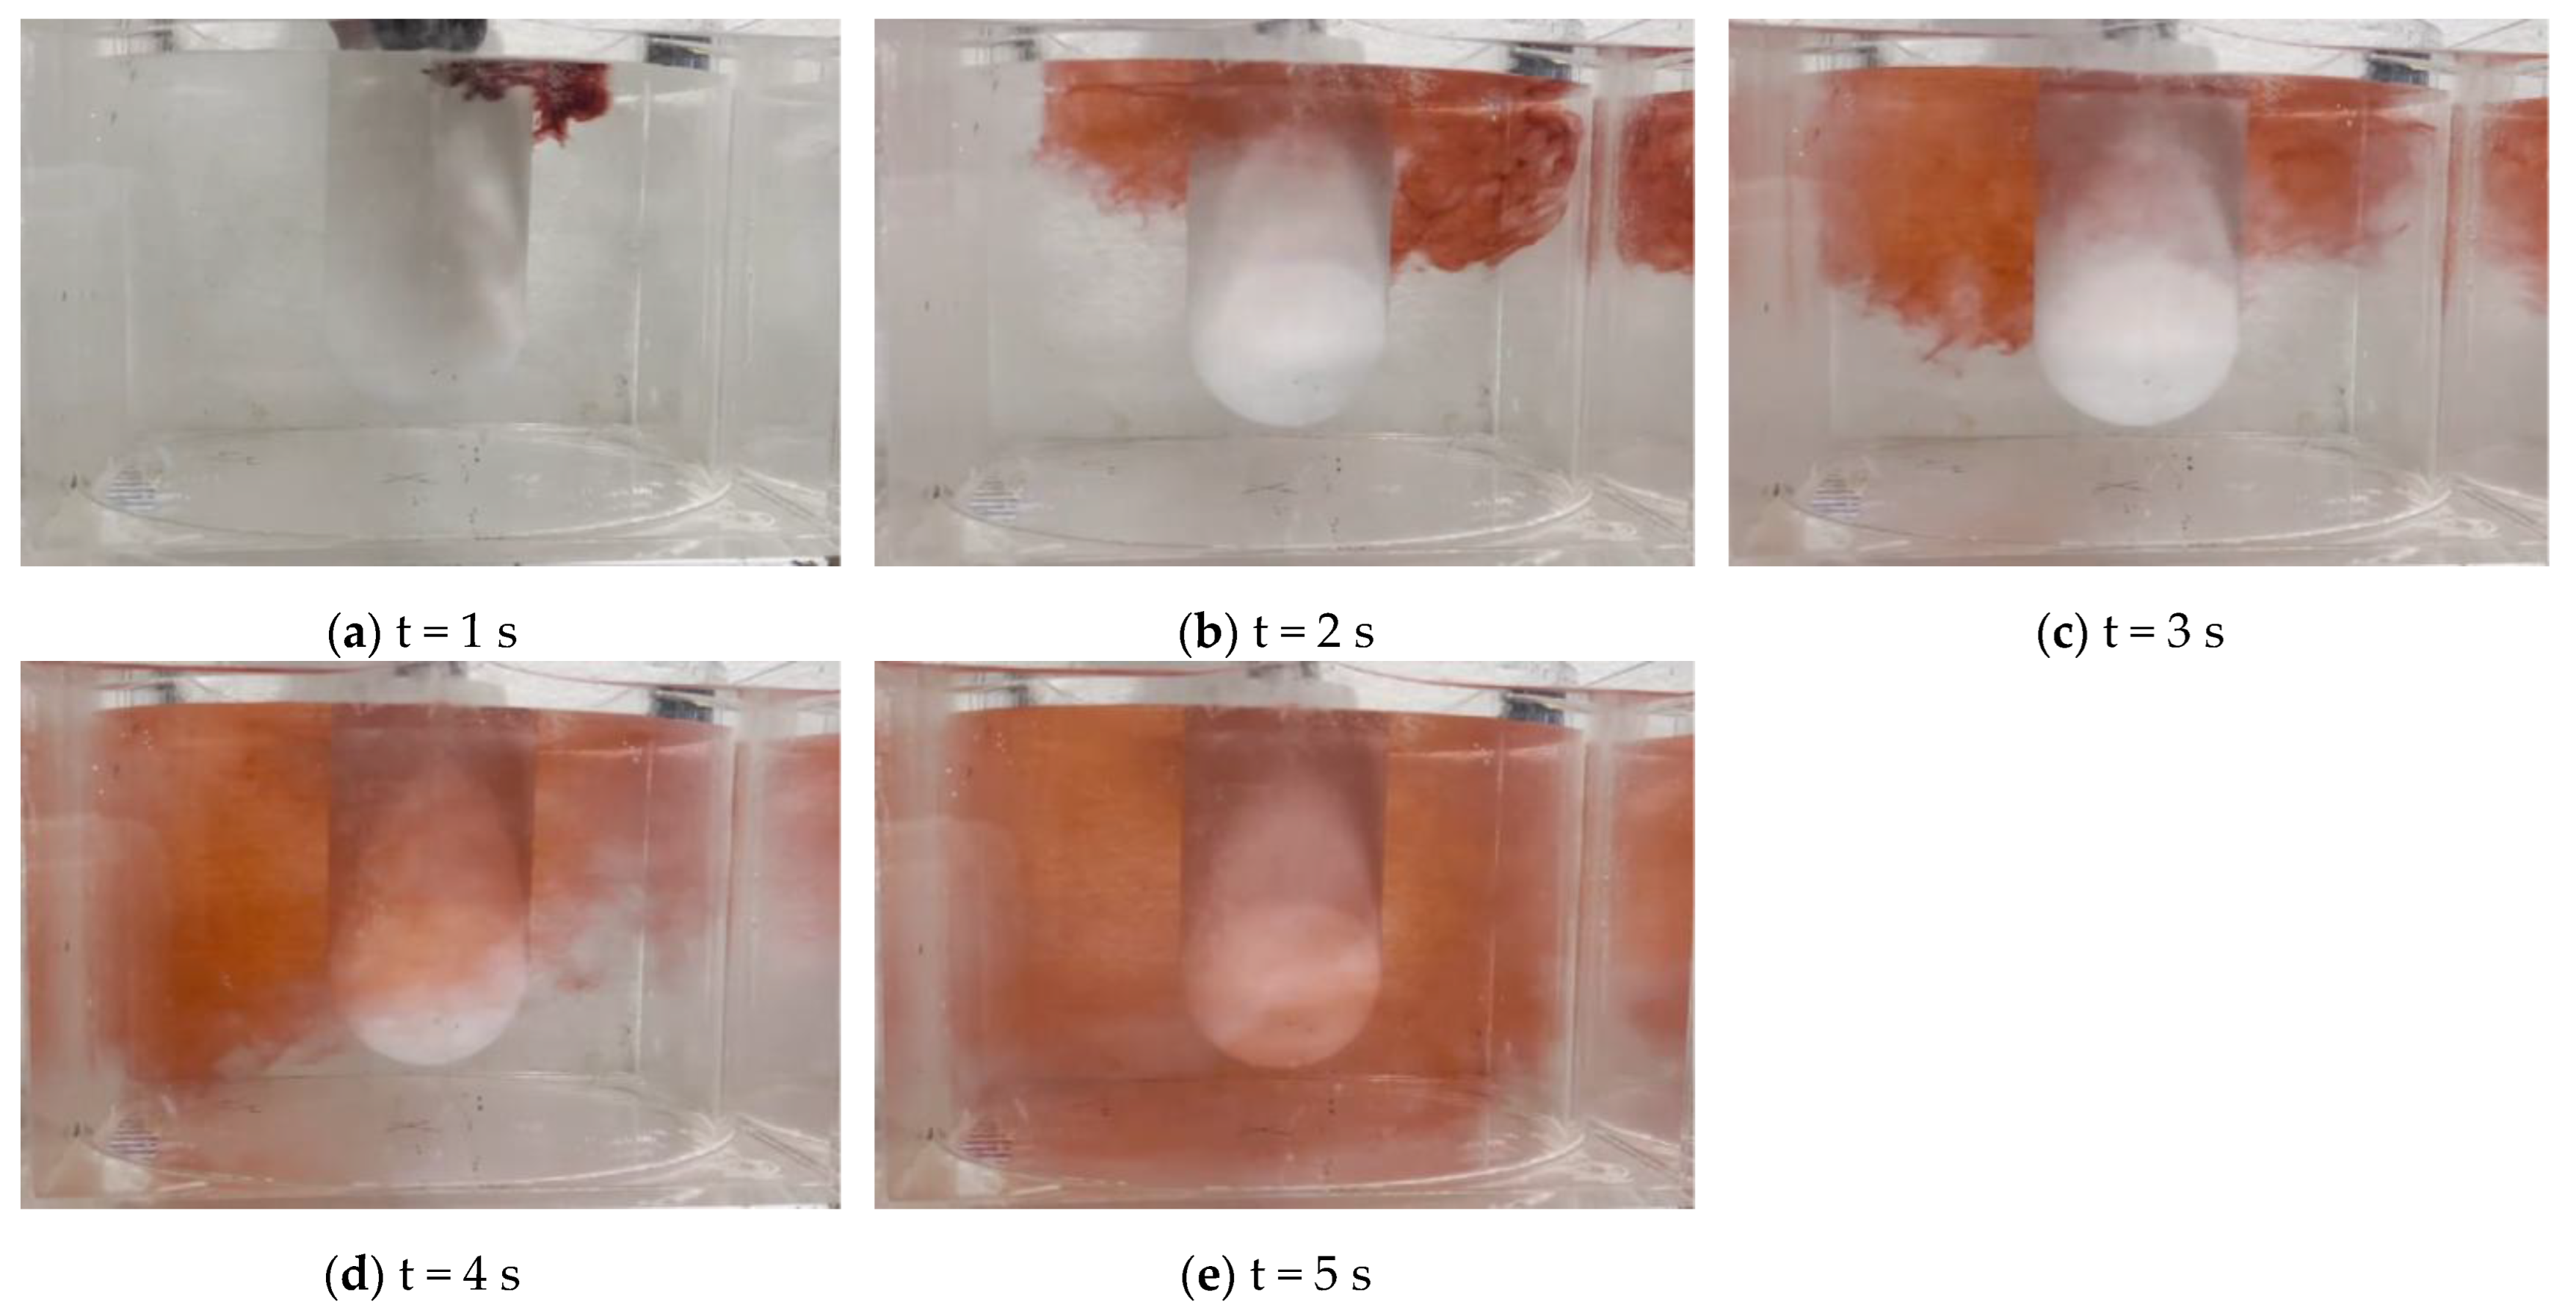
Under the no-baffle condition, the ink transport process is shown in Figure 6. At 1 s, after the ink was added near the crystallizer surface, it was immediately thrown out in the direction of crystallizer rotation. At 2 s, the ink had already spread over the entire upper free surface and continued to diffuse downward. At 3 s, due to the rotation of the crystallizer, a large amount of ink was transported to the left side of the image and moved obliquely downward. At 4 s, the ink had reached the crucible bottom on the left side of the crystallizer, and at this time, ink was present only in the upper-middle region on the right side of the crystallizer. At 5 s, the ink on the left side was carried to the right side by the rotation of the crystallizer, and the crucible was almost completely filled with red ink.
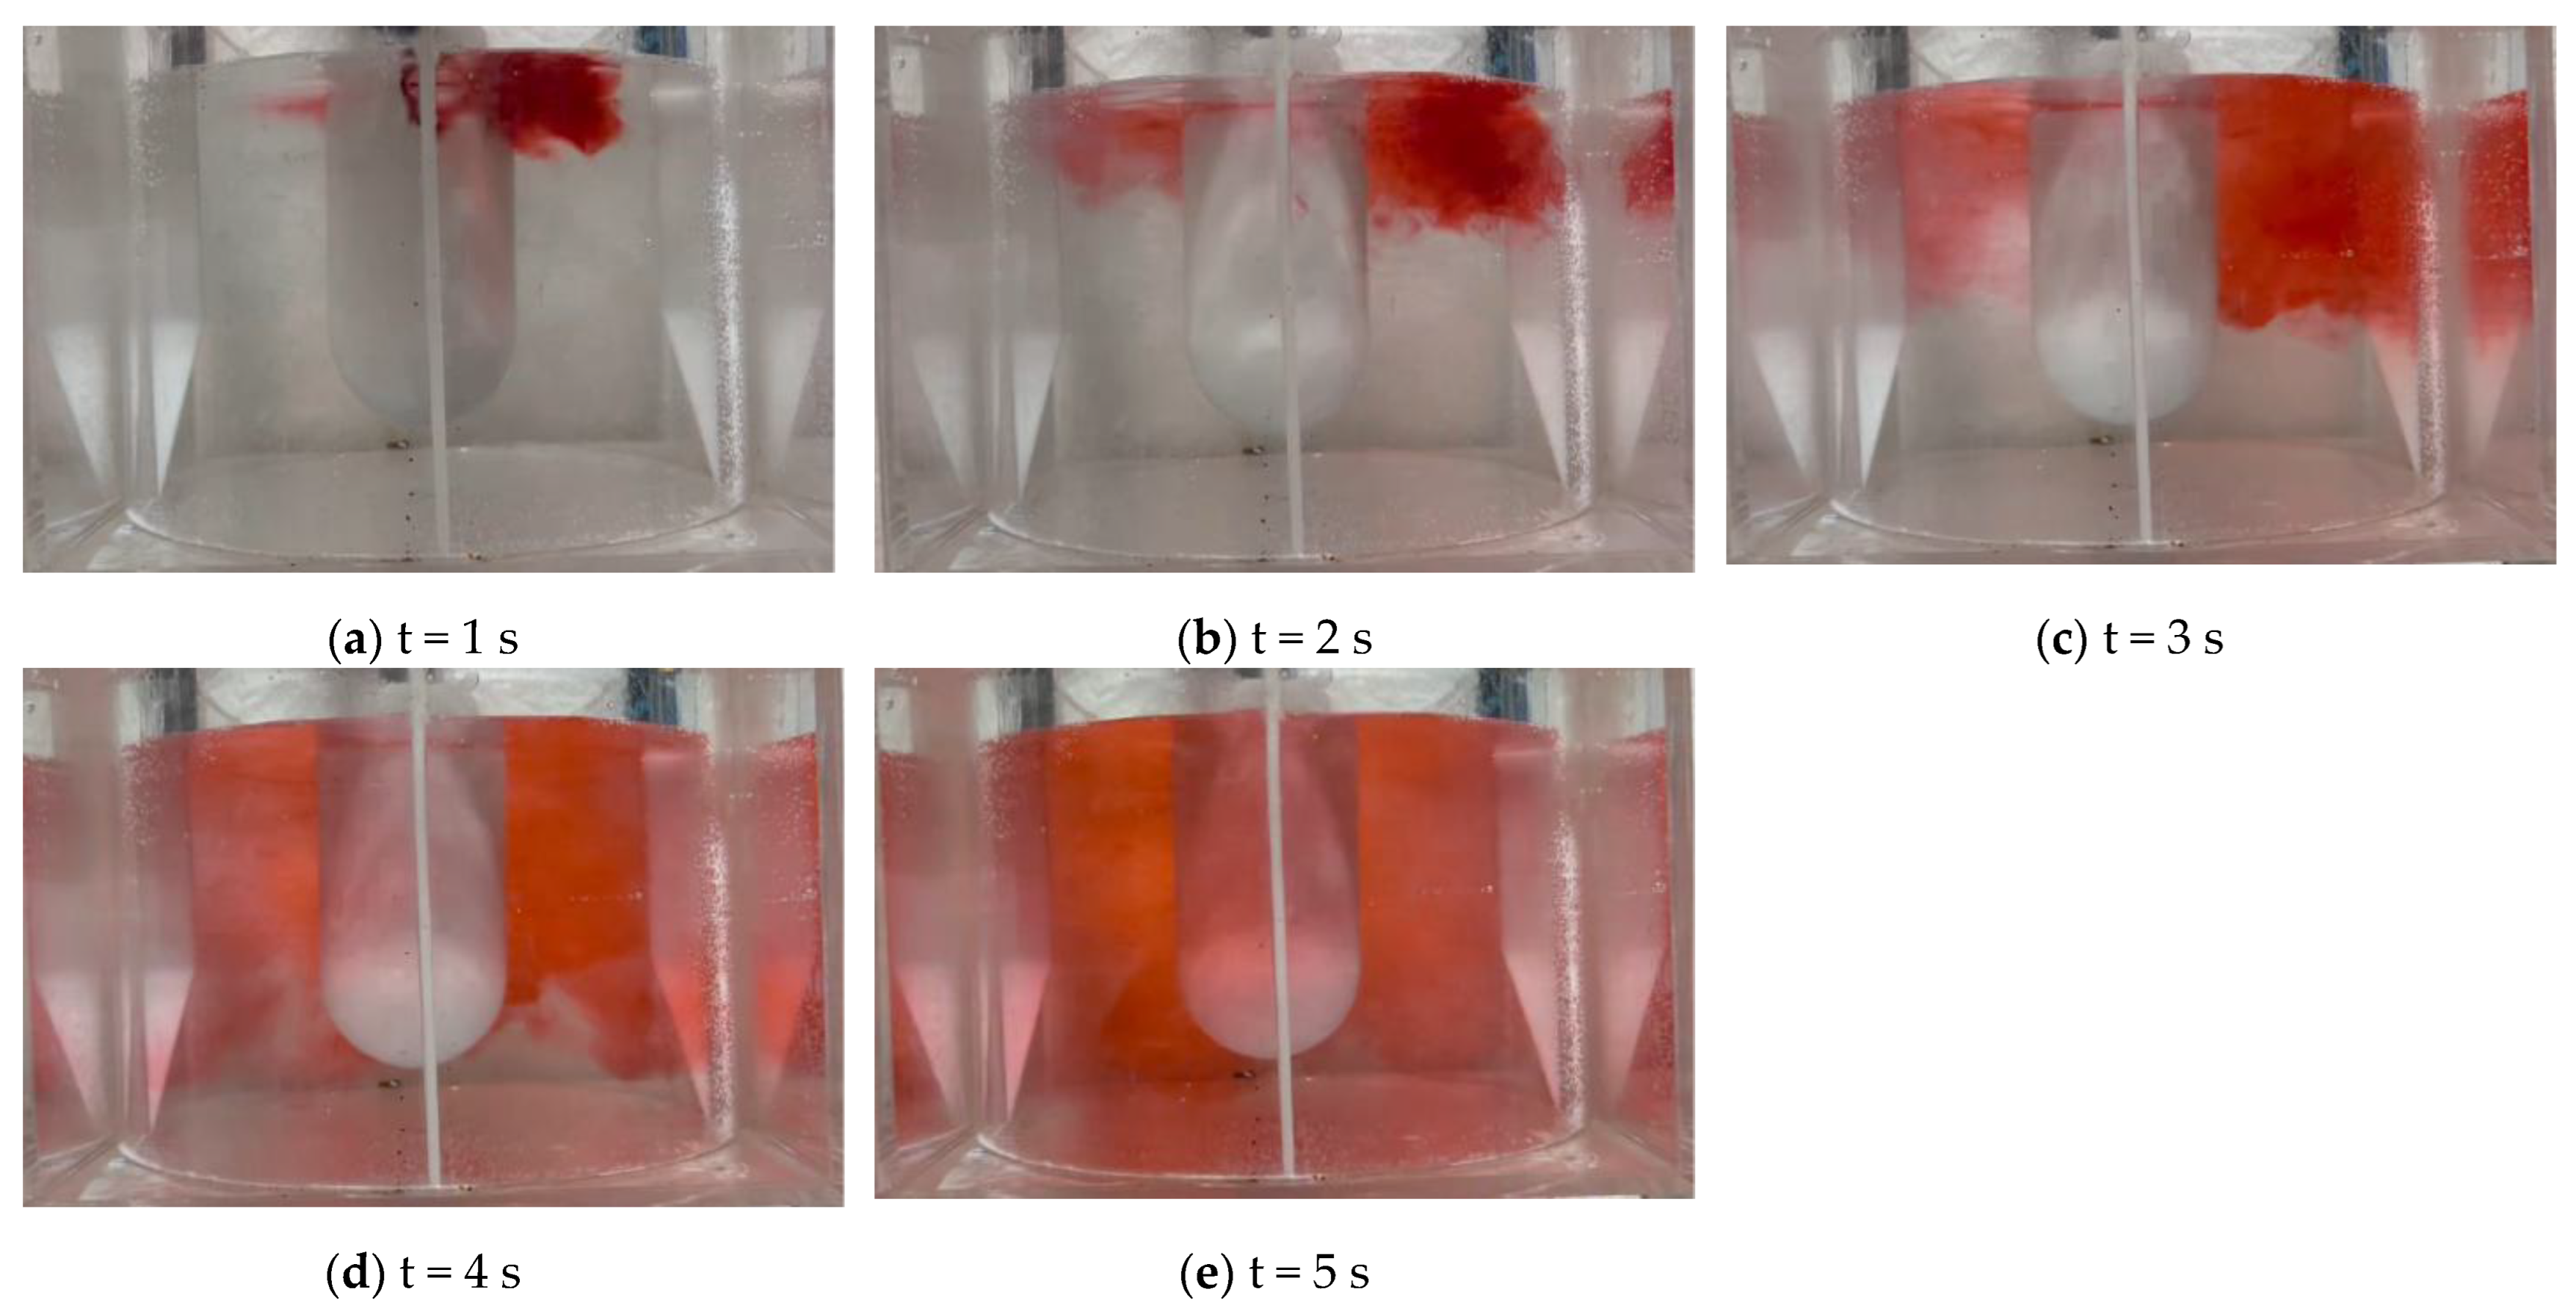
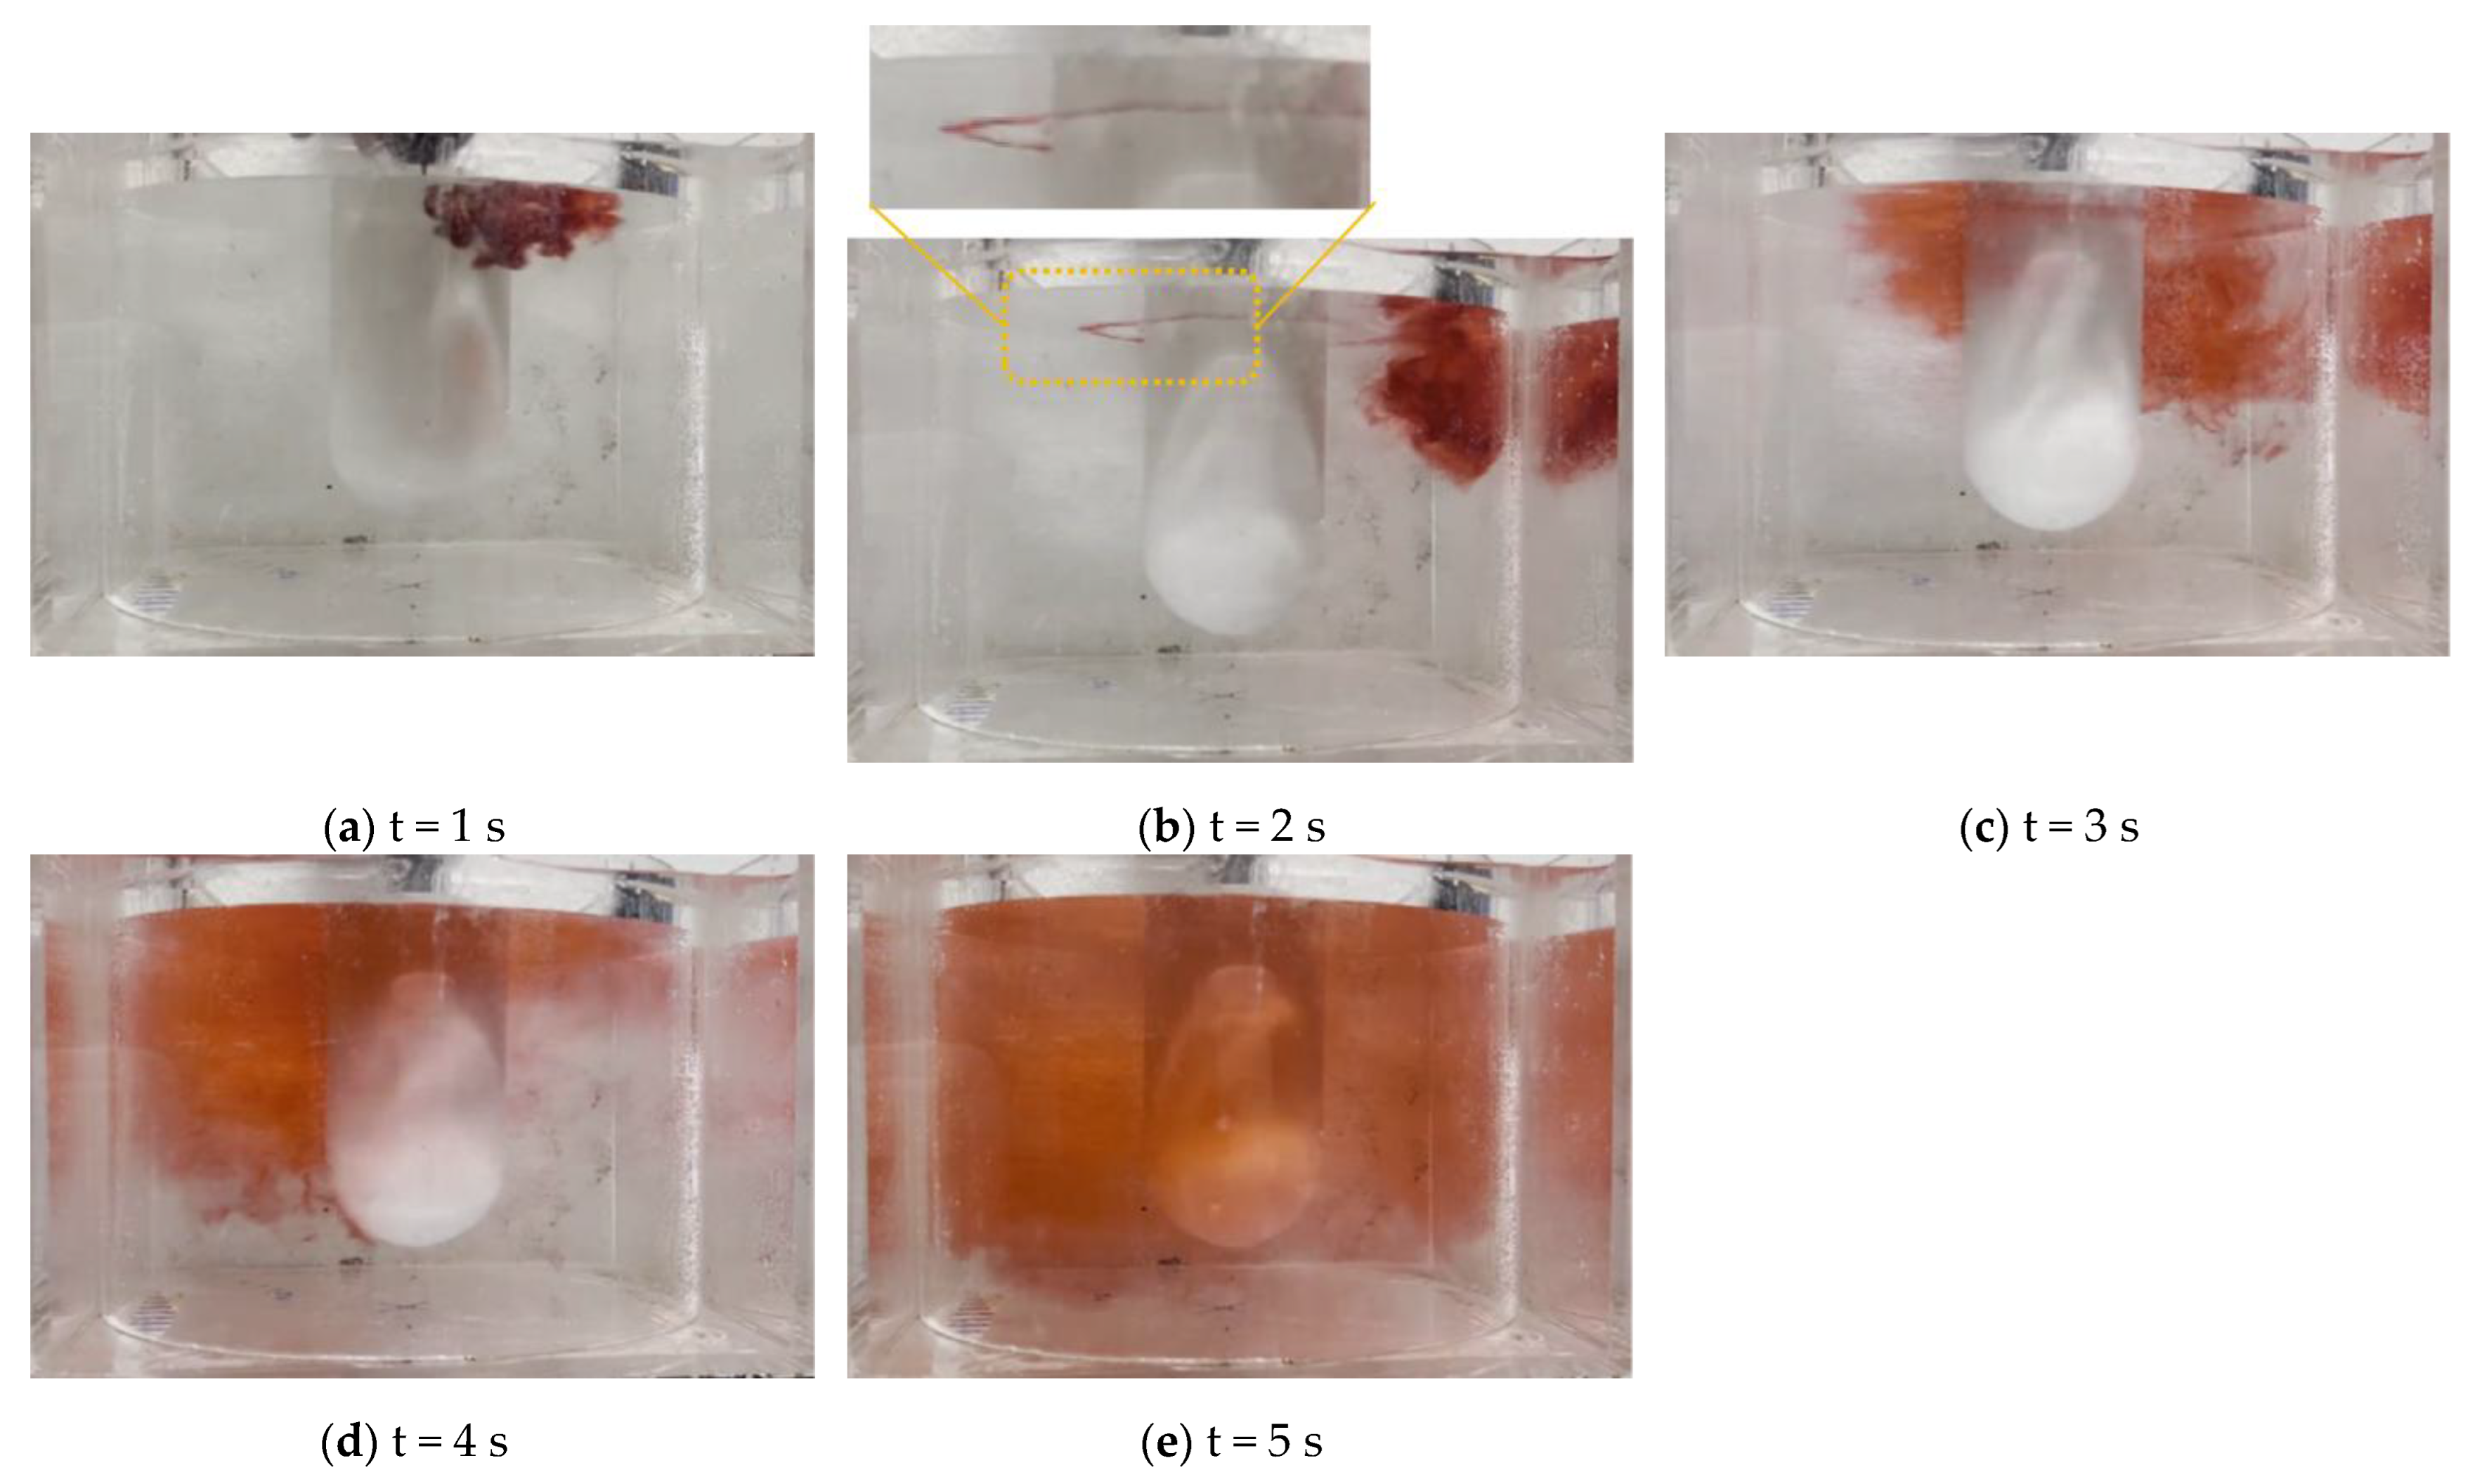
As shown in Figure 7, the ink transport process at a crystallizer rotational speed of 300 rpm is presented. At this rotational speed, the ink transport behavior differs from that at 200 rpm. At 1 s, after being added near the crystallizer surface, the ink was thrown outward by the centrifugal force generated by crystallizer rotation. At 2 s, the ink separated into two streams. One stream, consisting of a small amount of ink, formed a circular flow along the rotational direction of the crystallizer at the liquid surface, but it was not close to the crystallizer surface and instead remained at a certain distance from it, as shown in Figure 7b. The other, larger portion of the ink was thrown toward the crucible wall and, after contacting the wall, diffused downward under the combined effects of gravity and wall confinement. At 3 s, the ink near the crystallizer wall was drawn back toward the crystallizer surface and appeared on the left side of the image close to the crystallizer wall, while the ink on the right side continued to diffuse downward. At 4 s, a large amount of ink accumulated on the left side of the crucible, indicating that the ink moved together with the crystallizer rotation. At 5 s, the ink on the left side was carried by the crystallizer rotation into the next circulation loop and entered the right side of the crystallizer. At this moment, the entire crucible was almost completely filled with red ink.
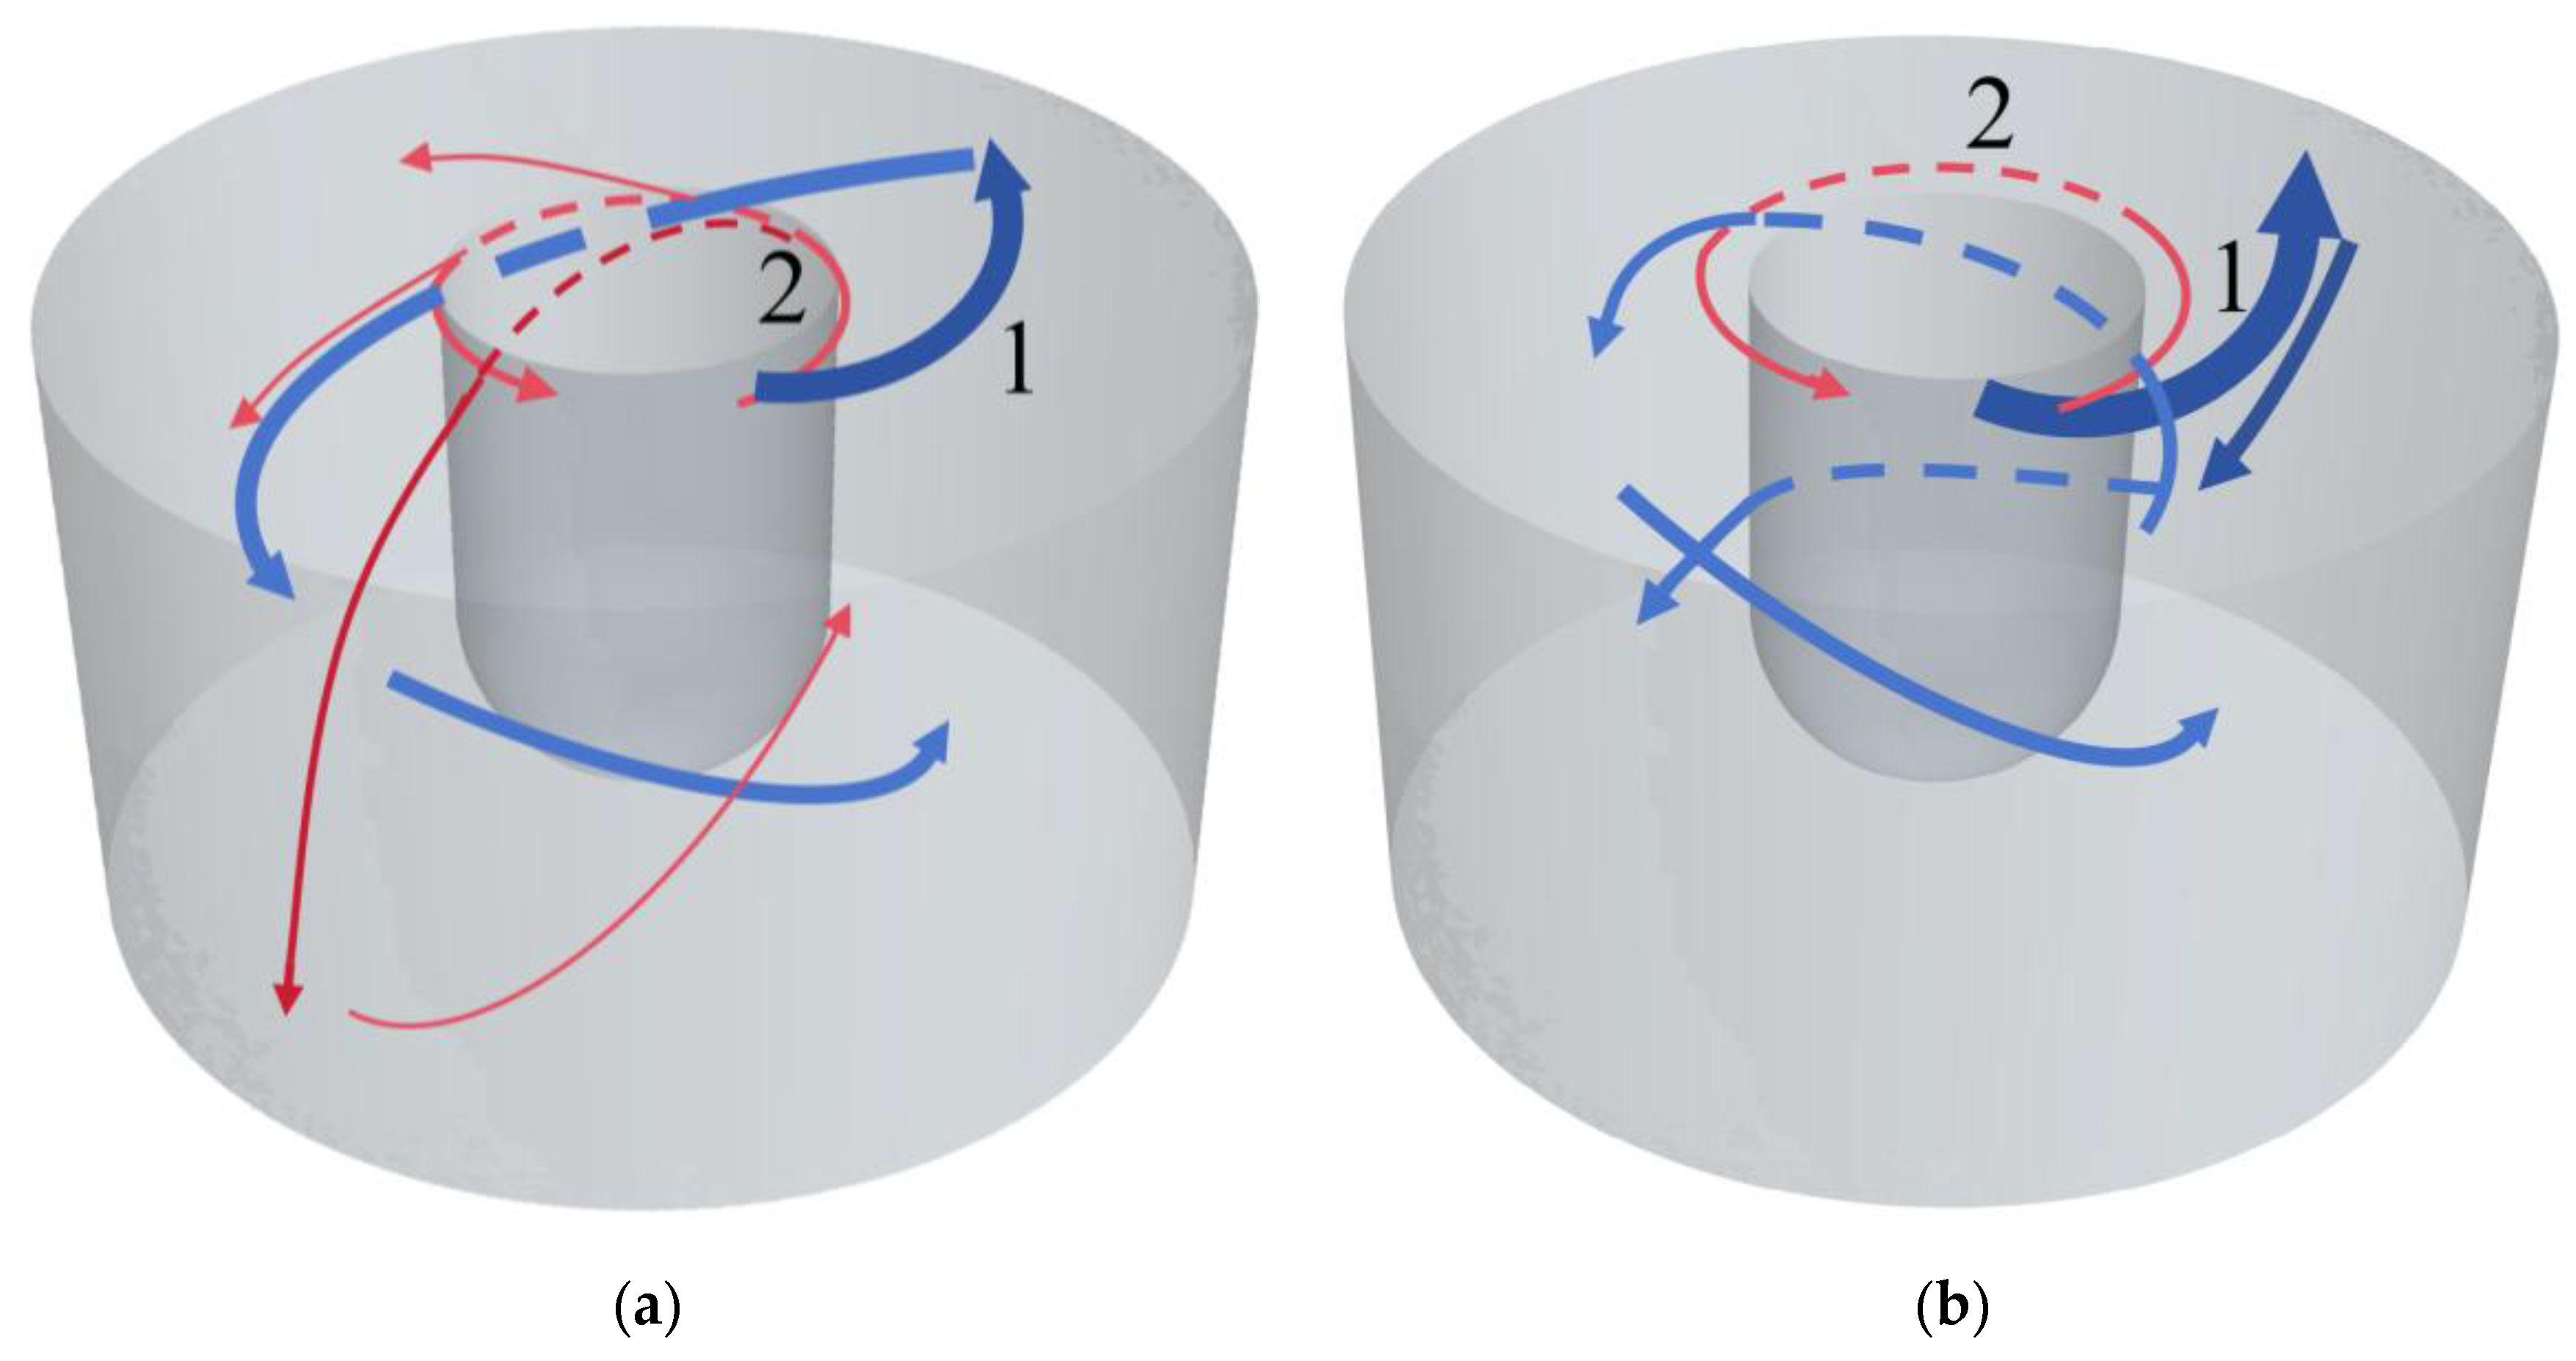
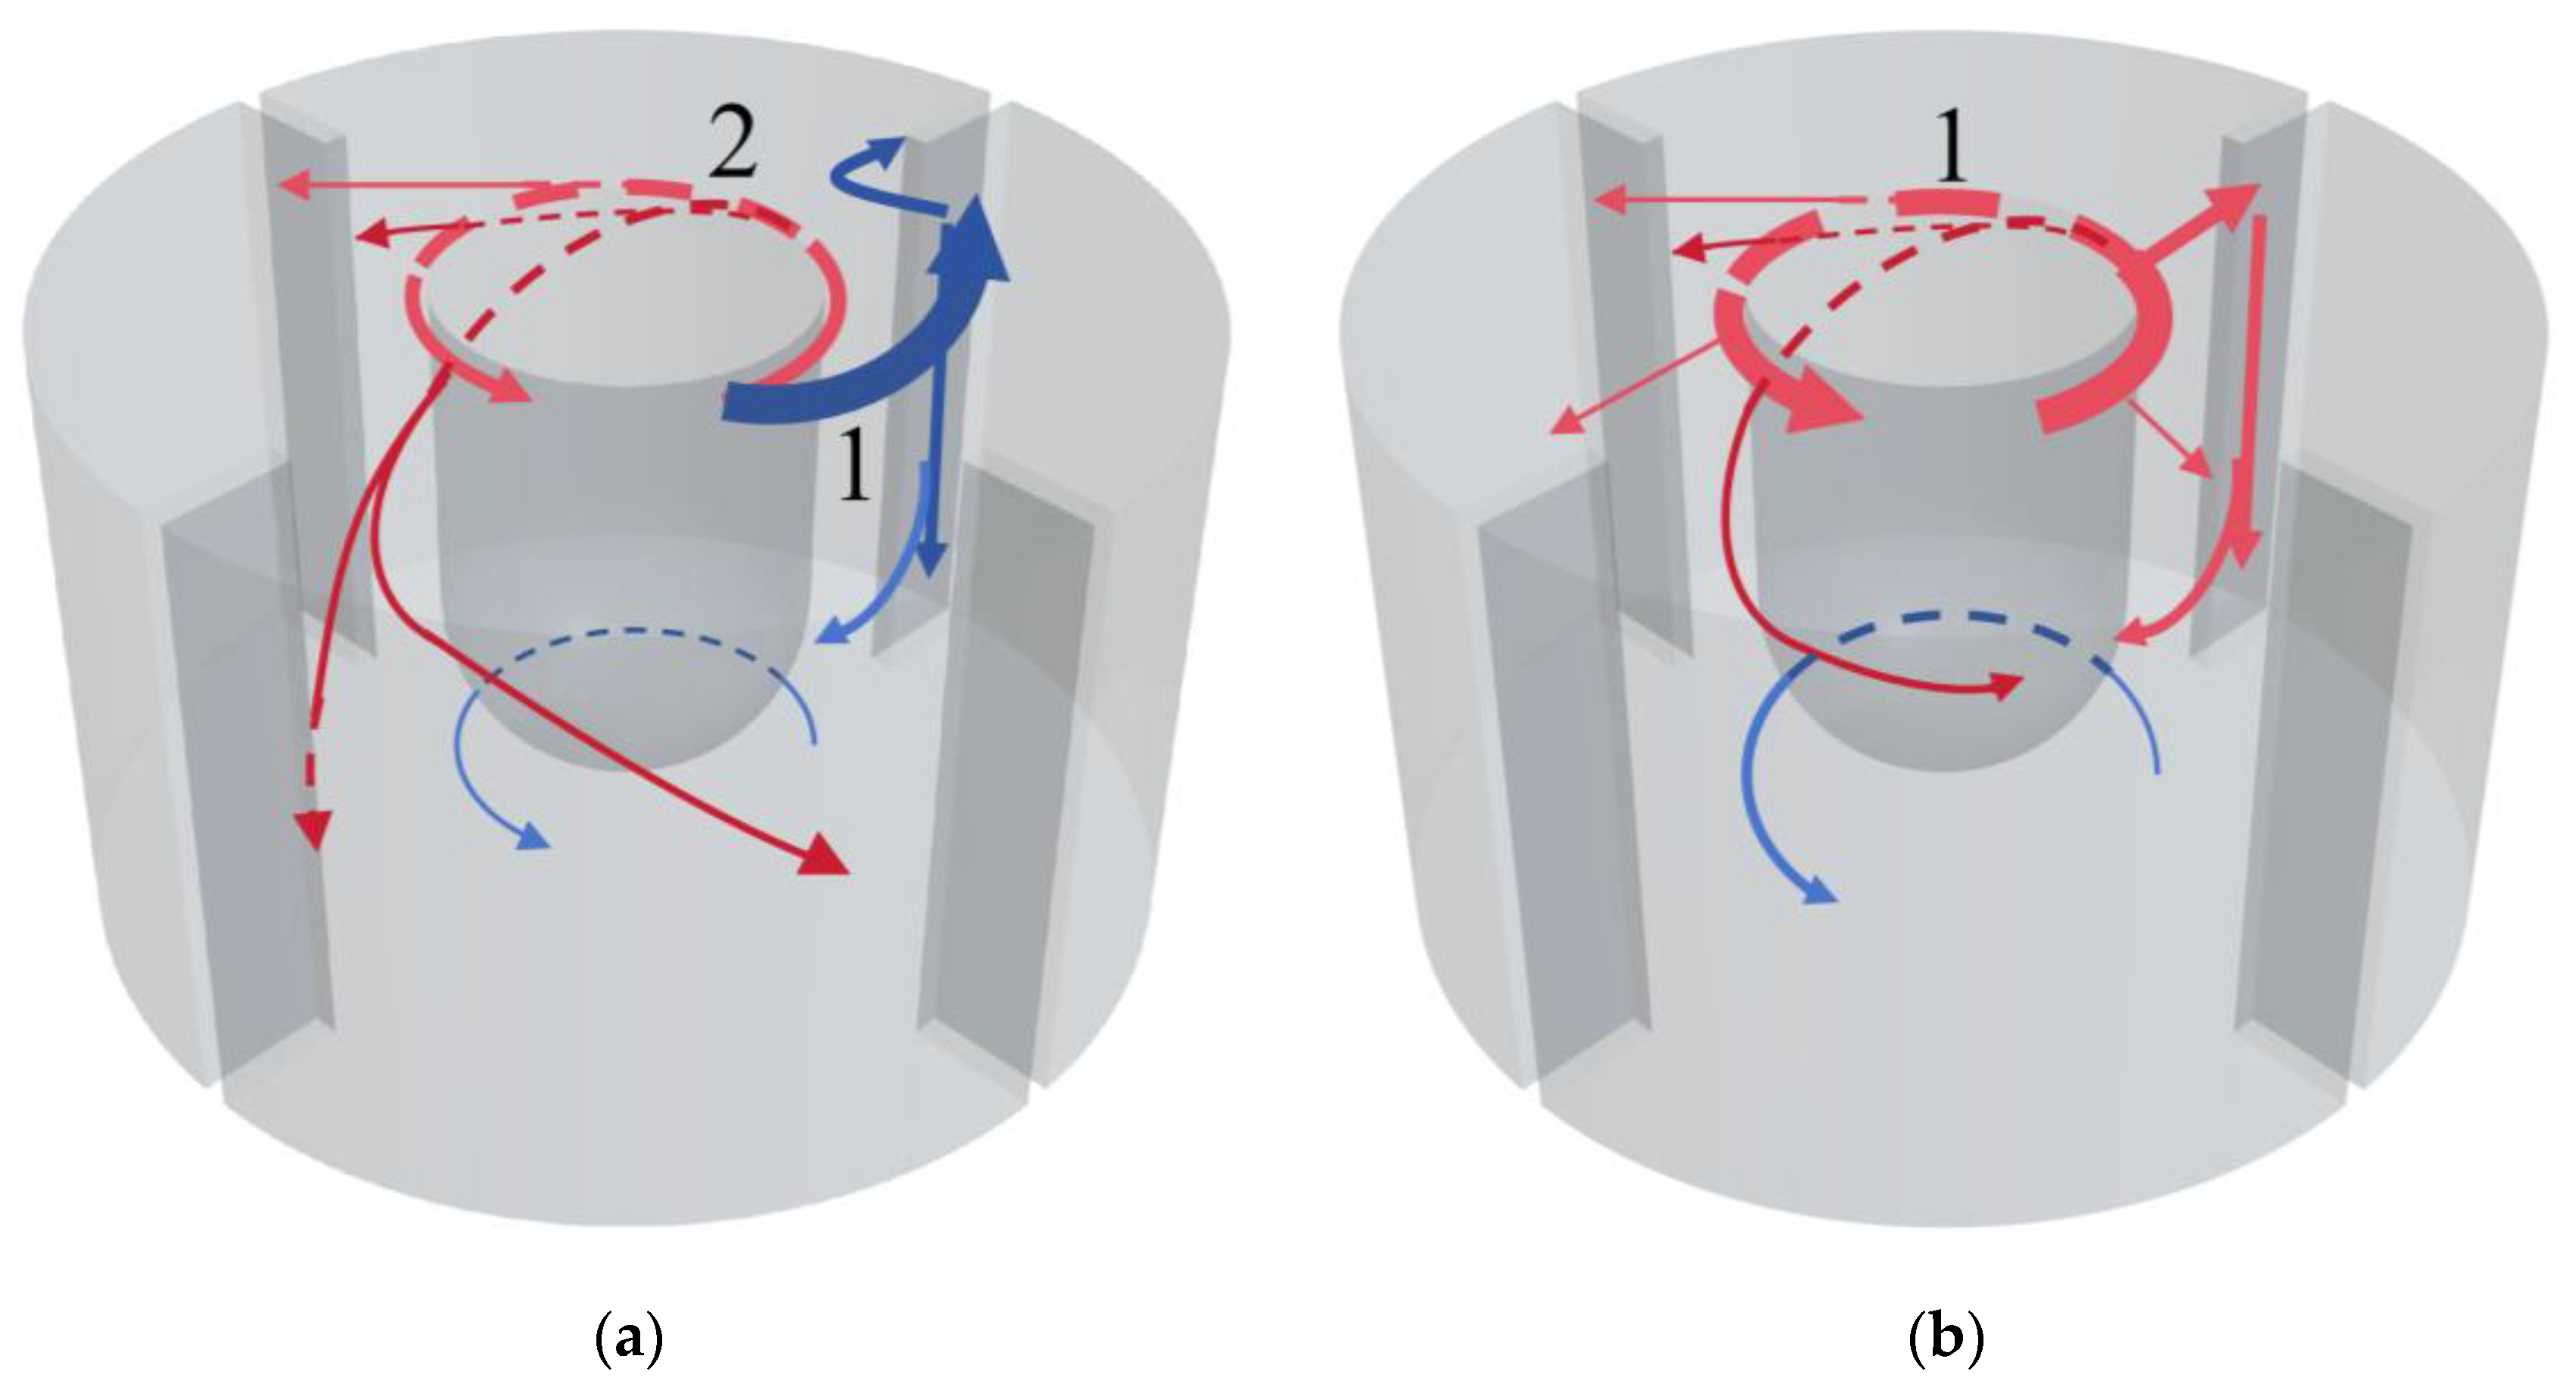
As shown in Figure 8, the flow-field transport schematics obtained from the visualization experiments at crystallizer rotational speeds of 200 rpm and 300 rpm are presented. In the figure, The numbers represent the quantity of mainstream streams, solid lines represent the visible flow trajectories, whereas dashed arrows indicate the flow trajectories in the regions blocked by the crystallizer. The thickness of the streamlines reflects the relative strength of the corresponding flow streams.
As shown in Figure 8a, under the 200 rpm condition, after the ink was introduced along the crystallizer surface, it was transported inside the crucible in two streams. Stream 1 was the dominant stream. This stream mainly moved in a spiraling and obliquely downward path around the crystallizer while diffusing. Immediately after injection, the ink was thrown outward by the centrifugal force generated by rotation and moved close to the right wall of the crucible. It was then rapidly carried away by the crystallizer rotation. This part of the fluid moved along the wall to the middle height of the free surface on the left side of the crystallizer (the 270° position), and then traveled obliquely downward to the bottom of the crucible on the right side. In Stream 2, the ink quickly formed an annular flow at the free surface along the rotational direction of the crystallizer. Meanwhile, under the action of gravity, it diffused obliquely downward to the crucible bottom, and then moved obliquely upward along the crystallizer surface to the right side of the crystallizer.
As shown in Figure 8b, under the 300 rpm condition, the flow-field transport process changed. Immediately after the ink was added, it was also transported inside the crucible in two streams. Stream 2 consisted of a small portion of the ink, which moved with the crystallizer rotation and formed a circular flow along the top free surface. In Stream 1, most of the ink possessed greater momentum because of the stronger flow induced by crystallizer rotation. It was therefore thrown toward the crucible wall by the centrifugal force generated by rotation and diffused downward along the wall. It was then entrained into the rotating flow generated by the crystallizer and split into two branches that moved around the crystallizer behind it. One branch traveled obliquely upward to the upper-left region of the crucible, while the other moved through the middle region of the crucible. The two branches then moved obliquely downward together toward the crucible bottom.

3.2.2. Tracer Concentration Inside the Crucible Under the No-Baffle Condition

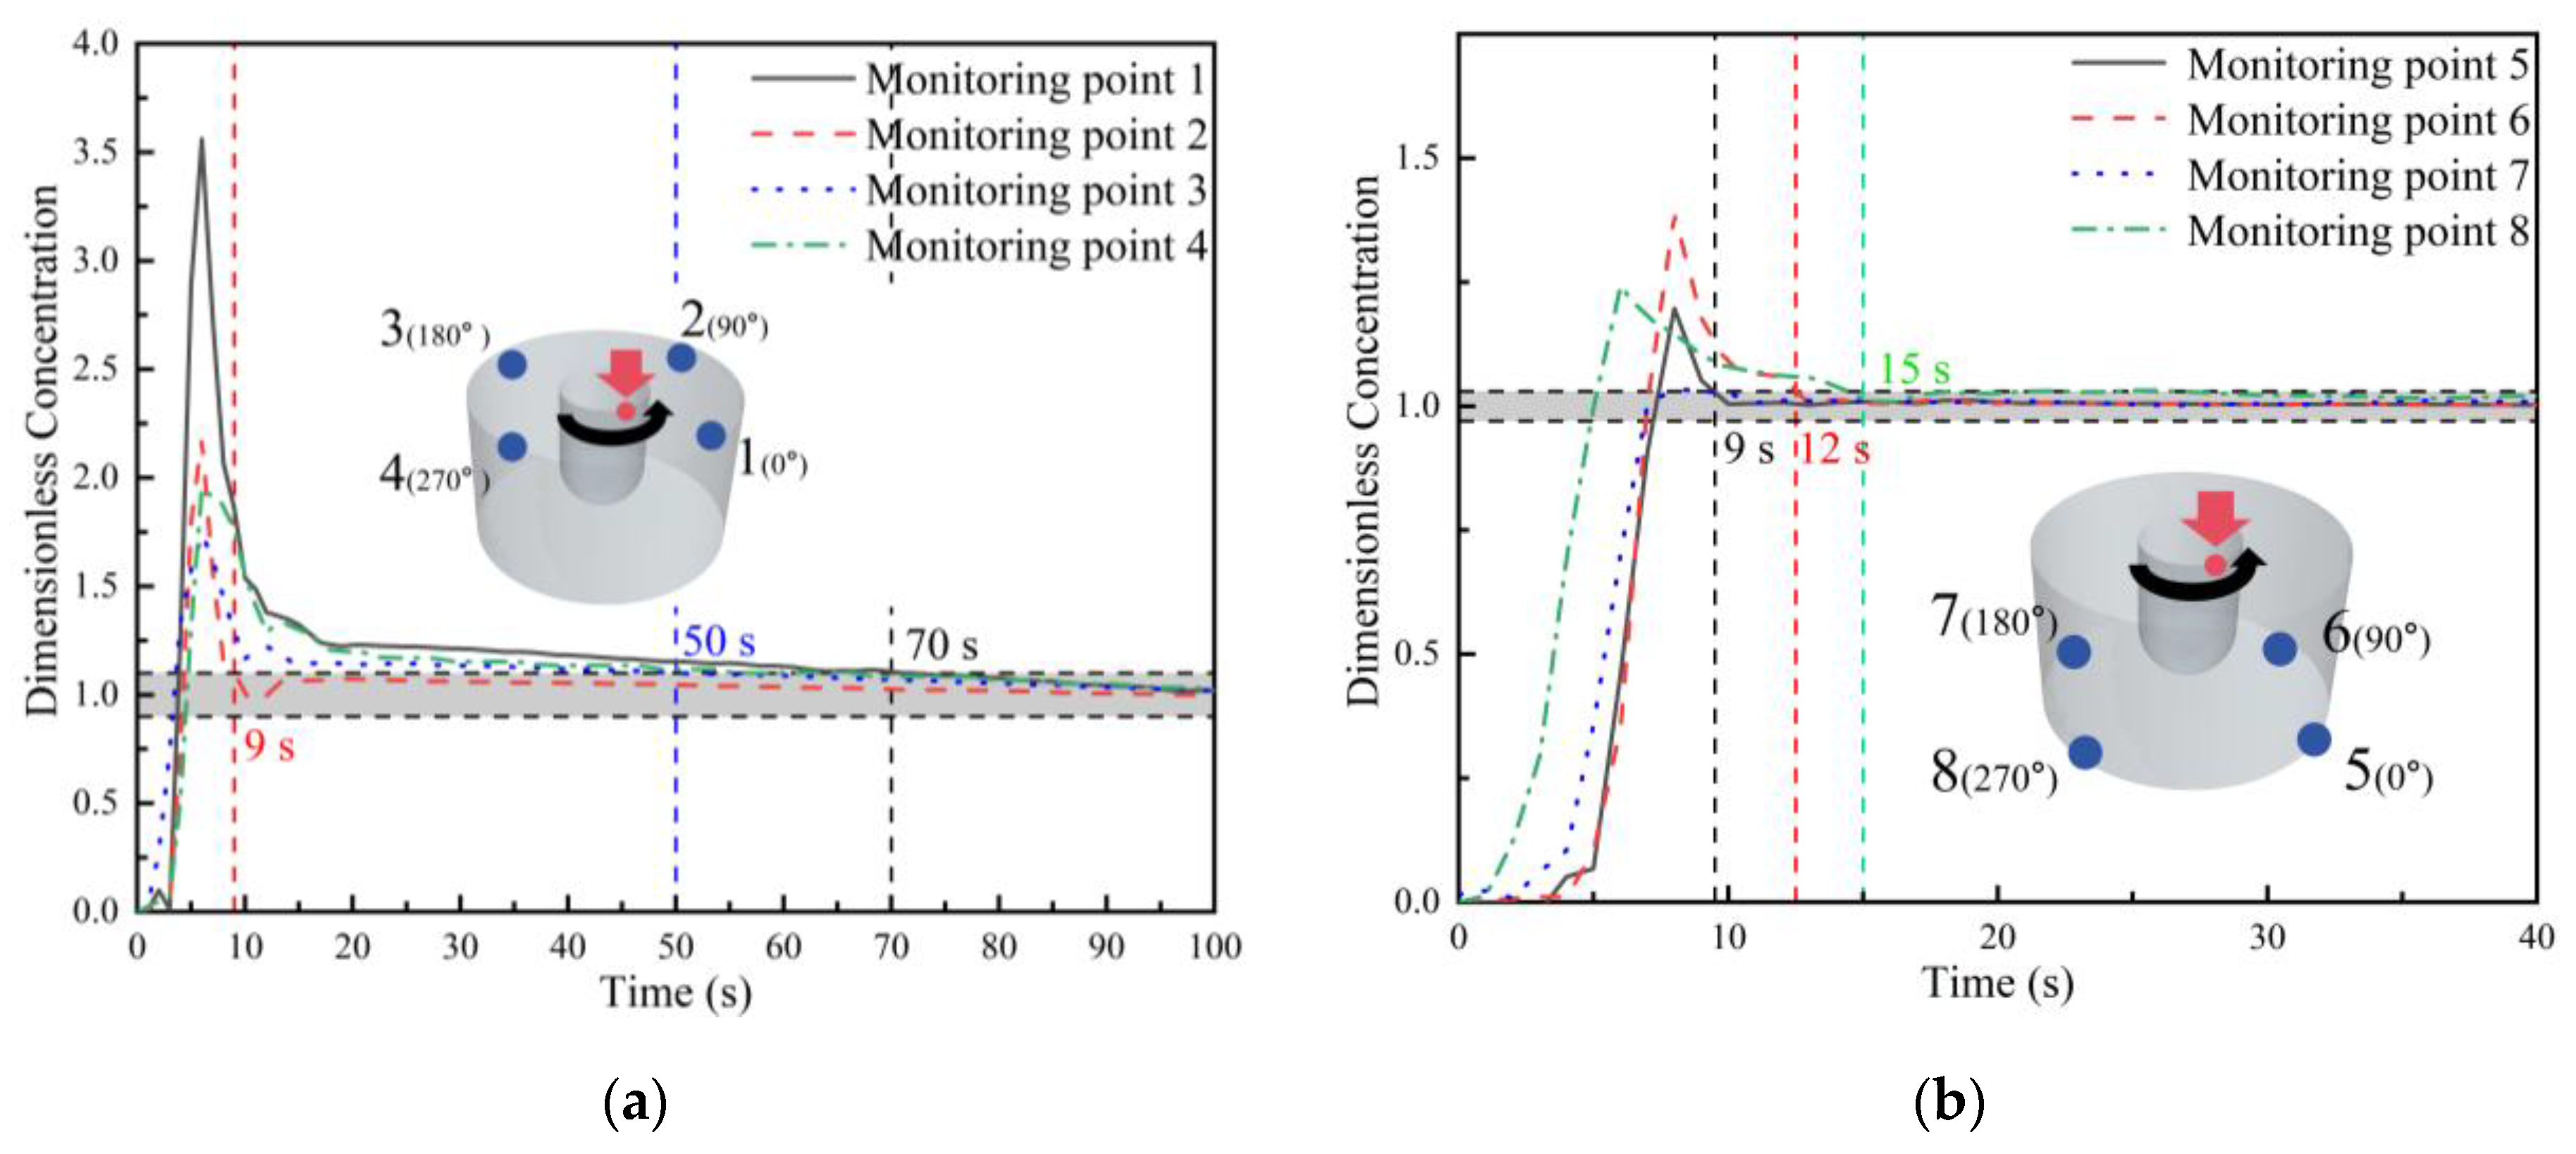
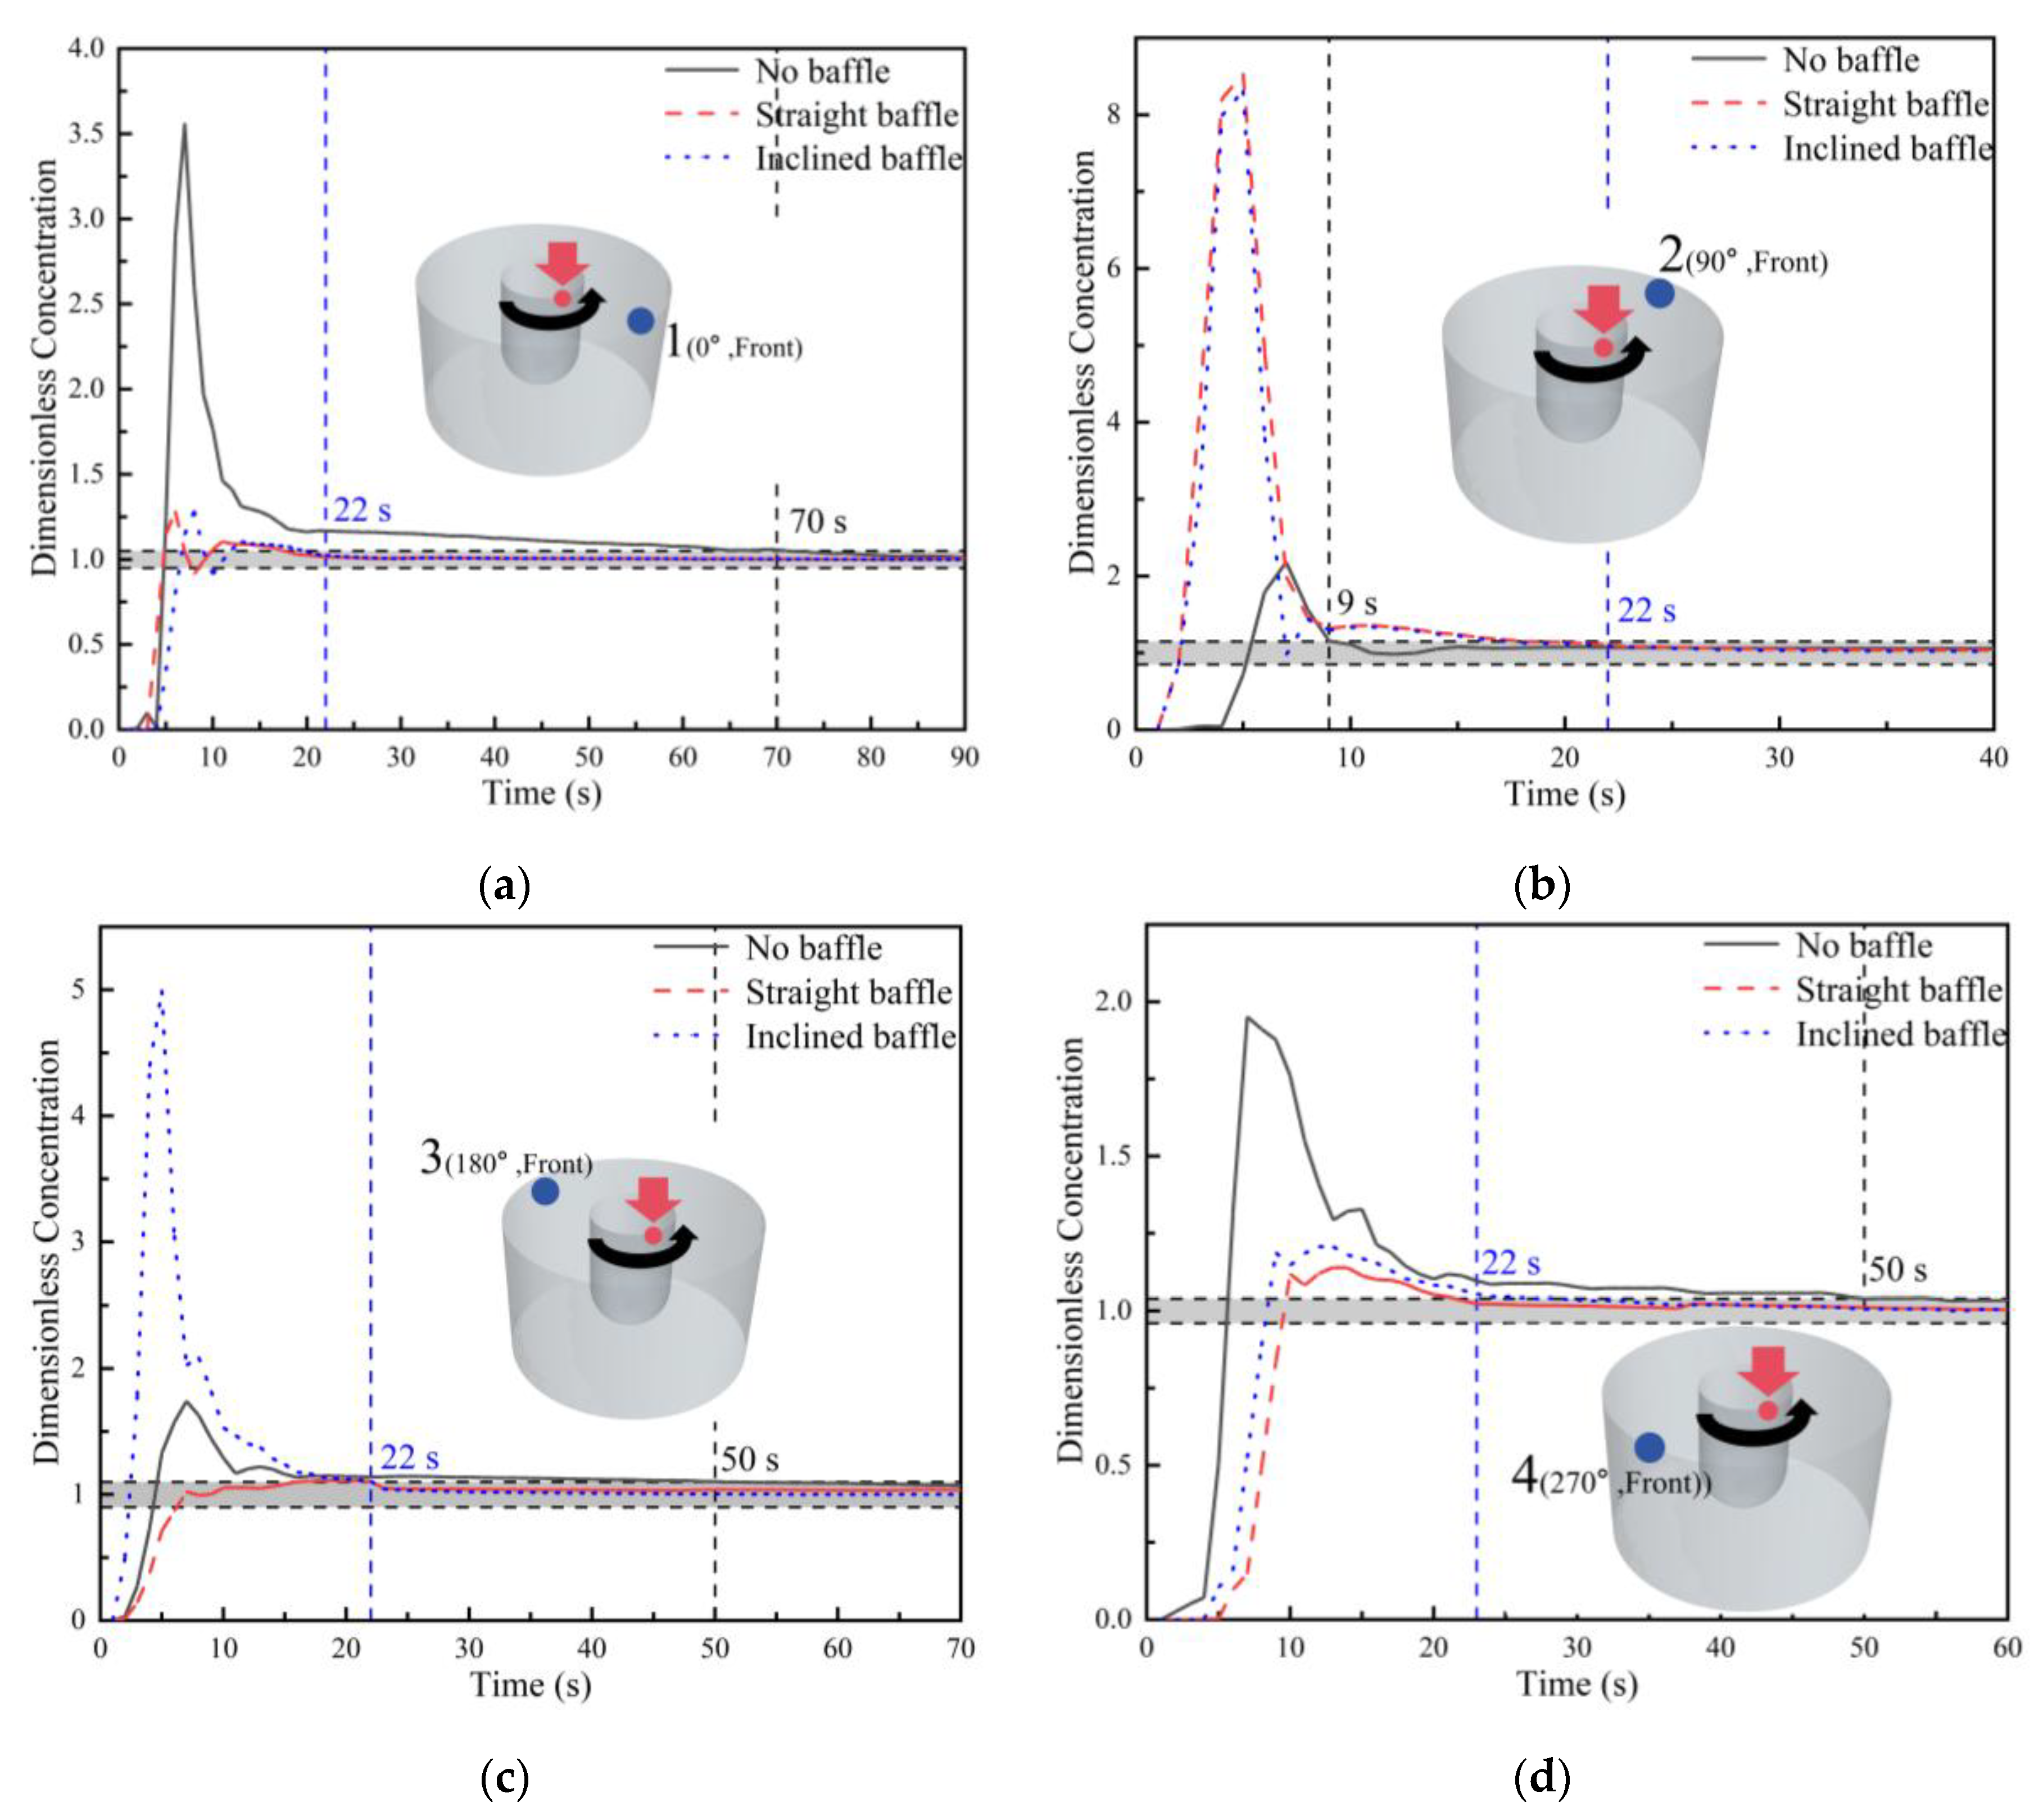
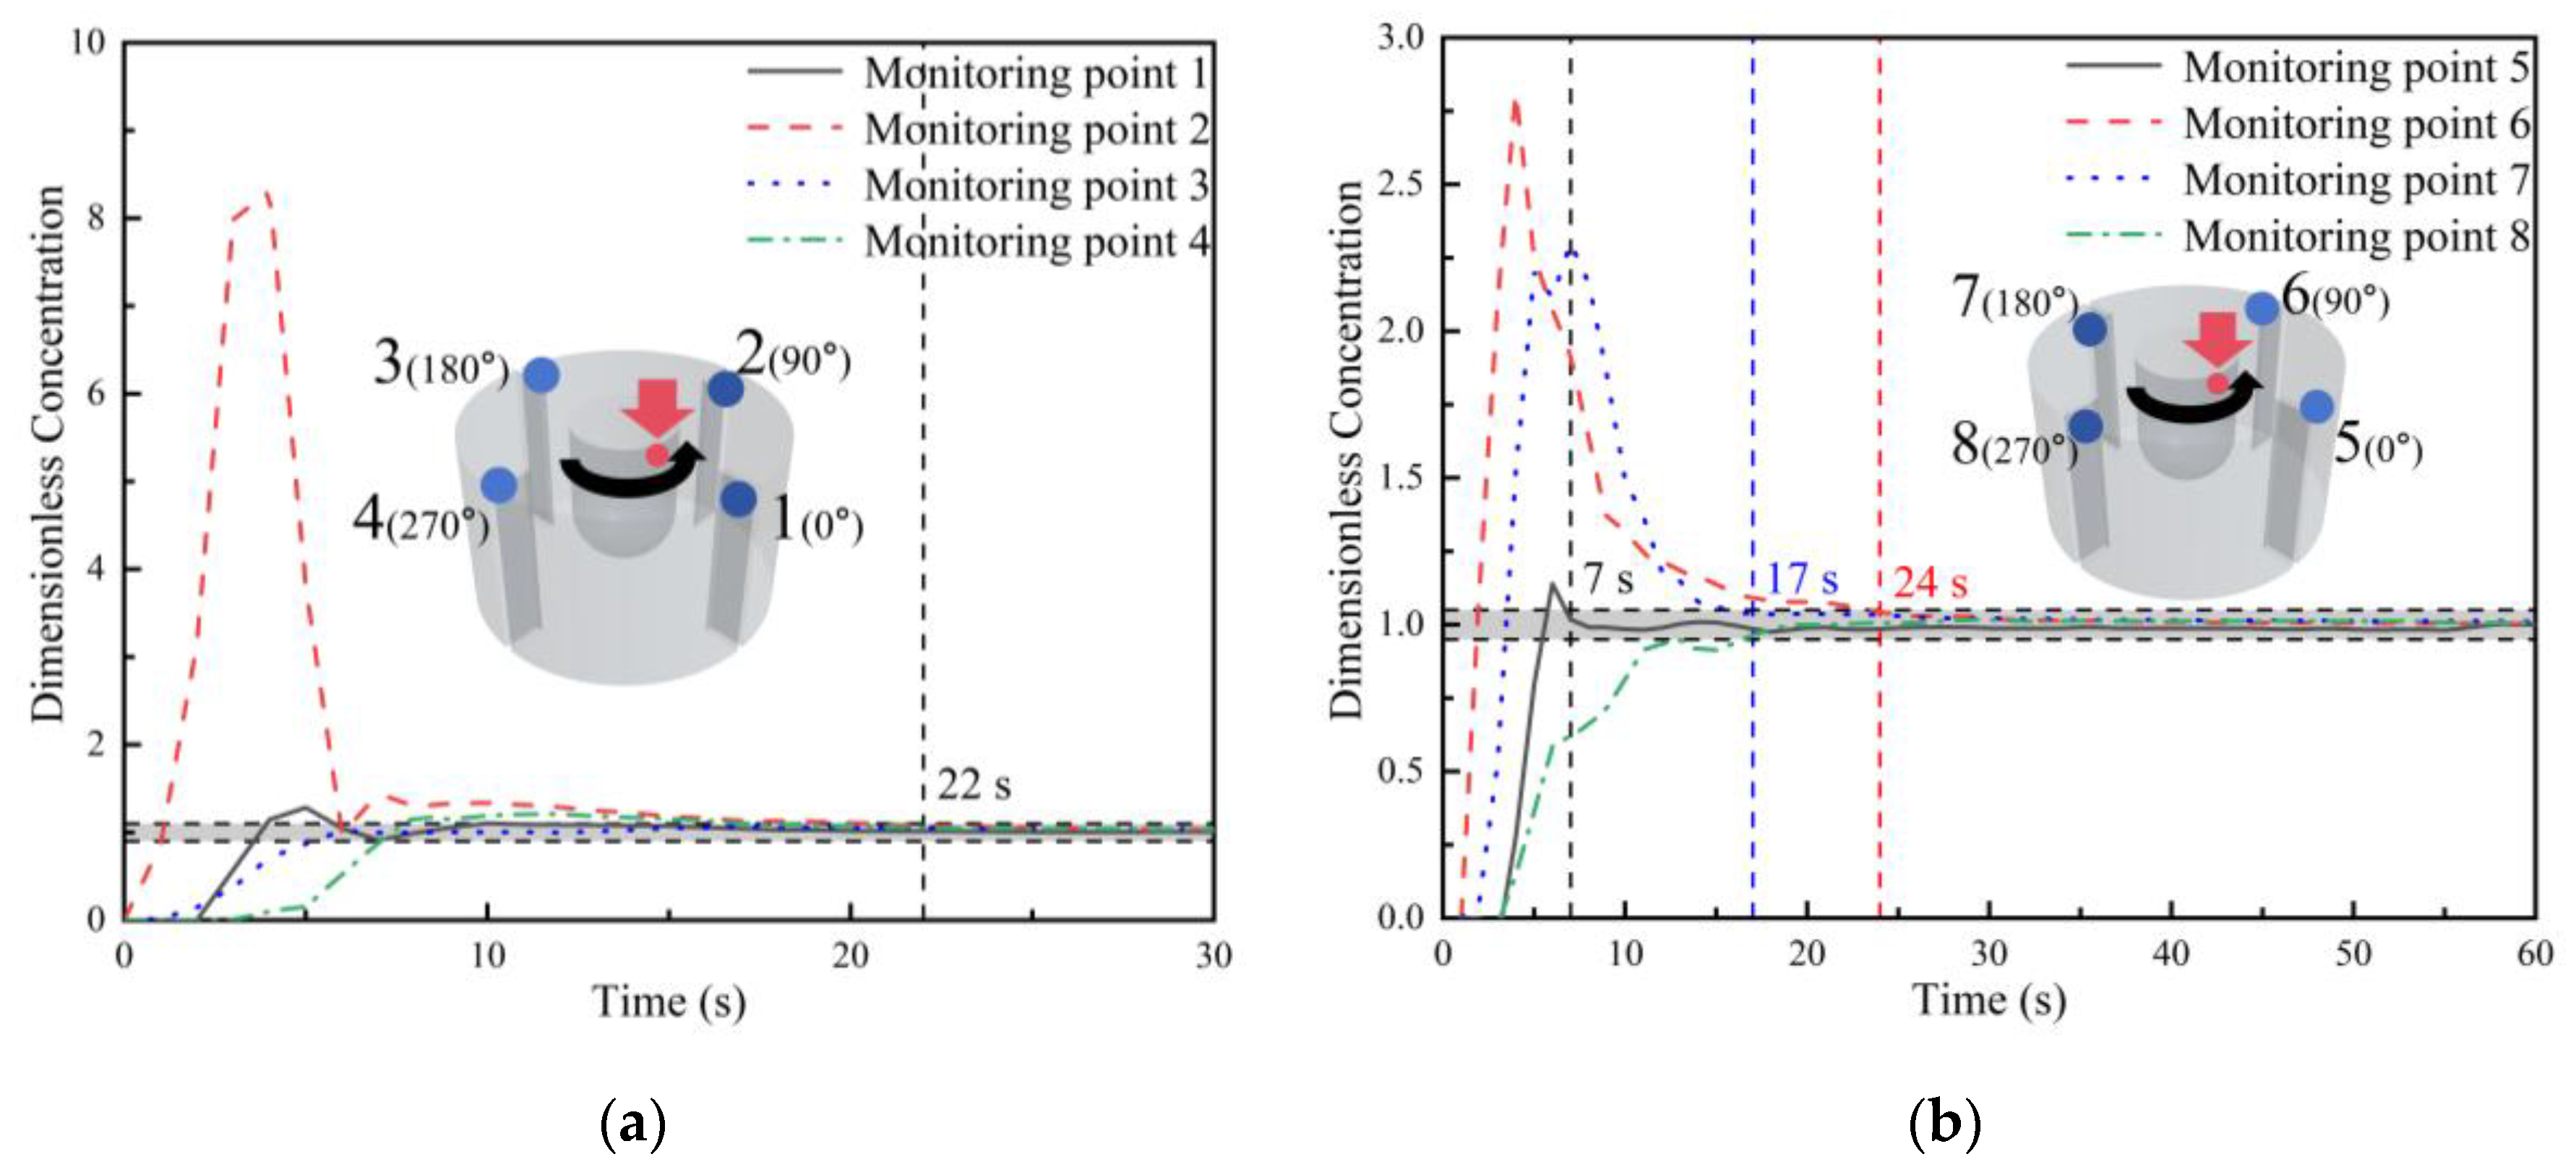
At a crystallizer rotational speed of 200 rpm without baffles, the tracer concentration curves at the upper monitoring points 1–4 are shown in Figure 9a. The tracer concentration curves at the four upper monitoring points are similar overall. They exhibit a rapid rise to a peak, followed by a sharp decline and then a slow approach to mixing equilibrium, although the mixing times differ significantly. After tracer addition, all monitoring points showed a peak within a very short time. Among them, monitoring point 1 exhibited the highest peak and the steepest rise, indicating that a large amount of tracer was first thrown toward monitoring point 1 immediately after injection under the centrifugal force generated by crystallizer rotation. However, monitoring point 1 also showed the longest mixing time, reaching complete mixing only after 70 s. Monitoring point 2 also showed a distinct peak, although its magnitude was lower than that at monitoring point 1. It reached its maximum value at 5 s, then decreased rapidly, and became well mixed at 9 s, which was much shorter than that at monitoring point 1. The tracer concentration curves at monitoring points 3 and 4 were similar. Both responded rapidly immediately after tracer addition, reached peak concentration at 5 s, then decreased gradually, and became well mixed at 50 s.
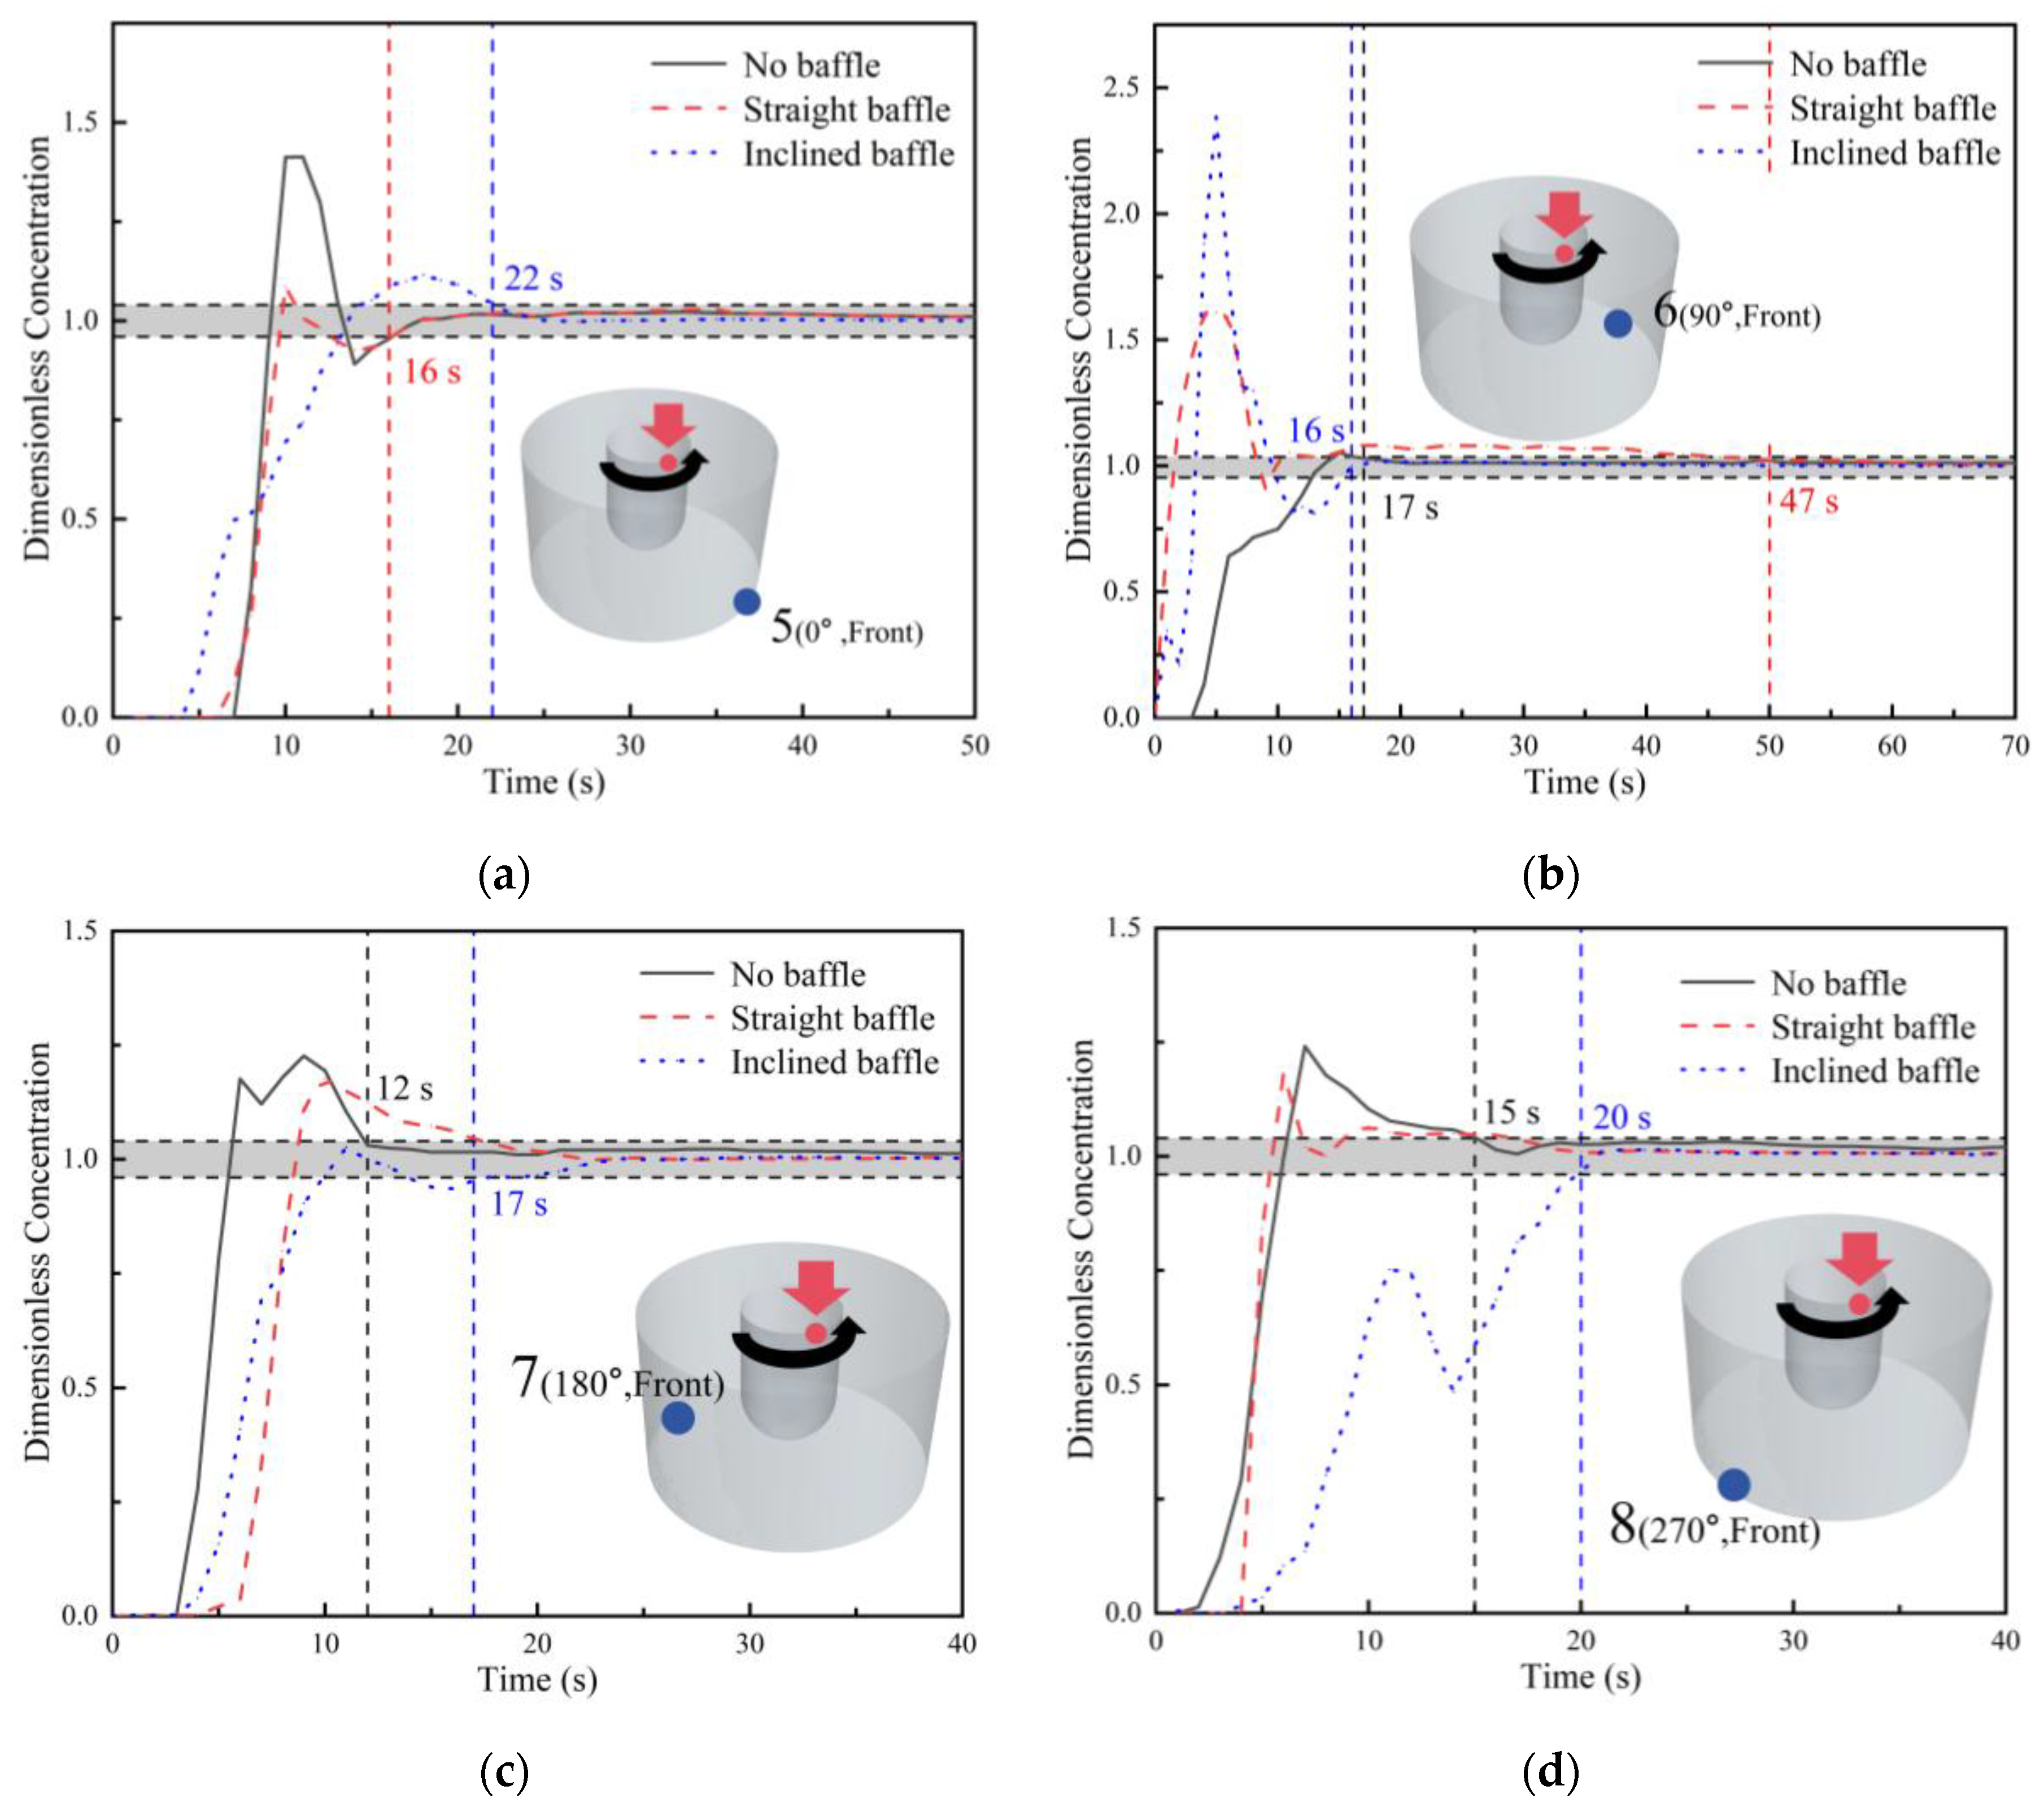
As shown in Figure 9b, the response times of the bottom monitoring points (5–8) differed greatly. Among them, monitoring point 8 responded rapidly 1 s after tracer addition, while the tracer concentration curves at monitoring points 6 and 7 began to rise at about 3 s. In contrast, monitoring point 5 did not respond until 6 s after tracer addition, showing a relatively long response time. As shown in Figure 8a, after the tracer was added at the top, Stream 2 entered the annular main flow region and was transported downward. After completing one revolution around the crystallizer, it first reached monitoring point 8, resulting in the short response time at this point. By contrast, Stream 1 descended spirally around the crystallizer. When it reached the bottom, the main stream was still far from monitoring point 5. The main stream then entered the bottom recirculation zone and only reached monitoring point 5 after rotating one full circle around the crystallizer at the bottom. Therefore, the response time at monitoring point 5 was relatively long. Peak values were observed in the tracer concentration curves at monitoring points 5, 7, and 8, and the peak at monitoring point 5 was higher than those at the other monitoring points. Monitoring point 6 showed a slowly rising parabolic curve. Ultimately, all four bottom monitoring points reached complete mixing at 17 s.
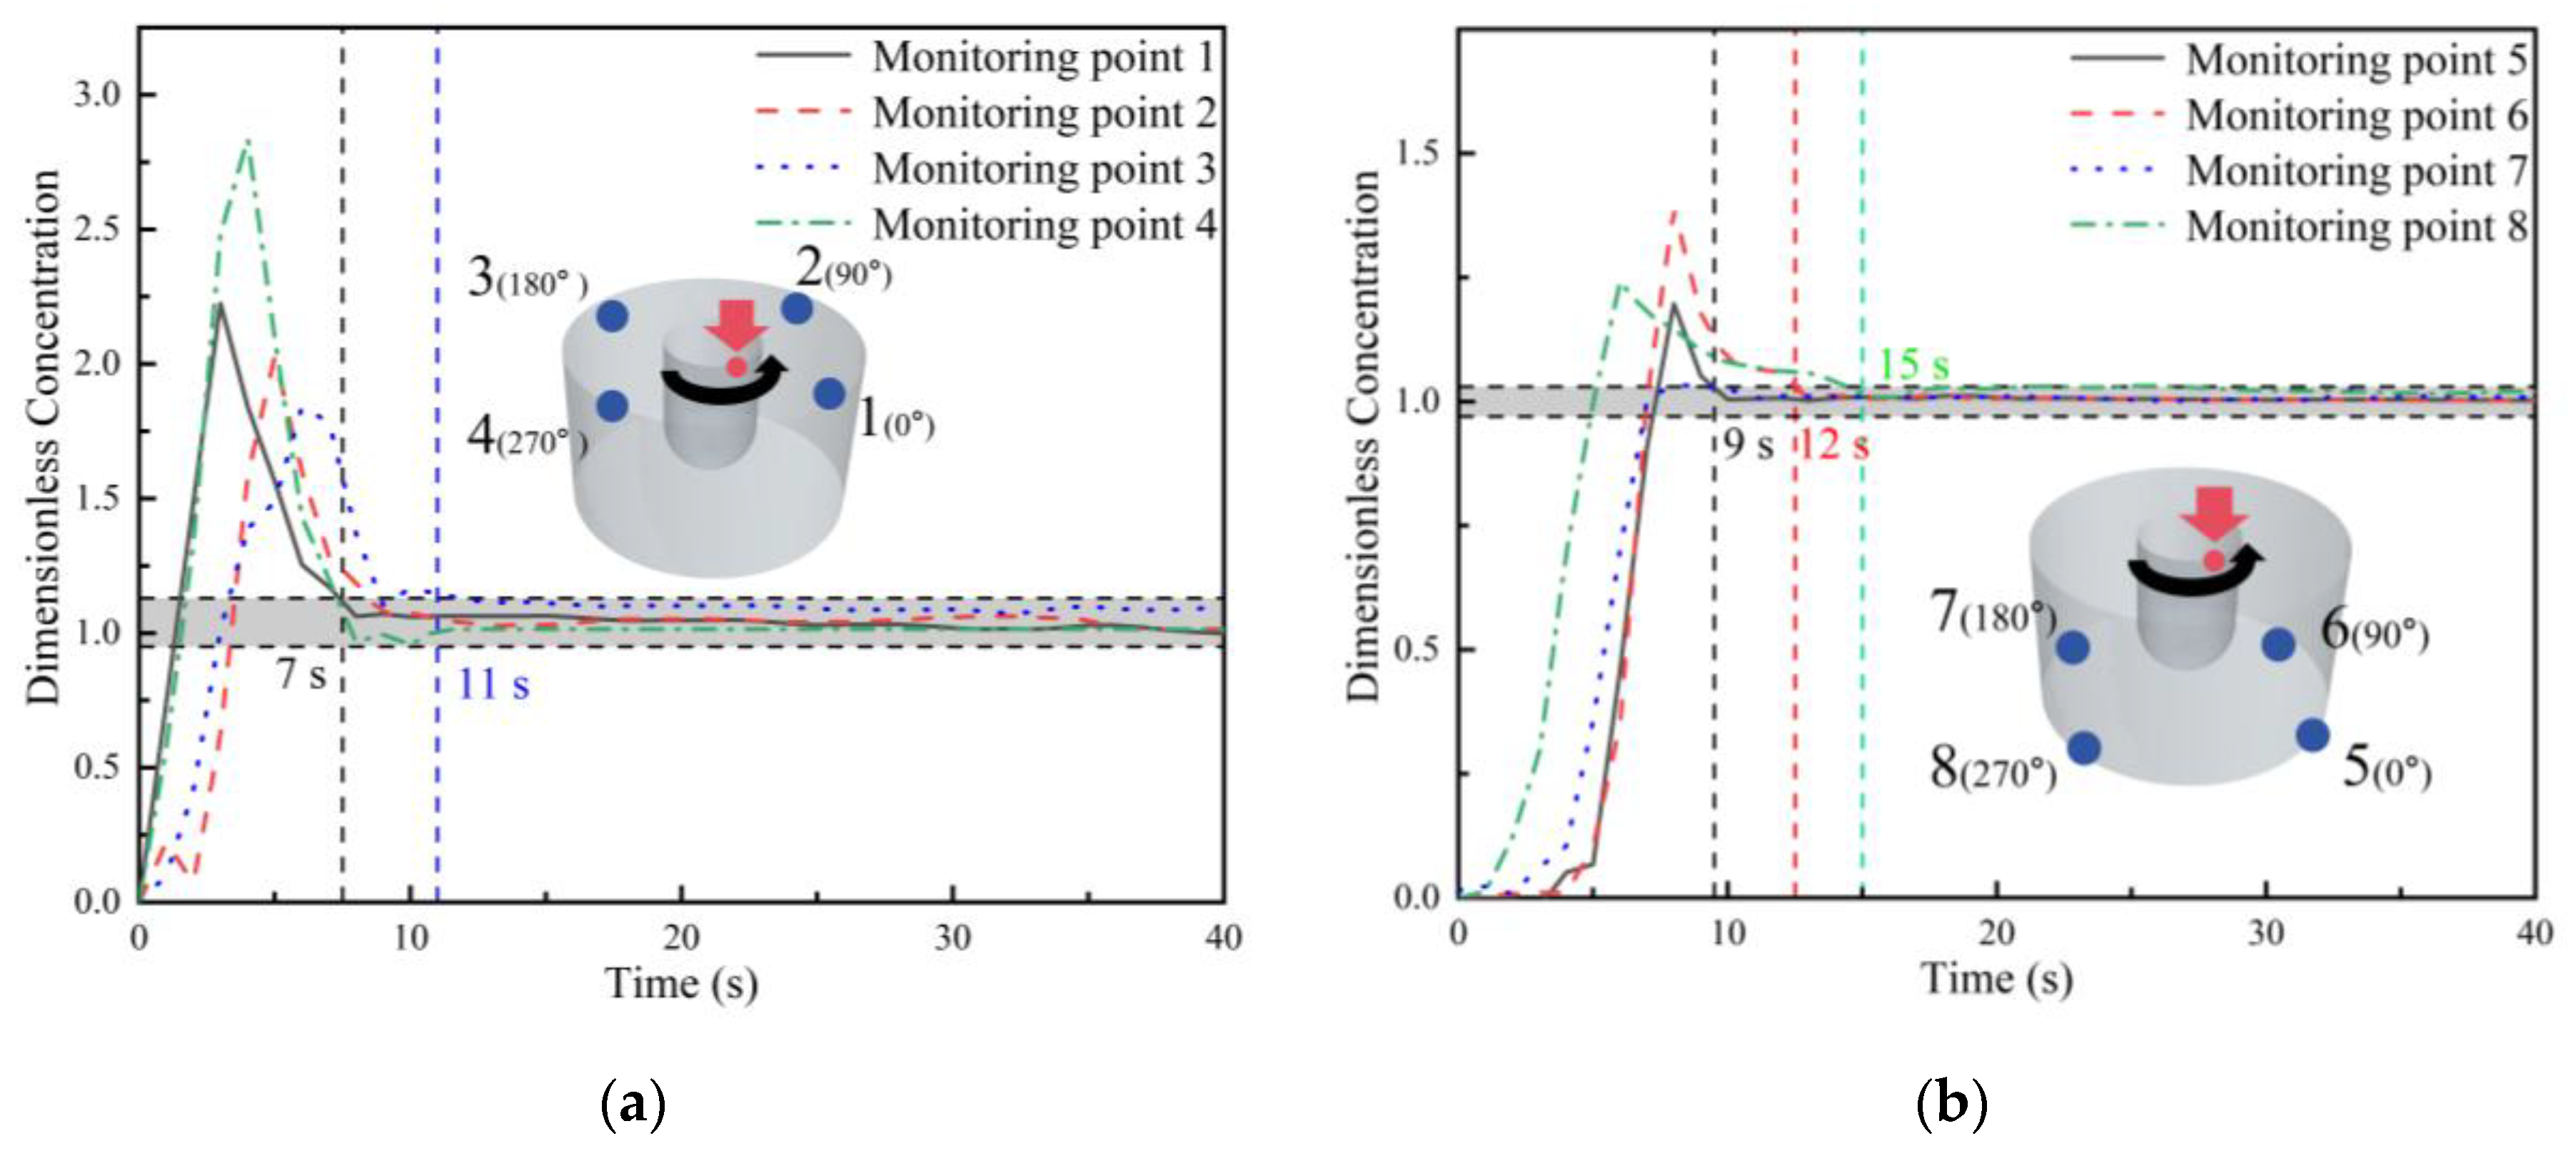
When no baffles were installed and the crystallizer rotational speed was increased to 300 rpm, the tracer concentration curves at the upper monitoring points 1–4 are shown in Figure 10a. The overall variation trend was basically the same as that under the 200 rpm condition, although the peak values differed considerably among the monitoring points. Combined with the ink transport schematic in Figure 8b, because of the higher crystallizer rotational speed, the tracer first moved with the rapid rotation of the crystallizer after being added. Under the action of centrifugal force, the tracer concentrations at monitoring points 1 and 4 rose almost simultaneously, whereas the response times at monitoring points 2 and 3 were slightly longer than those at monitoring points 1 and 4. At 200 rpm, monitoring point 1 exhibited the highest peak. However, when the rotational speed increased to 300 rpm, although the peak at monitoring point 1 remained relatively high, it became lower than that at monitoring point 4. This indicates that increasing the rotational speed enhanced the annular flow around the crystallizer at the free surface. After being added, the tracer first moved around the crystallizer in an annular path and was then thrown toward the position of monitoring point 4 by centrifugal force. When the rotational speed increased to 300 rpm, the mixing times at all four monitoring points were significantly shortened, especially at monitoring point 1, where the mixing time decreased by 63 s.
The tracer concentration curves at the bottom monitoring points (5–8) are shown in Figure 10b. Among them, the variation at monitoring point 8 was similar to that at 200 rpm, and it still responded first. According to the ink transport schematic in Figure 8b, under the 300 rpm condition, after the tracer was added near the 0° position of the crystallizer surface, it was first transported by the main flow stream to the bottom at the 270° position. The response times at monitoring points 5 and 6 were similar, and both curves began to rise at about 4 s. However, the tracer concentration curve at monitoring point 6 differed markedly from that at 200 rpm. As indicated by the ink transport schematic in Figure 8b, after tracer addition, the tracer first moved obliquely downward and rapidly filled the left side of the crucible. Only afterward did the tracer in the middle region move obliquely downward to the position of monitoring point 6. At that moment, the ink had not yet diffused and still reached monitoring point 6 in the form of a concentrated stream, which caused the tracer concentration curve at monitoring point 6 to show a relatively delayed response but a relatively high peak. Unlike the other three monitoring points, monitoring point 7 did not exhibit an obvious peak. Its tracer concentration curve increased gradually and finally reached complete mixing at 9 s.

3.3. Flow Behavior and Mixing in the Crucible After Baffle Installation

3.3.1. Flow-Field Transport Process Inside the Crucible Under the Straight-Baffle Condition

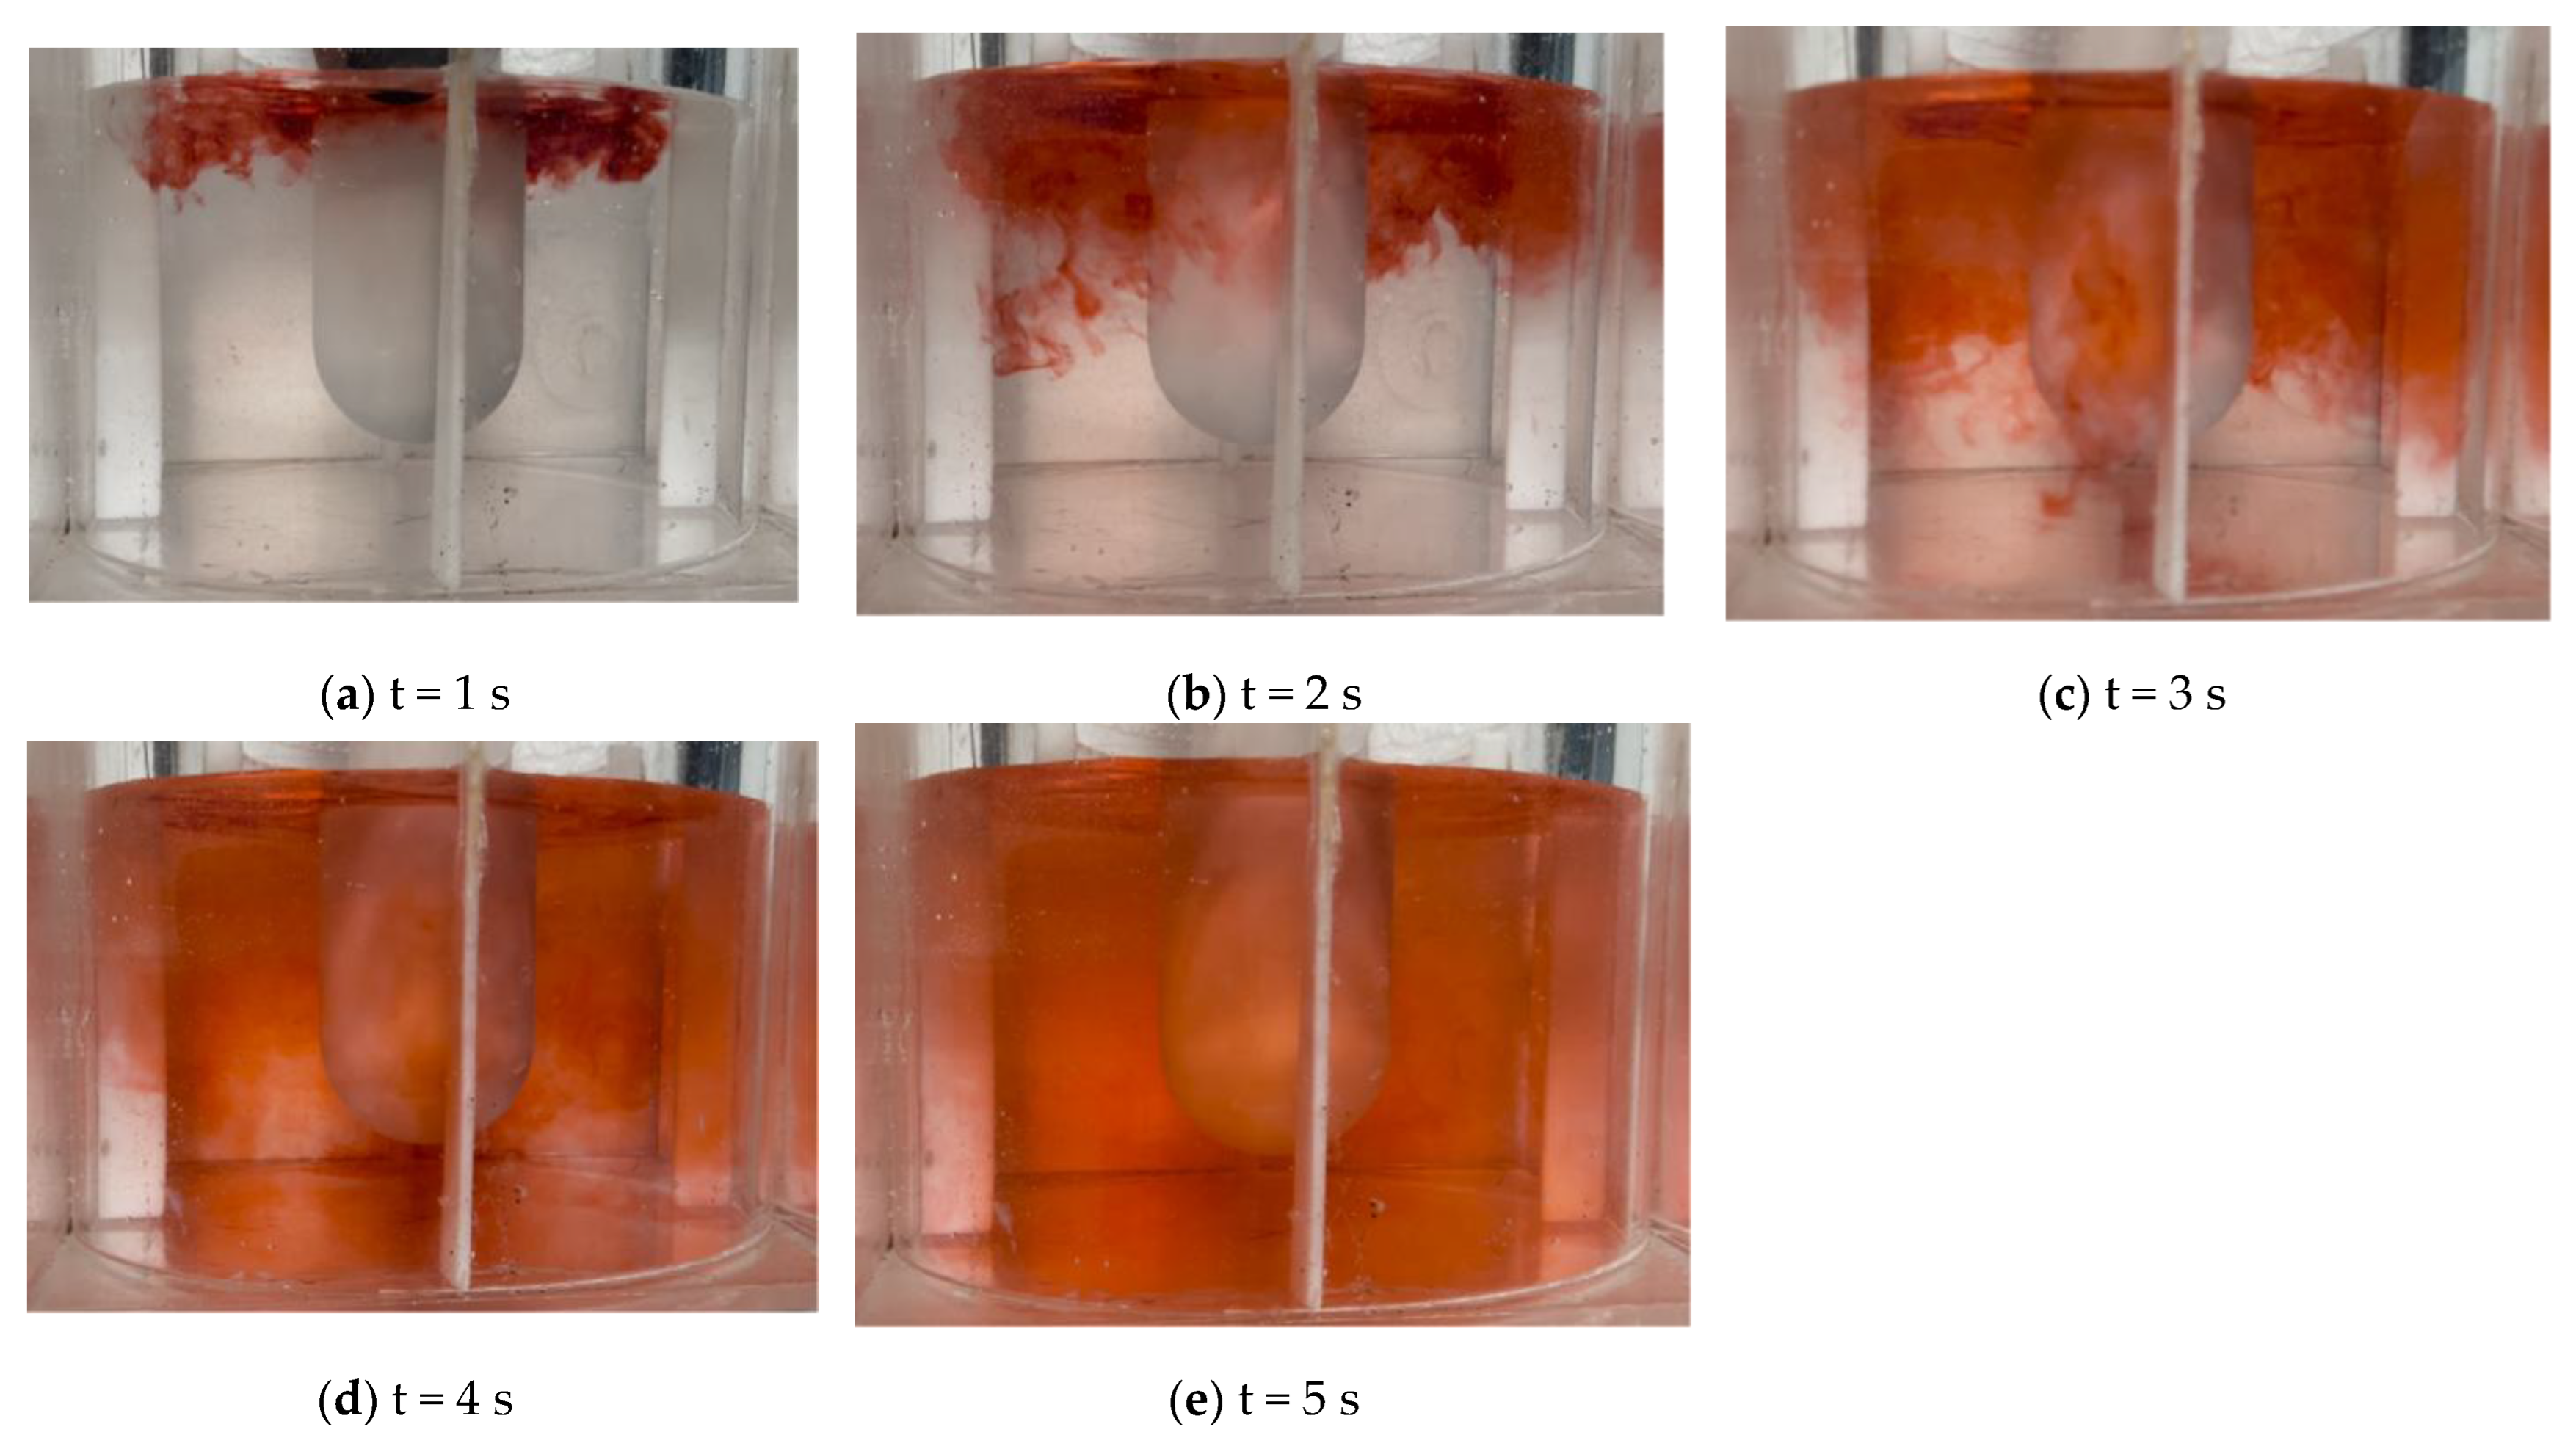
Under the straight-baffle condition, the ink transport process at a crystallizer rotational speed of 200 rpm is shown in Figure 11. At 1 s, after the ink was added near the crystallizer surface, it first spread rapidly near the free surface along the circumferential flow induced by crystallizer rotation. At 2 s, due to the blocking effect of the straight baffles, obvious local accumulation of ink appeared on the upstream side of the baffle (in front of the baffle). Meanwhile, the ink continued to spread circumferentially along the free surface. At 3 s, part of the ink was blocked by the 90° baffle on the right side of the image and diffused downward along the baffle. Another part of the ink remained in the main flow region and continued to spread toward the middle and lower regions along the rotational direction of the crystallizer. At 4 s, the ink was blocked not only by the baffle in the 90° direction, but also by the 180° baffle behind the crystallizer. At this location, the ink was transported in the same manner as at the 90° baffle, diffusing downward along the baffle. At this moment, the ink in the main flow region had already moved to the left side of the crystallizer (the 270° position), but no concentrated ink stream was observed there. Instead, the ink in this region diffused under the combined effects of gravity and crystallizer rotation. At 5 s, the ink had basically filled the main flow region of the crucible, but an obvious “blank region” still remained in the lower part behind the left baffle. This indicates that this region was a low-velocity retention zone on the backflow side of the baffle, where the ink had not yet spread by circulation. At 7 s, the ink at the bottom had finished diffusing toward the crystallizer, and the entire crucible was filled with red ink.
As shown in Figure 12, the ink transport process at a crystallizer rotational speed of 300 rpm is presented. At 1 s, after the ink was added near the crystallizer surface, it rapidly formed a circulating flow along the crucible surface and spread over the free surface. At this moment, the effect of the circumferential flow induced by crystallizer rotation on the ink became more pronounced. At 2 s, the ink on both the left and right sides of the crystallizer diffused downward from the free surface. At the same time, under the centrifugal force generated by crystallizer rotation, part of the ink was thrown toward the baffle region (in front of the 90° baffle). At 3 s, the ink at the baffle moved downward along the baffle, and its downward diffusion was faster than that in the main flow region at the center of the crucible. At 4 s, the red ink had reached the bottom of the crucible, but a region with little ink diffusion still remained behind the 270° baffle on the left side. At 5 s, the entire crucible was almost completely filled with red ink.
As shown in Figure 13, the flow-field transport process under the straight-baffle condition is presented. The numbers represent the quantity of mainstream streams, solid lines represent the visible flow trajectories, whereas dashed arrows indicate the flow trajectories in the regions blocked by the crystallizer. The thickness of the streamlines reflects the relative strength of the corresponding flow streams.
As shown in Figure 13a, after the ink was added along the crystallizer surface, it was also transported inside the crucible in two flow streams. Stream 1 was the main flow stream. After being thrown toward the baffle by centrifugal force, Stream 1 was divided into two branches. One branch moved downward along the baffle, while the other bypassed the baffle and reached the region behind it. After the branch moving downward along the baffle reached the bottom, it was driven toward the interior of the crucible and entered the annular flow at the bottom around the crystallizer. The transport mode of Stream 2 was similar to that of Stream 2 in the no-baffle condition. It moved spirally to the left side of the crystallizer (the 270° position) and formed an annular flow. At 200 rpm, the overall tracer transport under the straight-baffle condition was slower than that in the no-baffle condition.
As shown in Figure 13b, when the crystallizer rotational speed increased to 300 rpm, the flow inside the entire crucible changed significantly, and the annular transport formed along the rotational direction of the crystallizer was enhanced. Immediately after the ink was added, only one main flow stream existed inside the whole crucible. The ink rapidly spread near the free surface beside the crystallizer along the rotational direction of the crystallizer and diffused outward at the free surface under the action of centrifugal force. A large amount of ink was thrown toward the positions of the 90° and 180° baffles. Only a small portion of the ink moved spirally and obliquely downward along the crystallizer wall to the left side of the crucible. The fluid thrown toward the 90° baffle moved downward along the baffle and, after reaching the bottom, diffused toward the interior of the crucible.

3.3.2. Tracer Concentration Inside the Crucible Under the Straight-Baffle Condition

Under the straight-baffle condition at a crystallizer rotational speed of 200 rpm, the tracer concentration curve at monitoring point 1, as shown in Figure 14a, increased slowly during the first 5 s, reached its maximum at 5 s, and then gradually decreased. At monitoring point 2, the tracer concentration curve rose rapidly and then declined rapidly. Combined with the ink transport behavior under the straight-baffle condition, this indicates that immediately after tracer addition, most of the tracer first reached monitoring point 2 with the main flow stream and then moved downward along the baffle. Therefore, the curve at monitoring point 2 showed a trend of rising rapidly to a maximum and then decreasing rapidly. At monitoring points 3 and 4, the tracer concentration curves increased gradually, and their response times were shorter than those at monitoring points 1 and 2, being 2 s and 4 s, respectively.
As shown in Figure 14b, the tracer concentration curve at monitoring point 5 behind the upper baffle was similar to that at monitoring point 1. The tracer concentration began to increase at 4 s, and the curve showed a pattern of slow rise followed by gradual decline. At monitoring points 6 and 7, the response times were both 1 s, and clear peaks appeared at both locations. As shown in Figure 13a, after the tracer was added near the crystallizer surface, it split into two streams. One stream was thrown toward the crucible wall near the baffle (the 90° baffle position), while the other was first carried into the main flow region by crystallizer rotation and then thrown toward the crucible wall by the centrifugal force generated by rotation. The peak value of the tracer concentration curve at monitoring point 6 was relatively high. This is because part of the tracer from monitoring point 2 in front of the baffle was not completely blocked by the baffle and moved downward, while another part bypassed the baffle and reached the region of monitoring point 6, where it merged with the stream thrown toward monitoring point 6 by centrifugal force. As a result, the tracer concentration peak at this location was relatively high. The curve at monitoring point 7 was similar to that at monitoring point 6, showing a rapid rise followed by a decline. In contrast, the concentration curve at monitoring point 3 in front of this baffle did not show a similar shape, but instead increased gradually. This is because a large amount of tracer diffused from the main circulation flow into the region behind the 180° baffle, whereas relatively little tracer was directly transported to the region in front of this baffle. Monitoring point 8 had the same response time as monitoring point 5, namely 4 s, and no obvious peak appeared. Its tracer concentration showed a slowly increasing parabolic curve, similar to that at monitoring point 4.
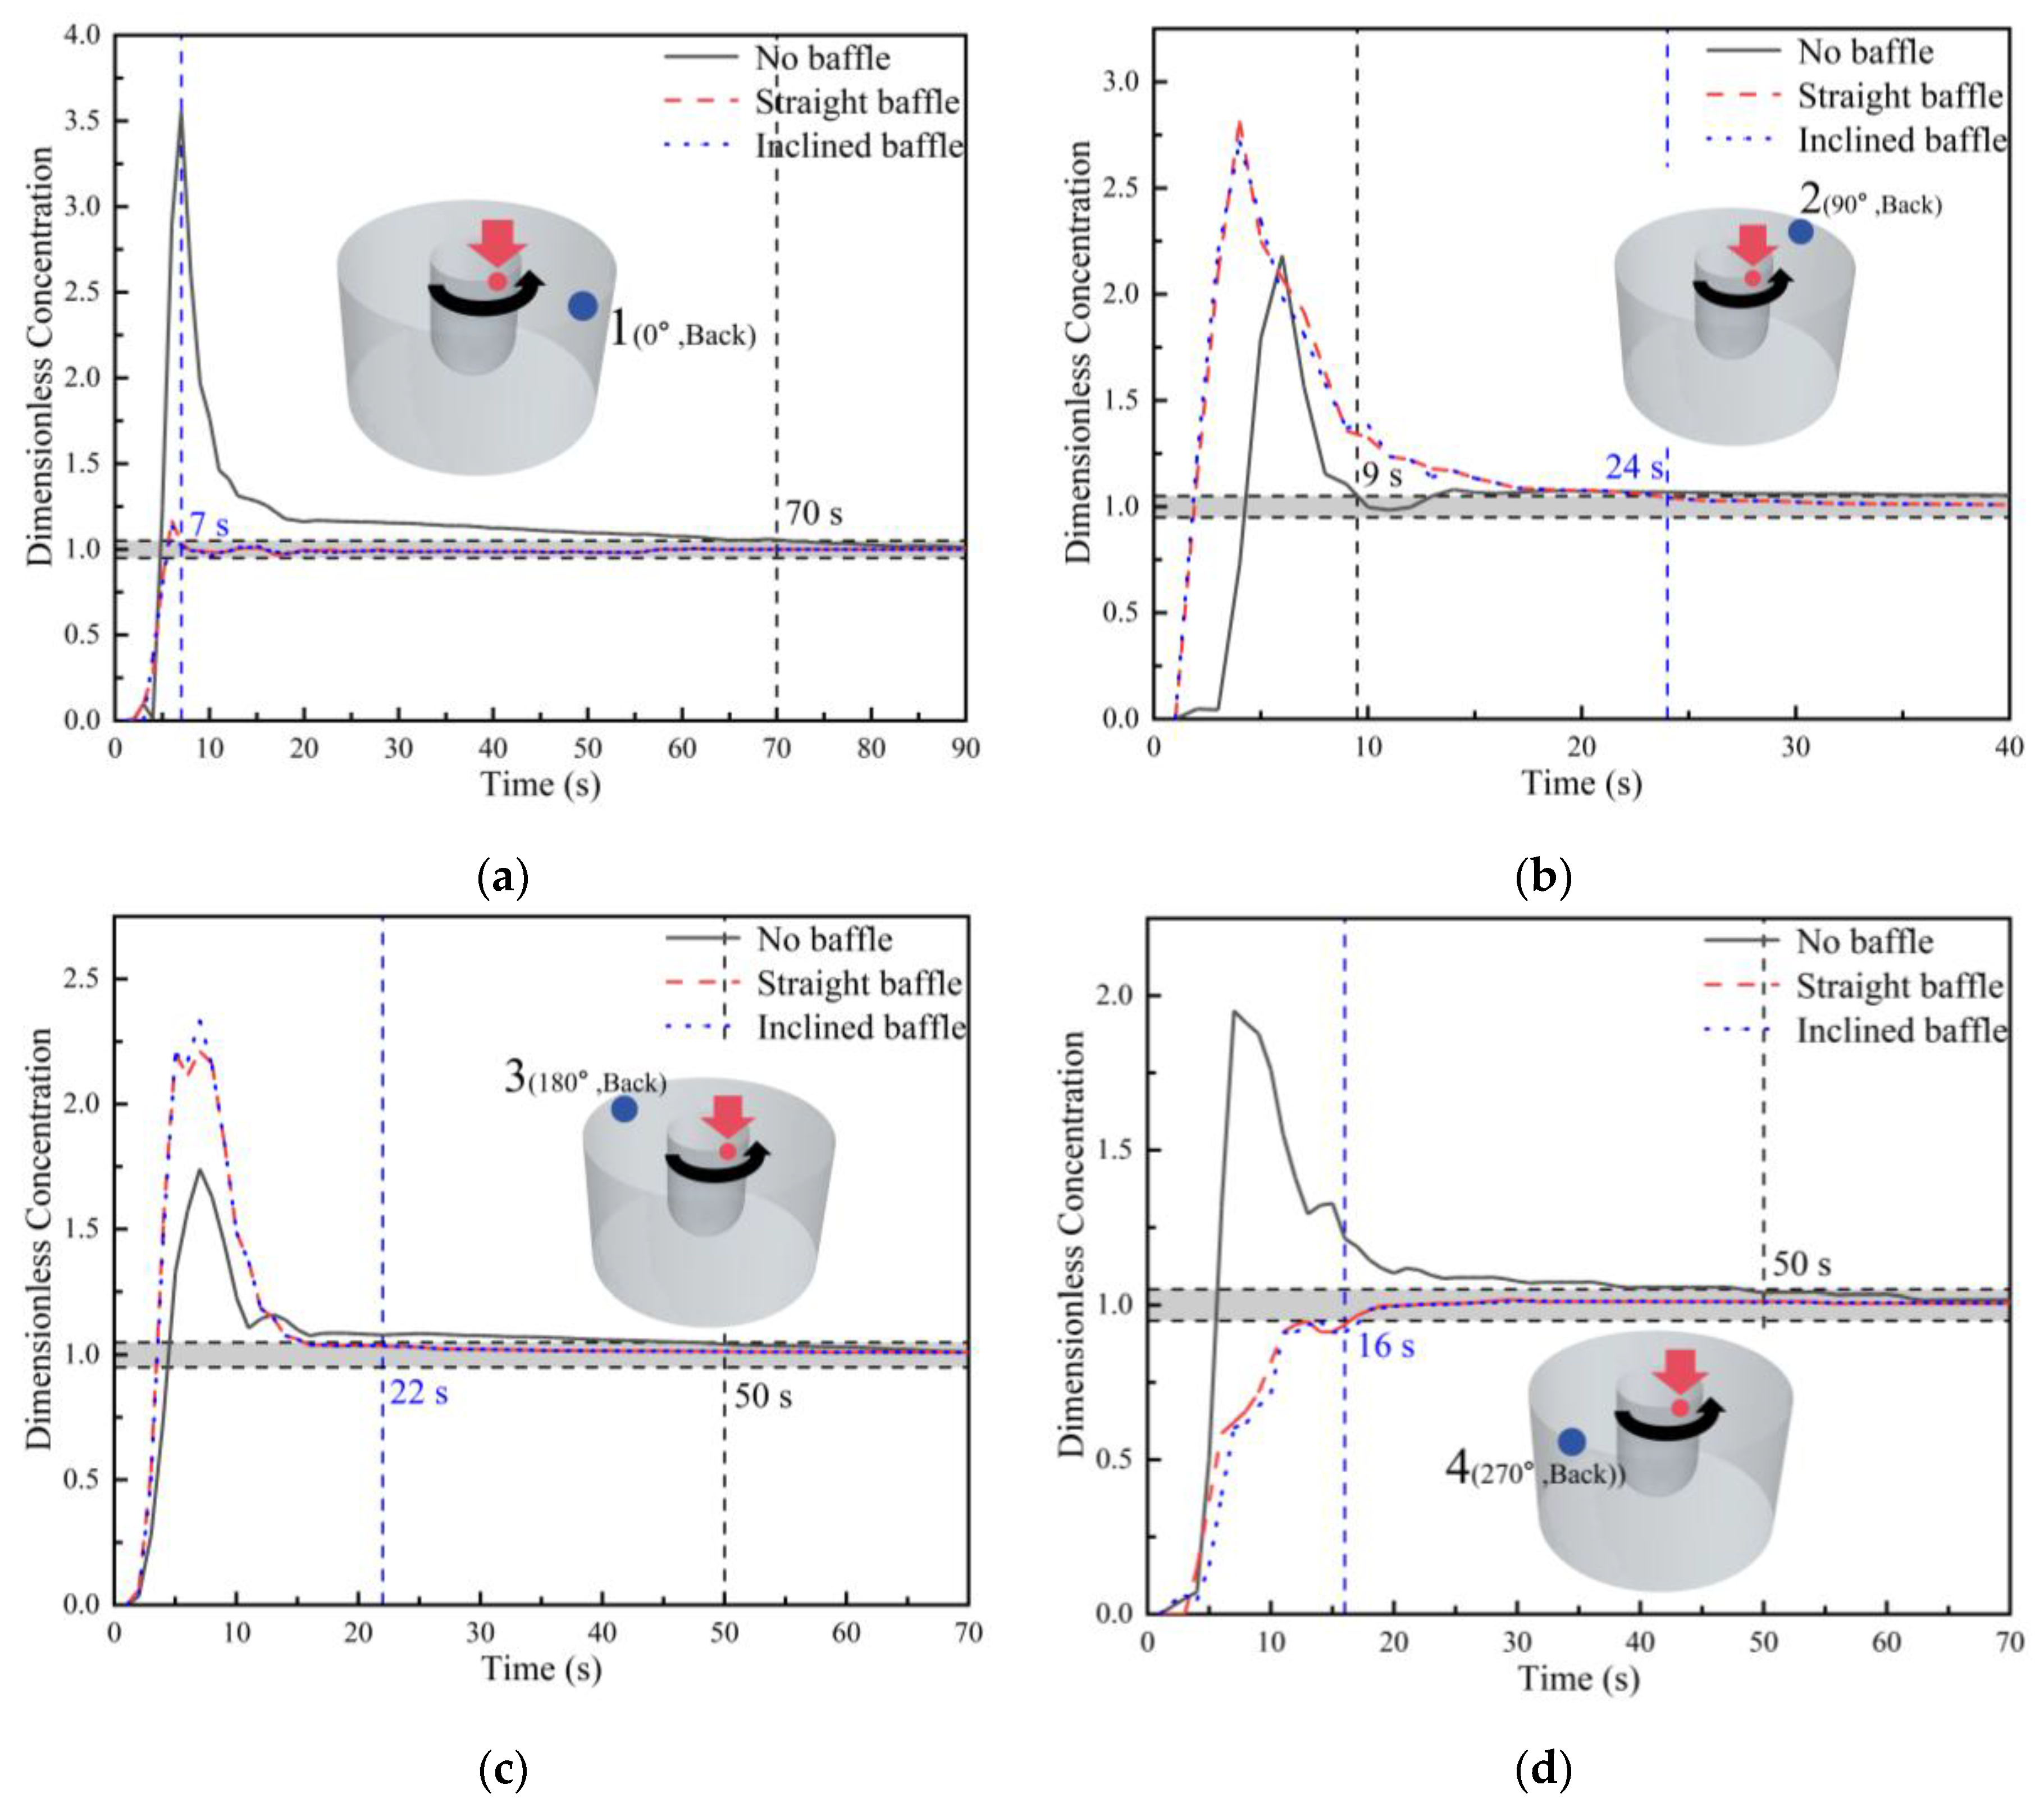
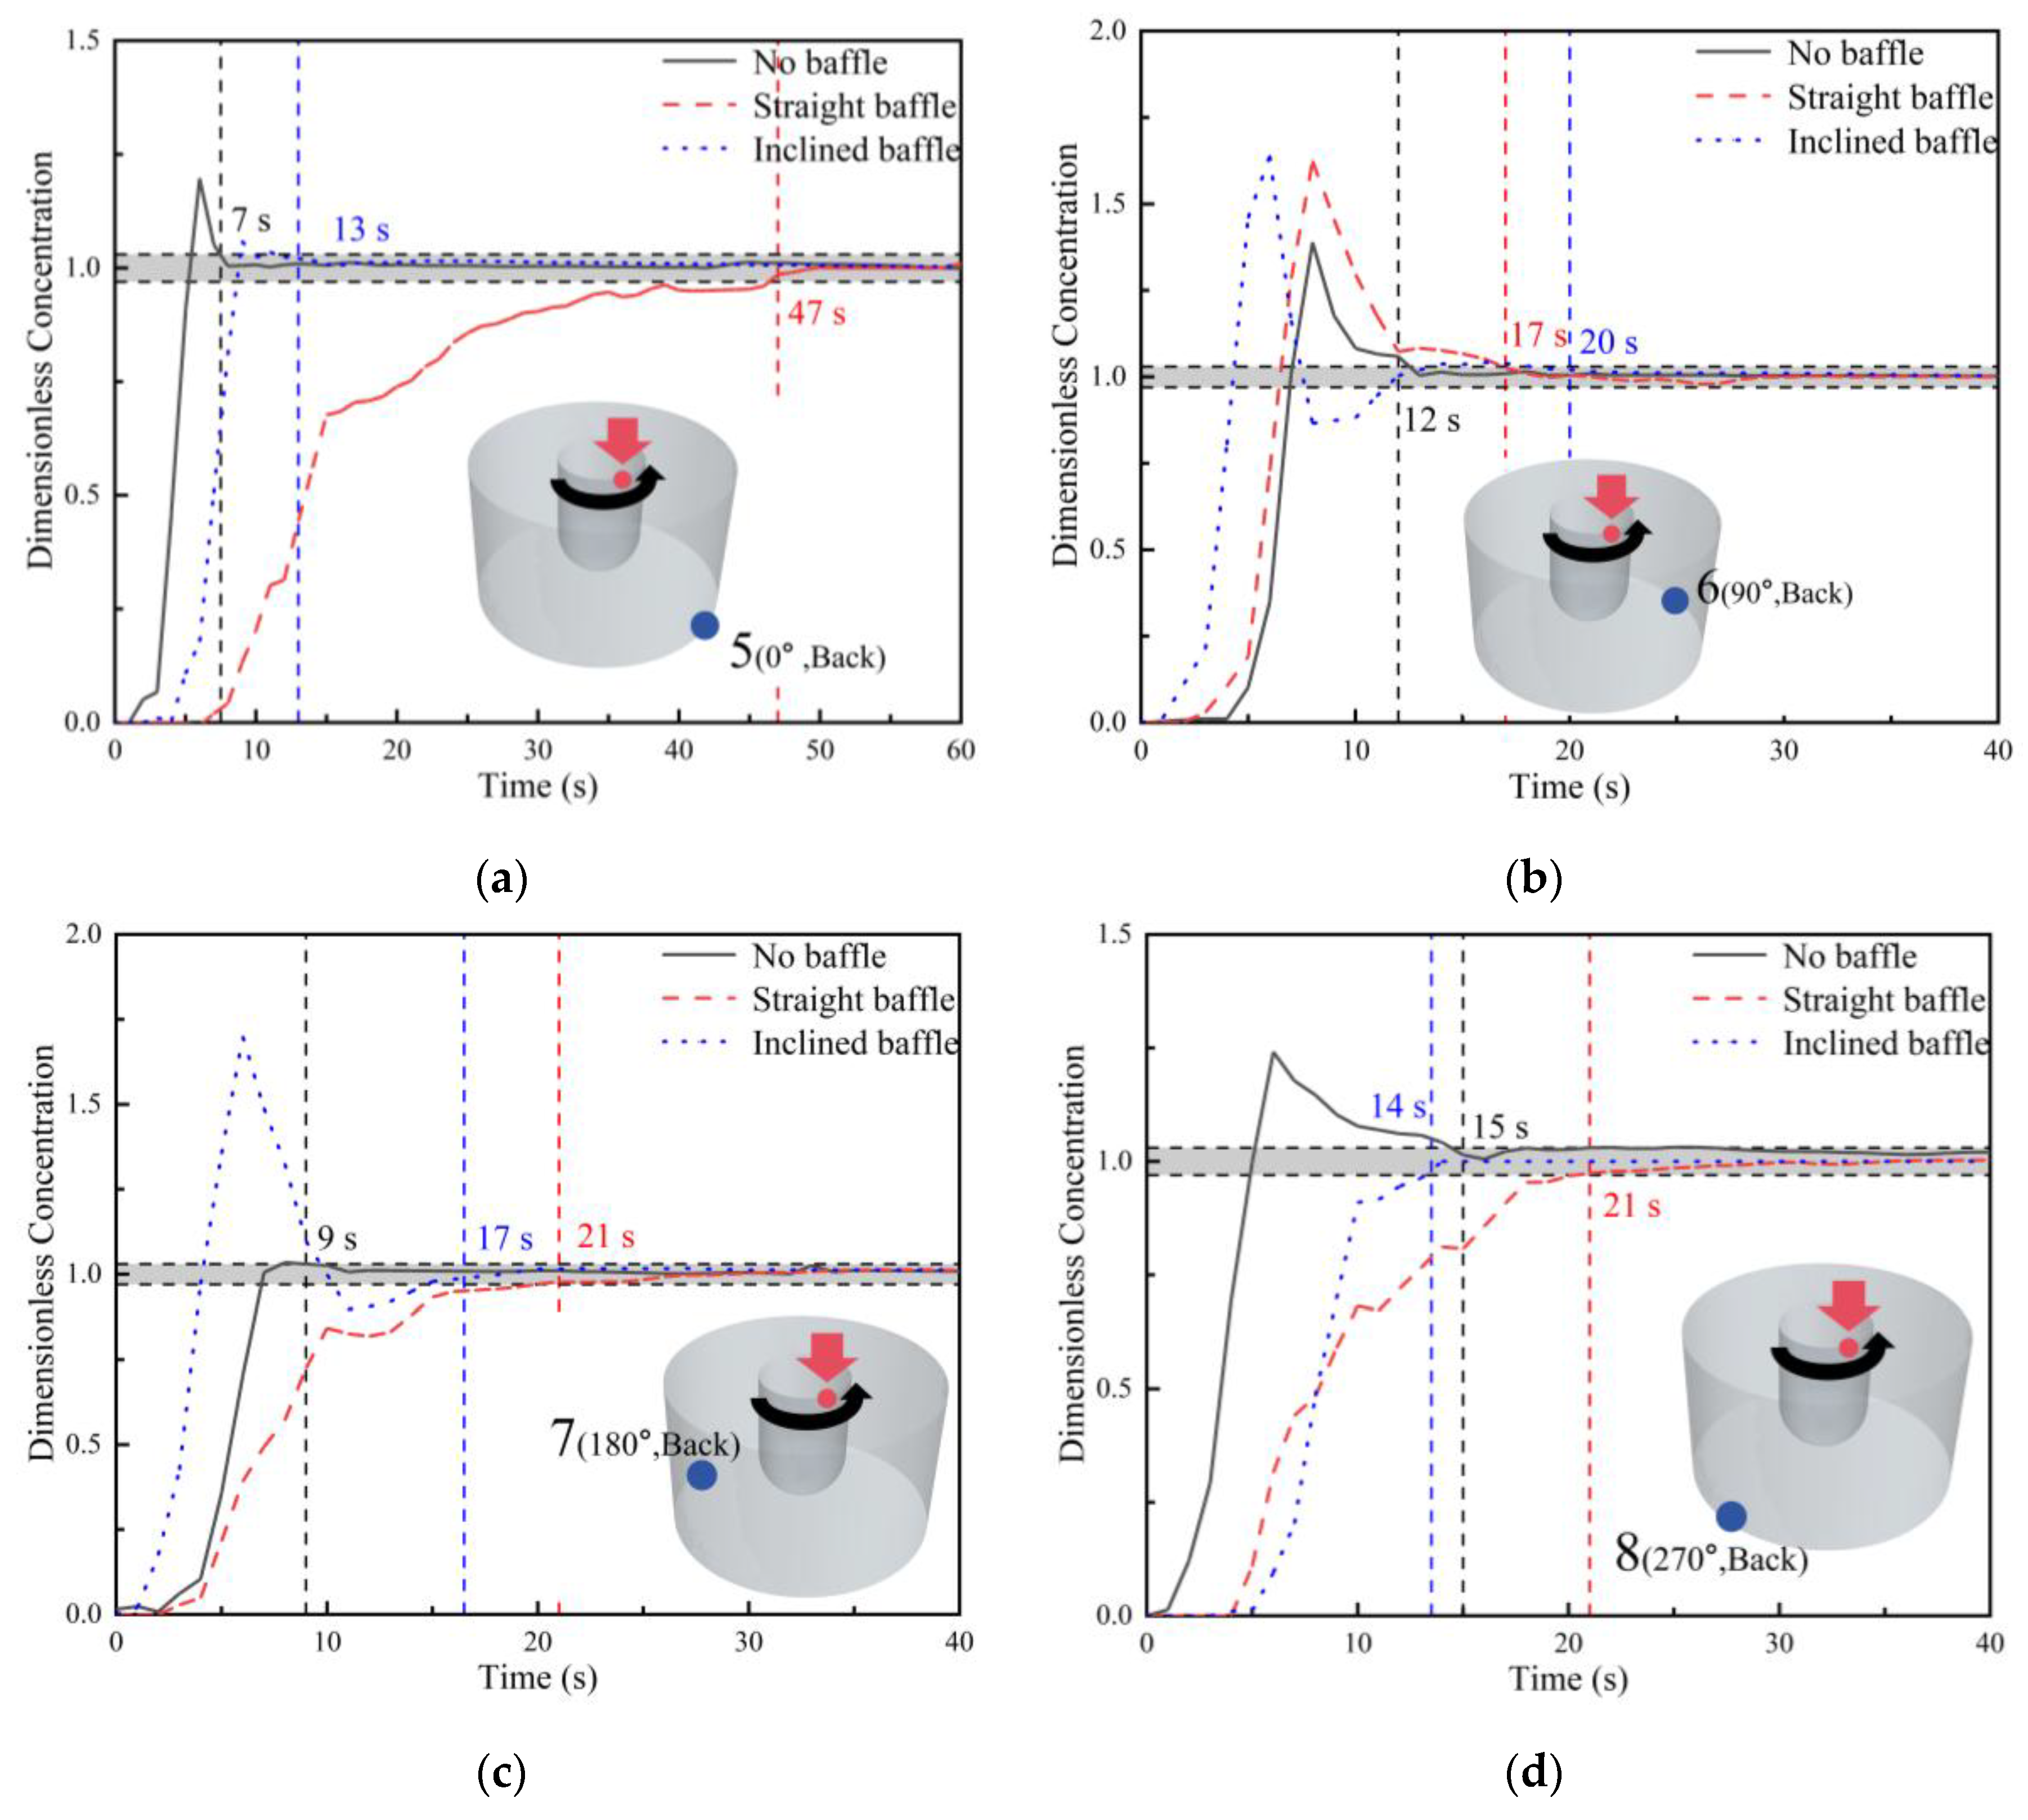
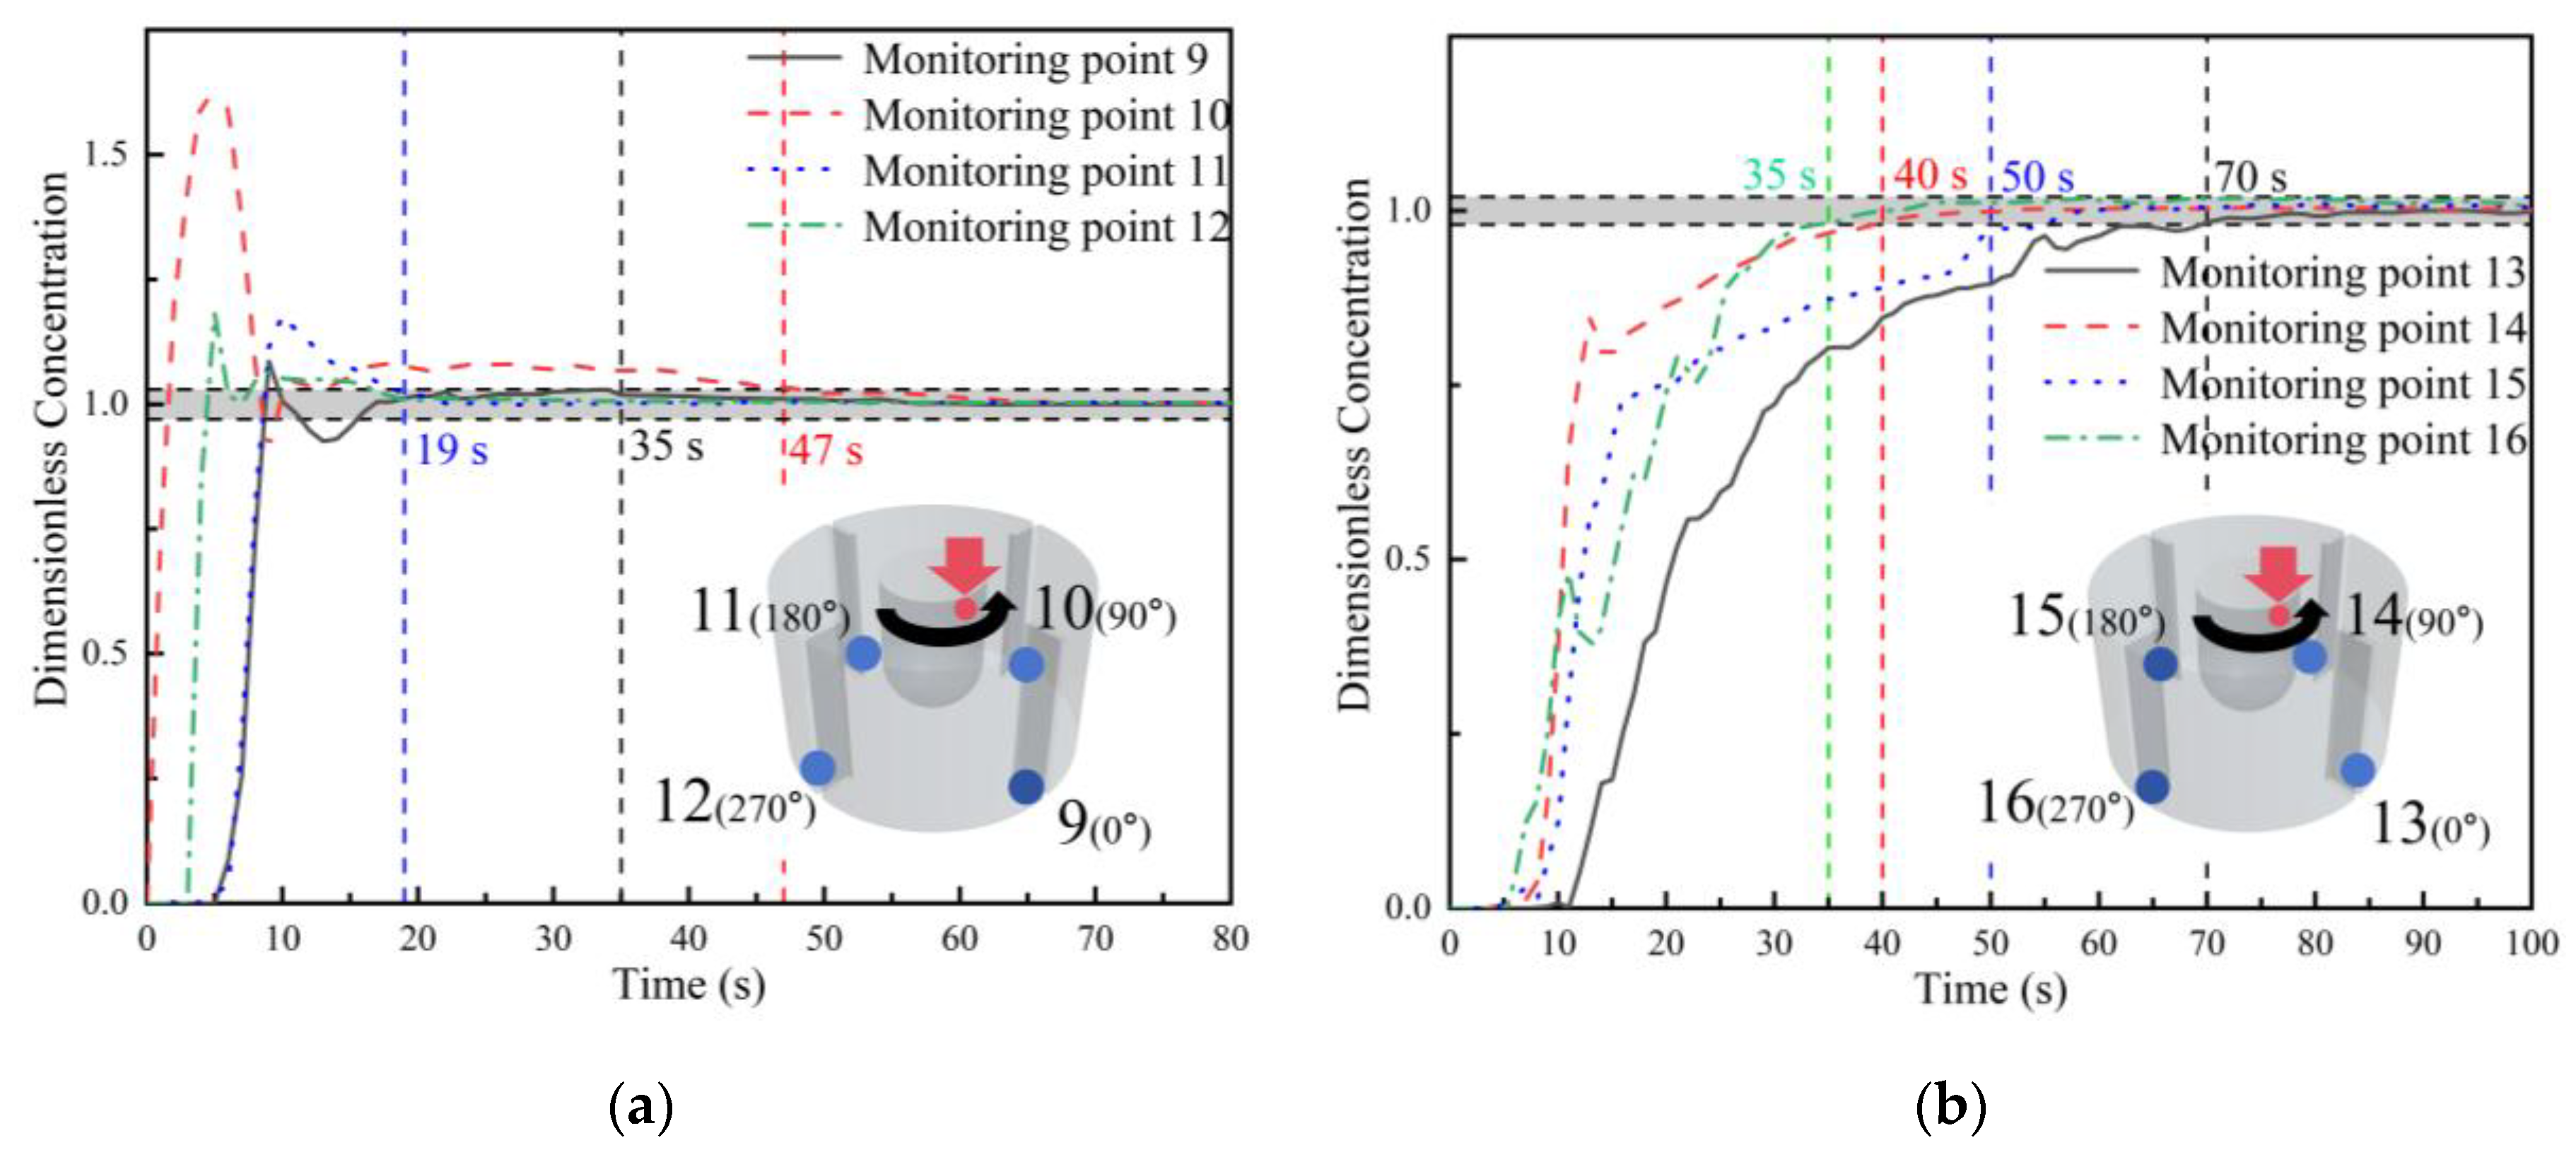
As shown in Figure 15a, among monitoring points 9–11, the curve at monitoring point 10 exhibited a rapid rise followed by a decline, with a relatively high peak concentration. Its response time was the same as that of monitoring point 2, and the concentration changed rapidly at the very beginning of monitoring, indicating that the baffle could quickly intercept the tracer near the crucible wall and force it to move downward, Moreover, the mixing time at this location was relatively long, and complete mixing was not achieved until 47 s. This phenomenon indicates that the straight baffle can effectively hinder the tracer thrown outward from the crystallizer surface, forcing it to move downward along the baffle and remain and accumulate in the bottom region. It can therefore be inferred that, during the rotational segregation process, impurities migrating outward from the crystallizer surface may exhibit a similar transport tendency. As a result, they may be kept away from the solidification interface to a certain extent, thereby reducing the probability of being captured by the solidification interface and improving the purification efficiency. Monitoring points 9 and 11 had the same response time, namely 5 s, and their curves showed a high degree of overlap. The response time at monitoring point 12 was 3 s, slightly earlier than those at monitoring points 9 and 11. As shown in Figure 13a, the flow stream carried into the main flow region by crystallizer rotation split into two branches after half a turn of annular circulation. One branch was thrown toward monitoring point 12 (the 270° baffle position), while the other was thrown downward toward monitoring point 9 (the 0° baffle position). After passing monitoring points 9 and 12, both branches were carried away by the main flow region, resulting in a small peak at both monitoring points. Because the tracer transport path to monitoring point 9 was longer, its response time was later than that at monitoring point 12. In contrast, the tracer blocked by the baffle at the 90° position moved downward along the baffle, diffused toward the crucible interior after reaching the bottom, and then entered the bottom recirculation flow, by which it was transported to monitoring point 11. Because the velocity of the bottom recirculation flow was relatively low, the response time at monitoring point 11 was relatively long and was the same as that at monitoring point 9.
As shown in Figure 15b, among monitoring points 13–16, none of the tracer concentration curves showed a distinct peak, although their rising trends and response times differed. The tracer concentration curve at monitoring point 14 increased the fastest. This is because a relatively large amount of tracer was present at monitoring point 10, and after bypassing the baffle, it diffused to the position of monitoring point 14. Monitoring point 13 (behind the 0° baffle) showed a relatively long response time, and its tracer concentration curve did not begin to increase until 10 s. Because the tracer concentration at monitoring point 9 (in front of the 0° baffle) showed no obvious peak and only began to respond at 5 s, most of the tracer had already diffused into the crucible interior by the time it reached monitoring point 9, and there was no distinct concentrated tracer stream. Therefore, the tracer concentration at monitoring point 13 increased slowly. The tracer concentration curves at monitoring points 15 and 16 were similar, and both had a response time of 4 s, resembling the curve at monitoring point 11. Monitoring point 12, located in front of the 270° baffle, responded rapidly, whereas monitoring point 16, which is behind the baffle, increased relatively slowly, indicating that the 270° baffle had a strong blocking effect on tracer transport.
After the installation of straight baffles, the main flow stream was subjected to obvious obstruction and redistribution by the baffles. Several monitoring points in front of the baffles showed high peaks and short response times, whereas the monitoring points behind the baffles exhibited delayed response and gradual increase characteristics. It is worth noting that monitoring point 10 showed a peak and a very short response time, but its subsequent mixing time was relatively long compared with those at the other monitoring points. The tracer concentration at monitoring point 10 continued to decrease and did not reach complete mixing until 47 s. This indicates that, at a crystallizer rotational speed of 200 rpm, the tracer added from the crystallizer surface tended to remain near monitoring point 10 and diffused relatively slowly.
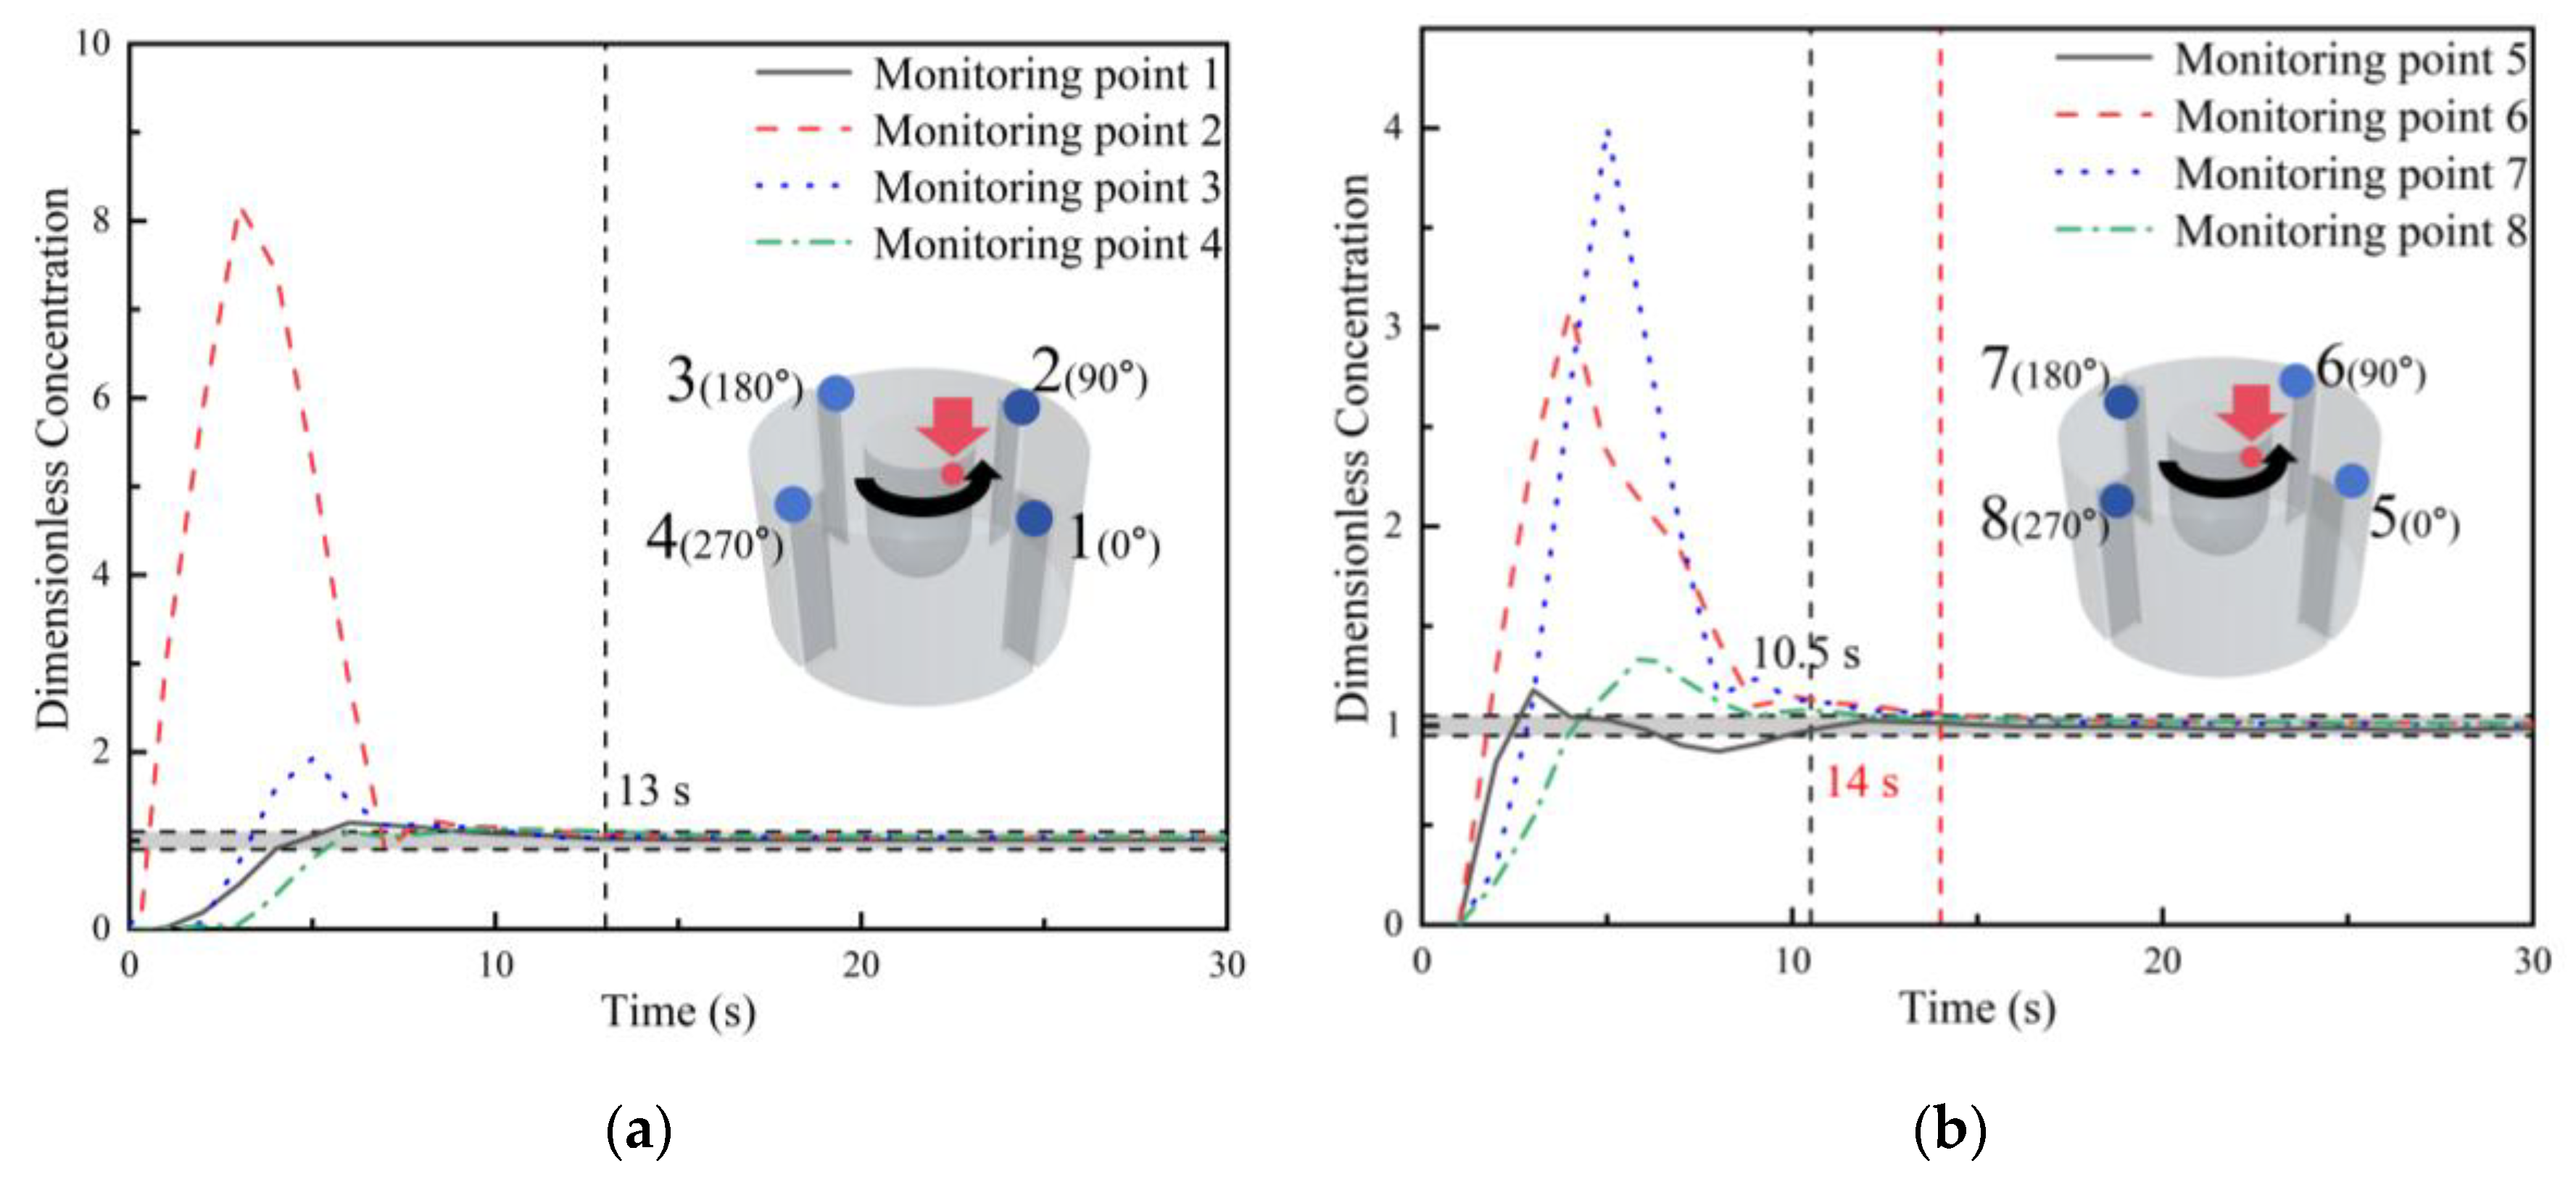
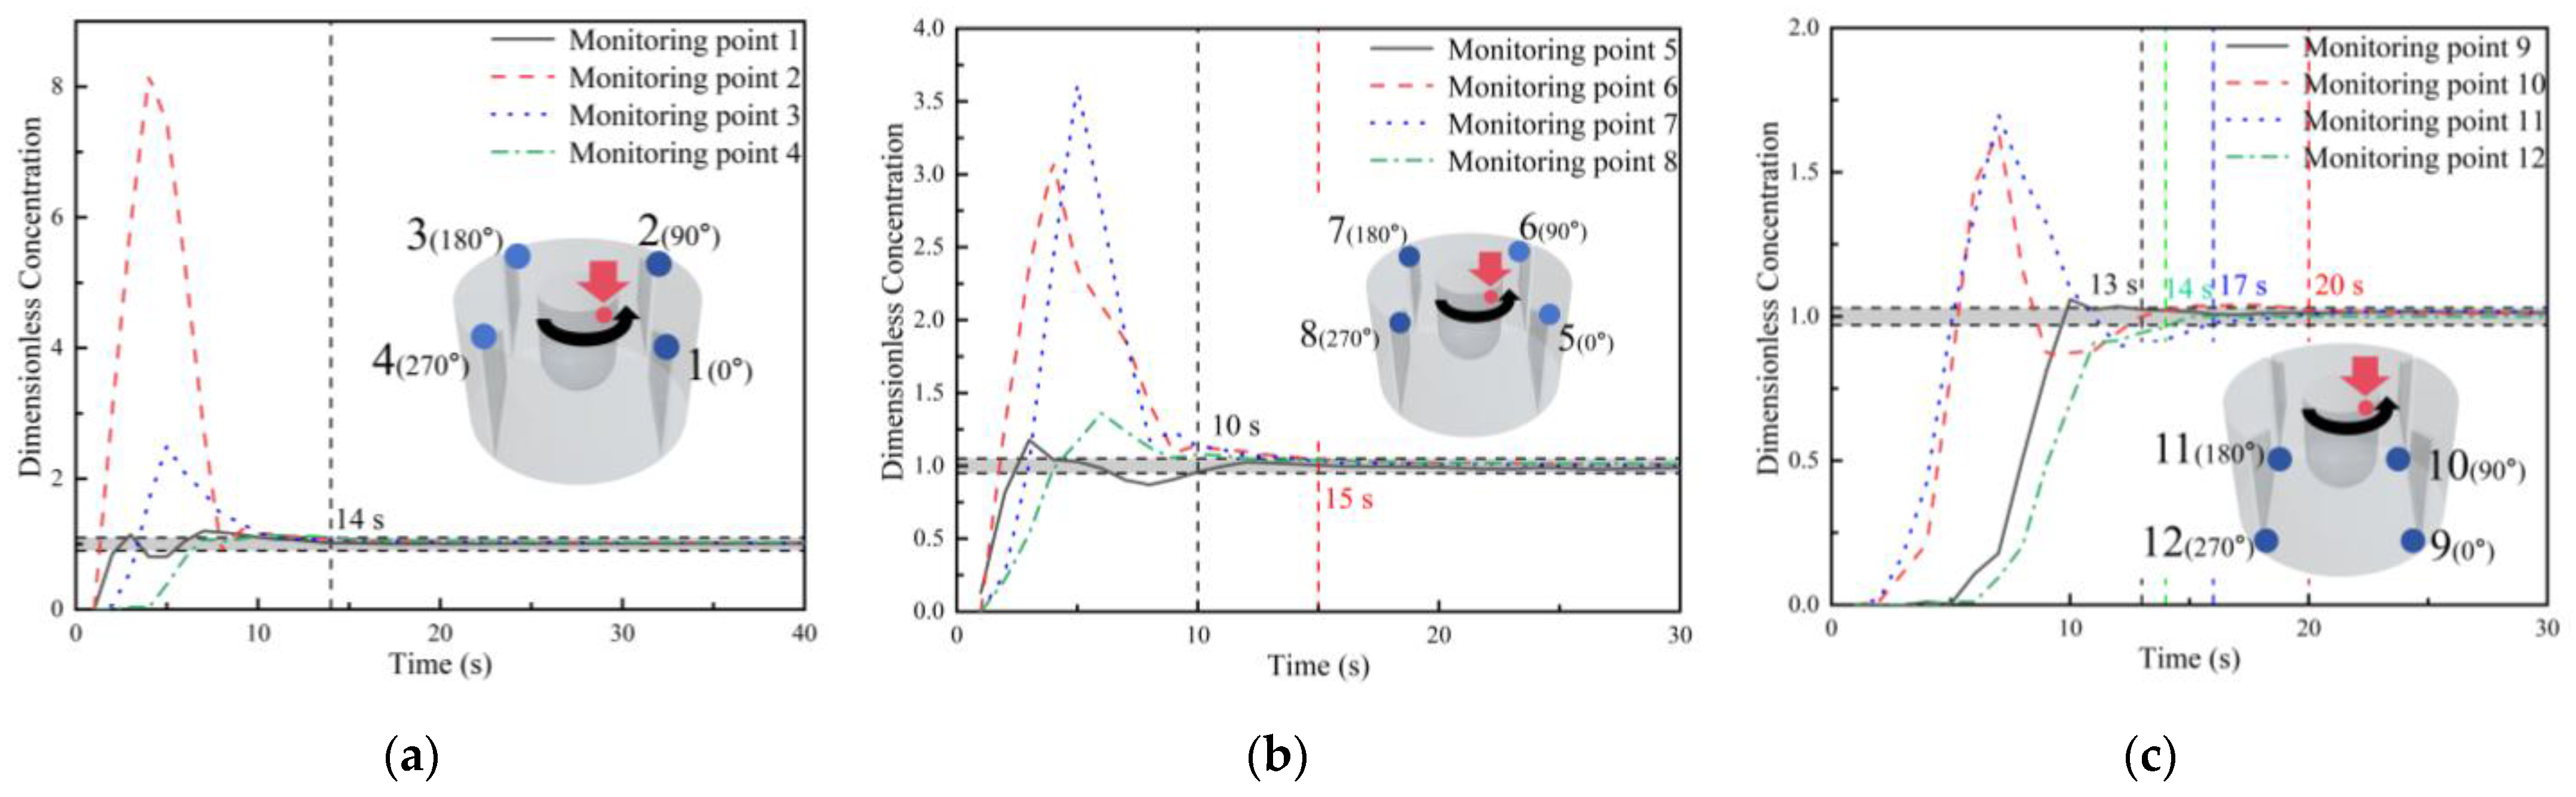
When the crystallizer rotational speed increased to 300 rpm, as shown in Figure 16a, among monitoring points 1–4, the tracer concentration curves at all points except monitoring point 3 were basically similar to those at 200 rpm. Monitoring point 2 still exhibited a relatively high peak, indicating that even after the rotational speed increased, a large amount of tracer was still thrown toward monitoring point 2. The tracer concentration curves at monitoring points 1 and 4 increased gradually until complete mixing was reached. At monitoring point 3, a small peak appeared, which was different from the behavior observed at 200 rpm. Combined with the ink transport path shown in Figure 13b, this suggests that, at the initial stage after ink addition, part of the ink was rapidly carried into the vicinity of monitoring point 3 by the high-speed rotational flow generated by the crystallizer, thereby producing this peak.
As shown in Figure 16b, for monitoring points 5–8 behind the upper baffles, the response time at each point was 3 s, and all curves exhibited peaks to different extents. This indicates that in the region behind the upper baffles of the crystallizer, tracer could reach the rear side of the baffles regardless of the angular position relative to the tracer injection point. Monitoring point 6 showed a curve similar to that at monitoring point 2 in front of the baffle. In both cases, the curve rose rapidly and then decreased rapidly to the mixed state, but the response time at monitoring point 6 was later. Combined with the ink transport path in Figure 13b, the rise in tracer concentration at monitoring point 6 can be attributed to the fact that too much tracer was thrown toward monitoring point 2, so the baffle could not completely block the tracer flow, and part of the tracer bypassed the baffle and reached monitoring point 6. Therefore, the response at monitoring point 6 lagged behind that at monitoring point 2. Although monitoring point 7 and monitoring point 3 were separated by only one baffle, their tracer concentration curves differed greatly, and the peak at monitoring point 7 was even higher than that at monitoring point 6. According to the ink transport schematic, the relatively high rotational speed of the crystallizer strengthened the flow field inside the crucible. After a large amount of tracer was entrained into the main rotational flow generated by the crystallizer, it was thrown toward the wall under centrifugal force with a relatively high initial velocity. As a result, instead of being thrown in front of the 180° baffle, the tracer bypassed the baffle directly and reached the region behind it. The concentrated tracer stream then flowed directly to monitoring point 7, leading to an extremely high tracer concentration peak at this point. Monitoring points 5 and 8 also exhibited peaks, but their peak concentrations were relatively low. This is because the circulation at the free surface caused a large amount of tracer to be thrown toward the 90° and 180° baffles. When the flow rotated to the 270° and 0° positions, only a small amount of tracer remained to be thrown outward by centrifugal force. Therefore, peaks still appeared at monitoring points 5 and 8, but their magnitudes were relatively low.
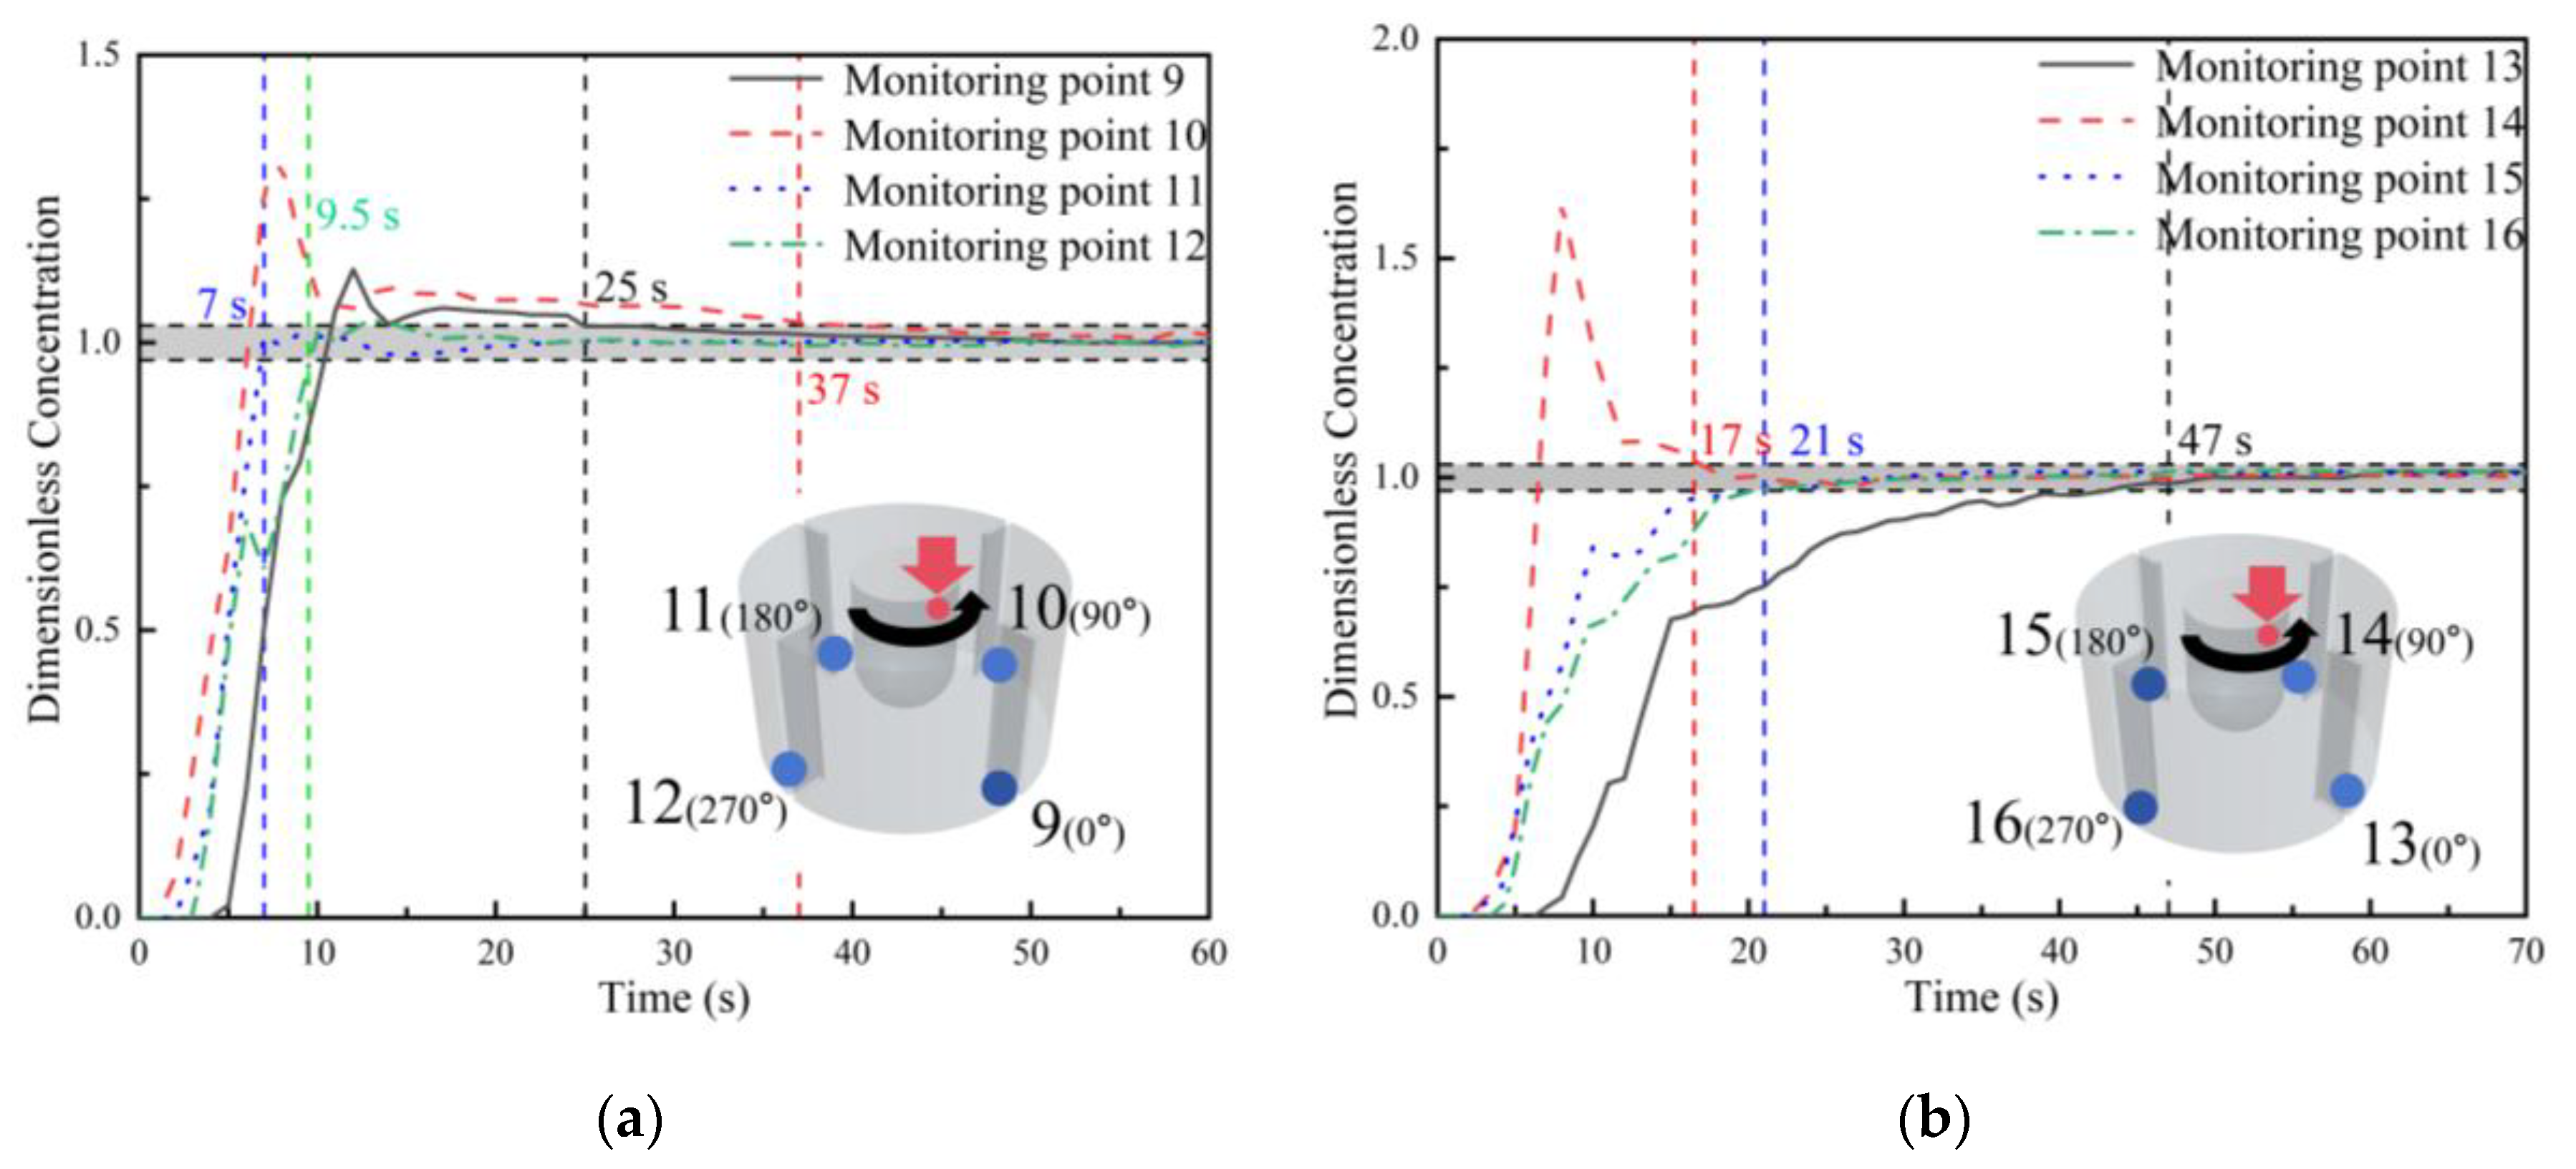
As shown in Figure 17a, at monitoring points 9–11, the response times of the monitoring points in front of the bottom baffles were different. Among them, monitoring point 10 at the 90° position responded first, and its variation trend was similar to that of monitoring point 1, although its peak was much lower than that at monitoring point 1. At monitoring point 10, the concentration rose rapidly at 1 s and then decreased gradually, reaching complete mixing only at 37 s. This is because the tracer thrown downward from the upper region diffused rapidly along the baffle from monitoring point 1 and first reached the vicinity of monitoring point 10. However, because a relatively low-velocity region existed in front of the baffle, the tracer could not diffuse rapidly, which prolonged the mixing process. A small peak also appeared at monitoring point 9, whereas no peak was observed at the corresponding upper monitoring point 1. Combined with the ink transport pattern shown in Figure 13b, after circulating around the crystallizer, the ink moved obliquely downward to the position of monitoring point 9 and was then carried away by the main flow, resulting in a small peak followed by a gradual decline until mixing was reached. The tracer concentration curves at monitoring points 11 and 12 both showed a slowly increasing parabolic shape. Monitoring points 11 and 12 were located directly below monitoring points 3 and 4, respectively. Although a peak appeared at monitoring point 3, it was very small. During the downward movement along the baffle, the tracer diffused and did not reach monitoring point 11 as a concentrated stream, so the curve showed a gradual increase.
As shown in Figure 17b, among monitoring points 13–16, the tracer concentration curves at all points except monitoring point 14 showed a slowly increasing parabolic shape. A distinct peak appeared at monitoring point 14, and its tracer concentration curve was similar to that at monitoring point 10, but the peak at monitoring point 14 was higher than that at monitoring point 10. This is because a relatively large amount of tracer moved rapidly downward along the baffle, and before completely reaching the bottom, part of the tracer diffused toward the interior of the crucible. It was then transported obliquely downward toward monitoring point 14 by the rotational flow induced by the crystallizer. As a result, the tracer concentration at monitoring point 14 was higher than that at monitoring point 10. Monitoring point 13 corresponded to monitoring point 9 in front of the baffle. Although a small peak appeared at monitoring point 9, this peak disappeared at monitoring point 13. This is because when the tracer reached the bottom of the baffle, it diffused toward the crucible interior and was dispersed at the same time, then bypassed the baffle and diffused to monitoring point 13. Therefore, the response time at monitoring point 13 was also longer than that at monitoring point 9. The tracer concentration curves at monitoring points 15 and 16 were similar to those at monitoring points 11 and 12, both showing a slowly increasing parabolic shape. This indicates that the tracer reached all four of these monitoring points mainly through diffusion.

3.3.3. Flow-Field Transport Process Inside the Crucible Under the Inclined-Baffle Condition

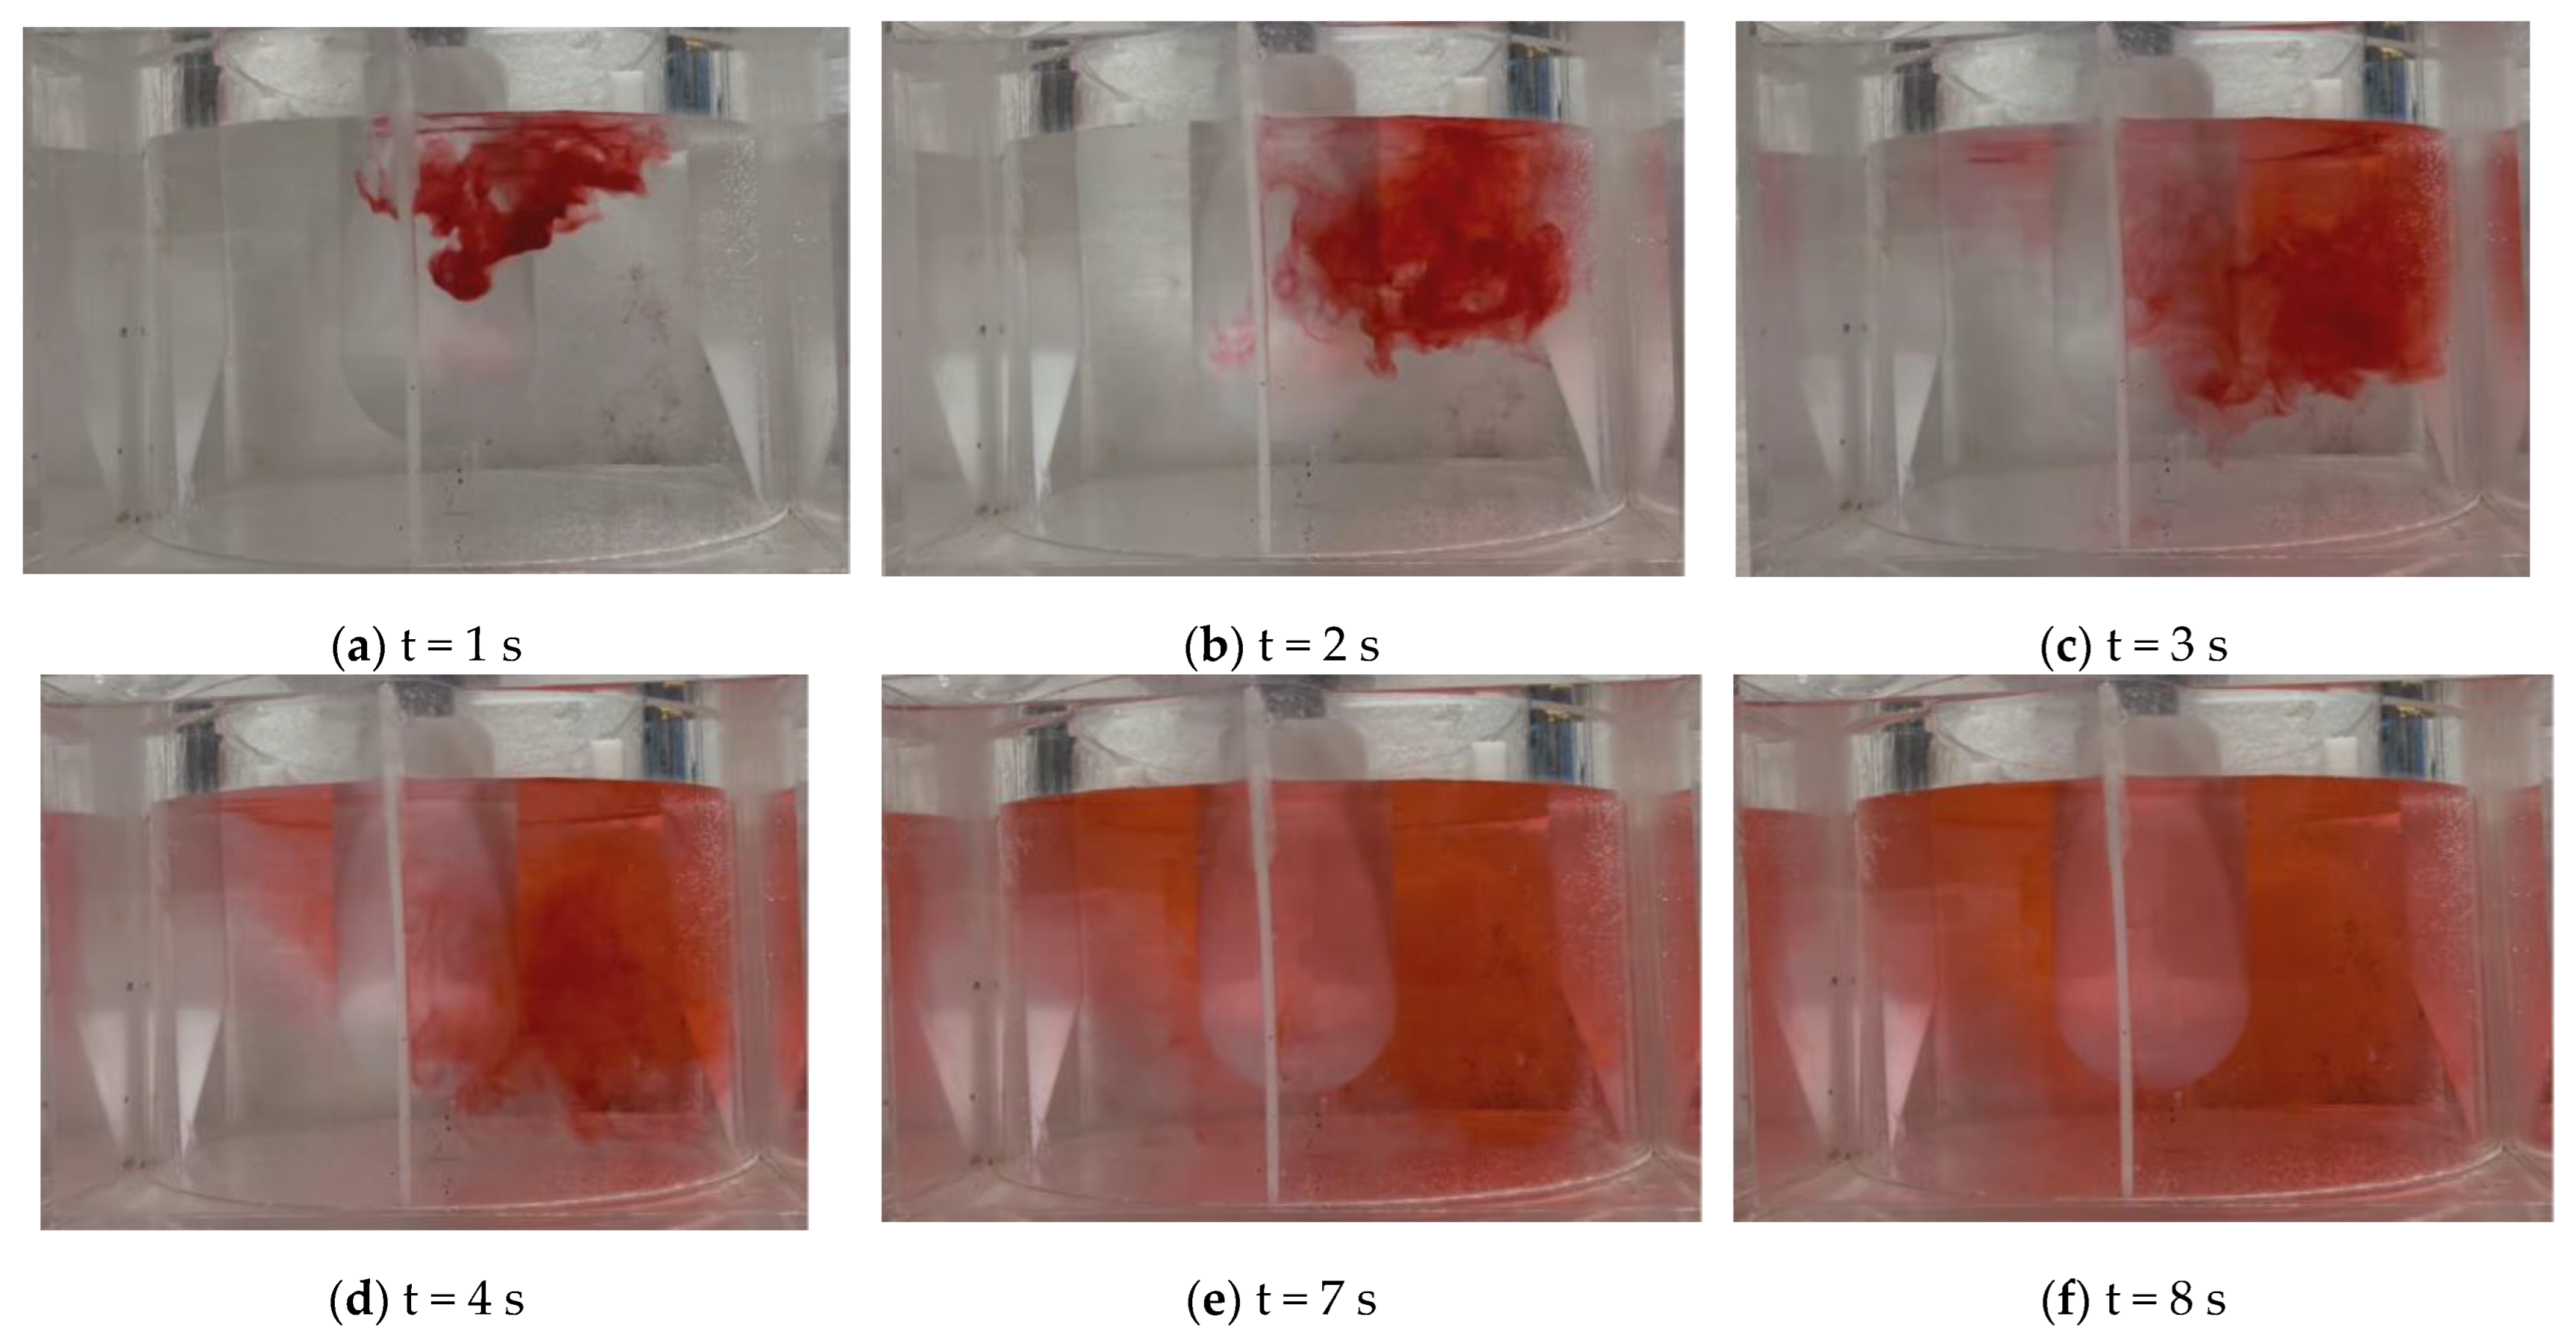
Under the inclined-baffle condition, the ink transport process at a crystallizer rotational speed of 200 rpm is shown in Figure 18. At 1 s, after the ink was added near the crystallizer surface, part of the ink diffused toward the middle region of the crucible, while the rest was transported along the rotational direction of the crystallizer. At 2 s, the ink continued to diffuse downward, and part of it was thrown toward the crucible wall and reached the 90° baffle. By 3 s, the ink on the right side of the crystallizer continued to diffuse downward, and the ink had already spread to the free-surface region on the left side of the crystallizer. At 4 s, the ink on the right side of the crystallizer had reached the bottom of the crucible. The ink was transported downward on the right side of the crystallizer, whereas a relatively large blank region still existed in the crucible on the left side of the crystallizer. At 7 s, the diffusion of the ink on the right side of the crystallizer was basically completed, and the color of the ink in the middle and upper regions on the left side became darker. However, under the straight-baffle condition, the ink had already filled the entire crucible by 7 s. Under the inclined-baffle condition, the overall flow pattern changed significantly compared with that under the straight-baffle condition. Strong flow existed mainly in the middle and upper regions of the crucible, whereas the flow near the crucible bottom was relatively weak, and a blank region still remained at the bottom on the left side of the crucible. At 8 s, the entire crucible was almost completely filled with red ink. However, even at this time, a small blank region still remained near the bottom of the left baffle on the crystallizer left side (the 270° baffle position).
When the crystallizer rotational speed increased to 300 rpm, the ink transport process is shown in Figure 19. At 1 s, immediately after the ink was added, a small red ink region had already appeared on the right side of the crystallizer. This indicates that, after the rotational speed increased, part of the ink immediately entered the main flow region inside the crucible, before being thrown toward the baffle by centrifugal force. At 2 s, the ink in the region on the right side of the crystallizer moved toward the crucible wall and diffused under the action of centrifugal force. At 3 s, when the ink in the right-side region encountered the baffle, it rapidly moved downward. Owing to the blocking effect of the baffle, the ink on the left side of the crystallizer was still very dilute at this time. At 4 s, the ink on the right side reached the bottom of the baffle. Because the blocking effect of the inclined baffle near its bottom was limited, the color of the ink on the left side of the crystallizer became deeper. At 5 s, the entire crucible was almost completely filled with red ink.
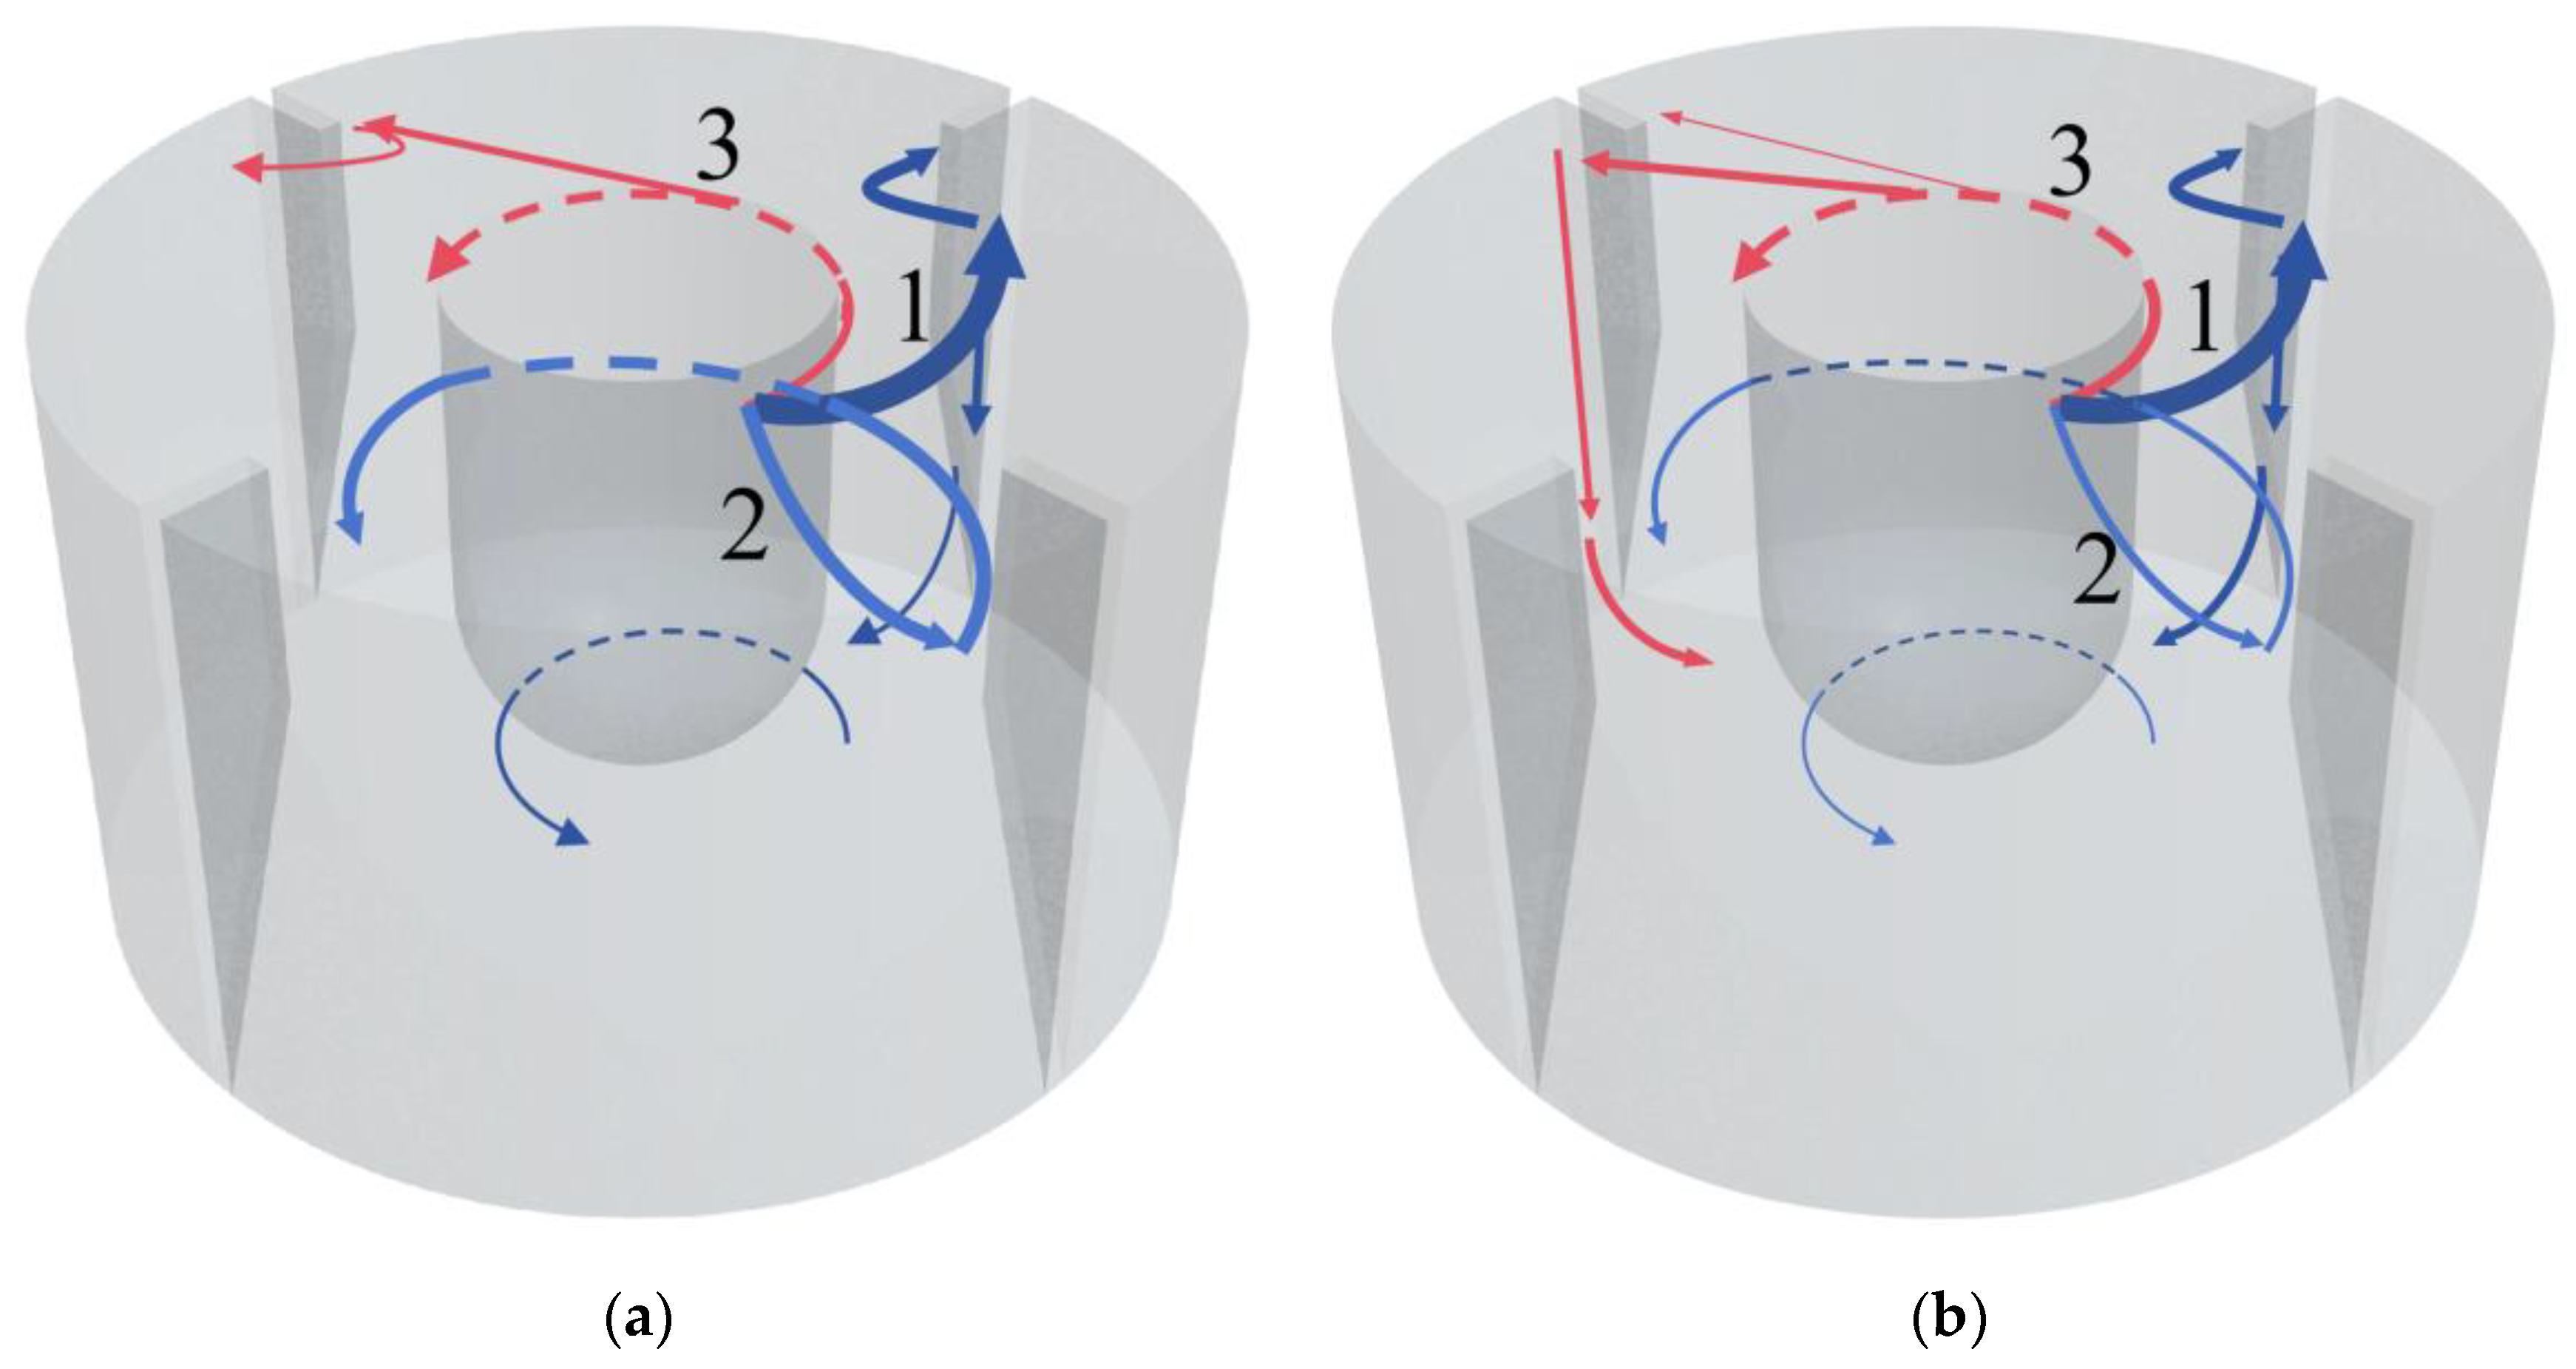
As shown in Figure 20, the flow-field transport process under the inclined-baffle condition is presented. The numbers represent the quantity of mainstream streams, solid lines represent the visible flow trajectories, whereas dashed arrows indicate the flow trajectories in the regions blocked by the crystallizer. The thickness of the streamlines reflects the relative strength of the corresponding flow streams.
As shown in Figure 20a, at a crystallizer rotational speed of 200 rpm, the ink moved inside the crucible in three streams. Stream 1 was the main flow stream, and its transport mode was similar to that of Stream 1 under the straight-baffle condition. However, when it reached the inclined section of the baffle, part of the fluid was guided downward along the baffle wall by the flow-guiding effect of the inclined baffle and then entered the annular flow at the bottom of the crucible. In Stream 2, the ink first moved obliquely downward toward the middle and upper regions of the crucible under gravity. It was then transported circumferentially around the crystallizer in the direction of crystallizer rotation until it reached the left side of the crystallizer. Stream 3 rapidly spread in an annular pattern along the rotational direction of the crystallizer at the free surface. It was then thrown toward the baffle under the action of centrifugal force and split into two branches, one of which moved downward along the baffle, while the other bypassed the baffle and reached the region behind the baffle.
As shown in Figure 20b, when the crystallizer rotational speed increased to 300 rpm, the ink transport path was similar to that at 200 rpm. The ink was still transported inside the crucible in three streams. However, because the increase in crystallizer rotational speed enhanced the momentum imparted to the flow, the annular flow of Stream 3 along the free surface became stronger, and the centrifugal force in the flow field also increased. After the ink rotated around the crystallizer together with the fluid inside the crucible, part of the ink was thrown by centrifugal force toward the rear side of the 180° baffle, moved downward along the baffle, and then diffused into the flow inside the crucible.
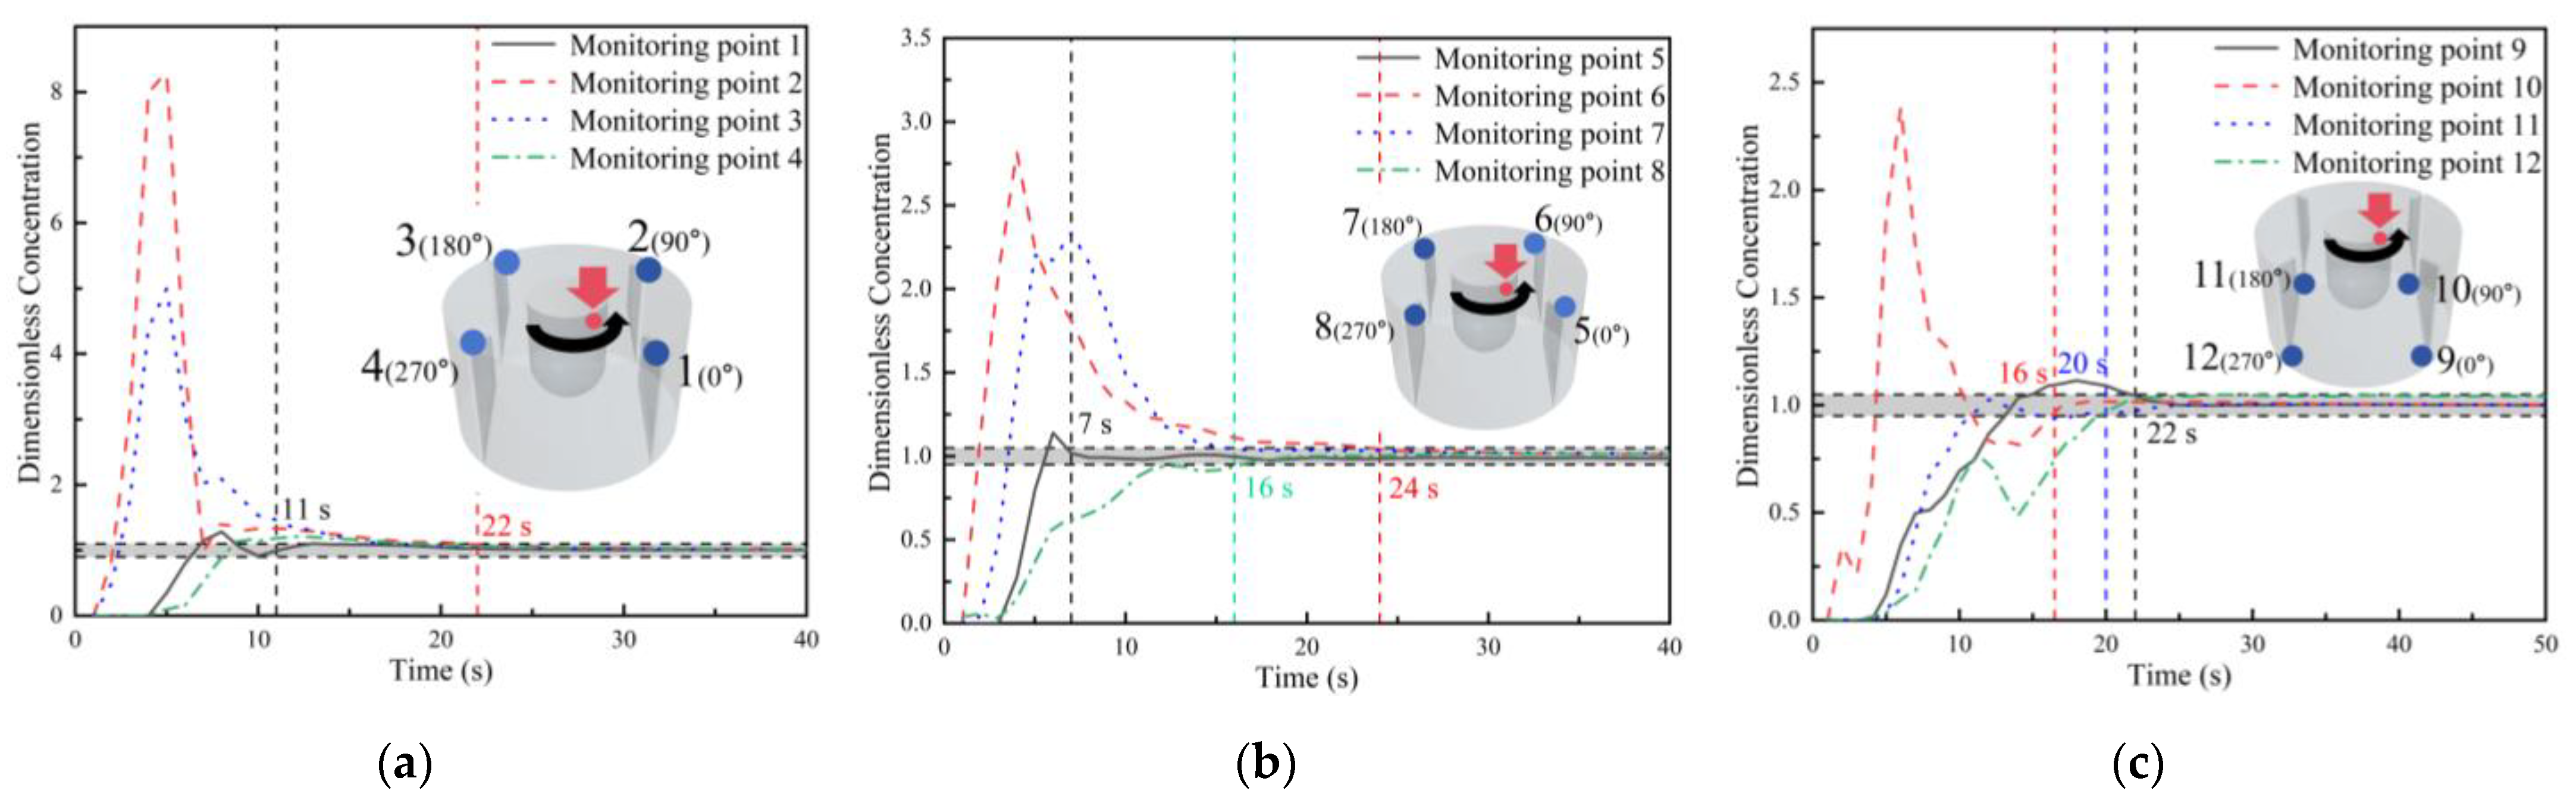
Under the inclined-baffle condition at a crystallizer rotational speed of 200 rpm, as shown in Figure 21a, among monitoring points 1–4, the tracer concentration curves at monitoring points 2 and 3 rose rapidly within 1 s after tracer addition, reached distinct peaks at 5 s, and then gradually stabilized after 22 s. The tracer concentration at monitoring point 2 exhibited a variation trend similar to that under the straight-baffle condition, indicating comparable tracer transport behavior in this region. However, the tracer concentration curve at monitoring point 3 differed markedly between the two baffle configurations. As shown in Figure 20a, after the tracer was added near the crystallizer, the ink also split into two streams, similar to the straight-baffle condition. The difference is that, under the inclined-baffle condition, the tracer was thrown toward the positions of monitoring points 2 and 3 (in front of the 90° and 180° baffles), and then moved downward along the baffles. Therefore, under the inclined-baffle condition, both monitoring points 2 and 3 showed a rapid increase followed by a decrease. The tracer concentration curves at monitoring points 1 and 4 were similar to those at monitoring points 1 and 4 under the straight-baffle condition, both showing a gradual increase and remaining significantly lower than those at monitoring points 2 and 3.
As shown in Figure 21b, the tracer concentration curves at monitoring points 5–8 behind the upper baffles were similar to those at monitoring points 5–8 under the straight-baffle condition. Monitoring points 6 and 7 both showed relatively obvious peaks 1 s after tracer addition, after which the concentration gradually declined and tended to stabilize. This is because a relatively large amount of tracer was thrown toward monitoring points 2 (in front of the 90° baffle) and 3 (in front of the 180° baffle), and the initial momentum of the tracer was relatively large. As a result, the tracer was not completely blocked by the baffles, but bypassed them and reached the positions of monitoring points 6 and 7. The tracer concentration curves at monitoring points 5 and 8 were similar to those at monitoring points 1 and 4. The curves began to rise after 4 s and showed a gradual increase before approaching a stable state. Although monitoring point 5 responded relatively late, it reached complete mixing at 7 s. In contrast, monitoring points 6 and 7, which responded first, did not gradually reach complete mixing until 24 s.
As shown in Figure 21c, among monitoring points 9–12 in front of the bottom baffles, monitoring point 10 responded at 1 s, increased rapidly to a relatively high peak, and then decreased rapidly before tending toward a stable state, reaching complete mixing at 16 s. This is because the tracer blocked by the 90° baffle at monitoring point 2 moved downward along the baffle to monitoring point 10. Since the bottom region was less affected by the inclined-baffle structure, this tracer was immediately carried away by the main flow generated by the crystallizer. The other monitoring points (9, 11, and 12) began to respond at 5 s. Among these monitoring points, the tracer concentration at points 11 and 12 increased gradually and then approached a stable value, indicating a relatively slow tracer transport and mixing process in these regions. At monitoring point 9 (the bottom of the 0° baffle), a small peak appeared. As shown in Figure 20a, this peak was caused by a flow stream leaving the crystallizer surface, first moving downward, then swirling upward around the crystallizer surface, and finally being thrown downward to the position of monitoring point 9.
After the installation of inclined baffles, although the flow field in the upper part of the crucible was clearly obstructed and redistributed, the momentum generated by crystallizer rotation was relatively large. As a result, the tracer blocked by the baffles continued to move downward and could not remain in the upper and middle baffle regions for a long time. After reaching the bottom of the crucible, among monitoring points 9–12 located there, only monitoring point 10 showed a tracer concentration curve characterized by a rapid rise followed by a rapid decline, with a relatively short mixing time. The tracer did not remain at this location for a long period, but was rapidly carried away by crystallizer rotation after reaching the bottom, which is unfavorable for impurity retention at this position.
As shown in Figure 22, when inclined baffles were installed and the crystallizer rotational speed was increased to 300 rpm, the tracer concentration curves at the upper monitoring points 1–8 were similar to those obtained under the straight-baffle condition at the same rotational speed. As shown in Figure 22a, among monitoring points 1–4, distinct peaks also appeared at monitoring points 2 and 3, and the peak at monitoring point 2 was much higher than that at monitoring point 3. This trend was exactly the same as that observed at monitoring points 2 and 3 under the straight-baffle condition at 300 rpm. This is because, when the crystallizer rotational speed was 300 rpm, the centrifugal force generated by crystallizer rotation was relatively strong. Under both baffle configurations, the tracer followed the same motion pattern immediately after addition: it first entered the annular main flow region and was then thrown toward the 90° and 180° baffle positions. However, because of the relatively high flow velocity associated with the annular flow, when the tracer was thrown toward the 180° position, most of it passed to the rear side of the baffle. As a result, the tracer concentration peak in front of the 180° baffle was relatively low, whereas the peak at monitoring point 7 behind the baffle, as shown in Figure 22b, was very high. The variation patterns at the other monitoring points were similar to those at the upper monitoring points under the straight-baffle condition, with differences only in mixing time.
In contrast, the tracer concentration curves at the bottom of the crucible differed markedly from those under the straight-baffle condition. As shown in Figure 22c, among monitoring points 9–12 at the crucible bottom, the tracer concentration curves at monitoring points 10 and 11 rose rapidly and exhibited peaks at 3 s, then decreased rapidly and gradually stabilized. This is because the tracer blocked by the upper part of the baffles moved downward along the baffles and reached monitoring points 10 and 11. After reaching the bottom, the tracer rapidly entered the annular main flow region and then diffused throughout the crucible. The responses at monitoring points 9 and 12 were relatively delayed, and no peaks appeared. Their curves began to respond at 6 s and were mainly characterized by a gradual increase toward a stable value. The variation trends at the upper monitoring points 1 and 4 directly above them were similar, and the increase in tracer concentration at these points was also caused by tracer diffusion to these locations.

3.4. Comparison of Transport Behavior Inside the Molten Pool Under Three Conditions

3.4.1. Transport Behavior Inside the Molten Pool at a Crystallizer Rotational Speed of 200 rpm

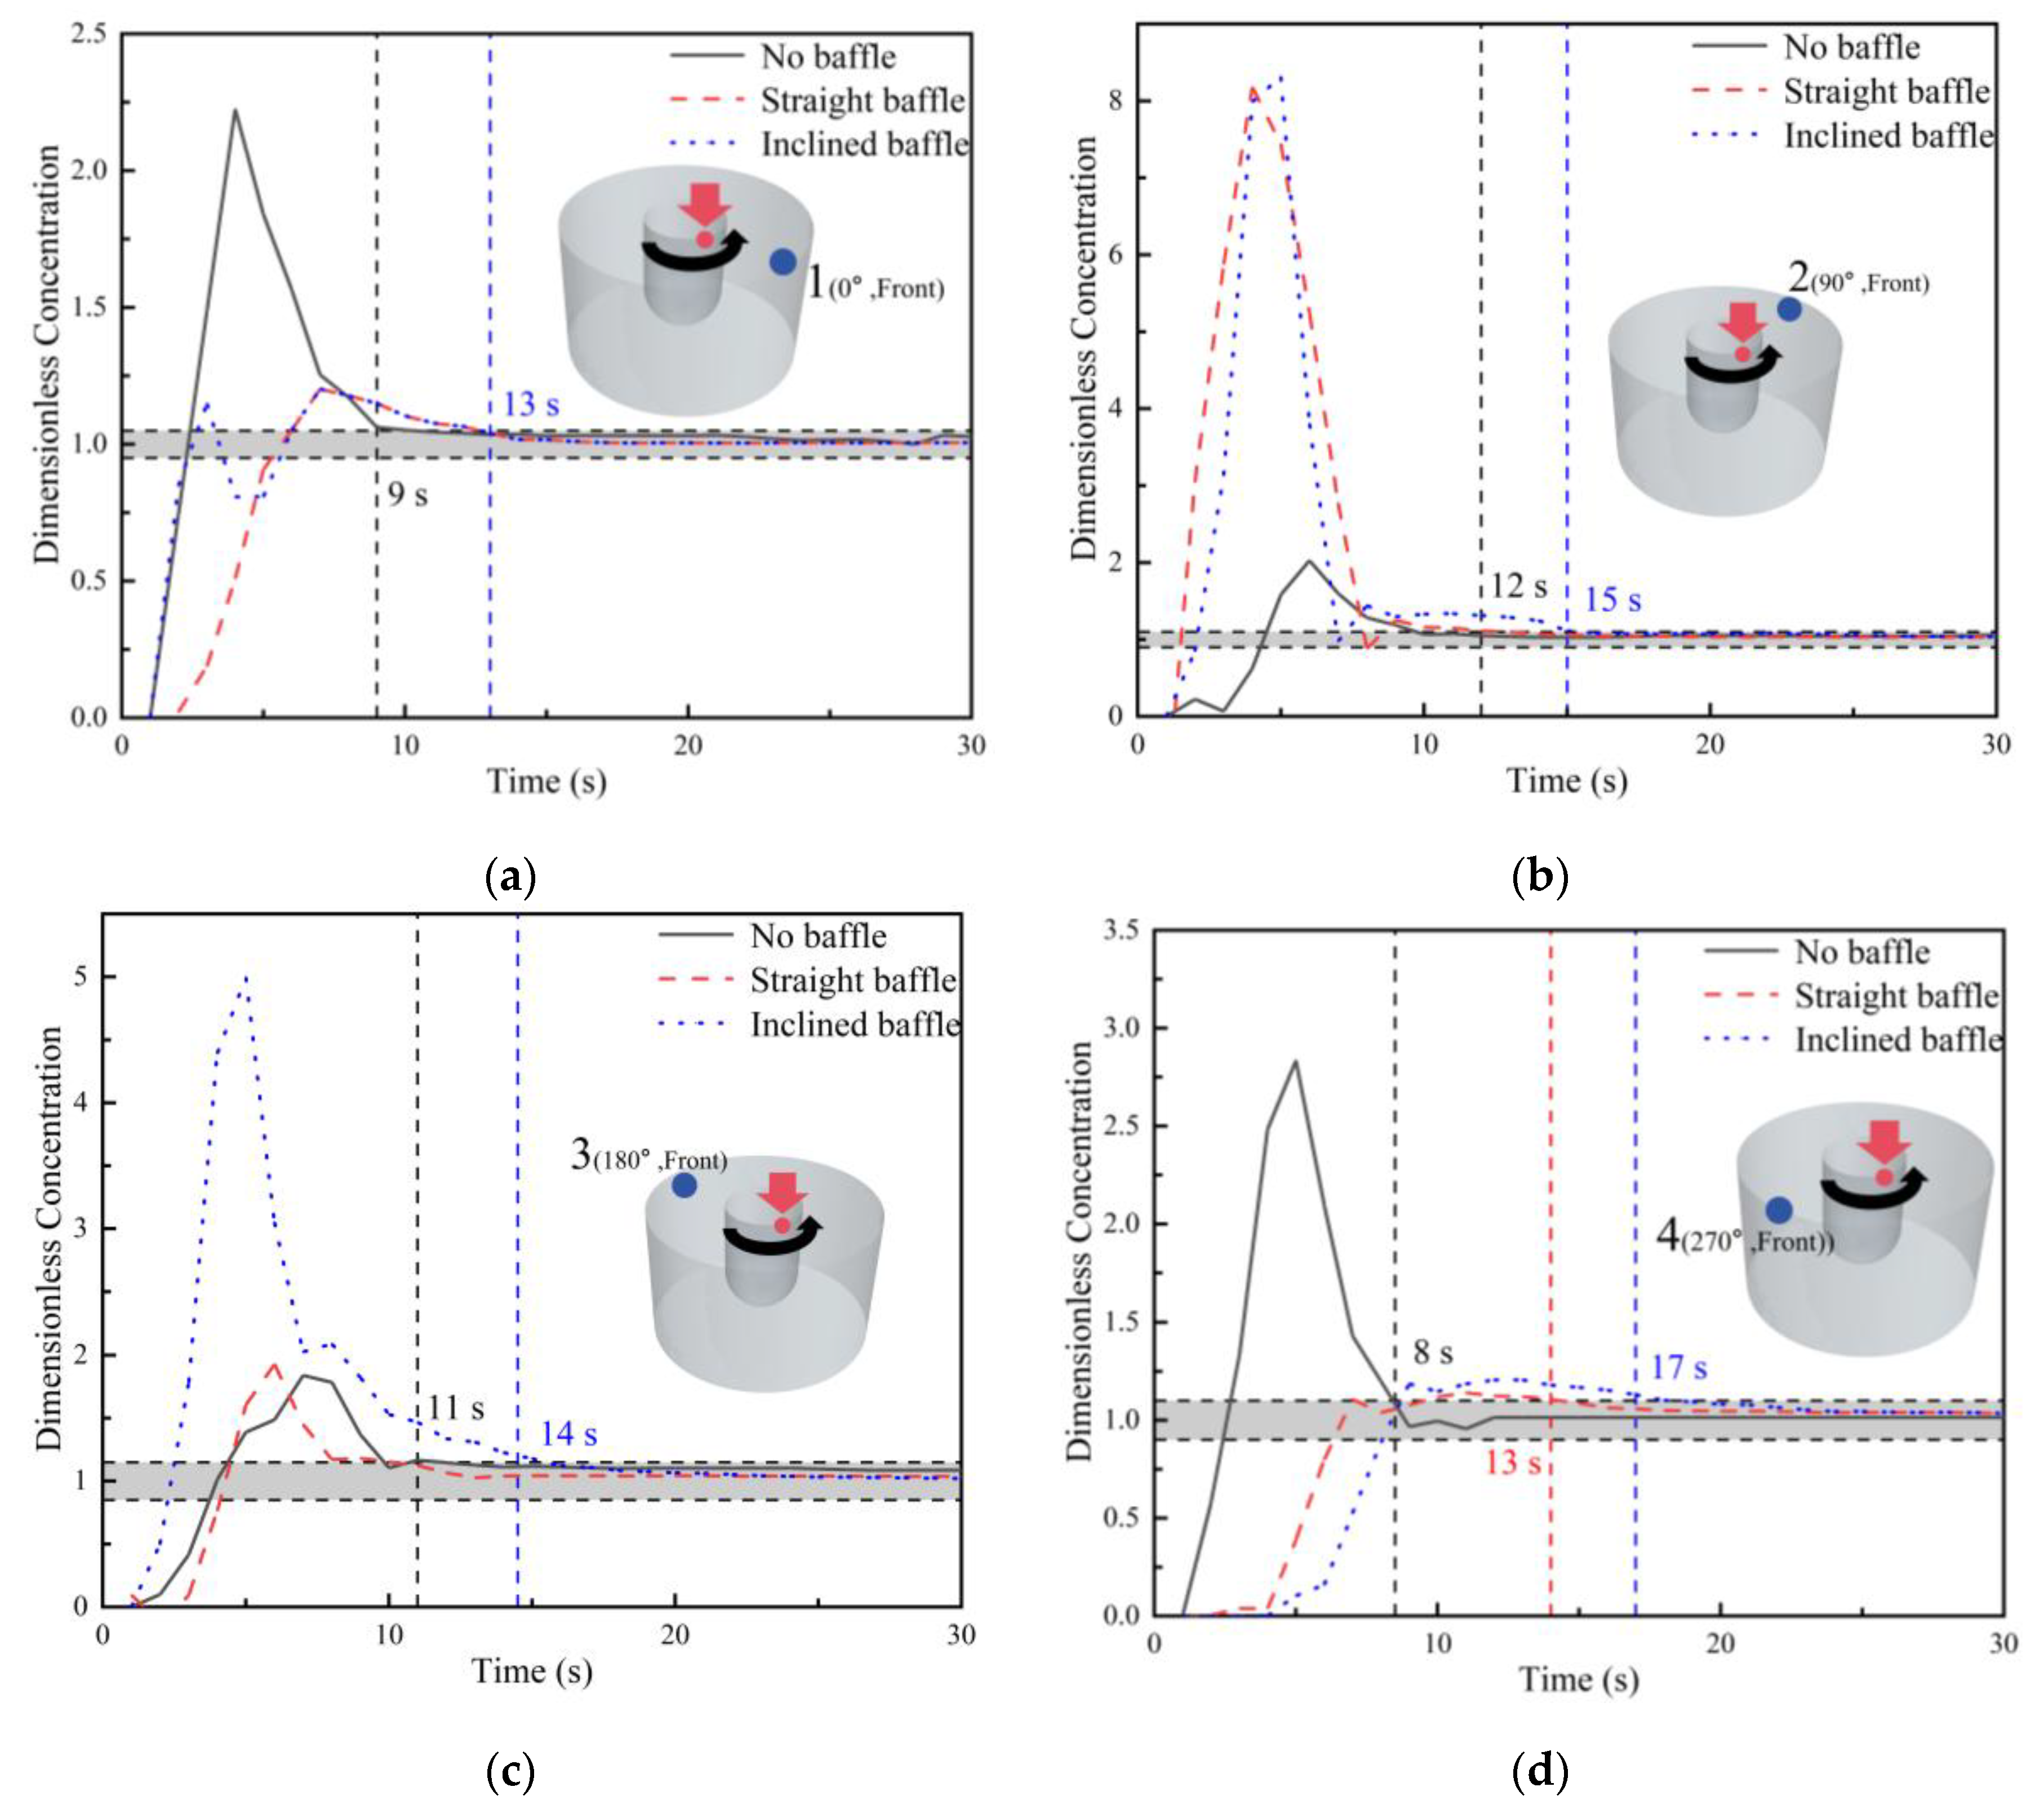
As shown in Figure 23, the tracer concentration curves at upper monitoring points 1–4 in front of the baffles under the straight-baffle and inclined-baffle conditions are compared with those at upper monitoring points 1–4 under the no-baffle condition at four different positions. As shown in Figure 23a–c, when no baffles were installed, the tracer was immediately thrown by centrifugal force toward monitoring point 1 after being added along the crystallizer surface. After the installation of straight baffles, however, the tracer was first thrown toward monitoring point 2 (the 90° baffle position). Under the inclined-baffle condition, the tracer was thrown toward both monitoring point 2 and monitoring point 3. As shown in Figure 23d, the tracer concentration curves at monitoring point 4 were similar under the straight-baffle and inclined-baffle conditions, indicating that the two baffle configurations had the same effect on tracer transport at monitoring point 4.
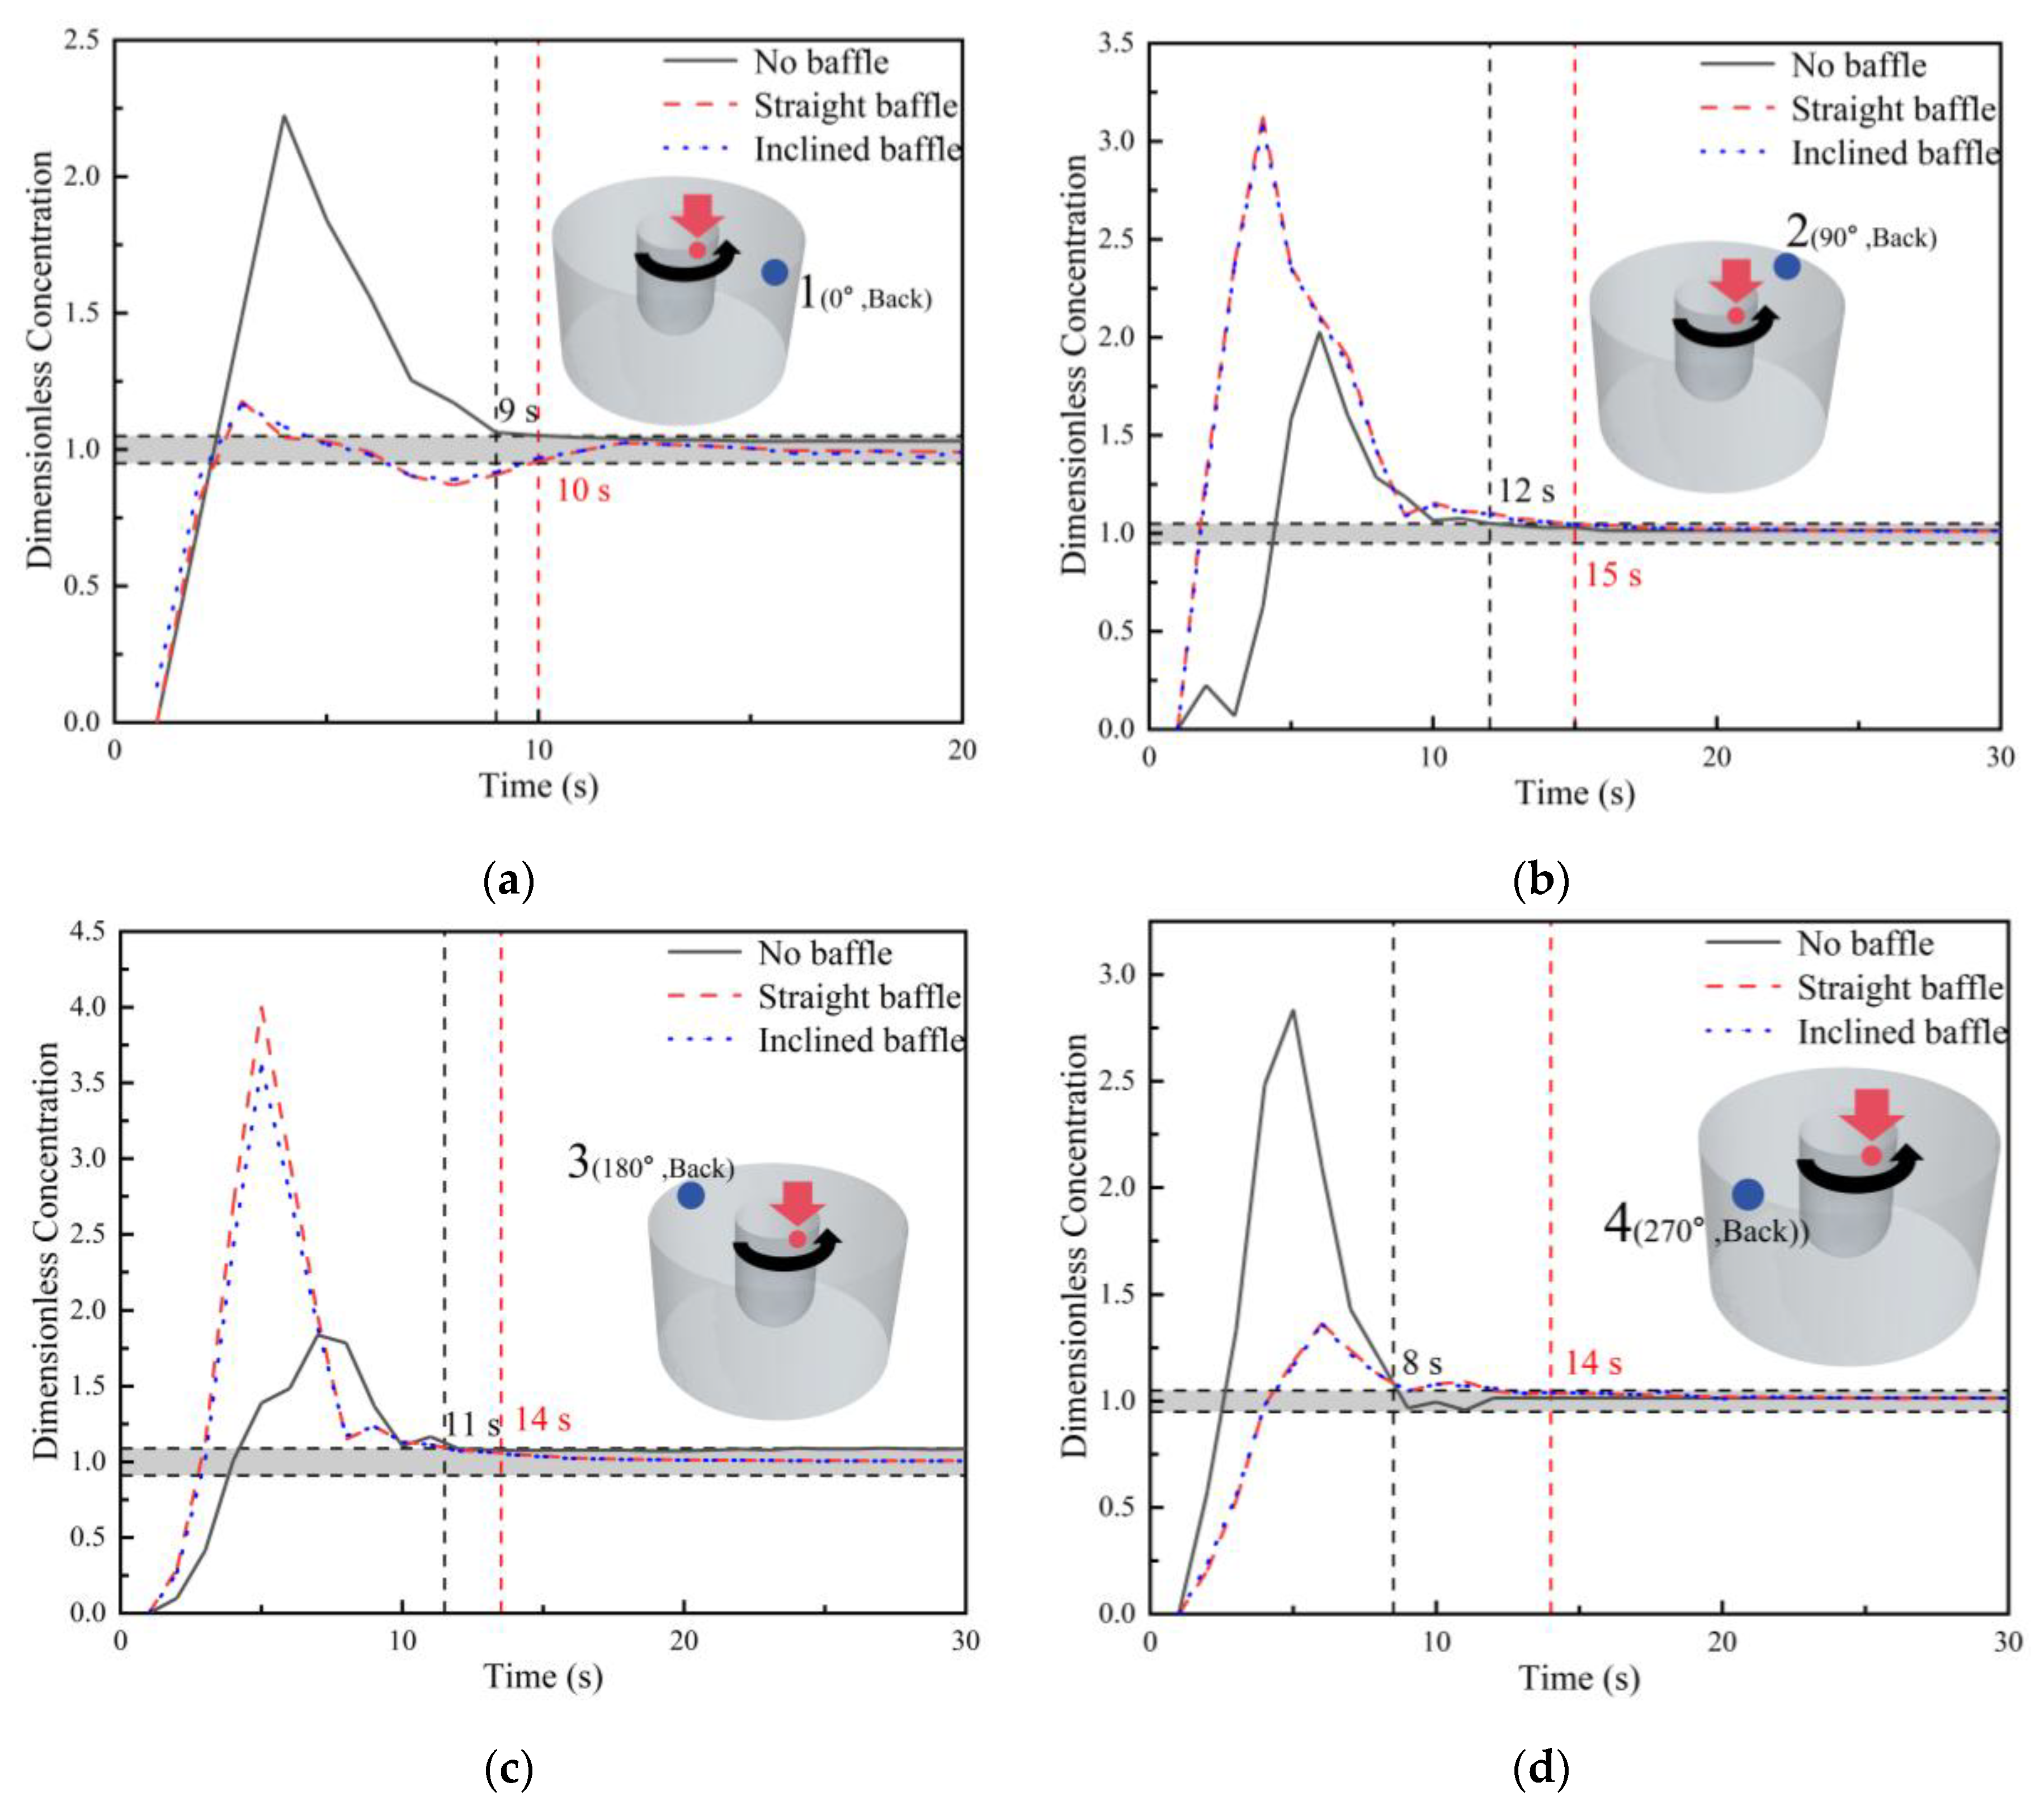
As shown in Figure 24a–d, the tracer concentration curves at monitoring points 5–8 behind the upper baffles under the straight-baffle and inclined-baffle conditions are compared with those at upper monitoring points 1–4 under the no-baffle condition. Since no distinction exists between the front and rear sides of the baffle under the no-baffle condition, the tracer concentration curves for the no-baffle case in Figure 24a–d are the same as those in Figure 23a–d. Under both the straight-baffle and inclined-baffle conditions, the tracer concentration curves showed basically the same variation trend, and the mixing times were also identical. It is worth noting that, in Figure 24b, peaks appeared under both baffle conditions and the peak values were the same. This indicates that, at the 90° position behind the upper baffle, the two baffle configurations had the same blocking effect on tracer transport, and in both cases some tracer bypassed the baffle and reached the region behind the 90° baffle.
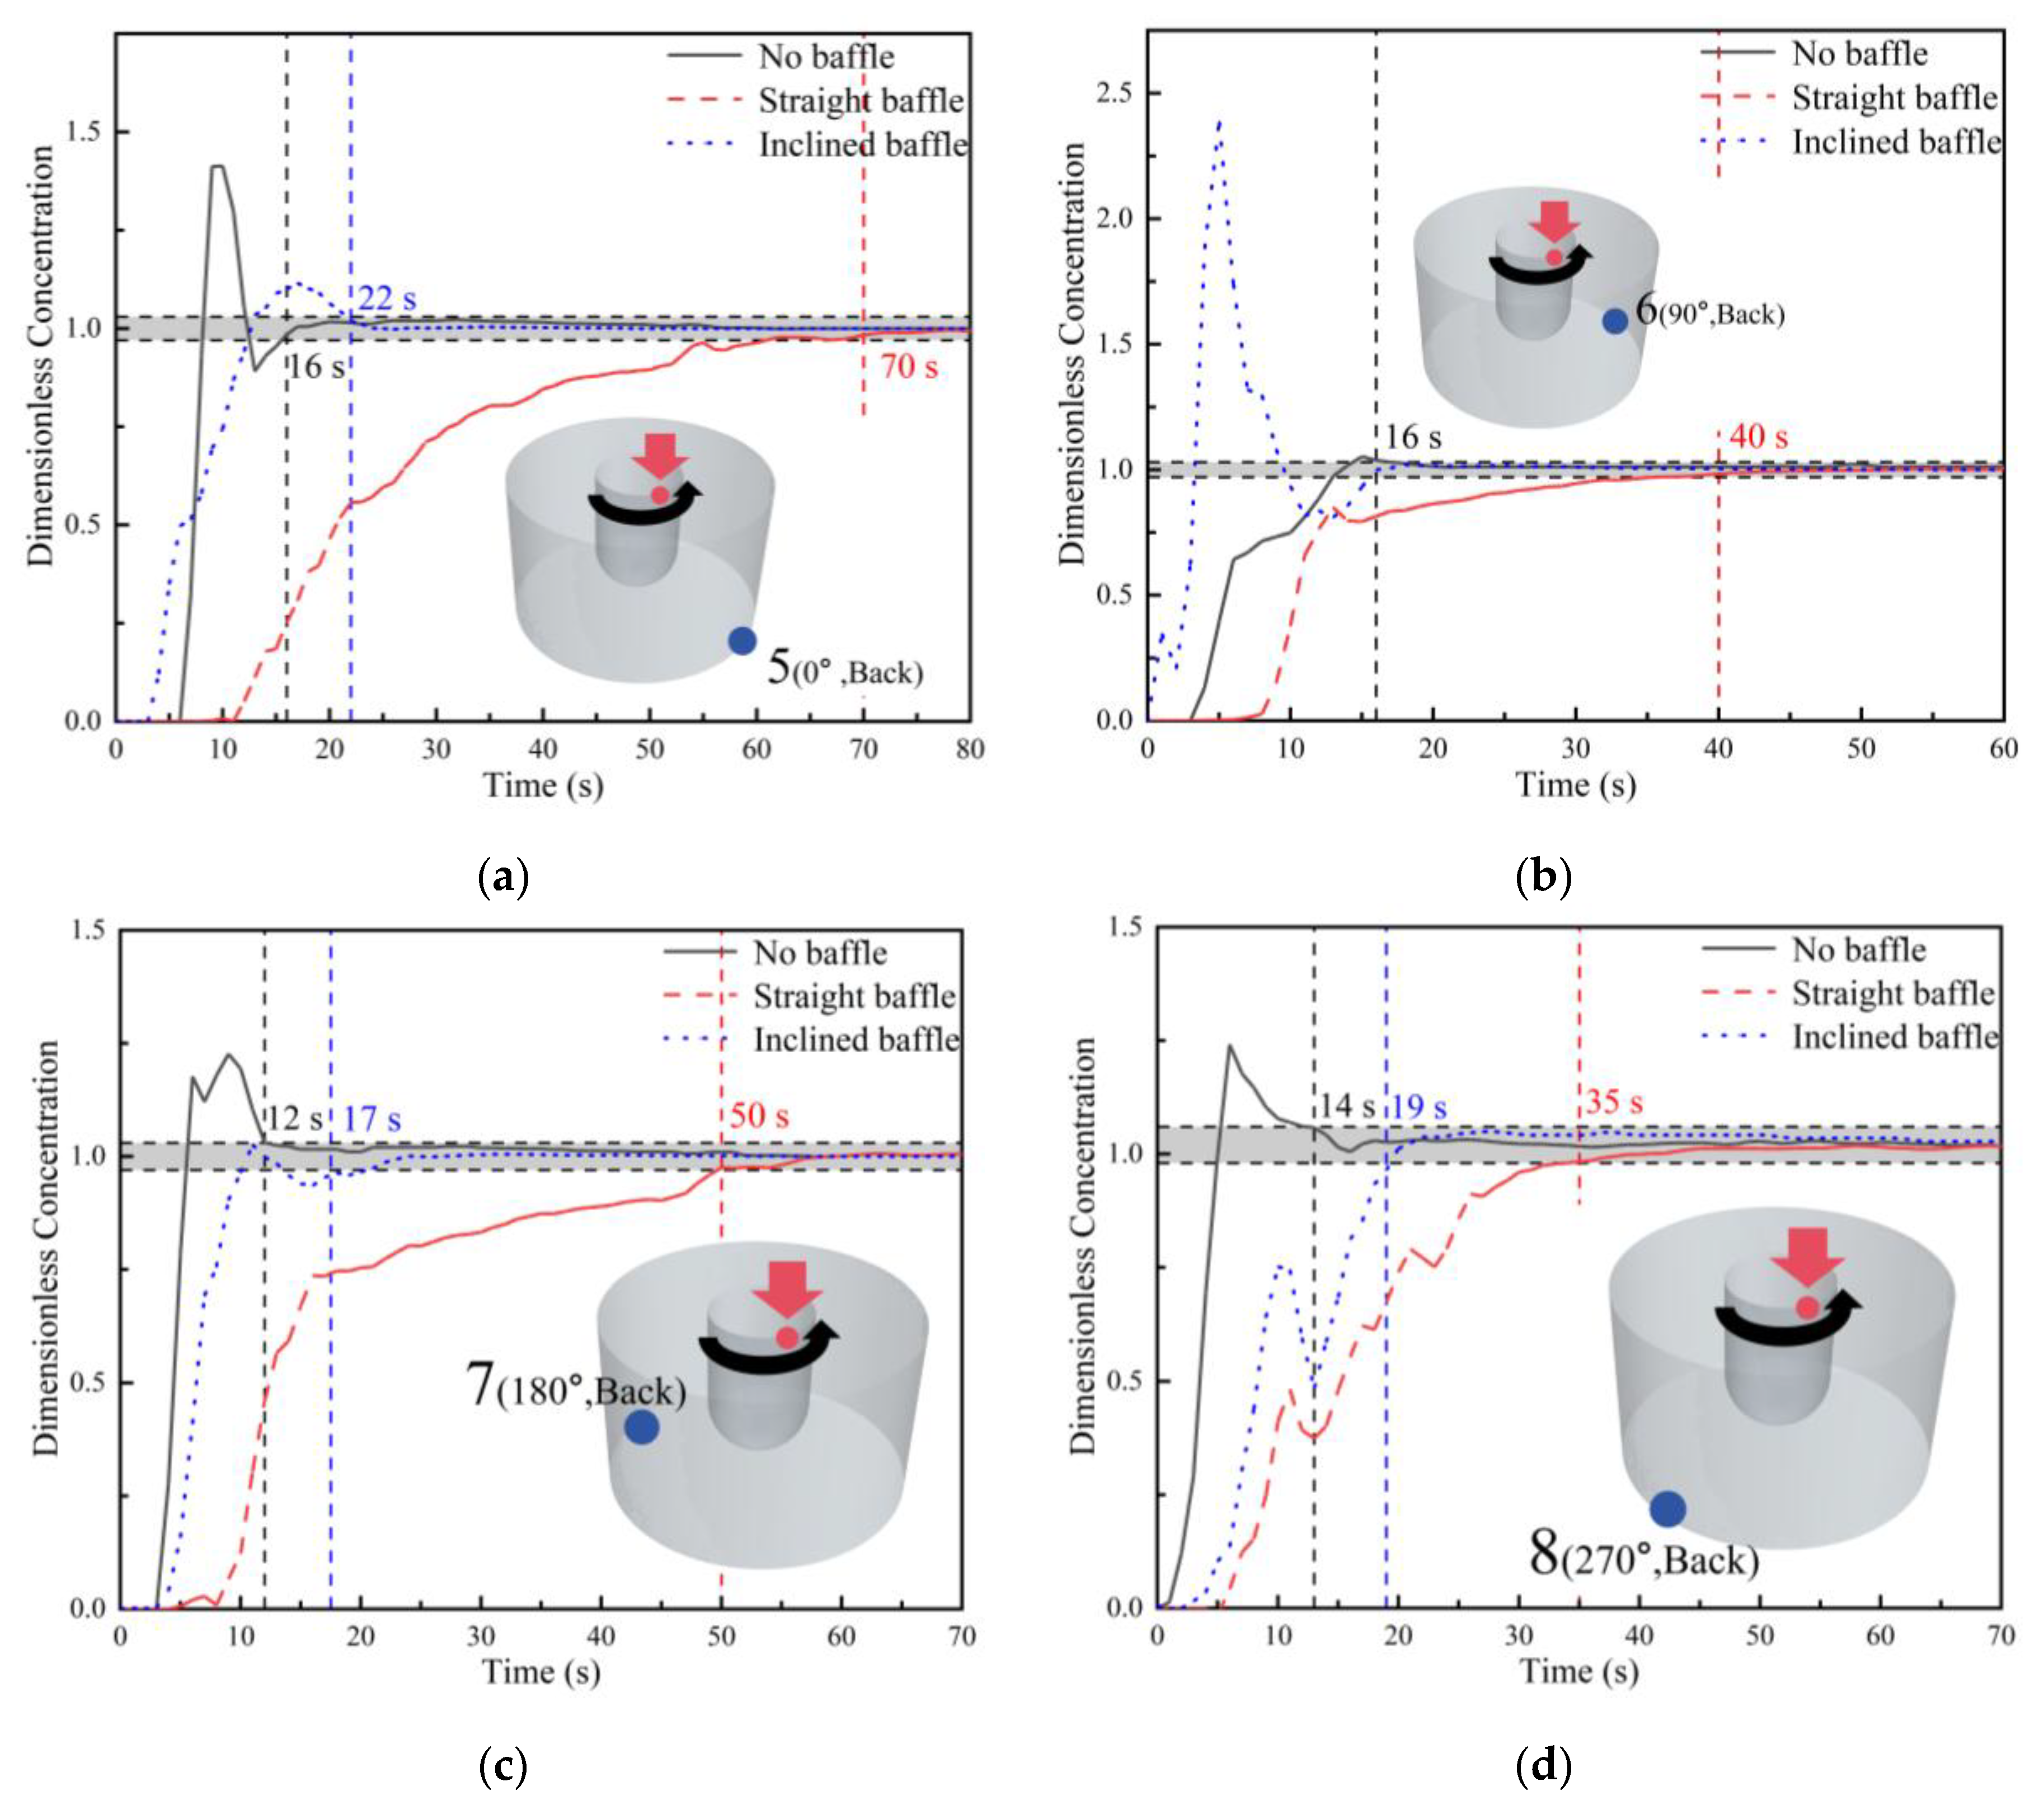
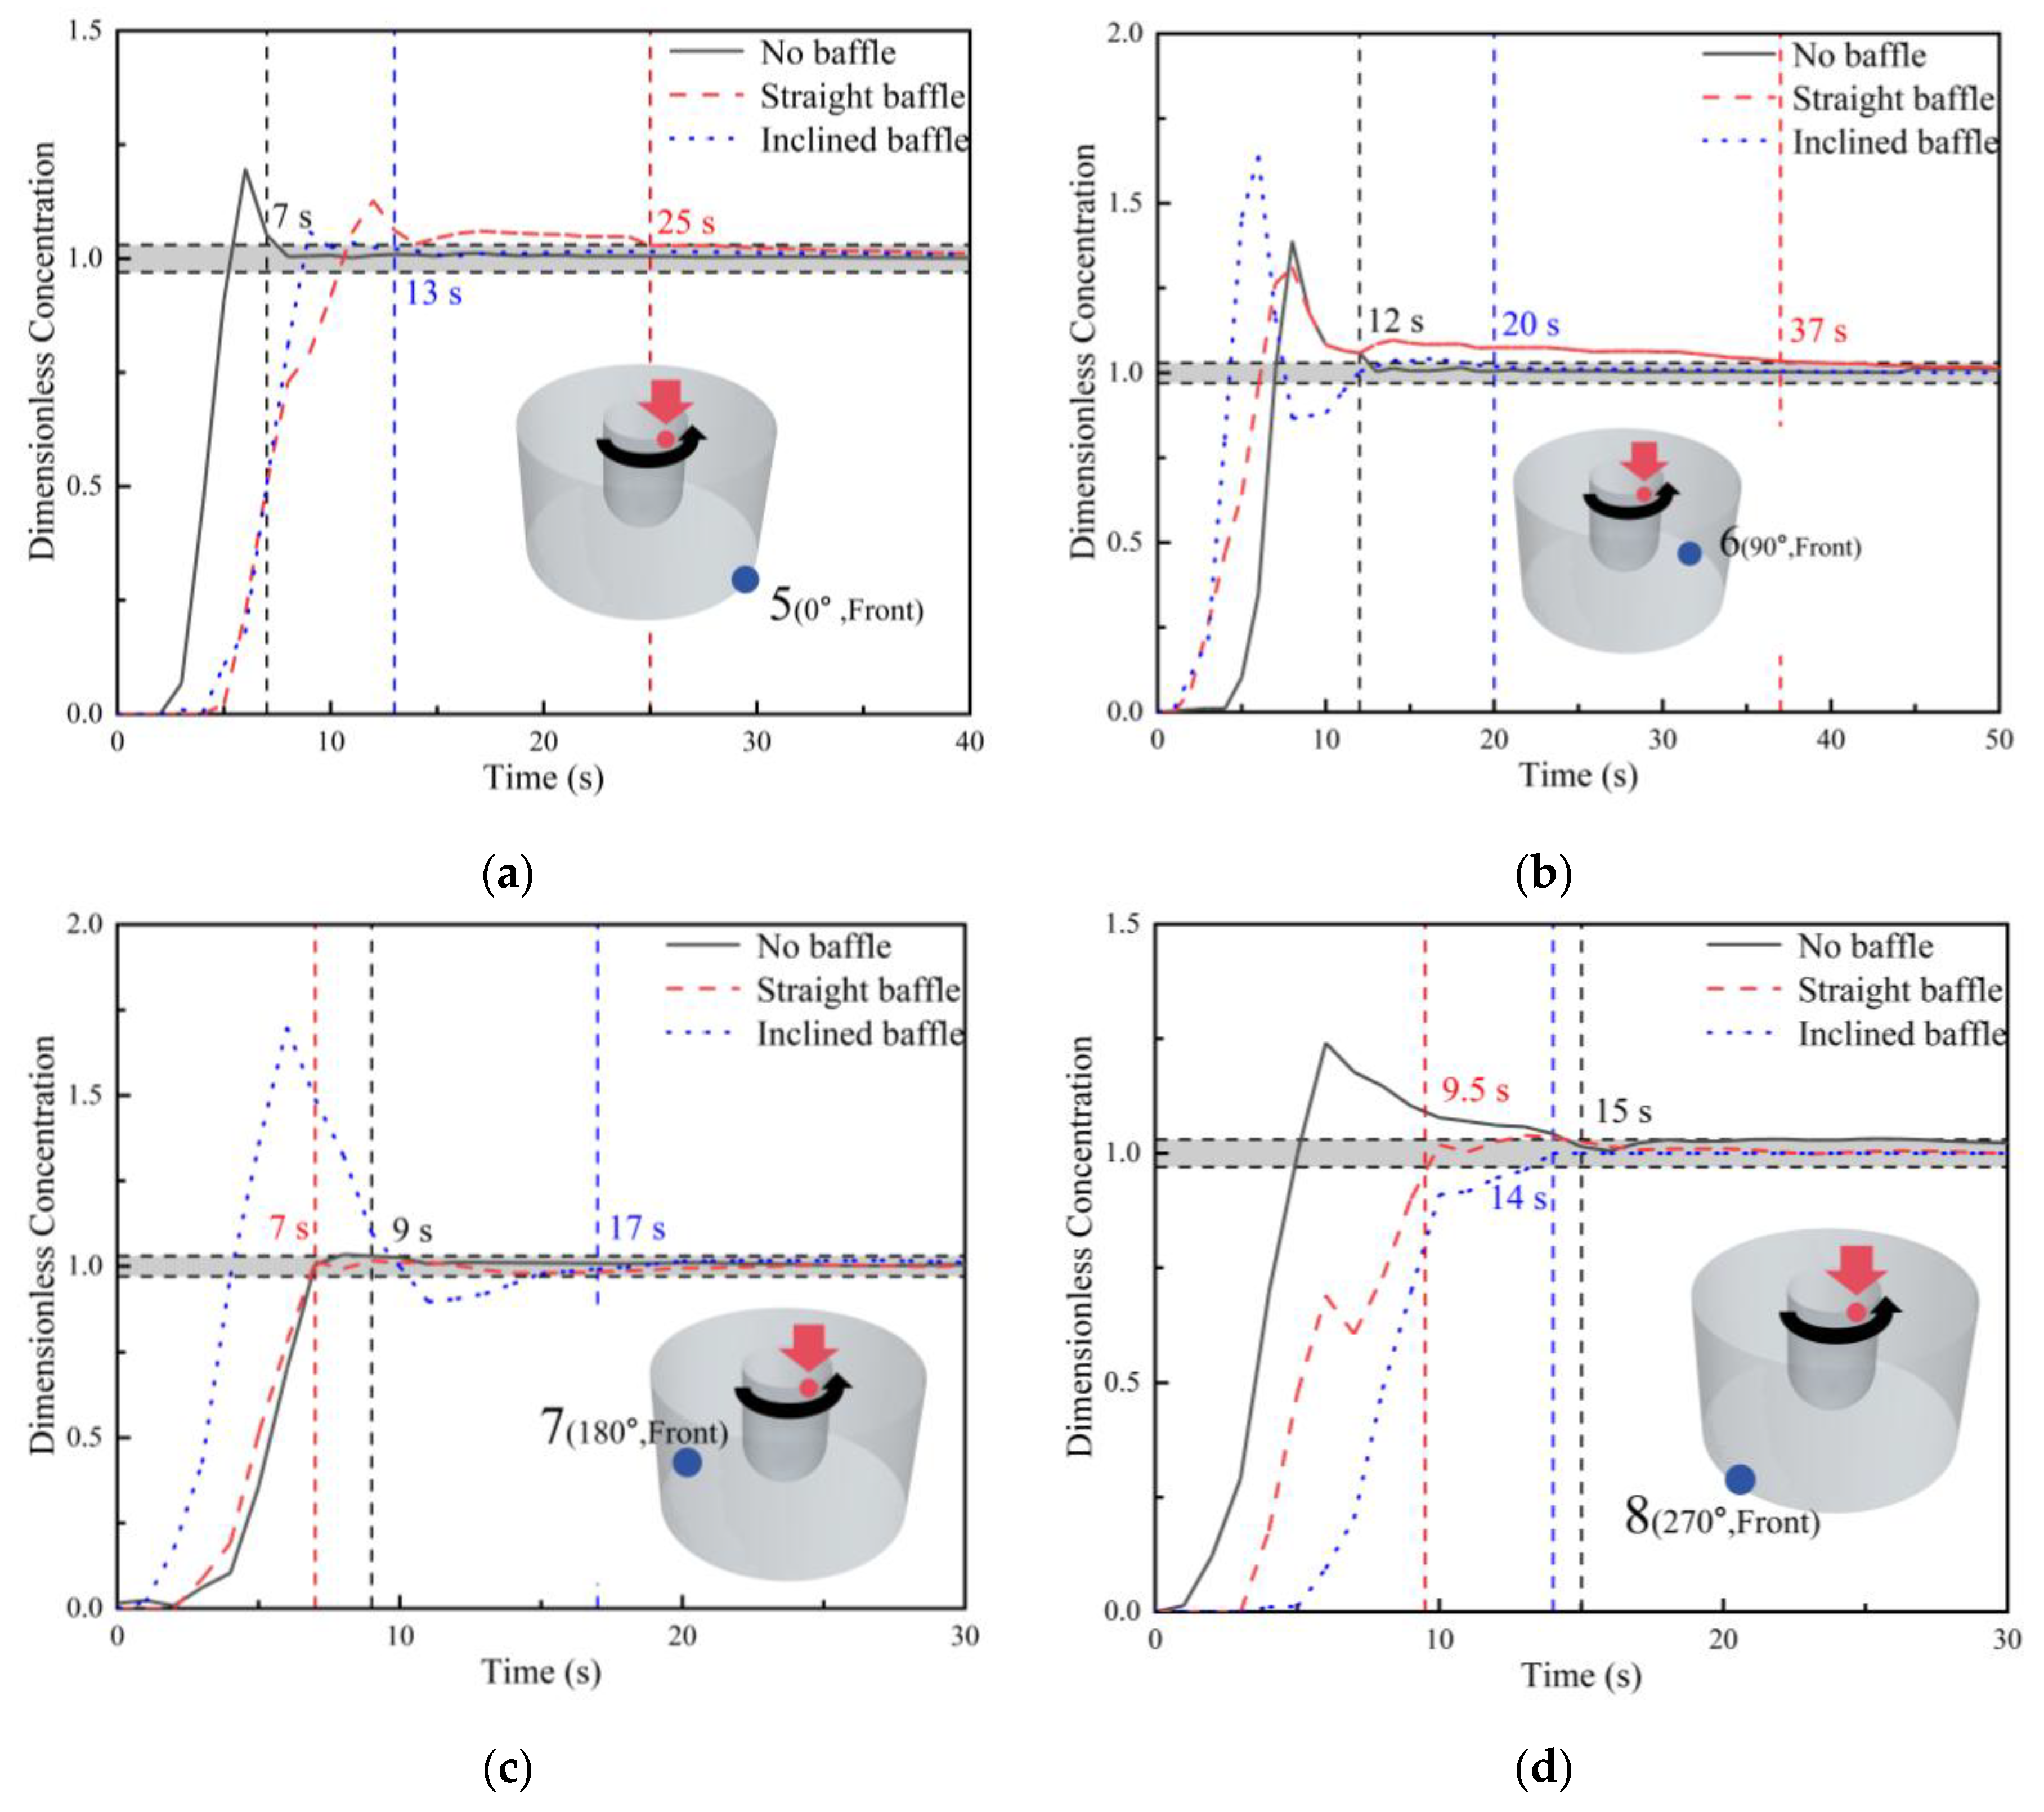
As shown in Figure 25, the tracer concentration curves at the bottom monitoring points under the straight-baffle and inclined-baffle conditions at 200 rpm are compared with those at the bottom monitoring points under the no-baffle condition. Specifically, monitoring points 9–12 for the straight-baffle and inclined-baffle cases are compared with monitoring points 5–8 for the no-baffle case. At the crucible bottom, the effects of the straight baffles and inclined baffles on tracer transport differ greatly. As shown in Figure 25a–d, under the no-baffle condition, the corresponding bottom monitoring point responded first, and only afterward did the tracer concentration at the other three monitoring points begin to increase. This behavior is related to the spiral transport of the tracer around the crystallizer under the no-baffle condition. However, under the no-baffle condition, all four bottom monitoring points reached complete mixing rapidly, which is unfavorable for impurity retention. As discussed in Section 3.3.2 and Section 3.3.3, both the straight baffles and inclined baffles at the 90° position could block the tracer and force it to move downward along the baffle. As shown in Figure 25b and Table 1, the response time was 0 s in both cases, after moving downward, the blocked tracer reached the bottom monitoring point. Although the tracer concentration peak was higher under the inclined-baffle condition, the concentration decreased rapidly after reaching the peak, and complete mixing was achieved at 16 s. In contrast, under the straight-baffle condition, the tracer concentration decreased after reaching the peak, but then rose slowly again and did not reach complete mixing until 47 s. This indicates that, under the blocking effect of the straight baffle, the tracer transported downward to the bottom diffused more slowly near monitoring point 2, which indicates a stronger local retention tendency in the model system and may provide a favorable hydrodynamic condition for controlling the transport of solute rejected from the solidification interface.
As shown in Figure 26a–d, the tracer concentration curves at monitoring points 13–16 behind the bottom straight baffles at 200 rpm are compared with those at monitoring points 9–12 under the inclined-baffle condition and monitoring points 5–8 under the no-baffle condition. Since there is no distinction between the front and rear sides at the crucible bottom under the no-baffle and inclined-baffle conditions, the tracer concentration curves for these two conditions are the same as those shown in Figure 25a–d. Behind the bottom straight baffles, the tracer concentration curves all exhibited a slowly increasing “parabolic” shape. Under the straight-baffle condition, the mixing times behind the bottom baffles were all significantly longer than those under the other two conditions. These four monitoring points further demonstrate that the straight baffles hindered tracer diffusion at the crucible bottom.

3.4.2. Transport Behavior Inside the Molten Pool at a Crystallizer Rotational Speed of 300 rpm

As shown in Figure 27, the tracer concentration curves at upper monitoring points 1–4 in front of the baffles under the straight-baffle and inclined-baffle conditions at 300 rpm are compared with those at upper monitoring points 1–4 under the no-baffle condition at four different positions. After the crystallizer rotational speed increased, the variation trends of the tracer concentration curves at the four monitoring points under all three conditions remained the same as those at 200 rpm. Under the straight-baffle condition, the tracer was still mainly thrown toward monitoring point 2, whereas under the inclined-baffle condition, the tracer was thrown toward monitoring points 2 and 3. After the rotational speed increased, the mixing times at all monitoring points were shortened.
As shown in Figure 28, the tracer concentration curves at monitoring points 5–8 behind the upper baffles under the straight-baffle and inclined-baffle conditions are compared with those at the upper monitoring points 1–4 under the no-baffle condition. Similarly, the tracer concentration curves for the no-baffle condition in Figure 28a–d are the same as those in Figure 27a–d. As shown in Figure 28b, the tracer concentration curves behind both the straight baffles and the inclined baffles still exhibited distinct peaks, and these peaks were higher than those at 200 rpm. As shown in Figure 28c, under the straight-baffle condition, the peak of the tracer concentration curve behind the upper 180° baffle (monitoring point 7) was higher than that at the same monitoring position at 200 rpm. After the rotational speed increased, the flow field in the upper part of the crucible was strengthened, and the tracer was thrown toward more distant monitoring points after being added.
As shown in Figure 29, the tracer concentration curves at the bottom monitoring points 9–12 under the straight-baffle and inclined-baffle conditions at 300 rpm are compared with those at the bottom monitoring points 5–8 under the no-baffle condition. As shown in Figure 29b and Table 2, peak values were still observed at the bottom monitoring points after the baffles were installed, but they were significantly lower than those under the same conditions at 200 rpm. With increasing rotational speed, the mixing time in front of the bottom region of the 90° straight baffle remained relatively long, reaching 37 s, indicating that some impurity retention still existed in this region, although the effect was weaker than that at 200 rpm.This phenomenon indicates that the baffles altered the main flow structure. The straight baffles imposed a stronger blocking effect on the circumferential flow, leading to the formation of low-velocity zones and local retention zones in front of the baffles. As a result, tracer transport in the bottom region was slowed down and the mixing time was prolonged. In contrast, the inclined baffles provided both blocking and flow-guiding effects, which could modify the tracer transport path. However, this flow-guiding effect also made it easier for part of the tracer to re-enter the main flow, so the stability of local accumulation was weaker than that under the straight-baffle condition. As shown in Figure 29c, the tracer concentration curves under the inclined-baffle and straight-baffle conditions differed greatly at this position, and a distinct peak appeared under the inclined-baffle condition. Combined with Figure 20b, this peak resulted from the tracer blocked at the top of the baffle moving downward along the baffle and then reaching this position. As shown in Figure 29d, after the crystallizer rotational speed increased, the tracer concentration curve at monitoring point 12 at the bottom under the inclined-baffle condition rose faster than that at 200 rpm, indicating that the mixing behavior at this position was improved under the inclined-baffle condition when the rotational speed increased to 300 rpm. However, excessively rapid mixing may cause impurities to re-enter the main flow region inside the crucible, where they are more likely to be captured by the solidification interface, thereby reducing the impurity separation efficiency. Therefore, achieving a proper balance between transport efficiency and mixing time is of critical importance.
As shown in Figure 30a–d, the tracer concentration curves at monitoring points 13–16 behind the bottom straight baffles at 300 rpm are compared with those at monitoring points 9–12 under the inclined-baffle condition and monitoring points 5–8 under the no-baffle condition. Similarly, because there is no distinction between the front and rear sides at the crucible bottom under the no-baffle and inclined-baffle conditions, the tracer concentration curves for these two conditions are the same as those shown in Figure 29a–d. After the rotational speed increased, an obvious difference from the 200 rpm condition appeared only at monitoring point 14 behind the straight baffle. Under the 300 rpm condition, a small peak appeared at this point. This peak was generated because the increase in rotational speed accelerated the spiral flow, causing the tracer to be transported to this position.

4. Conclusions

(1)
At a crystallizer rotational speed of 200 rpm, a complete annular main flow formed inside the crucible under the no-baffle condition, and the fluid was transported through the crucible in a spiraling and obliquely downward manner. The ink could be transported along the spiral main flow to the 270° position. After straight baffles were installed, the spiral transport around the crystallizer still existed, while part of the flow was blocked and redistributed by the baffles at the 90° and 180° positions, forming an annular flow near the bottom. Under the inclined-baffle condition, the spiral flow disappeared. The flow stream was blocked by the baffle at the 90° position, and transport was mainly concentrated in the upper part of the crucible, whereas transport near the bottom was relatively weak. Overall, tracer transport under the inclined-baffle condition was slower than that under the straight-baffle and no-baffle conditions.
(2)
When the crystallizer rotational speed increased to 300 rpm, the overall flow pattern under the no-baffle condition did not change significantly, while the flow intensity increased. Under the straight-baffle condition, the spiral flow around the crystallizer was strengthened with increasing rotational speed. Under the inclined-baffle condition, increasing rotational speed caused no obvious change in the flow field in the middle and upper regions of the crucible, but enhanced flow transport near the bottom.
(3)
Straight baffles significantly prolonged the mixing time in local bottom regions, especially in front of the 90° baffle, where tracer transport became slower. This behavior indicated a stronger local retention tendency in the model system, and the effect was particularly evident at a crystallizer rotational speed of 200 rpm. Under the inclined-baffle condition, although the tracer was blocked by the baffle and transported to the bottom, it was rapidly carried away by the main flow after reaching the bottom, indicating lower stability of local accumulation than that under the straight-baffle condition. However, compared with the no-baffle condition, the inclined baffles still improved local retention by interrupting the continuous circumferential flow, suppressing the short-circuiting transport path, and extending the local tracer transport route near the baffle and bottom regions.
(4)
As the rotational speed increased, the overall mixing rate also increased. At 300 rpm, the mixing times under all three conditions were shortened. However, under the straight-baffle condition, the prolonged local retention behavior observed in the bottom region became less pronounced as the rotational speed increased.
Overall, this study, based on a water model, revealed the effects of rotational speed and baffle configuration on the flow-field structure, tracer transport, and mixing behavior in a rotational segregation model system. These results provide a preliminary hydrodynamic understanding of flow regulation in such systems. Two representative baffle configurations, namely straight baffles and inclined baffles, were selected to establish a clear basis for comparison and to elucidate the influence of baffle orientation on flow behavior. Therefore, the results of this study cannot yet be directly extended to all geometric parameters, such as baffle angle, spacing, and number. Further work is still needed to carry out more systematic parametric investigations on geometric sensitivity so as to more comprehensively clarify the effects of baffle design on flow and transport behavior. In addition, coupling the hydrodynamic behavior with the thermal gradient and solidification behavior will be an important direction for future work.

Author Contributions

Conceptualization, Z.R. and C.C.; Methodology, C.C. and L.C.; Investigation, Z.D. and H.Z.; Data curation, Z.R., D.H. and G.S.; Writing—original draft preparation, D.H., G.S. and Z.D.; Writing—review and editing, C.C., J.L. and H.Z.; Visualization, Z.R., J.L. and G.Q.; Supervision, L.C. and W.L.; Funding acquisition, C.C., G.Q. and W.L. All authors have read and agreed to the published version of the manuscript.

Funding

This work was supported by the National Natural Science Foundation of China (No. 52374418).

Data Availability Statement

The original contributions presented in this study are included in the article. Further inquiries can be directed to the corresponding authors.

Conflicts of Interest

The authors declare no conflicts of interest.

Appendix A

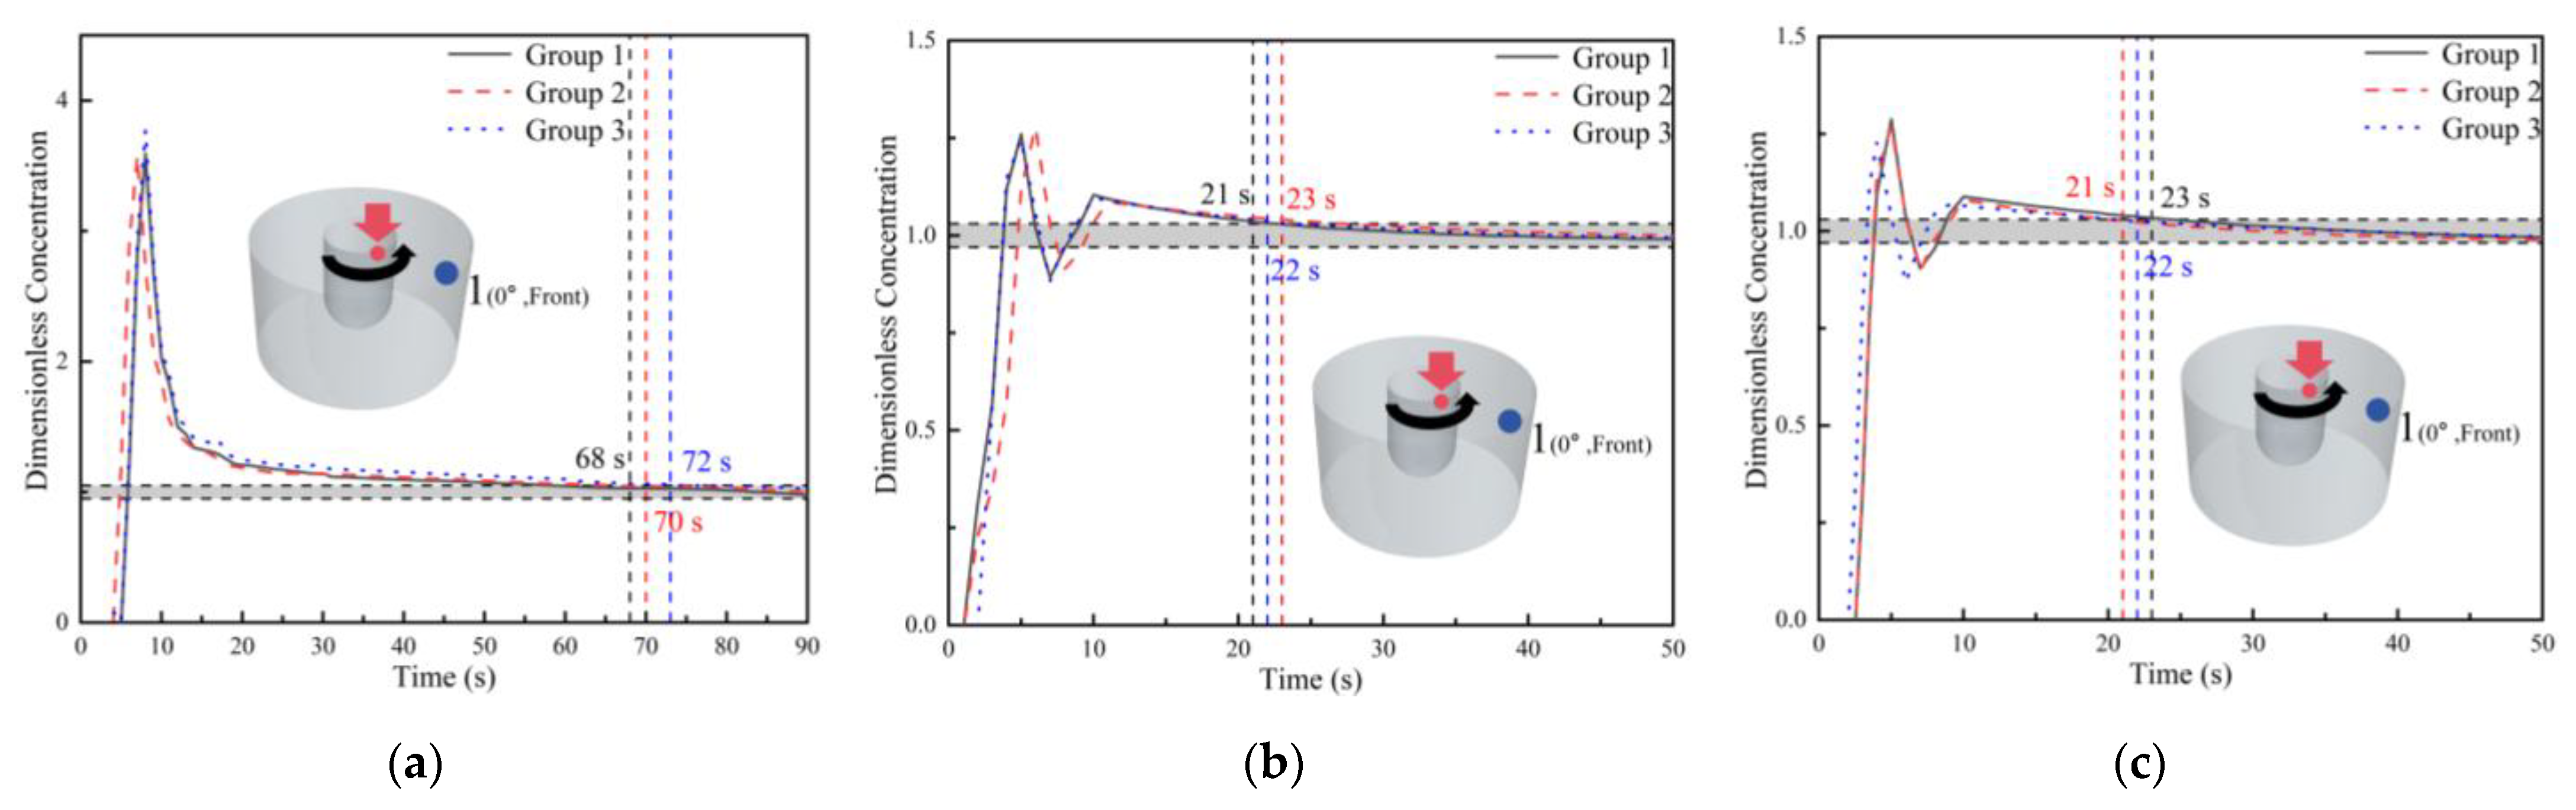
As shown in Figure A1, the dimensionless concentration curves from the three repeated experiments under each condition exhibited similar variation patterns. Under the no-baffle condition, all three curves rose rapidly to a peak after tracer addition, then gradually decayed and approached the fully mixed state. The corresponding mixing times were 68 s, 70 s, and 72 s, respectively, with an average mixing time of 70 s and a standard deviation of 2 s. Under the straight-baffle condition, the three concentration curves showed good agreement in terms of the peak appearance time, decay process, and final stabilization trend. The corresponding mixing times were 21 s, 22 s, and 23 s, respectively, with an average mixing time of 22 s and a standard deviation of 1 s. Under the inclined-baffle condition, the mixing times of the three repeated experiments were also concentrated within the range of 21–23 s, with an average mixing time of 22 s and a standard deviation of 1 s.
Figure A1. Repeatability of the dimensionless tracer concentration curves at monitoring point 1 under three typical conditions based on three repeated experiments: (a) no-baffle; (b) straight-baffle; (c) inclined-baffle. The arrows and red dots indicate the tracer injection positions, and the black arrow represents the rotation direction of the crystallizer. The gray area in the figure represents the dimensionless concentration of 1 ± 0.05, which is the mixing range.
Processes 14 01500 g0a1
These results indicate that the dispersion of the mixing times obtained from the repeated experiments under all three conditions was relatively small, and that the overall variation trends of the dimensionless concentration curves were highly consistent, demonstrating good repeatability and reliability of the tracer experiments in this study. At the same time, the differences in mixing time among the three conditions were much larger than the experimental error associated with the repeated runs, indicating that the effect of baffle structure on the mixing behavior inside the crucible is highly credible.
As shown in Table A1 and Table A2, the response time and mixing time at all monitoring points were quantitatively compared under different baffle configurations at crystallizer rotational speeds of 200 rpm and 300 rpm, respectively.
Table A1. Quantitative comparison of response time and mixing time at all monitoring points under different baffle configurations at a crystallizer rotational speed of 200 rpm.
Case 200 rpmMonitoring PointResponse Time/sMixing Time/s
No baffle1170
239
3050
4070
5617
6317
7317
8017
Straight baffle1022
2022
3022
4422
547
6124
7217
8417
9535
10047
11519
12419
131070
14540
15550
16535
Inclined baffle1411
2122
3122
4422
537
6124
7116
8316
9422
10016
11420
12420
Table A2. Quantitative comparison of response time and mixing time at all monitoring points under different baffle configurations at a crystallizer rotational speed of 300 rpm.
Case 300 rpmMonitoring PointResponse Time/sMixing Time/s
No baffle107
2011
3011
4012
569
6712
729
8015
Straight baffle1113
2013
3113
4313
5110.5
6114
7114
8114
9425
10037
1127
1239.5
13547
14217
15221
16321
Inclined baffle1114
2114
3214
4314
5110
6115
7115
8115
9313
10020
11117
12314

References

  1. Franco, M.A.; Groesser, S.N. A systematic literature review of the solar photovoltaic value chain for a circular economy. Sustainability 2021, 13, 9615. [Google Scholar] [CrossRef]
  2. Ramírez-Márquez, C. Solar-grade silicon in the energy transition: A strategic commodity for the global photovoltaic market. Commodities 2025, 4, 18. [Google Scholar] [CrossRef]
  3. Yuan, X.P.; Guo, L.J.; Lv, Q.H.; Zhao, D.; Liao, H.; Ma, W.H.; Jiang, Q.Y.; Xie, G.; Hou, Y.Q.; Shen, J.L. Product quality research in the industrialized preparation of electronic grade polysilicon: A review of impurity sources and control strategies. Renew. Sustain. Energy Rev. 2025, 214, 115569. [Google Scholar] [CrossRef]
  4. Zong, L.Q.; Zhu, B.; Lu, Z.D.; Tan, Y.L.; Jin, Y.; Liu, N.; Hu, Y.; Gu, S.; Zhu, J.; Cui, Y. Nanopurification of silicon from 84% to 99.999% purity with a simple and scalable process. Proc. Natl. Acad. Sci. USA 2015, 112, 13473–13477. [Google Scholar] [CrossRef] [PubMed]
  5. Zhuang, K.Y.; Chen, G.Y.; Wang, Y.; Li, W.; Zheng, Y.J.; He, Z.W.; Zhao, Z.W.; Gao, M.M.; Chai, Y.F.; Peng, J. Phase-separation induced by retired photovoltaic glass enhances the quality of ferrosilicon alloy prepared from silicon powder waste. Chem. Eng. J. 2025, 523, 168454. [Google Scholar] [CrossRef]
  6. Li, Y.Z.; Qu, K.; Jiang, R.H.; Wang, H.N.; Zhao, X.Y.; Yang, Z.Z.; Tian, B.B.; Tao, J.H.; Chu, J.H.; Duan, C.G. Atomic-Scale Defect Reconfiguration via Thermally Induced Structural Ordering for High-Efficiency Sb2Se3 Solar Cells. ACS Nano 2025, 19, 33460–33472. [Google Scholar] [CrossRef]
  7. Dong, Y.J.; Bi, S.Q.; Wang, M.R.; Yang, Z.X.; Tian, X.N.; Chen, Y.R.; Sun, Z.Q.; Sun, R.R.; Ouyang, Y.G.; Bai, L.Y.; et al. Plasma-driven material synthesis and structural chemical engineering of silicon-based anodes for lithium-ion batteries. Chin. J. Struct. Chem. 2026, in press. [Google Scholar] [CrossRef]
  8. Zhang, G.Y.; Luo, X.H.; Li, Y.; Liu, S. Comparative study of gravity effects in directional solidification of Al-3.5 wt.% Si and Al-10 wt.% Cu alloys. npj Microgravity 2024, 10, 114. [Google Scholar] [CrossRef]
  9. Gan, X.; Chen, Z.; Zhang, Z.; Ma, W.; Zhang, Y.; Qu, J.; Wen, J. Design of composite coal reducing agents for cost reduction and efficiency enhancement in industrial silicon smelting: Correlation mechanism between carbon structure evolution and resistivity. J. Anal. Appl. Pyrol. 2026, 196, 107779. [Google Scholar] [CrossRef]
  10. Chatelain, M.; Rhouzlane, S.; Botton, V.; Albaric, M.; Henry, D.; Millet, S.; Pelletier, D.; Garandet, J.P. Towards wall functions for the prediction of solute segregation in plane front directional solidification. J. Cryst. Growth 2017, 475, 55–69. [Google Scholar] [CrossRef]
  11. Friedrich, S.; Curtolo, D.C.; Friedrich, B. Effect of Process Parameter Variation on Purity during Rotary Fractional Crystallization of Aluminum. Open J. Met. 2017, 7, 25–38. [Google Scholar] [CrossRef]
  12. Zhang, H.Y.; Qian, G.Y.; Pang, J.C.; Wang, Z. Enhancing Rapid and Deep Removal of Trace Impurities from Tellurium by an Immersion Rotational Segregation Purification Process. Metall. Mater. Trans. B 2024, 55, 3007–3011. [Google Scholar] [CrossRef]
  13. Wu, B.X. CFD Study of Submersible Mixers in Anaerobic Digesters. Trans. ASABE 2017, 60, 275–282. [Google Scholar] [CrossRef]
  14. He, H.B.; Liu, Y.J.; Zhang, A.N.; Yang, Z.Z.; Liu, X.S.; Yang, R.S.; Tang, H.; Li, Z.H. Kinetic modeling and experimental verification of a swirl flocculation-enhanced reactor: A case study of coal chemical wastewater pretreatment. Sep. Purif. Technol. 2023, 326, 124852. [Google Scholar] [CrossRef]
  15. Fu, X.L.; Chen, Y.; Li, D.Y.; Zheng, Z.L.; Wang, H.J. Comparative research on the performance of three impeller seal clearance structures of pumped-storage units based on improved entropy production theory. Energy 2026, 351, 140818. [Google Scholar] [CrossRef]
  16. Wan, Z.H.; Yang, S.L.; Kong, D.S.; Li, D.B.; Hu, J.H.; Wang, H. Numerical investigation of sinusoidal pulsating gas intake to intensify the gas-slag momentum transfer in the top-blown smelting furnace. Int. J. Miner. Metall. Mater. 2024, 31, 301–314. [Google Scholar] [CrossRef]
  17. Cwudziński, A.; Falkus, J.; Podolska-Loska, A. Numerical, Physical, and Industrial Investigations on Hot Metal Desulphurization—From Macromixing Conditions to Reaction Rate Phenomena. Materials 2024, 17, 5858. [Google Scholar] [CrossRef]
  18. Shan, H.F.; Su, Y.W.; Xu, N. Construction of Self-Optimization and Quality Prediction Model for Intelligent Die Casting Unit Process Parameters. Int. Sci. Tech. Econ. Res. 2025, 3, 111–120. [Google Scholar] [CrossRef]
  19. Posadas-Navarro, D.I.; González-Rivera, C.; Ramírez-Argáez, M.A.; Ascanio, G. Power characteristics and mass transfer of rotor injectors in a water physical model of an aluminum degassing ladle. Chem. Eng. Res. Des. 2023, 191, 261–270. [Google Scholar] [CrossRef]
  20. Arai, K.; Shingu, H.; Sakaguchi, M.; Nishide, T.; Watanabe, O.; Otsuka, R.; Tsukamoto, K. Process for Producing High-Purity Aluminum. U.S. Patent 4,469,512, 4 September 1984. [Google Scholar]
  21. Shang, R.L.; Qian, G.Y.; Wang, Z.; Zhou, L.; Sheng, Z.L. Numerical Simulation of Flow Field Optimizing the Rotating Segregation Purification of Silicon for SoG-Si. Metall. Mater. Trans. B 2022, 53, 2657–2674. [Google Scholar] [CrossRef]
  22. Qian, G.Y.; Zhou, L.; Lu, J.J.; Pang, S.; Sun, Y.W.; Pang, J.C.; Wang, D.; Wei, K.X.; Ma, W.H.; Wang, Z. Toward sustainability for upcycling SoG-Si scrap by an immersion rotational segregation purification process. J. Clean. Prod. 2023, 416, 137978. [Google Scholar] [CrossRef]
  23. Liu, H.W.; Xu, B.Q.; Duan, M.P.; Zhao, J.Y.; Lei, X.J.; Yang, B.; Tian, Y.; Jiang, W.L. The behavior of Si and Fe impurities in the process of rotary crystallization for enhancing aluminum purification. Sep. Purif. Technol. 2025, 375, 133640. [Google Scholar] [CrossRef]
  24. Ohno, R.; Tanaka, S.; Takahashi, K.; Tsuda, K.; Morita, Y. Method of Preparing High-Purity Metal and Rotary Cooling Member for Use in Apparatus Therefor. U.S. Patent 4,948,102, 14 August 1990. [Google Scholar]
  25. Tamburini, A.; Gagliano, G.; Micale, G.; Brucato, A.; Scargiali, F.; Ciofalo, M. Direct numerical simulations of creeping to early turbulent flow in unbaffled and baffled stirred tanks. Chem. Eng. Sci. 2018, 192, 161–175. [Google Scholar] [CrossRef]
  26. Lu, W.M.; Wu, H.Z.; Ju, M.Y. Effects of baffle design on the liquid mixing in an aerated stirred tank with standard Rushton turbine impellers. Chem. Eng. Sci. 1997, 52, 3843–3851. [Google Scholar] [CrossRef]
  27. Busciglio, A.; Grisafi, F.; Scargiali, F.; Brucato, A. Mixing dynamics in uncovered unbaffled stirred tanks. Chem. Eng. J. 2014, 254, 210–219. [Google Scholar] [CrossRef]
  28. Fu, S.C.; Zhao, T.Y.; Tao, L.L.; Chen, G.F.; Yang, D.; Tao, L. Influence of Glass-Lined V-Shaped Stirrers on Crystallization Properties. Korean J. Chem. Eng. 2024, 41, 1625–1636. [Google Scholar] [CrossRef]
  29. Torré, J.P.; Fletcher, D.F.; Lasuye, T.; Xuereb, C. An experimental and computational study of the vortex shape in a partially baffled agitated vessel. Chem. Eng. Sci. 2007, 62, 1915–1926. [Google Scholar] [CrossRef]
  30. Yamada, S.; Yamagami, N.; Kato, T.; Ogawa, T.; Kikuchi, M.; Komoda, Y.; Ohmura, N. Flow and mixing characteristics in a stirred tank equipped with a swirl-type impeller (SWINGSTIR®). J. Taiwan Inst. Chem. Eng. 2025, 176, 106309. [Google Scholar] [CrossRef]
  31. Pei, X.W.; Xu, H.H. CFD analysis of a multi-layer continuous stirred tank based on an orthogonal experiment. J. Phys. Conf. Ser. 2025, 2951, 012084. [Google Scholar] [CrossRef]
  32. Jia, B.G.; Wang, D.; Zhao, Z.Y.; Xu, Y.F.; Du, H.D.; Yao, C.Y.; Han, D. The role of temperature non-uniformity in forced air pre-cooling of tomatoes: A comparative study. Int. Commun. Heat Mass Transf. 2026, 172, 110748. [Google Scholar] [CrossRef]
  33. Shen, Y.Y.; Qin, B.; Li, X.; Zhu, Z.Y.; Cui, P.Z.; Gao, J.; Wang, Y.L. Investigation of the flow characteristics of liquid–liquid two-phase mixing in an agitator equipped with a “V-shaped” horizontal baffle. Environ. Dev. Sustain. 2021, 23, 2298–2313. [Google Scholar] [CrossRef]
  34. Kamla, Y.; Bouzit, M.; Ameur, H.; Arab, M.I.; Hadjeb, A. Effect of the Inclination of Baffles on the Power Consumption and Fluid Flows in a Vessel Stirred by a Rushton Turbine. Chin. J. Mech. Eng. 2017, 30, 1008–1016. [Google Scholar] [CrossRef]
  35. Jia, B.; Song, Z.; Li, X.; Hu, Z.; Li, Q. Enhancing Thermal Performance: The Evolution and Future of Solar Air Heaters with Baffles. Case Stud. Therm. Eng. 2025, 75, 107163. [Google Scholar] [CrossRef]
  36. Youcefi, S.; Bouzit, M.; Youcefi, A.; Mokhefi, A. Effect of an Inclined Slots on the Power Consumption and Vortices Size in a Rushton Turbine Agitated Tank. Chin. J. Mech. Eng. 2023, 36, 147. [Google Scholar] [CrossRef]
  37. Pukkella, A.K.; Vysyaraju, R.; Tammishetti, V.; Rai, B.; Subramanian, S.K. Improved mixing of solid suspensions in stirred tanks with interface baffles: CFD simulation and experimental validation. Chem. Eng. J. 2019, 358, 621–633. [Google Scholar] [CrossRef]
  38. Foukrach, M.; Ameur, H. Effect of baffles shape on the flow patterns and power consumption in stirred vessels. SN Appl. Sci. 2019, 1, 1550–1559. [Google Scholar] [CrossRef]
  39. He, W.P.; Lu, W.J.; Xu, S.R.; Huang, M.L.; Li, H.Q. Comparative analysis on floc morphological evolution in cylindrical and square stirred-tank flocculating reactors with or without baffles: Flocculation-test and CFD-aided investigations. Chem. Eng. Res. Des. 2019, 147, 278–291. [Google Scholar] [CrossRef]
  40. Zhou, S.Q.; Yang, Q.Z.; Lu, L.F.; Xia, D.; Zhang, W.T.; Yan, H. CFD Analysis of Sine Baffles on Flow Mixing and Power Consumption in Stirred Tank. Appl. Sci. 2022, 12, 5743. [Google Scholar] [CrossRef]
  41. National Institute of Standards and Technology. NIST Chemistry WebBook, SRD 69: Thermophysical Properties of Fluid Systems. Available online: https://webbook.nist.gov/chemistry/fluid/ (accessed on 28 April 2026).
  42. Mazumdar, D.; Kim, H.B.; Guthrie, R.I. Modelling Criteria for Flow Simulation in Gas Stirred ladles: Experimental Study. Ironmak. Steelmak. 2000, 27, 302–309. [Google Scholar] [CrossRef]
  43. Krishnapisharody, K.; Irons, G.A. A Critical Review of the Modified Froude Number in Ladle Metallurgy. Metall. Mater. Trans. B 2013, 44, 1486–1498. [Google Scholar] [CrossRef]
  44. Yang, R.W.; Chen, C.; Lin, Y.C.; Zhao, Y.; Zhao, J.; Zhu, J.J.; Yang, S.S. Water model experiment on motion and melting of scarp in gas stirred reactors. Chin. J. Process Eng. 2022, 22, 954–962. [Google Scholar] [CrossRef]
  45. Liu, J.; Zhou, P.; Zuo, X.; Wu, D.; Wu, D. Optimization of the Liquid Steel Flow Behavior in the Tundish through Water Model Experiment, Numerical Simulation and Industrial Trial. Metals 2022, 12, 1480. [Google Scholar] [CrossRef]
  46. Geng, M.J.; Wang, T.Y.; Chen, C. Assessment of the volume effect and application of an improved tracer in physical model of a single-strand bare tundish. Metall. Mater. Trans. B 2024, 55, 4121–4131. [Google Scholar] [CrossRef]
  47. Zhao, Y.S.; Chen, C.; Li, L.B.; Wang, T.Y.; Chen, L.; Wang, J. Application of an improved tracer in a water model of ladle. Metall. Mater. Trans. B 2025, 56, 6725–6745. [Google Scholar] [CrossRef]
  48. Oymo, D.; Guthrie, R.I.L. Mixing Times in Combination Blowing Processes. In Mixed Gas Blowing, Proceedings of the 4th Process Technology Conference; ISS: Chicago, IL, USA, 1984; pp. 45–52. [Google Scholar]
  49. Taylor, I.F.; Dang, P.; Schwarz, M.P.; Wright, J.K. An Improved Method for the Experimental Validation of Numerical Mixing Time Predictions. In Proceedings of the 72nd Steelmaking Proceedings, ISS, Chicago, IL, USA, 2–5 April 1989; pp. 505–516. [Google Scholar]
  50. Mazumdar, D.; Guthrie, R.L. The physical and mathematical modelling of gas stirred ladle systems. ISIJ Int. 1995, 35, 1–20. [Google Scholar] [CrossRef]
  51. Li, L.; Chen, C.; Tao, X.; Qi, H.; Liu, T.; Yan, Q.; Deng, F.; Allayev, A.; Lin, W.; Wang, J. Effect of Salt Solution Tracer Dosage on the Transport and Mixing of Tracer in a Water Model of Asymmetrical Gas-Stirred Ladle with a Moderate Gas Flowrate. Symmetry 2024, 16, 619. [Google Scholar] [CrossRef]
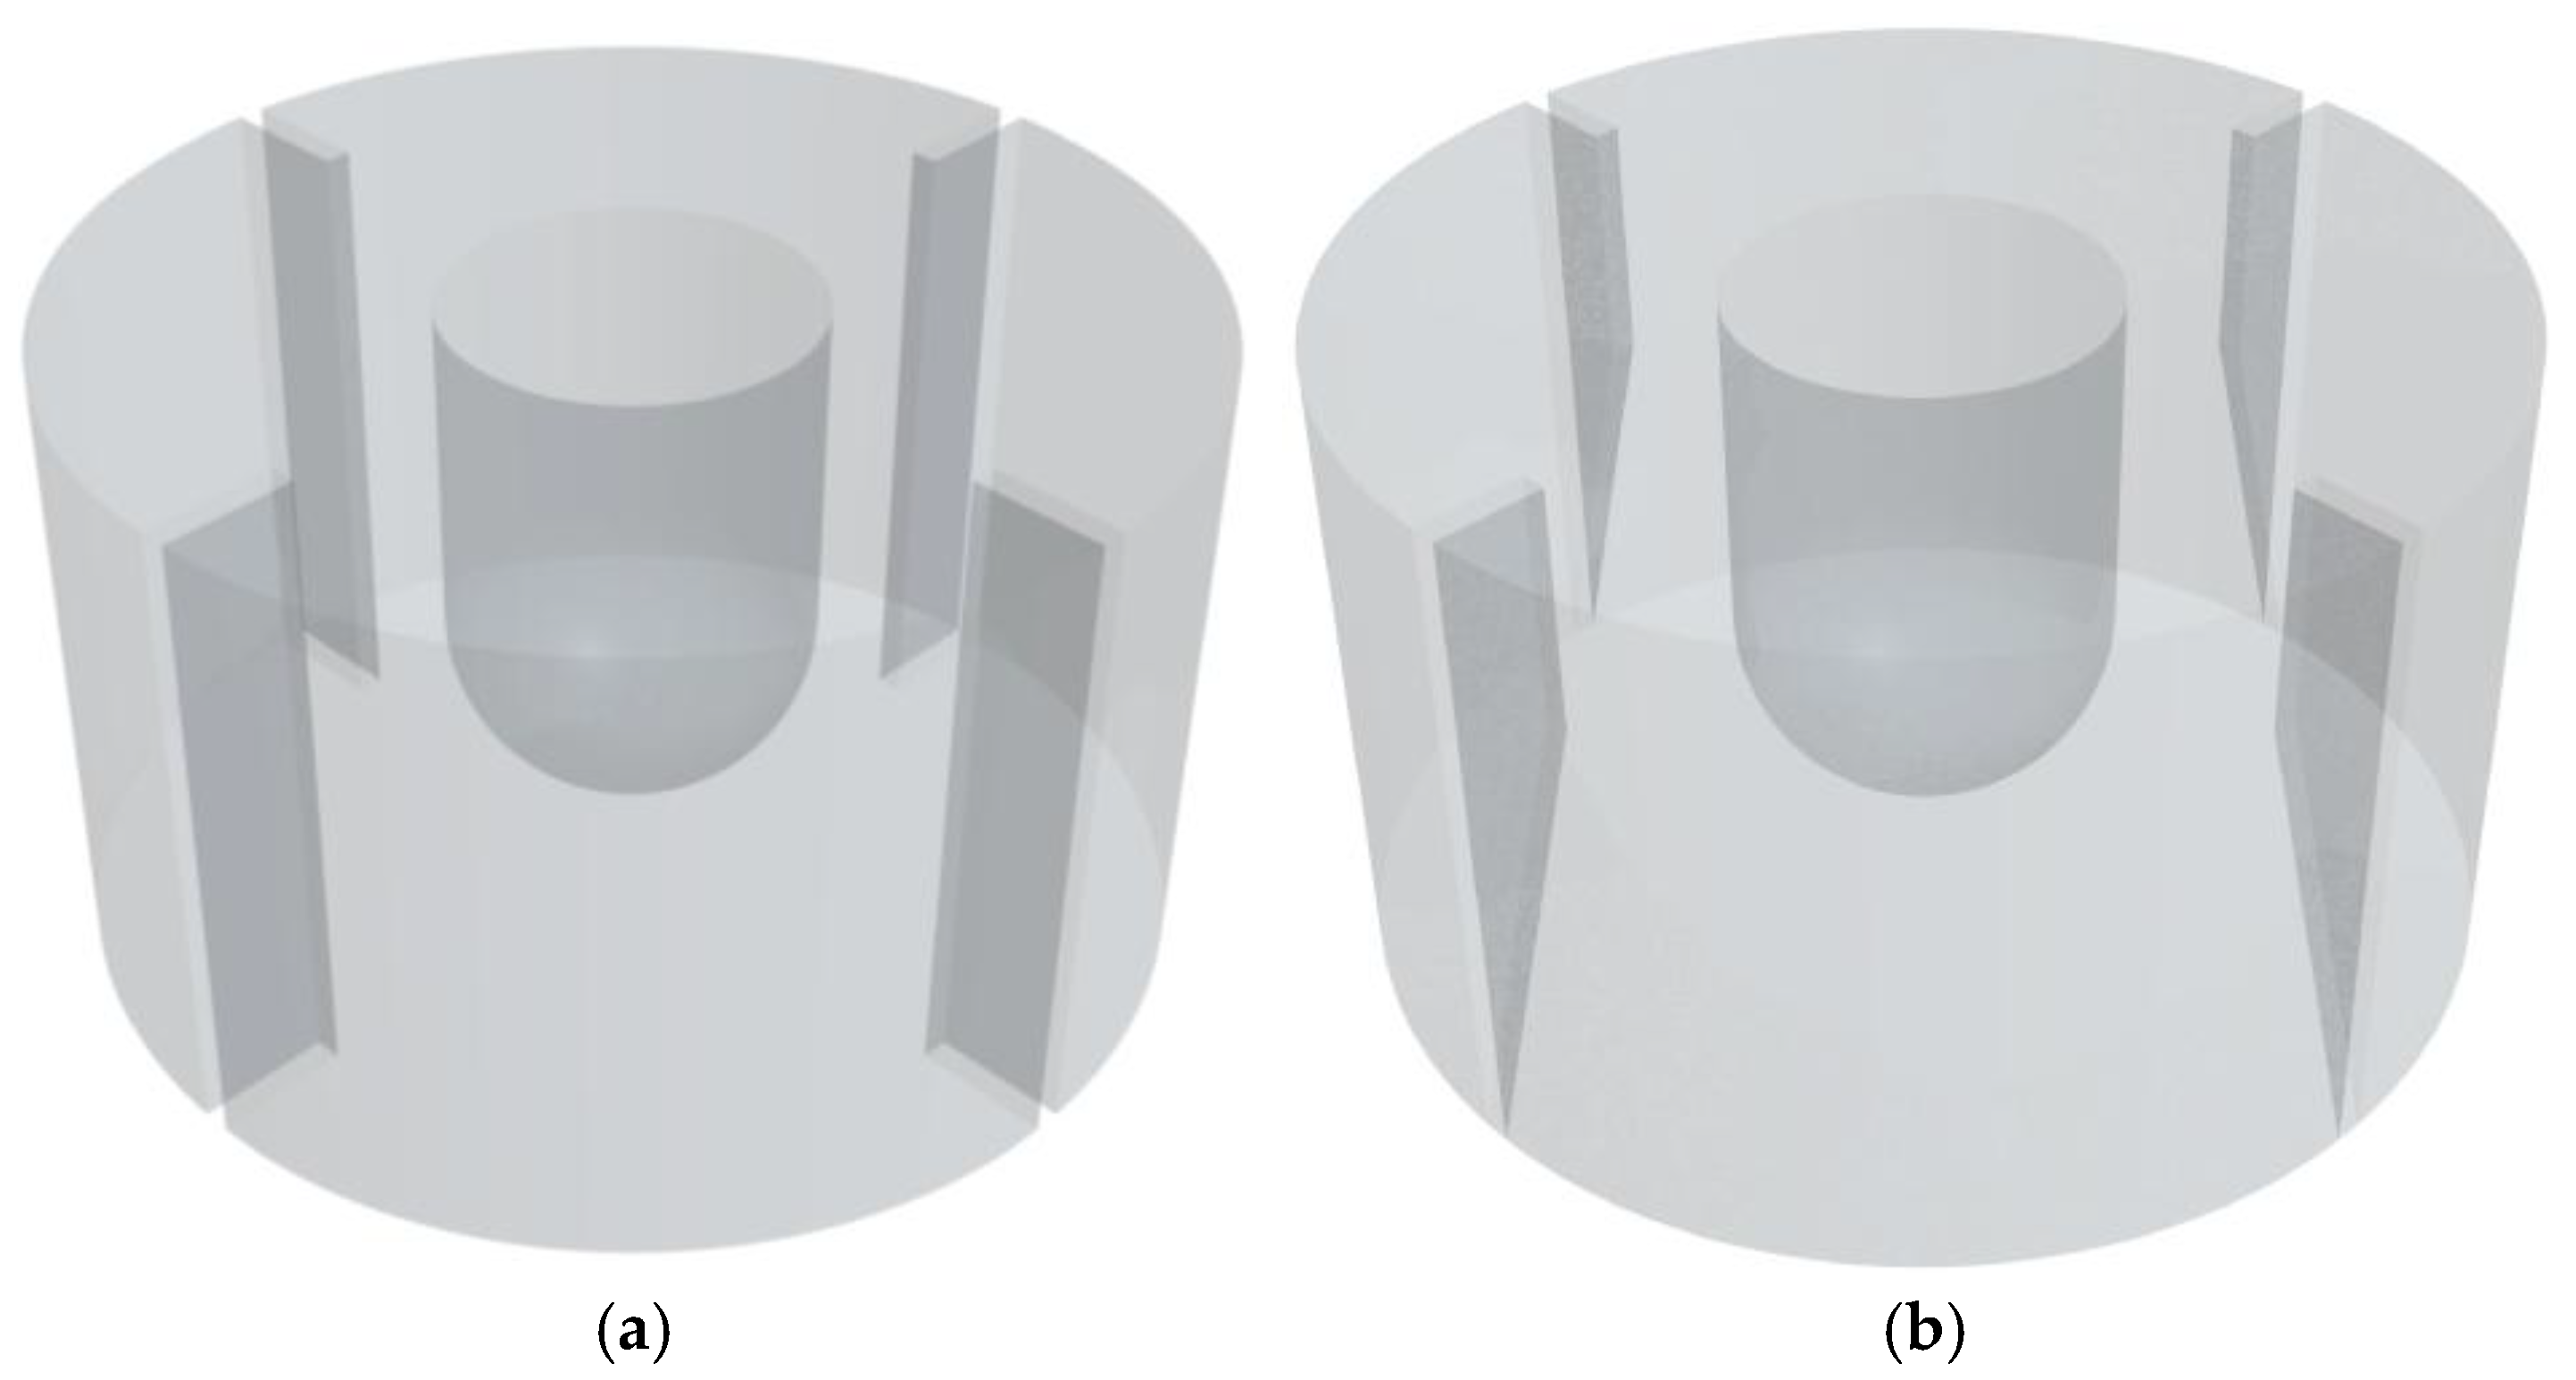
Figure 1. Specific installation positions of the baffles in the crucible: (a) straight baffle; (b) inclined baffle.
Processes 14 01500 g001
Figure 2. Structural dimensions of the baffles: (a) straight baffle; (b) inclined baffle.
Processes 14 01500 g002
Figure 3. Improved tracer and ink injection positions and distribution of monitoring points under the no-baffle condition.
Processes 14 01500 g003
Figure 4. Improved tracer and ink injection positions and distribution of monitoring points under the straight-baffle condition: (a) In front of the baffle; (b) Behind the baffle.
Processes 14 01500 g004
Figure 5. Improved tracer and ink injection positions and distribution of monitoring points under the inclined-baffle condition: (a) In front of the baffle; (b) Behind the baffle.
Processes 14 01500 g005
Figure 6. Ink-transport patterns in the crucible at a crystallizer rotational speed of 200 rpm under the no-baffle condition.
Processes 14 01500 g006
Figure 7. Ink-transport patterns in the crucible at a crystallizer rotational speed of 300 rpm under the no-baffle condition.
Processes 14 01500 g007
Figure 8. Schematic of the flow patterns under the no-baffle condition at two different crystallizer rotational speeds, (a) 200 rpm; (b) 300 rpm.
Processes 14 01500 g008
Figure 9. Tracer concentration curves at a crystallizer rotational speed of 200 rpm under the no-baffle condition: (a) monitoring points 1–4; (b) monitoring points 5–8. The arrows and red dots indicate the tracer injection positions, and the black arrow represents the rotation direction of the crystallizer. The gray area in the figure represents the dimensionless concentration of 1 ± 0.05, which is the mixing range.
Processes 14 01500 g009
Figure 10. Tracer concentration curves at a crystallizer rotational speed of 300 rpm under the no-baffle condition: (a) monitoring points 1–4; (b) monitoring points 5–8. The arrows and red dots indicate the tracer injection positions, and the black arrow represents the rotation direction of the crystallizer. The gray area in the figure represents the dimensionless concentration of 1 ± 0.05, which is the mixing range.
Processes 14 01500 g010
Figure 11. Ink-transport patterns in the crucible at a crystallizer rotational speed of 200 rpm with straight baffles installed.
Processes 14 01500 g011
Figure 12. Ink-transport patterns in the crucible at a crystallizer rotational speed of 300 rpm with straight baffles installed.
Processes 14 01500 g012
Figure 13. Schematic of the flow patterns with straight baffles installed at two different crystallizer rotational speeds, (a) 200 rpm; (b) 300 rpm.
Processes 14 01500 g013
Figure 14. Tracer concentration curves at a crystallizer rotational speed of 200 rpm with straight baffles installed: (a) monitoring points 1–4; (b) monitoring points 5–8. The arrows and red dots indicate the tracer injection positions, and the black arrow represents the rotation direction of the crystallizer. The gray area in the figure represents the dimensionless concentration of 1 ± 0.05, which is the mixing range.
Processes 14 01500 g014
Figure 15. Tracer concentration curves at a crystallizer rotational speed of 200 rpm with straight baffles installed: (a) monitoring points 9–12; (b) monitoring points 13–16. The arrows and red dots indicate the tracer injection positions, and the black arrow represents the rotation direction of the crystallizer. The gray area in the figure represents the dimensionless concentration of 1 ± 0.05, which is the mixing range.
Processes 14 01500 g015
Figure 16. Tracer concentration curves at a crystallizer rotational speed of 300 rpm with straight baffles installed: (a) monitoring points 1–4; (b) monitoring points 5–8. The arrows and red dots indicate the tracer injection positions, and the black arrow represents the rotation direction of the crystallizer. The gray area in the figure represents the dimensionless concentration of 1 ± 0.05, which is the mixing range.
Processes 14 01500 g016
Figure 17. Tracer concentration curves at a crystallizer rotational speed of 300 rpm with straight baffles installed: (a) monitoring points 9–12; (b) monitoring points 13–16. The arrows and red dots indicate the tracer injection positions, and the black arrow represents the rotation direction of the crystallizer. The gray area in the figure represents the dimensionless concentration of 1 ± 0.05, which is the mixing range.
Processes 14 01500 g017
Figure 18. Ink-transport patterns in the crucible at a crystallizer rotational speed of 200 rpm with inclined baffles installed.
Processes 14 01500 g018
Figure 19. Ink-transport patterns in the crucible at a crystallizer rotational speed of 300 rpm with inclined baffles installed.
Processes 14 01500 g019
Figure 20. Schematic of the flow patterns with inclined baffles installed at two crystallizer rotational speeds: (a) 200 rpm; (b) 300 rpm.
Processes 14 01500 g020
Figure 21. Tracer concentration curves at a crystallizer rotational speed of 200 rpm with inclined baffles installed: (a) monitoring points 1–4; (b) monitoring points 5–8; (c) monitoring points 9–12. The arrows and red dots indicate the tracer injection positions, and the black arrow represents the rotation direction of the crystallizer. The gray area in the figure represents the dimensionless concentration of 1 ± 0.05, which is the mixing range.
Processes 14 01500 g021
Figure 22. Tracer concentration curves at a crystallizer rotational speed of 300 rpm with inclined baffles installed: (a) monitoring points 1–4; (b) monitoring points 5–8; (c) monitoring points 9–12. The arrows and red dots indicate the tracer injection positions, and the black arrow represents the rotation direction of the crystallizer. The gray area in the figure represents the dimensionless concentration of 1 ± 0.05, which is the mixing range.
Processes 14 01500 g022
Figure 23. Comparison of tracer concentration variation curves at monitoring points before the baffle at the top of the crucible under three conditions at 200 rpm: (a) Monitoring point 1; (b) Monitoring point 2; (c) Monitoring point 3; (d) Monitoring point 4. The arrows and red dots indicate the tracer injection positions, and the black arrow represents the rotation direction of the crystallizer. The gray area in the figure represents the dimensionless concentration of 1 ± 0.05, which is the mixing range.
Processes 14 01500 g023
Figure 24. Comparison of tracer concentration variation curves at monitoring points behind the baffle at the top of the crucible under three conditions at 200 rpm: (a) Monitoring points 5 under straight and inclined baffles, and monitoring point 1 under no baffle; (b) Monitoring points 6 under straight and inclined baffles, and monitoring point 2 under no baffle; (c) Monitoring points 7 under straight and inclined baffles, and monitoring point 3 under no baffle; (d) Monitoring points 8 under straight and inclined baffles, and monitoring point 4 under no baffle. The arrows and red dots indicate the tracer injection positions, and the black arrow represents the rotation direction of the crystallizer. The gray area in the figure represents the dimensionless concentration of 1 ± 0.05, which is the mixing range.
Processes 14 01500 g024
Figure 25. Comparison of tracer concentration variation curves at monitoring points before the baffle at the bottom of the crucible under three conditions at 200 rpm: (a) Monitoring point 9 under straight and inclined baffles and monitoring point 5 under no baffle; (b) Monitoring point 10 under straight and inclined baffles and monitoring point 6 under no baffle; (c) Monitoring point 11 under straight and inclined baffles and monitoring point 7 under no baffle; (d) Monitoring point 12 under straight and inclined baffles and monitoring point 8 under no baffle. The arrows and red dots indicate the tracer injection positions, and the black arrow represents the rotation direction of the crystallizer. The gray area in the figure represents the dimensionless concentration of 1 ± 0.05, which is the mixing range.
Processes 14 01500 g025
Figure 26. Comparison of tracer concentration variation curves at monitoring points behind the baffle at the bottom of the crucible under three conditions at 200 rpm: (a) Monitoring point 13 under straight baffles, monitoring point 9 under inclined baffles, and monitoring point 5 under no baffle; (b) Monitoring point 14 under straight baffles, monitoring point 10 under inclined baffles, and monitoring point 6 under no baffle; (c) Monitoring point 15 under straight baffles, monitoring point 11 under inclined baffles, and monitoring point 7 under no baffle; (d) Monitoring point 16 under straight baffles, monitoring point 12 under inclined baffles, and monitoring point 8 under no baffle. The arrows and red dots indicate the tracer injection positions, and the black arrow represents the rotation direction of the crystallizer. The gray area in the figure represents the dimensionless concentration of 1 ± 0.05, which is the mixing range.
Processes 14 01500 g026
Figure 27. Comparison of tracer concentration variation curves at monitoring points before the baffle at the top of the crucible under three conditions at 300 rpm: (a) Monitoring point 1; (b) Monitoring point 2; (c) Monitoring point 3; (d) Monitoring point 4. The arrows and red dots indicate the tracer injection positions, and the black arrow represents the rotation direction of the crystallizer. The gray area in the figure represents the dimensionless concentration of 1 ± 0.05, which is the mixing range.
Processes 14 01500 g027
Figure 28. Comparison of tracer concentration variation curves at monitoring points behind the baffle at the top of the crucible under three conditions at 300 rpm: (a) Monitoring point 5 under straight and inclined baffles and monitoring point 1 under no baffle; (b) Monitoring point 6 under straight and inclined baffles and monitoring point 2 under no baffle; (c) Monitoring point 7 under straight and inclined baffles and monitoring point 3 under no baffle; (d) Monitoring point 8 under straight and inclined baffles and monitoring point 4 under no baffle. The arrows and red dots indicate the tracer injection positions, and the black arrow represents the rotation direction of the crystallizer. The gray area in the figure represents the dimensionless concentration of 1 ± 0.05, which is the mixing range.
Processes 14 01500 g028
Figure 29. Comparison of tracer concentration variation curves at monitoring points before the baffle at the bottom of the crucible under three conditions at 300 rpm: (a) Monitoring point 9 under straight and inclined baffles and monitoring point 5 under no baffle; (b) Monitoring point 10 under straight and inclined baffles and monitoring point 6 under no baffle; (c) Monitoring point 11 under straight and inclined baffles and monitoring point 7 under no baffle; (d) Monitoring point 12 under straight and inclined baffles and monitoring point 8 under no baffle. The arrows and red dots indicate the tracer injection positions, and the black arrow represents the rotation direction of the crystallizer. The gray area in the figure represents the dimensionless concentration of 1 ± 0.05, which is the mixing range.
Processes 14 01500 g029
Figure 30. Comparison of tracer concentration variation curves at monitoring points behind the baffle at the bottom of the crucible under three conditions at 300 rpm: (a) Monitoring point 13 under straight baffles, monitoring point 9 under inclined baffles, and monitoring point 5 under no baffle; (b) Monitoring point 14 under straight baffles, monitoring point 10 under inclined baffles, and monitoring point 6 under no baffle; (c) Monitoring point 15 under straight baffles, monitoring point 11 under inclined baffles, and monitoring point 7 under no baffle; (d) Monitoring point 16 under straight baffles, monitoring point 12 under inclined baffles, and monitoring point 8 under no baffle. The arrows and red dots indicate the tracer injection positions, and the black arrow represents the rotation direction of the crystallizer. The gray area in the figure represents the dimensionless concentration of 1 ± 0.05, which is the mixing range.
Processes 14 01500 g030
Table 1. Quantitative comparison of response time and mixing time at monitoring point 6 under different baffle configurations at 200 rpm.
Case 200 rpmMonitoring PointResponse Time/sMixing Time/s
No baffle6317
Straight baffle10 (6 Front)047
Inclined baffle10 (6 Front)016
Table 2. Quantitative comparison of response time and mixing time at monitoring point 6 under different baffle configurations at 300 rpm.
Case 300 rpmMonitoring PointResponse Time/sMixing Time/s
No baffle6412
Straight baffle10 (6 Front)037
Inclined baffle10 (6 Front)020
Disclaimer/Publisher’s Note: The statements, opinions and data contained in all publications are solely those of the individual author(s) and contributor(s) and not of MDPI and/or the editor(s). MDPI and/or the editor(s) disclaim responsibility for any injury to people or property resulting from any ideas, methods, instructions or products referred to in the content.