Article

Multi-Parameter Simultaneous Optimization of LDWC-IR Systems Based on the SaDE Algorithm

by
Qiuli Zhang
*,
Jiasen He
,
Huaiyu Zhao
,
Jing Zhang
,
Chengbin Shen
and
Lei Wu
School of Chemistry and Chemical Engineering, Xi’an University of Architecture and Technology, Xi’an 710055, China
*
Author to whom correspondence should be addressed.
Processes 2026, 14(9), 1493; https://doi.org/10.3390/pr14091493
Submission received: 5 April 2026 / Revised: 28 April 2026 / Accepted: 30 April 2026 / Published: 5 May 2026
(This article belongs to the Section Energy Systems)

Abstract

The liquid-only transfer dividing wall column (LDWC) eliminates the difficulty of controlling the vapor-phase distribution ratio; however, it involves numerous structural and operating parameters, resulting in high initialization difficulty and convergence challenges. This paper proposes a Matlab-SaDE-Aspen Plus (Aspen Plus V14) framework that reformulates the convergence problem through a multi-parameter simultaneous optimization approach, thereby enabling the efficient design of the LDWC. Building upon this framework, two intermediate reboiler intensification schemes (IR-LDWC1 and IR-LDWC2) are proposed based on CGCC analysis, and four key parameters are simultaneously optimized using the Matlab-SaDE-Aspen Plus framework to eliminate the cumulative errors inherent in independent sequential parameter optimization. The results indicate that, compared with conventional distillation sequences, the LDWC achieves reductions of 17.62% in total energy consumption, 19.35% in total annual cost, and 16.53% in CO2 emissions, with the most significant improvement observed in exergy efficiency. Among the intensified configurations, IR-LDWC2 exhibits the best overall performance, with total energy consumption, TAC, and CO2 emissions further reduced by 30.15%, 33.17%, and 31.24%, respectively.

1. Introduction

To overcome the inherent thermodynamic efficiency limitations of conventional distillation sequences (CDSs), researchers have proposed various thermally coupled distillation schemes, including the fully thermally coupled distillation column (FTCDC), the dividing wall column (DWC), and the liquid-only transfer dividing wall column (LOT-DWC, hereinafter referred to as LDWC).
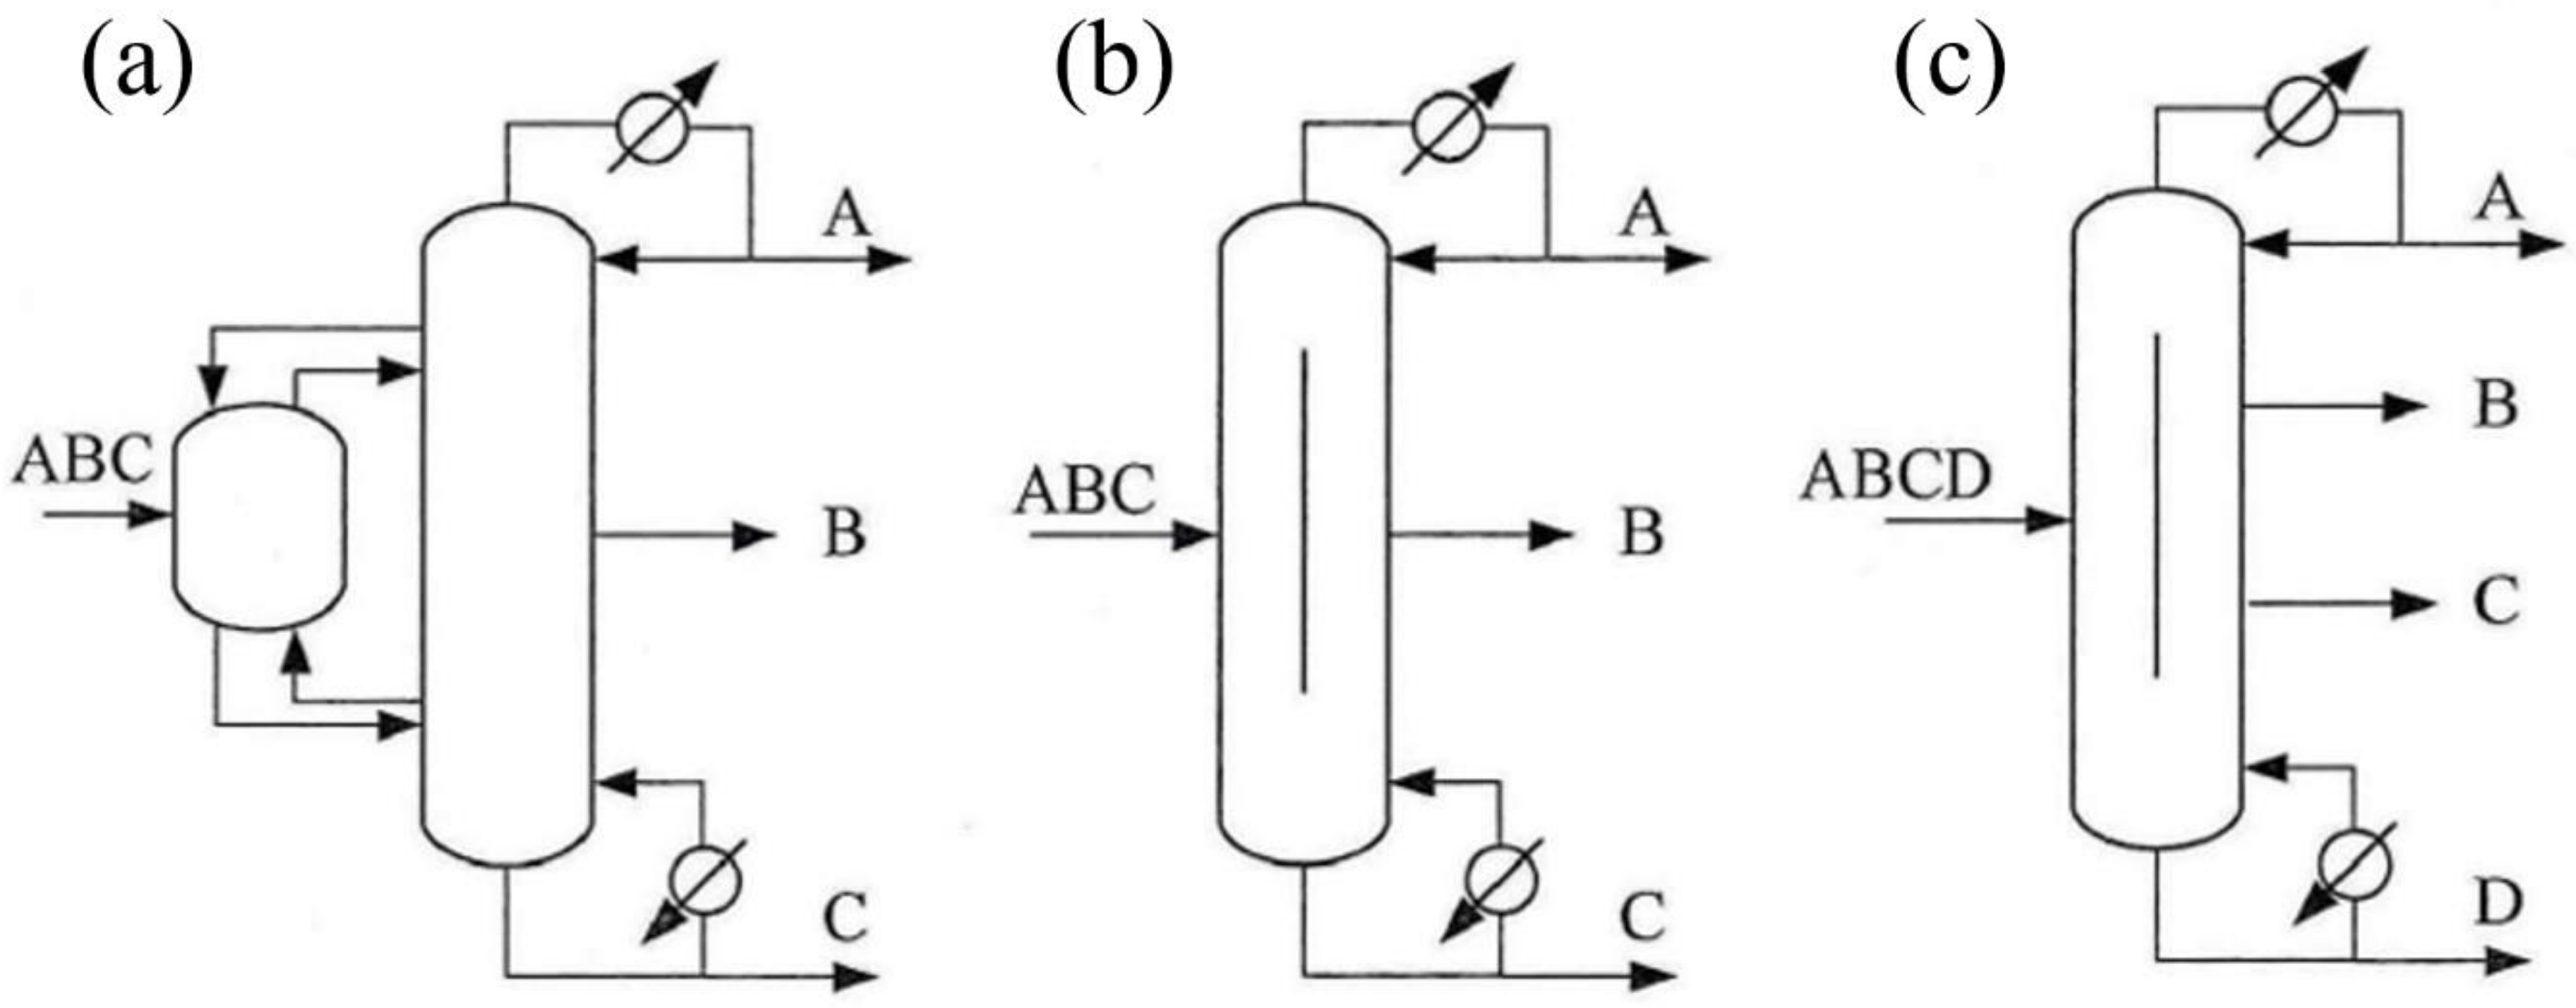
Petlyuk [1] first introduced the concept of the FTCDC, which reduces the mass transfer driving force required in the distillation process through effective withdrawal and integration of vapor–liquid streams among multiple column sections. As illustrated in Figure 1a, the typical FTCDC configuration eliminates the condenser and reboiler of the prefractionator, utilizing the liquid and vapor streams withdrawn from the main column as the liquid reflux and rising vapor for the prefractionator, respectively. Compared with conventional sequential distillation, the FTCDC reduces one condenser and one reboiler when separating ternary mixtures, thereby lowering both equipment investment and operating costs.
Wright [2] first achieved the integration of the FTCDC into a single column shell using a vertical partition wall, as shown in Figure 1b. The Wright-type DWC enables ternary mixture separation within a single column, while Kaibel [3] further extended this concept to quaternary mixture separation in a single column, as shown in Figure 1c. However, the DWC presents the control challenge of the vapor split ratio, which is susceptible to column pressure drop, feed flow rate, and composition variations, making precise control difficult. This significantly affects equipment investment and total energy consumption, constraining the pace of its industrial deployment to some extent [4,5]. To date, more than 300 DWC units have been successfully implemented in industrial applications worldwide.
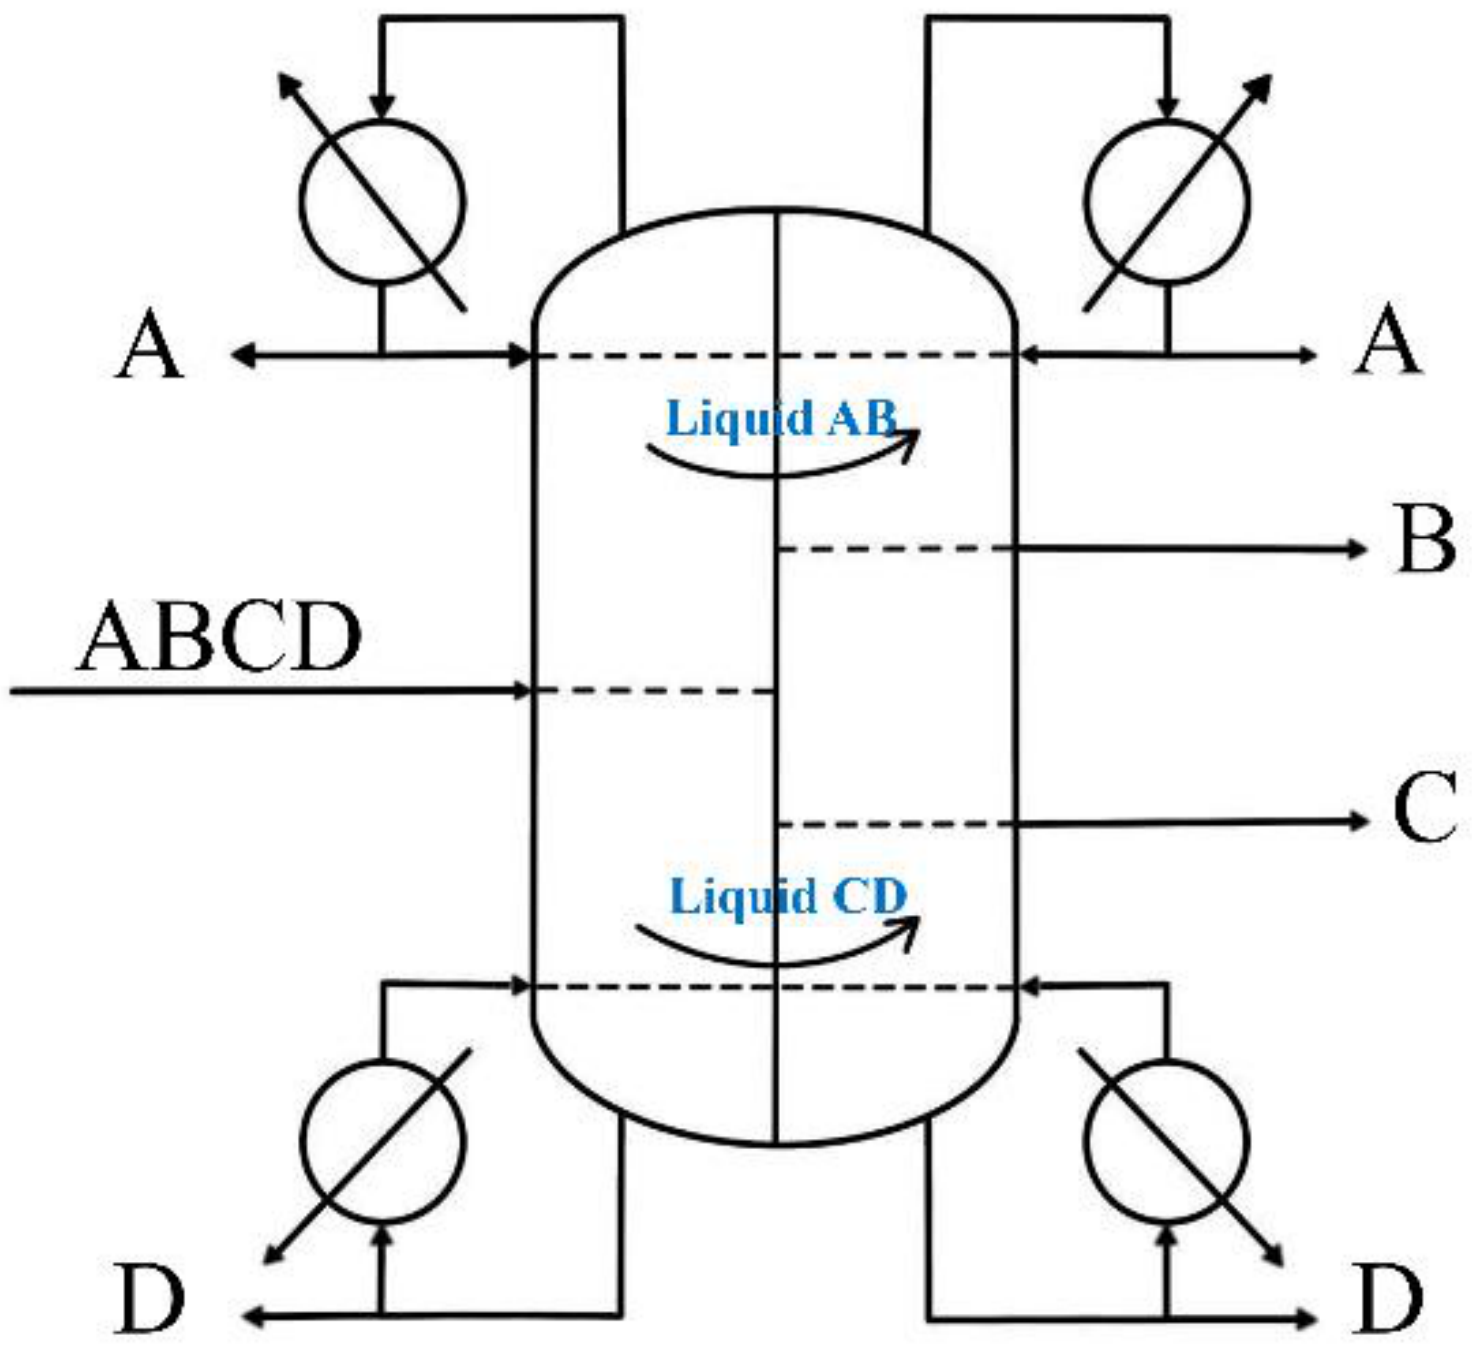
Liquid-phase transfer between distillation equipment is easier to operate and control compared with vapor-phase transfer. Agrawal [6] proposed converting the bidirectional vapor–liquid transfer streams within a DWC into liquid-only transfer streams by adding additional equipment and extending column sections, resulting in the LDWC structure shown in Figure 2, where A, B, C, and D denote components with decreasing relative volatility. The LDWC not only eliminates the vapor split ratio control challenge but also allows the two sides of the partition wall to operate at different pressures, thereby broadening the applicability of the DWC.

1.1. Liquid-Only Transfer Dividing Wall Column

Ramapriya et al. [6] demonstrated through mathematical analysis that the LDWC proposed by Agrawal is thermodynamically equivalent to its corresponding conventional DWC, and provided a detailed discussion of various possible LDWC configurations for ternary separations. Compared with conventional DWCs, the LDWC not only eliminates the vapor split ratio control challenge but also enables each side of the partition wall to operate at different pressures, thereby broadening the applicability of the DWC. Since no built-in LDWC model exists in current commercial process simulation software, Feng and Song et al. [7,8] neglected the heat transfer across the LDWC partition wall and constructed an equivalent LDWC model for ternary mixture separation using rigorous distillation modules on the Aspen Plus platform. Wu et al. [9] applied the LDWC to the separation of an equimolar mixture of 1,2-ethanediol, 1,3-propanediol, and 1,4-butanediol, optimizing the structural parameters with the minimization of total annual cost (TAC) as the objective function. Compared with the CDS, the LDWC reduced TAC by 17%, while saving 28% in cold utilities and 19% in hot utilities. Cui et al. [10] designed ten distillation sequences for ternary mixture separation and, using the separation of an equimolar benzene-toluene-xylene mixture as a case study, employed evolutionary algorithms with TAC minimization as the objective function to obtain optimal operating parameters and in-column composition profiles for each configuration. The results demonstrated that the LDWC effectively reduces backmixing of intermediate components within the column, achieving the lowest energy consumption and highest economic performance among all distillation sequences considered.
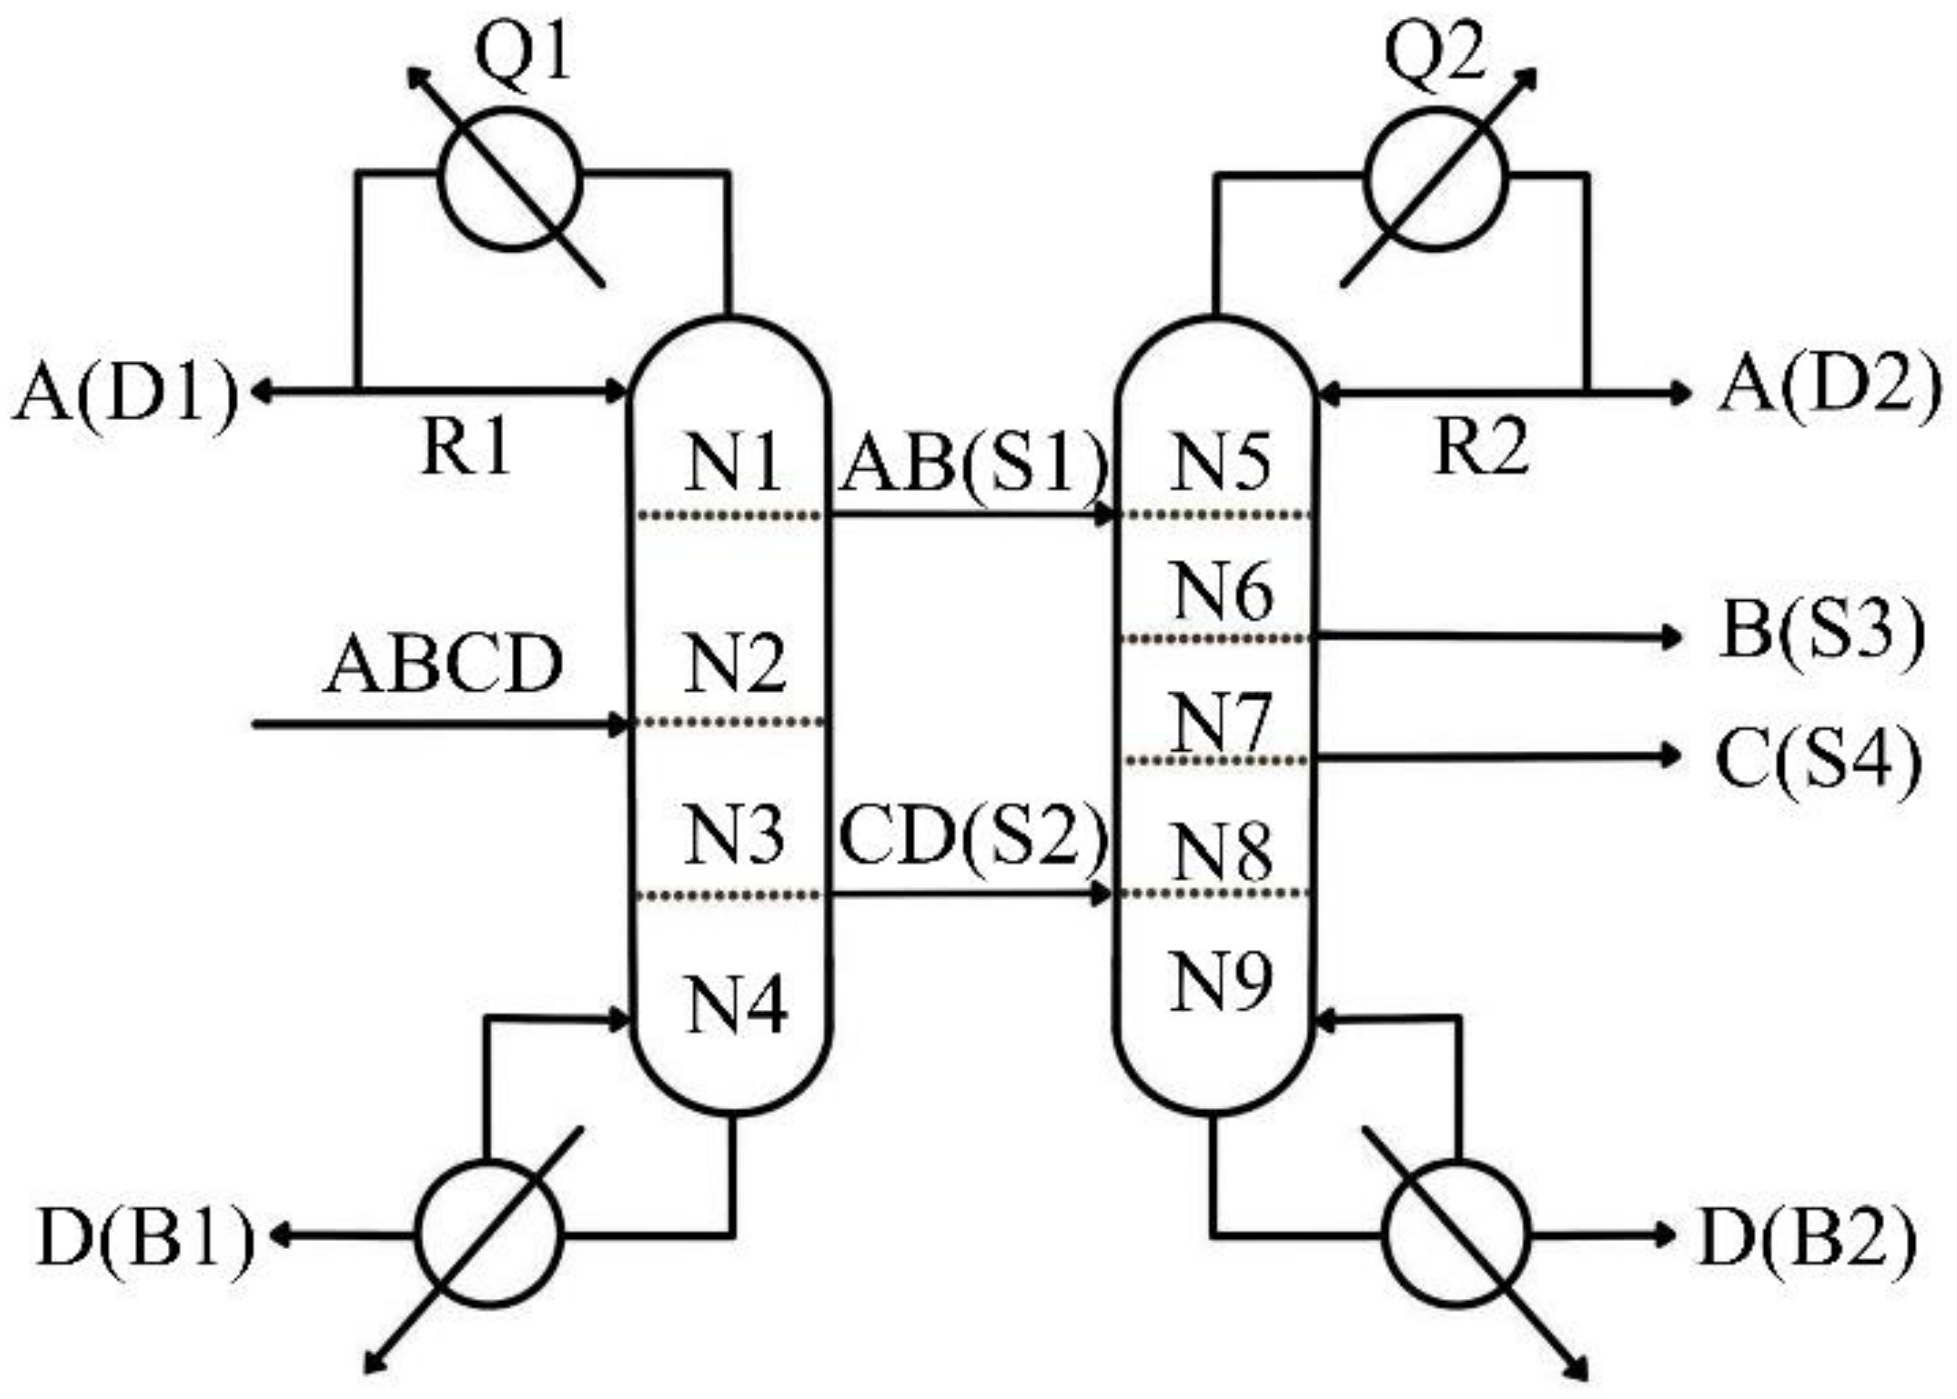
The aforementioned studies have primarily focused on the optimization of three-component LDWC systems, while research on four-component LDWC configurations remains scarce. The primary reason is that the initialization of four-component LDWC systems is extremely challenging, with low optimization convergence efficiency and prohibitively high trial-and-error costs for manual iteration. The structural parameters of a four-component LDWC are illustrated in Figure 3, comprising 9 discrete variables (N1–N9), 8 continuous variables (R1–R2, D1–D2, S1–S4), and 2 categories of constraint equations (product specifications and MESH equations), constituting a typical MINLP problem.
For the MINLP problems encountered in the optimization of four-component distillation sequences and four-component LDWC systems, the conventional sequential optimization method is essentially a manual decoupling of the MINLP problem. The solutions obtained through such decoupling are not global optima of the MINLP problem but merely feasible solutions under specific conditions. To date, such problems have not been adequately addressed.

1.2. Process Intensification of LDWC

Regarding LDWC process intensification, Tututi-Avila et al. [11] coupled the LDWC with extractive distillation to form the extractive LDWC (E-LDWC), addressing the difficulties of vapor split ratio control and low thermodynamic efficiency in conventional extractive DWC operations. When applied to the separation of ethanol-water, acetone-methanol, and heptane-toluene azeotropic mixtures, the E-LDWC achieved savings of 13.5%, 14.3%, and 13.4% in total energy consumption, 12.4%, 12.9%, and 12.45% in TAC, and 10.6%, 14.3%, and 13.4% in CO2 emissions, respectively, compared with conventional extractive distillation. Furthermore, heat integration studies on the E-LDWC yielded additional performance improvements. Zhang et al. [12] conducted dynamic control studies on the E-LDWC for acetone-methanol azeotrope separation, finding that a feedforward temperature control scheme could better maintain product purity near set points. By simultaneously modifying the operating pressures on both sides of the E-LDWC and employing a heat integration approach utilizing the overhead vapor from the right-side column as the heat source for the left-side reboiler, total energy consumption, TAC, and CO2 emissions were further reduced by 29.34%, 26.98%, and 29.34%, respectively, compared with the E-LDWC. A feedforward temperature control scheme incorporating a product composition controller enabled the system to handle ±20% feed disturbances. Ge et al. [13] modified a reactive distillation DWC into a liquid-only transfer reactive distillation DWC and applied it to methyl formate-based formic acid production, enabling reaction and separation to proceed at different pressures, further improving the thermodynamic efficiency of the system. Compared with the conventional reactive distillation process, this approach achieved savings of 7.5% in total energy consumption and 6.6% in TAC. Meanwhile, both multi-loop PI control and model predictive control were employed for effective system control, with results indicating that the model predictive control scheme offers superior performance in handling feed disturbances. In addition to coupling the LDWC with extractive and reactive distillation for process intensification, Duanmu et al. [14] first applied vapor recompression (VRC) technology to an LDWC equipped with a single reboiler and condenser, converting low-temperature waste heat into a high-grade heat source to supply heat to the reboiler, thereby improving the energy utilization efficiency of the system. An equivalent model for separating a ternary mixture of benzene, toluene, and o-xylene was constructed on the gPROMS platform, demonstrating higher thermodynamic efficiency and lower TAC compared with the base configuration.
The LDWC process intensification studies mentioned above all demonstrated significant TAC reductions. However, the parameter optimization methods employed in these process intensification efforts remain based on sequential optimization, lacking investigation into the coupling effects among parameters.

1.3. Application of Optimization Algorithms in Distillation Processes

Currently, the applications of optimization algorithms in distillation processes are as follows. Gutiérrez-Guerra et al. [15] employed a Boltzmann-based estimation of distribution algorithm to search for optimal schemes under different feed conditions for a two-component internally heat-integrated distillation column (HIDiC) process. The results showed that a mixture with a feed composition of 0.75/0.25 achieved the best balance between energy consumption and TAC; moreover, the optimal HIDiC design reduced TAC by 2% compared with the classical HIDiC. Shahandeh et al. [16] investigated the optimal design parameters for HIDiC processes using a genetic algorithm (GA). The results indicated that optimization of both external and internal HIDiC configurations using GA achieved TAC reductions of up to 6.60% and 9.75%, respectively, compared with conventional processes. Qiu et al. [17] employed neural network models to study the optimal design and the relative importance of various parameters for an externally heat-integrated propylene/propane distillation process. The results showed that each independent variable had a different degree of influence on TAC, with the location of heat integration in the rectifying section having the greatest impact; compressor investment and operating costs constituted the major components of TAC; and the best-performing TAC scheme tended to implement heat integration between the bottom and top of the rectifying section. Rahman et al. [18] combined GA with neural network models to investigate the optimal design parameters for desulfurization processes in petroleum refining. The results showed that the optimized scheme reduced fuel gas consumption by 98%, while the required temperatures for air and acid gas were lowered by 142 °C and 4 °C, respectively. Michailos et al. [19] employed a multi-objective optimization GA to study the optimal design of a bioethanol refining process, and combined with a typical discounted cash flow analysis, determined a minimum ethanol selling price of $0.69/L. Yang et al. [20] applied simulated annealing to study the optimal designs and process parameters of several two-component extractive distillation processes. The results demonstrated that the simulated annealing algorithm has the advantage of autonomous operation and a high probability of obtaining near-globally optimal design solutions. Cui et al. [21] used GA to investigate the optimal design of two-component extractive distillation processes under varying pressure conditions. The results showed that pressure optimization in pressure-sensitive systems yields significant economic benefits, whereas the opposite holds for pressure-insensitive systems. Li et al. [22] employed metaheuristic algorithms to study the optimal designs and parameters of double-effect distillation and self-heat recuperation technologies applied to ethylbenzene/styrene distillation processes. The results showed that for a processing capacity of 100 kmol/h with a 3-year payback period, double-effect distillation and self-heat recuperation configurations reduced TAC by approximately 8% compared with conventional process designs. For a processing capacity of 1000 kmol/h, the TAC reduction increased to approximately 28%.
Existing studies have predominantly focused on single-column distillation or extractive distillation optimization of two-component or specific systems, typically involving no more than 6 decision variables. For MINLP problems involving four or more components, multi-column coupling, and multiple structural and operating variables, related research remains limited. In particular, there is a lack of a general algorithmic framework capable of automatically achieving convergence and global optimization for complex distillation systems without requiring a feasible initial solution. In this work, a Matlab-based self-adaptive differential evolution algorithm coupled with Aspen Plus was developed as an integrated self-adaptive optimization system featuring automatic convergence and global optimization.

2. System Performance Evaluation Framework

This paper conducts a comprehensive analysis from the perspectives of energy, exergy, economics, and environmental impact, employing total energy consumption, exergy efficiency, total annual cost, and gaseous emissions as indicators for the comprehensive evaluation of system performance.

2.1. Energy Analysis

Total energy consumption (QE), as an indicator of energy analysis, can be calculated using Equation (1).
Q E = Q R + 3 n W n
where QR (kW) is the sum of all heater heat duties; Wn (kW) represents the electric power generated and consumed by operating units, with subscript n denoting specific operating units such as compressors. The coefficient 3 is the electricity conversion factor, derived from the reciprocal of the thermal-to-electric conversion efficiency. In chemical process energy analysis, the average efficiency of thermal power generation is commonly assumed to be approximately 33% (i.e., 1/3); therefore, converting 1 kW of electrical work to equivalent thermal energy requires multiplication by 3 to reflect the primary energy consumption associated with power generation [23].

2.2. Exergy Analysis

Compared with entropy, exergy has greater practical significance because it combines the first and second laws of thermodynamics. The exergy of a system represents the ideal work done when transforming the system from its initial state to the dead state [24]. When performing exergy analysis of a system, the exergy efficiency (ηgoal), also known as the second-law efficiency or thermodynamic efficiency, is commonly employed to evaluate the energy utilization of the system. Depending on whether the main function value is positive or negative, the exergy efficiency can be calculated using Equation (2) or Equation (3), respectively [25].
When the main function is positive:
η ( + ) g o a l = m a i n   g o a l L W m a i n   g o a l
When the main function is negative:
η ( + ) g o a l = m a i n   g o a l m a i n   g o a l L W
where LW represents the lost work or exergy destruction. The main goal represents the change in exergy of streams crossing the system boundary, with its absolute value equal to the minimum work required by the system (Wmin). For a continuous, steady-state system, main goal and LW are calculated using Equations (4) and (5), respectively [26].
m a i n   g o a l = [ m ( H T 0 S ) 3600 ] i n [ m ( H T 0 S ) 3600 ] o u t
L W = [ m ( H T 0 S ) 3600 ] i n [ m ( H T 0 S ) 3600 ] o u t + [ Q ( 1 T 0 T ) ] i n [ Q ( 1 T 0 T ) ] o u t
where m (kmol/h) is the molar flow rate of the stream; H (kJ/kmol) and S (kJ/(kmol·K)) are the molar enthalpy and molar entropy of the stream, respectively. The subscripts in and out denote streams entering and leaving the system, respectively. Q (kW) is the heat duty of the reboiler or condenser. T (K) is the temperature of the heat source or heat sink. T0 (K) is the ambient temperature.

2.3. Economic Analysis

In the economic analysis of distillation systems, the total annual cost (TAC, $/year) is commonly employed as the quantitative criterion, defined by Equation (6) [27]:
T A C = o p e r a t i n g   c o s t + C a p i t a l   C o s t p a y b a c k   p e r i o d
where the capital cost equals the sum of installed equipment costs, including the purchase and installation costs of major equipment. For chemical process systems, major equipment includes column shells, trays, heat exchangers, compressors, and similar items. Operating costs primarily comprise cold and hot utility costs and electricity consumption costs. In this study, the payback period is assumed to be 10 years, with an annual operating time of 8000 h. The electricity price is assumed to be 0.1 $/(kW·h) [28,29]; the cooling water price is 0.354 $/GJ. Medium-pressure steam at 1.23 MPa is adopted as the heat source, priced at 7.86 $/GJ.
The installed costs of major equipment are calculated using Equations (7)–(11). The Marshall & Swift index (M&S) uses the 2018 published value of 1638.2 [30]. All equipment is assumed to be constructed of carbon steel [31].
It should be noted that the costing correlations used herein, based on the M&S index of 1638.2 (2018), may not fully reflect recent market volatility in raw material and equipment prices. However, since the primary objective of this study is comparative evaluation among different distillation configurations under identical economic assumptions, the relative ranking and percentage improvements reported are expected to remain valid even under moderate cost fluctuations.
(1)
Column shell
Column   shell   installed   cost   ( $ ) = M & S 280 × 937.636 × D 1.066 · H c 0.802 × ( 2.18 + F c ) × θ
H c = ( N a c t u a l 1 ) × H T + H
where D (m) represents the column diameter or equivalent diameter, which can be calculated using the Column Internals module in Aspen Plus [32]. Fc is the cost correction factor related to equipment material and operating pressure; for carbon steel, Fc = 1. Hc is the installed column height, which depends on the actual number of trays (Nactual) and tray spacing (HT); H is the column clearance. θ is the penalty factor, equal to 1 for conventional distillation columns and 1.1 for the LDWC [33].
(2)
Trays
Tray   installed   cost   ( $ ) = M & S 280 × 97.243 × D 1.55 · H t · F c
where Fc is the cost correction factor related to tray spacing, type, and material coefficients; for carbon steel, Fc = 1. Ht is the tray stack height in the column, equal to the installed height minus the clearance.
(3)
Heat exchangers
Heat   exchanger   installed   cost   ( $ ) = M & S 280 × 474.668 × A 0.65 × ( 2.29 + F c )
A ( m 2 ) = Q U · T
where Fc is the cost correction factor related to heat exchanger type, pressure, and material coefficients; for carbon steel shell-and-tube heat exchangers with operating pressures not exceeding 10.2 atm, Fc = 1.35. A (m2) is the heat exchanger area. Q (kW) is the heat duty. U (kW/(K·m2)) is the overall heat transfer coefficient, assumed to be 0.852 for condensers and 0.568 for heaters. ΔT (K) is the temperature driving force, calculated according to the method of Qiao et al. [30].
The costs of cold and hot utilities and electricity consumption related to operating costs can be calculated using Equations (12)–(14).
(1)
Hot utility
Hot   utility   cost   ( $ / year ) C h · Q R × 8000
(2)
Cold Utility
Cold   utility   costs   ( $ / year ) C c · Q c × 8000
(3)
Electricity consumption
Electricity   cost   ( $ / year ) C e · W comp × 8000
where Cc ($/GJ), Ch ($/GJ), and Ce ($/(kW·h)) are the unit prices of cold utility, hot utility, and electricity, respectively. QC (GJ/h) and QR (GJ/h) are the condenser and heater heat duties, respectively. Wcomp (kW) is the compressor power.

2.4. Environmental Analysis

To support carbon neutrality goals, environmental analysis of distillation systems is indispensable. In China, energy is primarily supplied by coal combustion, which produces CO2, SO2, and NOX gases, resulting in the greenhouse effect, acid rain, and photochemical smog, causing environmental pollution [34,35]. Therefore, gaseous emissions (Gemission, t/year) can be employed to evaluate the environmental impact of each system, calculated using Equation (15).
G e m i s s i o n = i ( a i · M c o a l b i · W e l e c 1000 )
where subscript i denotes the gas type; a and b are the emission conversion coefficients for equivalent coal and electricity consumption, respectively, as listed in Table 1. Mcoal and Welec are the equivalent coal and electricity consumption, which can be calculated using Equations (16) and (17).
M c o a l = 3.6 × Q R · t Q s t
W e l e c = W n × t
where t represents the annual operating time, typically set at 8000 h; Qst is the standard coal calorific value (29,307.6 kJ/kg); QR (kW) and Wn (kW) are consistent with the parameters in Equation (1).

3. Process Simulation and Optimization

The property method is the fundamental basis for process simulation, directly affecting the accuracy of thermodynamic equilibria, phase behavior, and energy and material balances. For strongly polar, non-ideal systems such as phenolic compounds, the NRTL (Non-Random Two-Liquid) method is commonly used in industrial simulation calculations. In Aspen Plus, the NRTL equation is a local composition thermodynamic model for calculating liquid-phase activity coefficients, widely applied to vapor–liquid equilibrium, liquid–liquid equilibrium, and non-ideality predictions of mixtures. Therefore, the NRTL method was selected for the simulations in this study.
The system under investigation is an equimolar quaternary mixture comprising phenol, o-cresol, m-cresol, and 3,4-dimethylphenol, designated as P, O, M, and X, respectively. The feed flow rate is 3600 kmol/h with a product purity requirement of 99 mol%. The feed temperature and pressure are 60 °C and 5 kPa, respectively. Total condensers and kettle-type reboilers are employed for all columns.

3.1. Selection of the CDS Configuration

To conduct a detailed evaluation of LDWC performance, the conventional distillation sequence was simulated as the baseline process for performance comparison.
Conventional distillation columns with a single feed and two product streams are widely used in industry due to their simple structure and ease of control. When separating an N-component mixture using a conventional distillation column sequence, N − 1 conventional columns are required. The number of potential conventional distillation sequences can be calculated using Equation (18):
N u m b e r = [ 2 ( N 1 ) ] ! N ! ( N 1 ) !
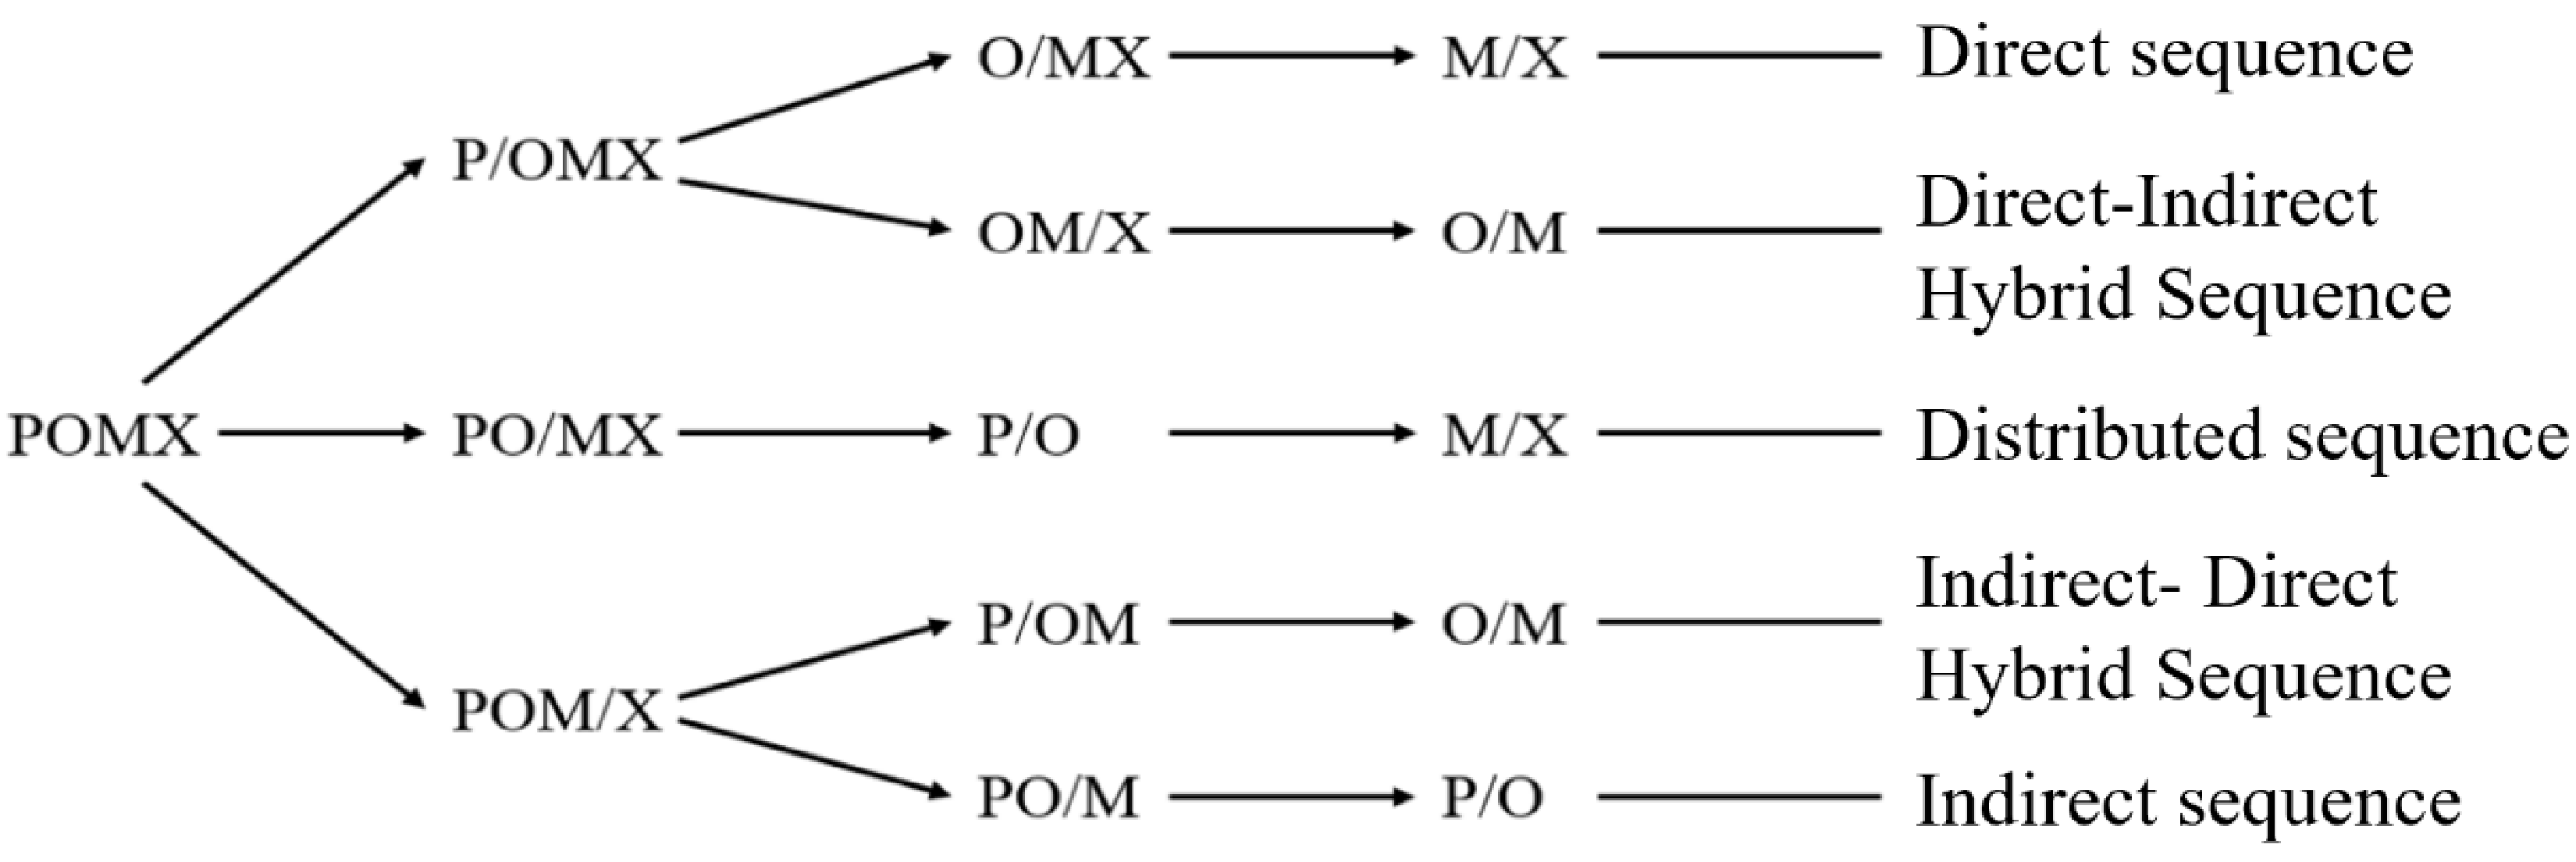
For the quaternary POMX mixture, the number of feasible separation sequences is 5, with 10 independent separation units. The possible separation sequences are illustrated in Figure 4.
For components that do not have a common boiling point, in industry, the direct sequence method (also known as the “light-key-first” strategy) [34] is generally adopted. That is, according to the descending order of component boiling points, the lightest component is removed from the top of the tower successively. Usually, the total heat load of the direct sequence is lower, and the bottom of the tower temperature will not be too high, which is conducive to using a cheaper heat source. The boiling points of POMX are 181.7 °C, 191.0 °C, 202.8 °C and 227 °C respectively. Therefore, in this paper, the first separation sequence in Figure 4 is selected as the basic process for performance comparison.

3.2. Matlab-SaDE-Aspen Plus Framework

Differential evolution (DE) is a population-based stochastic search optimization algorithm inspired by biological evolution through “inheritance, mutation, and natural selection.” It was proposed by Storn and Price in 1997 [36] and is primarily used for solving global optimization problems over continuous spaces. The key feature of the DE algorithm lies in its unique mutation strategy, which utilizes the vector differences between individuals in the population to perturb and generate new individuals, thereby guiding the population toward the optimal solution region. The basic framework of the DE algorithm is as follows [36]:
(1)
Population initialization: Determine the DE control parameters, including population size NP, scaling factor F, and crossover probability CR, and randomly generate the initial population.
(2)
Mutation: Randomly select a difference vector from two individuals in the population as a random perturbation source for a third individual; the weighted difference vector is added to the third individual according to prescribed rules to generate a mutant individual.
(3)
Crossover: The mutant individual is mixed with a predetermined target individual through parameter exchange to generate a trial individual.
(4)
Selection: Compare the fitness of the trial individual and the current individual, and select the individual with superior fitness as a member of the next generation population.
(5)
Iteration: Repeat the above process iteratively until termination conditions are satisfied (e.g., reaching the maximum number of iterations or achieving a predetermined fitness threshold), ultimately obtaining the approximate optimal solution.
The SaDE algorithm extends the DE algorithm by incorporating parameter self-adaptation and mutation strategy self-adaptation [37], allowing F and CR to participate in mutation, crossover, and selection alongside individual vectors. It provides a candidate strategy pool; during the initial phase, all strategies are selected with equal probability. The algorithm records the probability of each strategy successfully generating offspring superior to the parent over a past period, and dynamically adjusts the selection probability of each strategy based on these historical success rates. Strategies with better performance have higher selection probabilities in the current generation. This achieves “dual self-adaptation of strategies and parameters,” enabling the algorithm to automatically select the most appropriate search behavior based on the characteristics of the optimization problem and the search stage, resulting in highly robust performance.
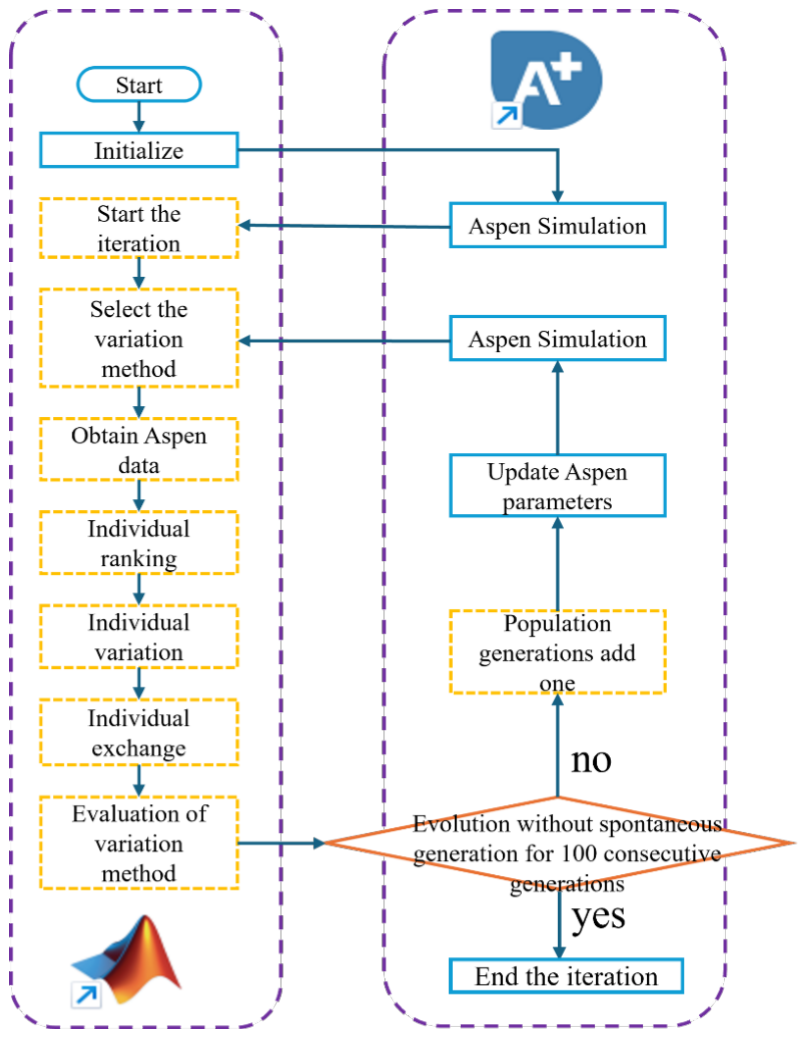
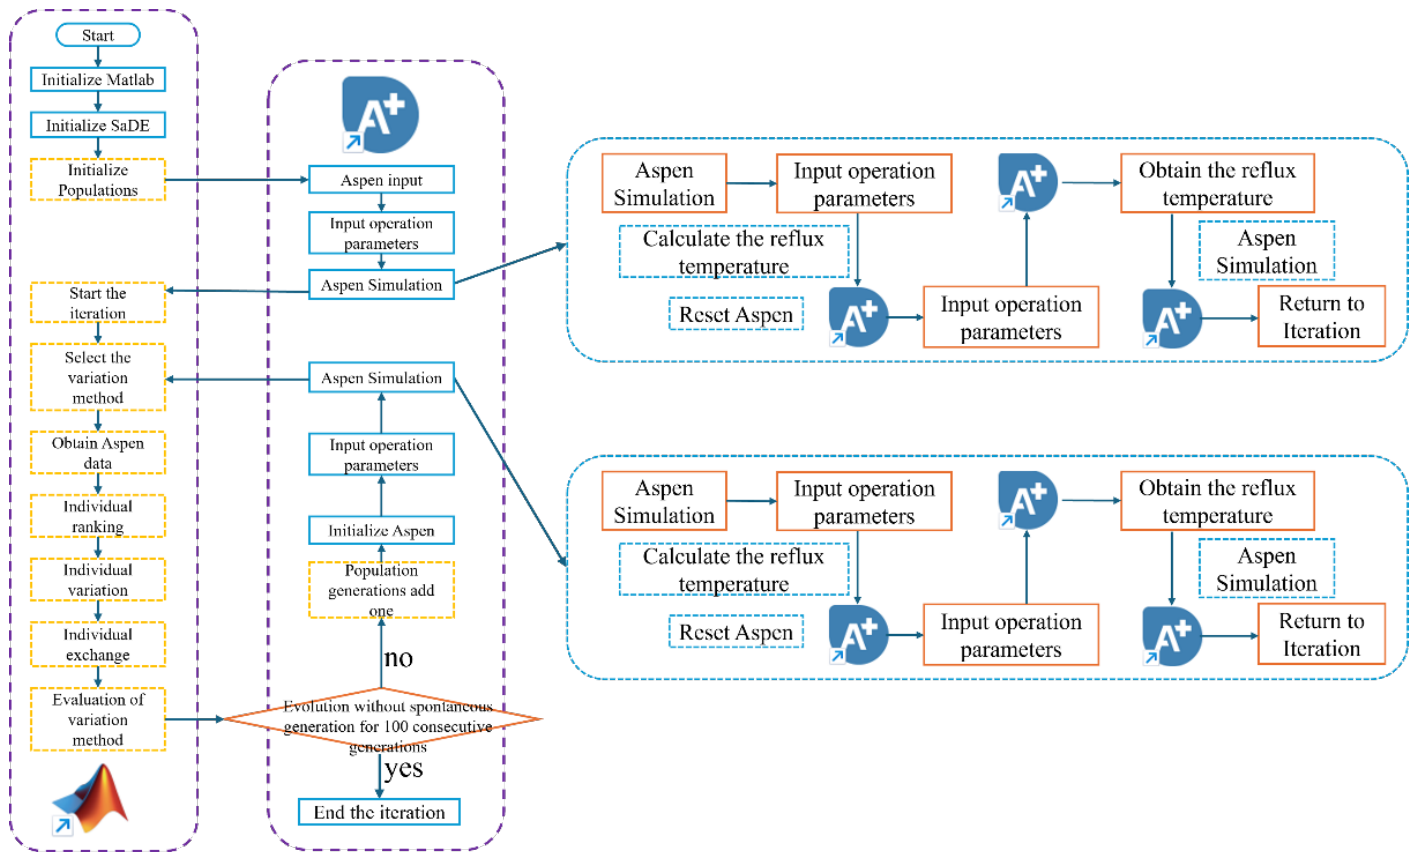
In this work, the SaDE algorithm was implemented in Matlab and coupled with Aspen Plus for rigorous simulation [38], establishing the Matlab-SaDE-Aspen Plus framework. Leveraging the powerful global search capability of the SaDE algorithm [39] and the data processing capability of Matlab, multiple parameters are simultaneously varied while employing the rigorous RADFRAC simulation module in Aspen Plus. This enables multiple rigorous simulations to be performed in a short time, with data extraction, iterative calculation, and verification to optimize the distillation system. The operational workflow of the finalized Matlab-SaDE-Aspen Plus framework is shown in Figure 5.
As shown in Figure 5, the process begins with Matlab initialization, clearing residual data and variables from previous runs. The SaDE algorithm parameters are then initialized, with four mutation strategies deployed for selection. The specific mutation strategies are shown in Equations (19)–(22). After generating the initial population based on the operable parameters of the specific distillation system, the individuals of the first generation are solved in Aspen Plus, and the resulting parameters are returned to Matlab for fitness evaluation. The iterative process then begins, with mutation strategies selected for mutation and crossover operations, followed by strategy evaluation. During the initial phase (i.e., the first LP generations of iteration), all strategies are selected with equal probability; in this study, LP is set to 50. The algorithm records the number of successes and failures of each strategy in generating offspring superior to the parent over the past LP generations and calculates the selection probability for each strategy. In each generation, each individual independently draws a strategy from the strategy pool according to the current probability distribution for mutation; strategy evaluation is not required for the first iteration.
  • Strategy 1:
v i G = x r 1 G + F ( x r 2 G x r 3 G )
  • Strategy 2:
v i G = x b e s t G + F ( x r 1 G x r 2 G ) + F ( x r 3 G x r 4 G )
  • Strategy 3:
v i G = x r 1 G + F ( x r 2 G x r 3 G ) + F ( x r 4 G x r 5 G )
  • Strategy 4:
v i G = x i G + F ( x b e s t G x i G ) + F ( x r 2 G x r 3 G ) + F ( x r 4 G x r 5 G )
where viG is the generated mutant individual; xiG is the i-th individual of generation G; xbestG is the best individual of generation G; xr1G through xr5G are mutually distinct individuals randomly selected from the current population; and F is the scaling factor.
When the deviation in the best individual’s fitness value between successive iterations is less than 0.001%, the individual is considered to have not evolved. If no individual evolves for 500 consecutive generations, the algorithm is deemed to have reached the global optimum. If the termination condition is not met, Aspen Plus is reinitialized to solve the individuals of the new generation. The iteration continues until the termination condition is satisfied.
It is noteworthy that during the early stages of distillation system optimization using the Matlab-SaDE-Aspen Plus framework, Aspen Plus does not converge for every calculation. In this phase, the returned fitness value is the convergence error, and the optimization proceeds in the direction of reducing the convergence error. Once the convergence error becomes sufficiently small, Aspen Plus achieves convergence. During the later stages of optimization, Aspen Plus converges for nearly every run, and the returned fitness value is the TAC, with optimization proceeding in the direction of TAC minimization.

3.3. LDWC Optimization Strategy

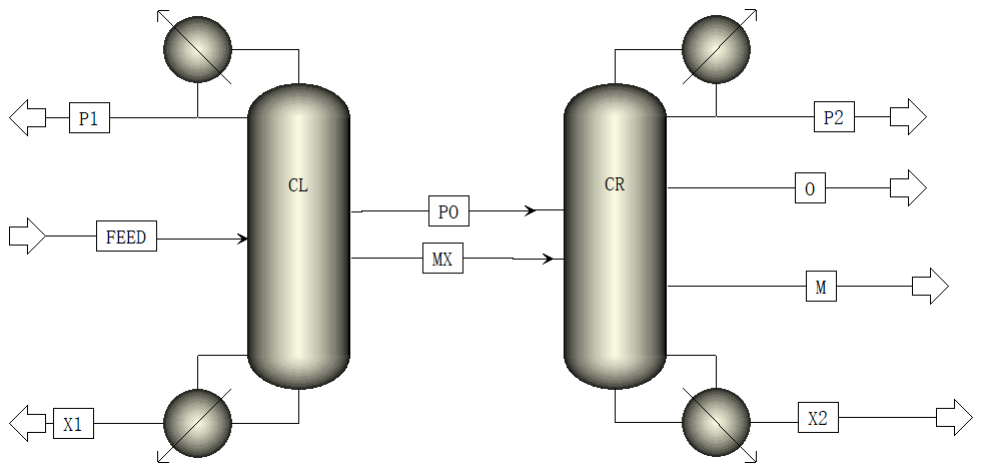
Since no built-in LDWC module exists in Aspen Plus, it is necessary to construct an equivalent model. When heat transfer across the vertical continuous partition wall is neglected, the LDWC equivalent model shown in Figure 6 can be constructed using RadFrac modules in Aspen Plus.
The four-component LDWC equivalent system was first established in Aspen Plus using RADFRAC modules, as shown in Figure 6. The feed conditions were then specified: a feed flow rate of 3600 kmol/h with equimolar P, O, M, and X (molar ratio 1:1:1:1), at a temperature and pressure of 60 °C and 5 kPa. Total condensers and kettle-type reboilers were used throughout. In the CL section, design specifications in RADFRAC were employed to fix the P and X mole fractions at 99% in the P1 and X1 product streams, with the reflux ratio and distillate flow rate as manipulated variables, ranging from 0.1 to 20 and 300 to 600 kmol/h, respectively. In the CR section, design specifications were similarly employed to achieve 99% mole fractions of P and X in the P2 and X2 product streams, with the same variable ranges. Global design specifications were added to ensure that the sum of P and O mole fractions in the PO stream equals 0.99, with the PO withdrawal flow rate as the manipulated variable (range: 900–1500 kmol/h), and that the sum of M and X mole fractions in the MX stream equals 0.99, with the MX withdrawal flow rate as the manipulated variable (range: 900–1500 kmol/h), thereby ensuring the thermodynamic conditions of the four-component LDWC. The number of theoretical stages, feed locations, sidestream withdrawal positions, reflux ratios, distillate flow rates, and sidestream product flow rates for both CL and CR are specified by the Matlab-SaDE-Aspen Plus framework and simultaneously varied in each iteration, achieving multi-parameter simultaneous optimization.

3.4. LDWC Process Intensification Strategy

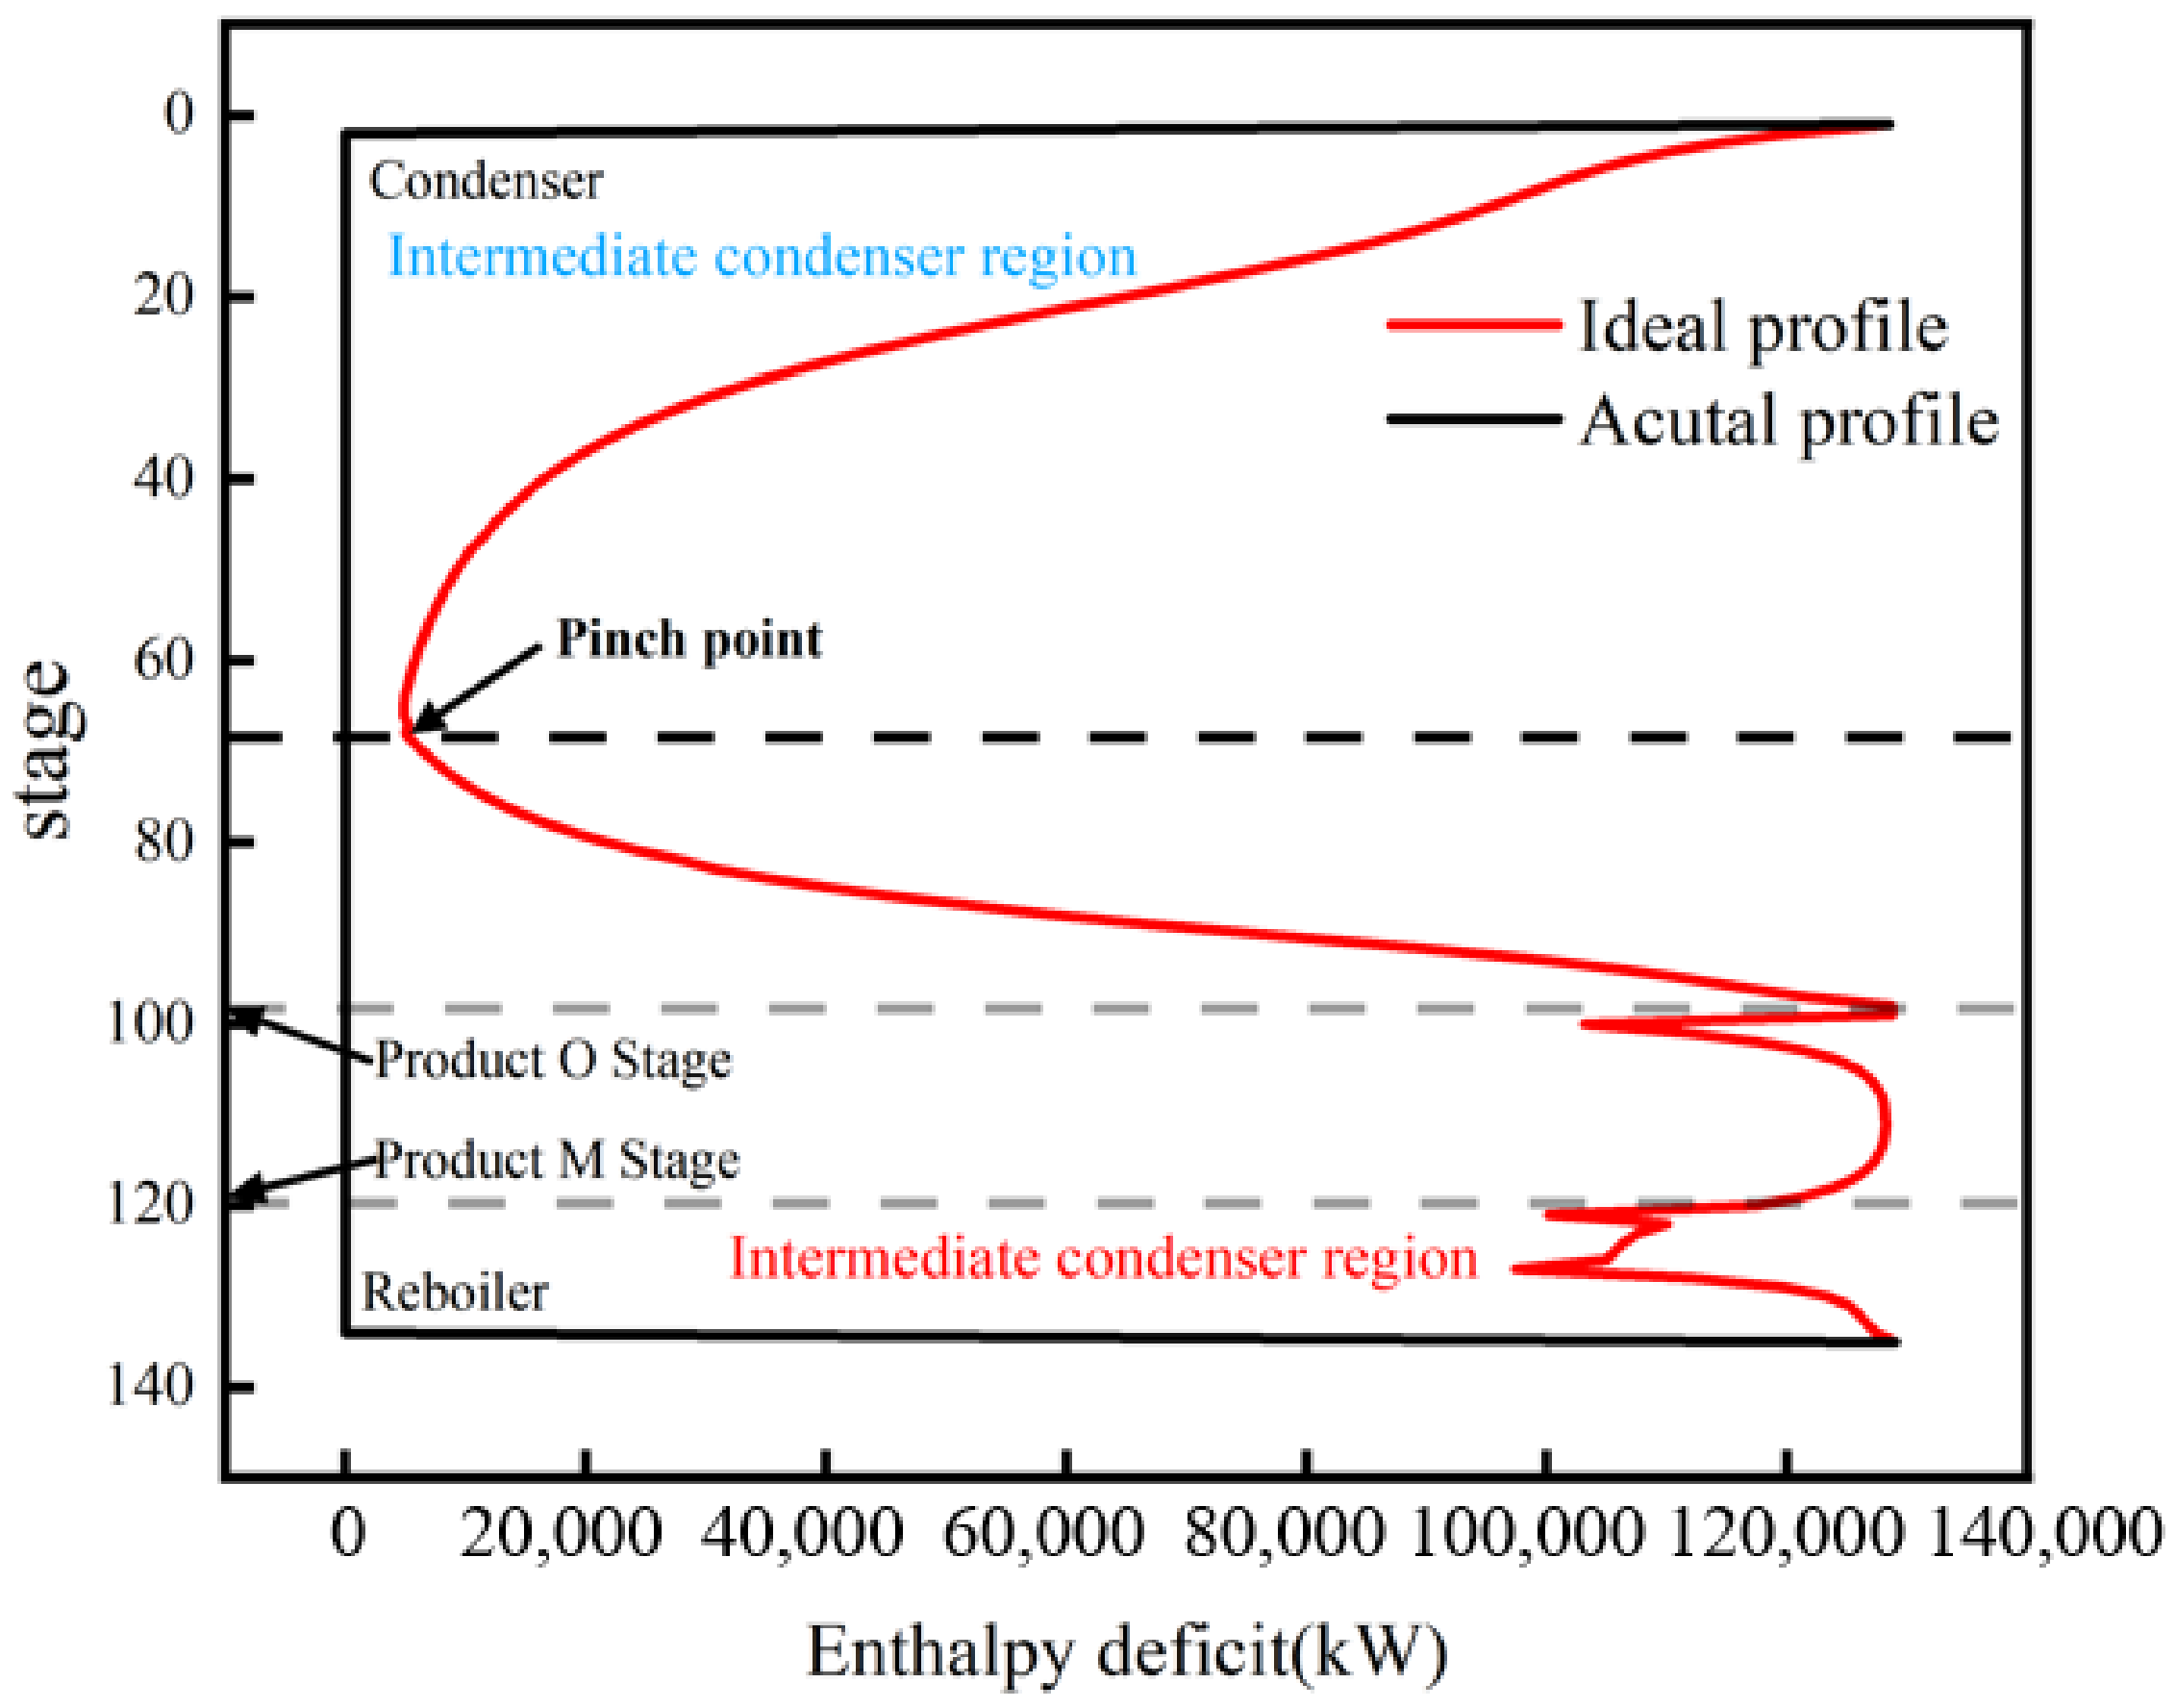
For the optimized LDWC system, process intensification measures can be applied to further reduce energy consumption. Common distillation process intensification technologies include VRC and intermediate reboilers (IR). For VRC technology, the core principle involves compressing the low-temperature overhead vapor to raise its temperature and provide heat to the bottom reboiler; the economic feasibility depends on the temperature difference between the column top and bottom. In the four-component POMX system studied herein, the CR column top temperature of the LDWC is approximately 108.57 °C and the bottom temperature approximately 146.49 °C, yielding a temperature difference of 37.92 °C. This temperature driving force is insufficient for conventional VRC technology to be economically viable. When the top-to-bottom temperature difference exceeds 36 °C, the required compression ratio for VRC becomes excessively high, and the compressor investment and electricity consumption exceed the saved steam costs [40]. Therefore, VRC technology is not applicable to this system, and alternative process intensification approaches must be sought. The CGCC [41] obtained from the analysis module in Aspen Plus accounts for irreversible exergy losses caused by feed location, backmixing, and tray pressure drops, and is of significant importance in distillation analysis. The CGCC diagram comprises a temperature-enthalpy (T-H) diagram and a stage-enthalpy (S-H) diagram, both exhibiting the same trends. The S-H diagram is used as an example for analysis in this chapter. The S-H diagram consists of ideal and actual enthalpy values, and through the pinch point, it can be divided into the intermediate reboiling zone and the intermediate condensing zone [42].
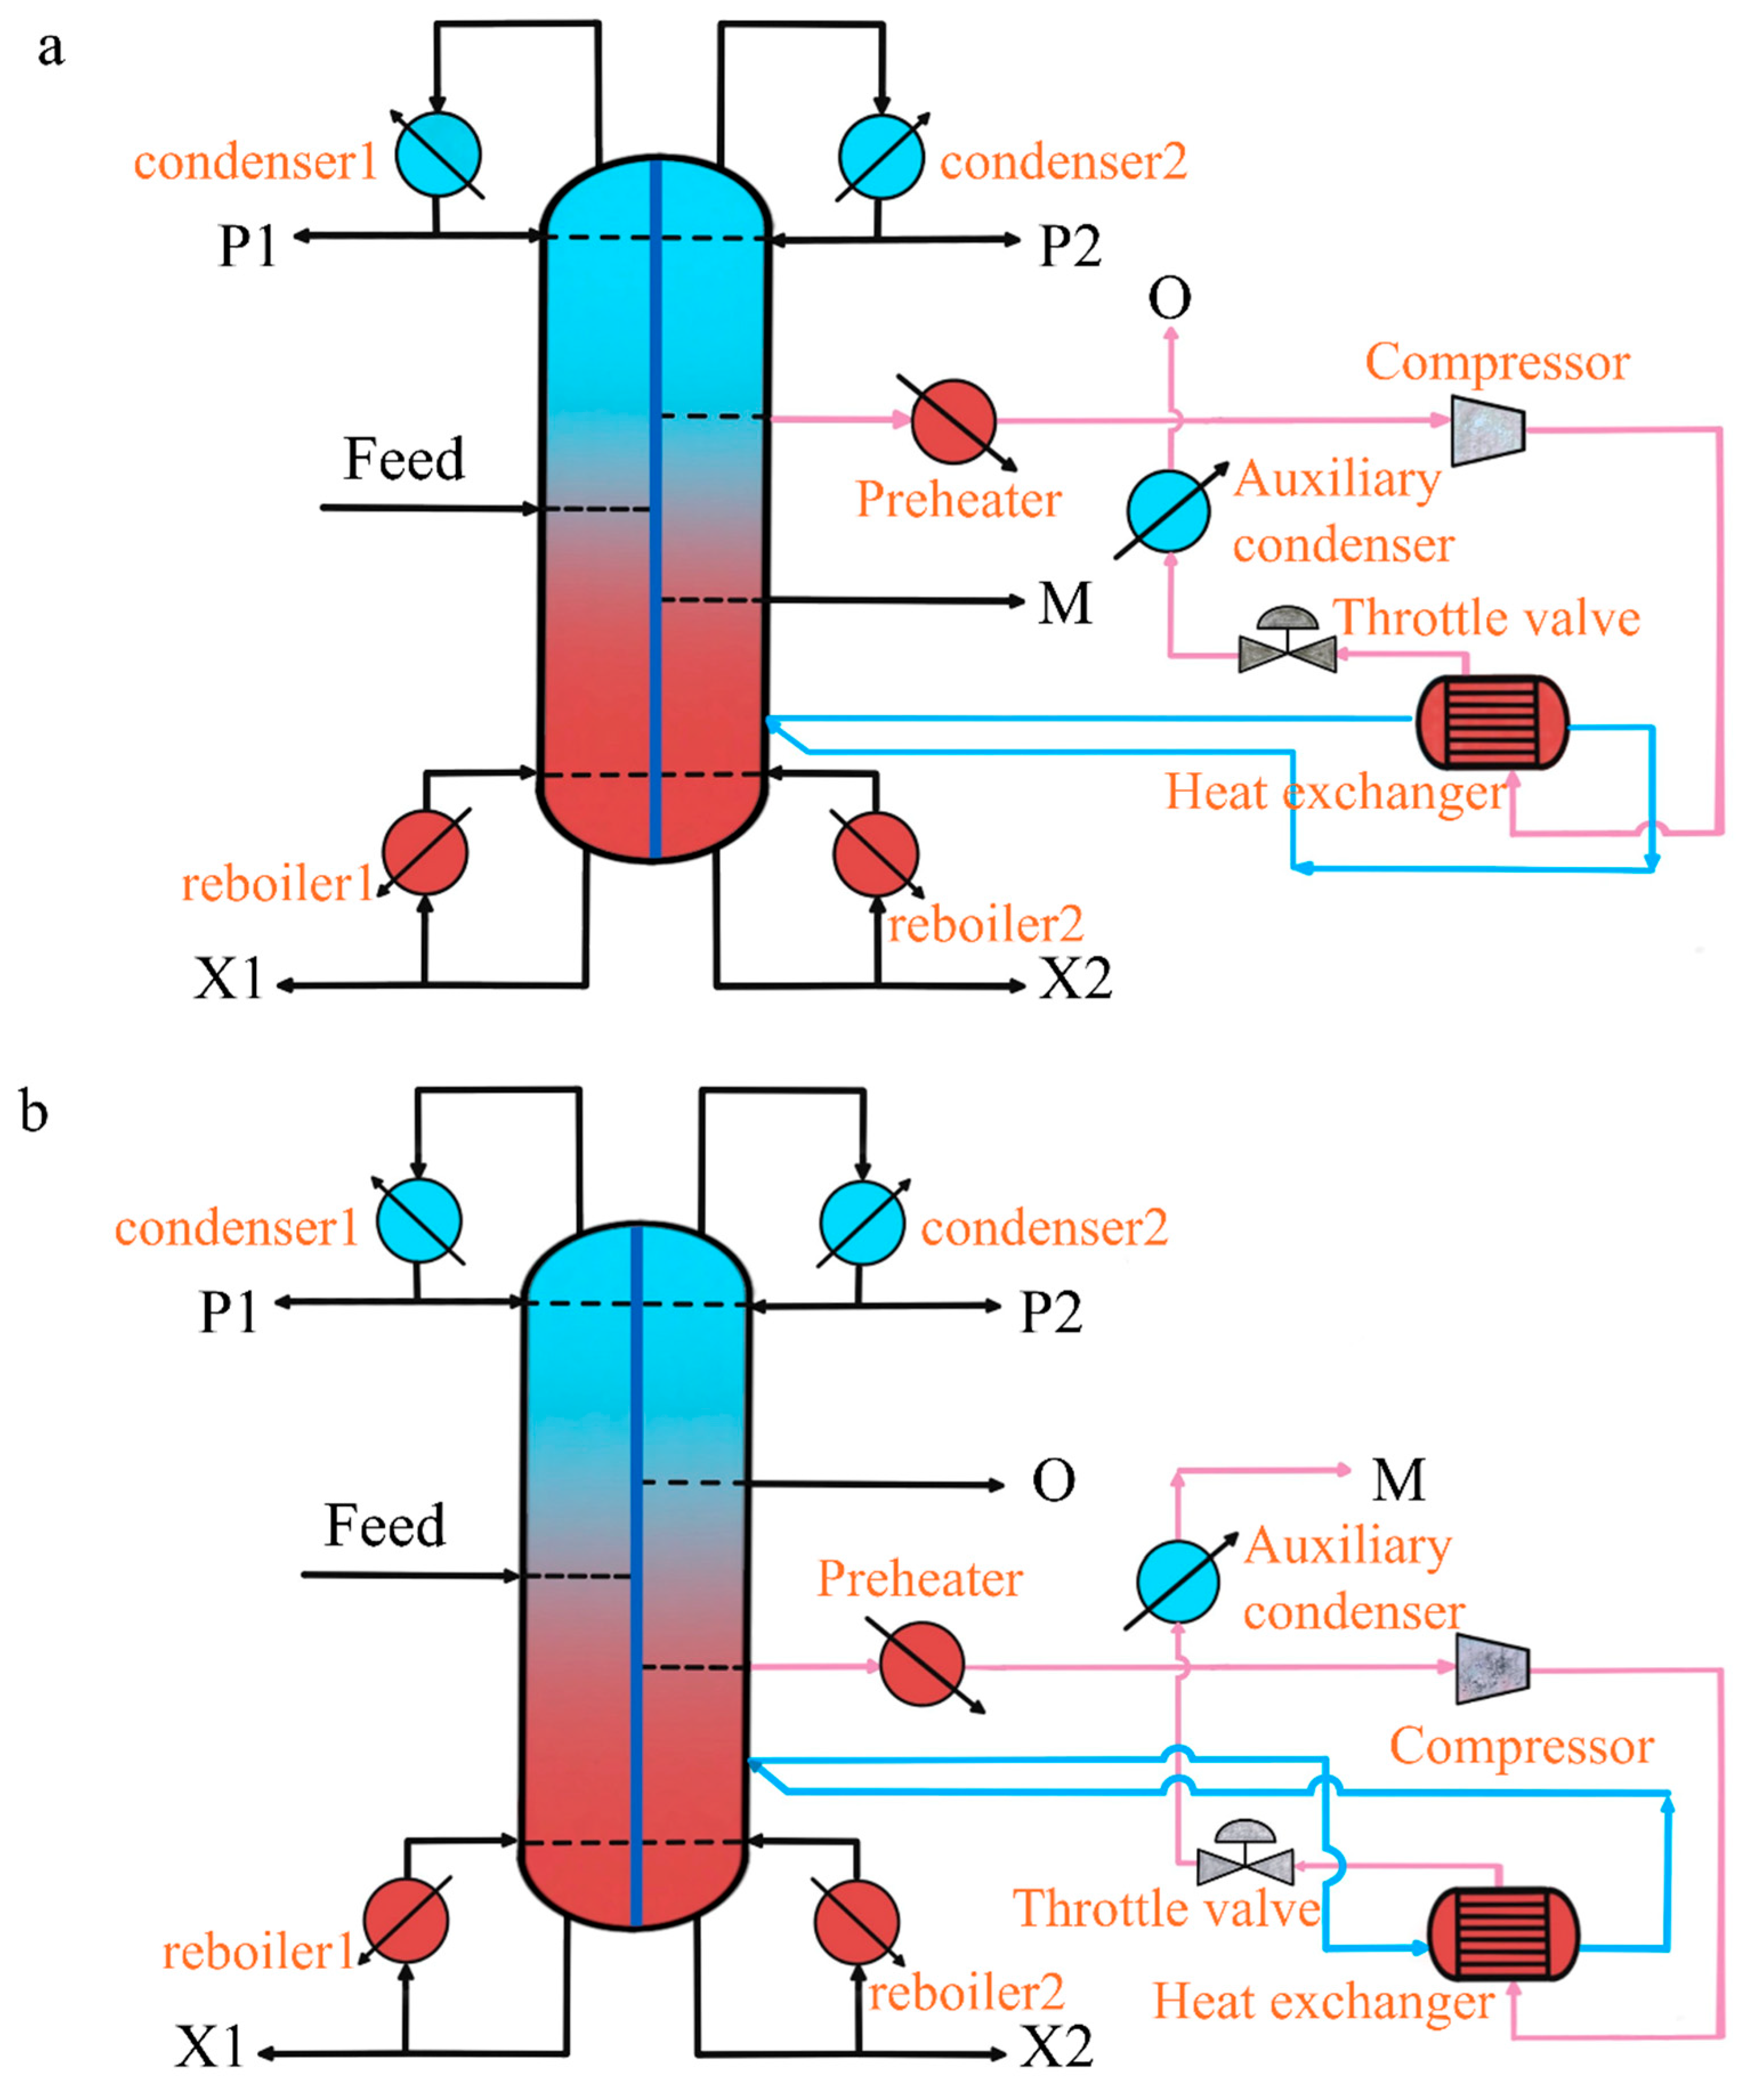
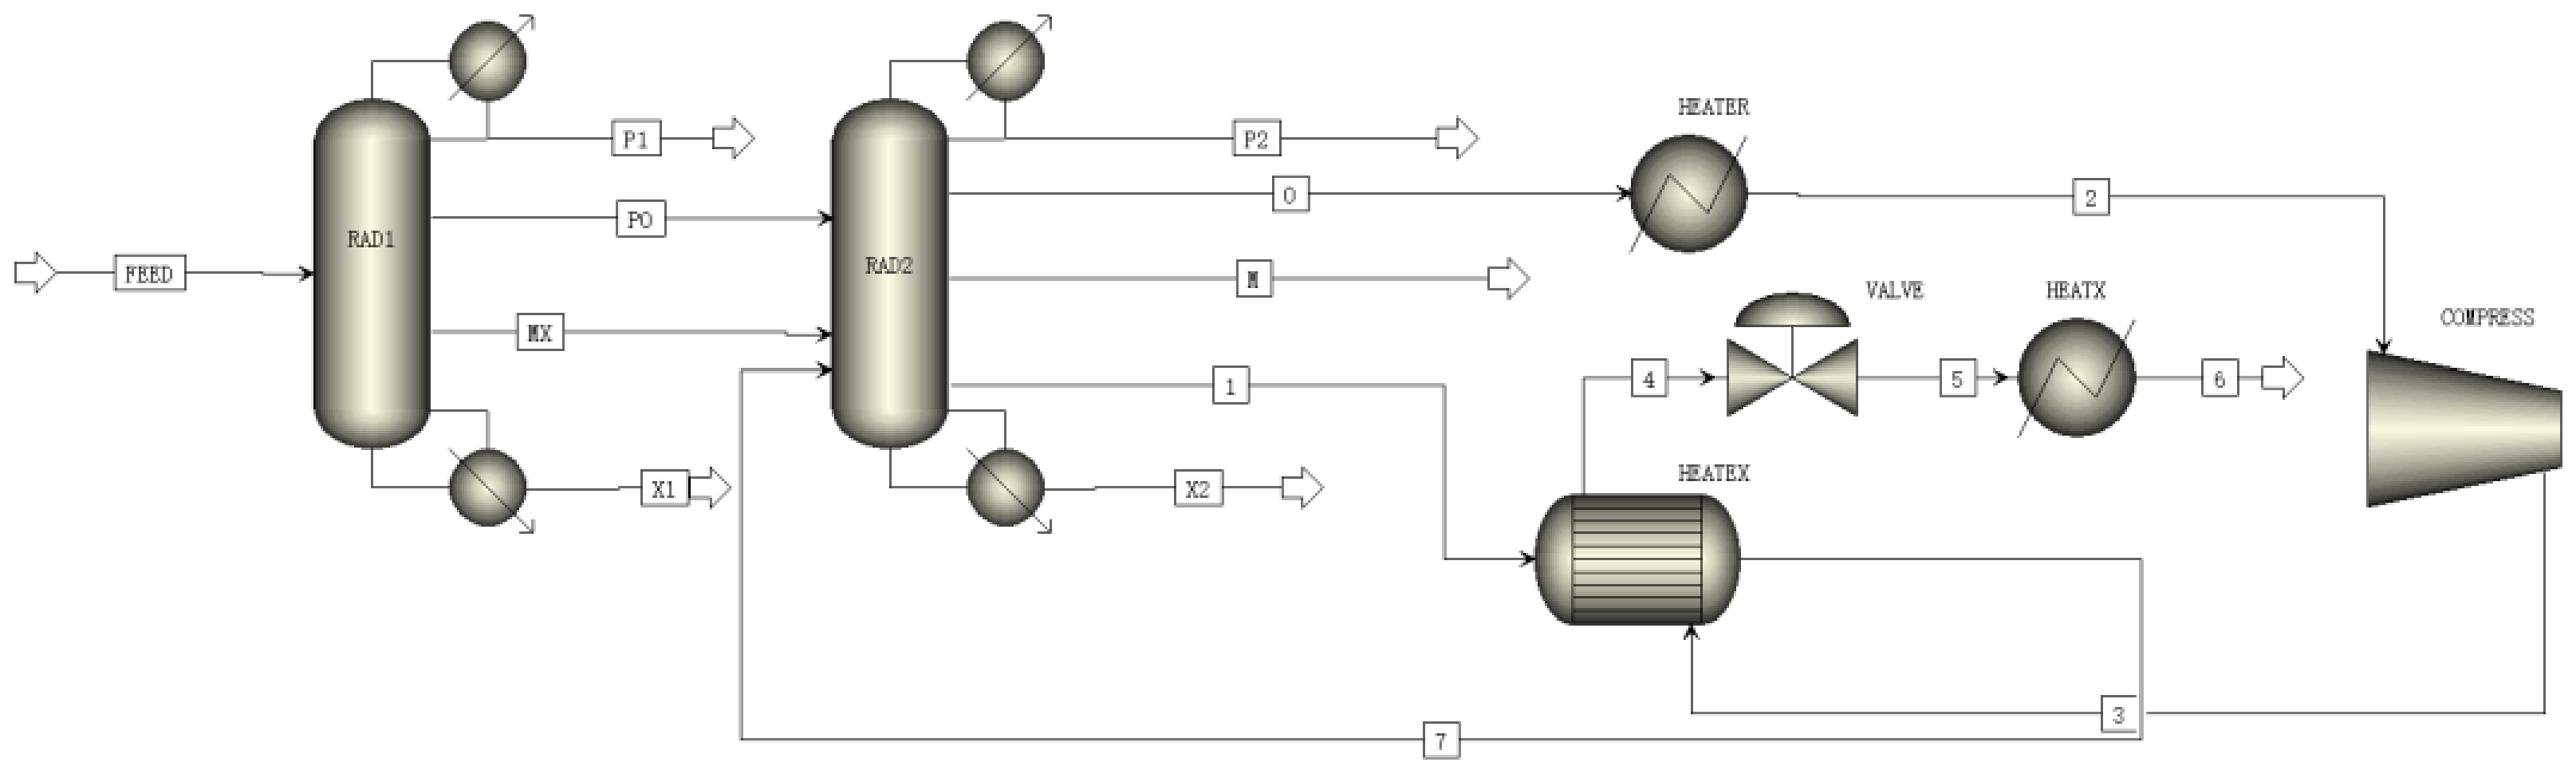
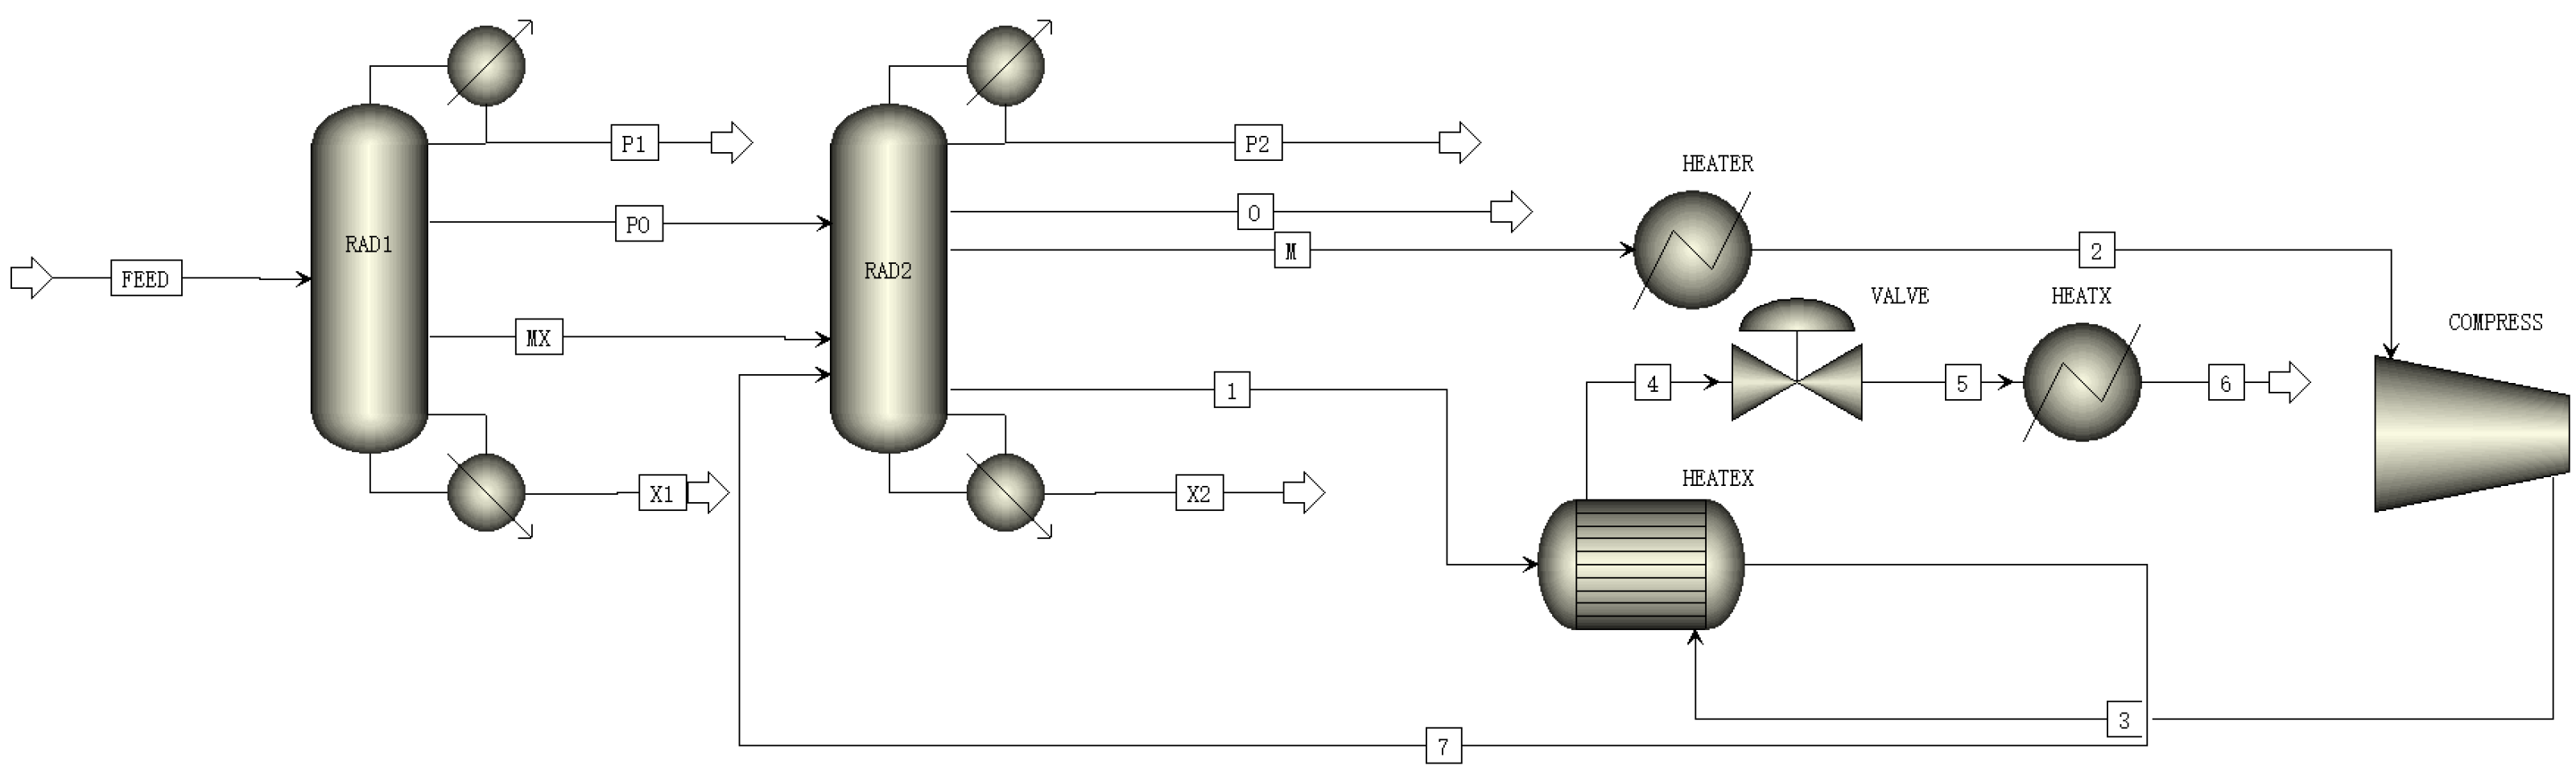
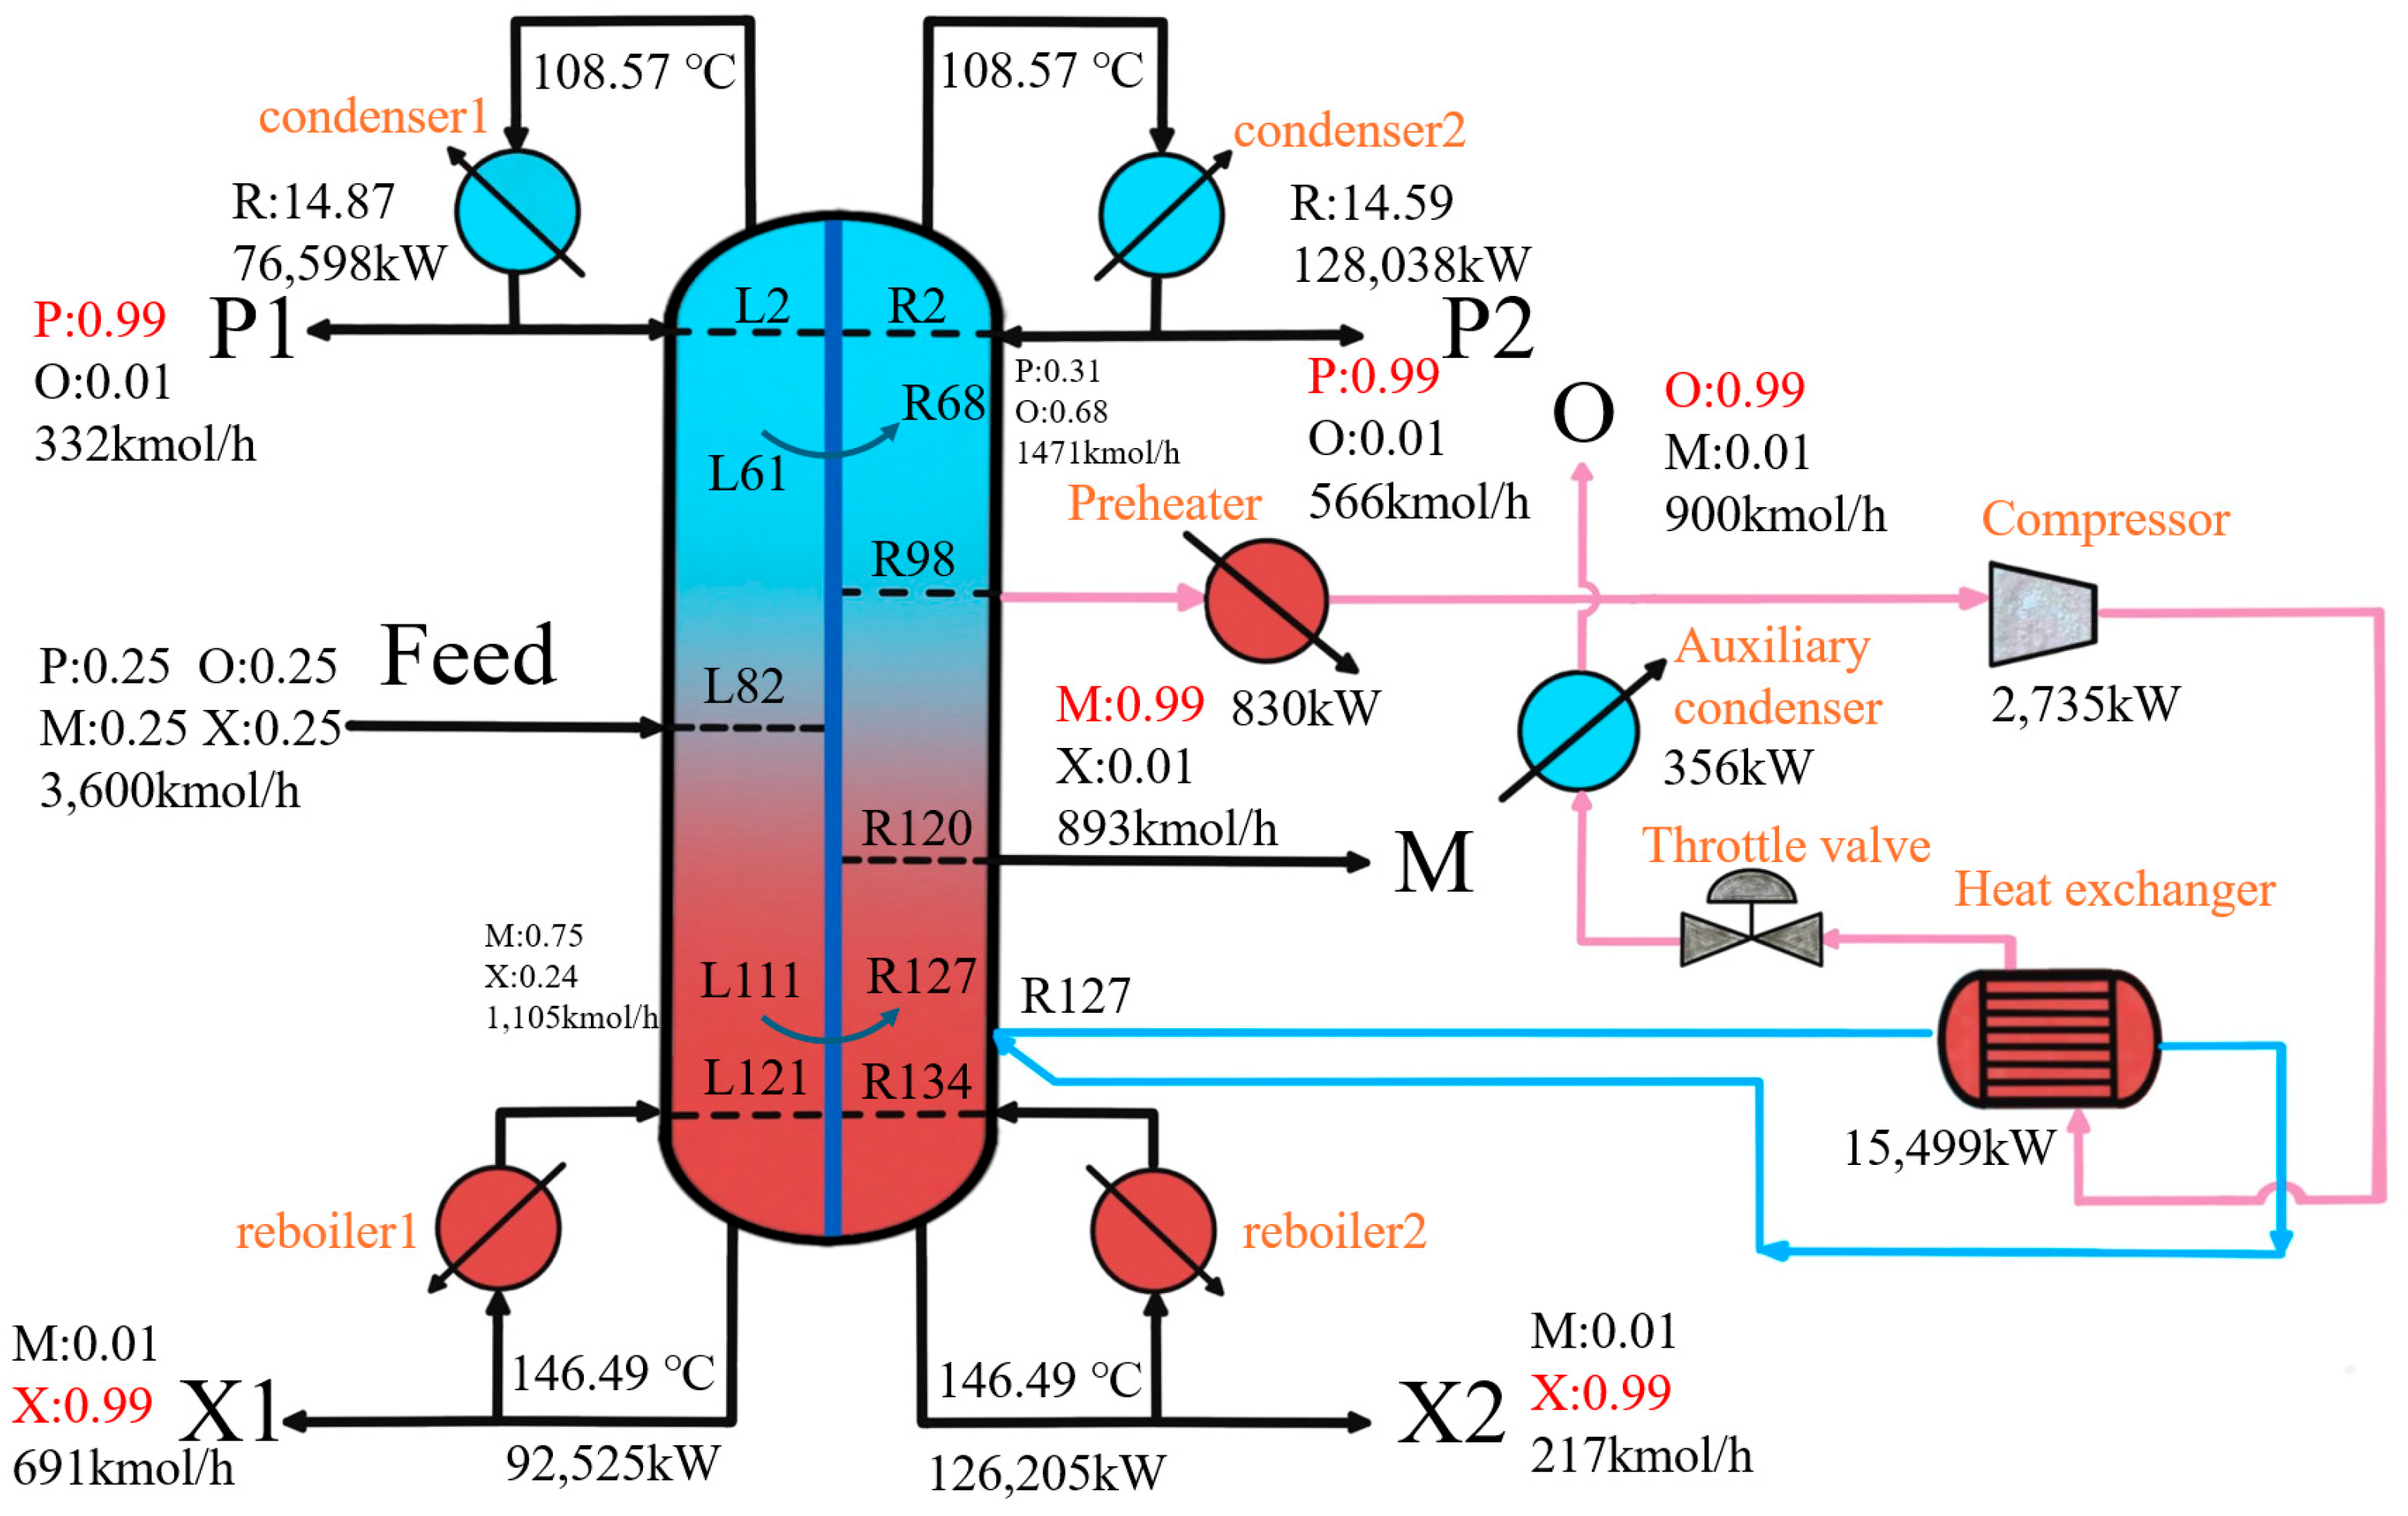
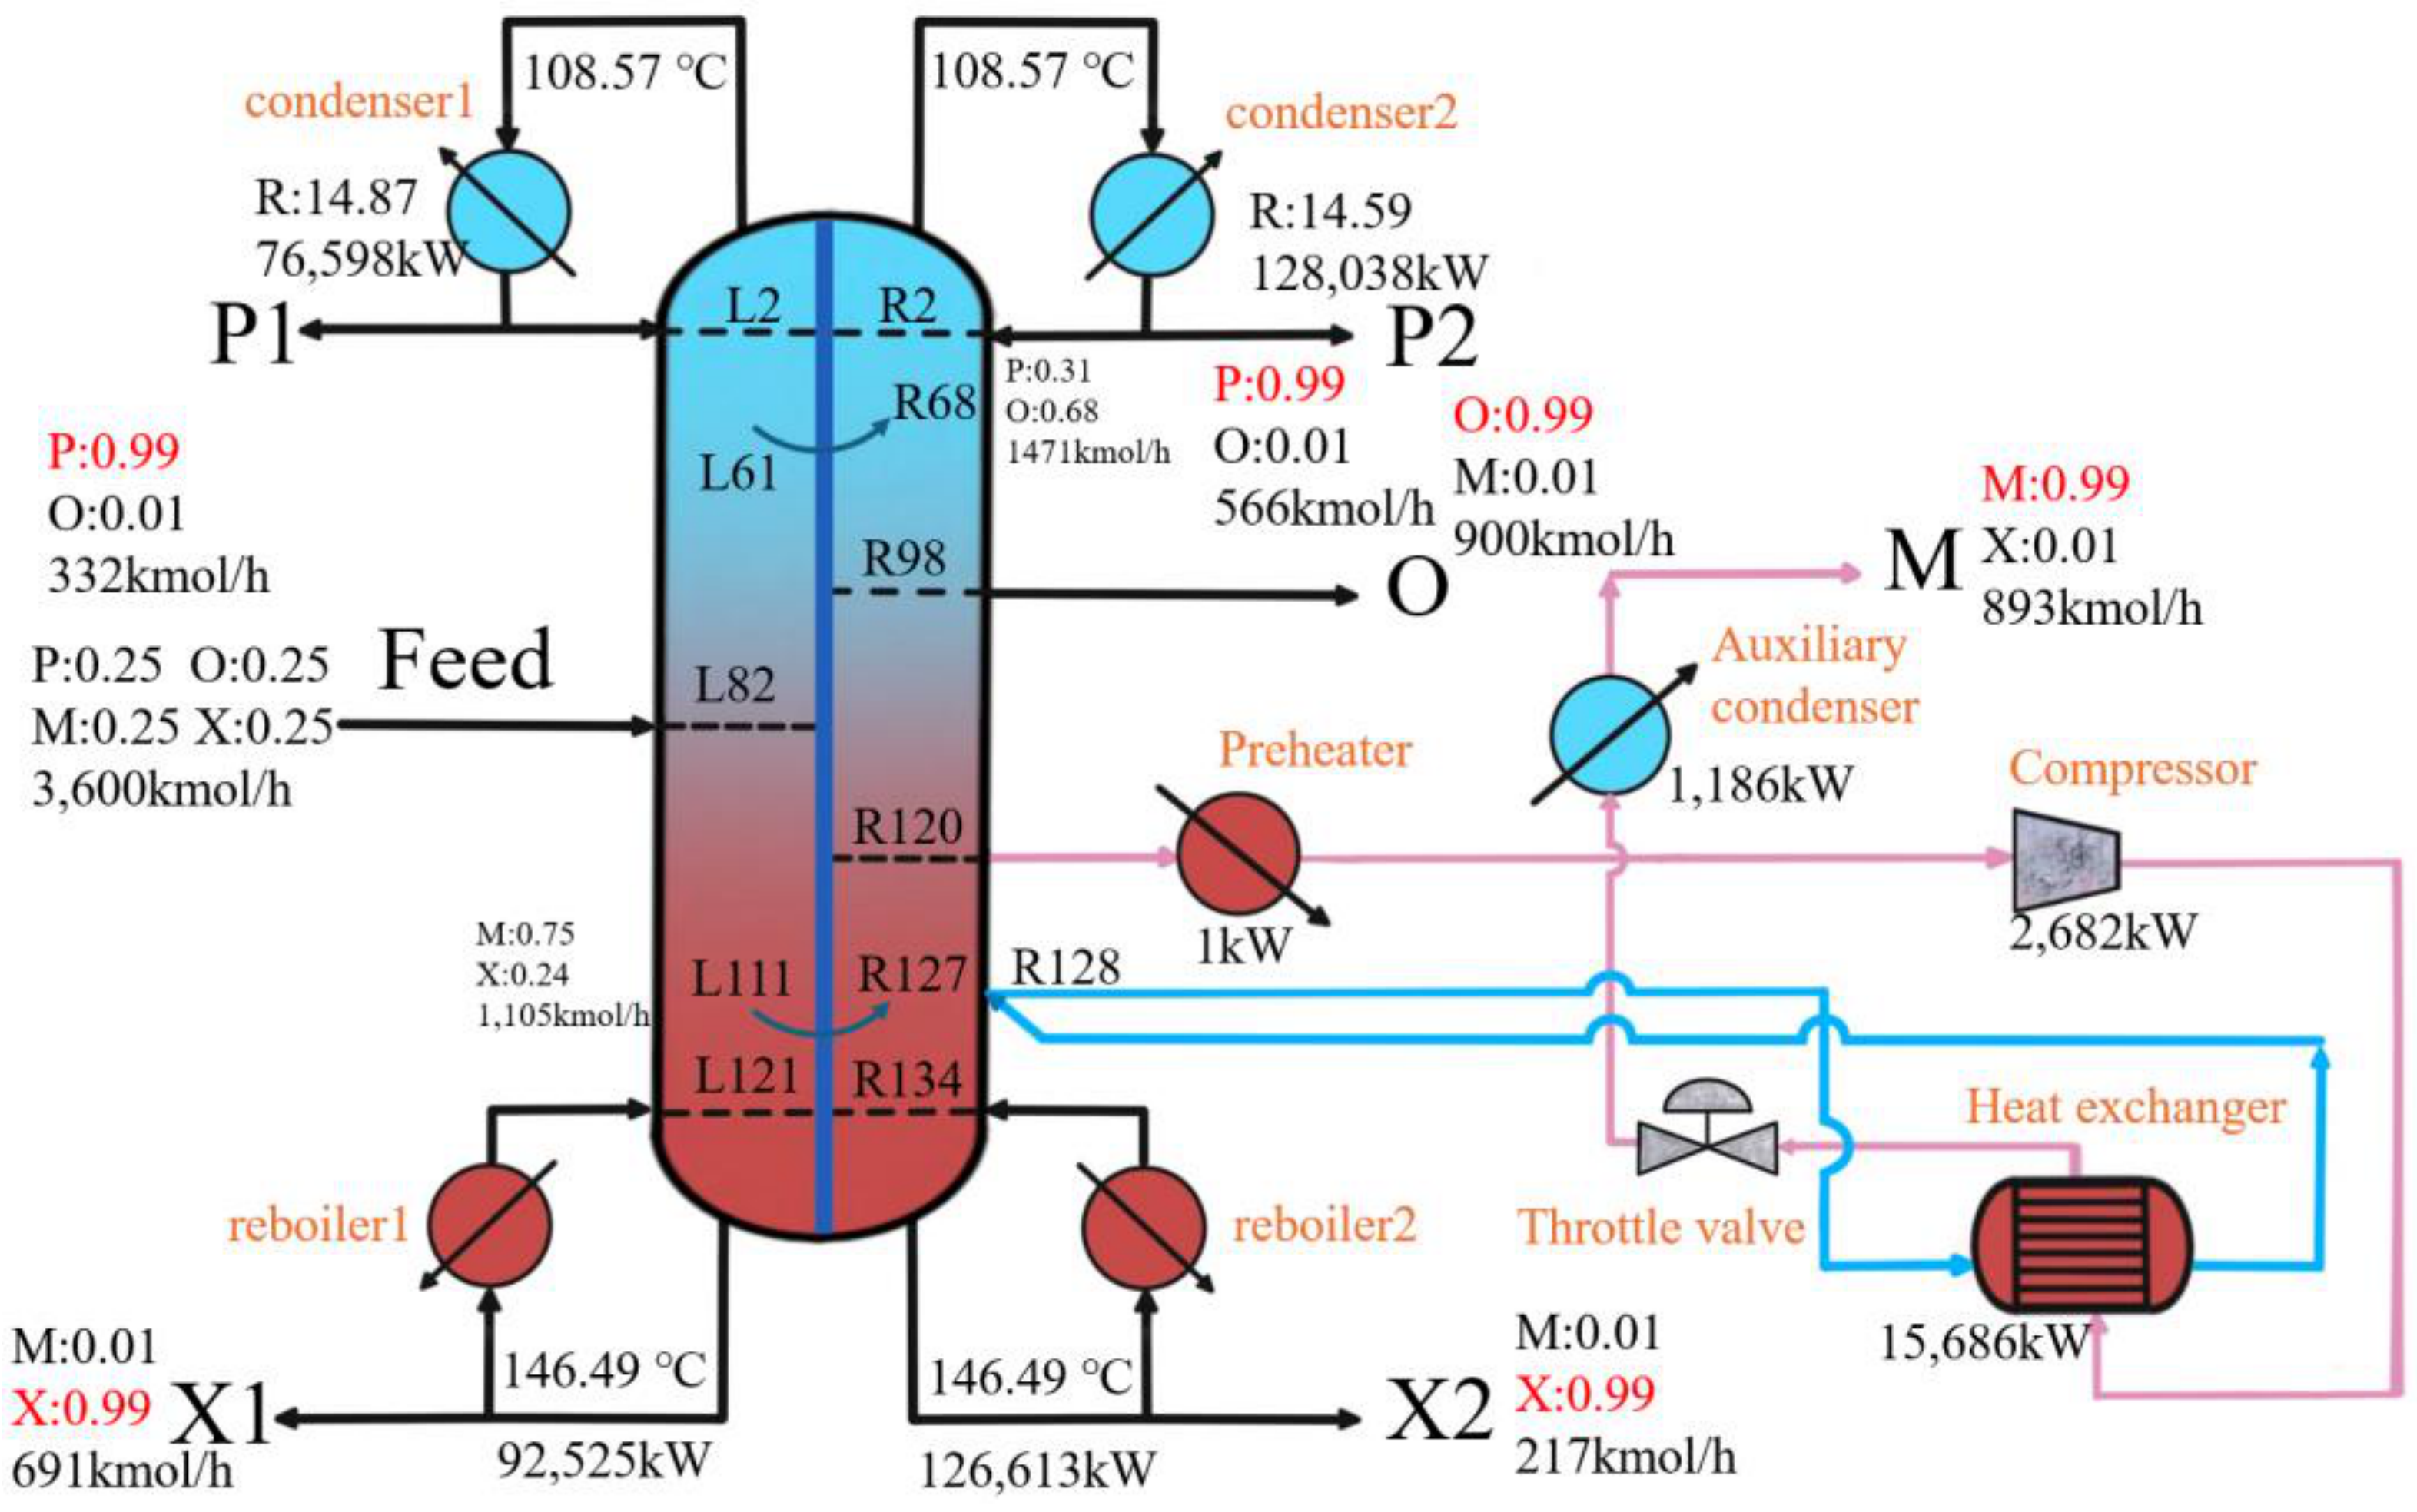
The S-H diagram of the LDWC is shown in Figure 7. Since both sidestream products are located in the intermediate reboiling zone, each sidestream product can be withdrawn as a vapor phase, thereby allowing the addition of an intermediate reboiler, as shown in Figure 8. When the upper sidestream is withdrawn as vapor, the resulting IR-LDWC is designated IR-LDWC1, as shown in Figure 8a. The vapor sidestream must be preheated after withdrawal to prevent liquid droplet formation during compression, which could damage the compressor. The polytropic and mechanical efficiencies of the compressor are assumed to be 0.8 and 0.95, respectively [43]. The high-temperature vapor produced after compression provides heat to the intermediate reboiler, vaporizing the liquid withdrawn from the column bottom and returning it to the column, thereby further reducing the reboiler heat duty. The steam exiting the heat exchanger is depressurized through a throttling valve, subsequently condensed in an auxiliary condenser, and withdrawn as the sidestream product. When the lower sidestream is withdrawn as vapor, the resulting configuration is designated IR-LDWC2, as shown in Figure 8b. The primary difference between IR-LDWC2 and IR-LDWC1 lies in the sidestream position serving as the vapor withdrawal; other operations are similar.
The preheating temperature, compression ratio, sidestream liquid withdrawal flow rate, and sidestream withdrawal position all have significant effects on the total energy consumption and equipment investment of the IR-LDWC system. To comprehensively evaluate system performance, these operating parameters must be simultaneously optimized. Similarly, with TAC as the objective, the Matlab-SaDE-Aspen Plus framework constructed in Section 3.2 was used to optimize the four operating parameters. The specific optimization workflow is shown in Figure 9, where a reset calculation for the IR system was incorporated into the existing Matlab-SaDE-Aspen Plus framework to reduce the number of non-convergent Aspen Plus runs. Additionally, since the intermediate reboiler system has relatively low complexity and high Aspen Plus simulation convergence rates, optimization can be completed within a small number of population generations; therefore, the termination condition was set to 100 consecutive generations without individual evolution.
Based on the rigorous simulation data of the LDWC system, the operating parameter ranges were determined, and the IR-LDWC1 process was constructed as shown in Figure 10. The sidestream product undergoing heat exchange is the O stream, with a preheating temperature range of 120–220 °C, compression ratio of 2–10, sidestream withdrawal flow rate of 600–1000 kmol/h, and sidestream withdrawal position of stages 99–130. Once the operating parameter ranges are established, the optimization is carried out automatically in Matlab following the workflow in Figure 9.
IR-LDWC2 employs the same optimization strategy, with the difference being that the sidestream product undergoing heat exchange is the M stream, and the sidestream withdrawal position ranges from stages 121 to 130. Figure 11 shows the IR-LDWC2 process.

4. Simulation Results and Discussion

4.1. CDS Baseline Optimization Results

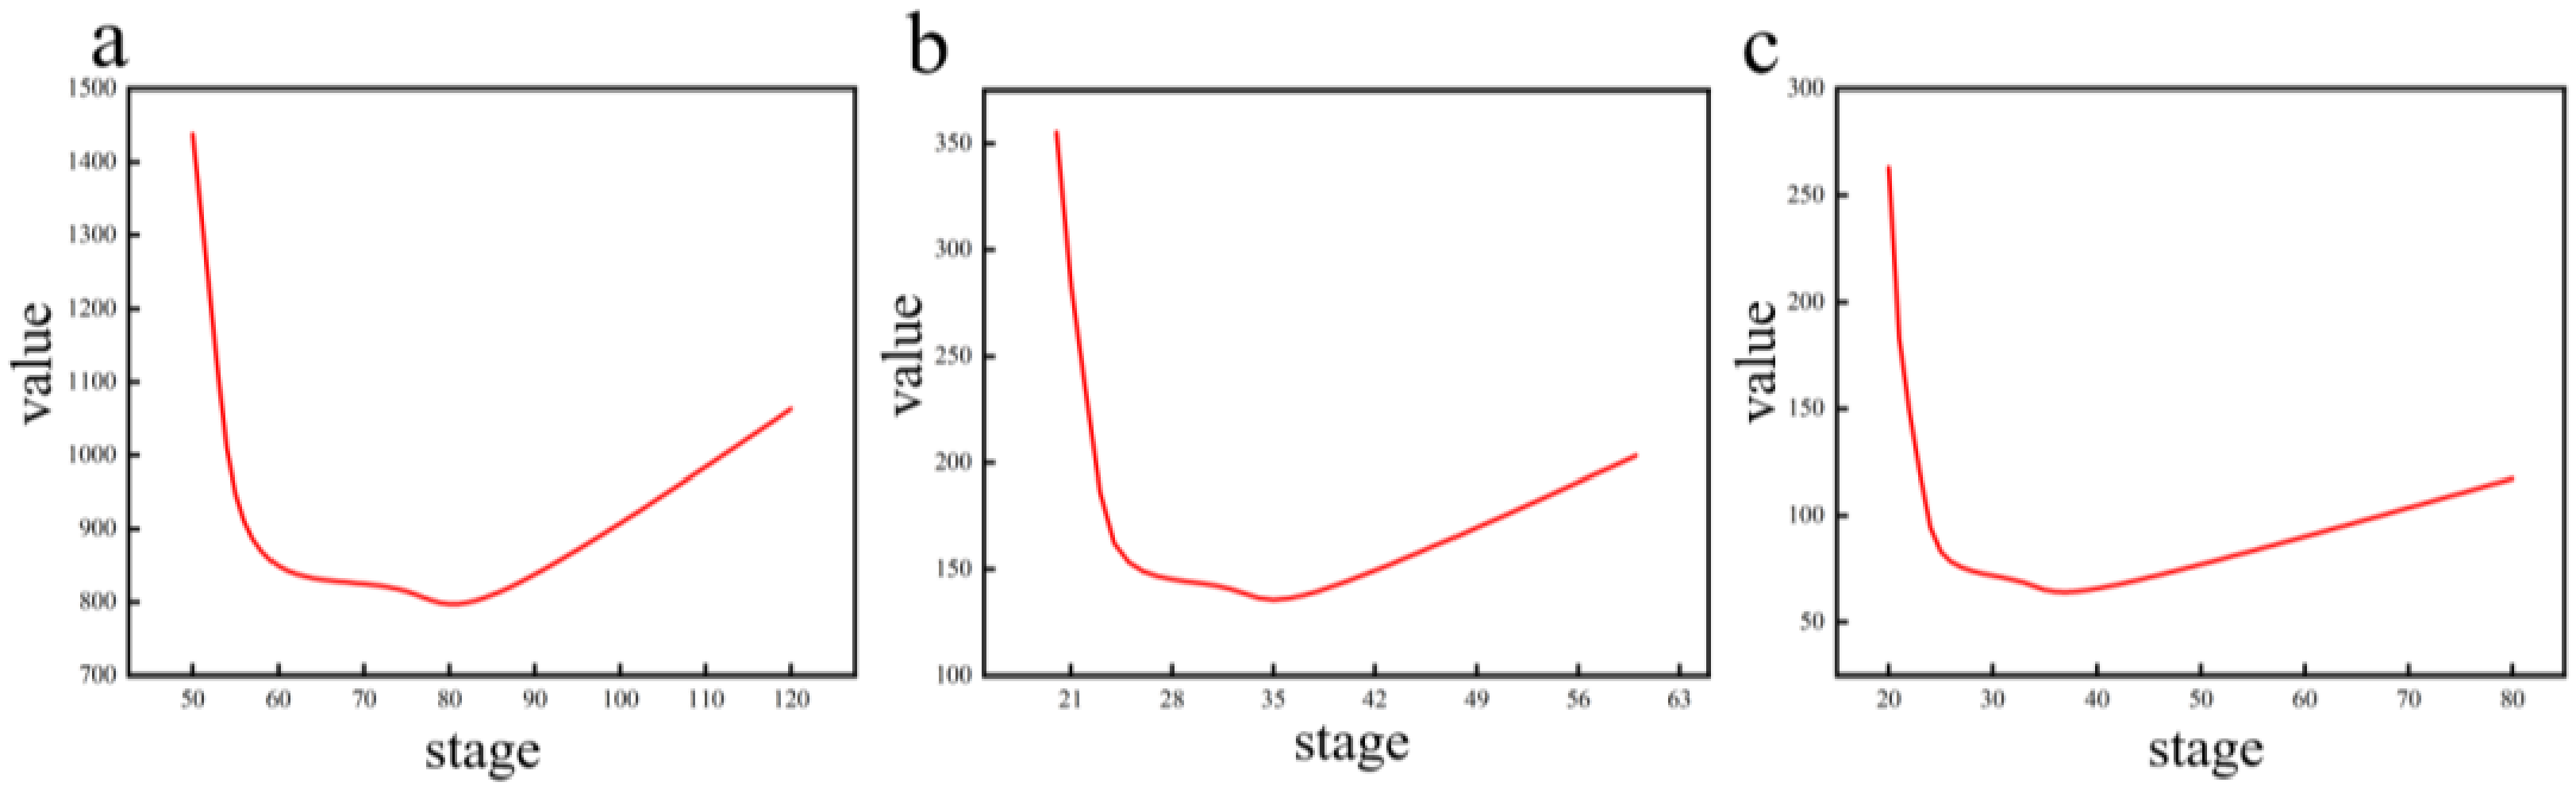
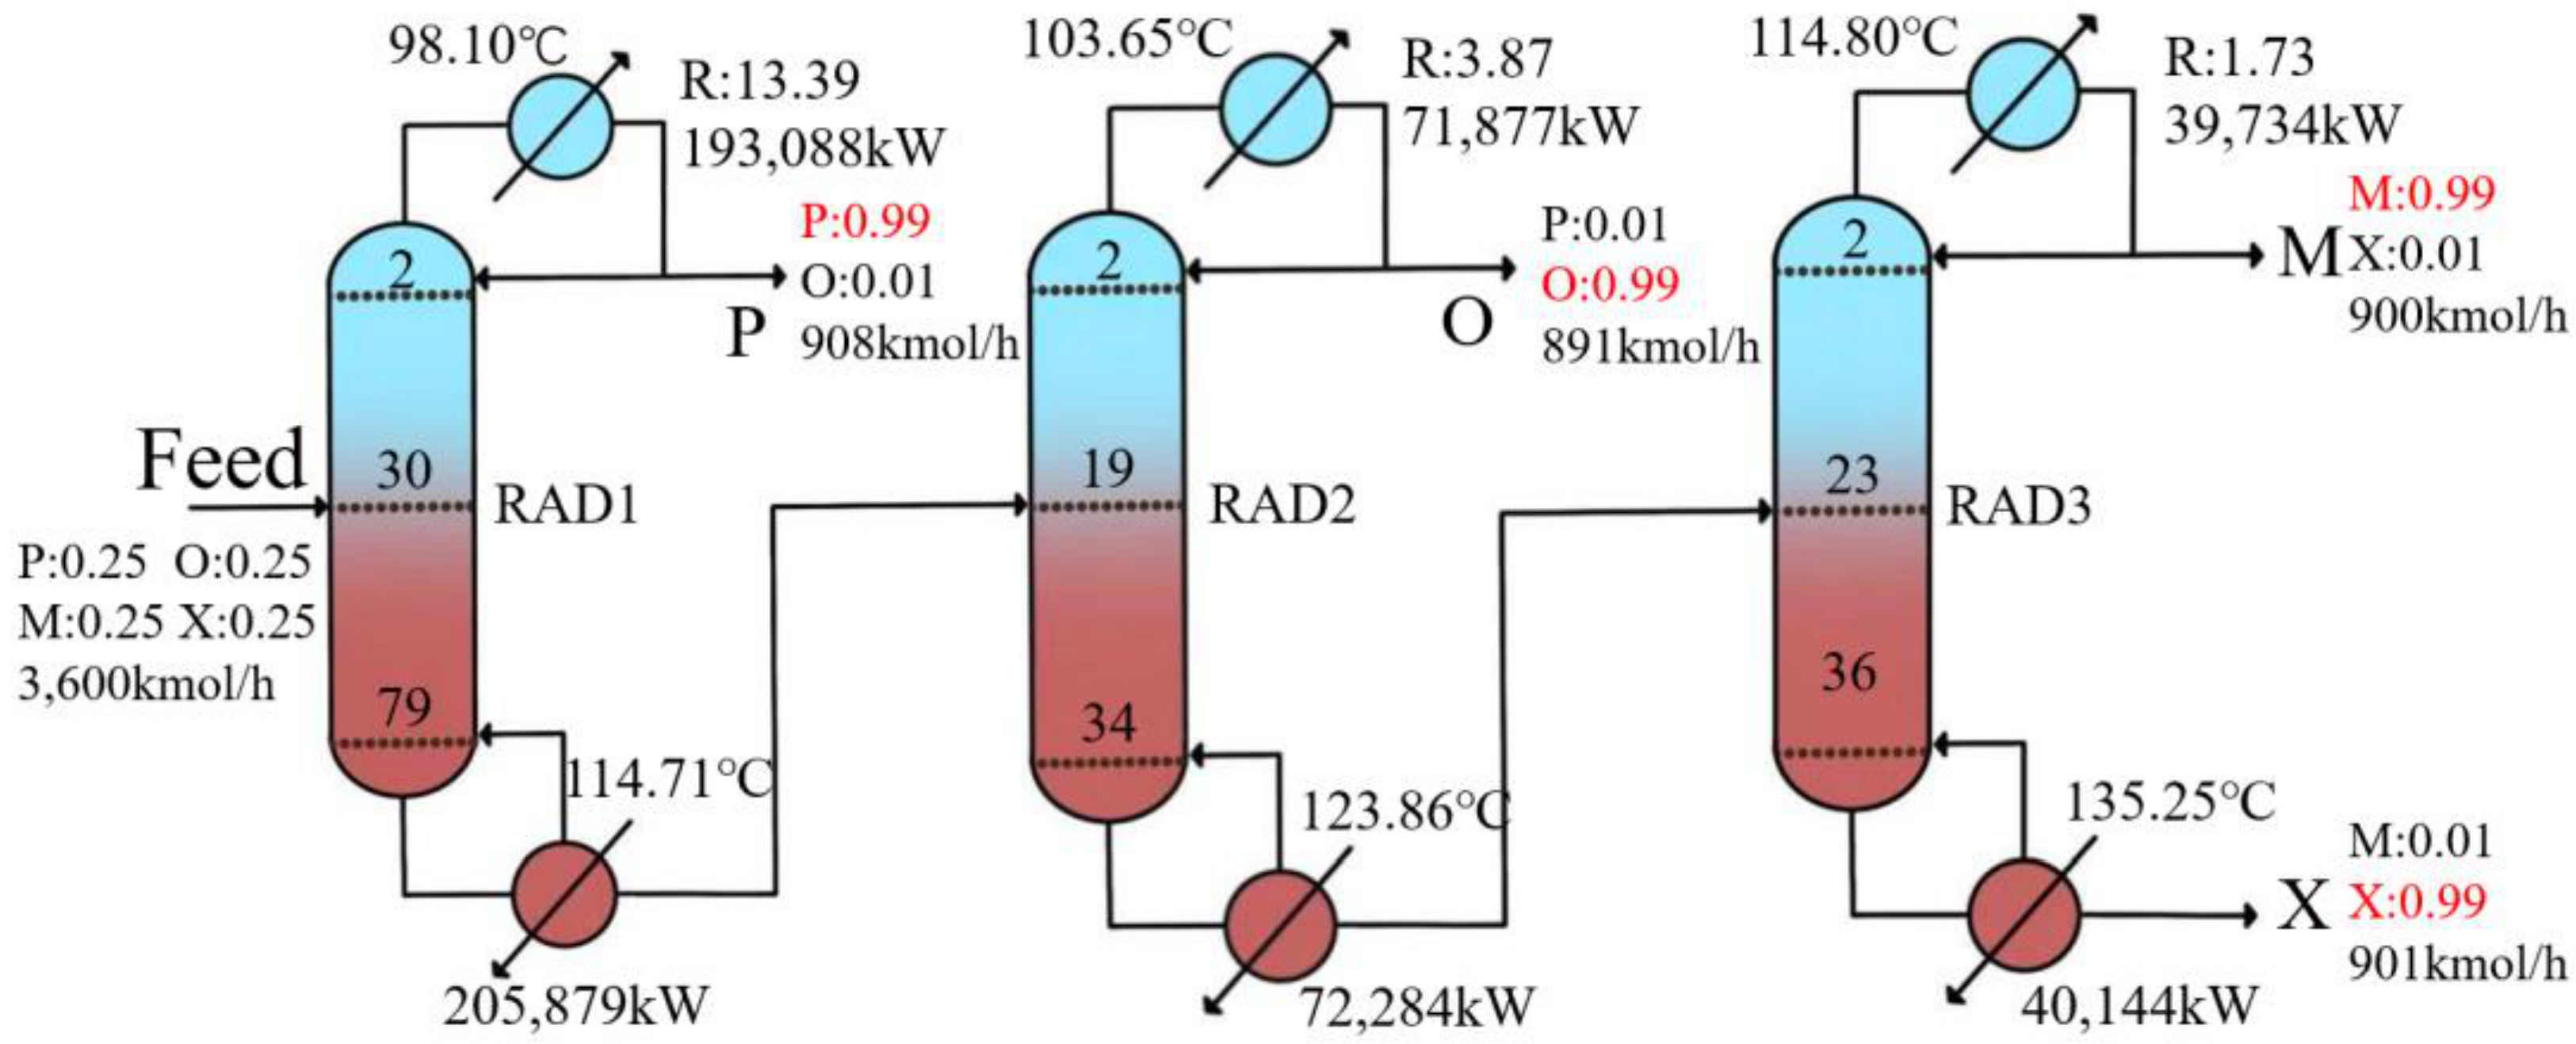
For the separation simulation of the quaternary mixture, the conventional three-column separation process requires shortcut calculations using the Winn–Underwood–Gilliland equations built into the DSTWU module of Aspen Plus, yielding the theoretical stages versus reflux ratio relationship shown in Figure 12. According to the study by Sun et al. [34], the point at which the product of theoretical stages and reflux ratio is minimized corresponds to the optimal number of theoretical stages.
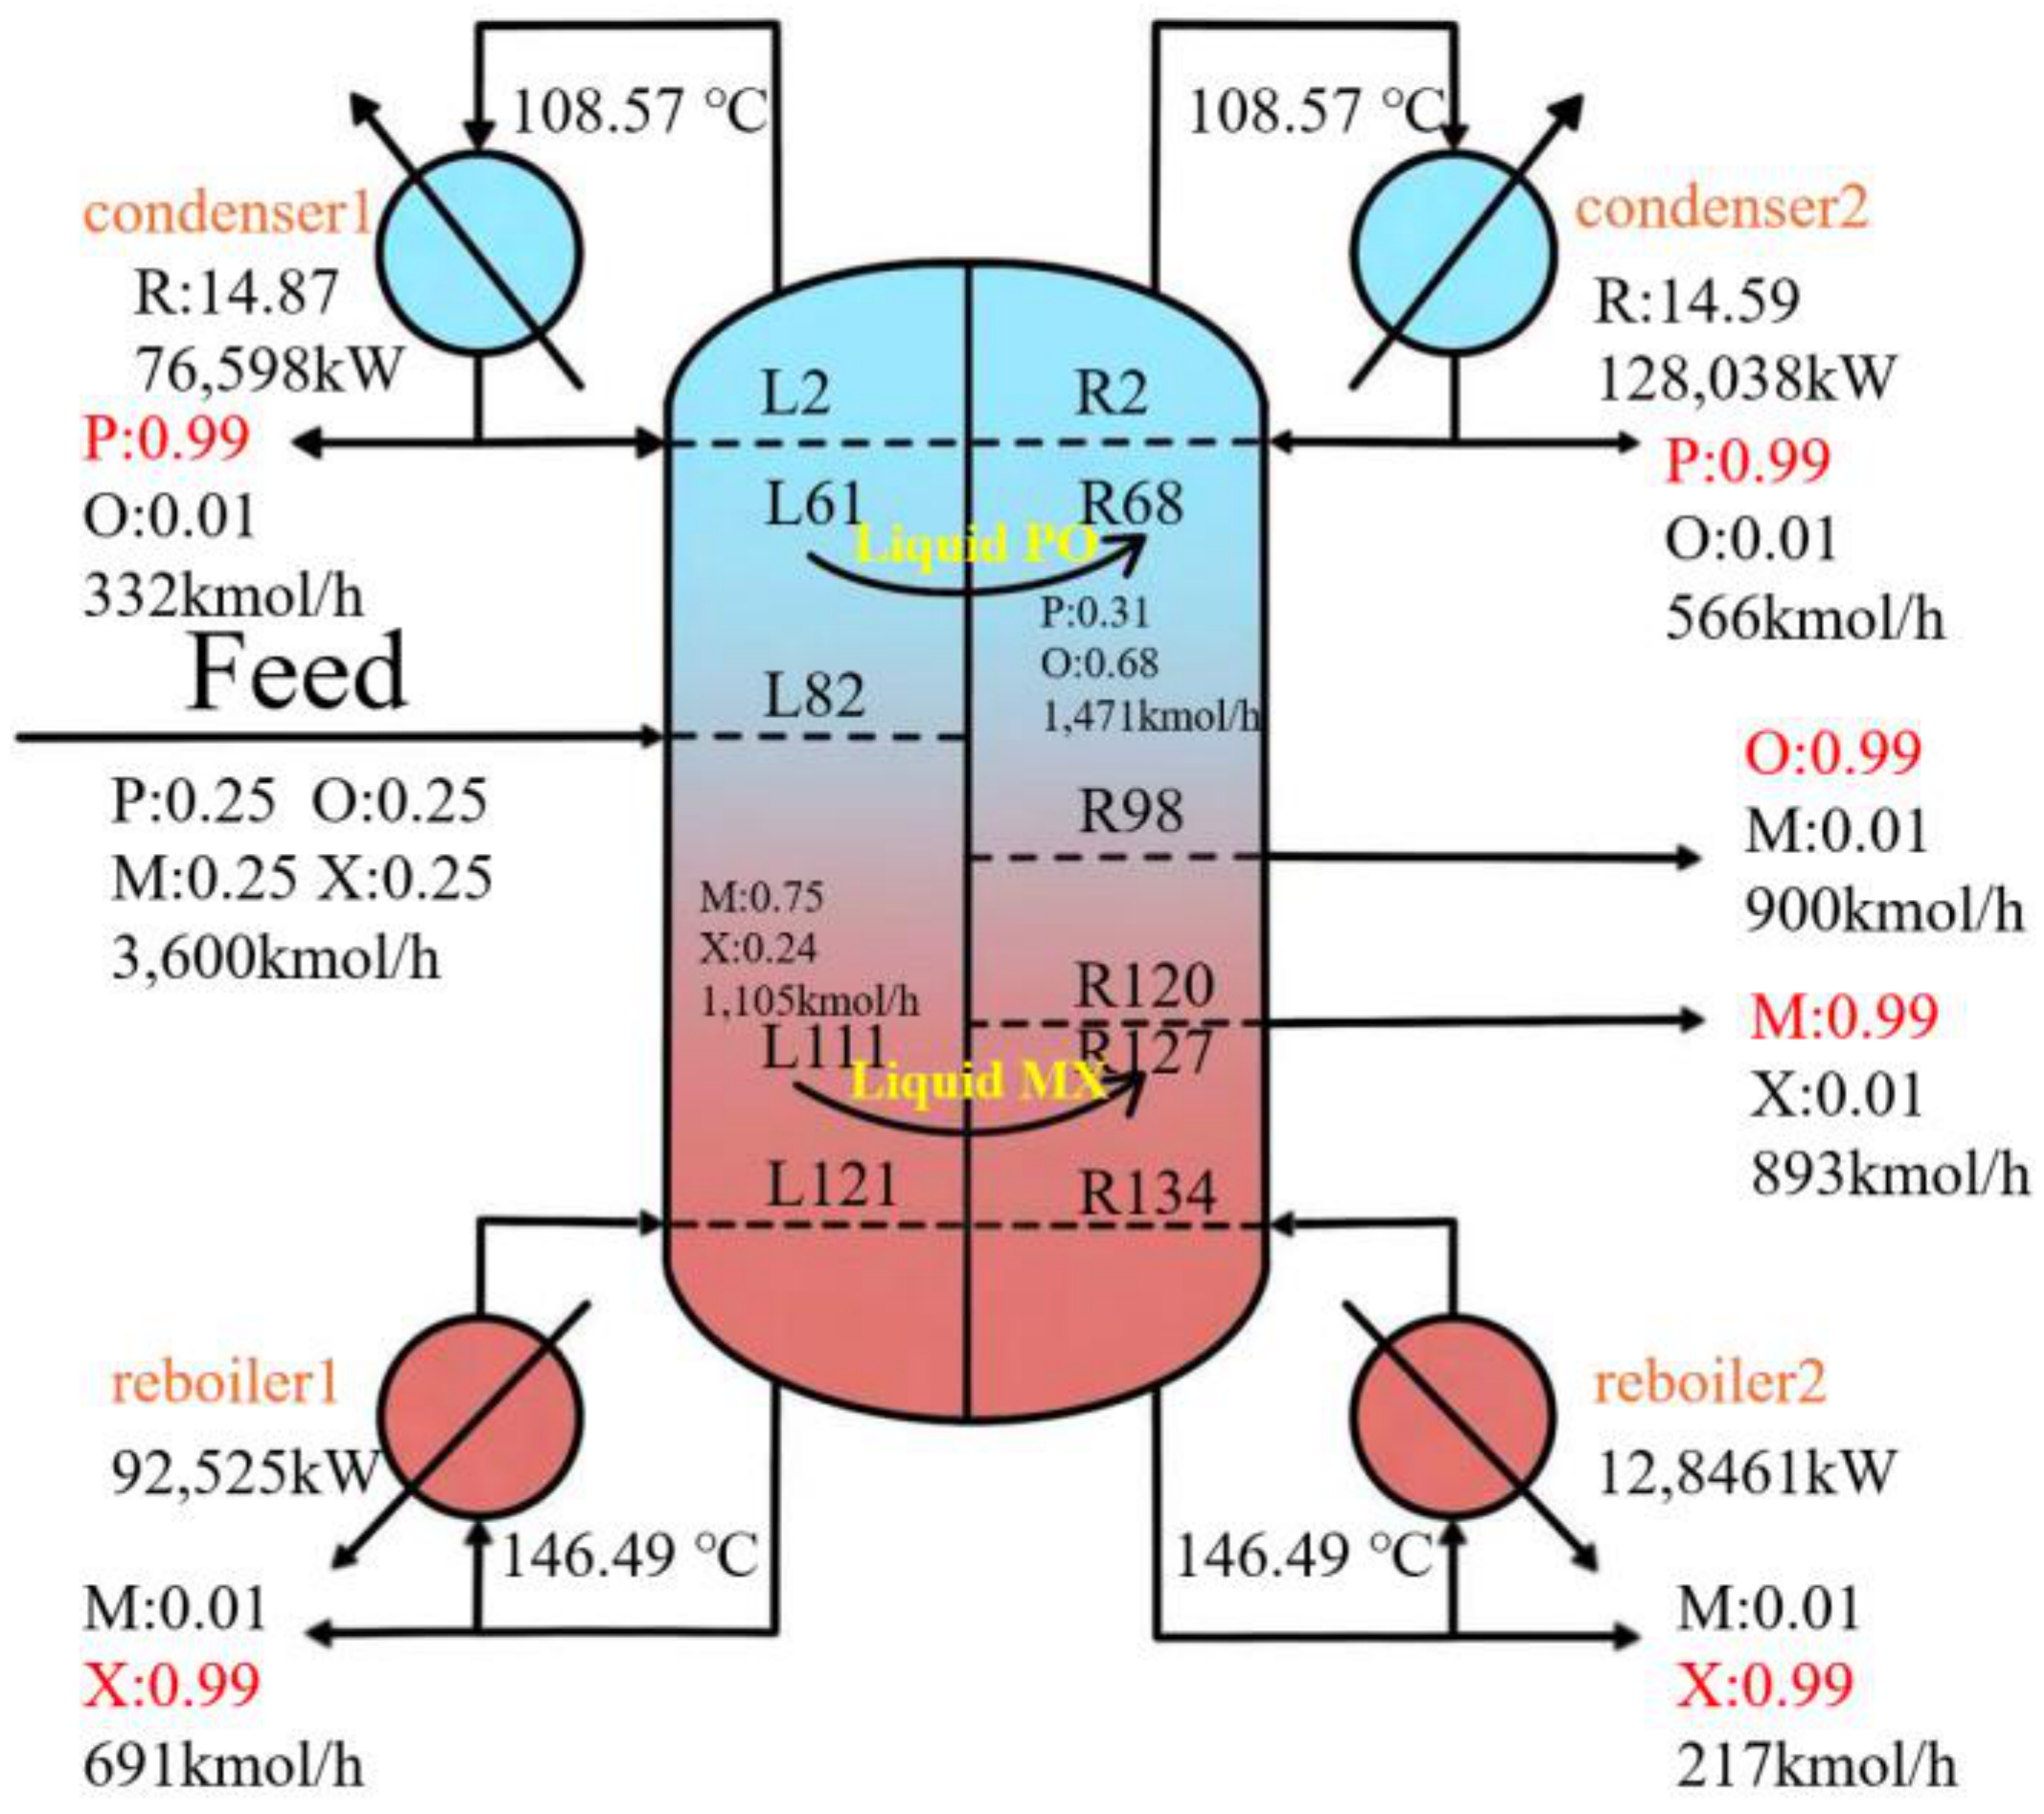
Rigorous simulation was performed using RadFrac based on the shortcut calculation results, with design specifications employed to ensure that each product meets the purity requirements. Figure 13 presents the CDS simulation data.
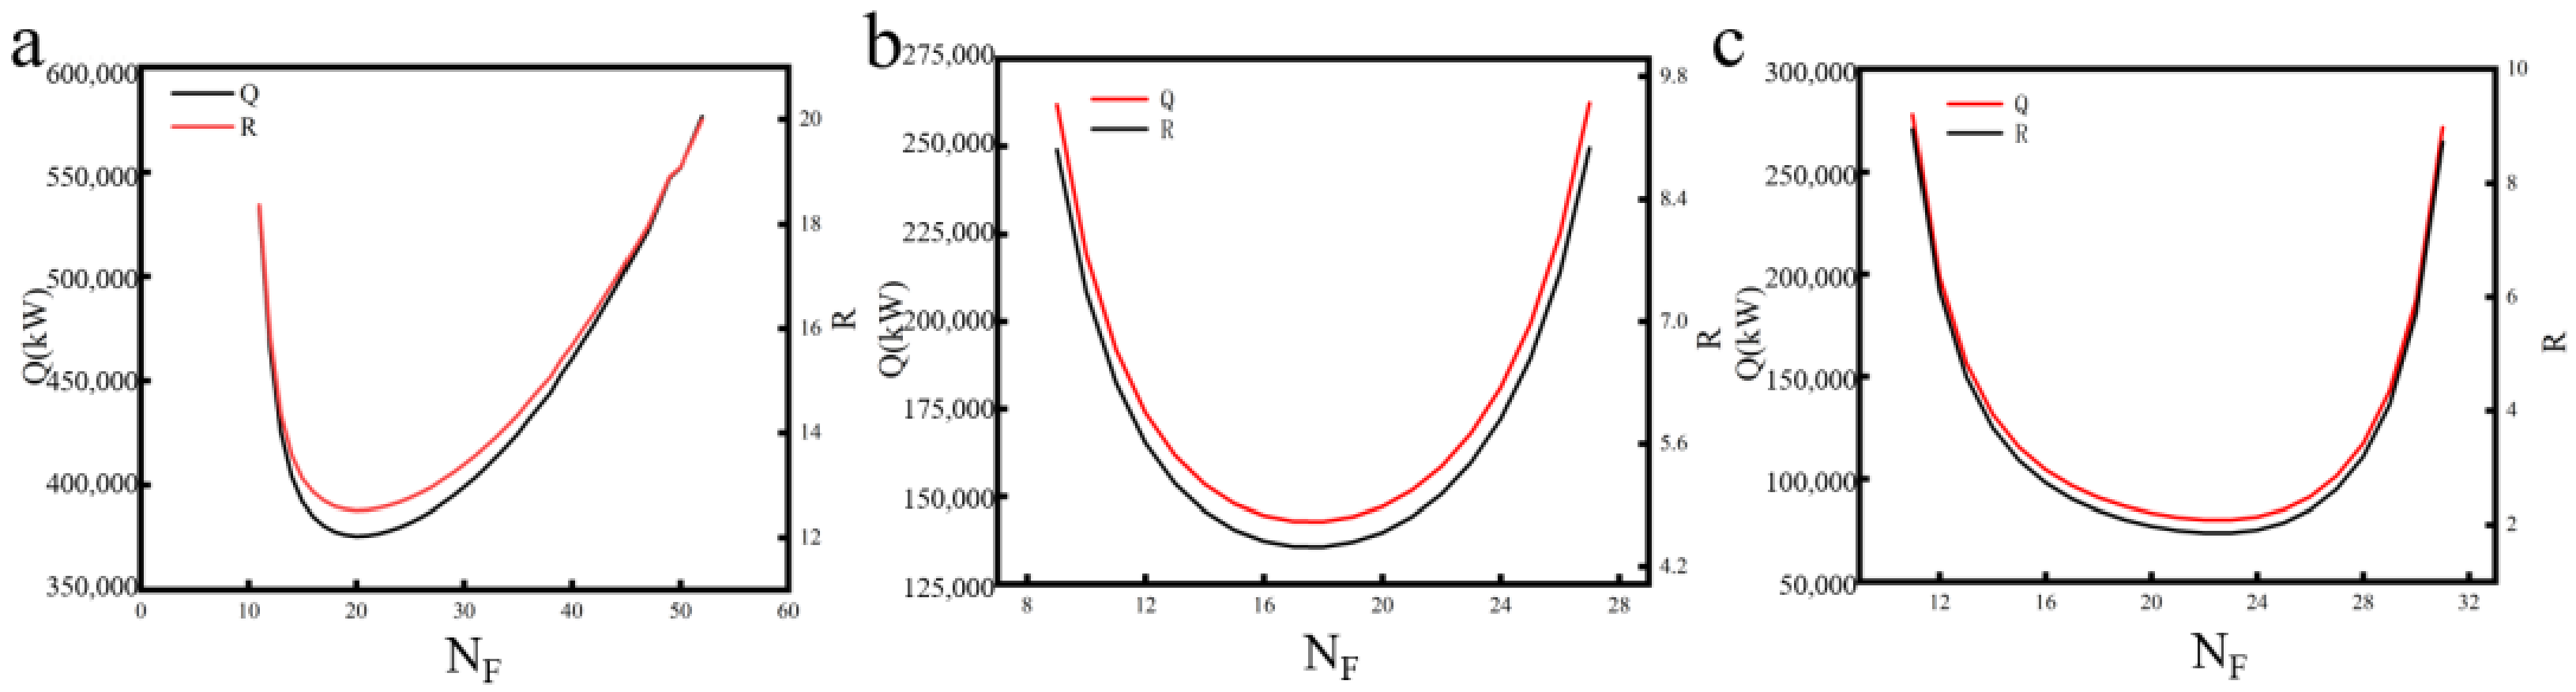
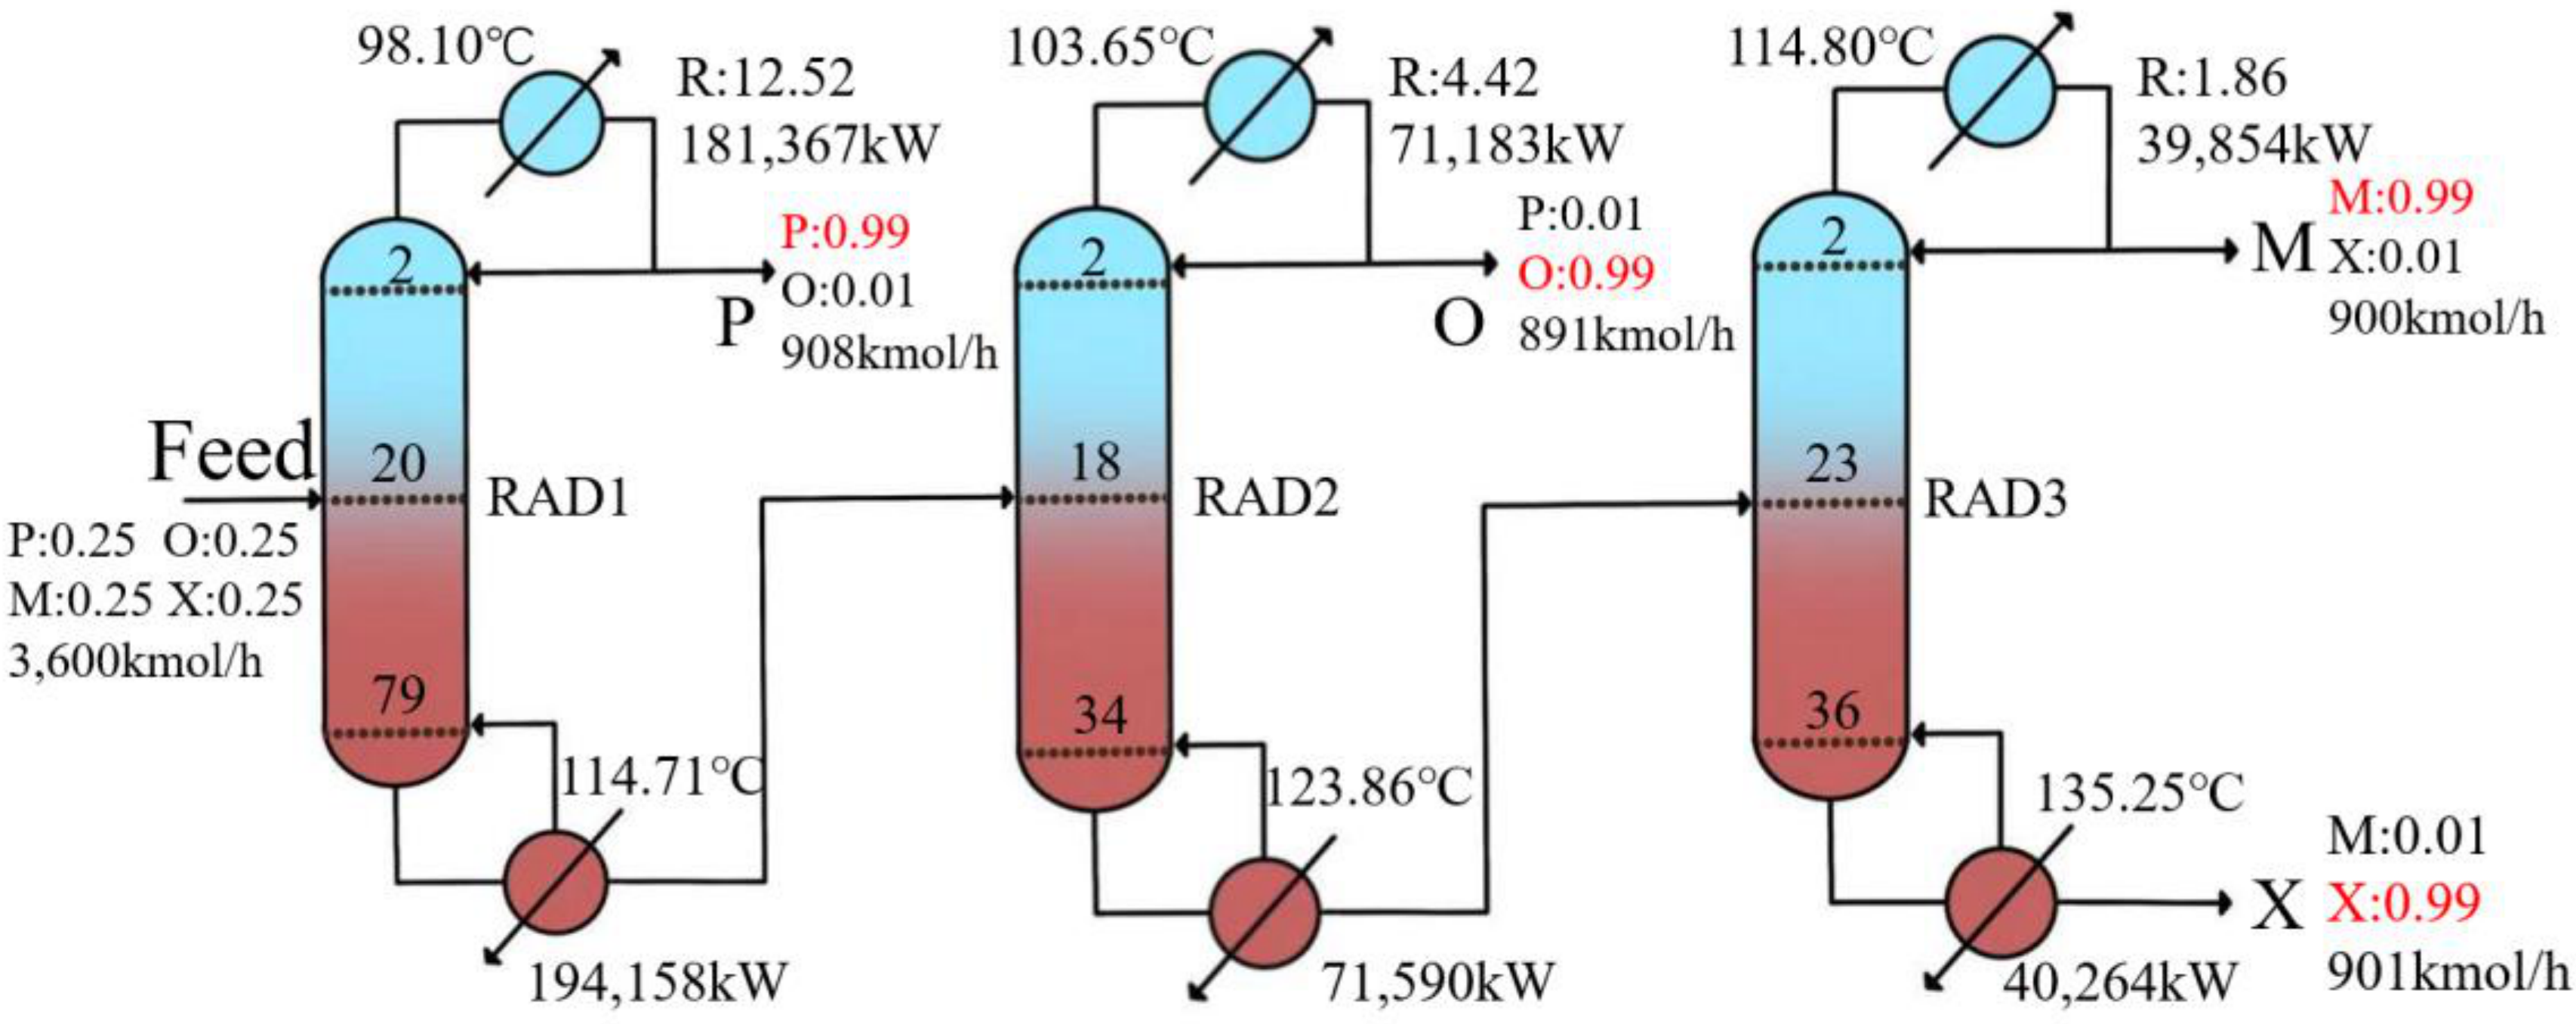
Sensitivity analysis was conducted on feed location and reflux ratio, yielding the NF-Q curves for each column as shown in Figure 14. The feed location at which both the reflux ratio and column duty reach their minimum was selected as the optimal feed location. The optimized CDS simulation data are shown in Figure 15.

4.2. LDWC System Optimization Results

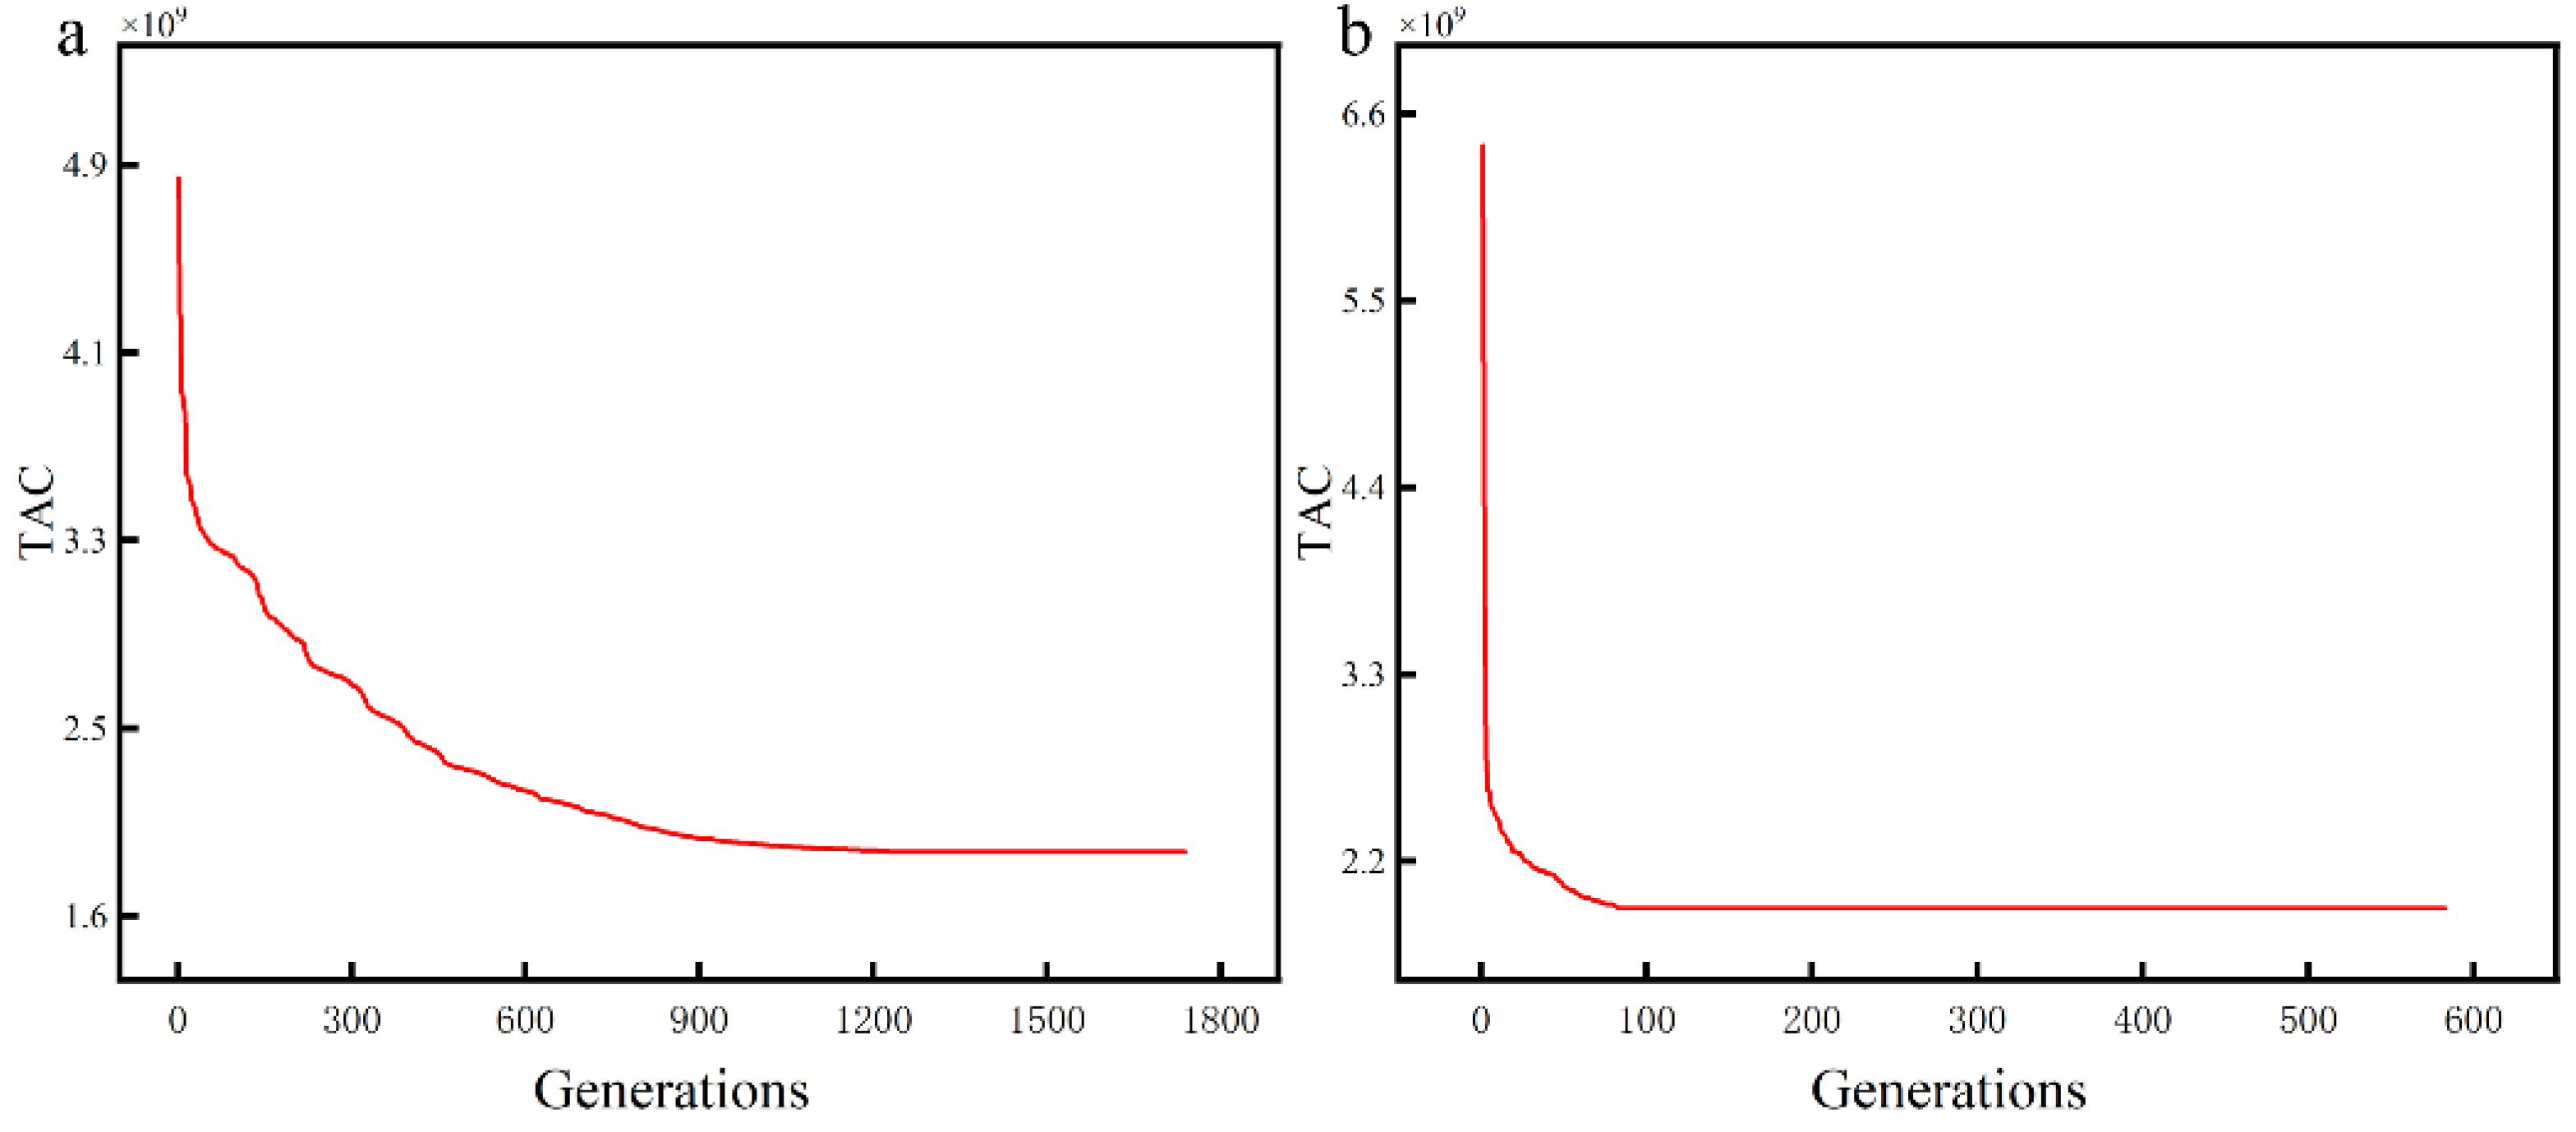
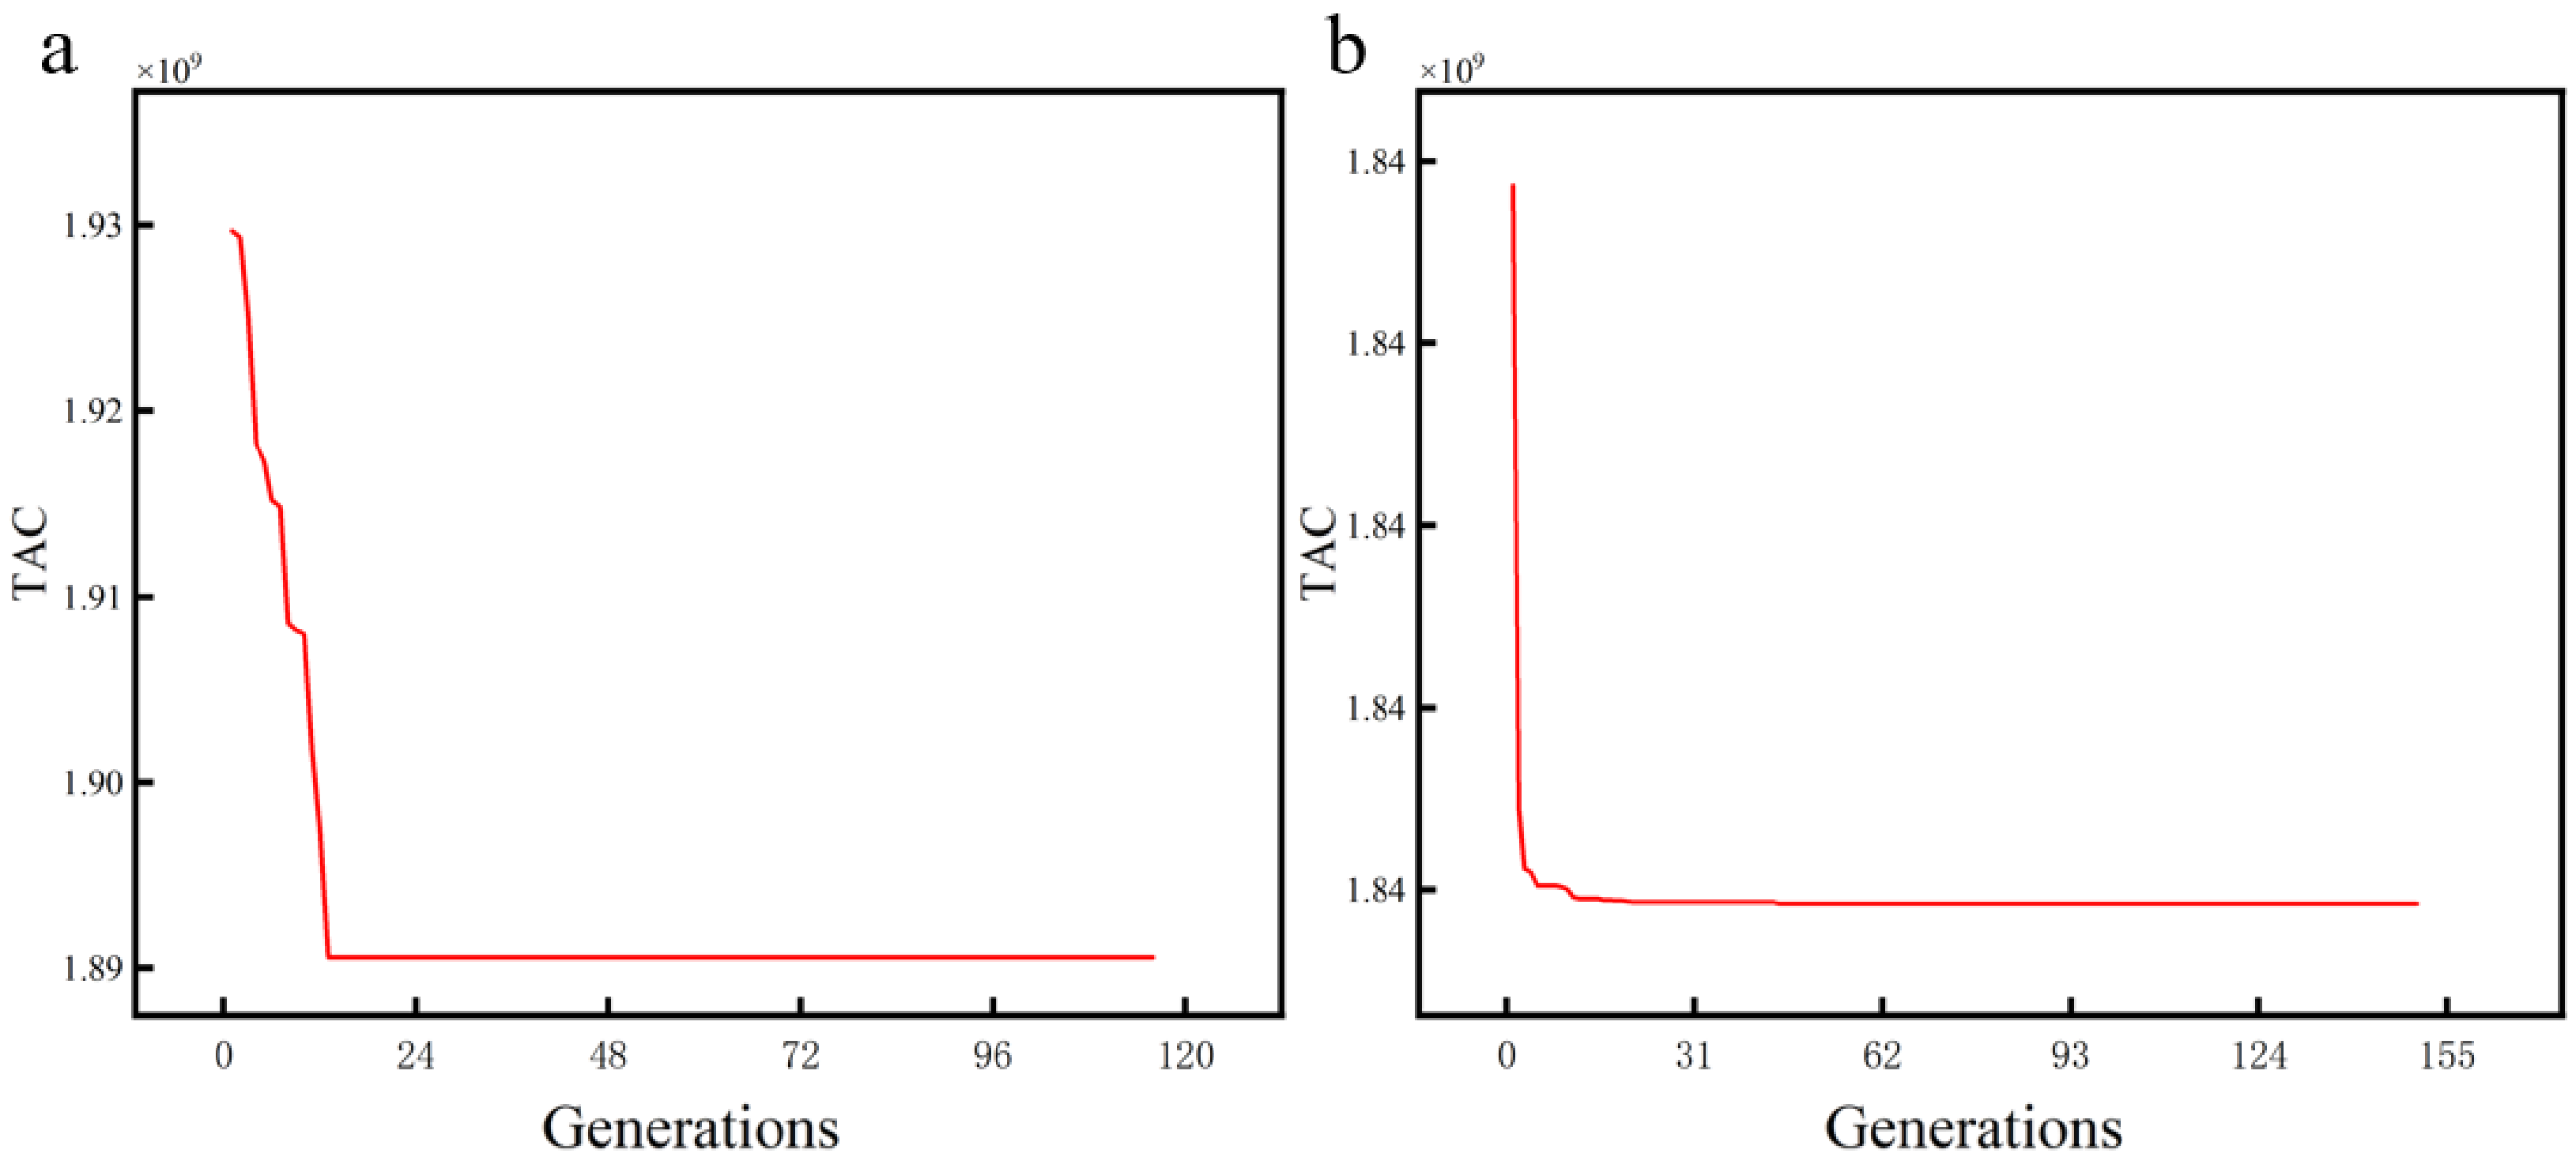
Figure 16 shows the evolution of the best TAC among individuals in each generation during the LDWC system optimization process. Due to the low degree of system coupling and high parameter sensitivity in the CL section, more iterations were required; at generation 1100, the best TAC per generation remained essentially unchanged, indicating that the CL section optimization was complete. Since the CL section had completed the pre-separation, the first feed to the CR section contained only P and O, while the second feed contained only M and X, with a high degree of coupling. Consequently, the CR section required significantly fewer iterations to complete optimization. The final results of the self-adaptive optimization of the LDWC are shown in Figure 17.

4.3. IR-LDWC Process Intensification Results

Figure 18 shows the evolution of the best TAC among individuals in each generation during the self-adaptive optimization of the IR-LDWC systems. IR-LDWC1 completed TAC optimization at generation 17, with specific optimization results shown in Figure 19. IR-LDWC2 completed TAC optimization at generation 53, with specific optimization results shown in Figure 20.
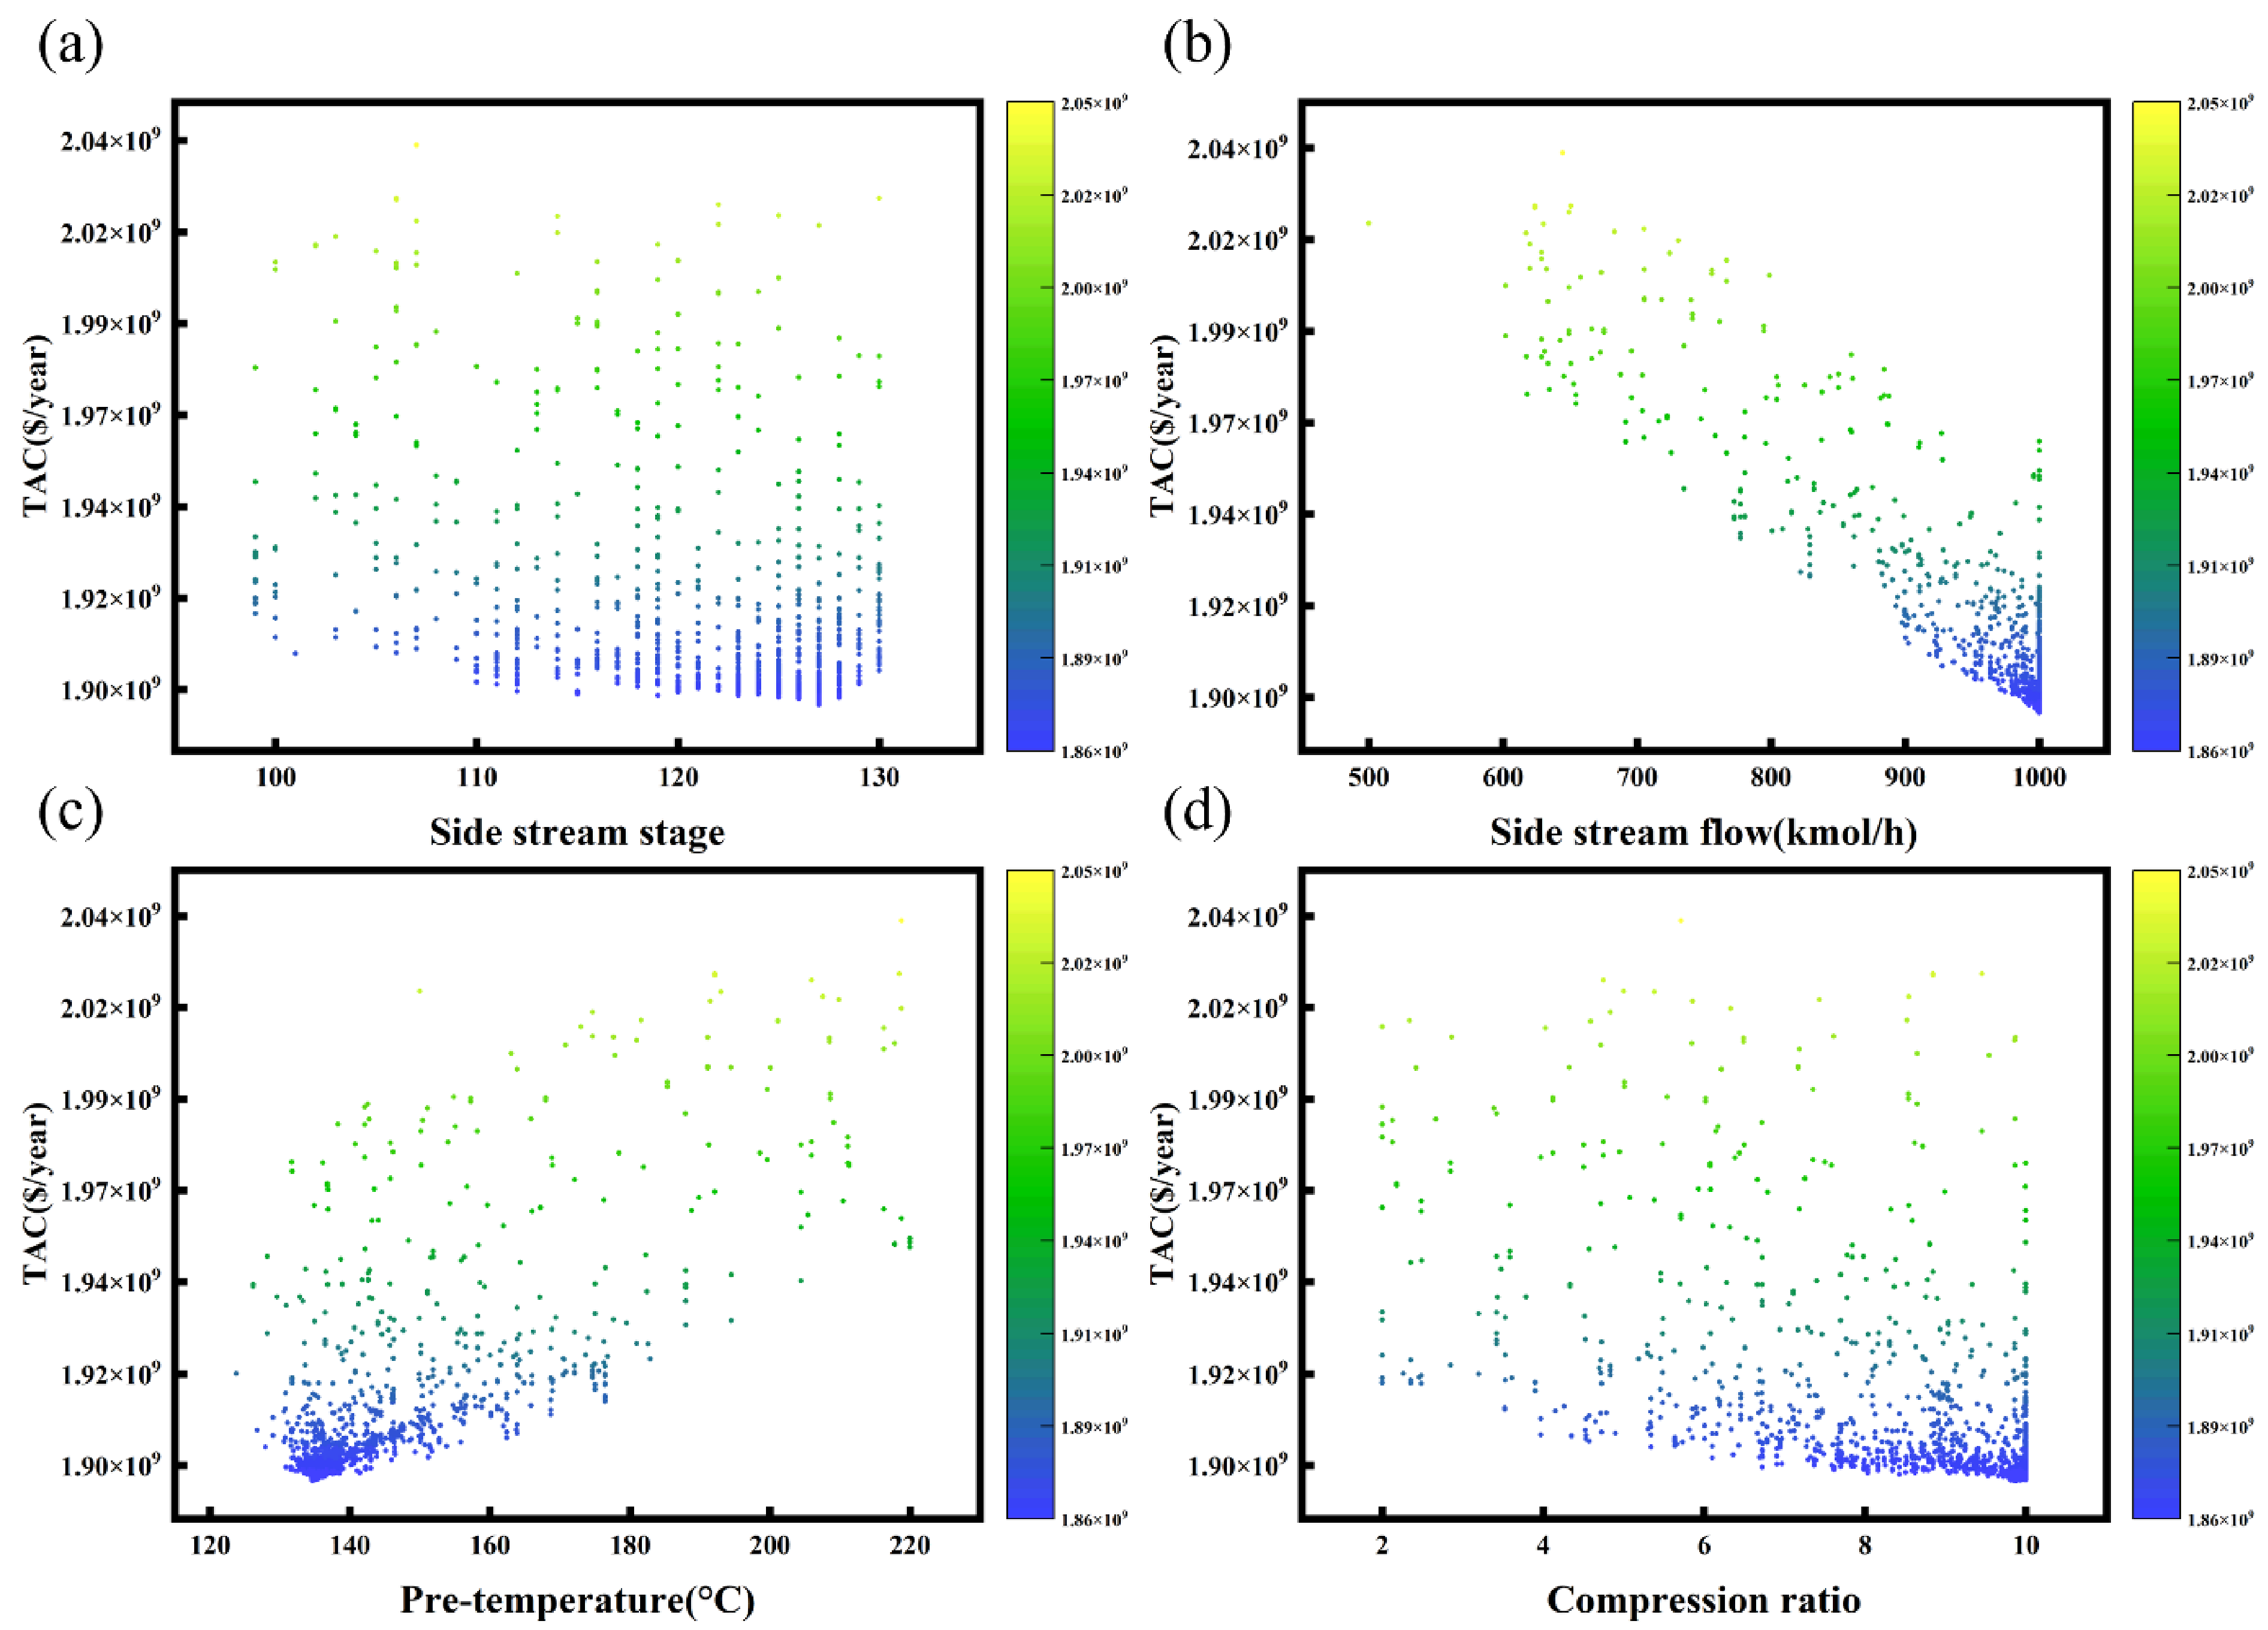
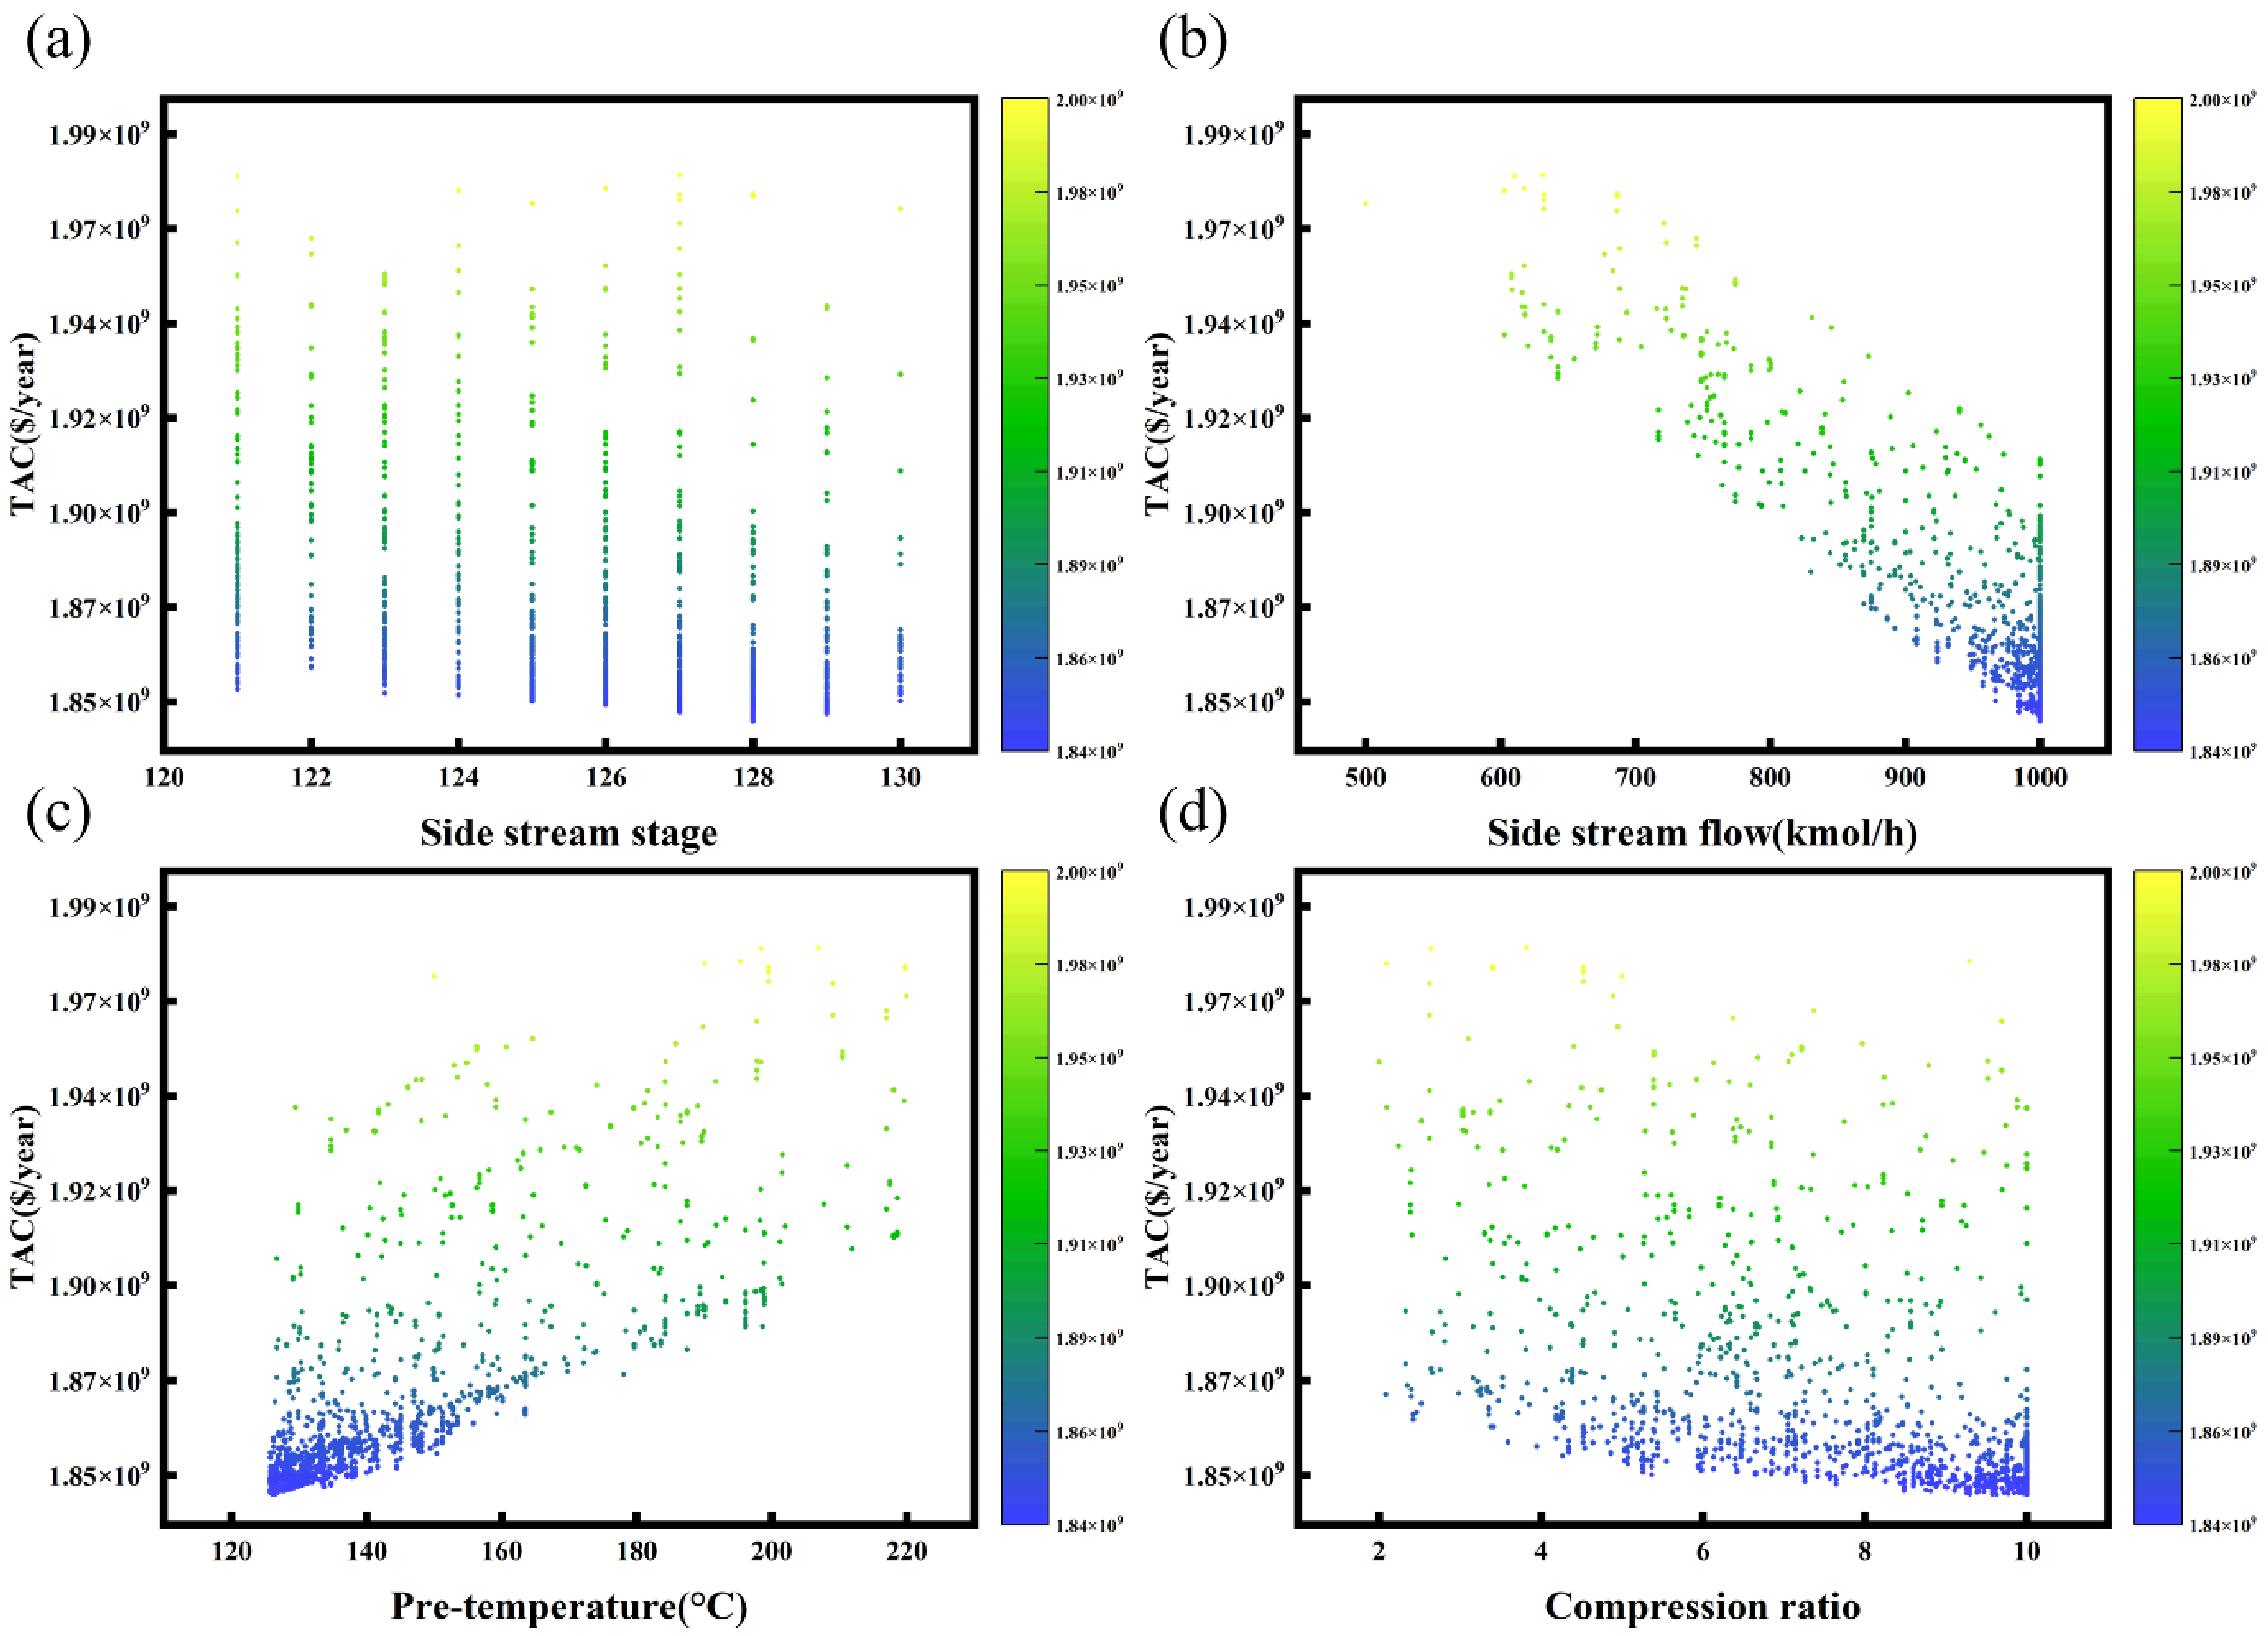
To further investigate the coupling effects among parameters in the intermediate reboiler system, 1500 data sets from the Matlab-SaDE-Aspen Plus framework optimization process were used to generate scatter plots of TAC versus parameter variations for analysis.
Figure 21 and Figure 22 illustrate the distributions of IR-LDWC parameters versus TAC. The optimization of IR-LDWC is a complex multi-parameter optimization problem. As shown in the figures, as TAC gradually decreases, the individual parameters do not exhibit specific monotonic trends. A given TAC does not correspond to a unique set of parameters; multiple parameter combinations can yield the same TAC. Therefore, the effects of individual parameters on TAC are not independent but rather interactive. Independent optimization of individual parameters fails to account for these inter-parameter interactions, and the resulting solutions are not optimal. The Matlab-SaDE-Aspen Plus framework established in this study enables simultaneous optimization of four parameters, finding the optimal solution in a short time. As shown in Figure 21, when IR-LDWC1 achieves the minimum TAC, the sidestream withdrawal position is stage 127, the sidestream withdrawal flow rate is 1000 kmol/h, the preheating temperature is 134.57 °C, and the compression ratio is 10. According to Figure 22, when IR-LDWC2 achieves the minimum TAC, the sidestream withdrawal position is stage 128, the sidestream liquid withdrawal flow rate is 1000 kmol/h, the preheating temperature is 125.78 °C, and the compression ratio is 10. Although the sidestream withdrawal flow rates and compression ratios for both IR-LDWC1 and IR-LDWC2 reach their boundary values, this does not imply that the bounds were set too conservatively. Increasing the sidestream withdrawal flow rate enables greater utilization of the intermediate reboiler to reduce the main reboiler heat duty, but it is constrained by the actual available liquid flow rate in the column and the downcomer liquid flow required for normal operation. A higher compression ratio provides higher-temperature steam for intermediate reboiler heating, but an excessively high compression ratio compromises system convergence and reduces compressor efficiency.
To further quantify the performance of the intermediate reboiler heat pump system, the COP values for IR-LDWC1 and IR-LDWC2 were calculated. The COP is the energy efficiency ratio of a heat pump system, defined as the ratio of useful heat released by the heat pump to the high-temperature heat sink to the input work consumed by the compressor, calculated using Equation (23). It is a key indicator for assessing the economic viability of heat pump systems.
C O P = Q I R W C o m p r e s s o r
The COP values for IR-LDWC1 and IR-LDWC2 are 5.67 and 5.85, respectively. Both COP values exceed 5, indicating that the heat pump is thermodynamically feasible. The higher COP of IR-LDWC2 compared with IR-LDWC1 implies that IR-LDWC2 can deliver more useful heat per unit of compressor work.

4.4. System Performance Evaluation

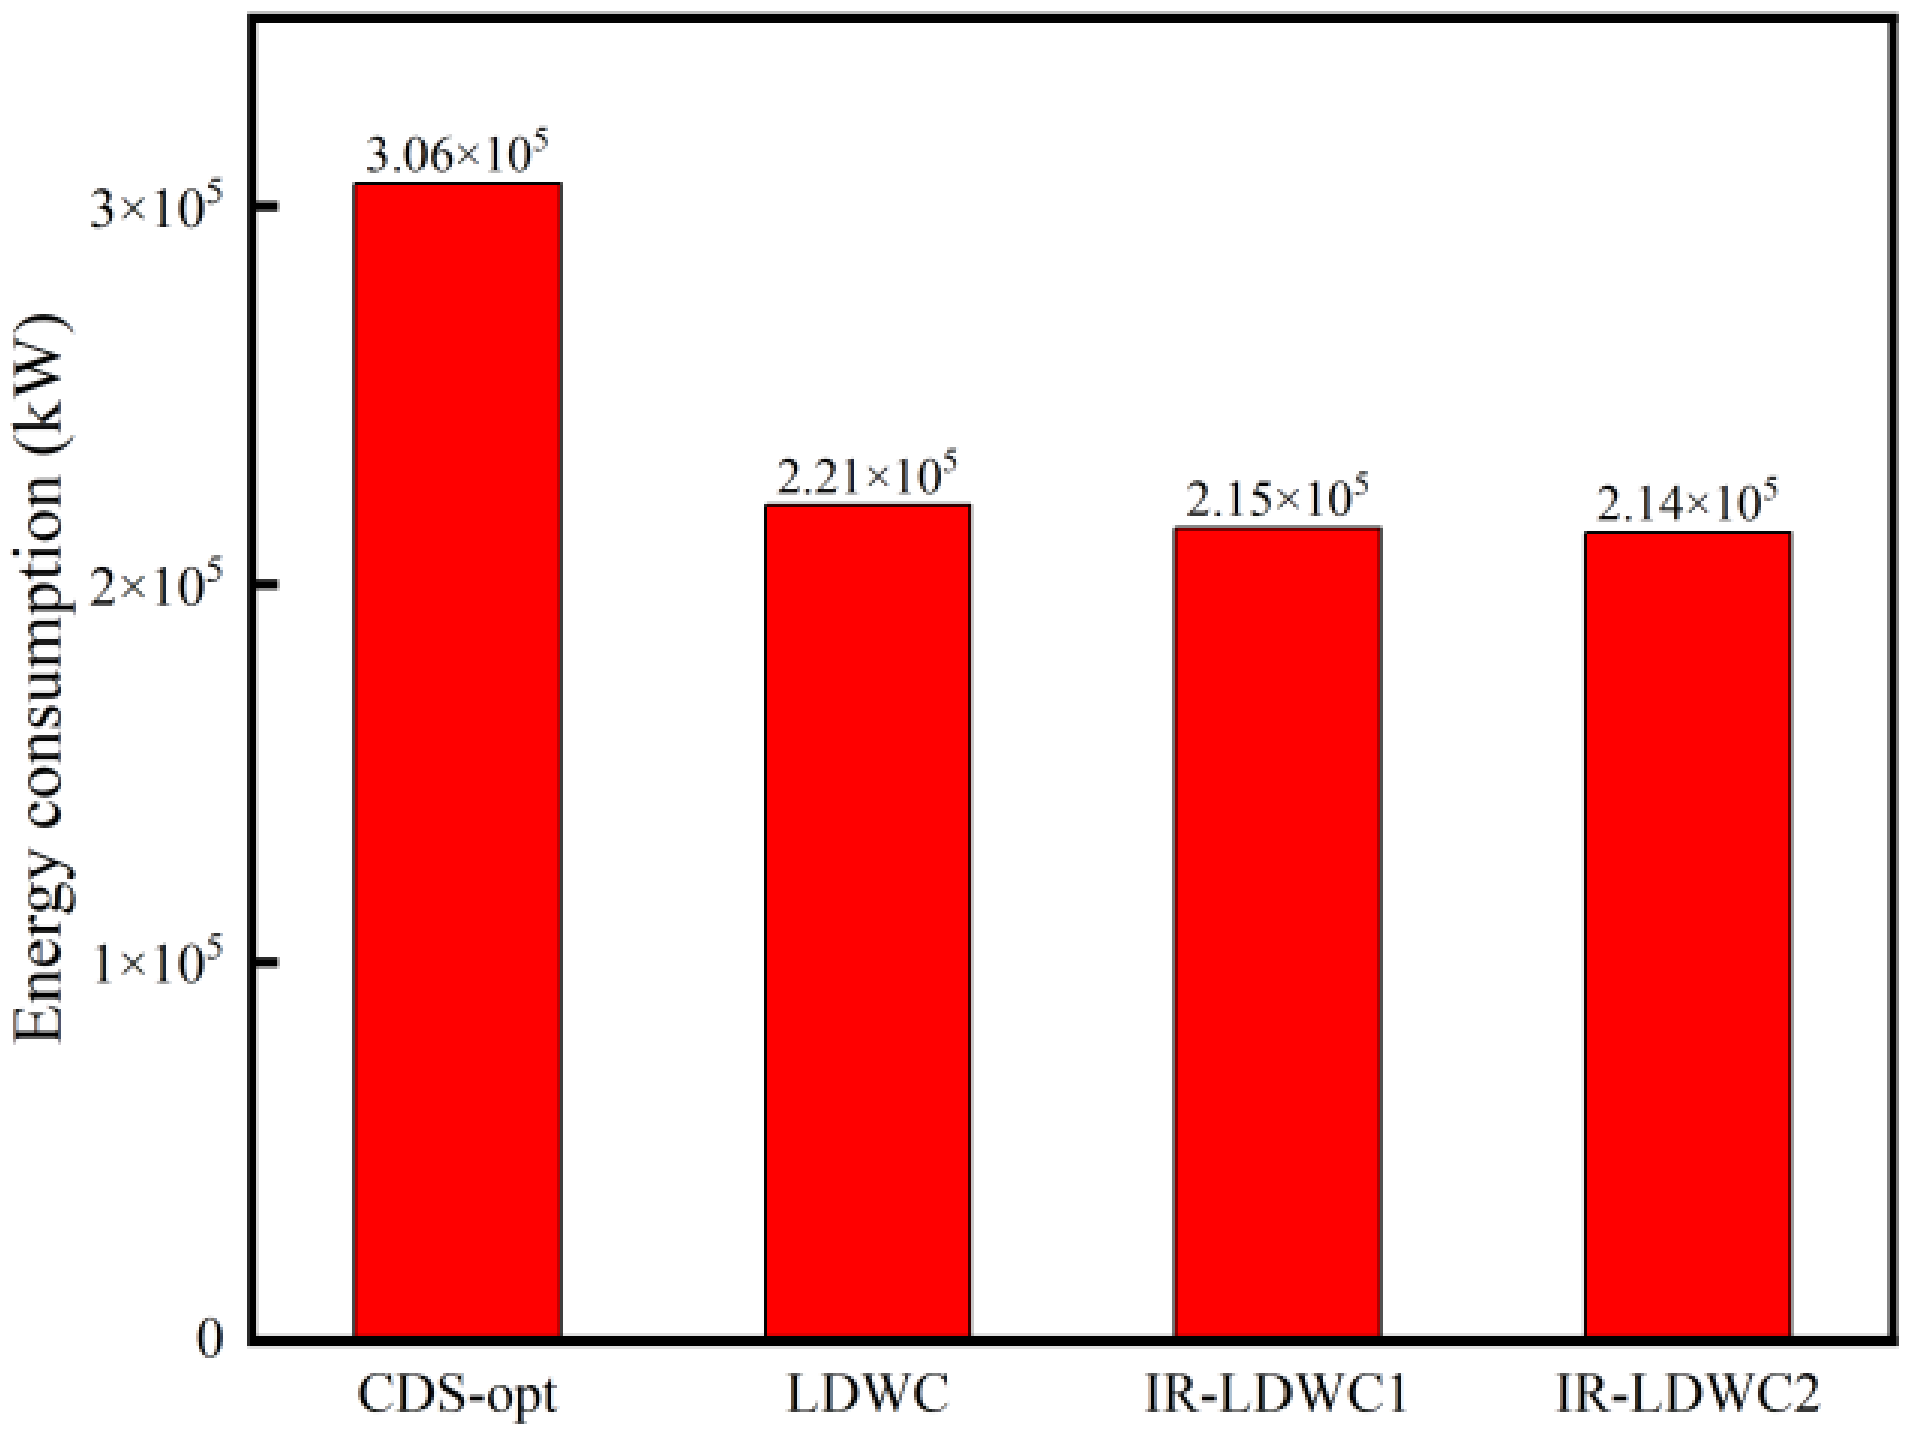
The comparison of total energy consumption across all processes is shown in Figure 23. Compared with the CDS, the LDWC reduces total energy consumption by 27.79%, while IR-LDWC1 and IR-LDWC2 further reduce it by 29.75% and 30.15%, respectively. The LDWC can separate all four components in a single column with only two reboilers, achieving higher energy integration than the CDS system, thus resulting in a substantially lower total energy consumption. The introduction of the intermediate reboiler further reduces total energy consumption because it vaporizes a portion of the column bottom liquid in advance, thereby reducing the reboiler heat duty.
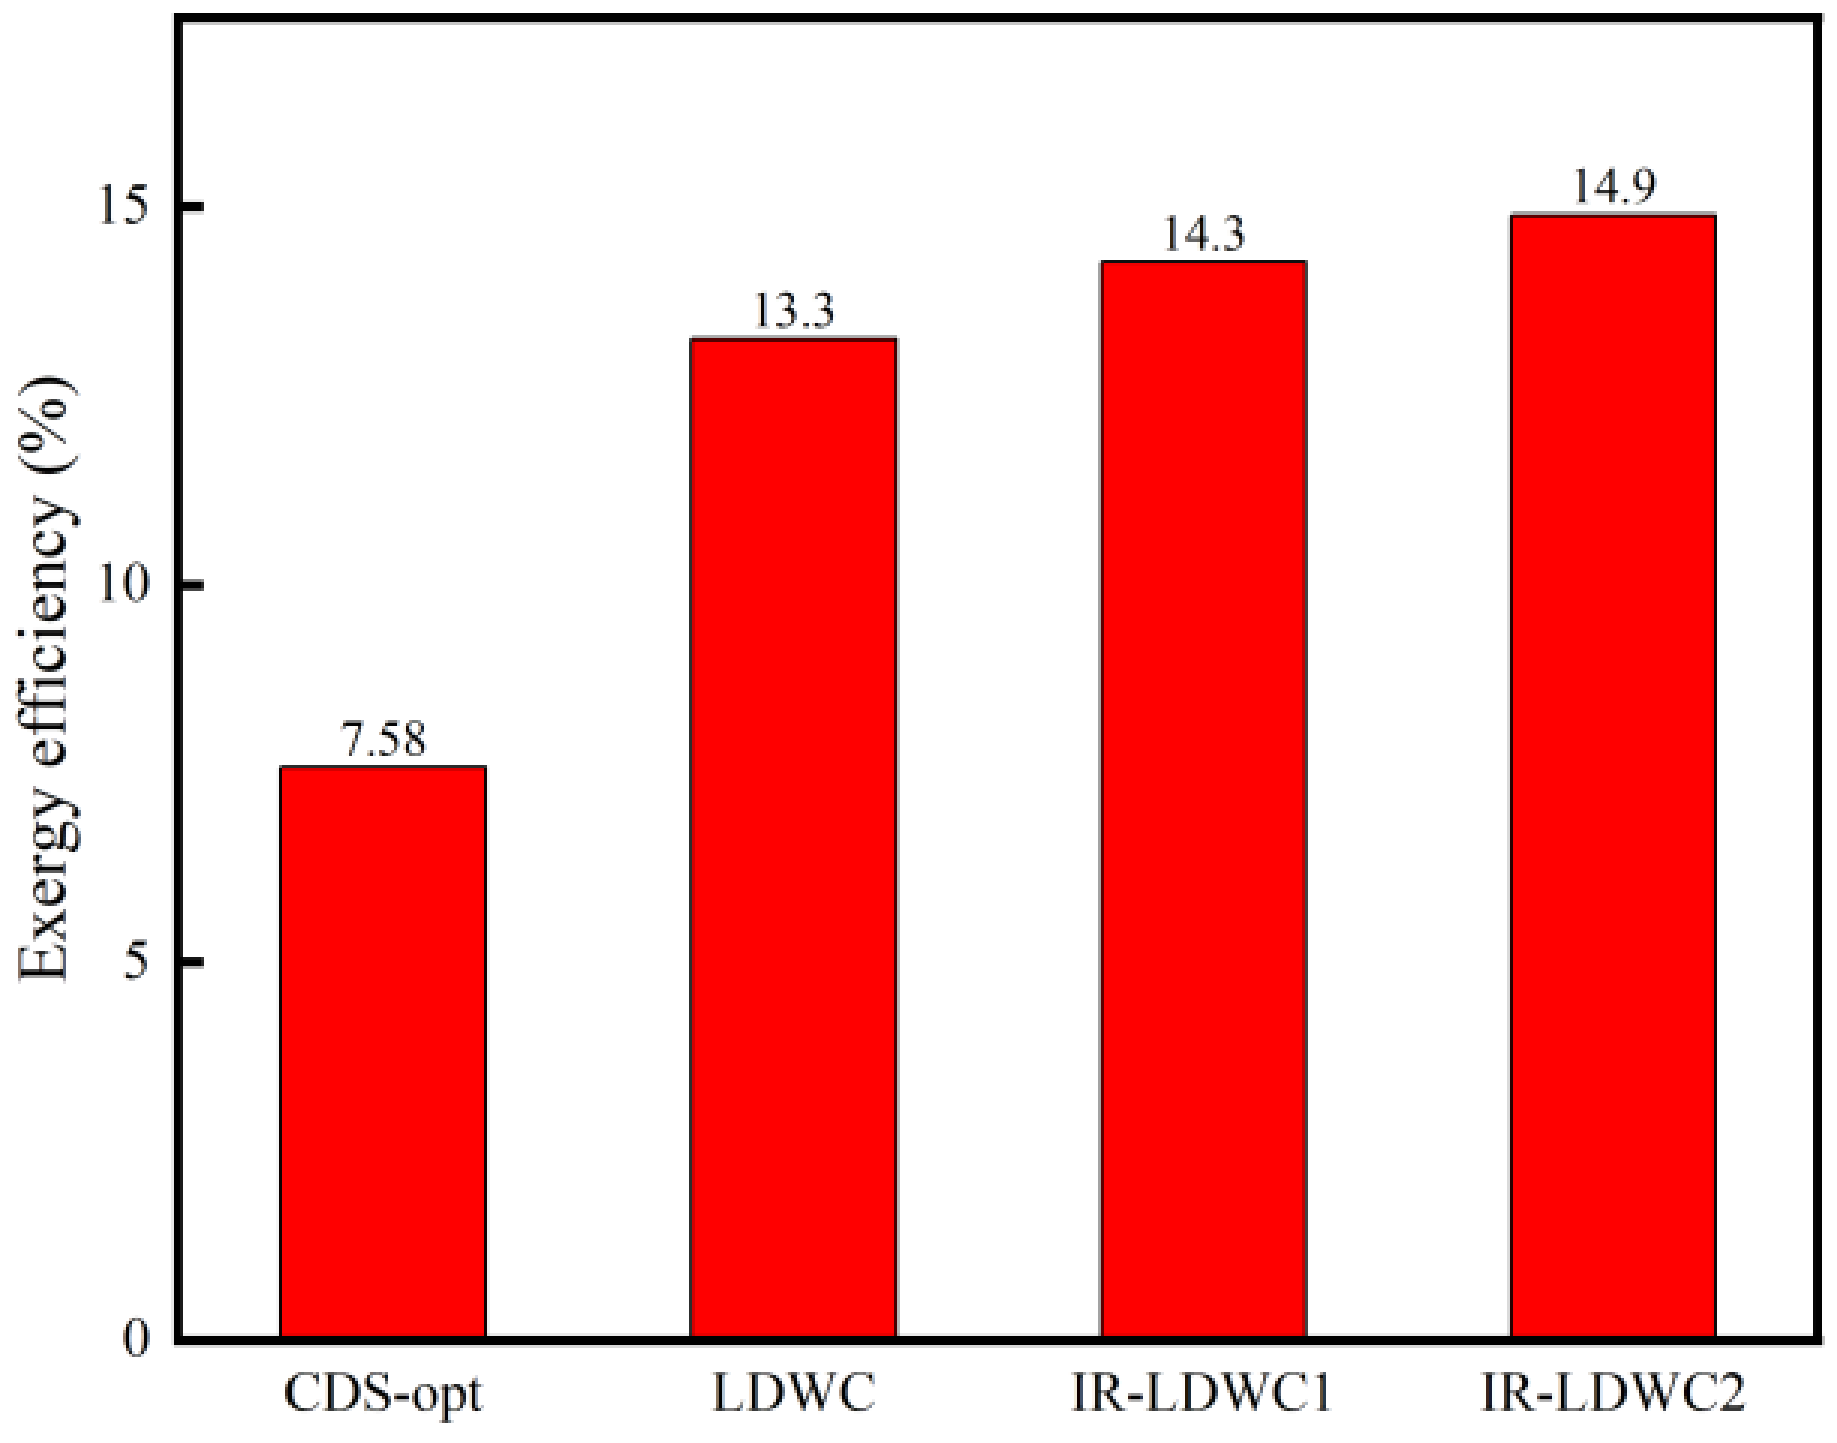
The comparison of exergy efficiency across all processes is shown in Figure 24. Owing to its energy integration characteristics, the LDWC increases the exergy efficiency to 13.3%, while IR-LDWC1 and IR-LDWC2 further improve it to 14.3% and 14.9%, respectively. This is because the presence of the intermediate reboiler reduces the irreversibility of the system, thereby enhancing the thermodynamic efficiency.
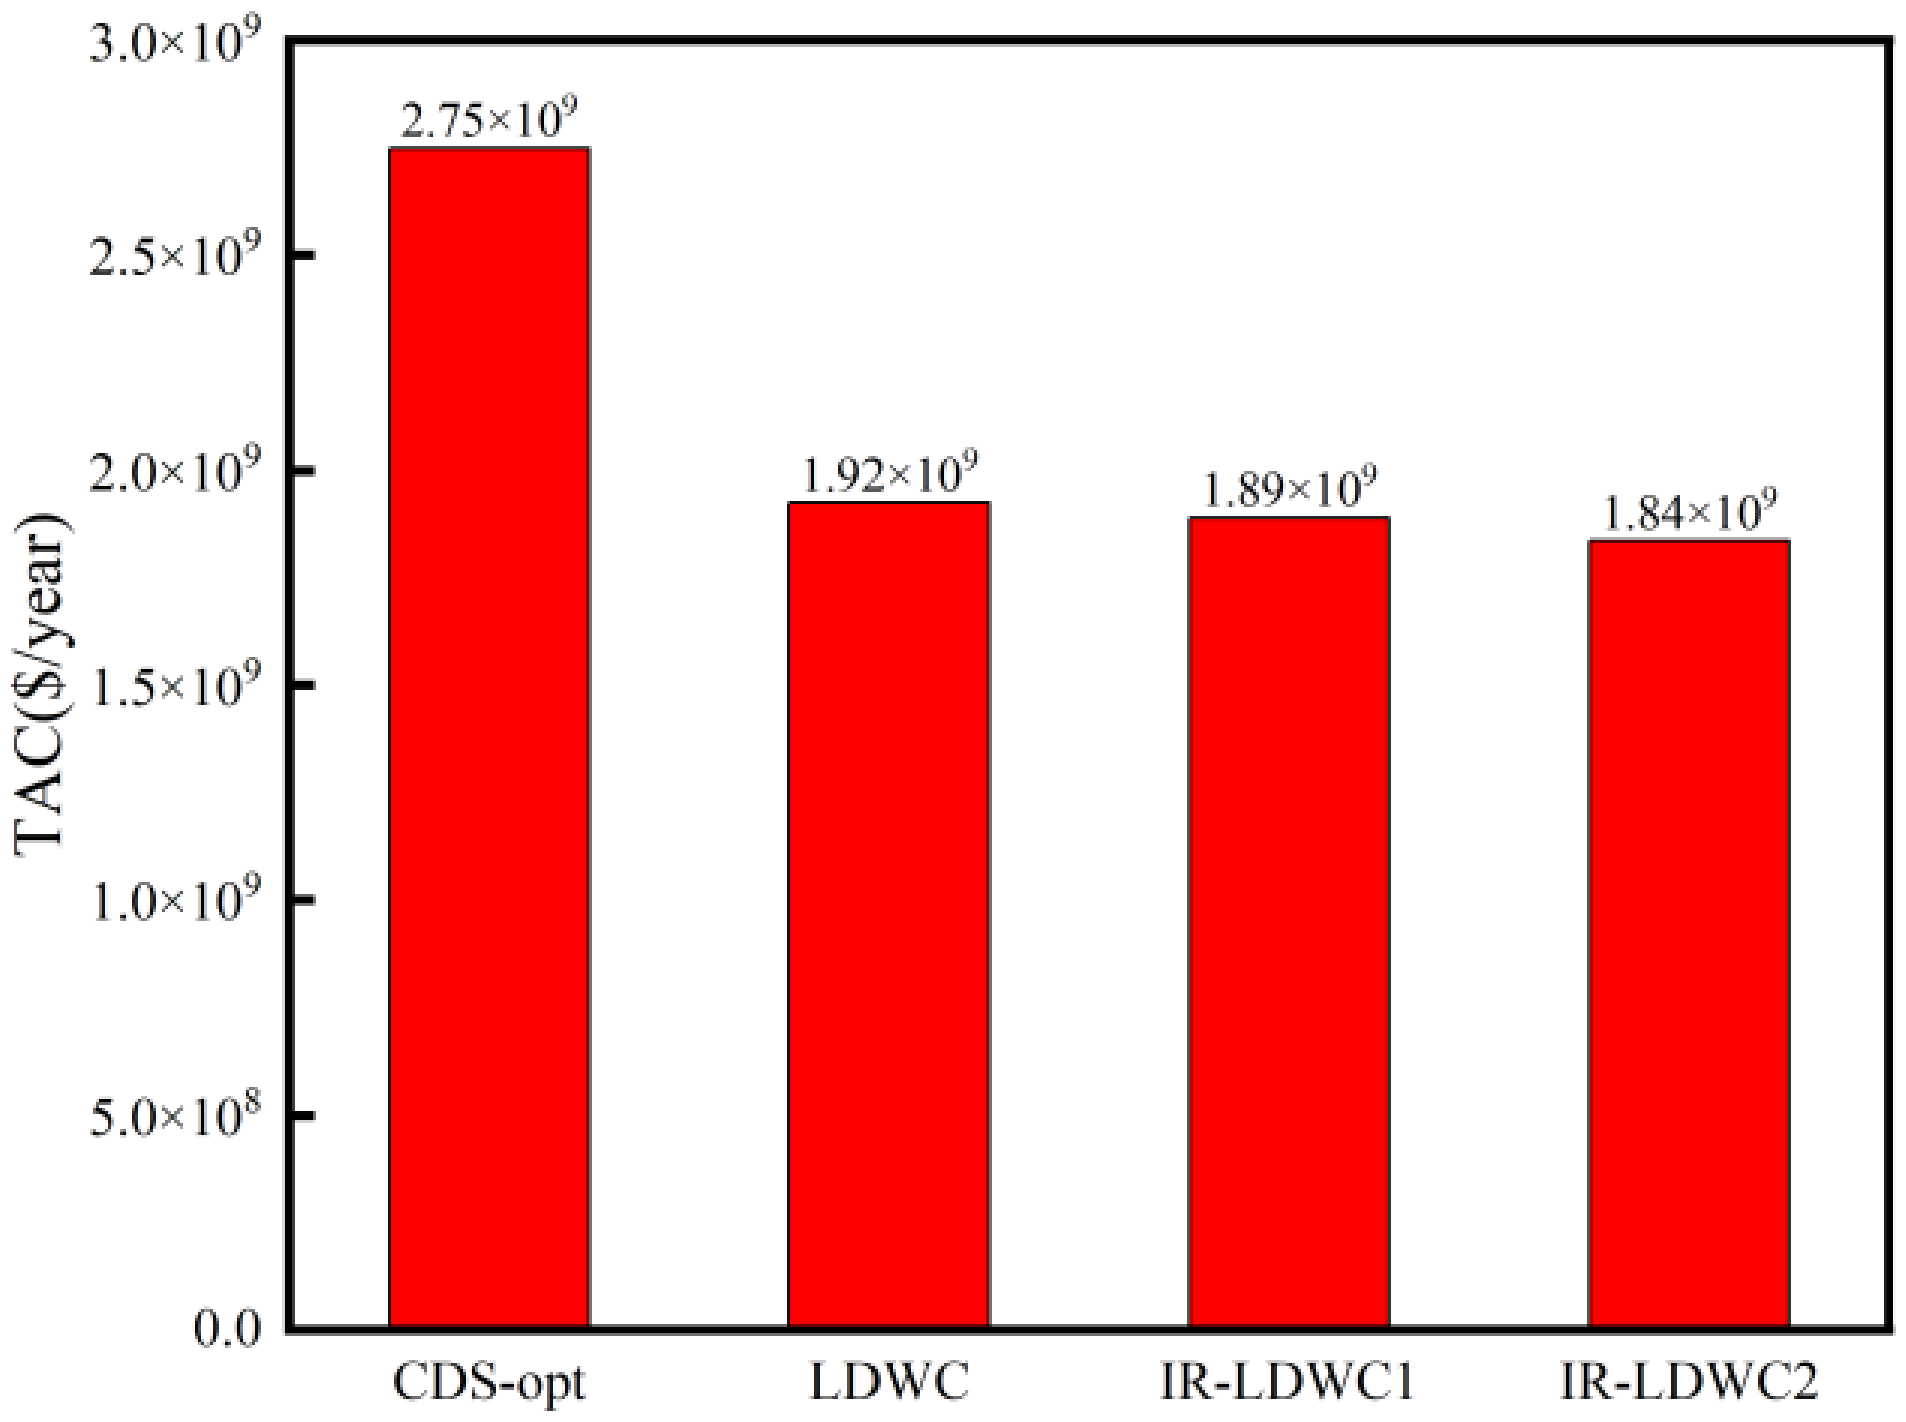
The comparison of TAC across all processes is shown in Figure 25. TAC is primarily influenced by operating costs, namely the consumption of cold and hot utilities and electricity. Due to the payback period, the impact of capital cost on TAC is substantially smaller than that of operating cost. Operating costs are mainly composed of the steam consumed by reboilers and other heaters. The LDWC systems substantially reduce operating costs, leading to significant TAC reductions. The IR-LDWC systems further reduce the reboiler duty through the addition of intermediate reboilers, thereby decreasing TAC. Compared with the CDS, the LDWC, IR-LDWC1, and IR-LDWC2 reduce TAC by 29.97%, 31.24%, and 33.17%, respectively. The higher COP of IR-LDWC2 compared with IR-LDWC1 indicates that IR-LDWC2 can deliver more useful heat per unit of compressor work, which is consistent with its superior TAC performance and further validates the rationale for recommending IR-LDWC2 as the preferred intensification scheme.
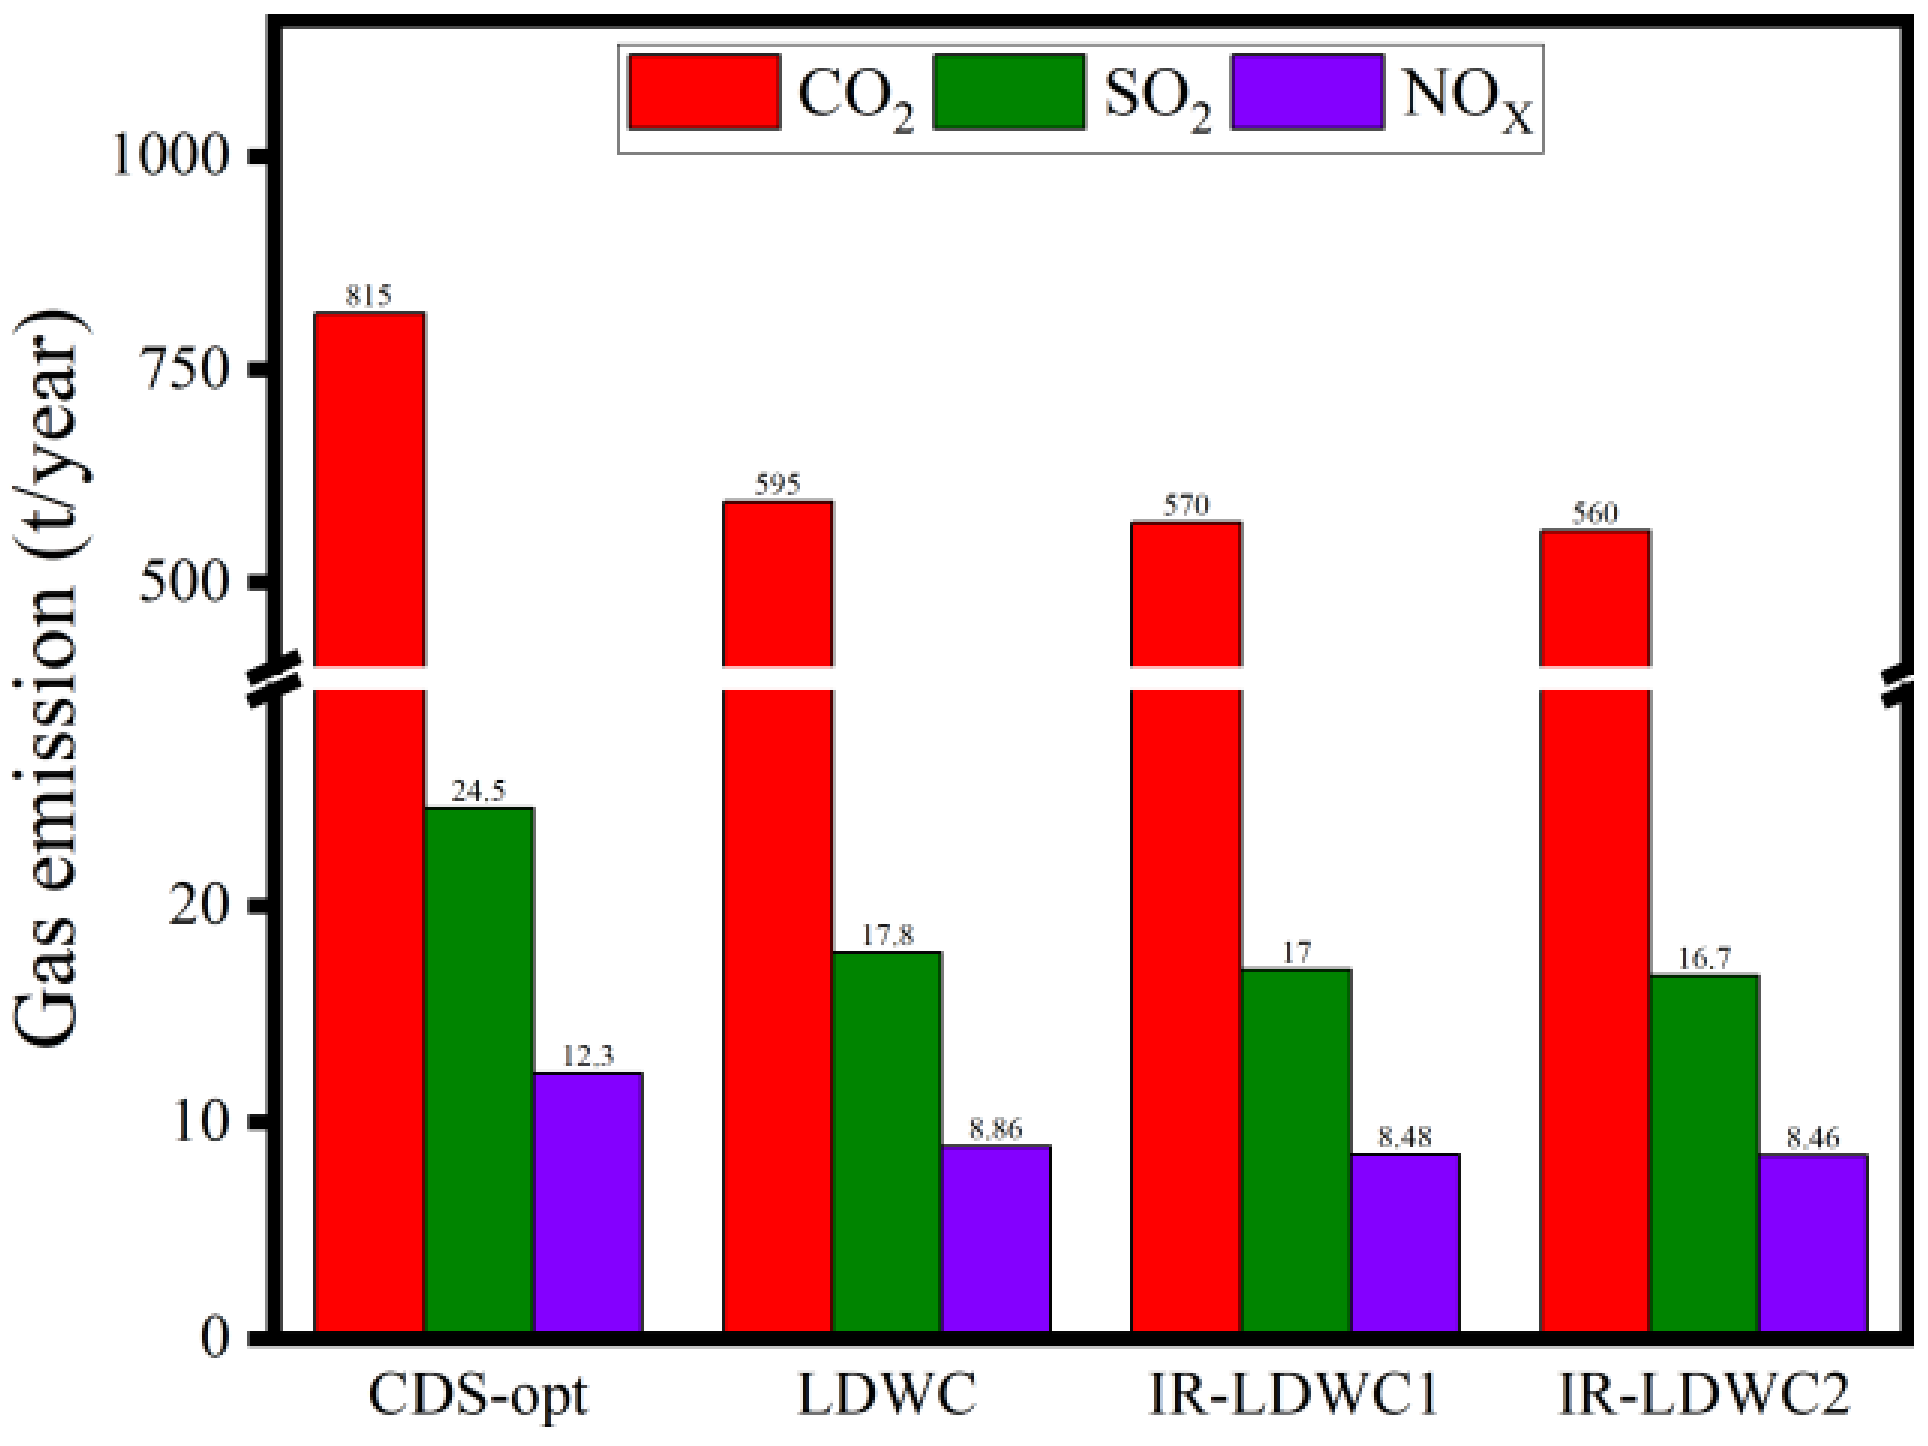
The comparison of gaseous emissions across all processes is shown in Figure 26. The LDWC optimized using the Matlab-SaDE-Aspen Plus framework reduces CO2, SO2, and NOX emissions by 26.98%, 27.31%, and 27.72%, respectively, compared with the CDS obtained through conventional sequential optimization. IR-LDWC2 achieves the lowest gaseous emissions, with CO2, SO2, and NOX reductions of 31.24%, 31.74%, and 31.95%, respectively, compared with the CDS. IR-LDWC1 reduces CO2, SO2, and NOX by 30.05%, 30.51%, and 30.81%, respectively, compared with the CDS.

5. Conclusions

This paper addresses the challenges of high initialization difficulty and poor convergence associated with the LDWC by proposing a self-adaptive optimization method based on the SaDE algorithm coupled with Aspen Plus. Using a four-component phenolic mixture as the research subject, systematic optimization and performance evaluation were completed, progressing from the conventional distillation sequence to the LDWC and its intermediate reboiler intensified configurations (IR-LDWC). The main conclusions are as follows:
  • The Matlab-SaDE-Aspen Plus framework was constructed, enabling automatic optimization of the key structural parameters and operating variables of the LDWC. This method effectively resolves the initialization and convergence difficulties caused by multi-variable strong coupling in the LDWC, providing a viable tool for the design of complex distillation configurations.
  • Compared with conventional sequential distillation, the LDWC achieves reductions of 17.62%, 19.35%, and 16.53% in total energy consumption, TAC, and CO2 emissions, respectively, with a significant improvement in exergy efficiency. These results demonstrate the energy-saving advantages and comprehensive performance enhancement potential of the LDWC in multicomponent separations.
  • Based on the CGCC analysis of the LDWC, two intermediate reboiler intensification schemes (IR-LDWC1 and IR-LDWC2) were proposed. The optimization results indicate that IR-LDWC2 achieves the best overall performance, with further reductions of 30.15% in total energy consumption, 33.17% in TAC, and 31.24% in CO2 emissions, validating the effectiveness of process intensification strategies in LDWC systems.
  • The variation trends of parameters during IR-LDWC system optimization were analyzed, revealing the coupling effects among multiple parameters and the importance of simultaneous optimization. Using the Matlab-SaDE-Aspen Plus framework for simultaneous parameter optimization, IR-LDWC2 achieved remarkable optimization results.

Author Contributions

Conceptualization, Q.Z. and J.H.; methodology, J.H.; software, J.H.; validation, H.Z. and J.Z.; formal analysis, Q.Z. and J.H.; investigation, C.S. and L.W.; resources, H.Z.; data curation, J.H. and J.Z.; writing—original draft preparation, H.Z. and J.Z.; writing—review and editing, Q.Z. and J.H.; visualization, C.S. and L.W.; supervision, Q.Z. and L.W.; project administration, Q.Z. All authors have read and agreed to the published version of the manuscript.

Funding

This research was funded by [National Natural Science Foundation of China] grant number [22578348].

Data Availability Statement

The raw data supporting the conclusions of this article will be made available by the authors on request.

Conflicts of Interest

The authors declare no conflicts of interest.

Nomenclature

CDSConventional Distillation Sequence
CGCCColumn Grand Composite Curve
COPCoefficient of Performance
CRCrossover probability (in DE context)/Column Right section (in LDWC context)
CLColumn Left section
DEDifferential Evolution
DWCDividing Wall Column
E-LDWCExtractive Liquid-only transfer Dividing Wall Column
FTCDCFully Thermally Coupled Distillation Column
GAGenetic Algorithm
HIDiCHeat-Integrated Distillation Column
IRIntermediate Reboiler
IR-LDWCIntermediate Reboiler enhanced Liquid-only transfer Dividing Wall Column
LDWCLiquid-only transfer Dividing Wall Column
MESHMaterial balance, Equilibrium, Summation, and Heat balance equations
MINLPMixed-Integer Nonlinear Programming
NRTLNon-Random Two-Liquid (thermodynamic model)
SaDESelf-adaptive Differential Evolution
TACTotal Annual Cost
VRCVapor Recompression

References

  1. Petlyuk, F.B.; Platonov, V.M.; Slavinski, D.M. Thermodynamically optimal methods for separating multicomponent mixtures. Int. Chem. Eng. 1965, 5, 309–317. [Google Scholar]
  2. Wright, R.O. Fractionation Apparatus. U.S. Patent US2471134, 17 July 1946. [Google Scholar]
  3. Kaibel, G. Distillation columns with vertical partitions. Chem. Eng. Technol. 1987, 10, 92–98. [Google Scholar] [CrossRef] [Scilit]
  4. Dejanovic, I.; Matijasevic, L.J.; Halvorsen, I.J. Designing four-product dividing wall columns for separation of a multicomponent aromatics mixture. Chem. Eng. Res. Des. 2011, 89, 1155–1167. [Google Scholar] [CrossRef] [Scilit]
  5. Si, Z.H.; Chen, H.; Cong, H.F. Energy, exergy, economic and environmental analysis of a novel steam-driven vapor recompression and organic Rankine cycle intensified dividing wall column. Sep. Purif. Technol. 2022, 295, 121285. [Google Scholar] [CrossRef] [Scilit]
  6. Ramapriya, G.M.; Tawarmalani, M.; Agrawal, R. Thermal coupling links to liquid-only transfer streams: A path for new dividing wall columns. AIChE J. 2014, 60, 2949–2961. [Google Scholar] [CrossRef] [Scilit]
  7. Feng, Z.M.; Wang, W.H.; Xu, D.; Rangaiah, G.P.; Dong, L.C. Dynamic controllability of temperature difference control for the operation of double liquid-only side-stream distillation. Comput. Chem. Eng. 2022, 164, 107870. [Google Scholar] [CrossRef] [Scilit]
  8. Song, Z.W.; Cui, W.; Wu, Y.Y.; Wu, B.; Chen, K.; Ji, L.J. Energy, exergy, economic, and environmental analysis of a novel liquid-only transfer dividing wall column with vapor recompression. Sep. Purif. Technol. 2024, 329, 125122. [Google Scholar] [CrossRef] [Scilit]
  9. Wu, Y.-Y.; Song, Z.-W.; Rao, J.-B.; Yao, Y.-X.; Wu, B.; Chen, K.; Ji, L.-J. Separation of ternary system 1,2-ethanediol + 1,3-propanediol + 1,4-butanediol by liquid-only transfer dividing wall column. Processes 2023, 11, 3150. [Google Scholar] [CrossRef] [Scilit]
  10. Cui, C.T.; Zhang, X.D.; Sun, J.S. Design and optimization of energy-efficient liquid-only side-stream distillation configurations using a stochastic algorithm. Chem. Eng. Res. Des. 2019, 145, 48–52. [Google Scholar] [CrossRef] [Scilit]
  11. Tututi-Avila, S.; Medina-Herrera, N.; Hahn, J.; Jiménez-Gutiérrez, A. Design of an energy-efficient side-stream extractive distillation system. Comput. Chem. Eng. 2017, 102, 17–25. [Google Scholar] [CrossRef] [Scilit]
  12. Zhang, Q.; Shi, P.; Hou, W.; Yang, S.; Zeng, A.; Ma, Y.; Yuan, X. Dynamic control analysis of an eco-efficient side-stream extractive distillation configuration. Sep. Purif. Technol. 2020, 239, 116525. [Google Scholar] [CrossRef] [Scilit]
  13. Ge, X.L.; Han, Y.C.; Yang, X.C.; Liu, B.T.; Liu, B.T. Optimal design, proportional-integral, and model predictive control of intensified process for formic acid production II: Reactive dividing wall column without uncontrollable vapor split. Ind. Eng. Chem. Res. 2021, 60, 1784–1798. [Google Scholar] [CrossRef] [Scilit]
  14. Duanmu, F.Y.; Sorensen, E. Optimal design of heat integrated reduced vapor transfer dividing wall columns. Comput. Aided Chem. Eng. 2022, 49, 175–180. [Google Scholar]
  15. Gutiérrez-Guerra, R.; Murrieta-Dueñas, R.; Cortez-González, J.; Segovia-Hernández, J.G.; Hernández, S.; Hernández-Aguirre, A. Design and optimization of heat-integrated distillation configurations with variable feed composition by using a Boltzmann-based estimation of distribution algorithm as optimizer. Chem. Eng. Res. Des. 2017, 124, 46–57. [Google Scholar] [CrossRef] [Scilit]
  16. Shahandeh, H.; Ivakpour, J.; Kasiri, N. Internal and external HIDiCs (heat integrated distillation columns) optimization by genetic algorithm. Energy 2014, 64, 875–886. [Google Scholar] [CrossRef] [Scilit]
  17. Qiu, P.; Huang, B.; Dai, Z.; Wang, F. Data-driven analysis and optimization of externally heat-integrated distillation columns (EHIDiC). Energy 2019, 189, 116177. [Google Scholar] [CrossRef] [Scilit]
  18. Rahman, R.K.; Ibrahim, S.; Raj, A. Multi-objective optimization of sulfur recovery units using a detailed reaction mechanism to reduce energy consumption and destruct feed contaminants. Comput. Chem. Eng. 2019, 128, 21–34. [Google Scholar] [CrossRef] [Scilit]
  19. Michailos, S.; Parker, D.; Webb, C. Design, sustainability analysis and multiobjective optimisation of ethanol production via syngas fermentation. Waste Biomass Valorization 2019, 10, 865–876. [Google Scholar] [CrossRef] [Scilit]
  20. Yang, X.L.; Ward, J.D. Extractive distillation optimization using simulated annealing and a process simulation automation server. Ind. Eng. Chem. Res. 2018, 57, 11050–11060. [Google Scholar] [CrossRef] [Scilit]
  21. Cui, C.; Sun, J. Rigorous design and simultaneous optimization of extractive distillation systems considering the effect of column pressures. Chem. Eng. Process Intensif. 2019, 139, 68–77. [Google Scholar] [CrossRef] [Scilit]
  22. Li, X.; Cui, C.; Li, H.; Gao, X. Process synthesis and simulation-based optimization of ethylbenzene/styrene separation using double-effect heat integration and self heat recuperation technology: A techno-economic analysis. Sep. Purif. Technol. 2019, 228, 115760. [Google Scholar] [CrossRef] [Scilit]
  23. Jana, A.K.; Mane, A. Heat pump assisted reactive distillation: Wide boiling mixture. AIChE J. 2011, 57, 3233–3237. [Google Scholar] [CrossRef] [Scilit]
  24. Shao, Y.Y.; Xiao, H.M.; Chen, B.M.; Huang, S.M.; Qin, F.G.F. Comparison and analysis of thermal efficiency and exergy efficiency in energy systems by case study. Energy Procedia 2018, 153, 161–168. [Google Scholar] [CrossRef] [Scilit]
  25. Seider, W.D.; Lewin, D.R.; Seader, J.D.; Widagdo, S.; Gani, R.; Ng, K.M. Product and Process Design Principles: Synthesis, Analysis, and Evaluation; John Wiley & Sons Inc.: New York, NY, USA, 2017. [Google Scholar]
  26. Douglas, J.M. Conceptual Design of Chemical Processes; McGraw-Hill: New York, NY, USA, 1988. [Google Scholar]
  27. Kiss, A.A. Advanced Distillation Technologies: Design, Control, and Applications; Wiley: Chichester, UK, 2013. [Google Scholar]
  28. Cui, C.T.; Li, X.G.; Guo, D.R.; Sun, J.S. Towards energy efficient styrene distillation scheme: From grassroots design to retrofit. Energy 2017, 134, 193–205. [Google Scholar] [CrossRef] [Scilit]
  29. Luyben, W.L. Distillation Design and Control Using Aspen Simulation; John Wiley & Sons: Hoboken, NJ, USA, 2006. [Google Scholar]
  30. Li, Q.; Feng, Z.M.; Rangaiah, G.P.; Dong, L.C. Process optimization of heat integrated extractive dividing-wall columns for energy-saving separation of CO2 and hydrocarbons. Ind. Eng. Chem. Res. 2020, 59, 11000–11011. [Google Scholar] [CrossRef] [Scilit]
  31. Sun, L.Y.; Wang, Q.Y.; Li, L.M.; Zhai, J.; Liu, Y.L. Design and control of extractive dividing wall column for separating benzene/cyclohexane mixtures. Ind. Eng. Chem. Res. 2014, 53, 8120–8131. [Google Scholar] [CrossRef] [Scilit]
  32. Wu, Y.C.; Hsu, P.H.C.; Chien, I.L. Critical assessment of the energy saving potential of an extractive dividing-wall column. Ind. Eng. Chem. Res. 2013, 52, 5384–5399. [Google Scholar] [CrossRef] [Scilit]
  33. Sun, L.Y.; Chang, X.W.; Qi, C.X.; Li, Q.S. Implementation of ethanol dehydration using dividing-wall heterogeneous azeotropic distillation column. Sep. Sci. Technol. 2011, 46, 1365–1375. [Google Scholar] [CrossRef] [Scilit]
  34. Sun, L.Y. Chemical Process Simulation Training: Aspen Plus Tutorial, 2nd ed.; Chemical Industry Press: Beijing, China, 2019. (In Chinese) [Google Scholar]
  35. Zhang, S.; Luo, Y.; Ma, Y.; Yuan, X. Simultaneous optimization of nonsharp distillation sequences and heat integration networks by simulated annealing algorithm. Energy 2018, 162, 1139–1157. [Google Scholar] [CrossRef] [Scilit]
  36. Storn, R.; Price, K. Differential evolution—a simple and efficient heuristic for global optimization over continuous spaces. J. Glob. Optim. 1997, 11, 341–359. [Google Scholar] [CrossRef] [Scilit]
  37. Qin, A.K.; Suganthan, P.N. Self-adaptive differential evolution algorithm for numerical optimization. In Proceedings of the 2005 IEEE Congress on Evolutionary Computation, Edinburgh, UK, 2–5 September 2005; IEEE: New York, NY, USA; pp. 1785–1791.
  38. Biegler, L.T. Nonlinear Programming: Concepts, Algorithms, and Applications to Chemical Processes; SIAM: Philadelphia, PA, USA, 2010. [Google Scholar]
  39. Qin, A.K.; Huang, V.L.; Suganthan, P.N. Differential evolution algorithm with strategy adaptation for global numerical optimization. IEEE Trans. Evol. Comput. 2009, 13, 398–417. [Google Scholar] [CrossRef] [Scilit]
  40. Luo, H.; Bildea, C.S.; Kiss, A.A. Novel heat-pump-assisted extractive distillation for bioethanol purification. Ind. Eng. Chem. Res. 2015, 54, 2208–2213. [Google Scholar] [CrossRef] [Scilit]
  41. Dhole, V.R.; Linnhoff, B. Distillation column targets. Comput. Chem. Eng. 1993, 17, 549–560. [Google Scholar] [CrossRef] [Scilit]
  42. Soares Pinto, F.; Zemp, R.; Jobson, M.; Smith, R. Thermodynamic optimisation of distillation columns. Chem. Eng. Sci. 2011, 66, 2920–2934. [Google Scholar] [CrossRef] [Scilit]
  43. Sun, L.Y. Chemical Process Simulation Training—Aspen Plus Tutorial; Chemical Industry Press: Beijing, China, 2017. (In Chinese) [Google Scholar]
Figure 1. Schematic diagrams of DWC configurations ((a) FTCDC (b) Wright (c) Kaibel).
Processes 14 01493 g001
Figure 2. Schematic diagram of the LDWC structure.
Processes 14 01493 g002
Figure 3. Schematic of LDWC parameters.
Processes 14 01493 g003
Figure 4. Schematic of POMX separation sequences.
Processes 14 01493 g004
Figure 5. Operational workflow of the Matlab-SaDE-Aspen Plus framework.
Processes 14 01493 g005
Figure 6. Equivalent structure of the four-component LDWC in Aspen Plus.
Processes 14 01493 g006
Figure 7. CGCC (S-H) of CR in the LDWC.
Processes 14 01493 g007
Figure 8. Structural diagrams: (a) IR-LDWC1 (b) IR-LDWC2.
Processes 14 01493 g008
Figure 9. IR-LDWC system optimization workflow.
Processes 14 01493 g009
Figure 10. IR-LDWC1 process flow diagram.
Processes 14 01493 g010
Figure 11. IR-LDWC2 process flow diagram.
Processes 14 01493 g011
Figure 12. Theoretical stages versus reflux ratio for each column. (a) stage 1; (b) stage 2; (c) stage 3.
Processes 14 01493 g012
Figure 13. CDS rigorous simulation data.
Processes 14 01493 g013
Figure 14. NF-Q curves for RAD1 through RAD3 in the CDS. (a) stage 1; (b) stage 2; (c) stage 3.
Processes 14 01493 g014
Figure 15. CDS sequentially optimized simulation data.
Processes 14 01493 g015
Figure 16. Generation count versus best TAC for the LDWC ((a) CL (b) CR).
Processes 14 01493 g016
Figure 17. LDWC optimization results.
Processes 14 01493 g017
Figure 18. Generation count versus best TAC for IR-LDWC ((a) IR-LDWC1 (b) IR-LDWC2).
Processes 14 01493 g018
Figure 19. IR-LDWC1 optimization results.
Processes 14 01493 g019
Figure 20. IR-LDWC2 optimization results.
Processes 14 01493 g020
Figure 21. Parameter versus TAC distributions for IR-LDWC1. (a) side stream stage; (b) side stream flow; (c) pre-temperature; (d) compression ratio.
Processes 14 01493 g021
Figure 22. Parameter versus TAC distributions for IR-LDWC2. (a) side stream stage; (b) side stream flow; (c) pre-temperature; (d) compression ratio.
Processes 14 01493 g022
Figure 23. Comparison of total energy consumption across processes.
Processes 14 01493 g023
Figure 24. Comparison of exergy efficiency across processes.
Processes 14 01493 g024
Figure 25. Comparison of TAC across processes.
Processes 14 01493 g025
Figure 26. Comparison of gaseous emissions across processes.
Processes 14 01493 g026
Table 1. Emission conversion coefficients.
Conversion Coefficient CO2 SO2 NOX
a (kg/kg) 2.493 0.075 0.0375
b (kg/kW·h) 0.997 0.030 0.015
Disclaimer/Publisher’s Note: The statements, opinions and data contained in all publications are solely those of the individual author(s) and contributor(s) and not of MDPI and/or the editor(s). MDPI and/or the editor(s) disclaim responsibility for any injury to people or property resulting from any ideas, methods, instructions or products referred to in the content.