Article

Mechanisms and Performance of Nanoemulsion-Induced Pressure Reduction and Enhanced Injection in Ultra-Low Permeability Reservoirs


1
National Engineering Laboratory for Exploration and Development of Low-Permeability Oil & Gas Fields, Xi’an 710018, China
2
Oil and Gas Technology Research Institute, PetroChina Changqing Oilfield Company, Xi’an 710018, China
3
College of Petroleum Engineering, Yangtze University, Wuhan 430100, China
4
College of Petroleum Engineering, China University of Petroleum (East China), Qingdao 266580, China
*
Author to whom correspondence should be addressed.
Processes 2026, 14(9), 1463; https://doi.org/10.3390/pr14091463
Submission received: 6 March 2026 / Revised: 23 April 2026 / Accepted: 27 April 2026 / Published: 30 April 2026
(This article belongs to the Special Issue Advanced Strategies in Enhanced Oil Recovery: Theory and Technology)

Abstract

To solve the problems of high injection pressure and low water injection in an ultra-low-permeability reservoir, nanoemulsion was injected to reduce the surface interfacial tension, change the wettability, and achieve the purpose of depressurization. In this paper, the surface and interfacial tension, wettability properties, and particle size distribution characterization of nanoemulsion were determined, and the performance of nanoemulsion was evaluated by laboratory experiments such as core displacement. At the same time, the depressurize and augmented injection mechanism of the nanoemulsion was studied through a scanning electron microscope. The experiment shows that the nanoemulsion system has good compatibility with brine. With the increase in temperature, the surface and interfacial tension does not change, and there is no precipitation. And the system can reduce the oil–water interfacial tension to about 1 mN·m−1 under the best conditions. By measuring the wettability angle of nanoemulsion at the concentration of 0.1% to 0.5%, which can adjust the wettability of the rock surface, the hydrophilicity is weakened. The depressurization performance of nanoemulsion under different injection rates, concentrations, and slug sizes was also compared through core displacement experiments, to provide reasonable experimental support for field operations. In the most reasonable case, the depressurization rate after using nanoemulsion can reach 16.78%.

1. Introduction

With the continuous exploration and in-depth development of medium- and high-permeability oilfields in China, the development of low-permeability oil reservoirs is attracting more and more attention and is of vital importance to the future oil field development [1,2,3,4,5]. With the advancements in horizontal drilling and hydraulic fracturing technologies, the exploitation of low-permeability reservoirs have come into a new stage [6]. However, due to the insufficient natural formation energy and rapid formation pressure decrease, when the reservoir is depleted after primary production, the primary oil recovery remains very low and is less than 15% of the original oil in place (OOIP) [7]. Thus, water flooding technology as one of the secondary recovery methods was applied to supplement formation energy to improve oil recovery. Due to the characteristics of low porosity and permeability in low-permeability reservoirs, there exist problems of high water injection pressure and low water absorption capacity. If the formation pressure is not supplemented timely, the oil production will be seriously affected [8,9,10]. To solve the problems, different depressurized and augmented injection methods including acidizing and chemical depressurized treatments were proposed. For acidizing treatment, there exist some problems as follows: (1) The amount of acid used in acidizing treatment is high, and the cost is high. (2) The reservoir pollution caused by the acid and the corrosion of the wellbore string is also significant (3) The validity period of acidizing treatment is short [11,12,13]. Thus, the chemical-modified augmented injection method is attracting increasing attention [14]. Surfactants and nanoparticles as common chemical-modified agents are usually used to depressurize and augment injection [15,16,17,18].
Surfactants are often used in low-permeability reservoirs because of their special structure, excellent interfacial activity, simple construction, strong adaptability, low cost, and good effect of reducing pressure and increasing injection. The surfactants can be divided into five types: cationic surfactant, anionic surfactant, nonionic surfactant, and amphoteric surfactant [19,20,21]. The depressurized and augmented injection mechanism of surfactants is as follows: (1) Reduce the oil–water interfacial tension and change the wettability of rock, which can reduce the adhesion work and make the oil droplets easier to peel off the surface [22,23,24,25,26,27]. (2) Improve the oil–water seepage characteristics, and increase the water phase permeability, to reduce the injection pressure [28,29,30].
For example, in Yan Chang Oilfield, the depressurized and augmented injection system includes non-ionic surfactant SNY-2 and petroleum sulfonate surfactant JW-1 as the main agent and organic alcohol S-1 as the additive agent, which can reduce the oil–water interfacial tension to 10−3 mN·m−1. Moreover, the contact angle of distilled water on the core surface can be reduced by 50° to change the wettability of the rock surface, and finally, the depressurization rate in the core displacement experiment can reach more than 45% [31,32,33].
Due to other unique small-size effects, nanoparticles have a special impact on the oil-water interface and have great applications in enhanced oil recovery [34,35]. Extensive experimental studies have been conducted on the depressurization and injection technology of nanoparticles [36]. Hydrophobic nanoparticles can be firmly adsorbed on the surface of rock pores to form a hydrophobic particle adsorption layer, which replaces the water film on the rock surface, changes the wettability of rock pore surface, reduces the oil–water interfacial tension, and avoids the hydration expansion of clay, which can solve the problem of high injection pressure in low-permeability reservoirs effectively [37]. For example, in 2012, a vertical well in the San Juan Basin of the United States was damaged by asphaltene, and its production decreased from 4.77 m3/d. The acidizing treatment was not effective, and then acidification technology combined with a nanoparticle-dispersing liquid system was used. The wedge structure, interfacial tension, and wettability alteration generated by nanoparticles successfully restored the oil well production to 19.10 m3/d [38]. In June 2019, the SiO2 nanoparticle was successfully applied in a low-injection and low-efficiency well LD2-4-B1in the Bohai low-permeability reservoir. Before treatment, the actual injection volume was 30 m3/d, which is far below the injection requirements of the reservoir block. After the treatment of the nano-SiO2 system in the well, the injection pressure decreased significantly from 15.6 MPa to 5.4 MPa before the treatment, and the injection water increased from 30 m3/d to 100 m3/d, achieving a good application effect. Field results show that the nano-SiO2 system can effectively reduce injection pressure and increase injection volume in offshore oil fields [39].
Thus, according to the characteristics of Chang 8 low-permeability reservoir, a novel nanoemulsion provided by Changqing Oilfield was used as a depressurized and augmented injection agent to settle the problem of low injection ability in a low-permeability reservoir. However, the depressurized performance and mechanism were not systematically investigated. Therefore, in this study, the performance of the nanoemulsion including the particle size distribution, compatibility with brine, interfacial tension, and wettability performance was evaluated. Then the depressurization and augmented injection performance were studied by conducting the two-phase core displacement experiment. Finally, the distribution of the nanoemulsion in the porous medium before and after the injection was studied by scanning electron microscopy. Then the morphology of nanoemulsion in porous media at different positions was observed, revealing the depressurized and augmented injection mechanism of the nanoemulsion injection agent. Through the study of the performance and mechanism of the nanoemulsion, we can further understand and lay a good foundation for optimization of depressurized and augmented injection used in a low-permeability reservoirs of target oilfields. Therefore, it is of great significance for the practical application of the nanoemulsion in the low-permeability reservoir.

2. Experimental Section

2.1. Materials

The nanoemulsion used as a depressurization and augmented injection agent in this study was provided by Changqing oilfield (Xi’an, China). The core used for the experiment was a Chang 8 natural outcrop core, as shown in Table 1. The water used for the experiment was simulated brine, as shown in Table 2. Sodium chloride, potassium chloride, calcium chloride, magnesium chloride hexahydrate, or anhydrous magnesium chloride and sodium bicarbonate are all analytically pure for preparing brine with different salinity. The experimental oil was Chang 8 formation simulation oil: degassed crude oil and kerosene were prepared in a ratio of 1:3.5.

2.2. Experimental Methods

2.2.1. Determination of Compatibility with Brine and Nanoemulsion

Different types of nanoemulsion with the same 0.3% concentration were prepared by using simulated brine. Then the nanoemulsions were aged under different temperature conditions to observe whether the phenomenon of precipitation or flocculation or turbidity occurred. If the solution was clear without change, it indicated that the compatibility with brine and nanoemulsion was good.

2.2.2. Determination of Particle Size Distribution of Nanoemulsion

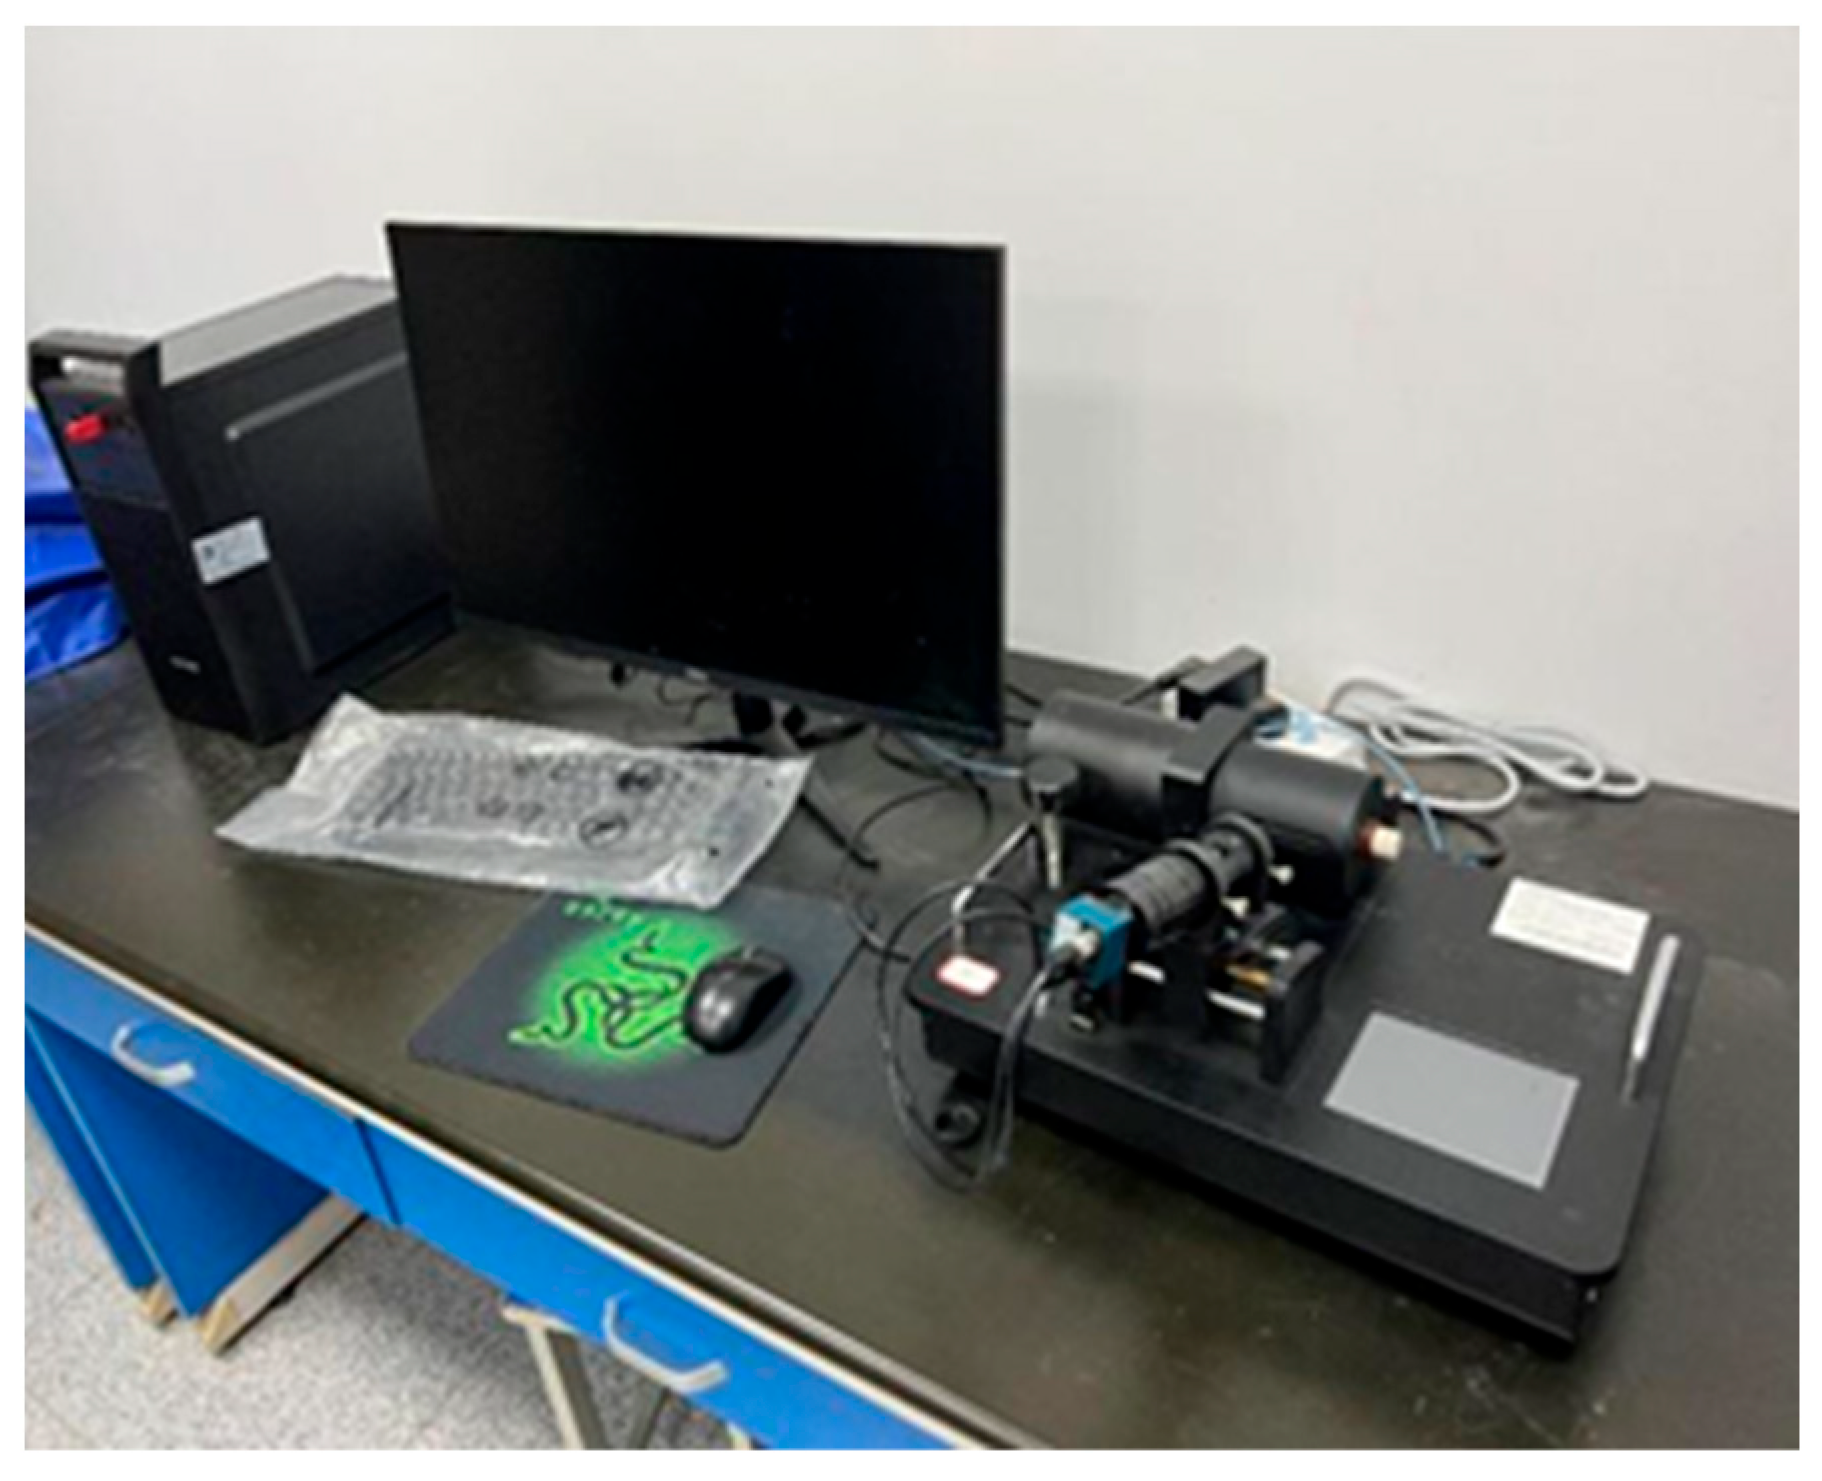
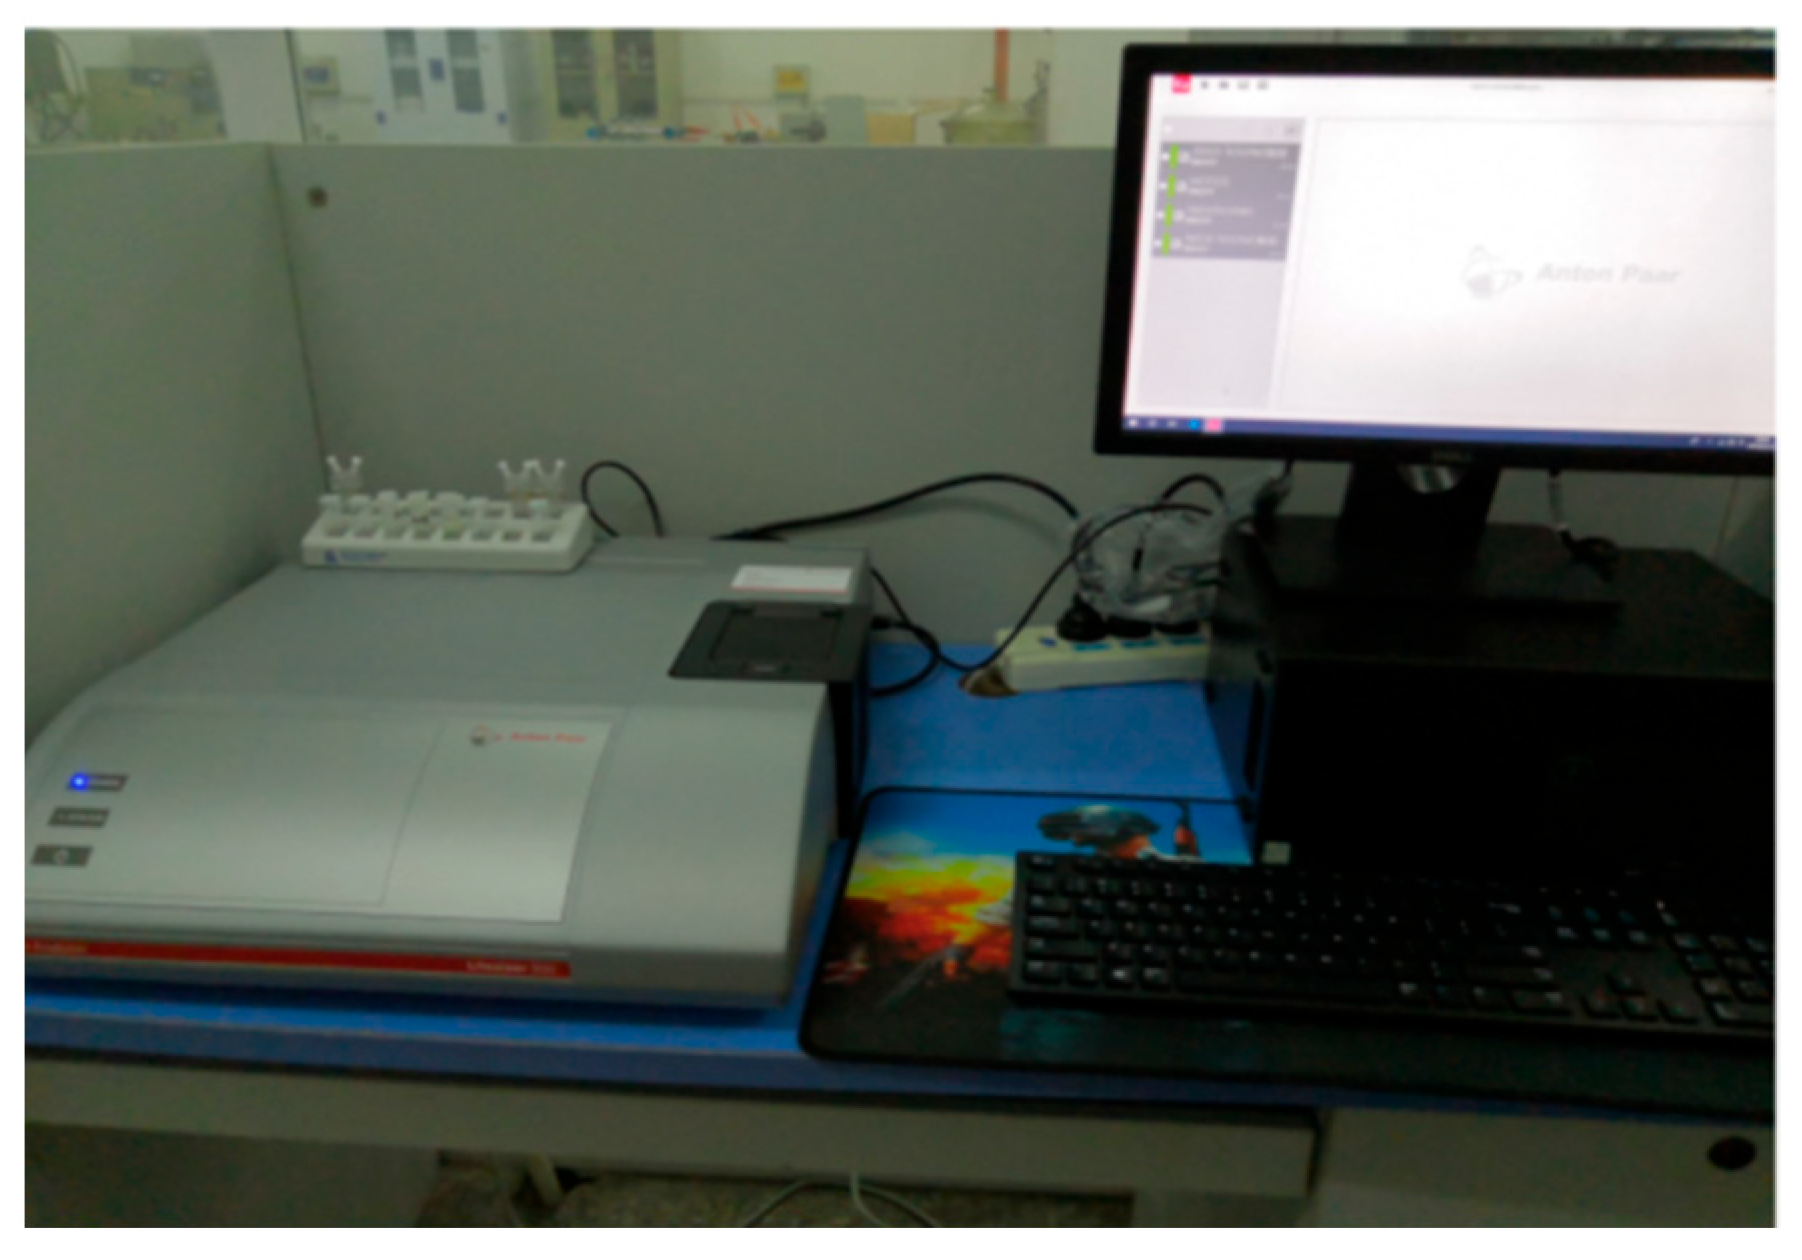
The particle size of the nanoemulsion was measured by dynamic light scattering using an Nanoparticle size analyzer (Dandong, China). The sample was diluted with deionized water, filtered through a 0.45 μm membrane, and transferred to a cuvette without bubbles. Measurements were performed at 25 °C in backscattering mode (173°, 658 nm laser). The correlation function was analyzed using the cumulants method to obtain the z-average diameter and PDI, while the size distribution was derived via the NNLS algorithm. Each sample was measured in triplicate, and the results are presented as the intensity-weighted size distribution in Figure 1.

2.2.3. Surface/Interfacial Tension Measurement

The Texas-500C interfacial tensiometer (Austin, TX, USA) was used, as shown in Figure 2, to measure the oil–water interfacial tension using the spinning drop method. The rotational speed was set to 6000 r/min, and the measurement temperature was maintained at 60 °C. The basic principle of the spinning drop method is as follows: the sample tube is first filled with the high-density phase (surfactant solution), after which a drop of the low-density phase (crude oil) is injected into it. Driven by the motor, the sample tube rotates at high speed. Under the action of centrifugal force, the crude oil droplet is positioned along the central axis of the tube and undergoes elongational deformation, gradually forming a stable oil column.
The diameter of the oil column is closely related to the oil–water interfacial tension. Under the same experimental conditions, a smaller oil column diameter indicates a lower oil–water interfacial tension. The specific experimental procedure is as follows:
(1)
Inject the surfactant solution into the sample tube using a syringe. Then use a microsyringe to inject 4–8 μL of oil sample and quickly withdraw the needle, leaving the oil droplet in the middle of the sample tube.
(2)
Turn on the power supply and adjust the required temperature and rotational speed.
(3)
Observe and measure the diameter of the oil column using a microscope. If the length of the oil column is less than four times its diameter, the length should also be recorded.
(4)
Record the readings at regular time intervals until three consecutive measurements fall within ±0.001 cm, at which point the measurement is completed.
(5)
Use a density bottle to measure the densities of the oil sample and the imbibition solution at the required temperature, and use a refractometer to measure the refractive index of the water sample. Substitute the measured values into the corresponding equations to calculate the interfacial tension.
γ = 1.2336 Δ ρ Y / n 3 / P 2
where γ is oil–water interfacial tension, mN/m; P is reciprocal of rotational speed, s/r; Z is oil column length, 10−4 m; Y is oil column diameter, 10−4 m; Δρ is density difference between oil and water phases, g/cm3; n is refractive index of the water phase; and f(Z/Y) is the correction factor.

2.2.4. Wettability Measurement

Quartz sheets or core slices are used to simulate the surface of the sandstone. The contact angle at the perimeter of the oil–water–solid circumference was based on the lying drop method, thus characterizing the wettability of a solid surface. A Kruss oil–water contact angle measuring instrument was used to measure the contact angle, as shown in the figure. The specific measurement process is as follows:
(1)
Before the contact angle measurement, clean the fresh quartz sheet obtained with chromic acid lotion, and then wash it with distilled water and dry it for reserve use.
(2)
The quartz tablet was immersed in the imbibition solution, and the quartz tablet was fixed in the container, and then a drop of oil about 1.0 μL was injected into the lower surface of the quartz tablet with an elbow syringe. Four drops of oil were injected into the lower surface of the quartz tablet in the experiment to obtain the average value of the contact angle. Due to the existence of wetting lag, the oil drops were placed under the quartz for about 30 min during the experiment, and then the final morphology of the oil drops was photographed by a high-resolution camera.
(3)
At the end of the experiment, the contact angle was calculated by using relevant software.

2.2.5. Depressurization and Augmented Injection Property Evaluation

A two-phase core displacement experiment is used to evaluate the depressurization performance of nanoemulsion in the oil-bearing core. In the core displacement experiment, the depressurization rate of injection pressure before and after injection of the nanoemulsion is the main evaluation index. The formula for calculating the depressurization rate of injection pressure is
S = (P1 − P2)/P1
where P1 is the stable core initial water drive stable pressure, and P2 is the core subsequent water drive stable pressure.
The specific experimental process is as follows:
(1)
Cores were saturated with a crude oil core and aged. The cores were vacuumed and saturated with simulated formation brine. Then the pore volume and porosity of the core were calculated according to the difference between wet weight and the dry weight of the core. At 65 °C, the core permeability is measured at a flow rate of 0.010 mL·min−1, the simulated crude oil was injected in the core at a flow rate of 0.010 mL·min−1 until the oil is completely produced, and the irreducible water saturation and original oil saturation are calculated. Then both ends of the core holder were closed, the core holder was placed in a 65 °C oven for aging for 48 h, and the oil displacement experiment was carried out.
(2)
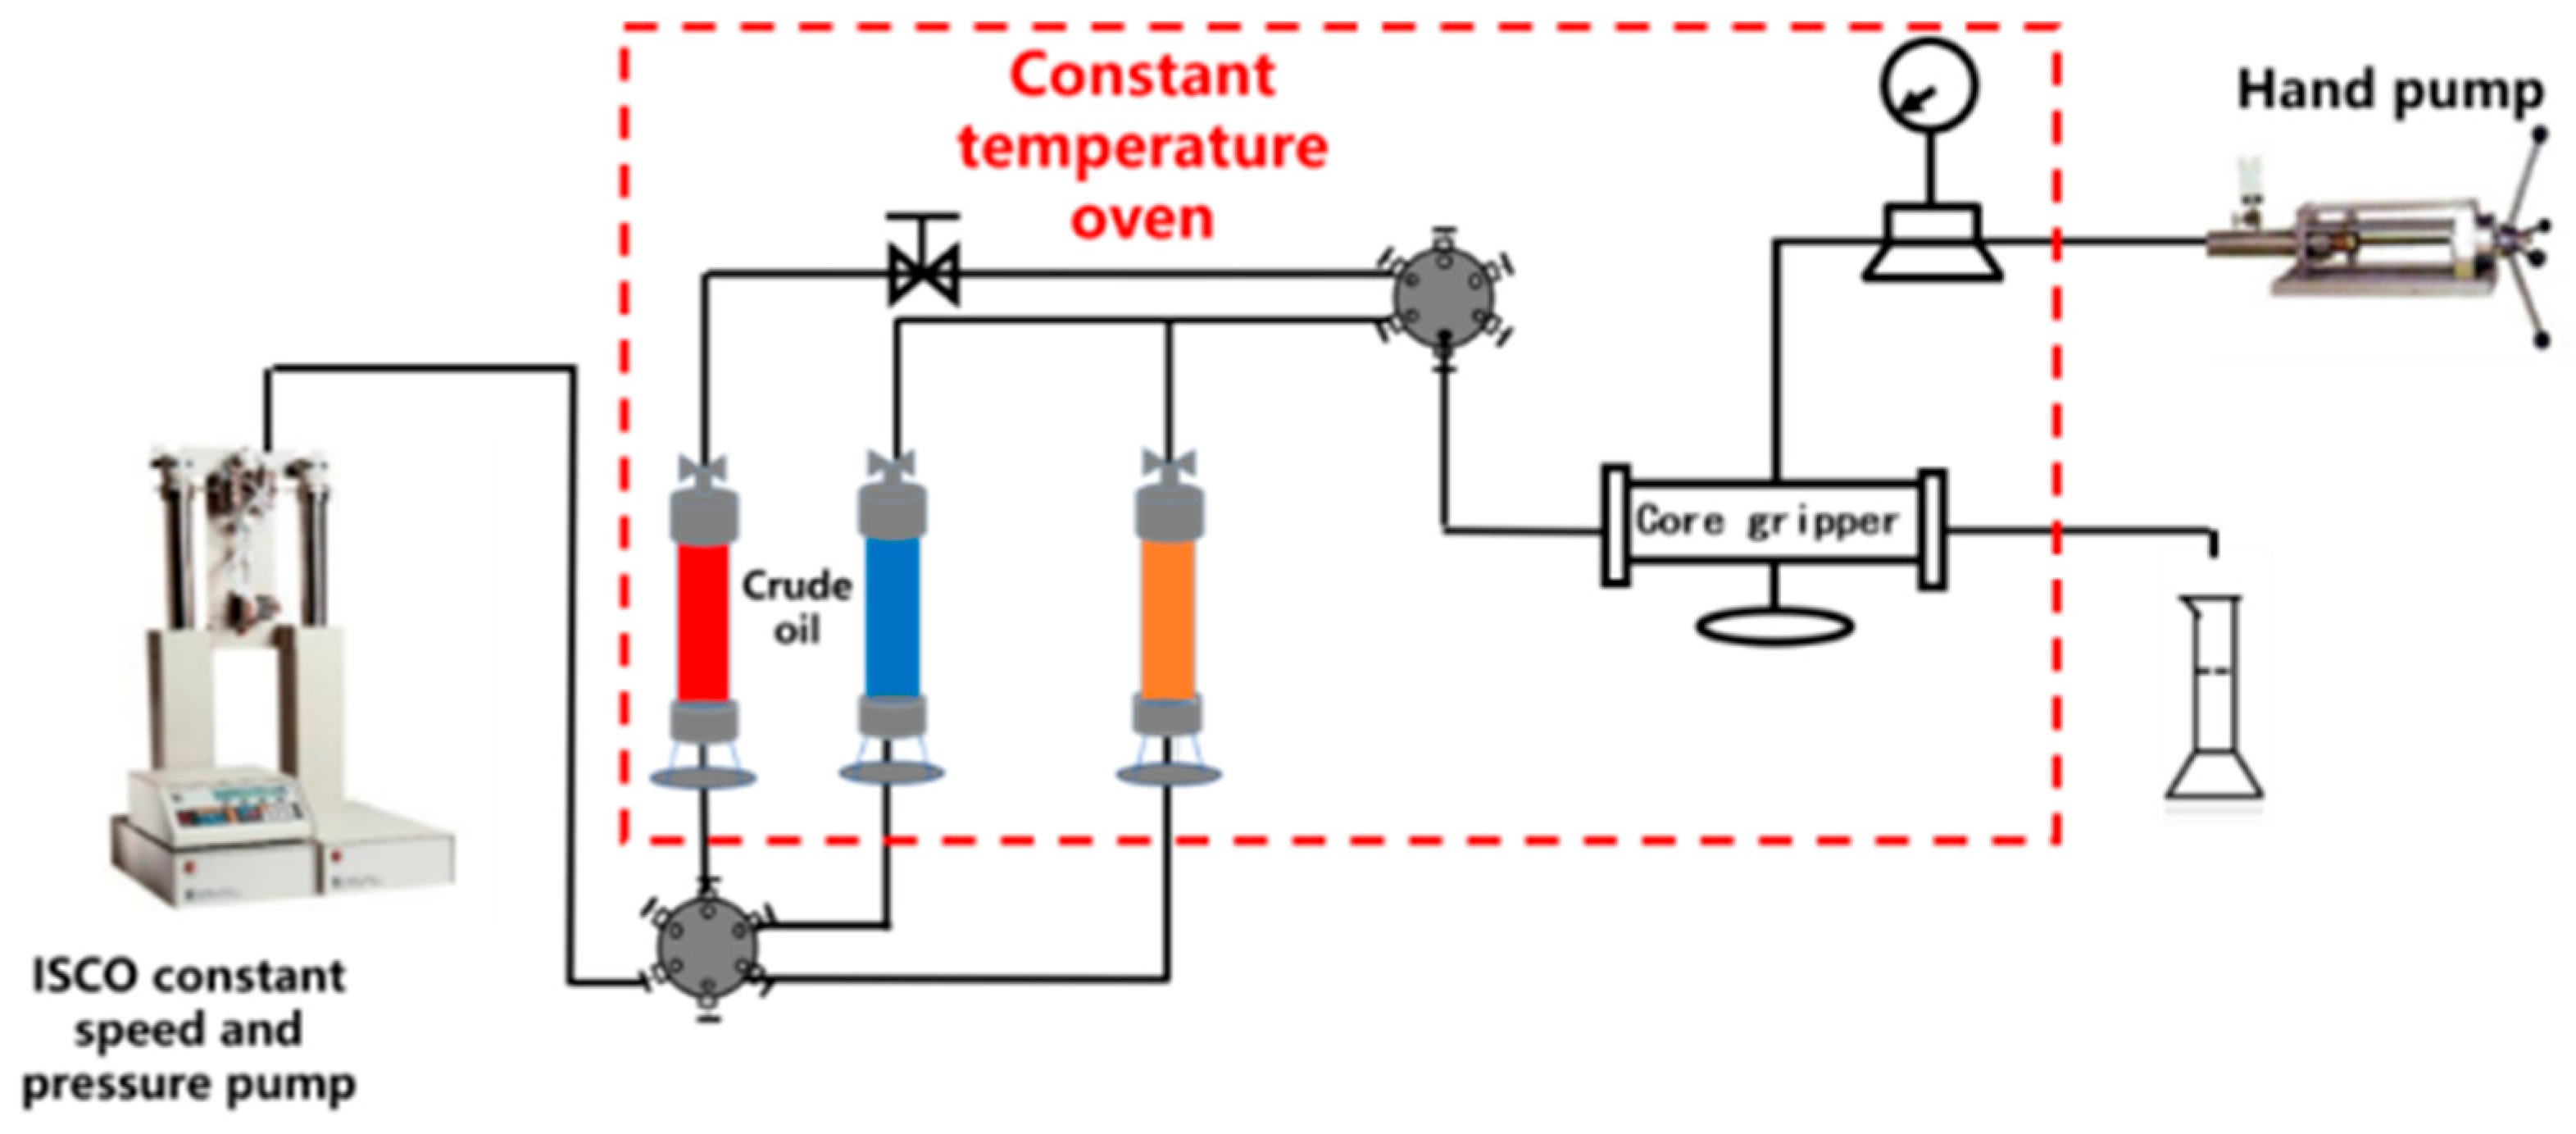
Water flooding was conducted at the flow rate of 0.1 mL·min−1, until the water drives no oil is produced and the pressure is stable, recorded as the initial water drive. Then inject a certain amount of micro nanoemulsion for surfactant displacement and then shut the well for 12 h. Then turn the water drive value to a stable displacement pressure and record the displacement pressure as the subsequent water drive pressure. (The experimental setup is shown in Figure 3).

2.2.6. SEM Observation of Nanoemulsion Adsorption on the Core Surface

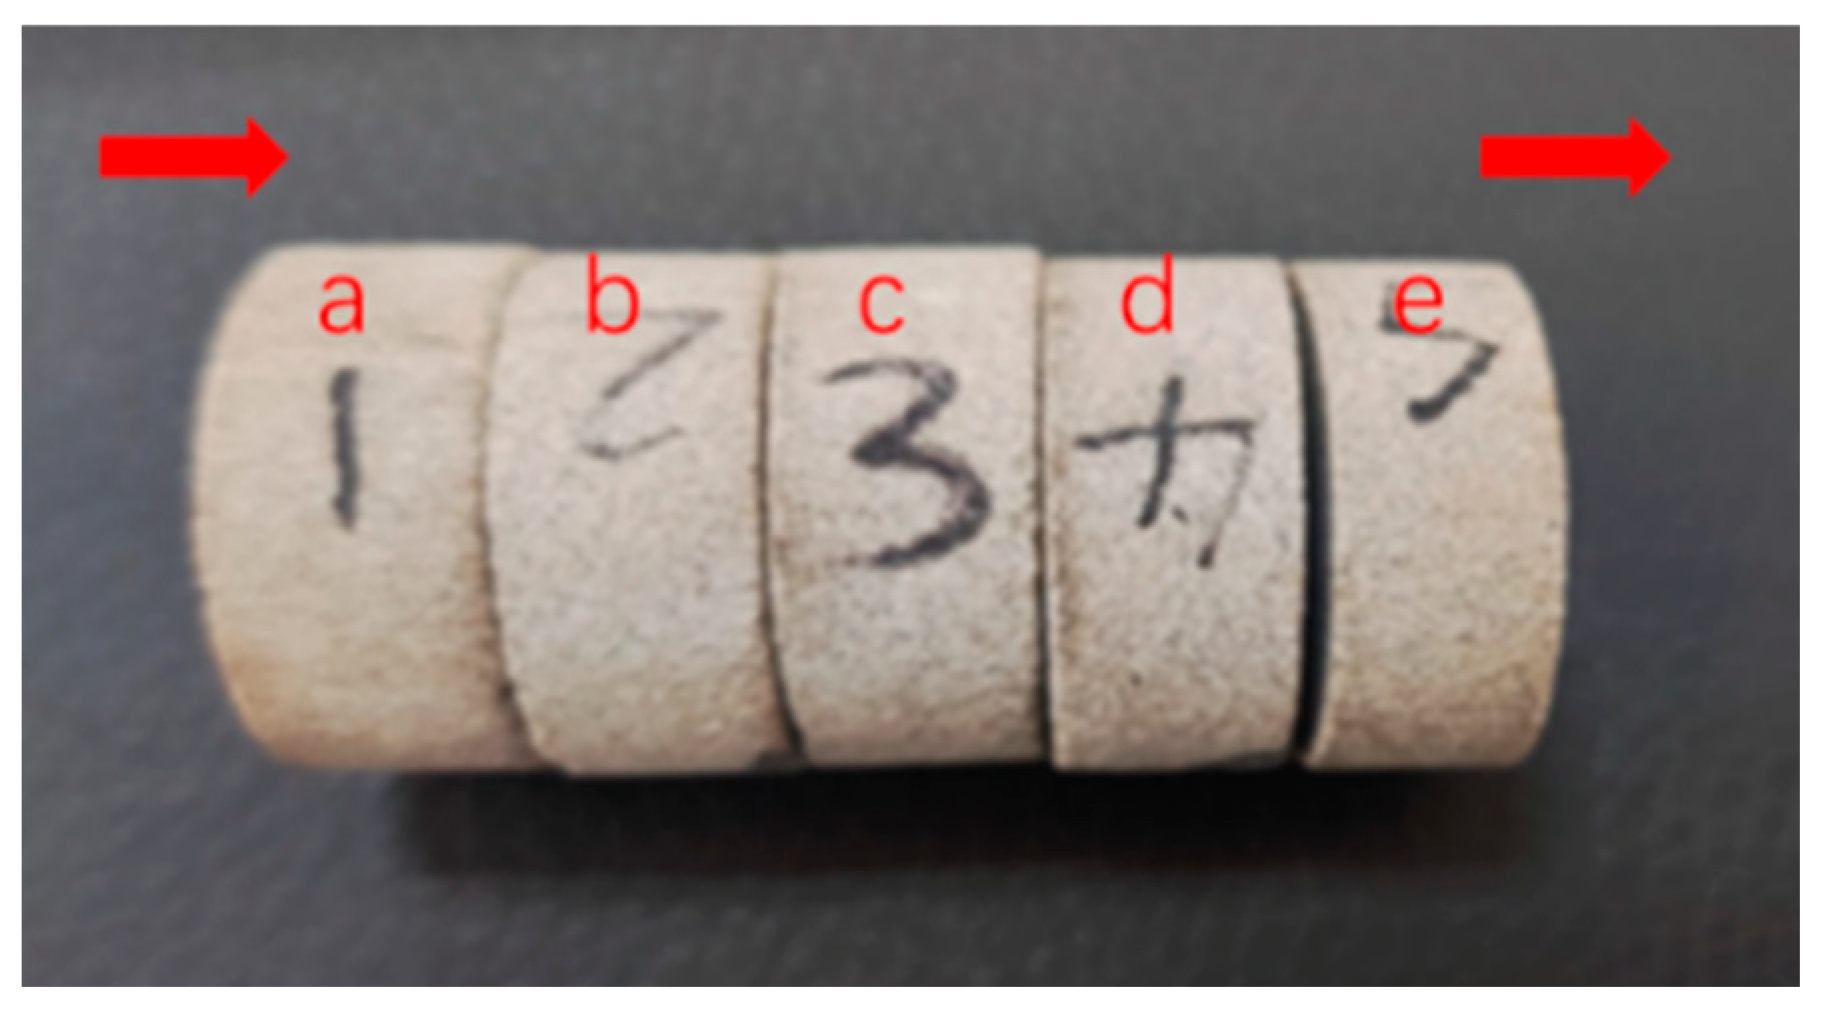
To reveal the depressurized and augmented injection mechanism, the nanoemulsion adsorption on the core surface and its surface morphology was observed by a scanning electron microscope. The experimental procedure was as follows: The core was saturated with brine and then different pore volume of nanoemulsion was injected into the core. After the nanoemulsion was adsorbed on the core surface, the core was cut into five pieces at different locations. Then take a small piece of core adsorbent and spray gold on the surface. Use a UK-4800 scanning electron microscope (Tokyo, Japan) to scan the surface and observe the adsorption of nanoemulsion.

3. Results and Discussion

3.1. Performance Evaluation of Nanoemulsion

Firstly, through the compatibility test of the nanoemulsion with brine and the measurement of the particle size distribution of the nanoemulsion in the core, we can judge whether the nanoemulsion will be blocked due to precipitation and particle size during the injection.
At the same time, because surfactants can reduce the interfacial tension between oil and water, and can modify the surface of hydrophilic rocks to be hydrophilic or neutral, it can reduce the flow resistance of fluids in rock pores and channels, thereby achieving the goal of depressurization in low-permeability reservoirs. Therefore, for the performance evaluation of the nanoemulsion, the depressurization and augmented injection performance of the nanoemulsion are mainly evaluated by measuring its interfacial tension with oil at different concentrations and the contact angle between the modified core slice with oil.

3.1.1. Evaluation of Compatibility with Brine

According to the salinity of the target block, the brine was simulated, and nanoemulsions with different concentrations were prepared. After standing for 24 h at the temperature of 30 °C and 65 °C, the precipitation or flocculation turbidity phenomenon was observed. If the solution was clear and there was no change, it indicated that the emulsion had good compatibility with brine. Measure the turbidity of the nanoemulsion system at 65 °C at different standing times using a turbidimeter, and analyze the trend of turbidity change over time to evaluate its stability. Before measurement, calibrate the instrument with standard turbidity solution and periodically check the calibration during the measurement.
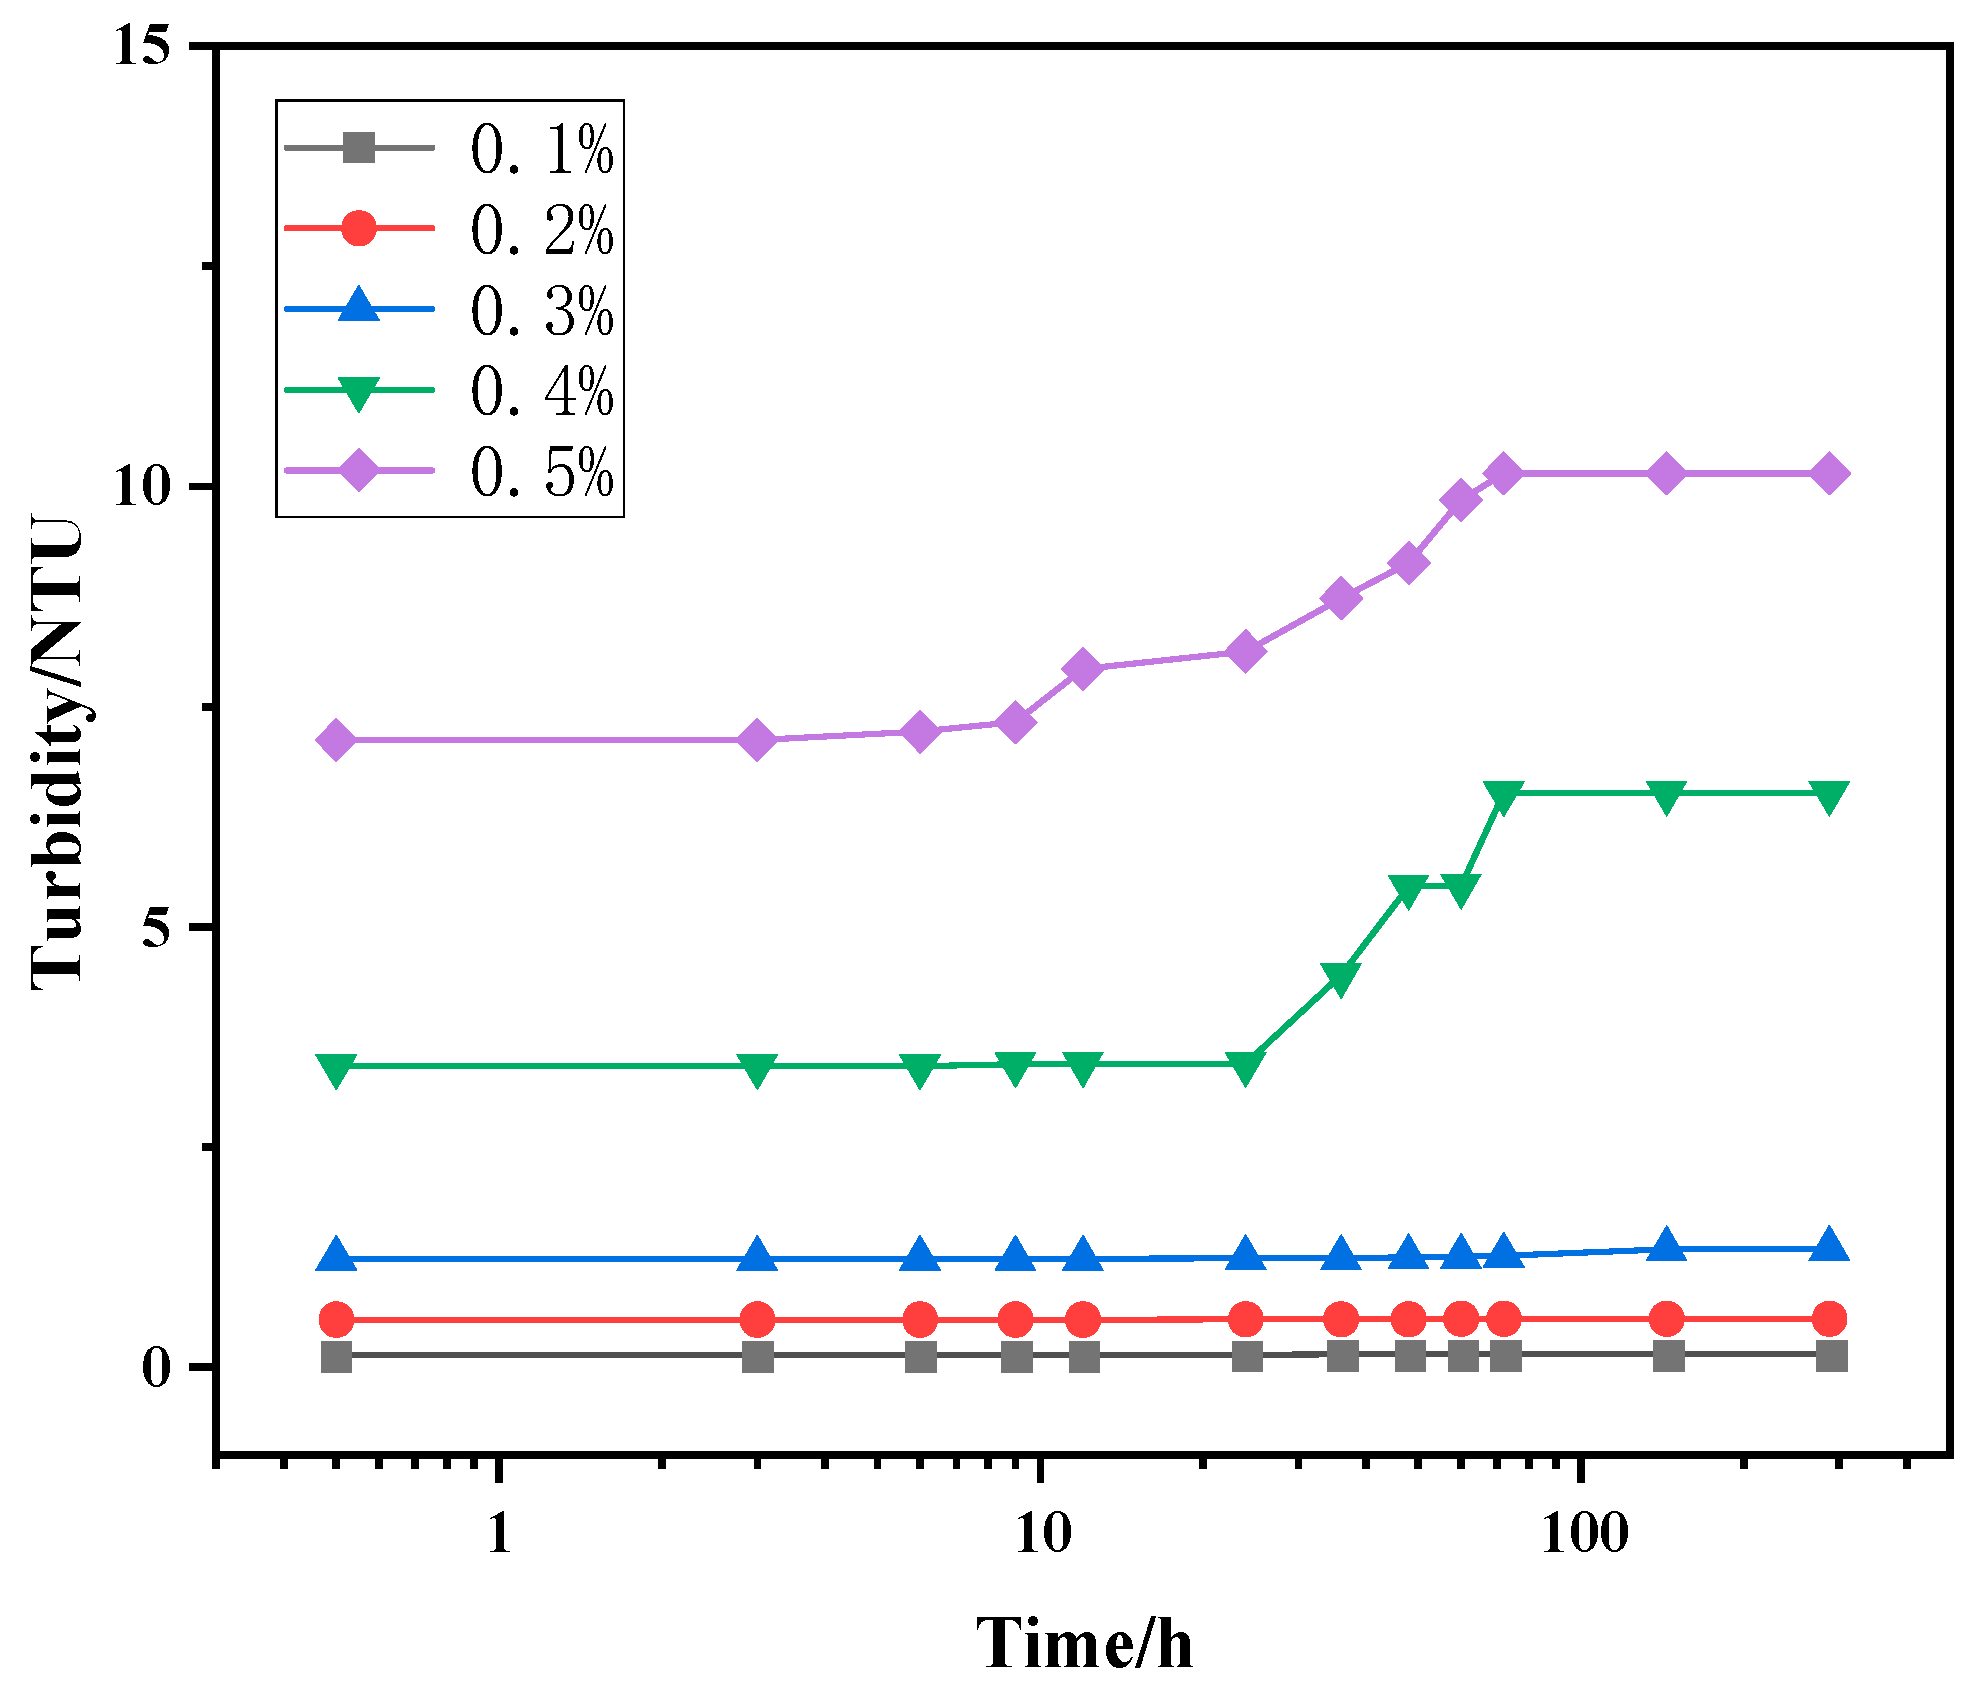
As shown in Table 3, the above compatibility experiment results show that under the temperature of 30 °C and 65 °C, the nanoemulsion with different concentrations has good compatibility with brine in a block, and no turbidity or precipitation phenomenon occurs. Figure 4 shows the turbidity change curve of the nanoemulsion system over time. In simulated formation water, after a standing time of 100 h, only the nanoemulsion systems with mass fractions of 0.4% and 0.5% exhibited slight turbidity, with a minor increase in turbidity as the standing time extended. The other nanoemulsion systems remained clear and transparent, with almost no change in turbidity over time, all maintaining values below 5 NTU. This indicates that the nanoemulsion system demonstrates good stability in simulated formation water and also suggests its excellent compatibility with the formation water.

3.1.2. Particle Size Distribution of Nanoemulsion Characterization

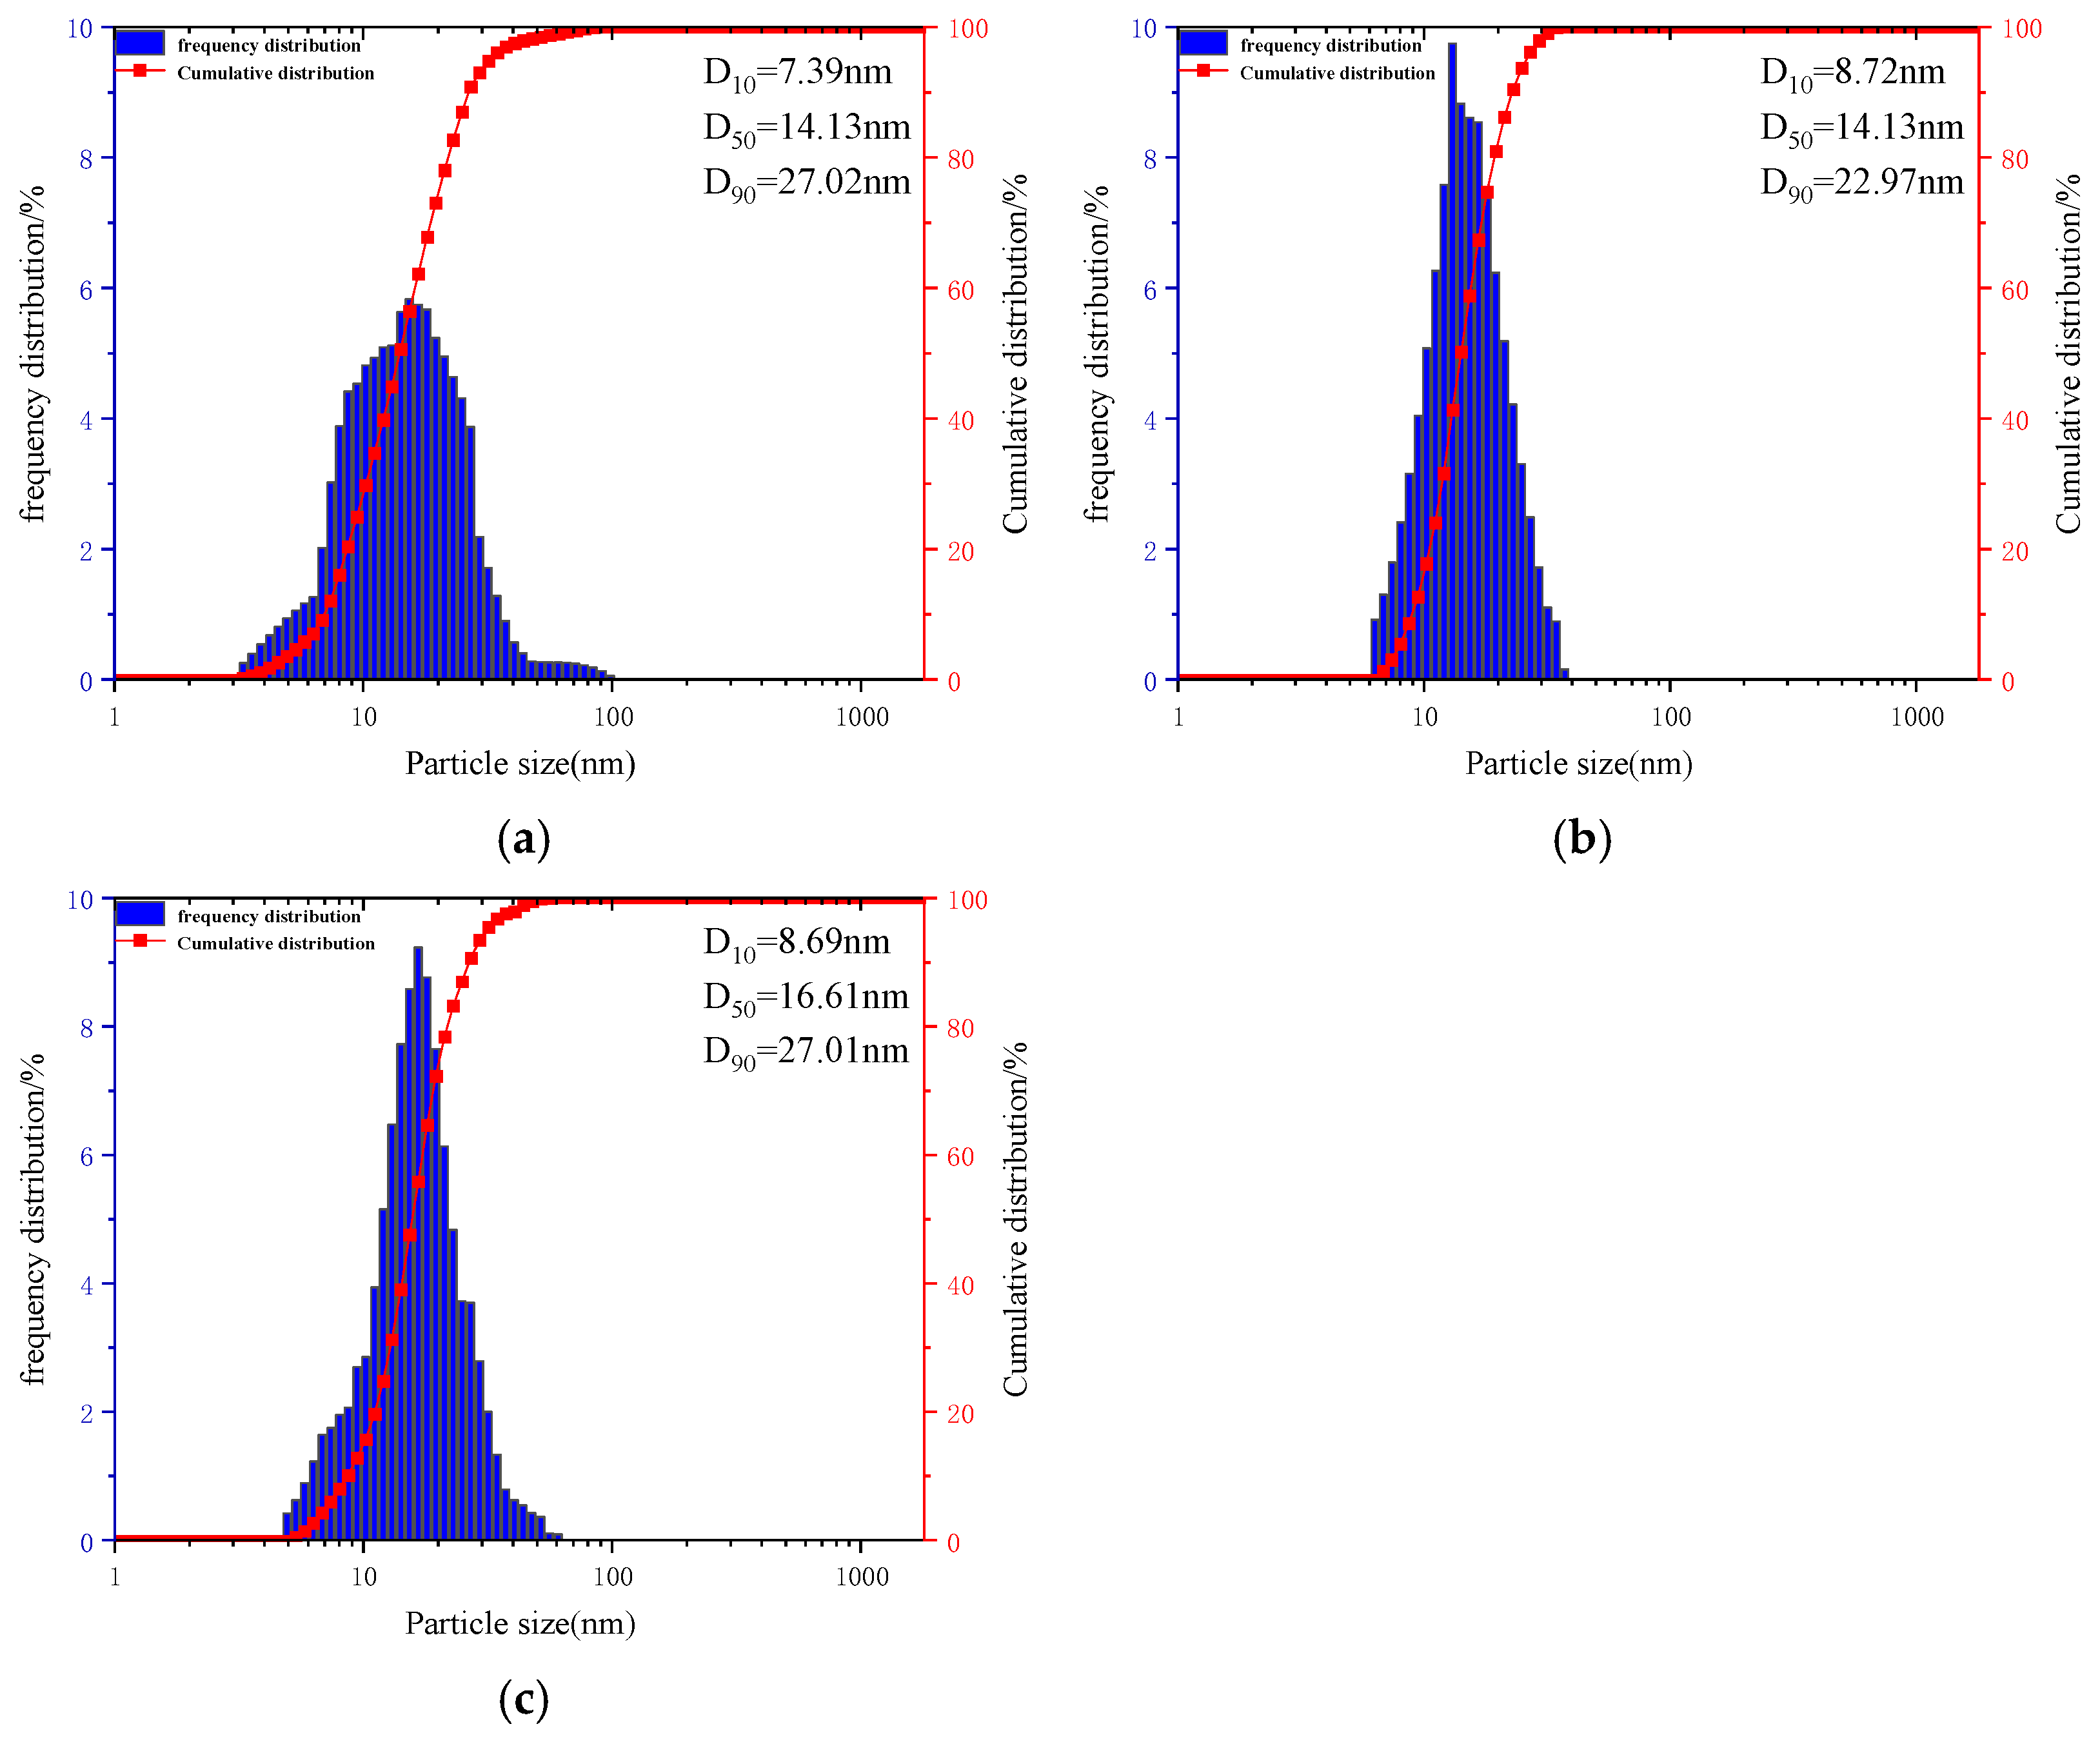
A nano size analyzer (Anton Paar Litesizer 500) was used to measure the particle size distribution of the nanoemulsion by the dynamic light scattering method at 65 °C. As verified earlier, the nanoemulsion exhibits good compatibility with brine; therefore, three nanoemulsion systems with a mass concentration of 0.3% were prepared using brine for the repeated measurement. The particle size results of three nanoemulsion systems are shown in Figure 5.
It can be seen from Figure 5 and Table 4 that the particle size distribution of the nanoemulsion presents a bimodal distribution, with the particle size mainly distributed in the range of 3.29–98.74 nm, and the median particle size D50 is 14.13 nm. To minimize experimental error, three identical samples were prepared and measured under the same conditions. According to the particle size distribution experiment, the particles of the nanoemulsion will not cause core pore throat blockage.

3.1.3. Evaluation of Interfacial Tension Properties

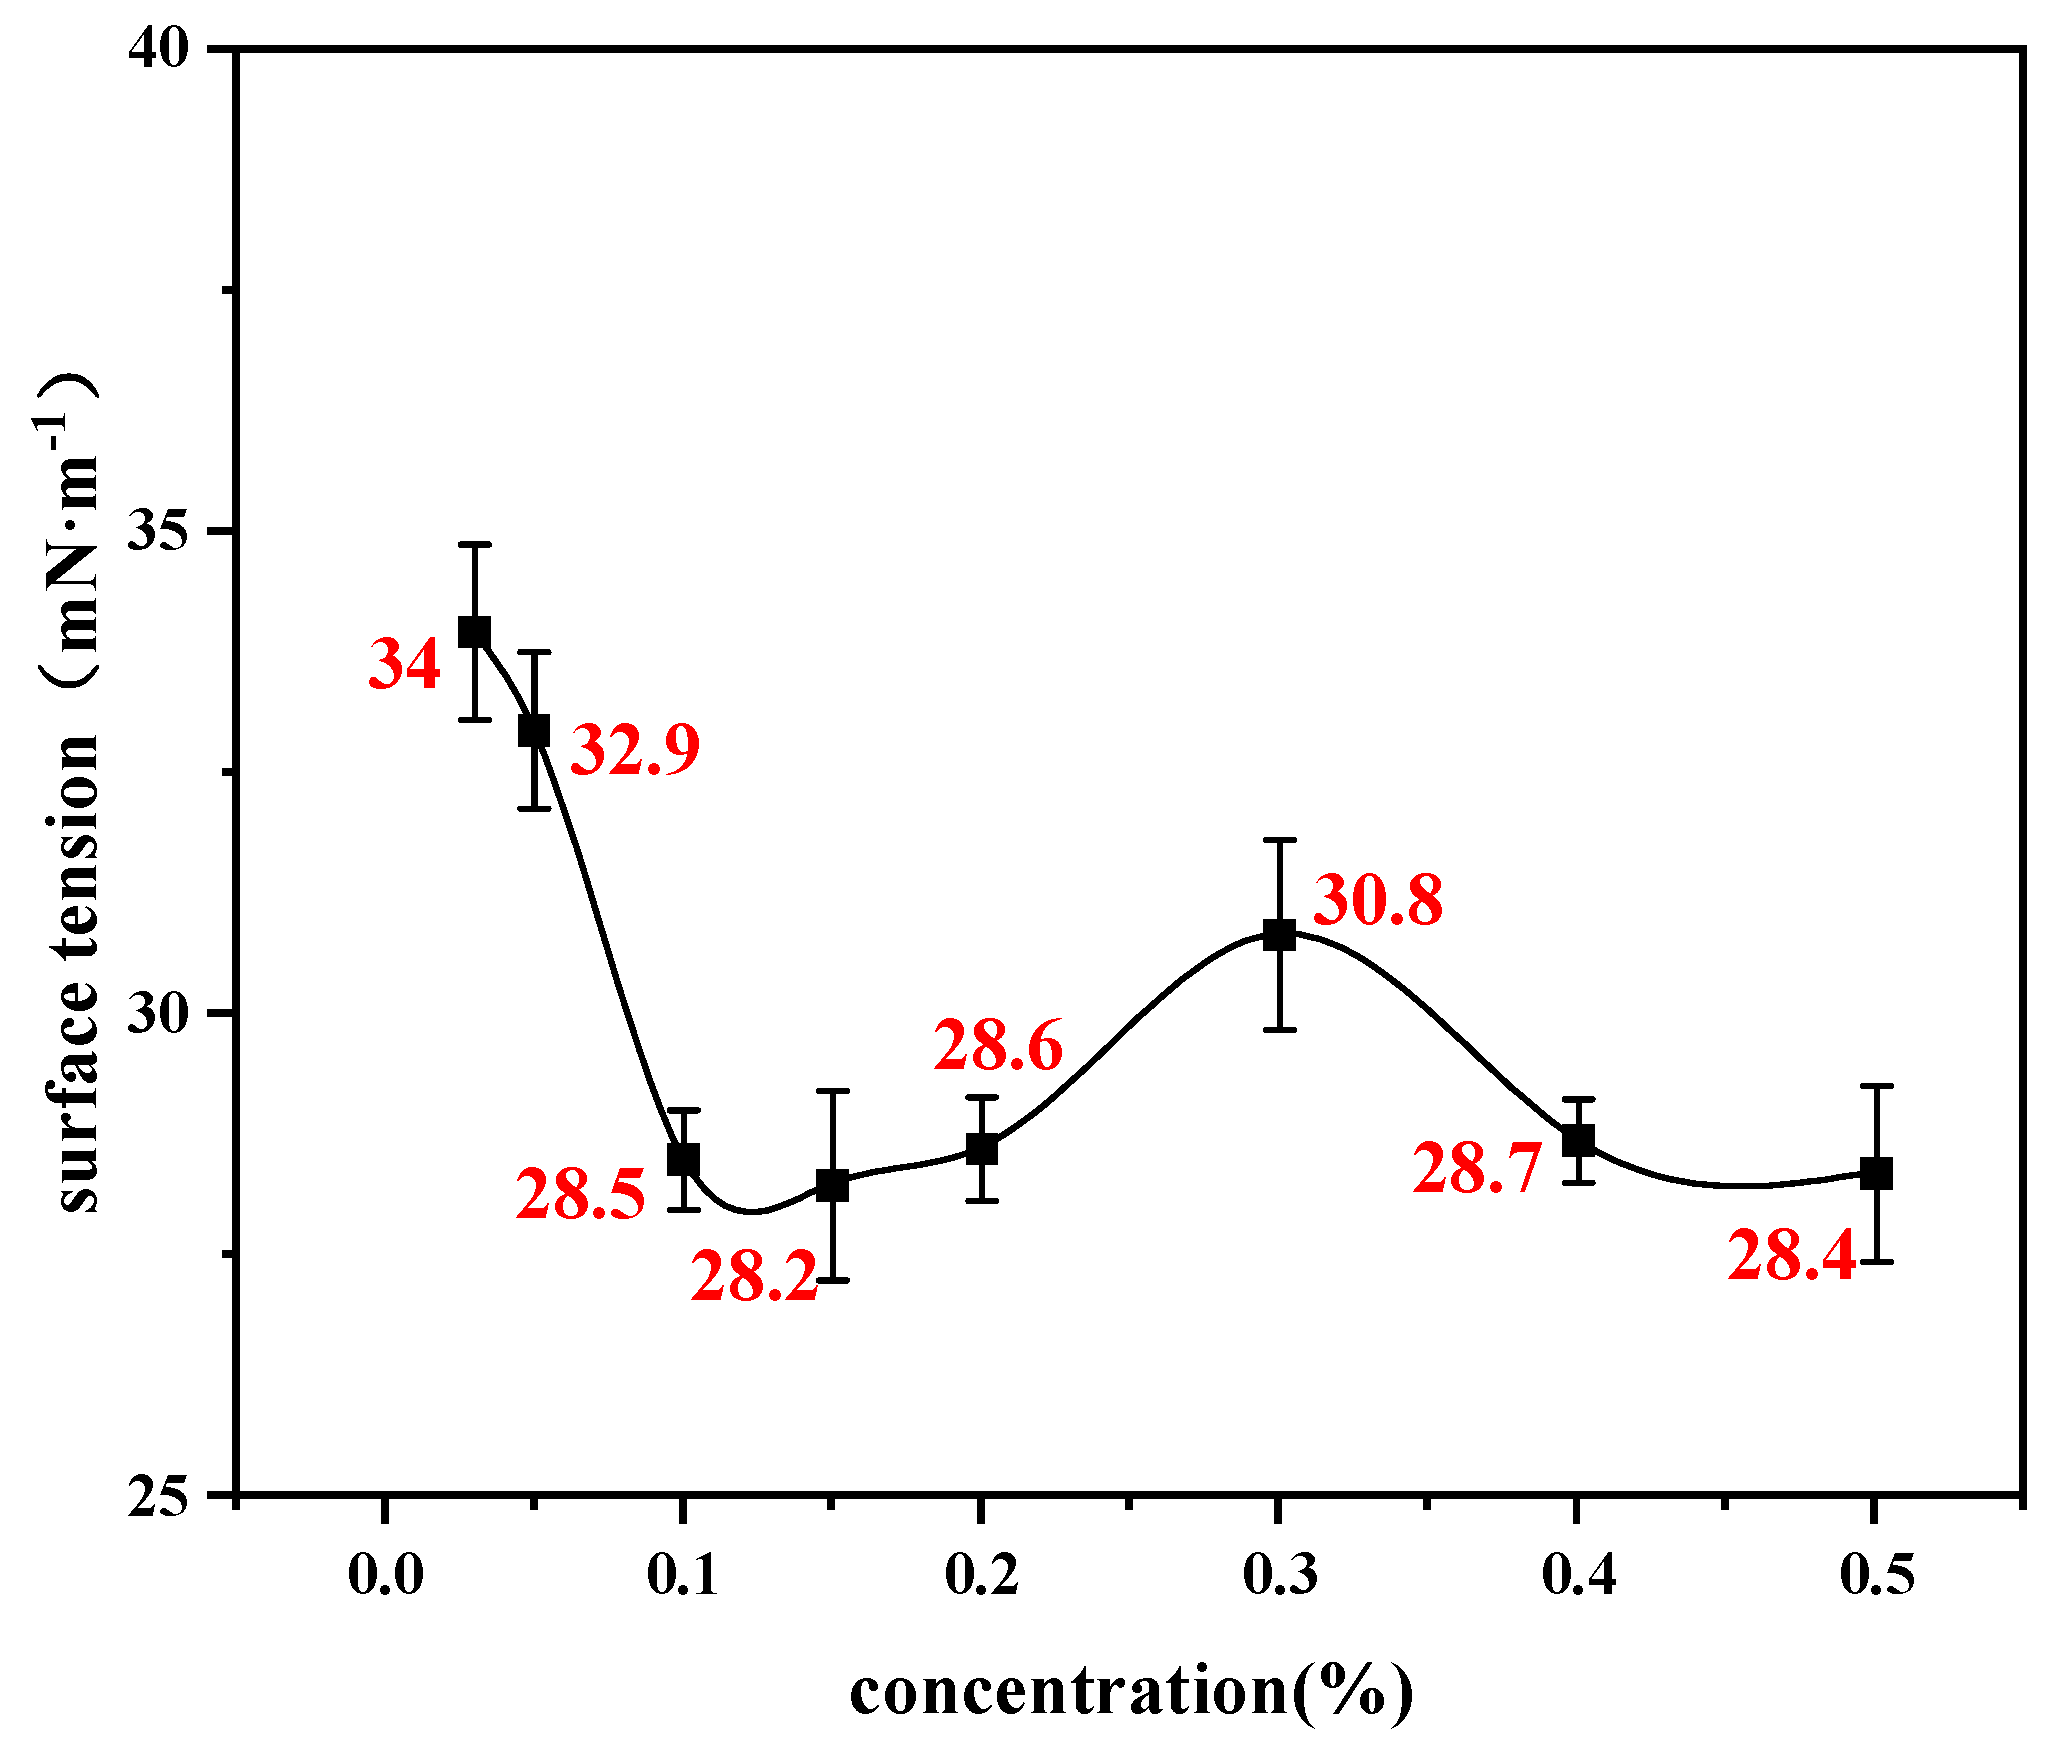
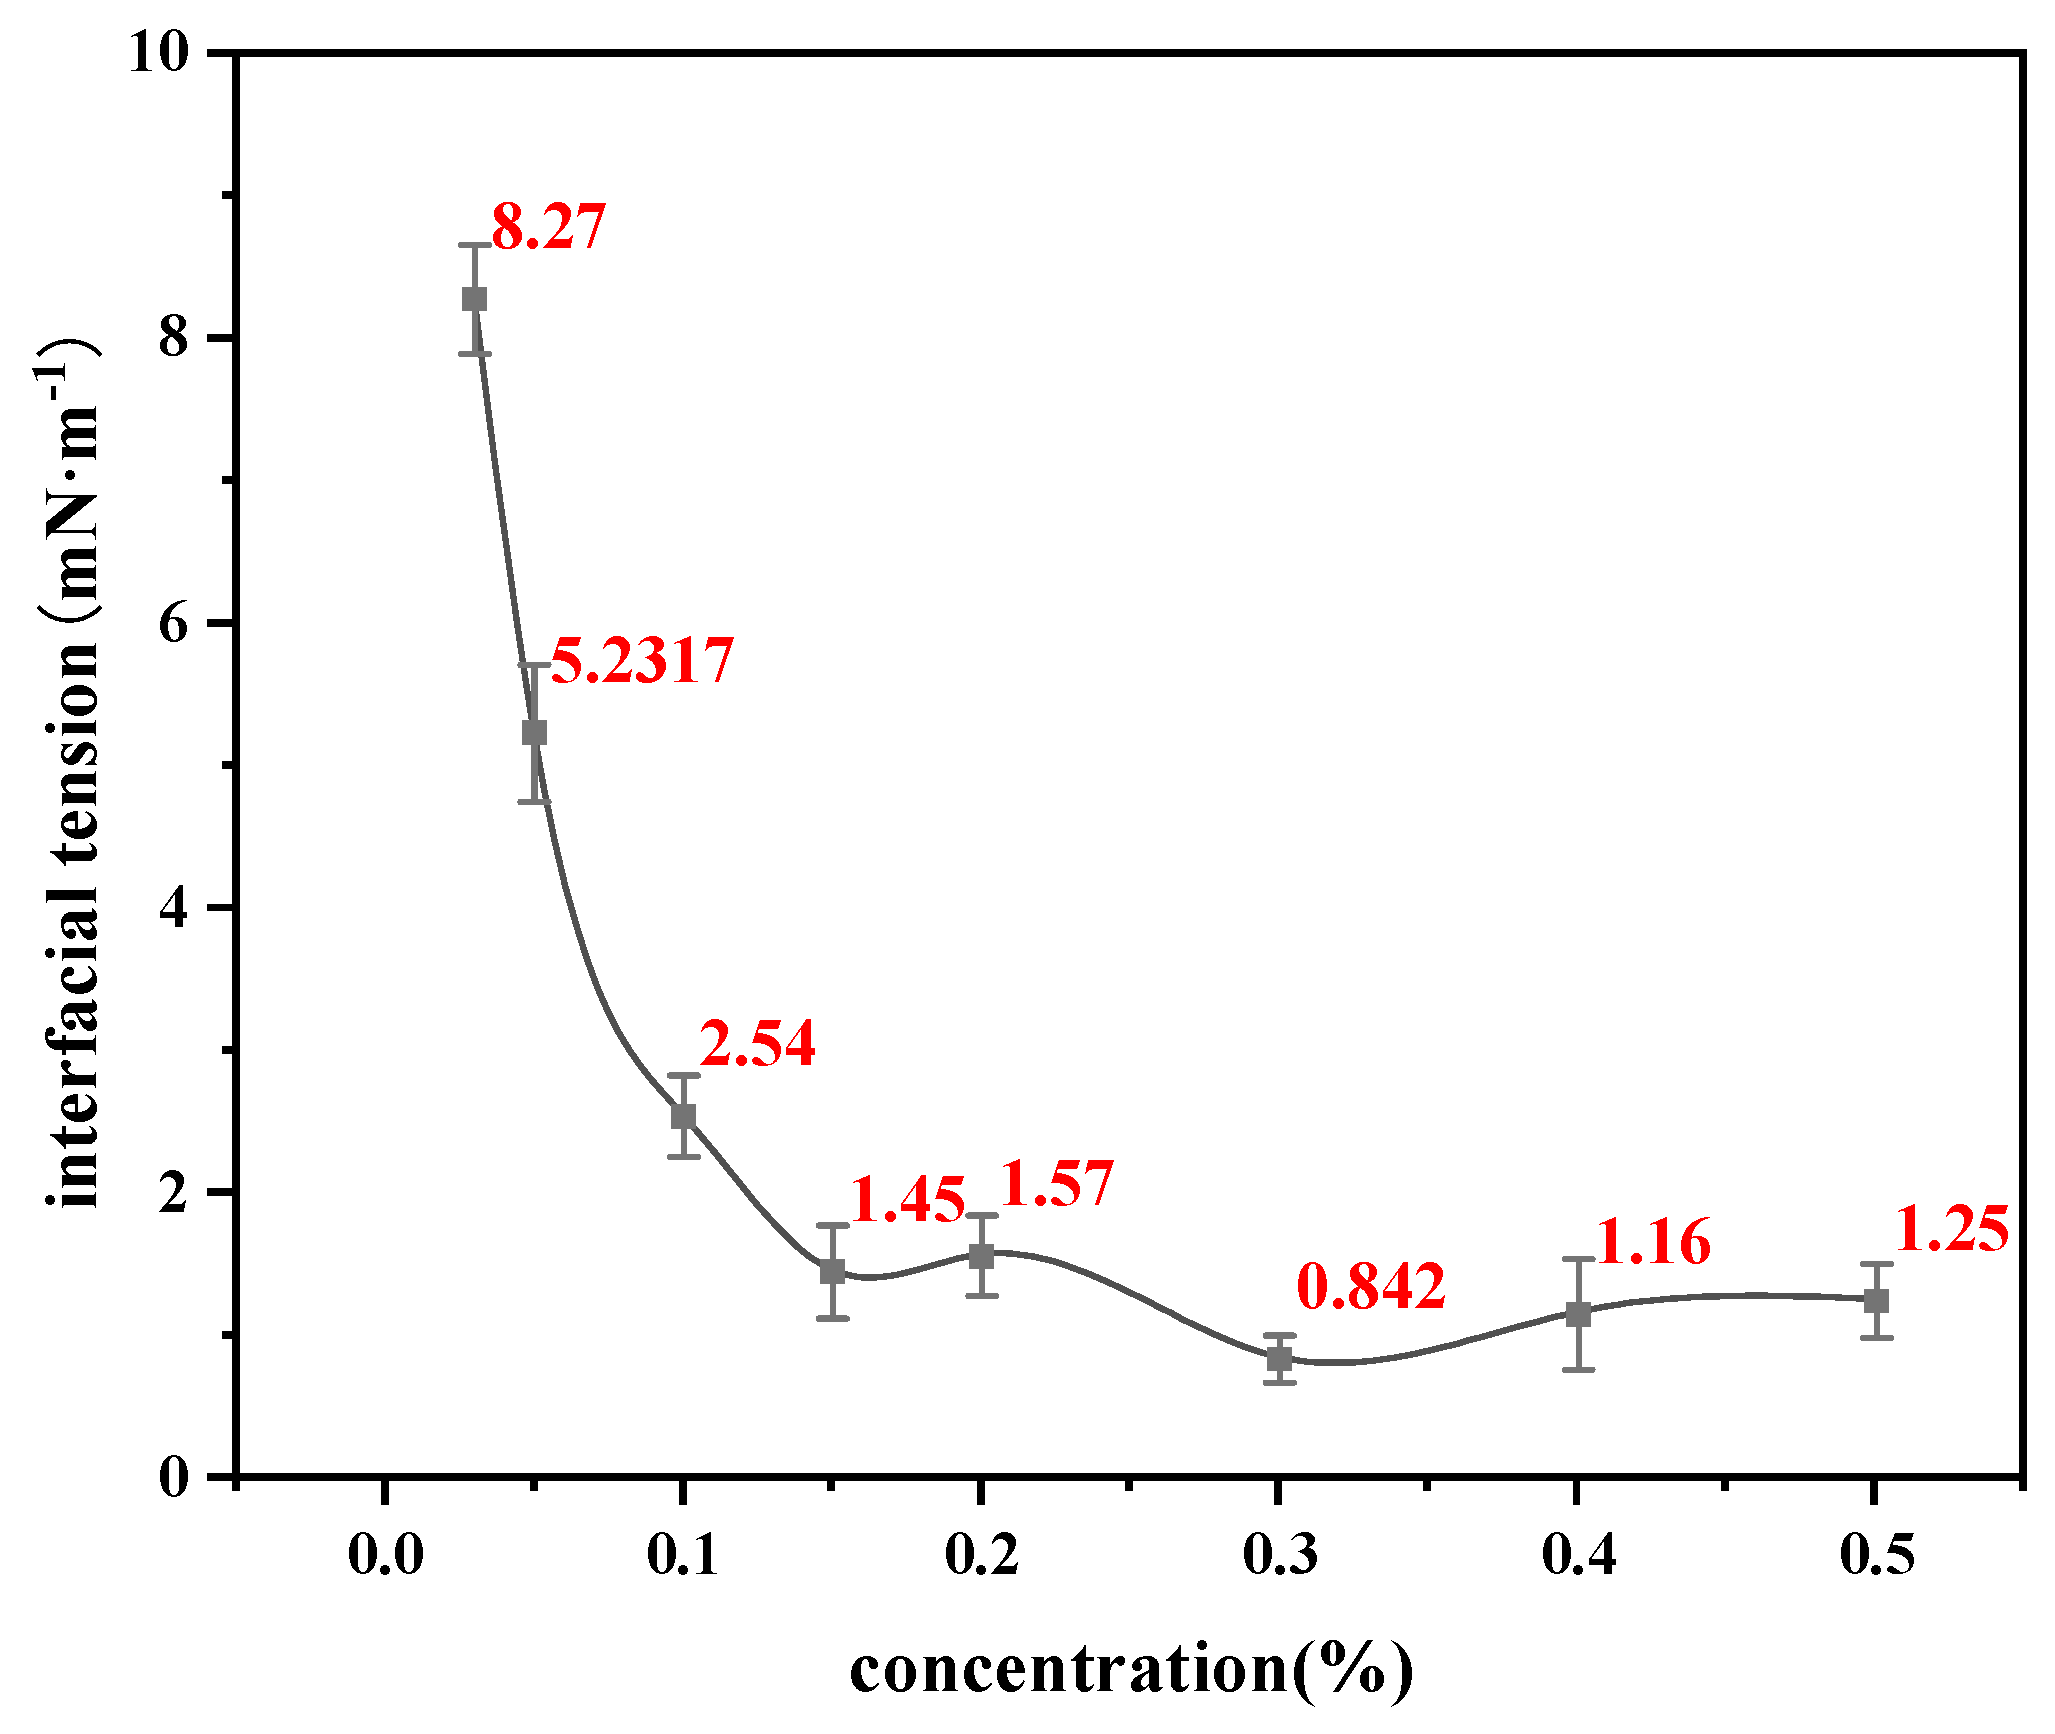
A Texas-500C surface/interfacial tensiometer was used to measure the gas–liquid surface tension and oil–water interfacial tension of the system by rotating drop method. The results are shown in Figure 6 and Figure 7. For each concentration of nanoemulsion, the interfacial tension was measured three times and the average value was taken to ensure the reliability of the test data. From Table 5 and Table 6, it can be seen that the standard deviation of the interfacial tension test data is within 1 at different concentrations, which also proves the reproducibility of the experimental data.
The gas–liquid surface tension of the nanoemulsion system prepared in the brine with different concentrations (0.03–0.5%) was around 30 mN·m−1, and the oil–water interfacial tension decreased with the concentration increasing from 0.03% to 0.5%. When the concentration was between 0.3% and 0.5%, the oil–water interfacial tension was between 0.59 and 1.27 mN·m−1. This indicates that the nanoemulsion system exhibits good interfacial activity, and increasing concentration enhances the adsorption of surfactant molecules at the oil–water interface, thereby reducing interfacial tension. However, the reduction trend becomes less pronounced at higher concentrations, suggesting that the interface gradually approaches adsorption saturation.

3.1.4. Wettability Property

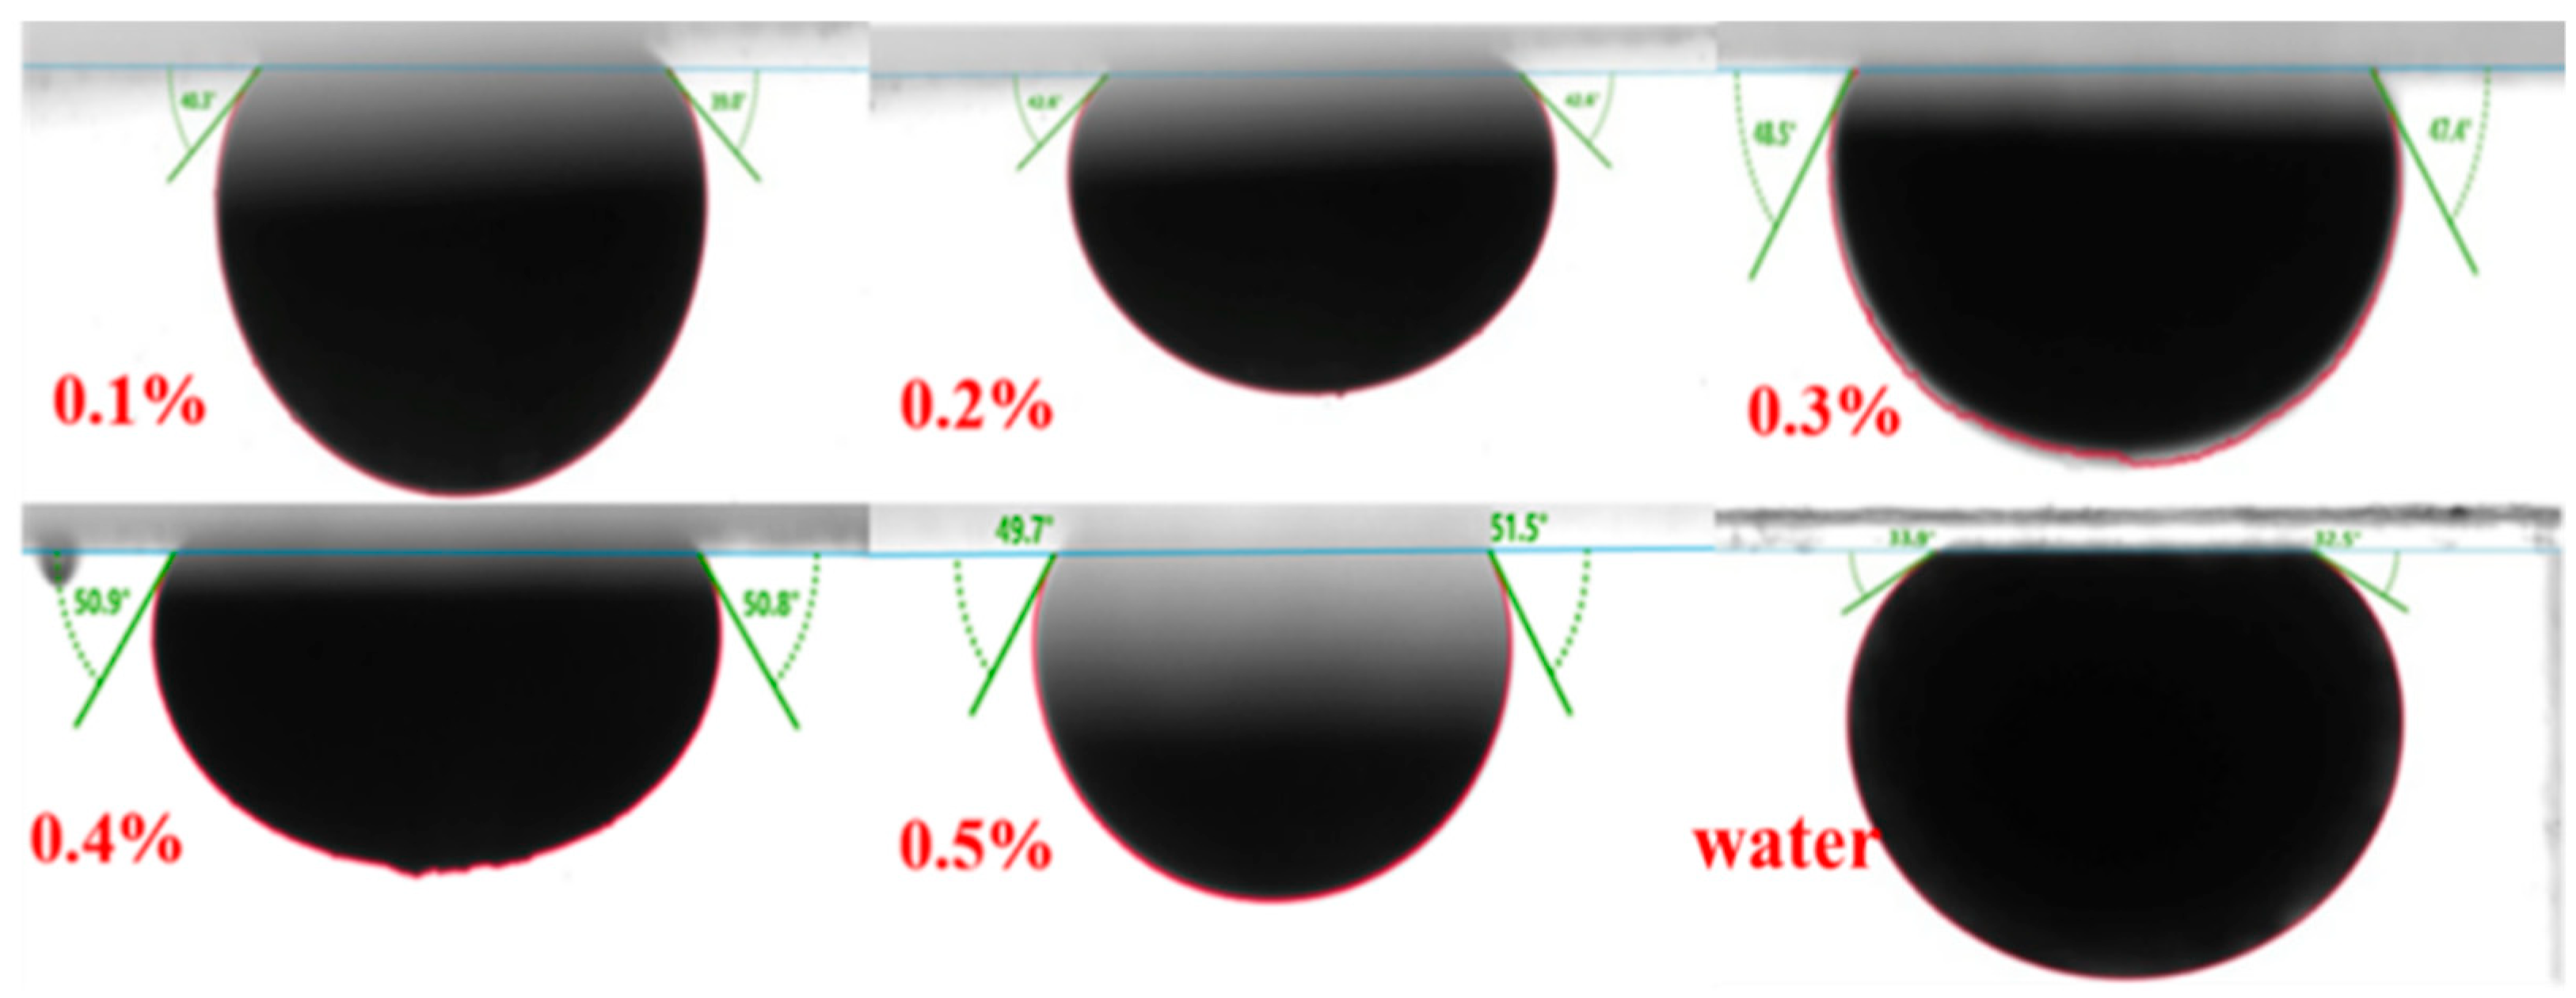
Quartz sheets are used to simulate the surface of sandstone, and the Kruss oil–water–solid contact angle measuring instrument is used to measure the contact angle at the boundary of the oil–water–solid phase based on the lying drop method, to characterize the wettability of a solid surface. The wettability contact angle was measured by preparing different concentrations of the nanoemulsion agent solution. Each contact angle was measured three times and the average was taken. The three measured values, the average, and the standard deviation are shown in Table 7. The standard deviations in the table are all less than 1, indicating the repeatability and reliability of the contact angle measurement data.
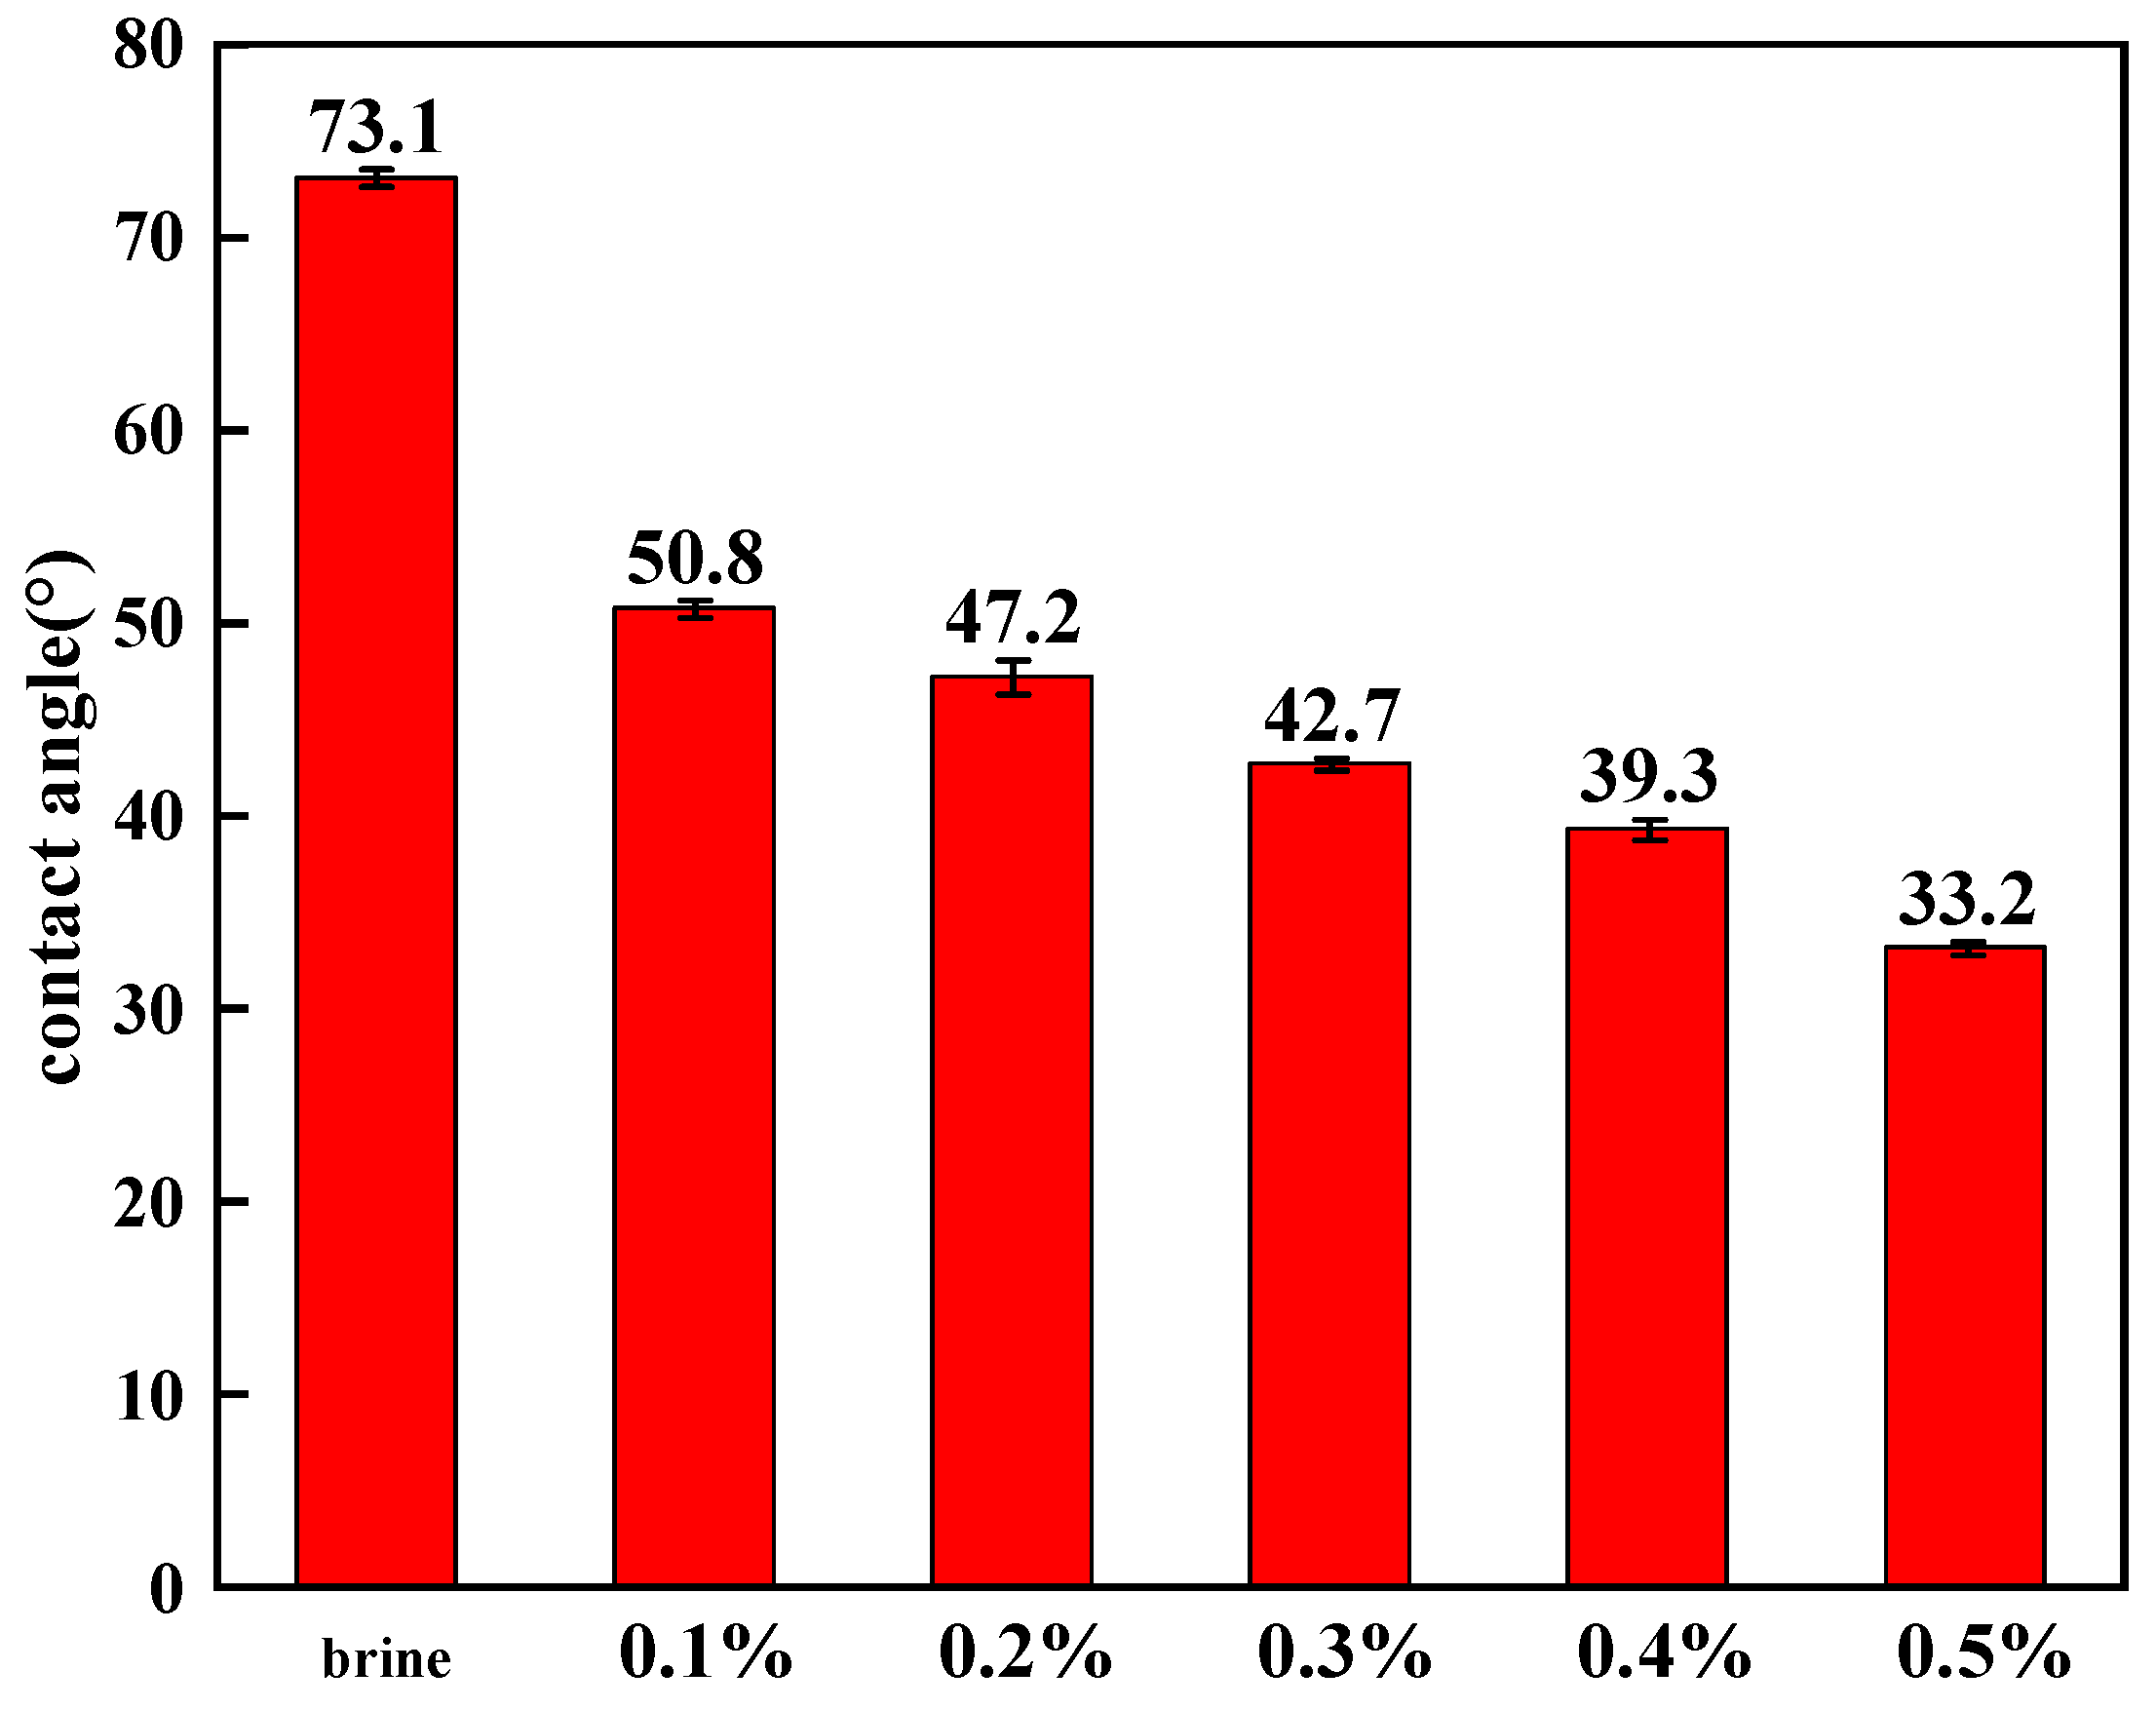
It can be observed from Figure 8 and Figure 9 that the addition of the nanoemulsion markedly affects the wettability of the oil–water–rock system. In the absence of the nanoemulsion, the contact angle between brine, crude oil, and the rock surface is only 33.2°, indicating that the rock exhibits strong water-wet characteristics. After the introduction of the nanoemulsion, the contact angle increases continuously with increasing nanoemulsion concentration. Specifically, when the concentration increases from 0.1% to 0.5%, the contact angle rises from 39.7° to 50.6°. The increase is relatively gradual between 0.1% and 0.3%, where the contact angle rises from 39.7° to 48.0°, whereas beyond 0.3%, the growth becomes less pronounced, reaching 50.9° at 0.4% and slightly decreasing to 50.6° at 0.5%. This suggests that the wettability alteration effect of the nanoemulsion tends to approach saturation at concentrations above 0.4%. The increase in contact angle demonstrates that the nanoemulsion is capable of modifying the surface wettability of the rock and reducing its water-wetness. This behavior is likely associated with the adsorption of nanoemulsion droplets or surfactant molecules onto the rock surface, which changes the surface free energy and weakens the affinity between the rock and the aqueous phase.
Although the contact angle increases significantly, all measured values remain below 90°, indicating that the rock surface still retains an overall water-wet character. However, the transition from a strongly water-wet surface to a moderately water-wet surface is beneficial for oil displacement. The weakened hydrophilicity reduces the adhesion work between crude oil and the rock surface, making it easier for the oil phase to detach from pore walls and migrate through the pore network. Consequently, the threshold pressure required for fluid flow is reduced, which is favorable for improving seepage capacity and enhancing oil recovery in low-permeability reservoirs.

3.2. Depressurization and Augmented Injection Performance Evaluation of Nanoemulsion

For the nanoemulsion, the depressurization rate of injection pressure before and after nanoemulsion injection is mainly used to evaluate its depressurization and augmented injection performance through an oil-bearing two-phase core displacement experiment.
The following is mainly to evaluate the depressurization and augmented injection performance of nanoemulsion from three aspects: different injection rates, different injection concentrations, and different injection volumes.

3.2.1. Effect of Injection Rate

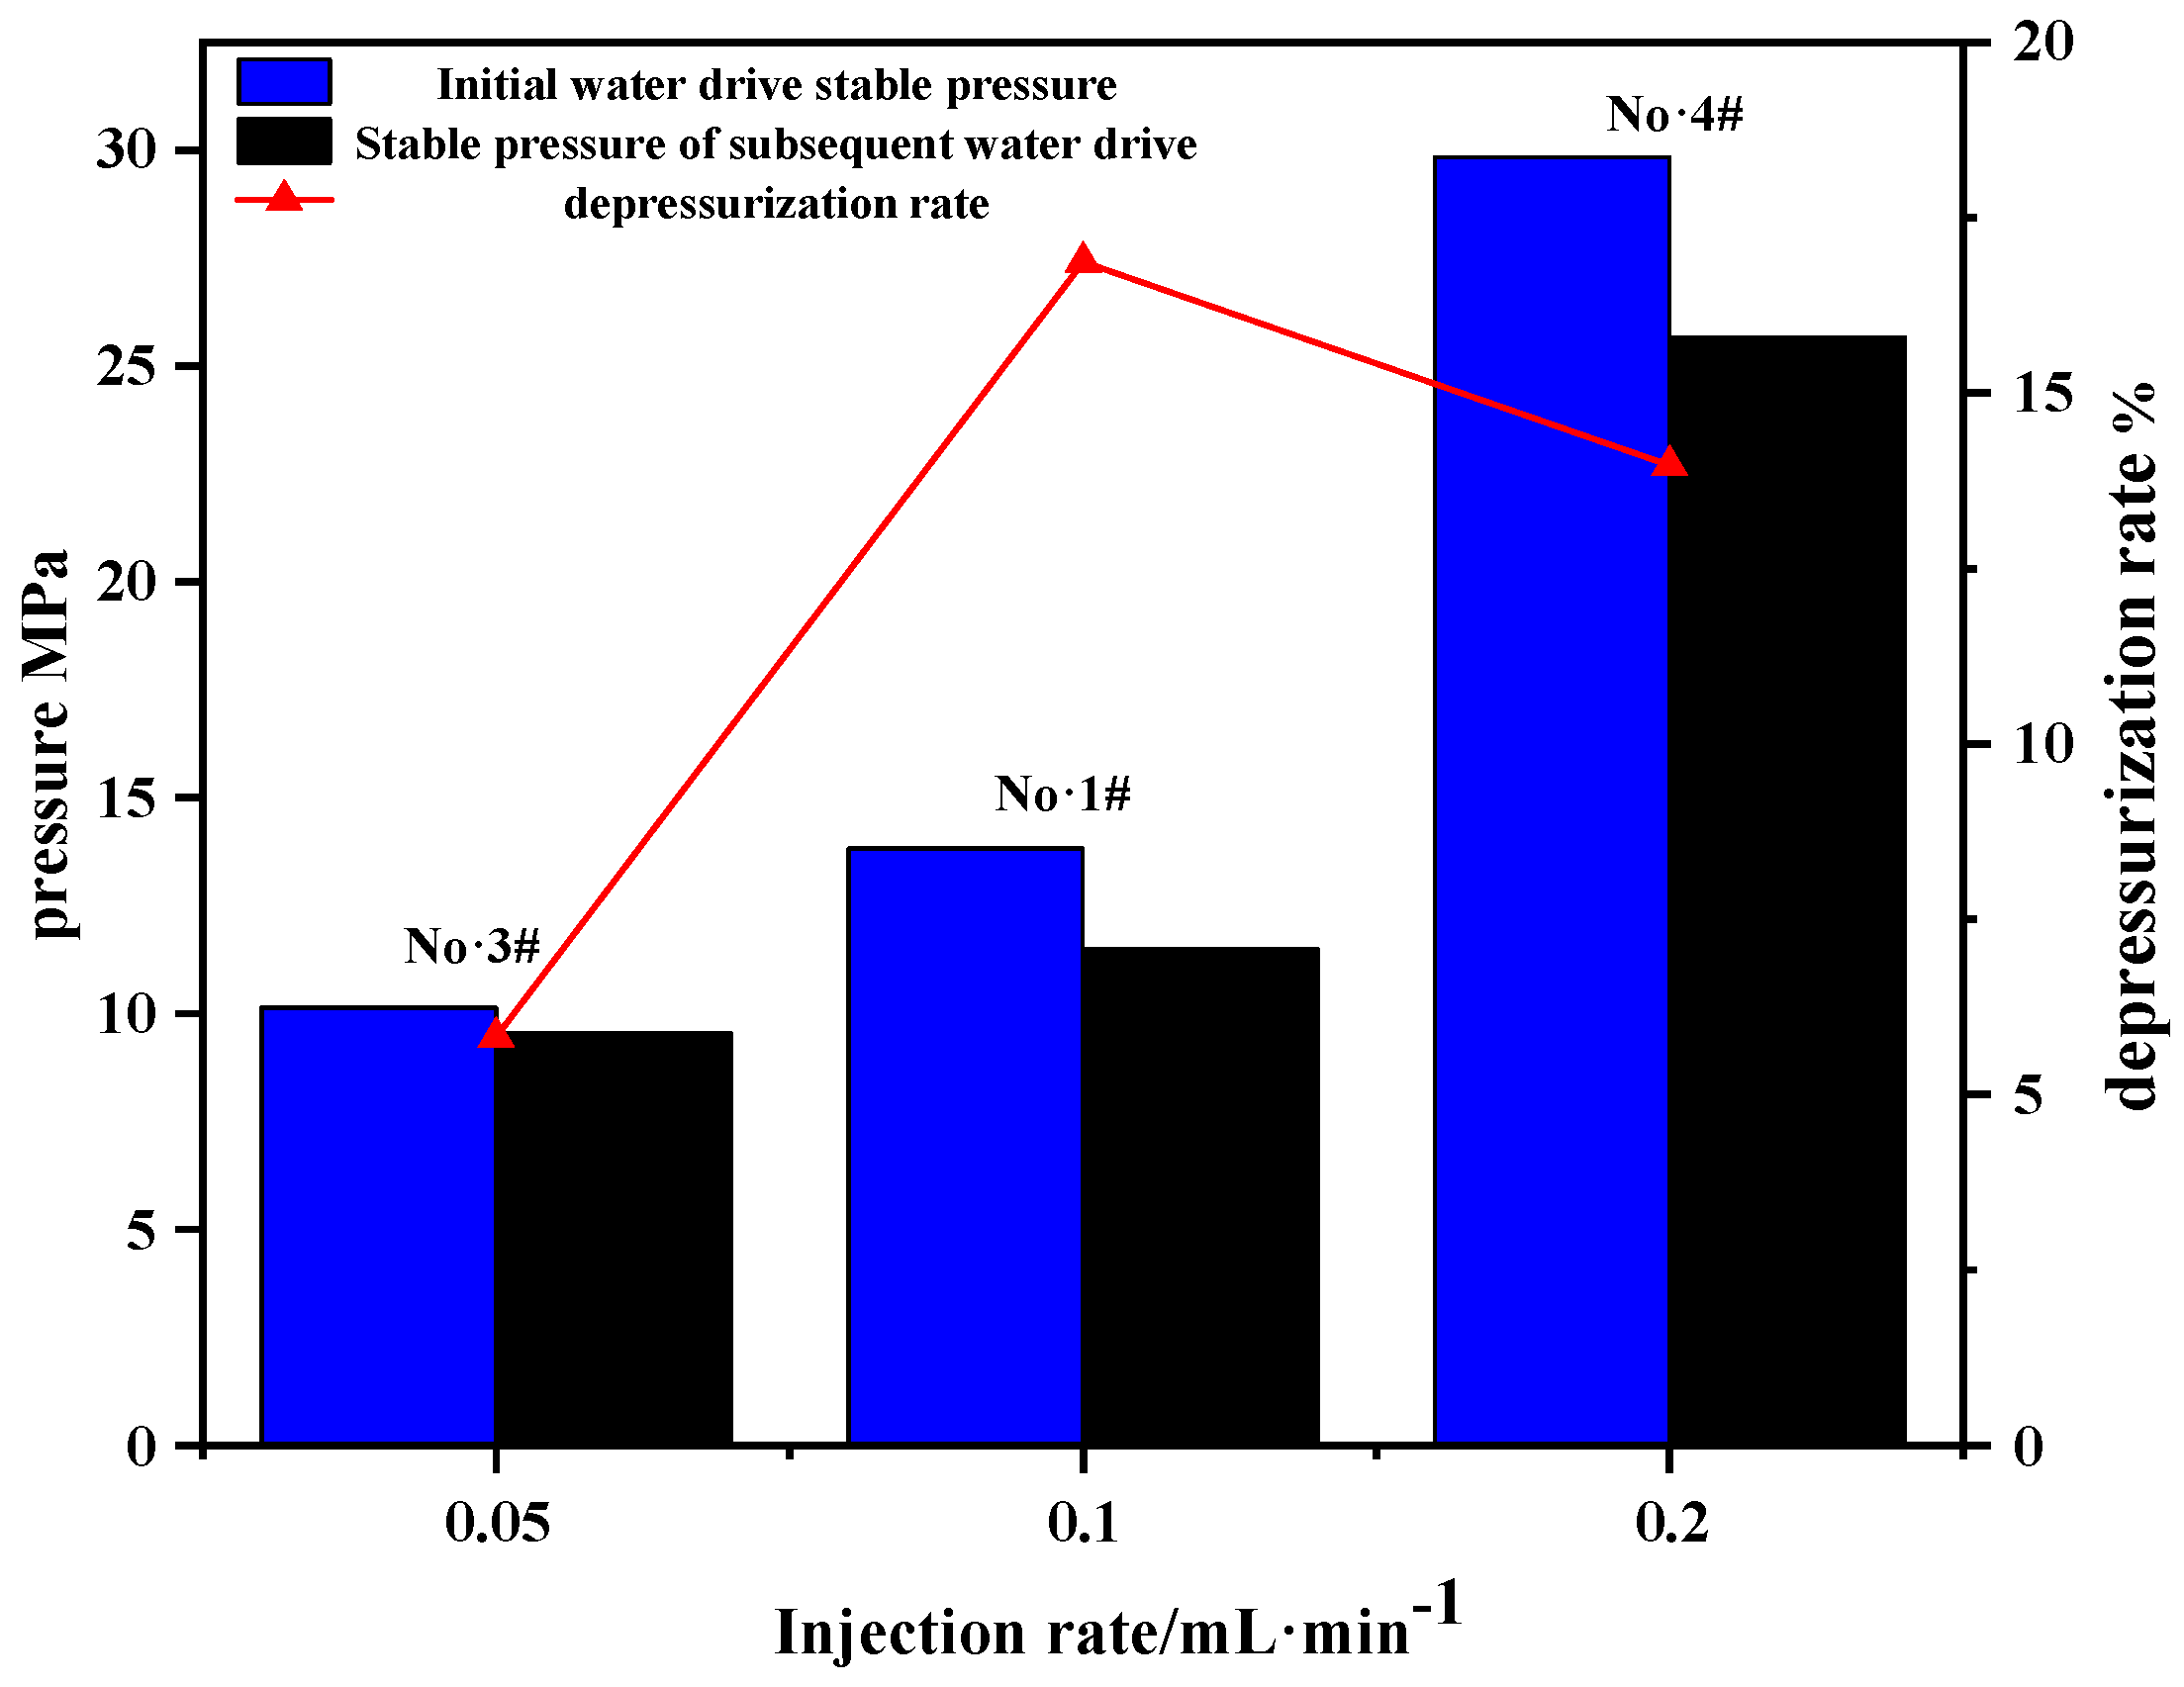
According to the two-phase displacement experimental method, using the Chang 8 natural outcrop core, a single plug soaking injection method was used, with a fixed injection amount of 1 PV and an injection concentration of 0.5%. The effect of different injection rates on the depressurization performance of nanoemulsion was studied at three different injection rates of 0.05 mL·min−1, 0.1 mL·min−1, and 0.2 mL·min−1. The experimental results are shown below.
Based on the data presented in Table 8 and the analysis of Figure 10, the variation in injection rate has a significant impact on both the initial and subsequent stable water-drive pressures, as well as the depressurization behavior. Specifically, when the injection rate is 0.05 mL·min−1, the initial stable water-drive pressure is relatively low at 10.14 MPa, and the subsequent stable pressure slightly decreases to 9.55 MPa, corresponding to a modest depressurization rate of 5.82%. This indicates a relatively stable flow condition with limited pressure fluctuation. As the injection rate increases to 0.1 mL·min−1, the initial stable pressure rises to 13.83 MPa, while the subsequent pressure decreases more noticeably to 11.50 MPa. The depressurization rate reaches 16.87%, suggesting that at this intermediate injection rate, the system experiences a more pronounced pressure adjustment, possibly due to enhanced fluid redistribution and pore-scale flow reorganization.
When the injection rate is further increased to 0.2 mL·min−1, the initial stable water-drive pressure sharply increases to 29.84 MPa, and the subsequent pressure decreases to 25.67 MPa, with a depressurization rate of 13.97%. Although the pressure drop remains significant, the depressurization rate is lower than that at 0.1 mL·min−1, implying that excessively high injection rates may intensify flow resistance and reduce the relative efficiency of pressure relief.
Overall, with increasing injection rate, both the initial and subsequent stable pressures show an increasing trend, reflecting enhanced injection energy and flow resistance within the core. However, the depressurization rate exhibits a non-monotonic variation, reaching a maximum at 0.1 mL·min−1. This suggests that there exists an optimal injection rate range that can effectively promote pressure regulation and improve flow dynamics within the porous medium. At low injection rates, the adhesion volume fraction of nano injection emulsion increases, and the thickness of the adsorption layer on the core wall affects the permeability and porosity of the core and affects the depressurization rate. When the injection rate is too high, the throat wall of the core hole cannot adsorb enough nanoemulsion, nor can it achieve a good depressurization and injection enhancement effect. The reasonable injection rate of depressurization and augmented injection is between 0.1~0.2 mL·min−1.

3.2.2. Effect of Concentration

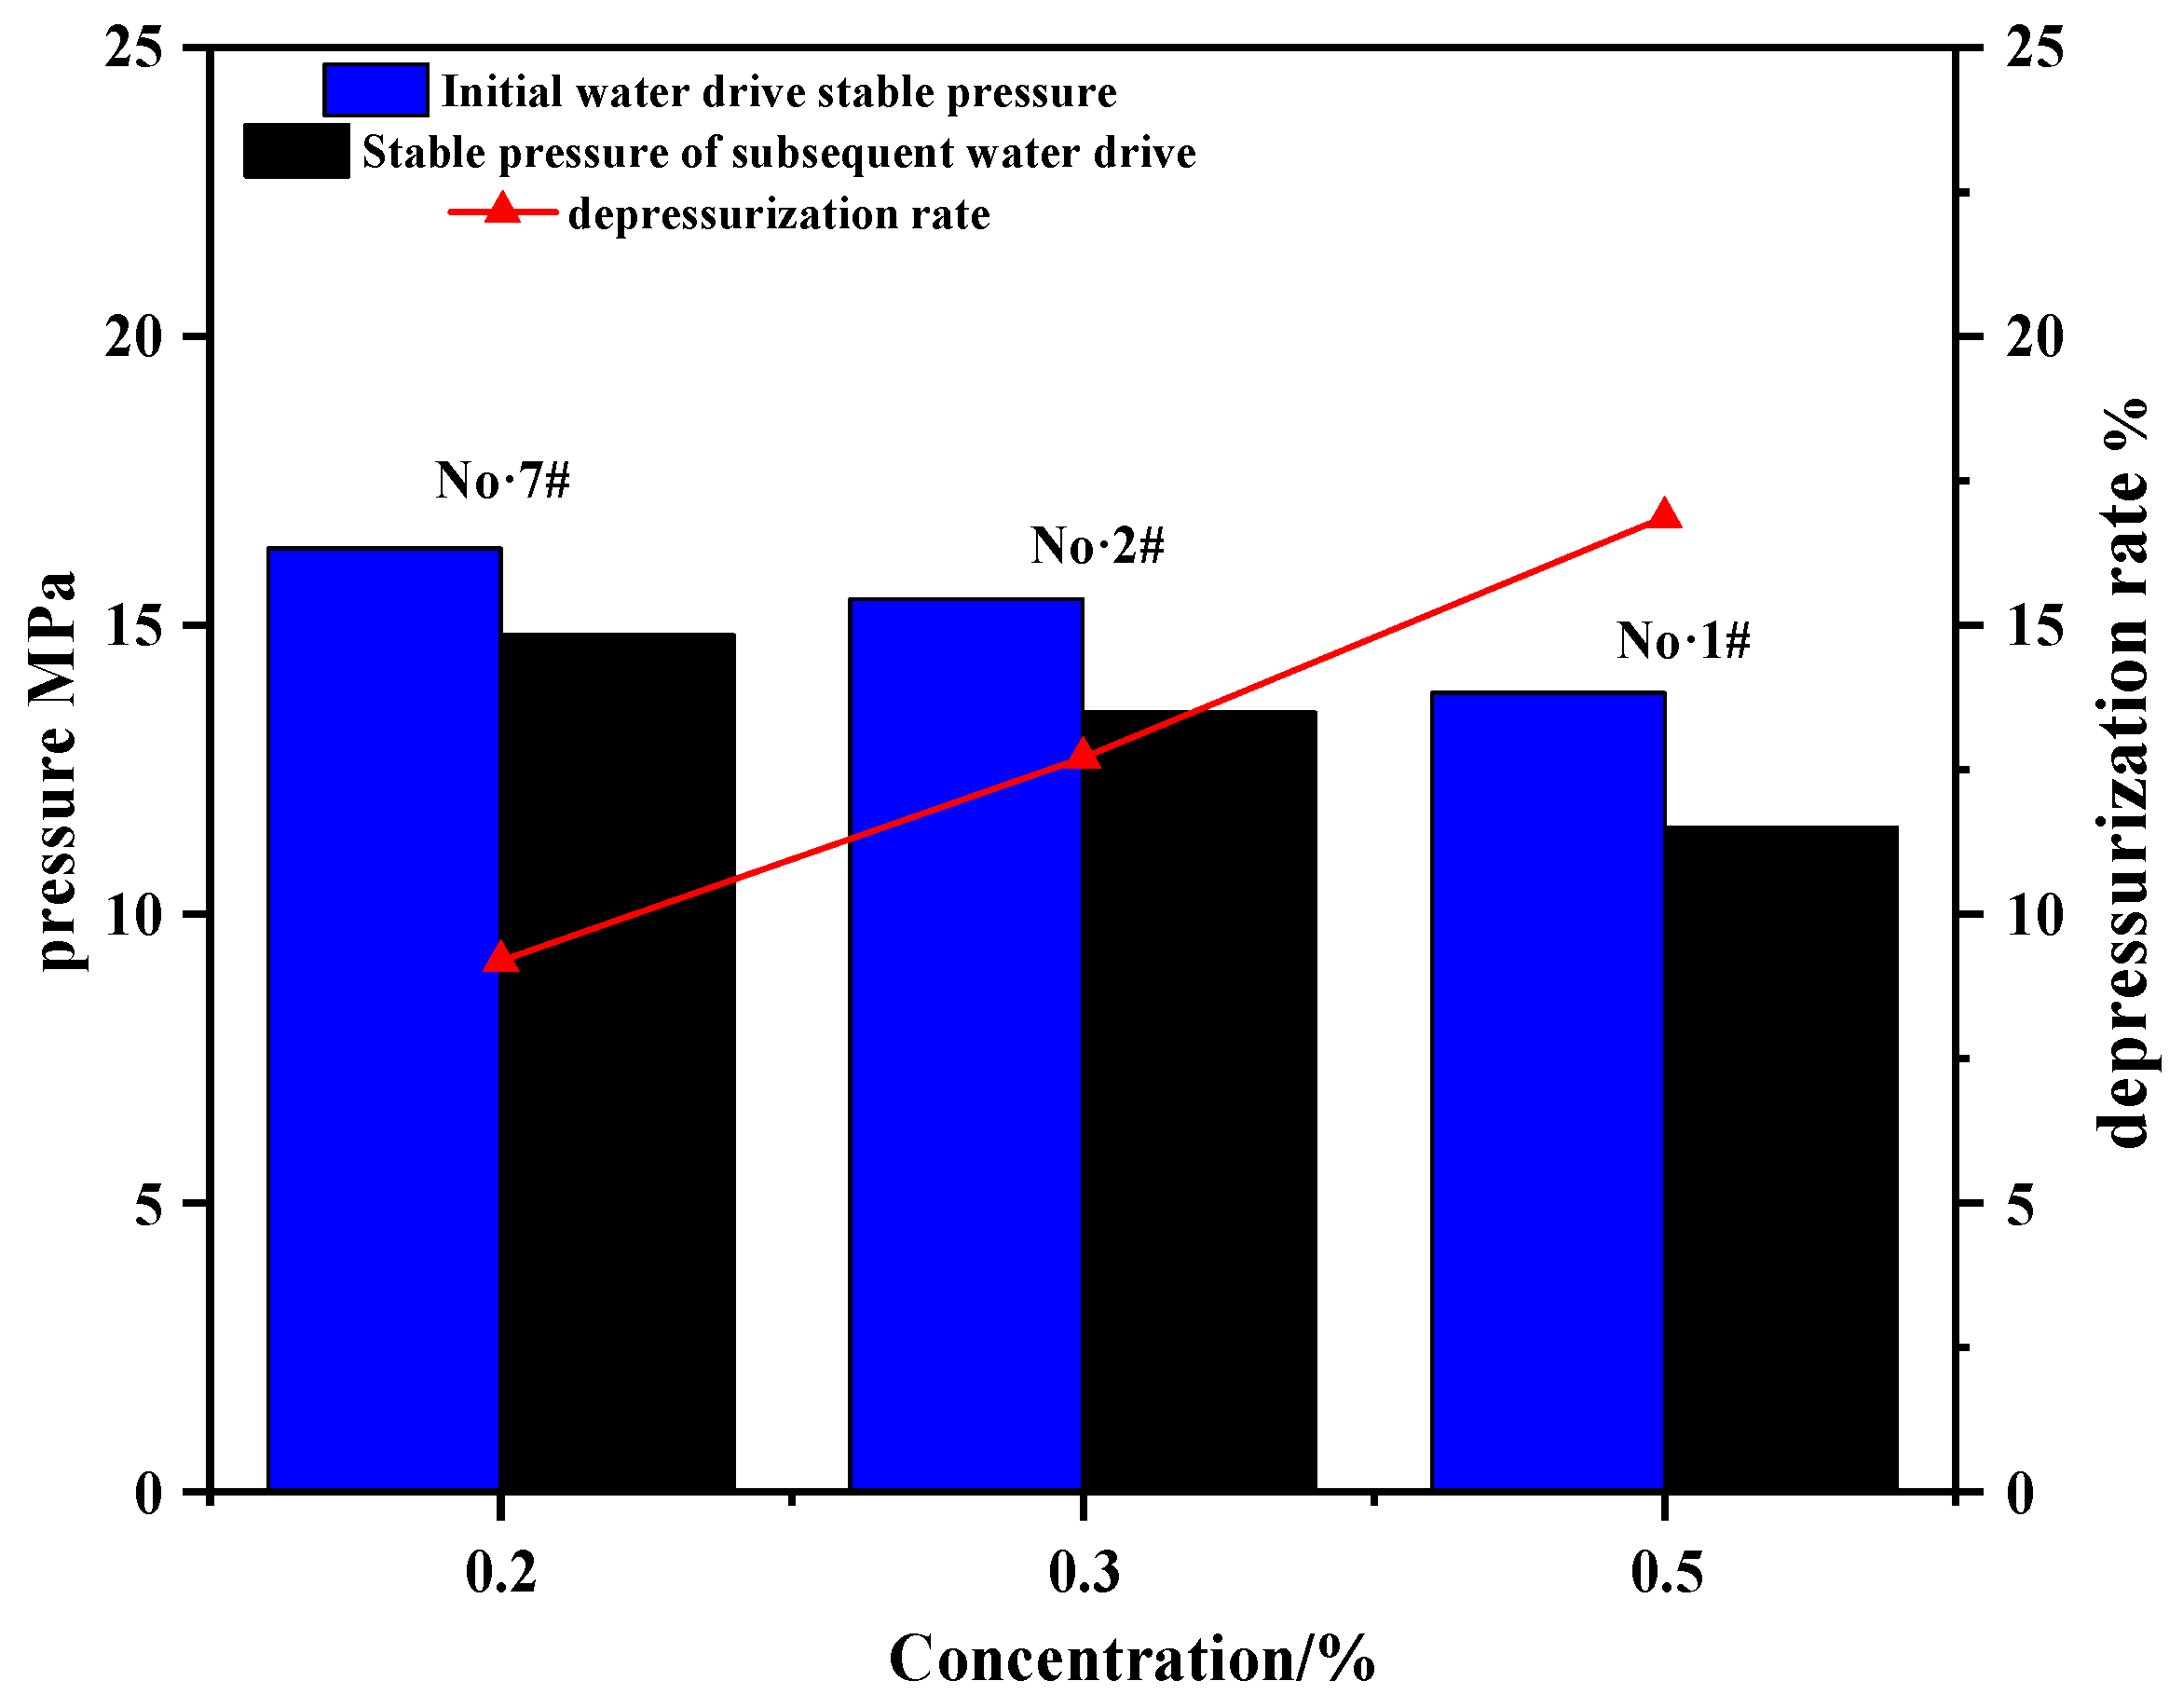
According to the two-phase displacement experiment method, a single slug was used to fill the well, the fixed injection rate was 0.1 mL·min−1, and the injection amount was 1 PV. Different cores were injected with 0.2%, 0.3% and 0.5% nanoemulsion. The wells were closed for 12 h and then transferred to subsequent water flooding.
As can be seen from Table 9 and Figure 11 above, when 0.2% nanoemulsion is injected, the initial water flooding stability pressure is 16.33 MPa, the subsequent water flooding stability pressure is 14.83 MPa, and the depressurization rate is 9.19%. When 0.3% nanoemulsion is injected, the initial stable pressure of water flooding is 15.45 MPa, the subsequent stable pressure of water flooding is 13.49 MPa, and the step-down rate is 12.71%. When 0.5% concentration of nanoemulsion was injected, the initial stable pressure of water flooding was 13.83 MPa, at the subsequent stable pressure of water flooding was 11.50 MPa, and the depressurization rate was 16.87%. Since the nanoemulsion with 0.5% concentration has a better ability to reduce the interfacial tension than the nanoemulsion with 0.2% and 0.3% concentration, and the nanoemulsion with 0.5% concentration wettability control ability is stronger, the nanoemulsion with 0.5% concentration has a better effect of depressurization and augmented injection in core displacement experiments.

3.2.3. Effect of Slug Size

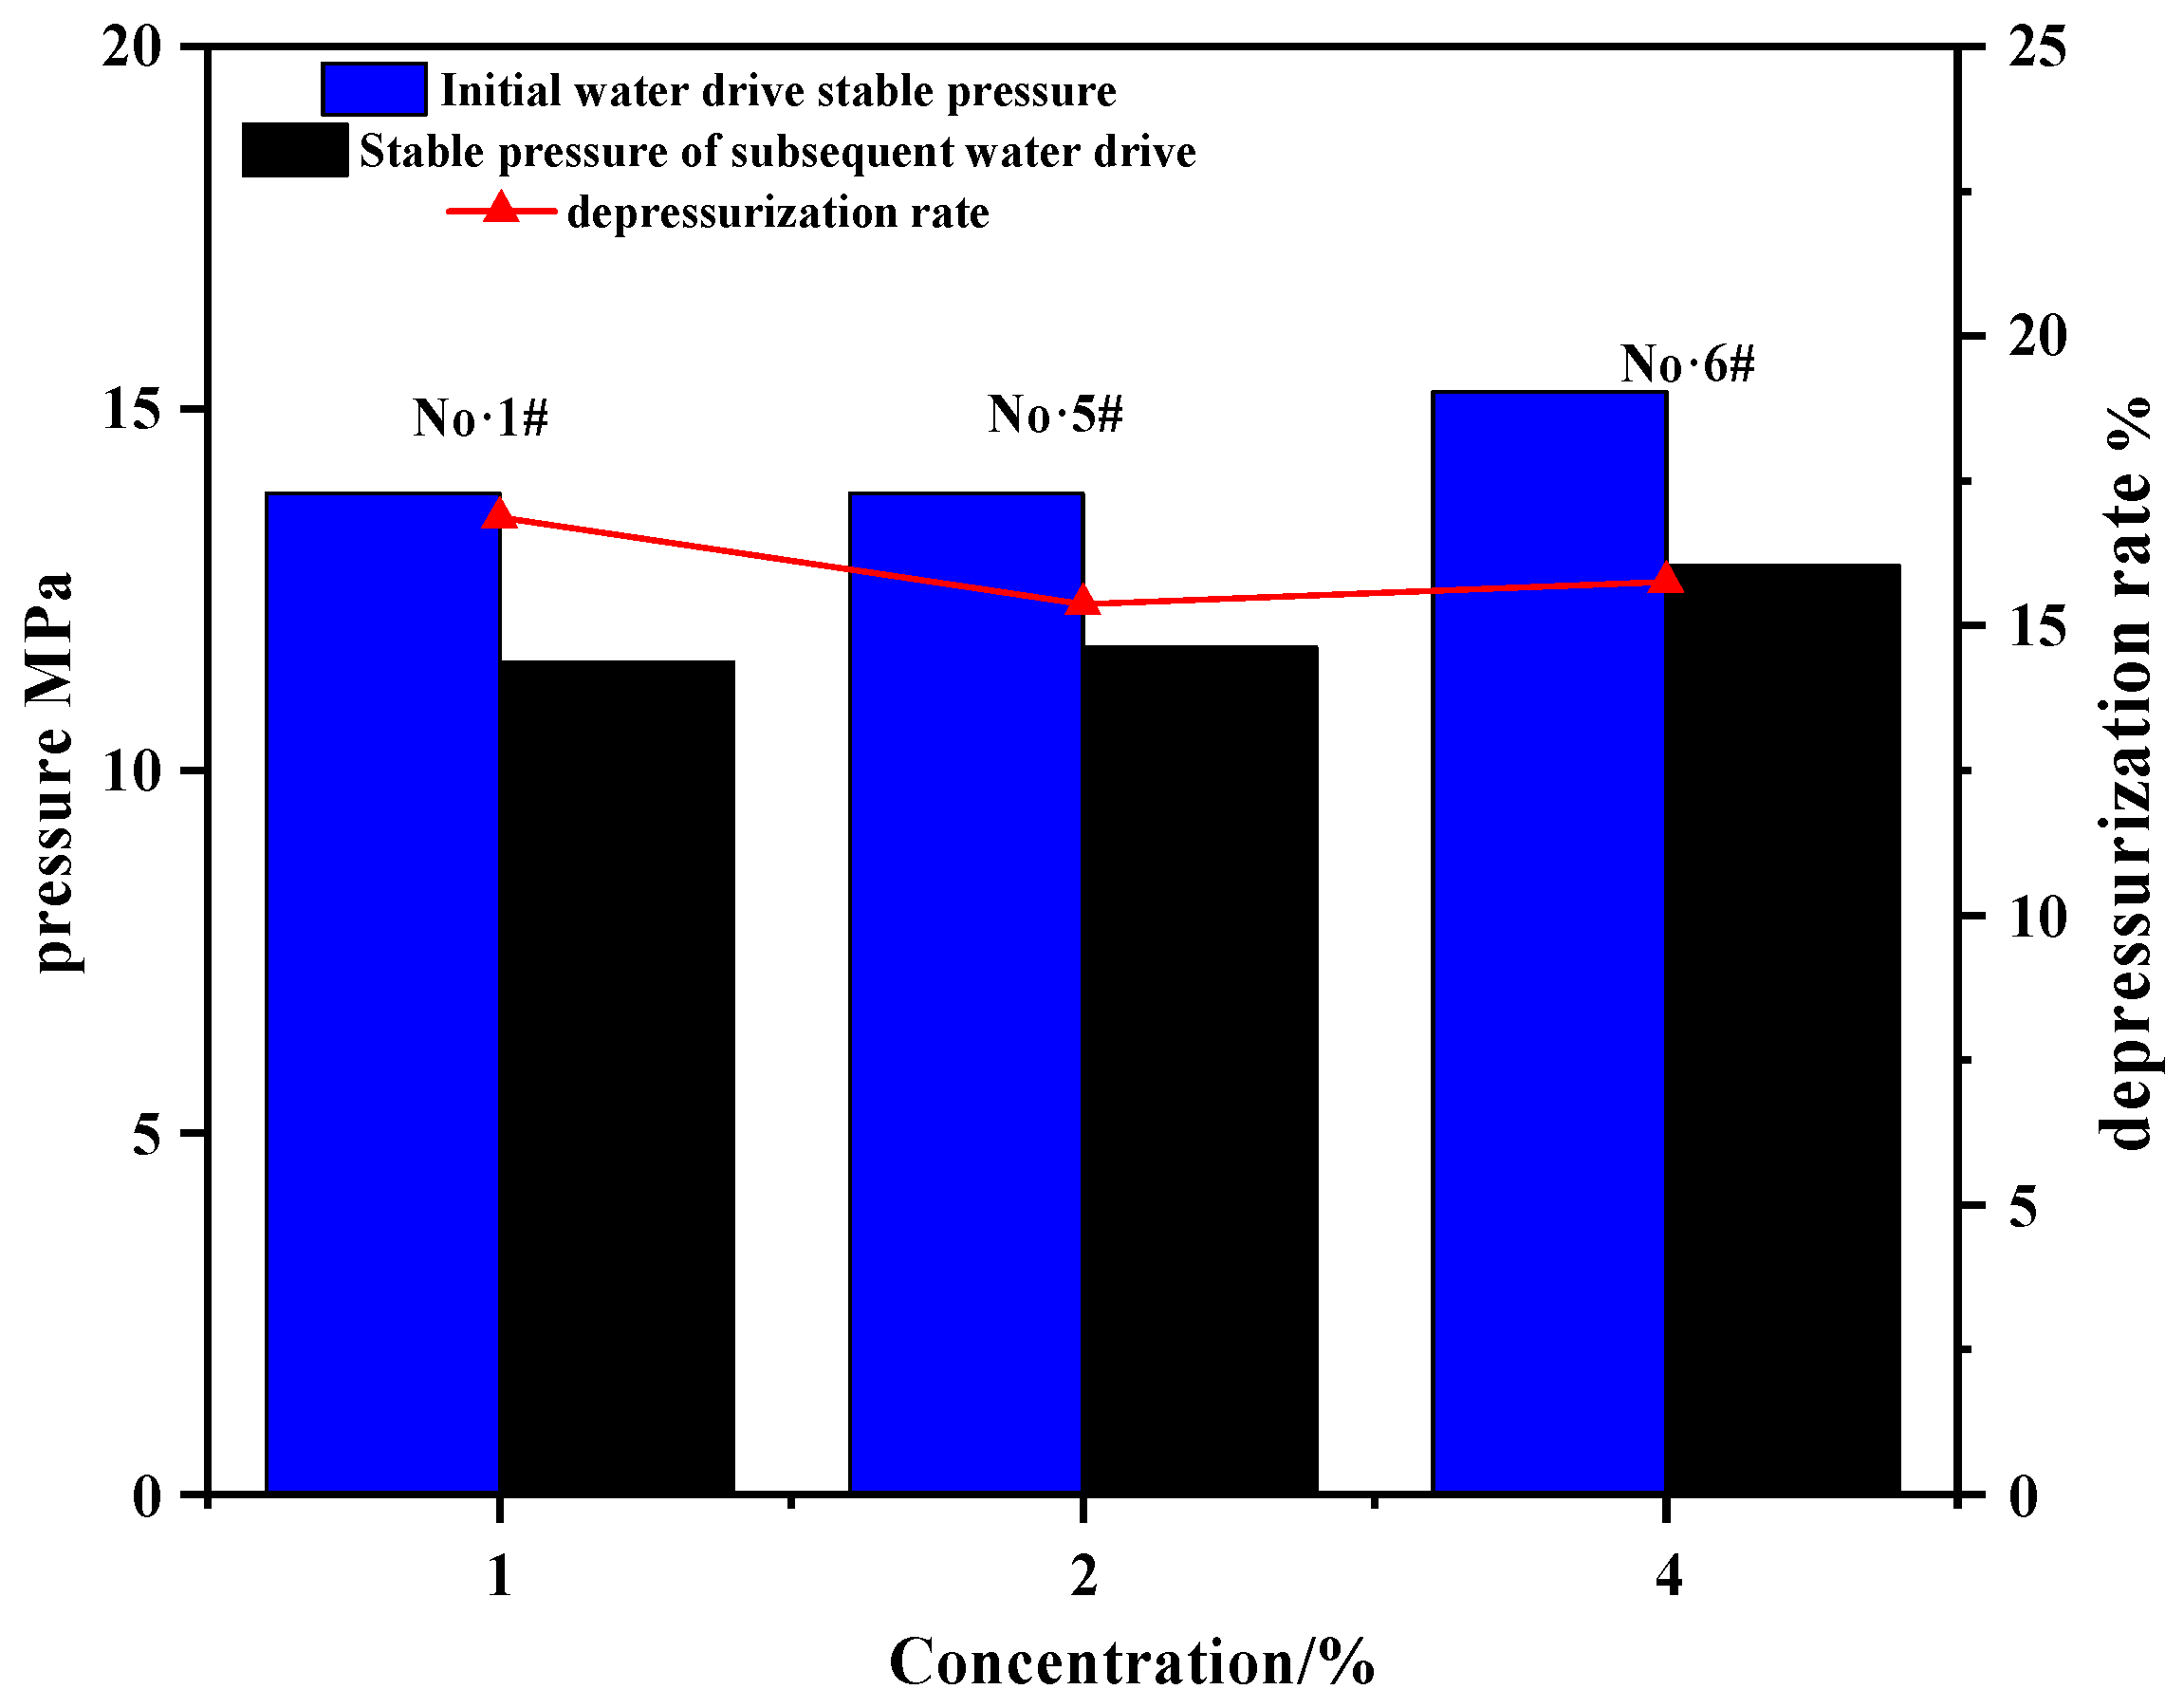
According to the experimental method of two-phase (oil-bearing) core displacement, 1 PV, 2 PV, and 4 PV nanoemulsion were injected into three different cores at the injection rate of 0.1 mL·min−1 and an injection concentration of 0.5%.
As shown in Table 10 and Figure 12, the injection slug size of nanoemulsion exerts a noticeable influence on the pressure characteristics during subsequent water flooding, although the variation trend is not strictly linear. After the injection of 1 PV nanoemulsion, the initial stable water-drive pressure is 13.83 MPa, and the subsequent stable pressure decreases to 11.50 MPa, corresponding to a depressurization rate of 16.87%. This indicates that a relatively small slug size can already achieve a significant pressure reduction effect, suggesting effective modification of the pore-scale flow environment. When the injection slug size increases to 2 PV, the initial stable pressure remains unchanged at 13.83 MPa, while the subsequent stable pressure slightly increases to 11.70 MPa. The depressurization rate correspondingly decreases to 15.38%, implying that further increasing the injected volume does not proportionally enhance the depressurization performance and may lead to a marginal decline in efficiency.
With a further increase to 4 PV, the initial stable water-drive pressure rises to 15.23 MPa, and the subsequent stable pressure increases to 12.83 MPa, with a depressurization rate of 15.76%. Compared with the 2 PV case, the depressurization rate shows a slight recovery but remains lower than that of 1 PV. The increase in pressure level may be attributed to enhanced flow resistance caused by excessive nanoemulsion retention or accumulation within the pore space.
Overall, while increasing the injection slug size leads to a gradual rise in both initial and subsequent stable pressures, the depressurization rate exhibits a slight decreasing trend followed by a minor rebound. This suggests that there is no straightforward positive correlation between slug size and depressurization efficiency. Instead, a relatively smaller slug size, such as 1 PV, appears to be more effective in achieving pressure reduction, indicating the existence of an optimal injection volume for balancing flow resistance and permeability improvement.

3.3. Depressurization and Augmented Injection Mechanism Analysis

Due to the low permeability of tight and low-permeability reservoirs, the capillary forces acting on fluids within rock pores or throats are significantly higher than those in medium- to high-permeability reservoirs, resulting in substantial resistance to fluid flow. Nanoemulsions can effectively reduce the oil–water interfacial tension (IFT), thereby decreasing the capillary resistance of trapped fluids. Additionally, during the oil displacement process, nanoemulsions can lower the contact angle between crude oil and rock interfaces, inducing a wettability reversal from oil-wet to water-wet on the rock surface, which further reduces adhesion work. Recent studies at the microscale have further confirmed and enriched this drag reduction mechanism. For instance, Minakov et al. [40] demonstrated that nanoscale droplets can generate structural disjoining pressure in the three-phase contact region, forming a wedge-shaped liquid film that actively promotes the detachment of crude oil from the rock surface. Meanwhile, Zhu et al. [41] and Huang et al. [42] observed through microfluidic and micro-CT experiments that the ultra-low interfacial tension and emulsification capability of nanoemulsions trigger microscopic mechanisms such as “filament pulling” and “interfacial peeling,” which significantly enhance the capillary number and overcome capillary trapping in narrow throats. Furthermore, as noted by Fei et al. [43], the combined effects of wettability reversal and reduced interfacial tension synergistically improve the mobility of residual oil and alleviate pore clogging. In summary, the interplay of these microscopic mechanisms substantially reduces the flow resistance of crude oil in rock pores or throats, leading to a macroscopically observable effect of significant pressure reduction and enhanced injection efficiency.
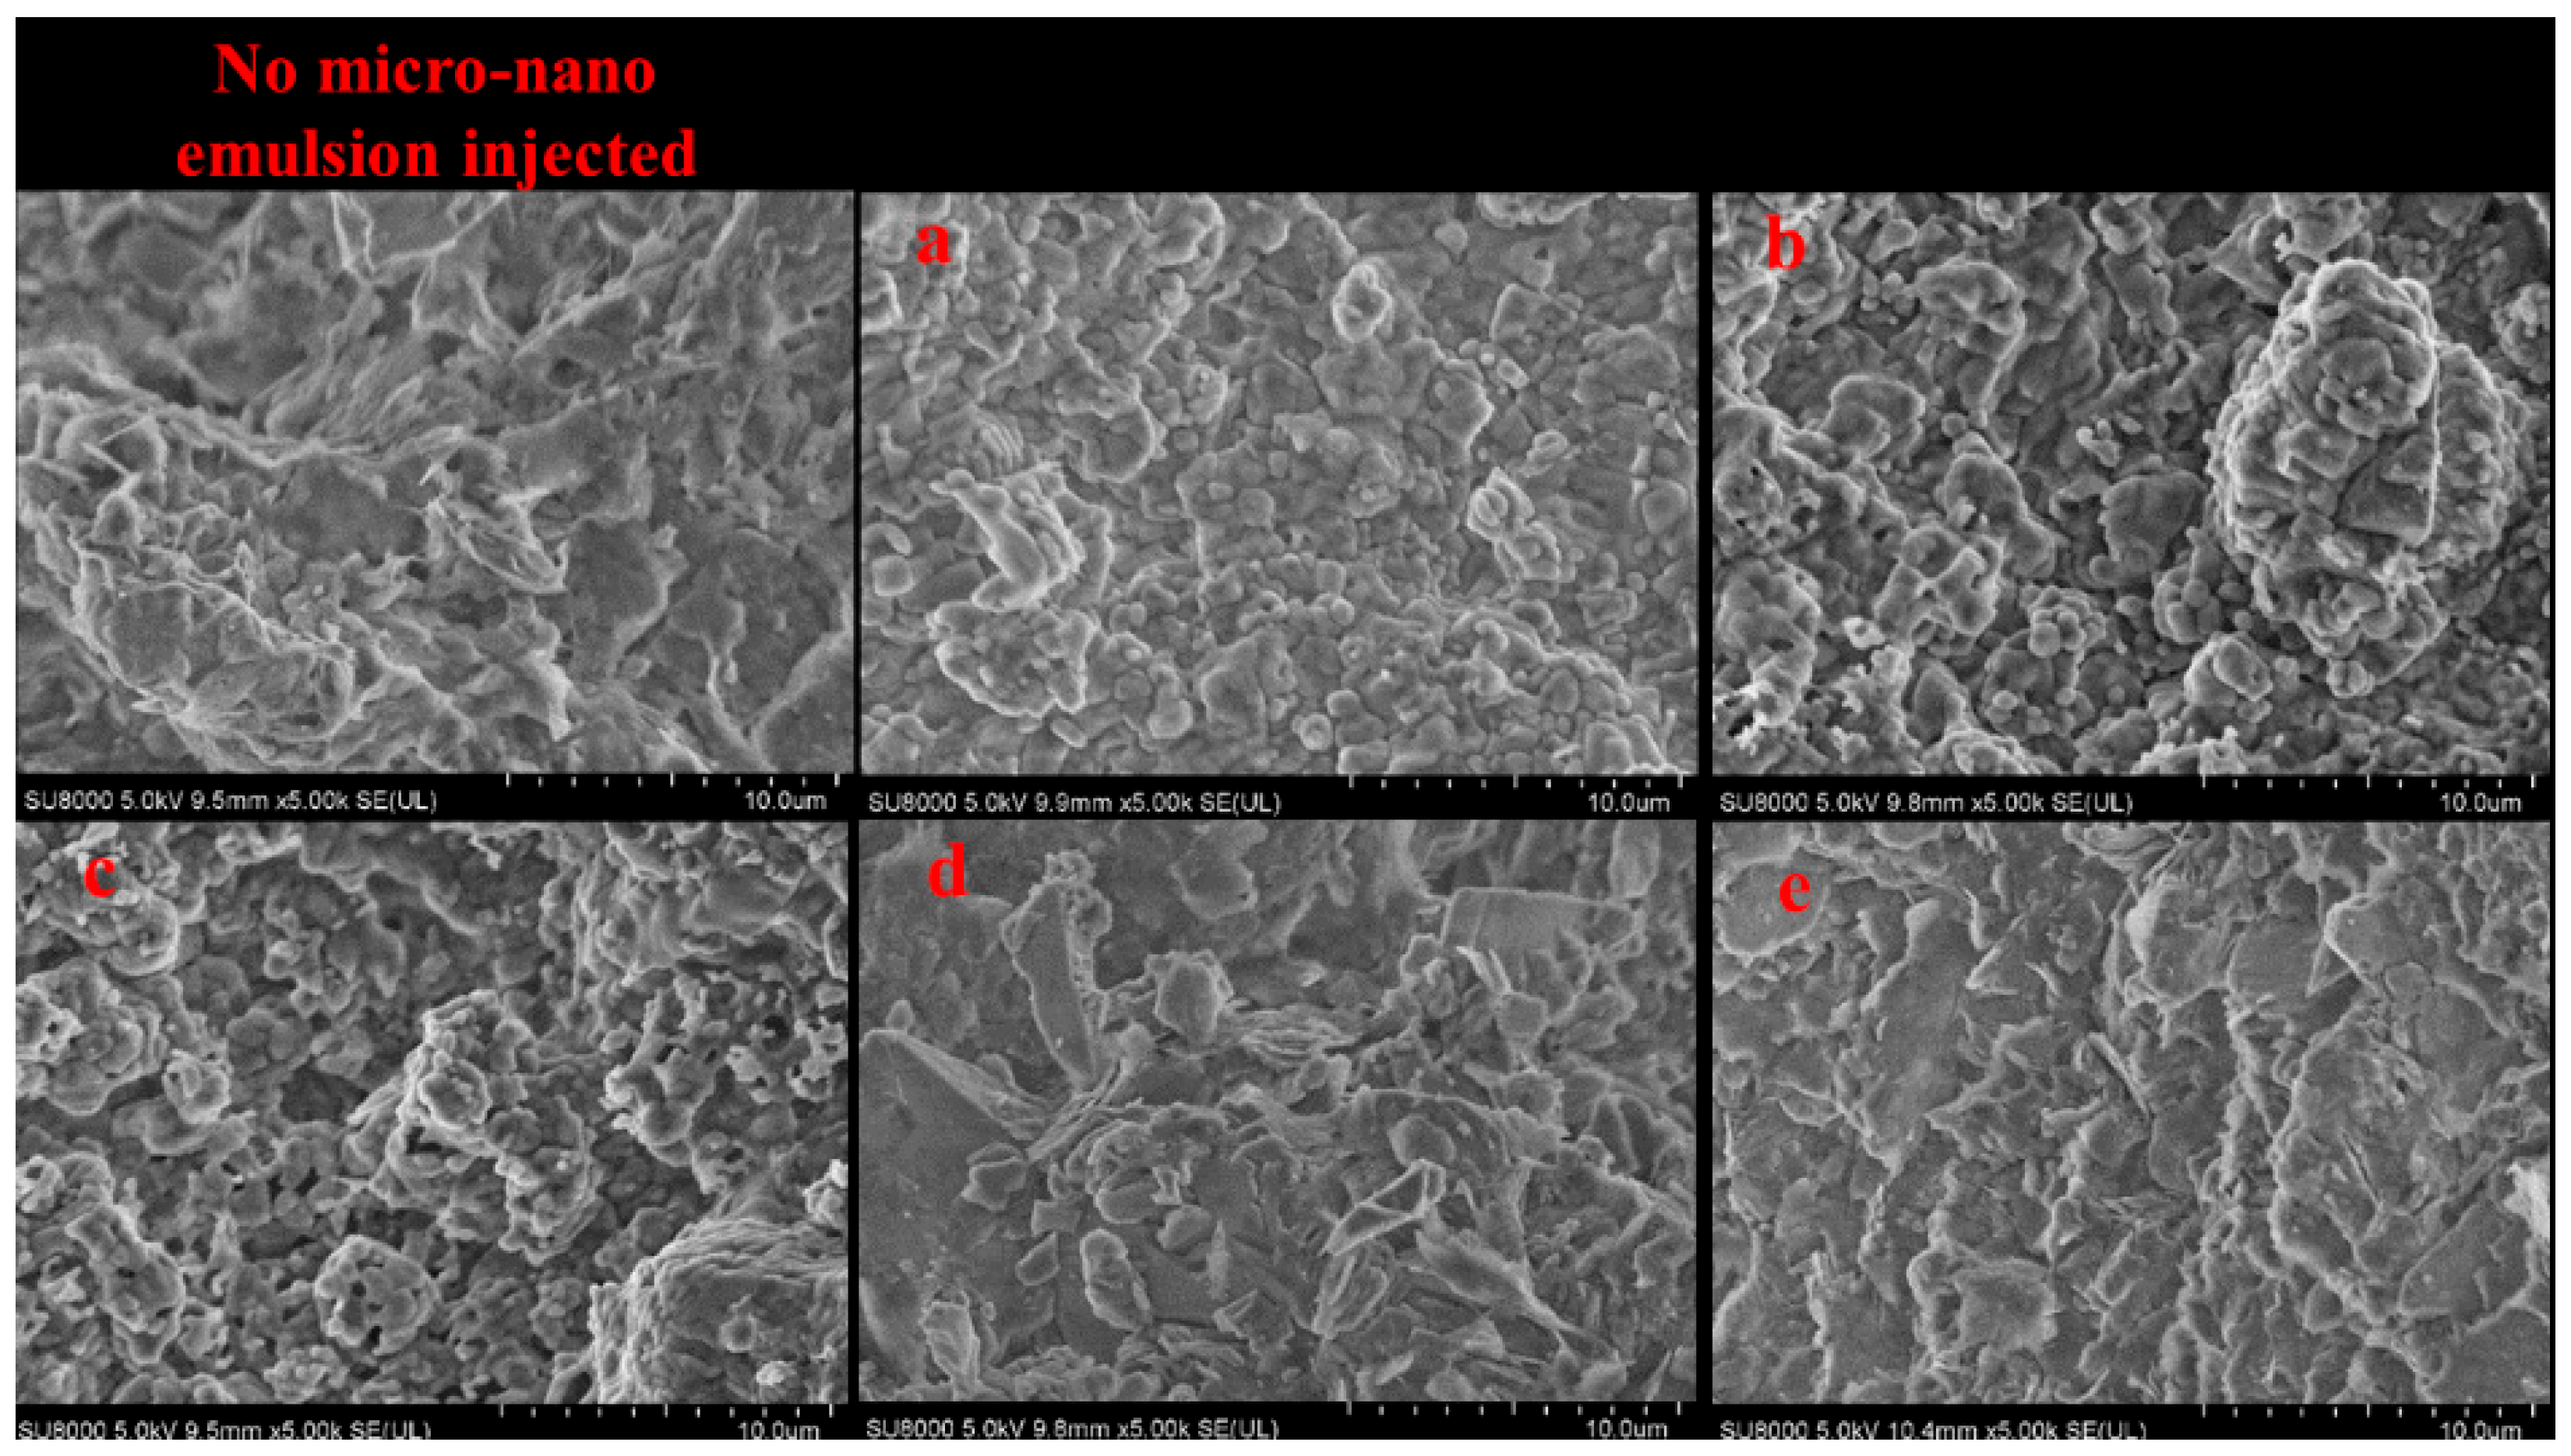
To reveal the depressurize and augmented injection mechanism, the nanoemulsion adsorption on the core surface and its surface morphology was observed by a scanning electron microscope. Scanning electron microscopy was used to characterize the micromorphology and structure at different positions before and after the injection of the nanoemulsion, and the experimental results are shown in Figure 13 and Figure 14.
From Figure 13 to Figure 14, the nanoemulsion can be firmly adsorbed in core pores or on the surface of the roar at positions a to c of the rock, forming an adsorption layer, but no nanoparticles can be adsorbed at positions d to e of the core. It can be seen that after injecting the nanoemulsion into the core, it will be adsorbed on the core pores or the surface of the roar, forming an adsorption layer, which will change the wettability of the core and reduce the interfacial tension of oil and water in the pores or the roar, to reduce the seepage resistance of oil and water in the rock and achieve the effect of depressurized and augmented injection.

4. Conclusions

(1)
Under the conditions of 30 °C and 65 °C, the nanoemulsion with different concentrations has good compatibility with the brine, and no turbidity or precipitation occurs.
(2)
The gas–liquid surface tension of the nanoemulsion system with different concentrations (0.03–0.5%) prepared by different brine is around 30 mN·m−1, and the oil–water interfacial tension decreases with the concentration increasing from 0.03% to 0.5%. When the concentration is between 0.3% and 0.5%, the oil–water interfacial tension was between 0.59 and 1.27 mN·m−1.
(3)
The wetting contact angle between brine and crude oil and rock is 33.2° when no nanoemulsion is added. The wetting contact angle increases with the addition of the nanoemulsion. With the concentration increasing from 0.1% to 0.5%, the wetting contact angle increases from 39.7° to 50.6°. It indicates that the depressurization of the nanoemulsion can adjust the wettability of the rock surface, and the hydrophilicity is weakened, which has a certain ability of wettability alteration.
(4)
When the injection concentration is 0.5% and slug size is 1.0 PV, as the injection rate increases from 0.05 mL·min−1 to 0.2 mL·min−1, the depressurization rate of the nanoemulsion increased first and then decreased. At low injection rates, the adhesion volume fraction of the nano injection emulsion increases, and the thickness of the adsorption layer on the core wall affects the permeability and porosity of the core and affects the depressurization rate. When the injection rate is too high, the throat wall of the core hole cannot adsorb enough nanoemulsion, nor can it achieve a good depressurization and augmented injection effect. The reasonable injection rate of depressurization and injection augmented is between 0.1~0.2 mL·min−1. When the injection rate is 0.1 mL·min−1 and slug size is 1.0 PV, as the concentration was in the range of 0.2%,0.3%, and 0.5%, the depressurization rate is 9.19%, 12.71%, and 16.87%, respectively. With the increasing injection concentration, the depressurization rate increase. When the single slug injection method is used to inject 1 PV, 2 PV, and 4 PV with the concentration of 0.5% at the speed of 0.1 mL·min−1, the depressurization rate is about 16%, so the emulsion can play a certain effect of depressurization and augment injection.
(5)
The microscopic morphology and structure of the core after the injection of the nanoemulsion were observed by scanning electron microscopy. It can be seen that the emulsion can be adsorbed in the pore of the core to form a spherical adsorption layer. The adsorption layer changes its wettability. Combined with reducing the oil–water interfacial tension and reducing the seepage resistance of oil and water in the core, this works to achieve the effect of depressurization and augment injection.
Despite promising laboratory results, this study has several limitations that warrant discussion. Firstly, the experiments were conducted on relatively homogeneous core plugs under idealized conditions, which do not fully represent the complex heterogeneity, natural fracture networks, and dynamic pressure variations in actual ultra-low-permeability reservoirs. Secondly, the long-term stability of the nanoemulsion under prolonged reservoir aging and its dynamic flow behavior within the porous media require further investigation, as static SEM observations alone are insufficient to capture the in situ displacement process. Scaling up these findings to field applications presents several key challenges. Primarily, there is a risk of significant chemical retention due to adsorption near the wellbore, which could hinder the nanoemulsion’s propagation deep into the formation. Furthermore, the nanoemulsion’s structural integrity may be compromised by high shear degradation during surface pumping and injection. Finally, the economic feasibility of injecting large slug sizes is a major concern, necessitating the optimization of injection strategies to balance technical performance with operational costs in future field trials.

Author Contributions

Conceptualization, L.Z.; Methodology, L.Z.; Software, L.Z.; Validation, C.Y.; Formal analysis, C.Y. and T.W.; Investigation, Y.L. and H.P.; Resources, L.Z., Y.L. and W.Z.; Data curation, T.W.; Writing—original draft, H.P.; Writing—review & editing, H.P.; Visualization, H.H. and W.Z.; Supervision, H.H.; Project administration, H.H., T.W. and W.Z. All authors have read and agreed to the published version of the manuscript.

Funding

This research received no external funding.

Data Availability Statement

The original contributions presented in this study are included in the article. Further inquiries can be directed to the corresponding author.

Conflicts of Interest

Authors Lijun Zheng, Changhao Yan, Teng Wang, Yunlong Liu and Wenjing Zhao were employed by PetroChina Changqing Oilfield Company. The remaining authors declare that the research was conducted in the absence of any commercial or financial relationships that could be construed as a potential conflict of interest. The PetroChina Changqing Oilfield Company had no role in the design of the study; in the collection, analyses, or interpretation of data; in the writing of the manuscript, or in the decision to publish the results.

References

  1. Zhao, J.; An, X.; Jing, W.; Wang, J.; Fan, J.; Kang, X.; Tan, X.; Li, W. A quantitative evaluation for well pattern adaptability in ultra-low permeability oil reservoirs: A case study of Triassic Chang 6 and Chang 8 reservoirs in Ordos Basin. Pet. Explor. Dev. 2018, 45, 499–506. [Google Scholar] [CrossRef]
  2. Shahri, M.P.; Shadizadeh, S.R.; Jamialahmadi, M. Applicability test of new surfactant produced from Zizyphus Spina-Christi leaves for enhanced oil recovery in carbonate reservoirs. J. Jpn. Pet. Inst. 2012, 55, 27–32. [Google Scholar] [CrossRef]
  3. Li, S.; Tang, J.; Ding, Y.; Liu, S.; Liu, G.; Cai, B. Recovery of low permeability reservoirs considering well shut-ins and surfactant additivities. Energies 2017, 10, 1279. [Google Scholar] [CrossRef]
  4. Ko, K.M.; Chon, B.H.; Jang, S.B.; Jang, H.Y. Surfactant flooding characteristics of dodecyl alkyl sulfate for enhanced oil recovery. J. Ind. Eng. Chem. 2014, 20, 228–233. [Google Scholar] [CrossRef]
  5. Xiong, W.; Gao, S.; Hu, Z.; Xue, H.; Ye, L. An experimental study on the percolation characteristics of single phase gas in low and ultra-low permeability sandstone gas reservoirs. Nat. Gas Ind. 2009, 29, 75–77. [Google Scholar]
  6. Shuo, Z. Research on the Mechanism of Decompression and Augmented Injection during Waterflooding Development in Low Permeability Reservoirs. Open Pet. Eng. J. 2012, 5, 53–57. [Google Scholar] [CrossRef]
  7. Li, X. Analysis on Reservoir Characteristics and Formation Mechanism of Low Permeability Reservoir. J. Changzhou Univ. Nat. Sci. Ed. 2015, 27, 39–44. [Google Scholar]
  8. Adeniyi, O.D.; Nwalor, J.U.; Ako, C.T. A Review on Waterflooding Problems in Nigeria’s Crude Oil Production. J. Dispers. Sci. Technol. (JDST) 2008, 29, 362–365. [Google Scholar] [CrossRef]
  9. Zhang, X.; Bi, Y.; Wang, L. Research on activity of water increase injection technique in low permeability. Pet. Geol. Eng. 2009, 23, 121–123. [Google Scholar]
  10. AlMubarak, T.; AlKhaldi, M.; AlMubarak, M.; Rafie, M.; Al-Ibrahim, H.; AlBokhari, N. Investigation of acid-induced emulsion and asphaltene precipitation in low permeability carbonate reservoirs. In Proceedings of the SPE Saudi Arabia Section Annual Technical Symposium and Exhibition, Al-Khobar, Saudi Arabia, 21–23 April 2015; OnePetro: Richardson, TX, USA, 2015. [Google Scholar]
  11. Hall-Thompson, B.; Ernesto, A.R.; Abdulrahman, N.; Alsuhaimi, A. Acid stimulation-best practices for design, selection and testing of acid recipes in low permeability carbonate reservoirs. In Proceedings of the International Petroleum Technology Conference, Dhahran, Saudi Arabia, 13–15 January 2020; OnePetro: Richardson, TX, USA, 2020. [Google Scholar]
  12. Zhang, S.; Fang, Z. Permeability damage micro-mechanisms and stimulation of low-permeability sandstone reservoirs: A case study from Jiyang Depression, Bohai Bay Basin, China. Pet. Explor. Dev. 2020, 47, 374–382. [Google Scholar] [CrossRef]
  13. Favero, C.; Gaillard, N.; Giovannetti, B. Formulations of Water-Soluble Polymers and Stabilizing Additives for Injecting a Single Compound Useable in Injection Fluids for Chemical Enhanced Oil Recovery. U.S. Patent 9,469,805, 18 October 2016. [Google Scholar]
  14. Jamaloei, B.Y. Chemical flooding in naturally fractured reservoirs: Fundamental aspects and field-scale practices. Oil Gas Sci. Technol.–Rev. d’IFP Energ. Nouv. 2011, 66, 991–1004. [Google Scholar] [CrossRef][Green Version]
  15. Stoll, W.M.; al Shureqi, H.; Finol, J.; Al-Harthy, S.A.; Oyemade, S.; de Kruijf, A.; van Wunnik, J.; Arkesteijn, F.; Bouwmeester, R.; Faber, M.J. Alkaline/surfactant/polymer flood: From the laboratory to the field. SPE Reserv. Eval. Eng. 2011, 14, 702–712. [Google Scholar] [CrossRef]
  16. Zhang, K.; Qin, J. The effect of alkali and surfactant on polymer molecular structure. Pet. Sci. Technol. 2011, 29, 183–191. [Google Scholar] [CrossRef]
  17. Chen, P.; Mohanty, K.K. Surfactant-enhanced oil recovery from fractured oil-wet carbonates: Effects of low ift and wettability alteration. In Proceedings of the SPE International Symposium on Oilfield Chemistry, The Woodlands, TX, USA, 13–15 April 2015; OnePetro: Richardson, TX, USA, 2015. [Google Scholar]
  18. Li, X.D.; Liu, Y.; Li, X.; Liu, Y.B.; Ge, S.Q.; Li, B.; Wang, R.H. Current status and prospects of surfactant depressurized-augmented injection. Petrochem. Ind. Appl. 2020, 39, 1–4+13. [Google Scholar]
  19. Pang, Z.-X.; Liu, H.-Q.; Liu, X.-L. Characteristics of formation damage and variations of reservoir properties during steam injection in heavy oil reservoir. Pet. Sci. Technol. 2010, 28, 477–493. [Google Scholar] [CrossRef]
  20. Bi, Z.; Qi, L.; Liao, W. Dynamic surface properties, wettability and mimic oil recovery of ethanediyl-α, β-bis (cetyldimethylammonium bromide) on dodecane modified silica powder. J. Mater. Sci. 2005, 40, 2783–2788. [Google Scholar] [CrossRef]
  21. Xiao, C. Effect of oil components on interfacial tension of surfactants in chemical flooding. Spec. Oil Gas Reserv. 2011, 18, 103–105. [Google Scholar]
  22. Guo, J.; Gao, X. The optimization for surfactant oil displacement system in low permeability reservoirs. Appl. Chem. Ind. 2011, 40, 940–945. [Google Scholar]
  23. Wu, J.-C. Analysis of mechanisms of lowering trigger pressure of extra low permeability reservoirs. J.-Daqing Pet. Inst. 2003, 27, 83–84. [Google Scholar]
  24. Son, J.; Neale, G.H.; Hornof, V. Interfacial tension and phase behaviour characteristics of petroleum sulfonate/lignosulfonate mixtures. Can. J. Chem. Eng. 1982, 60, 684–691. [Google Scholar] [CrossRef]
  25. Ogunberu, A.L.; Ayub, M. The role of wettability in petroleum recovery. Pet. Sci. Technol. 2005, 23, 169–188. [Google Scholar] [CrossRef]
  26. Robin, M. Interfacial phenomena: Reservoir wettability in oil recovery. Oil Gas Sci. Technol. 2001, 56, 55–62. [Google Scholar] [CrossRef]
  27. Zhao, L.; Wang, Z.-L.; Wu, X.-J.; He, N.-Z.; Xiao, S.-M. Effect of surfactant on seepage characteristics of ultra-low permeability reservoir. Editor. Dep. Pet. Geol. Recovery Effic. 2015, 21, 72–75. [Google Scholar]
  28. Li, K. Theoretical development of the Brooks-Corey capillary pressure model from fractal modeling of porous media. In Proceedings of the SPE/DOE Symposium on Improved Oil Recovery, Tulsa, OK, USA, 17–21 April 2004; OnePetro: Richardson, TX, USA, 2004. [Google Scholar]
  29. Li, D. Fluid Flow Mechanism of Low Permeability Reservoirs; Chemical Industry Press: Beijing, China, 1999. [Google Scholar]
  30. Wang, Y.; Yang, R.-G.; Yu, X.-D.; Guo, Z.-H.; Pang, B. Study on Surfactant Depressurization and Injection Increase System for Layered Water Injection Wells in Low Permeability Blocks of Yanchang Oilfield. Contemp. Chem. Ind. 2022, 51, 1996–1999. [Google Scholar] [CrossRef]
  31. Reis, J.C. Water advance and oil production rate in a naturally fractured reservoir during waterflooding. J. Pet. Sci. Eng. 2002, 36, 19–32. [Google Scholar] [CrossRef]
  32. Zhang, L. Surfactants for Production and Injection Enhancement of High-temperature and Low-Permeability Reservoir in Bonan Oilfield. Master’s Thesis, College of Petroleum Engineering, China University of Petroleum (East China), Qingdao, China, 2011. [Google Scholar]
  33. Guo, D. Application of Nano-technology in enhancing oil recovery. Adv. Fine Fetrochem. 2004, 5, 1–5. [Google Scholar]
  34. Zhao, M.; Cheng, Y.; Wu, Y.; Dai, C.; Gao, M.; Yan, R.; Guo, X. Enhanced oil recovery mechanism by surfactant-silica nanoparticles imbibition in ultra-low permeability reservoirs. J. Mol. Liq. 2022, 348, 118010. [Google Scholar] [CrossRef]
  35. Olayiwola, S.O.; Dejam, M. Synergistic interaction of nanoparticles with low salinity water and surfactant during alternating injection into sandstone reservoirs to improve oil recovery and reduce formation damage. J. Mol. Liq. 2020, 317, 114228. [Google Scholar] [CrossRef]
  36. Zargartalebi, M.; Kharrat, R.; Barati, N. Enhancement of surfactant flooding performance by the use of silica nanoparticles. Fuel 2015, 143, 21–27. [Google Scholar] [CrossRef]
  37. Qin, W.; Zhang, Z.; Hou, B.; Yang, J. Advance of nanotechnology application in enhancing oil recovery. Duankuai Youqitian (Fault-Block Oil Gas Field) 2013, 20, 10–13. [Google Scholar]
  38. Li, X.-N.; Feng, Q.; Gao, P.; Huang, Z.-J.; Gong, R.X.; Chen, X.-C.; Li, J. Application Progress of Nano-SiO2 in Enhanced Oil Recovery and Depressurization and Injection-augmenting. Sci. Technol. Eng. 2021, 21, 8291–8300. [Google Scholar]
  39. Deglint, H.J.; Clarkson, C.R.; DeBuhr, C.; Ghanizadeh, A. Live imaging of micro-wettability experiments performed for low-permeability oil reservoirs. Sci. Rep. 2017, 7, 4347. [Google Scholar] [CrossRef] [PubMed]
  40. Minakov, A.; Zhigarev, V.; Skorobogatova, A.; Guzei, D.; Pryazhnikov, A.; Pryazhnikov, M.; Lubenets, S.; Vaganov, R. Comprehensive Study of the Efficiency of Low-Concentration Nanoemulsions with Diesel Fuel for Enhanced Oil Recovery. Colloids Interfaces 2025, 9, 86. [Google Scholar] [CrossRef]
  41. Zhu, Y.; Zhang, Q.; Han, X.; Chen, G.; Mao, S.; Li, Y.; Cao, M. Microemulsion flooding mechanisms in strongly heterogeneous conglomerate reservoirs from interfacial behavior and pore-scale dynamics. Colloids Surf. A Physicochem. Eng. Asp. 2026, 737, 139939. [Google Scholar] [CrossRef]
  42. Huang, H.; Li, K.; Xie, W.; Le, J.; Li, Y. In Situ Micro-CT Study of Nanoemulsion for Enhanced Oil Recovery in Low-Permeability Reservoirs. Energy Fuels 2026, 40, 5085–5092. [Google Scholar]
  43. Fei, R.; Li, M.; Yuan, S.; Cao, C.; Zhou, F.; Yao, E.; Bai, H.; Ding, D. Study of the effect of nanoemulsion on the EOR in low-permeability, highly waxy oil reservoirs based on NMR displacement experiments. Pet. Sci. 2026, 23, 897–912. [Google Scholar] [CrossRef]
Figure 1. Nanoparticle size analyzer.
Processes 14 01463 g001
Figure 2. Texas-500C interfacial tensiometer.
Processes 14 01463 g002
Figure 3. Flow chart of core displacement experiment.
Processes 14 01463 g003
Figure 4. Turbidity curves of nanoemulsions with different concentrations in brine.
Processes 14 01463 g004
Figure 5. Particle size distribution curve of nanoemulsion, (a) First measurement result; (b) Second measurement result; (c) Third measurement result.
Processes 14 01463 g005
Figure 6. Gas–liquid surface tension of nanoemulsion.
Processes 14 01463 g006
Figure 7. Oil–water interfacial tension of nanoemulsion.
Processes 14 01463 g007
Figure 8. Oil–water solid wetting contact angle under the action of different concentrations of nanoemulsion.
Processes 14 01463 g008
Figure 9. Wetting contact angle and concentration relationship.
Processes 14 01463 g009
Figure 10. Depressurization rate of nanoemulsion at different injection rates.
Processes 14 01463 g010
Figure 11. Depressurization rate of nanoemulsion at different injection concentrations.
Processes 14 01463 g011
Figure 12. Depressurization rate of nanoemulsion at different injection slug sizes.
Processes 14 01463 g012
Figure 13. Injection of nanoemulsion using rock cores.
Processes 14 01463 g013
Figure 14. Scanning electron microscopy of core after injection of nanoemulsion.
Processes 14 01463 g014
Table 1. Core data parameters.
CoreLength
/cm
Diameter
/cm
Porosity
/%
Permeability
/10−3 μm2
Oil Saturation
/%
1#4.7062.51513.990.2739.76
2#5.1052.51513.260.2438.69
3#4.8802.51513.660.2236.25
4#4.7722.51513.970.2238.97
5#4.9122.51513.450.2436.59
6#5.1992.51514.260.2632.61
7#4.9922.51513.920.2532.46
Table 2. Compositions of simulated produced water.
Ion CompositionK+ and Na+Ca2+Mg2+SO42−HCO3Cl
Ion concentration
/mg·L−1
23,439.81086.180.0554.6159.828,223.0
Table 3. Compatibility of nanoemulsion with brine.
Nanoemulsion
Concentration
Compatibility of Nanoemulsion with Brine at Different Temperatures
30 °C65 °C
0.1clearclear
0.2clearclear
0.3clearclear
0.4clearclear
0.5clearclear
Table 4. Average value and standard deviation in particle size measurement.
ExperimentD10/nmD50/nmD90/nm
17.3914.1327.02
28.7214.1322.97
38.6916.6127.01
standard deviation0.761.432.34
Table 5. Standard deviation in gas–water interfacial tension experiment.
ConcentrationExperimental NumberStandard
Deviation
123
0.0334.5533.2134.920.91
0.0533.0032.0433.990.81
0.128.9927.8528.810.51
0.1528.0727.2629.590.98
0.228.7527.9828.430.53
0.331.8630.6231.240.98
0.429.2928.2628.570.43
0.527.3528.3329.560.91
Table 6. Standard deviation in Oil-water interfacial tension experiment.
ConcentrationExperimental NumberStandard
Deviation
123
0.038.168.1488.82850.38
0.054.725.575.700.47
0.12.142.722.530.28
0.151.601.831.100.32
0.21.361.301.910.28
0.30.731.070.840.16
0.40.781.651.250.38
0.51.581.170.960.25
Table 7. Standard deviation of the contact angle measurement experiment.
Concentration/%Contact Angle/°
123Standard
Deviation
072.673.273.50.46
0.150.851.250.30.45
0.247.947.546.20.89
0.342.643.142.50.32
0.439.839.438.70.56
0.533.633.132.90.36
Table 8. The influence of injection rate on the core data parameters.
CoreInjection Rate
/mL·min−1
Water Drive Pressure
/MPa
Subsequent Water Drive Pressure
/MPa
Depressurization Rate/%
3#0.0510.149.555.82
1#0.113.8311.5016.87
4#0.229.8425.6713.97
Table 9. The influence of injection concentration on the core data parameters.
CoreConcentration
/%
Water Drive Pressure
/MPa
Subsequent Water Drive Pressure
/MPa
Depressurization Rate/%
7#0.2016.3314.839.19
2#0.3015.4513.4912.71
1#0.5013.8311.5016.87
Table 10. The influence of injection slug size on the core data parameters.
CoreInjected PVWater Drive
Pressure/MPa
Subsequent Water Drive Pressure
/MPa
Depressurization Rate/%
1#1.013.8311.5016.87
5#2.013.8311.7015.38
6#4.015.2312.8315.76
Disclaimer/Publisher’s Note: The statements, opinions and data contained in all publications are solely those of the individual author(s) and contributor(s) and not of MDPI and/or the editor(s). MDPI and/or the editor(s) disclaim responsibility for any injury to people or property resulting from any ideas, methods, instructions or products referred to in the content.