1. Introduction
In recent years exploration has increasingly moved to normally pressured shale gas [
1], with pressure coefficients of about 0.9–1.3, expected to have large resource potential and a broader distribution, particularly near basin margins and in structurally complicated areas. The difficulty lies in that a normal pressure often weakens multiple indicators simultaneously. In Chinese shale practice, normally pressured shale is commonly described as “three low, one strong, and one complex”, i.e., low formation energy, low pore pressure, and low gas saturation, together with strong tectonic reworking (multi-stage uplift and faulting) and complex preservation conditions. These characteristics can trigger a series of challenges in reservoir prediction and fracability evaluation. For example, locations that appear favorable from a purely geological viewpoint may not be the easiest to stimulate, while zones that are easier to fracture do not always have good preservation. Moreover, the seismic response is frequently too weak (or too mixed with structure and lithology effects) to support confident discrimination of gas-bearing and reservoir quality.
The Shixi block in Guizhou Province lies on the southeastern margin of the Sichuan Basin. The marine shale formations in the Shixi block are considered a favorable target area for the exploration and development of shallow, normally pressured shale gas. The Shixi block is usually considered a “dual-complexity” area, involving both near-surface karst and multi-phase structural deformation at depth. At present, exploration in Shixi is still limited, and several issues continue to restrict target selection and development planning, including poor seismic data quality, high uncertainty in structural interpretation, unclear seismic/rock-physics responses of key sweet-spot parameters, and insufficient understanding of the main controls on gas preservation.
In industrial practice, conventional shale gas evaluation often relies on ‘reservoir quality’ (e.g., TOC, porosity, and brittleness) as the primary decision-making metric. However, in the Shixi block, this approach has led to high exploration risks and inconsistent well performance. Our field analysis reveals that ‘good shale’ does not guarantee high productivity in this normally pressured, structurally complex setting. The industrial bottleneck lies in the ‘source–seal’ decoupling caused by multi-stage tectonic reworking. Therefore, the necessity of our ‘Four-in-One’ workflow is driven by the urgent need to shift from a ‘reservoir-centric’ to a ‘preservation-centric’ evaluation strategy. By integrating preservation conditions and paleogeomorphology, our workflow provides a more reliable basis for well deployment, effectively mitigating the risk of drilling into high-quality shale that has been compromised by structural leakage.
To address complex shale reservoirs, seismic–geology–engineering integration has been discussed and applied in both academia and industry [
2,
3]. The basic idea is to use high-quality 3D seismic data as a framework. We then incorporate geological interpretation, rock physics, geomechanics, and engineering information to build a model that connects structure, reservoir properties, and in situ stress for decision support [
4]. Representative studies include seismic imaging and data-quality improvement in complex areas [
5,
6], quantitative reservoir prediction using rock physics and pre-stack inversion [
7,
8,
9,
10], stress modeling and fracability evaluation [
11,
12,
13], fracture network characterization and preservation-related interpretation using multi-attribute methods [
14,
15,
16], and iterative updating in life-cycle workflows when production and monitoring data become available [
17,
18,
19]. This integrated thinking has supported North American shale development [
20,
21] and has also been extended to other unconventional plays worldwide [
22,
23].
However, direct application of “standard” seismic–geology–engineering integration in Shixi is constrained. Weak seismic signals and challenging statics and velocity modeling reduce imaging reliability, causing limited inversion and attribute interpretation reliability [
24]. Meanwhile, preservation is highly fault-controlled. We must resolve fault sealing, leakage, lateral sealing, and along-strike sealing variability to explain the sharply different gas indications between adjacent structural positions. Strong structural compartmentalization also leads to spatially variable in situ stress orientation and magnitude [
25]. Finally, under normal pressure, elastic indicators of gas-bearing and reservoir quality are weak and easily confounded by TOC, maturity, and microcrack-related effects, increasing rock-physics ambiguity [
26,
27,
28]. These issues are amplified in narrow, steep synclines, where integrated evaluation remains immature and assumptions valid in gentler structures may fail [
29,
30].
However, the direct application of ‘standard’ seismic–geology–engineering integration in the Shixi block has faced significant challenges. Previous exploration attempts, including the drilling of several vertical and horizontal wells, have yielded inconsistent results [
31,
32,
33]. The primary industrial problem is that these early efforts often relied on a ‘reservoir-centric’ approach, which failed to account for the ‘source–seal’ decoupling caused by multi-stage tectonic reworking [
34]. For instance, in several wells (e.g., Shixi-1 and Shidi-1), high-quality shale intervals with favorable TOC and brittleness were identified, yet the tested gas production remained low [
32]. This failure indicates that reservoir quality alone is insufficient for gas enrichment in this normally pressured, structurally complex setting [
1]. Consequently, the necessity of our integrated approach is justified by the urgent need to elevate ‘preservation condition’ to an equal weight with ‘reservoir quality’, ensuring that future well deployment targets stable structural compartments rather than just high-quality shale.
To address these challenges, this study develops a targeted seismic–geology–engineering integration strategy suitable for the ‘dual-complexity’ setting of the Shixi block. The key contributions of this work are as follows: (1) An integrated workflow was proposed to elevate ‘preservation condition’ to an equal weight with ‘reservoir quality’, incorporating engineering feasibility and paleogeomorphology to form a comprehensive quantitative index. (2) A tiered strategy—utilizing coherence, curvature, and ant-tracking—was developed to effectively characterize faults and fractures across different scales, significantly reducing interpretation ambiguity in low-SNR seismic areas. (3) A dynamic feedback loop was established where seismic-derived predictions are continuously refined by real-time drilling and logging data, providing a robust solution for managing uncertainty in complex structural settings.
2. Geological Setting of the Shixi Block
2.1. Geographic Location and Tectonic Setting
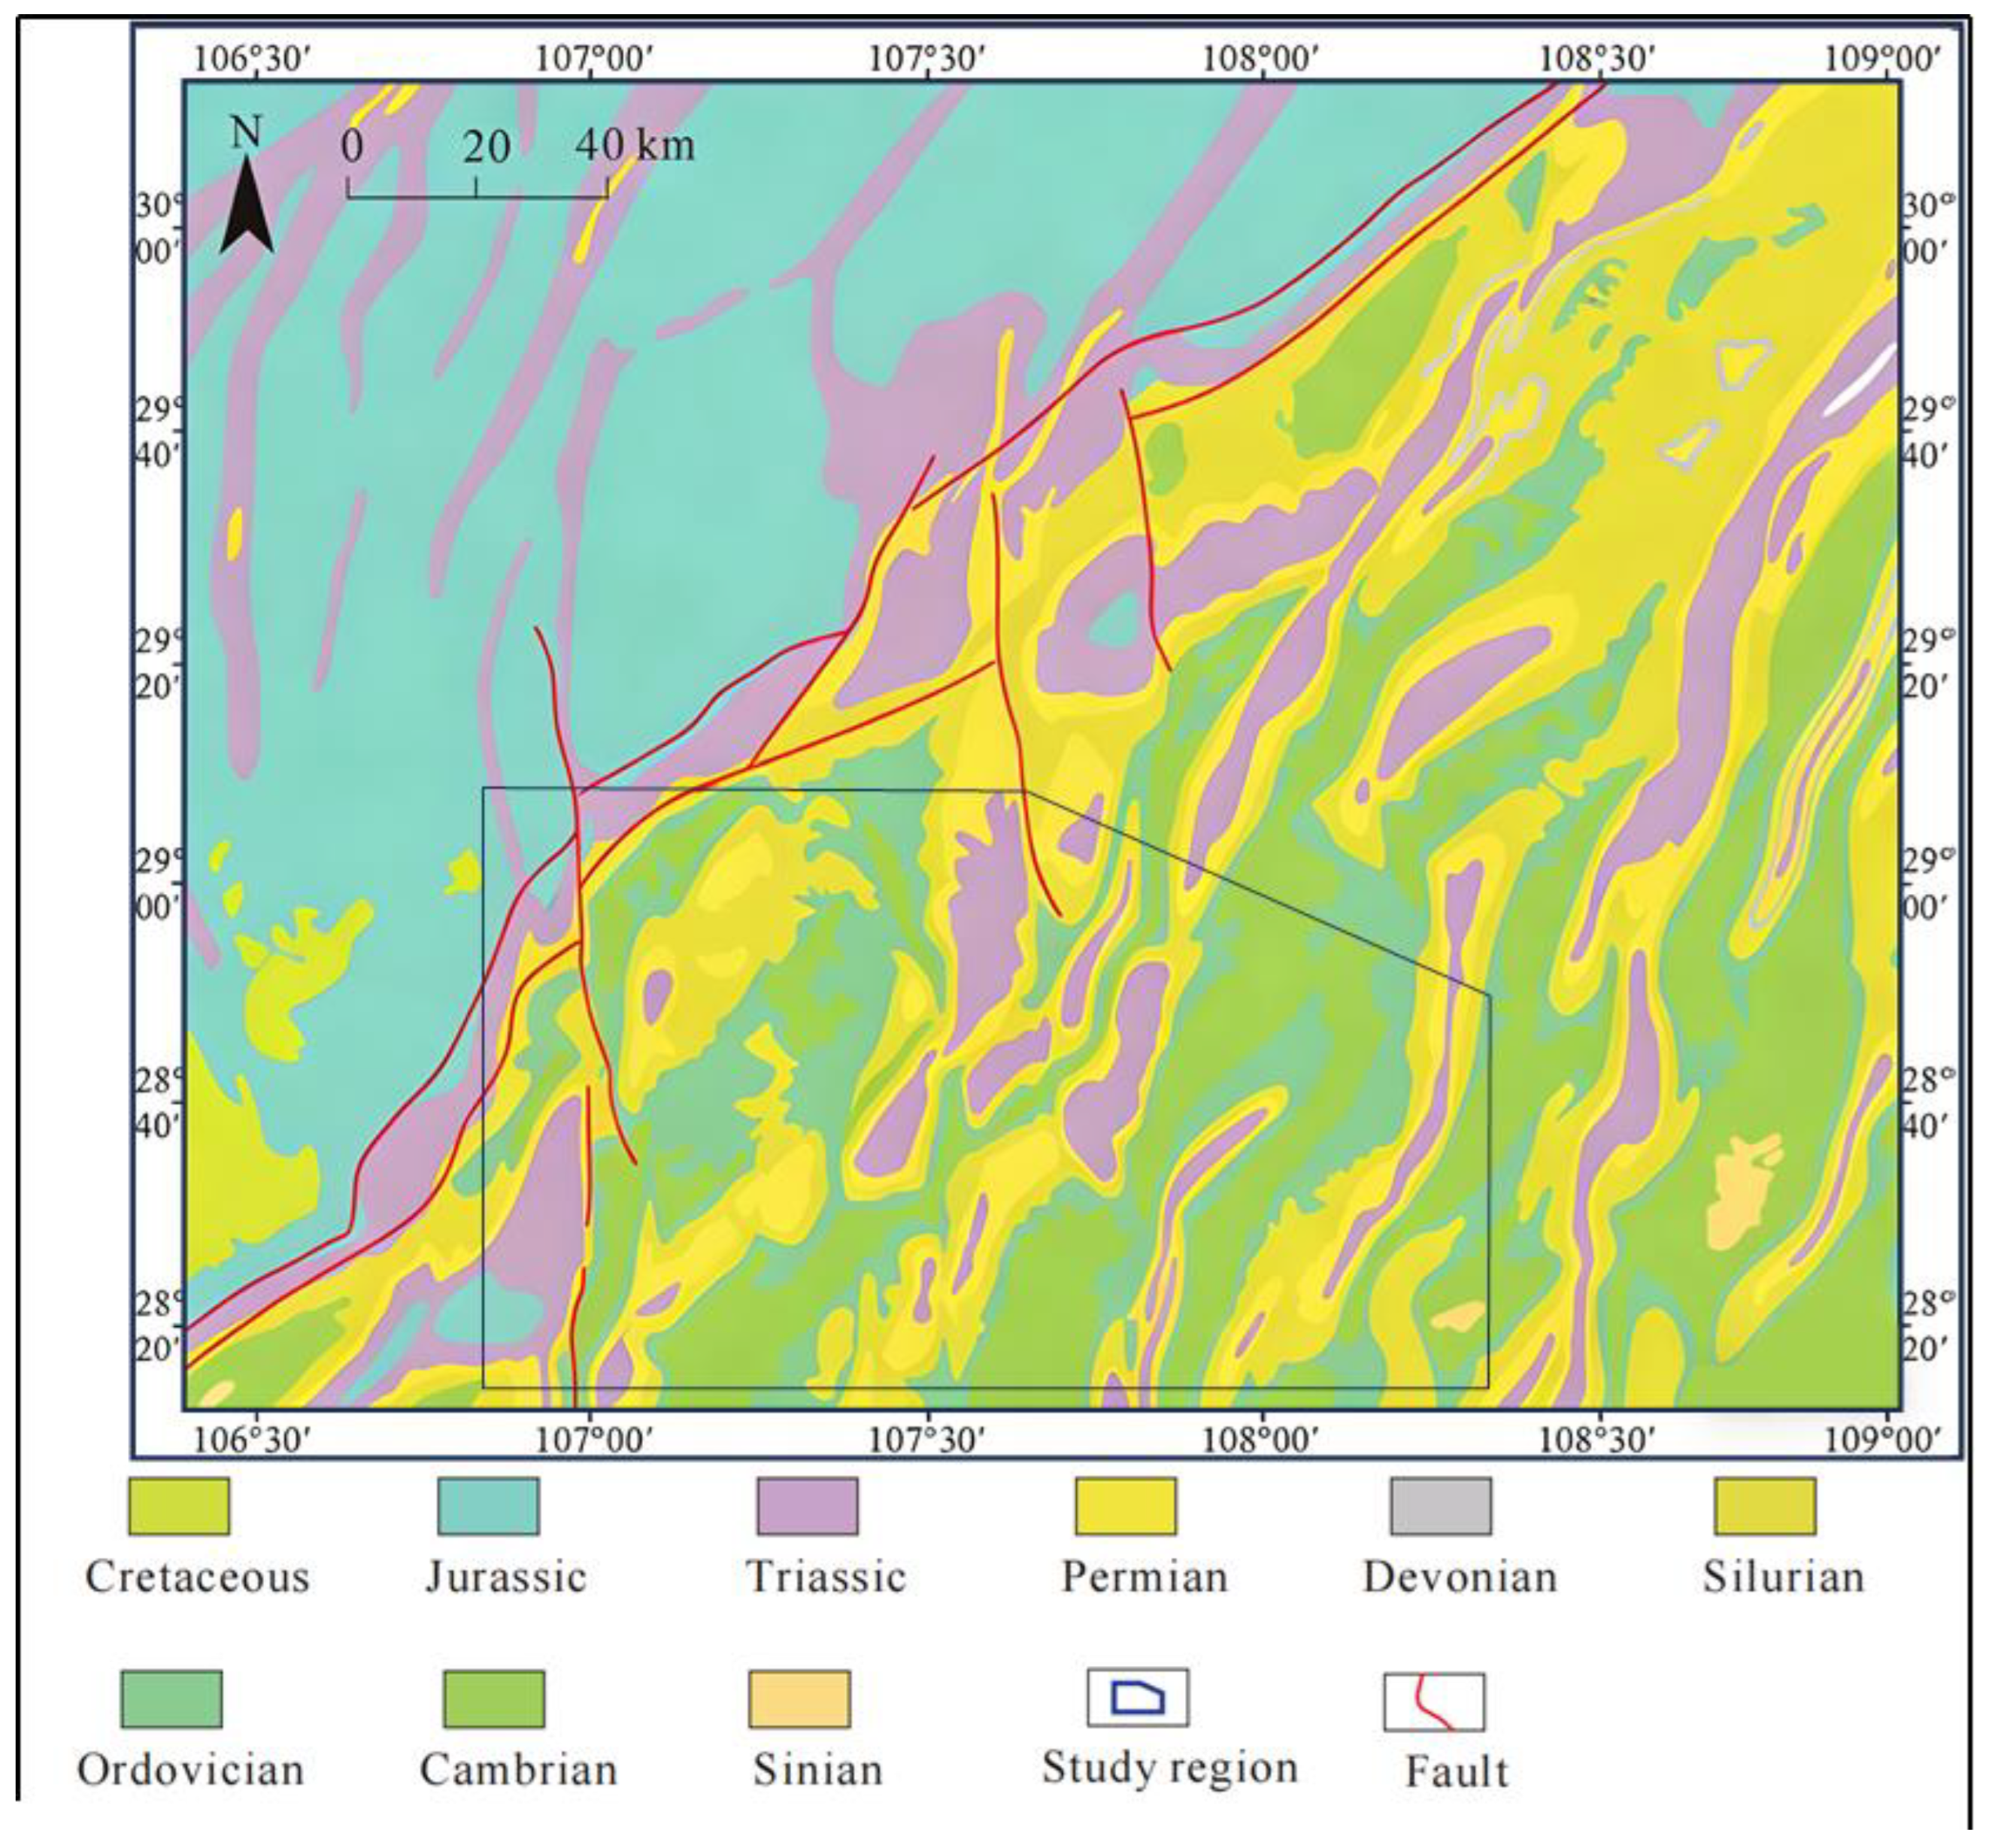
The Shixi block is situated in the extra-basin fold belt along the southeastern margin of the Sichuan Basin (
Figure 1). It is administratively located in northern Tongzi County, Guizhou Province, and covers approximately 57.5 km
2. Structurally, the block belongs to the N–S-trending “ge-shi”-type fold deformation belt in the northern Guizhou uplift zone. The regional framework is dominated by a narrow and steep syncline, which is strongly controlled by the Nanchuan–Zunyi fault. The syncline exhibits asymmetric wings: the eastern limb is relatively gentle with dip angles typically less than 20°, while the western limb is significantly steeper, with dip angles locally exceeding 30°. This structural asymmetry is a key factor contributing to the ‘dual-complexity’ drilling conditions in the Shixi block.
Tectonic deformation is intense, and the area is characterized by NE–NNE-trending folds accompanied by small-scale faults, mainly thrust faults. Although the structural configuration is complex, individual faults generally have limited lateral extension and small throws. These faults may locally deteriorate preservation conditions by providing leakage pathways; however, they also contribute to the structural trapping background and compartmentalization that are important for shale gas accumulation in such a highly deformed setting.
To support exploration, a 3D seismic survey (full-fold area about 65 km2) was completed in December 2022 in the Tongzi Shixi Syncline. Multiple vertical and horizontal wells have been drilled. Several key wells (e.g., Shixi 1-1HF and Shixi 1-2HF) have reported industrial gas flows, with tested daily production reaching several hundred to over one thousand cubic meters, and cumulative production from some wells exceeding 1.0 × 10⁶ m3. These results indicate that the Upper Ordovician Wufeng formation and the Lower Silurian Longmaxi formation shales have favorable potential for further industrial development.
2.2. Regional Stratigraphic Framework
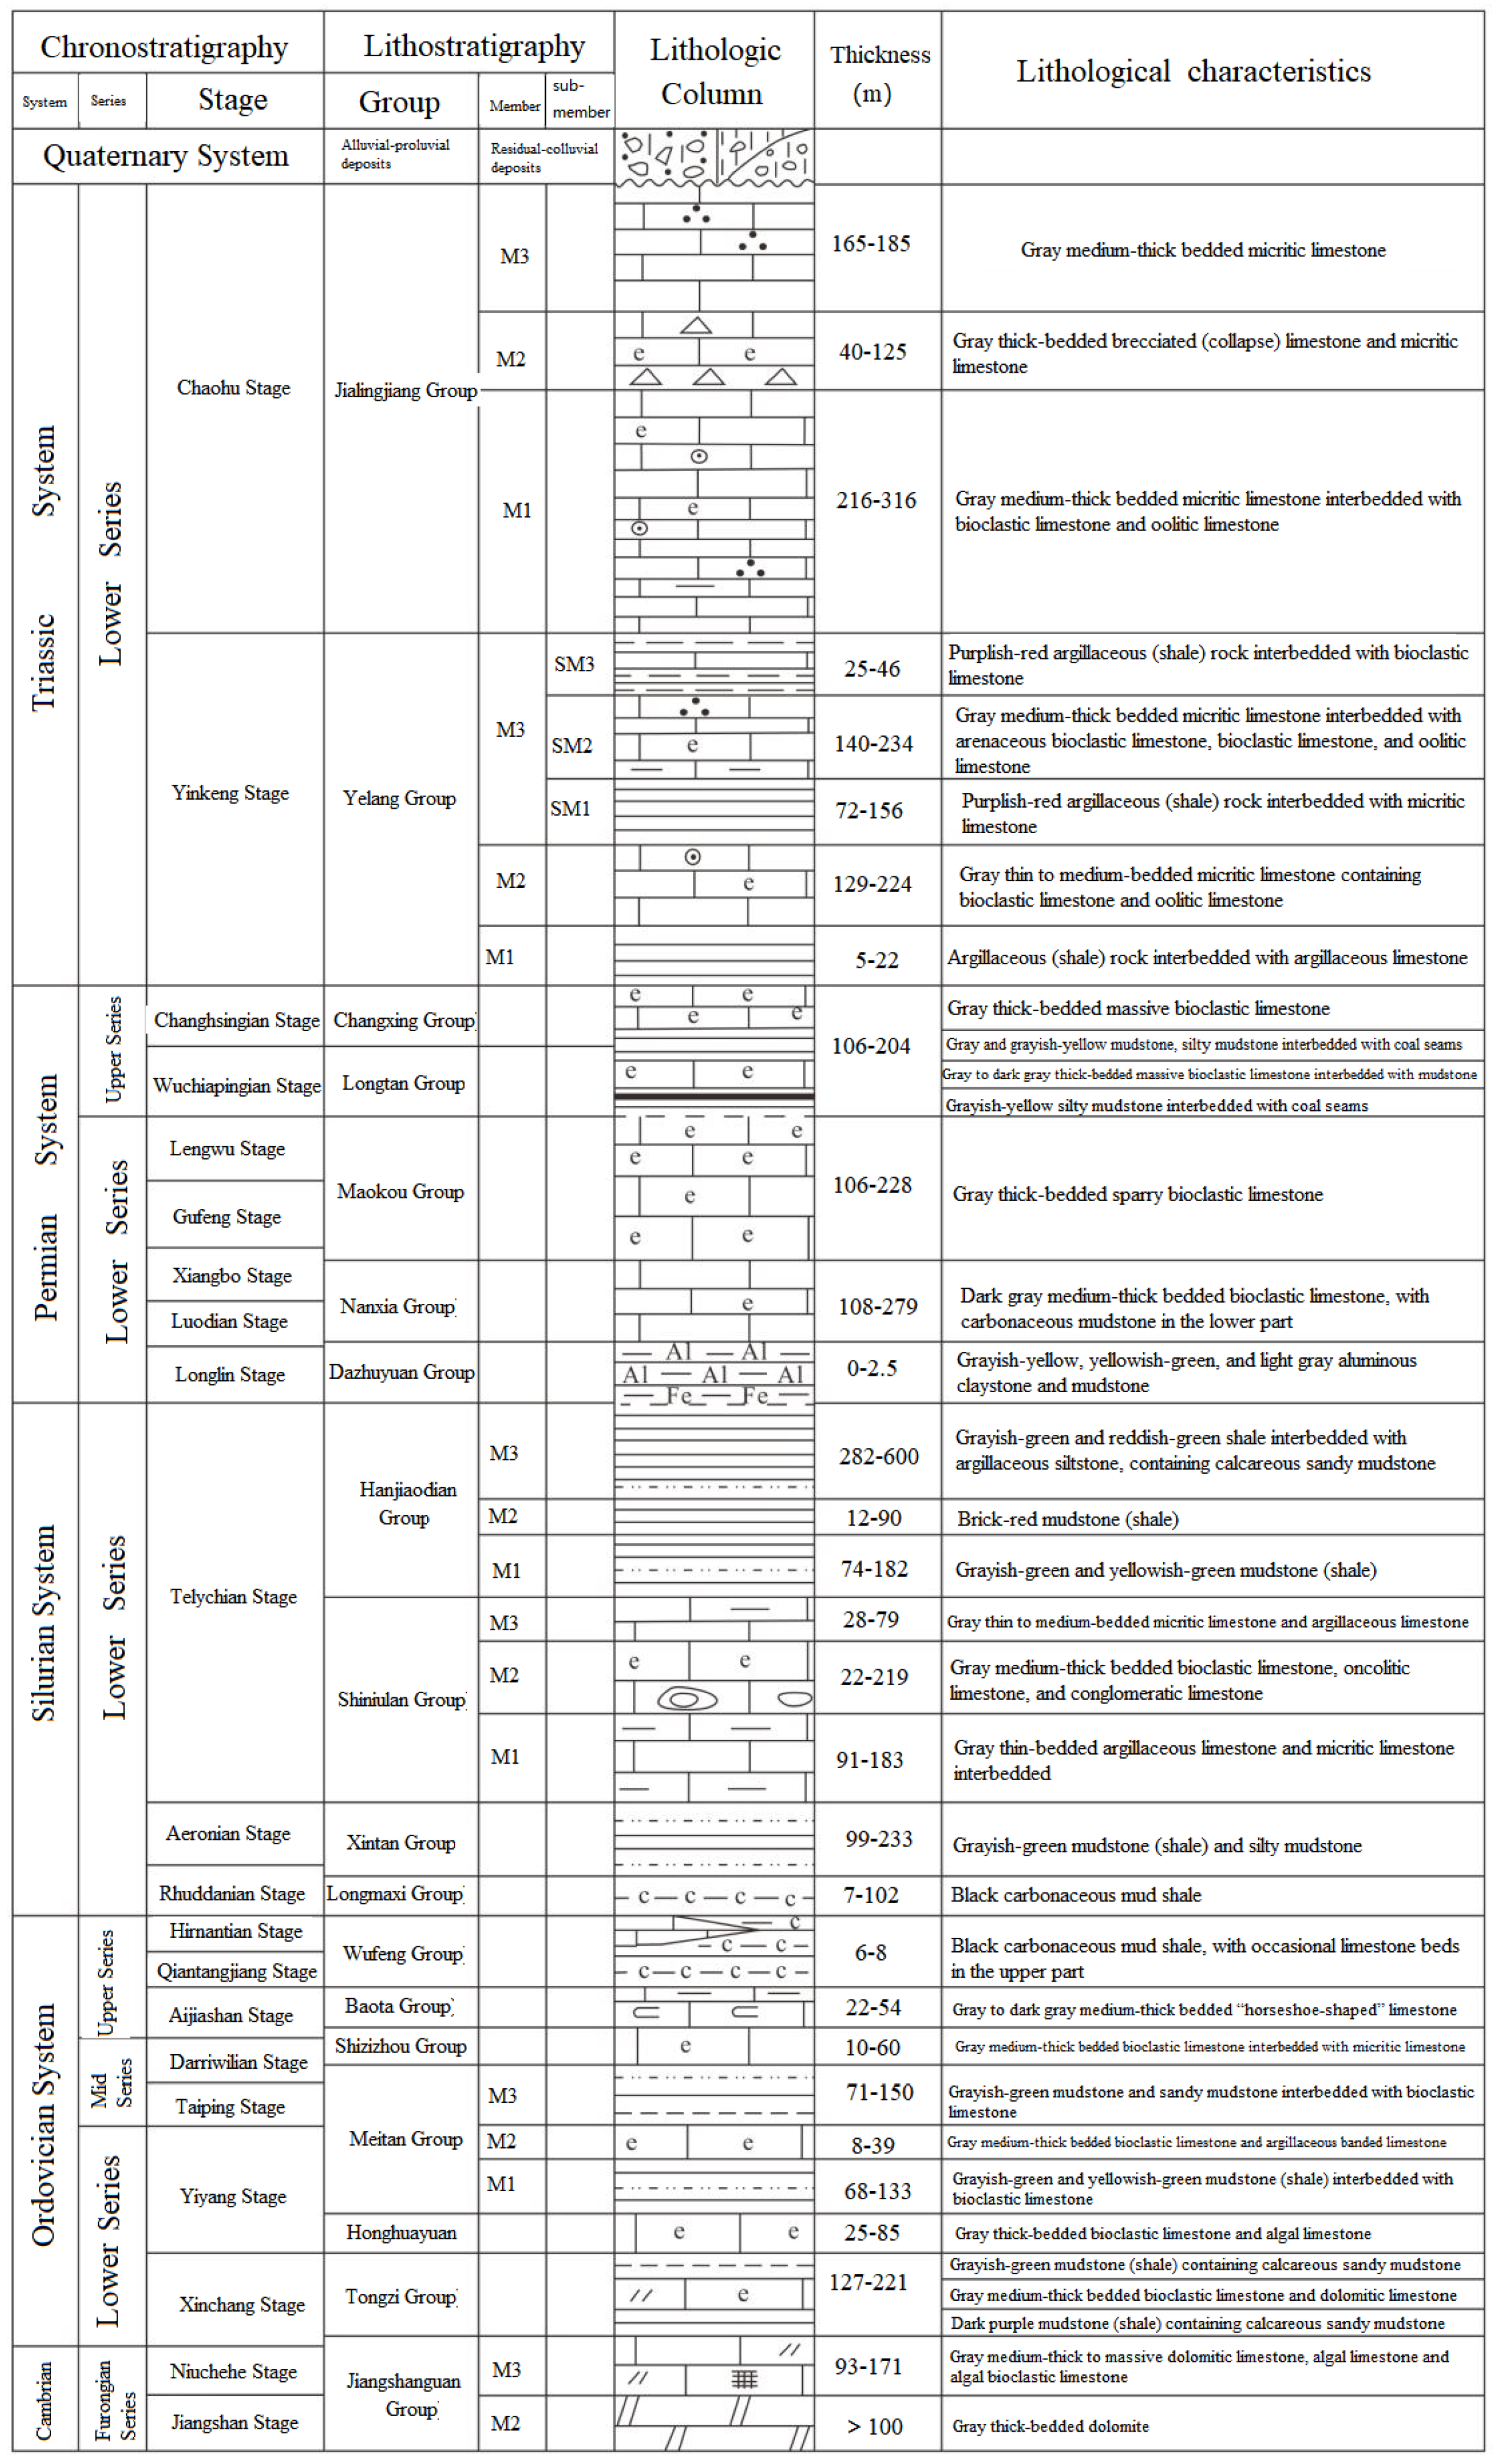
Outcrops and drilling data indicate that the exposed strata in the work area range from Ordovician to Triassic, while Devonian and Carboniferous strata are generally absent. Based on integrated interpretation of drilling, outcrops, and seismic data, a stratigraphic column for the block was established (
Figure 2). The main shale gas target interval comprises the Upper Ordovician Wufeng formation and the Lower Silurian Longmaxi formation, which are in conformable contact and were deposited in a deep-water shelf environment with anoxic conditions favorable for organic matter preservation.
2.3. Target Interval Stratigraphy: Wufeng–Longmaxi Formations
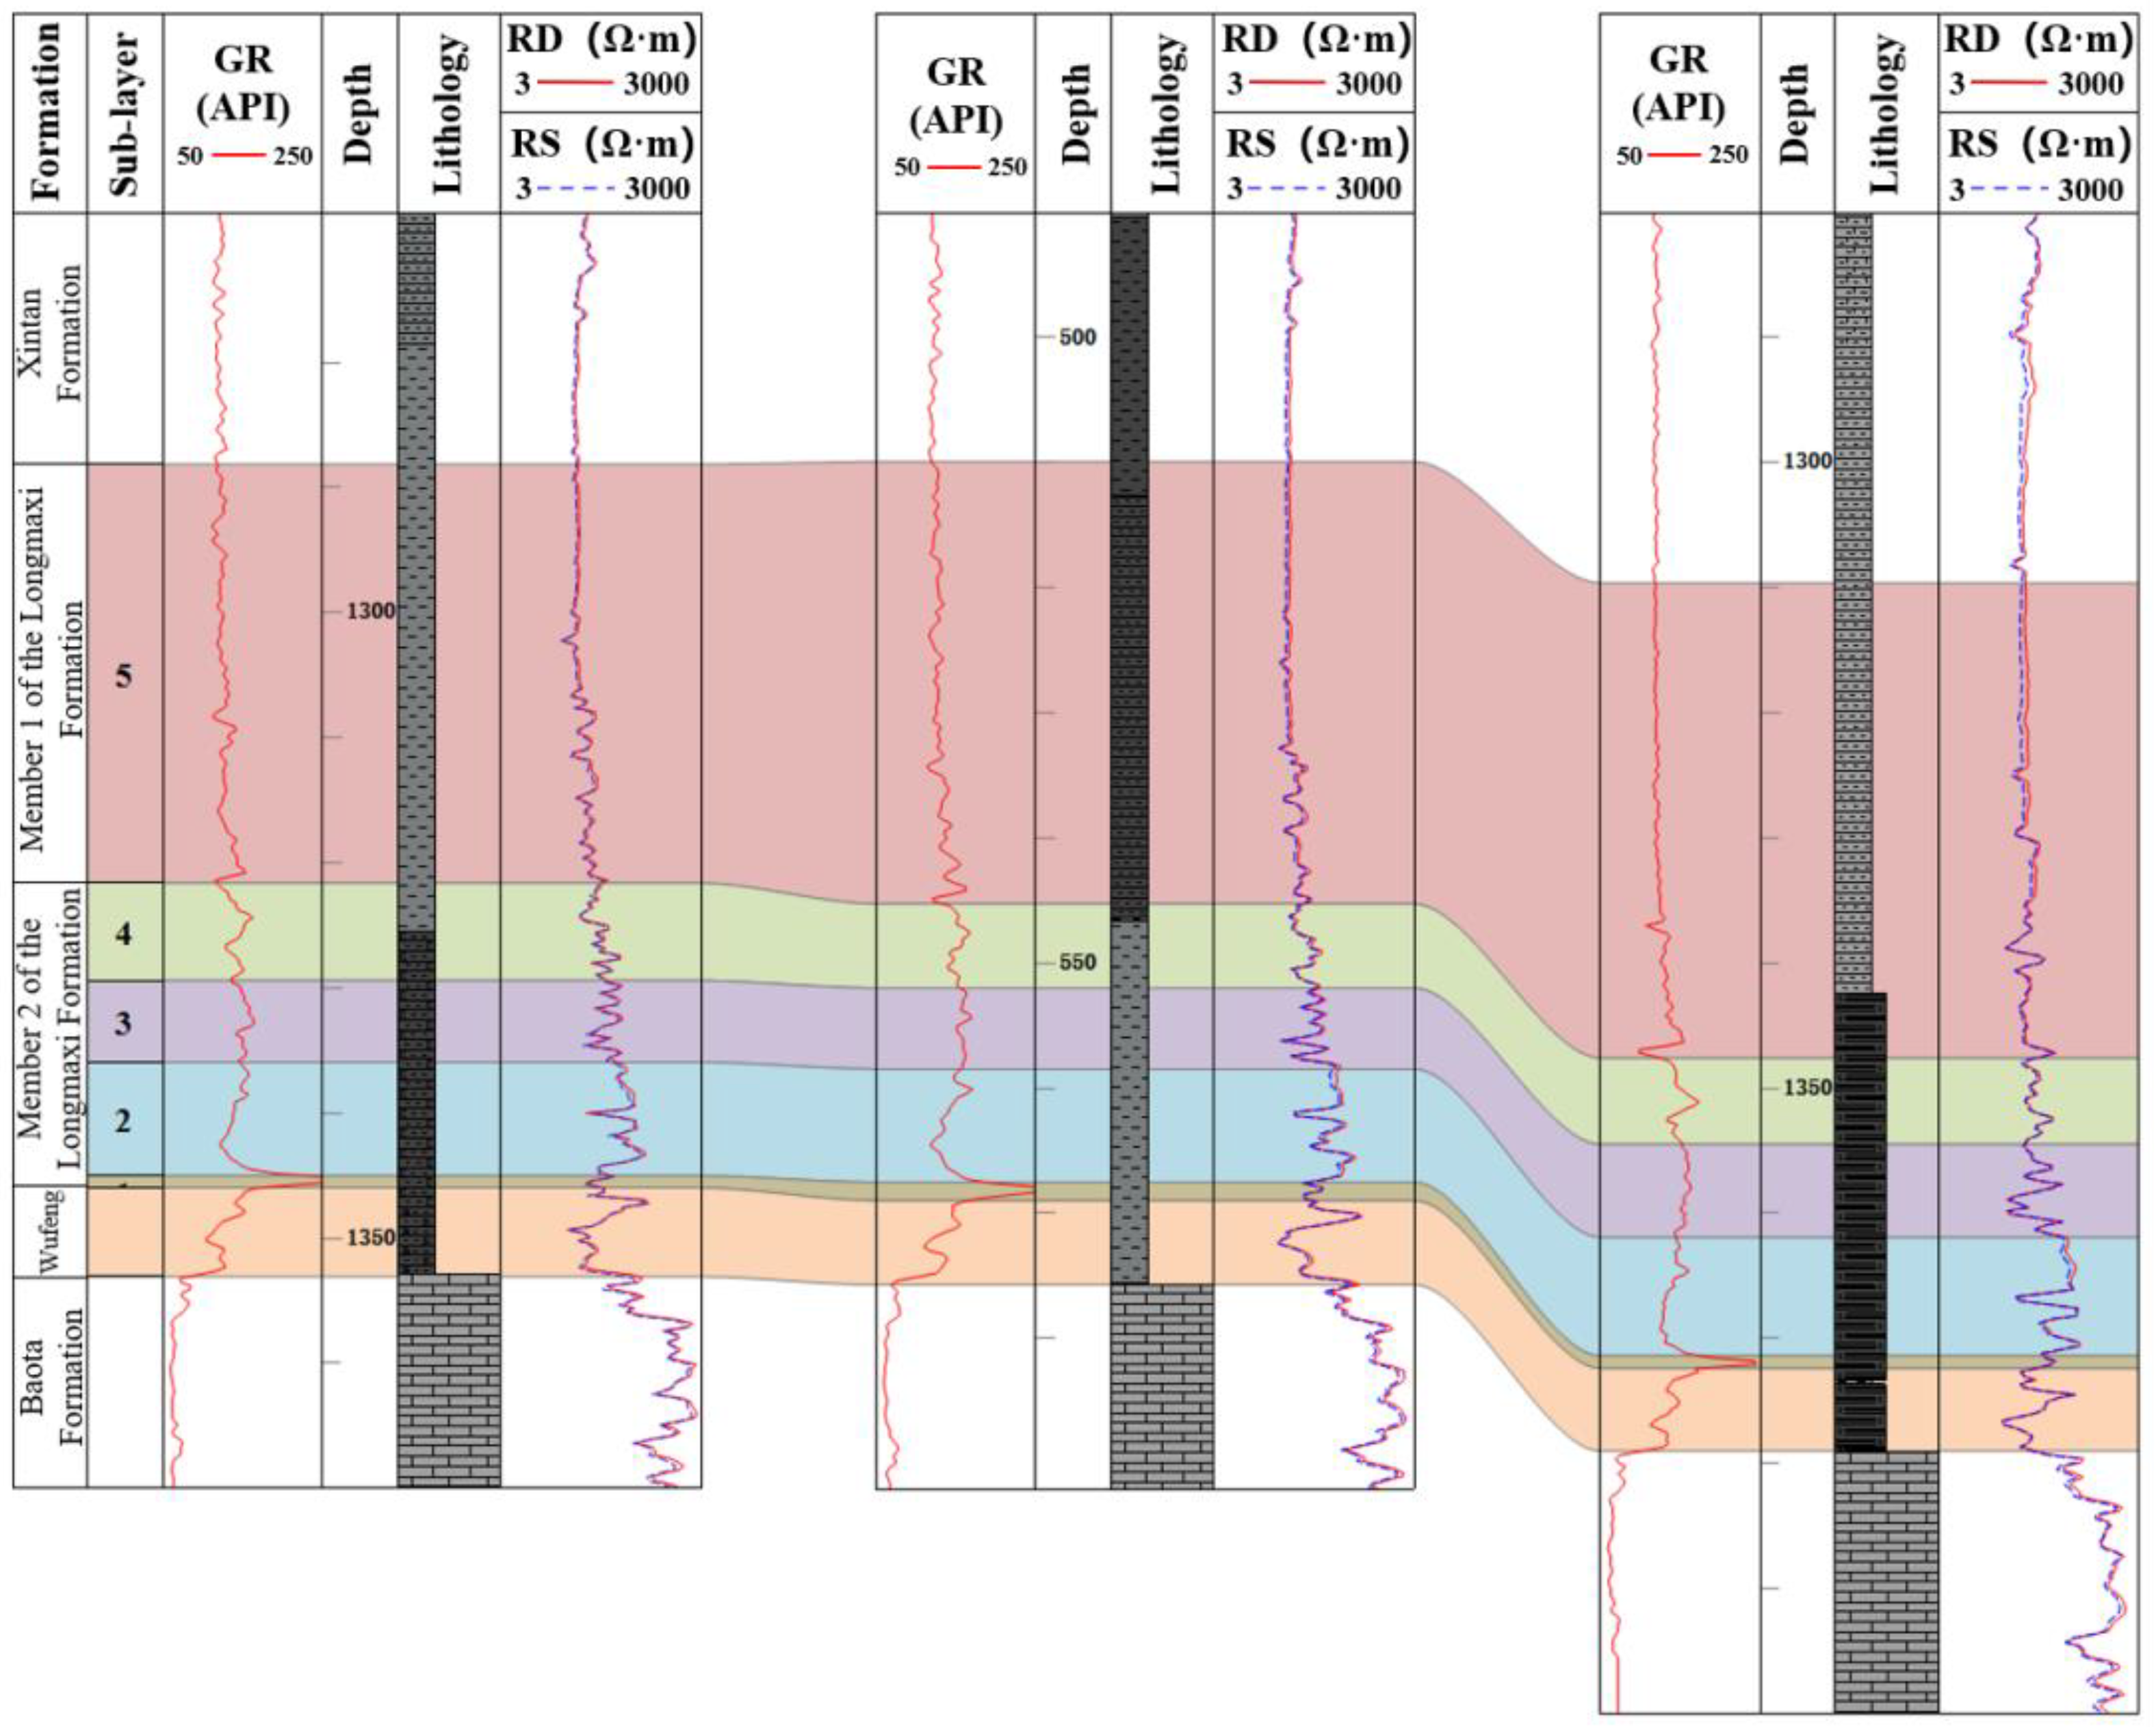
The Wufeng formation is relatively thin (about 6.1–7.4 m) and conformably overlies the Upper Ordovician Baota formation, a limestone unit commonly showing mud cracks or “chicken-wire” textures. The Wufeng lithology is mainly black siliceous shale with abundant graptolites. A laterally stable marker bed occurs at the top: the Guanyinqiao Member, composed of shelly limestone rich in Hirnantia fossils, which is widely used for regional correlation. In well logs, the Wufeng formation typically shows a rapid increase in gamma rays (GRs) and a relative decrease in resistivity compared with the underlying Baota limestone, which is characterized by low GRs and high resistivity. The Wufeng shales were deposited in a restricted, stagnant deep-water shelf setting, promoting strong reducing conditions and organic matter enrichment.
The Longmaxi formation is much thicker (about 56.7–62.4 m) and conformably overlies the Wufeng formation. Based on lithology, electrical responses, and paleontological features, it is subdivided into the Long-1 Member and Long-2 Member (
Figure 3). The Long-1 Member (about 24.2–25.0 m) is the primary gas-bearing interval, dominated by black to gray-black carbonaceous graptolitic shale with well-developed fine lamination and common pyrite occurrences (spots, nodules, and locally massive aggregates), indicating persistent reducing conditions in a deep-water shelf environment. It can be further divided into four sub-layers (S
1l
1–S
1l
4); among them, S
1l
1 shows the strongest organic enrichment and a sharp GR peak (often >280 API), while above this the shale becomes gradually more silty, especially in S
1l
4.
The Long-2 Member (about 32.0–38.0 m) is mainly dark gray silty shale, with increasing sandy components and markedly reduced graptolite content. Log responses generally show lower GRs and a higher density than the Long-1 Member, consistent with an upward shift toward a shallower-water shelf environment. The Longmaxi formation is conformably overlain by the Silurian Xintan formation (green-gray mudstone and shale), which—together with the underlying Baota limestone—forms effective regional sealing conditions for the Wufeng–Longmaxi shale gas system.
2.4. Reservoir Characteristics of the Wufeng and Long-1 Shales
Core observations, well logs, and laboratory analyses indicate that the Wufeng formation and Long-1 Member in the Shixi block have favorable shale gas reservoir properties. Organic matter is dominated by type I kerogen, with high thermal maturity (Ro ≈ 2.17–2.33%), indicating a dry-gas generation stage. Total organic carbon (TOC) in the high-quality Long-1 sub-layers (especially sub-layers 1–3) averages about 3.79%, providing a strong hydrocarbon generation basis.
Mineralogically, the reservoir is brittle-mineral rich, with quartz, feldspar, and carbonates averaging ~78%, while clay minerals average ~21% (mainly illite/smectite mixed layers). The brittleness index (BI) is generally >60% and can exceed 70% in the high-quality intervals, suggesting good fracability. Petrophysically, the shale is an ultra-low porosity and ultra-low permeability reservoir, with average porosity around 4.2% (up to ~4.65% in better intervals) and median permeability of ~0.00273 mD. Pore systems are dominated by organic matter-hosted pores, typically 10–300 nm in diameter, and many pores show ink-bottle morphologies with relatively good connectivity.
The gas content from desorption data is strongly heterogeneous and appears to be closely linked to local preservation conditions; the maximum measured gas content in quality intervals reaches 4.79 m3/t. Natural fractures are most developed in the Wufeng formation and the S1l1 sub-layer, mainly as high-angle and network fractures, often filled by calcite. Image log interpretations indicate dominant fracture trends of NWW–SEE and NE–SW, which are relevant for understanding both preservation risk and hydraulic fracturing response.
3. Seismic Data Interpretation
The Shixi block is characterized by a typical “dual-complexity” setting, including complicated near-surface conditions and a strongly deformed subsurface structure. As a result, the seismic imaging quality changes obviously in the lateral direction. Discontinuous reflectors, local steep dips and dense faults make horizon tracking and fault picking very sensitive to statics and velocity models. To build a reliable structural framework for shale gas evaluation, this study conducted seismic quality grading, multi-scale fault and fracture interpretation, and high-precision 3D structural modeling. This workflow is not merely a case-specific modification but a systematic approach to address the ‘weak signal and strong deformation’ challenge. By establishing a signal-to-noise ratio (SNR)-based grading system as the foundation, the workflow ensures that subsequent inversion and interpretation are conducted with a clear understanding of data reliability, a step often overlooked in standard integrated studies.
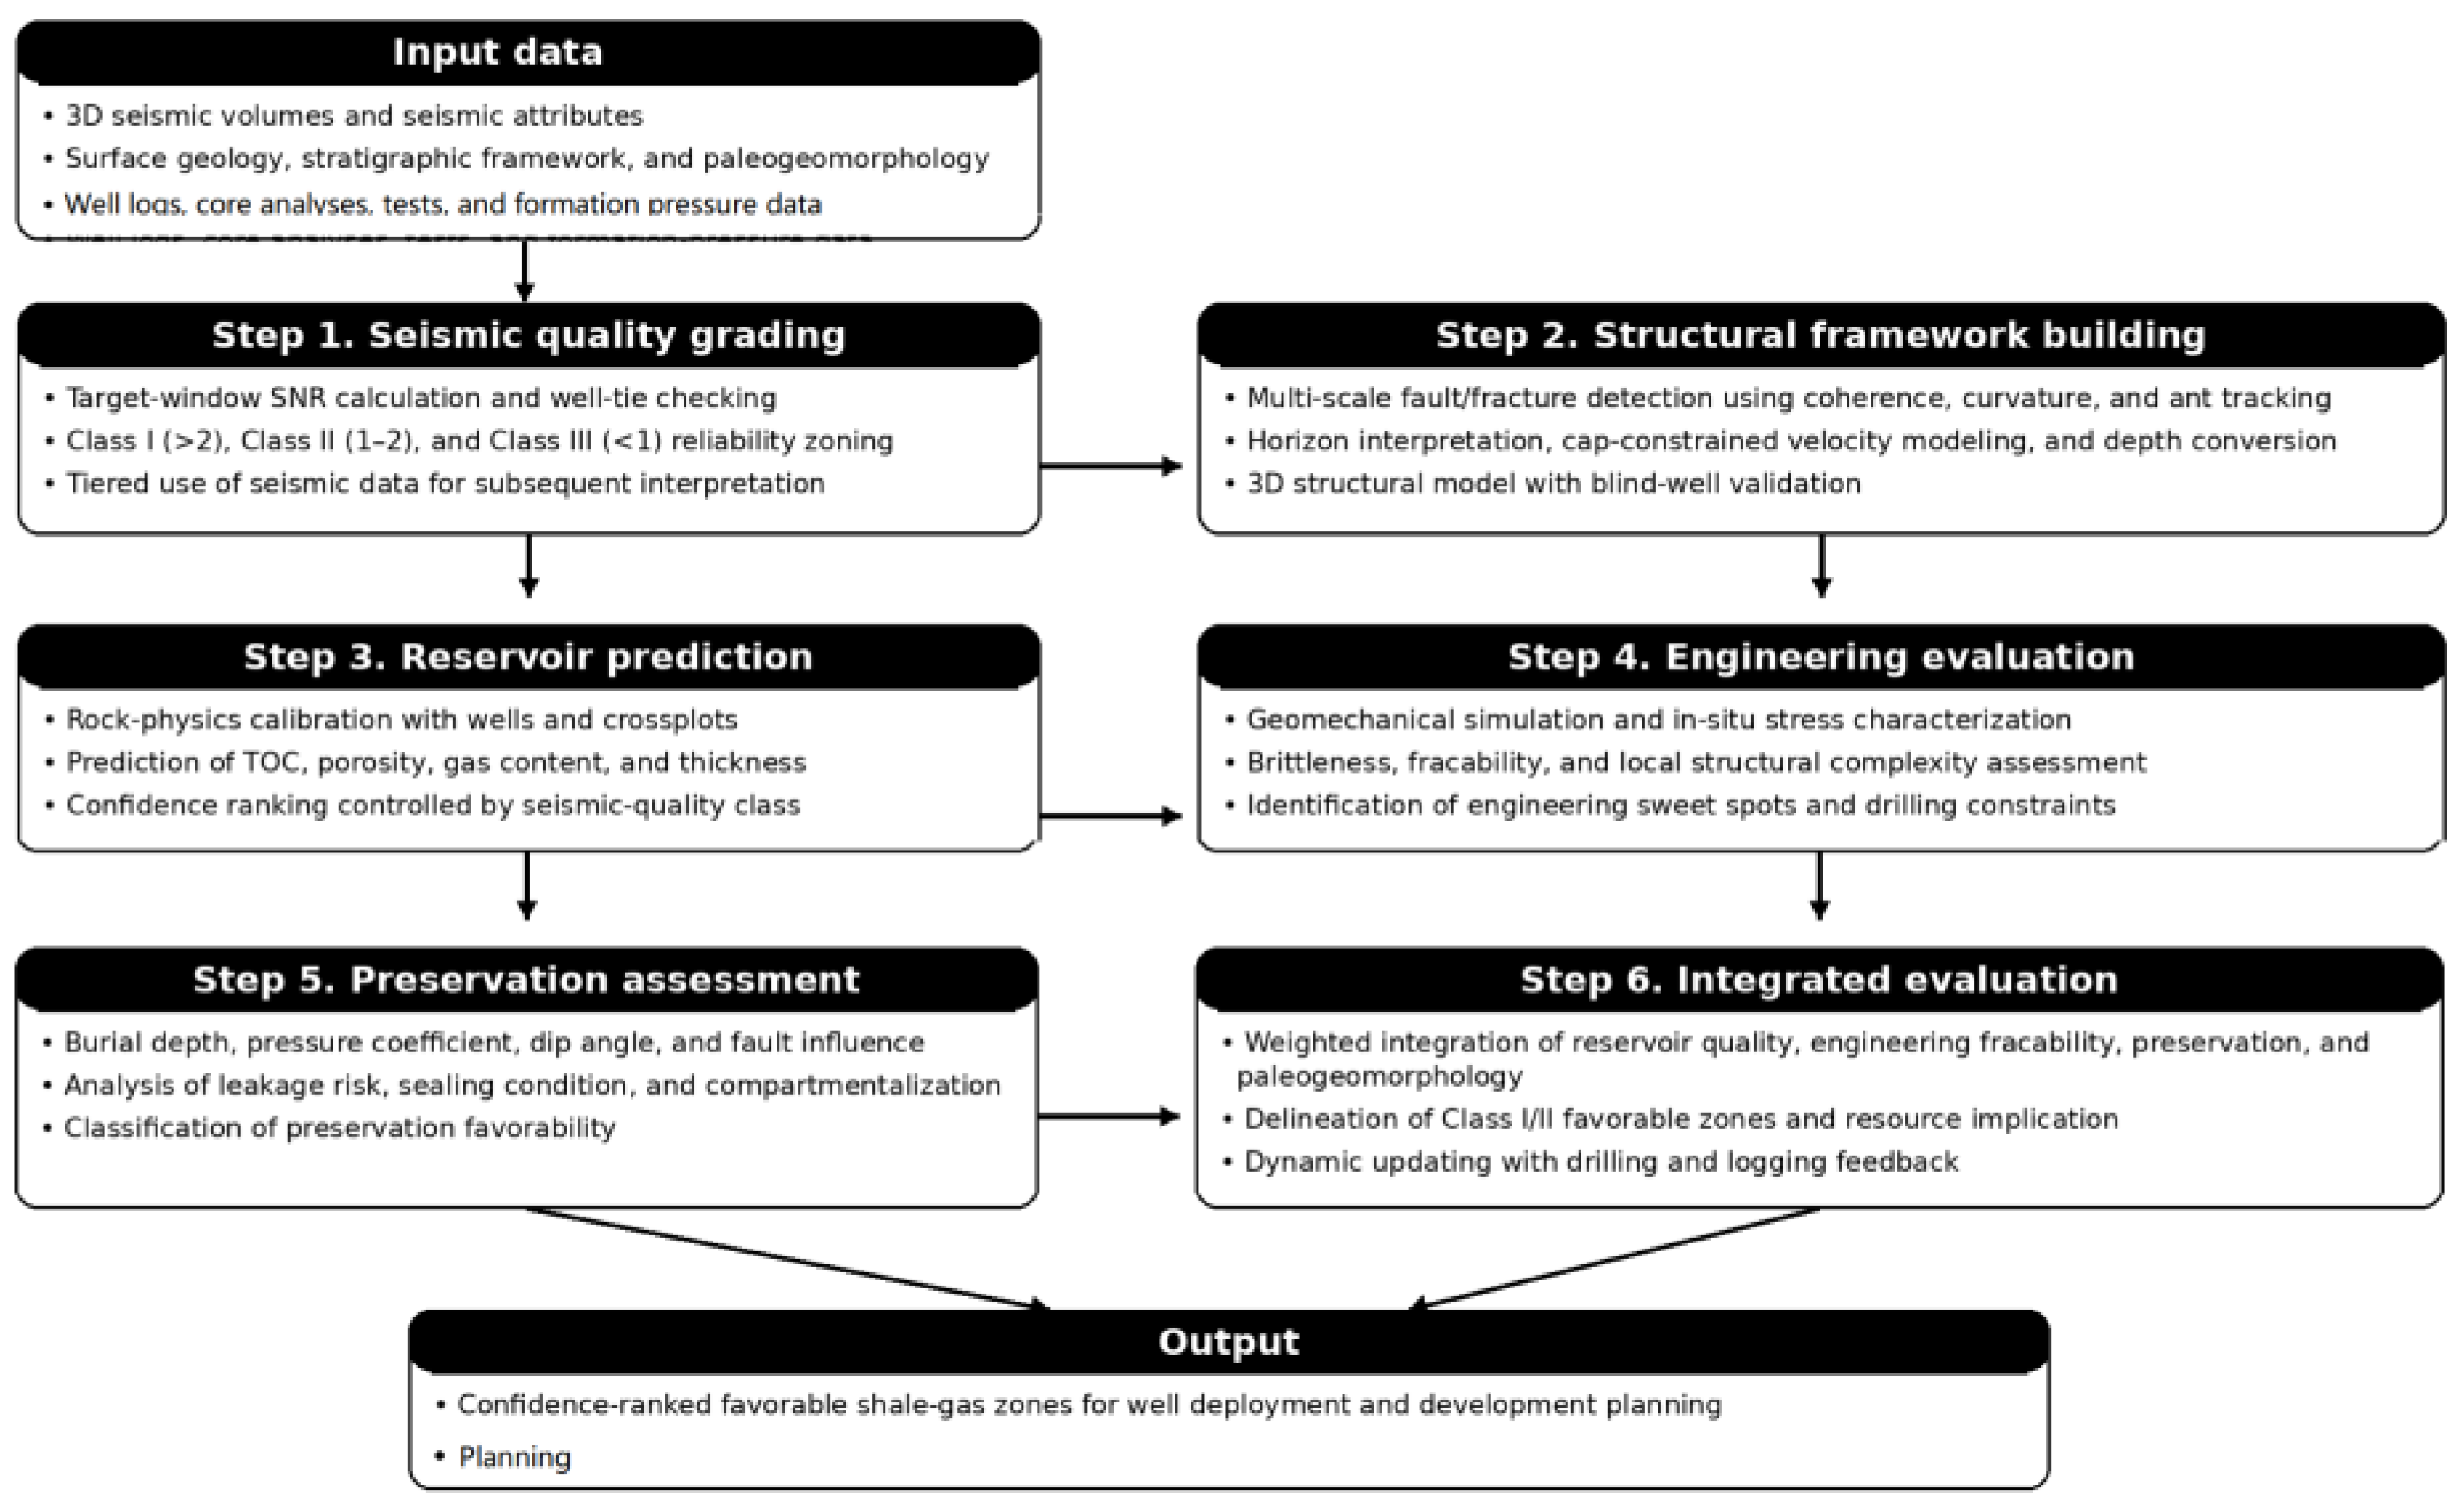
As shown in
Figure 4, the proposed workflow is organized as a sequential but feedback-enabled process. Seismic data quality grading provides the reliability basis for subsequent interpretation and inversion; structural modeling establishes the geometric framework; reservoir prediction and geomechanical simulation characterize geological sweetness and engineering fracability; preservation assessment evaluates the likelihood of gas retention under normal-pressure conditions; and all these components are finally integrated to delineate favorable zones. This graphical summary is intended to improve the clarity and reproducibility of the workflow before the detailed description of each step.
3.1. Seismic Data Quality Grading for Interpretation Purpose
Under the special surface and geological conditions in Shixi, seismic wave propagation is complicated and attenuation is strong, so the dataset often shows a low signal-to-noise ratio and unstable resolution. Therefore, before detailed structural interpretation and sweet-spot prediction, we carried out a practical quality evaluation and grading for the available 3D seismic volumes.
In this work, the grading is geology and engineering oriented. We mainly considered six aspects: the well-to-seismic tie quality by synthetic seismogram, migration imaging performance, signal-to-noise ratio, wavelet resolution, amplitude fidelity for quantitative work, and the final geological interpretability such as fault recognizability and horizon traceability. Among these, the SNR was taken as the core quantitative metric, because of its direct physical link to seismic band-limited reflectivity. In structurally complex areas like Shixi, the SNR is the most sensitive indicator of whether the seismic amplitude preserves the true geological response or is contaminated by scattering and absorption. Physically, the stability of acoustic impedance inversion is fundamentally constrained by the SNR. A low SNR leads to non-uniqueness and instability in the deconvolution and matrix inversion processes, where noise can be erroneously amplified as ‘pseudo-reservoirs’. Therefore, the SNR grading serves as a foundational ‘reliability mask’ for all subsequent quantitative reservoir characterization. The SNR was calculated within the target reflection time window and a nearby noise window in the same trace, and then summarized statistically on horizon slices.
SNR thresholds for classification were calibrated by cross-referencing the seismic data quality with the confidence levels of well-to-seismic ties at existing well locations (e.g., Shixi-1 and Shidi-1). Specifically, it was observed that in areas where SNR > 2, the correlation coefficient between synthetic seismograms and real seismic traces typically exceeds 0.75, providing a reliable basis for quantitative inversion. When the SNR falls below 1, the correlation decreases significantly, and the seismic events become too blurred to support deterministic interpretation.
A three-class system was defined (
Table 1). Class I data have an SNR higher than 2 and can support detailed fault interpretation and seismic inversion with relatively high confidence (
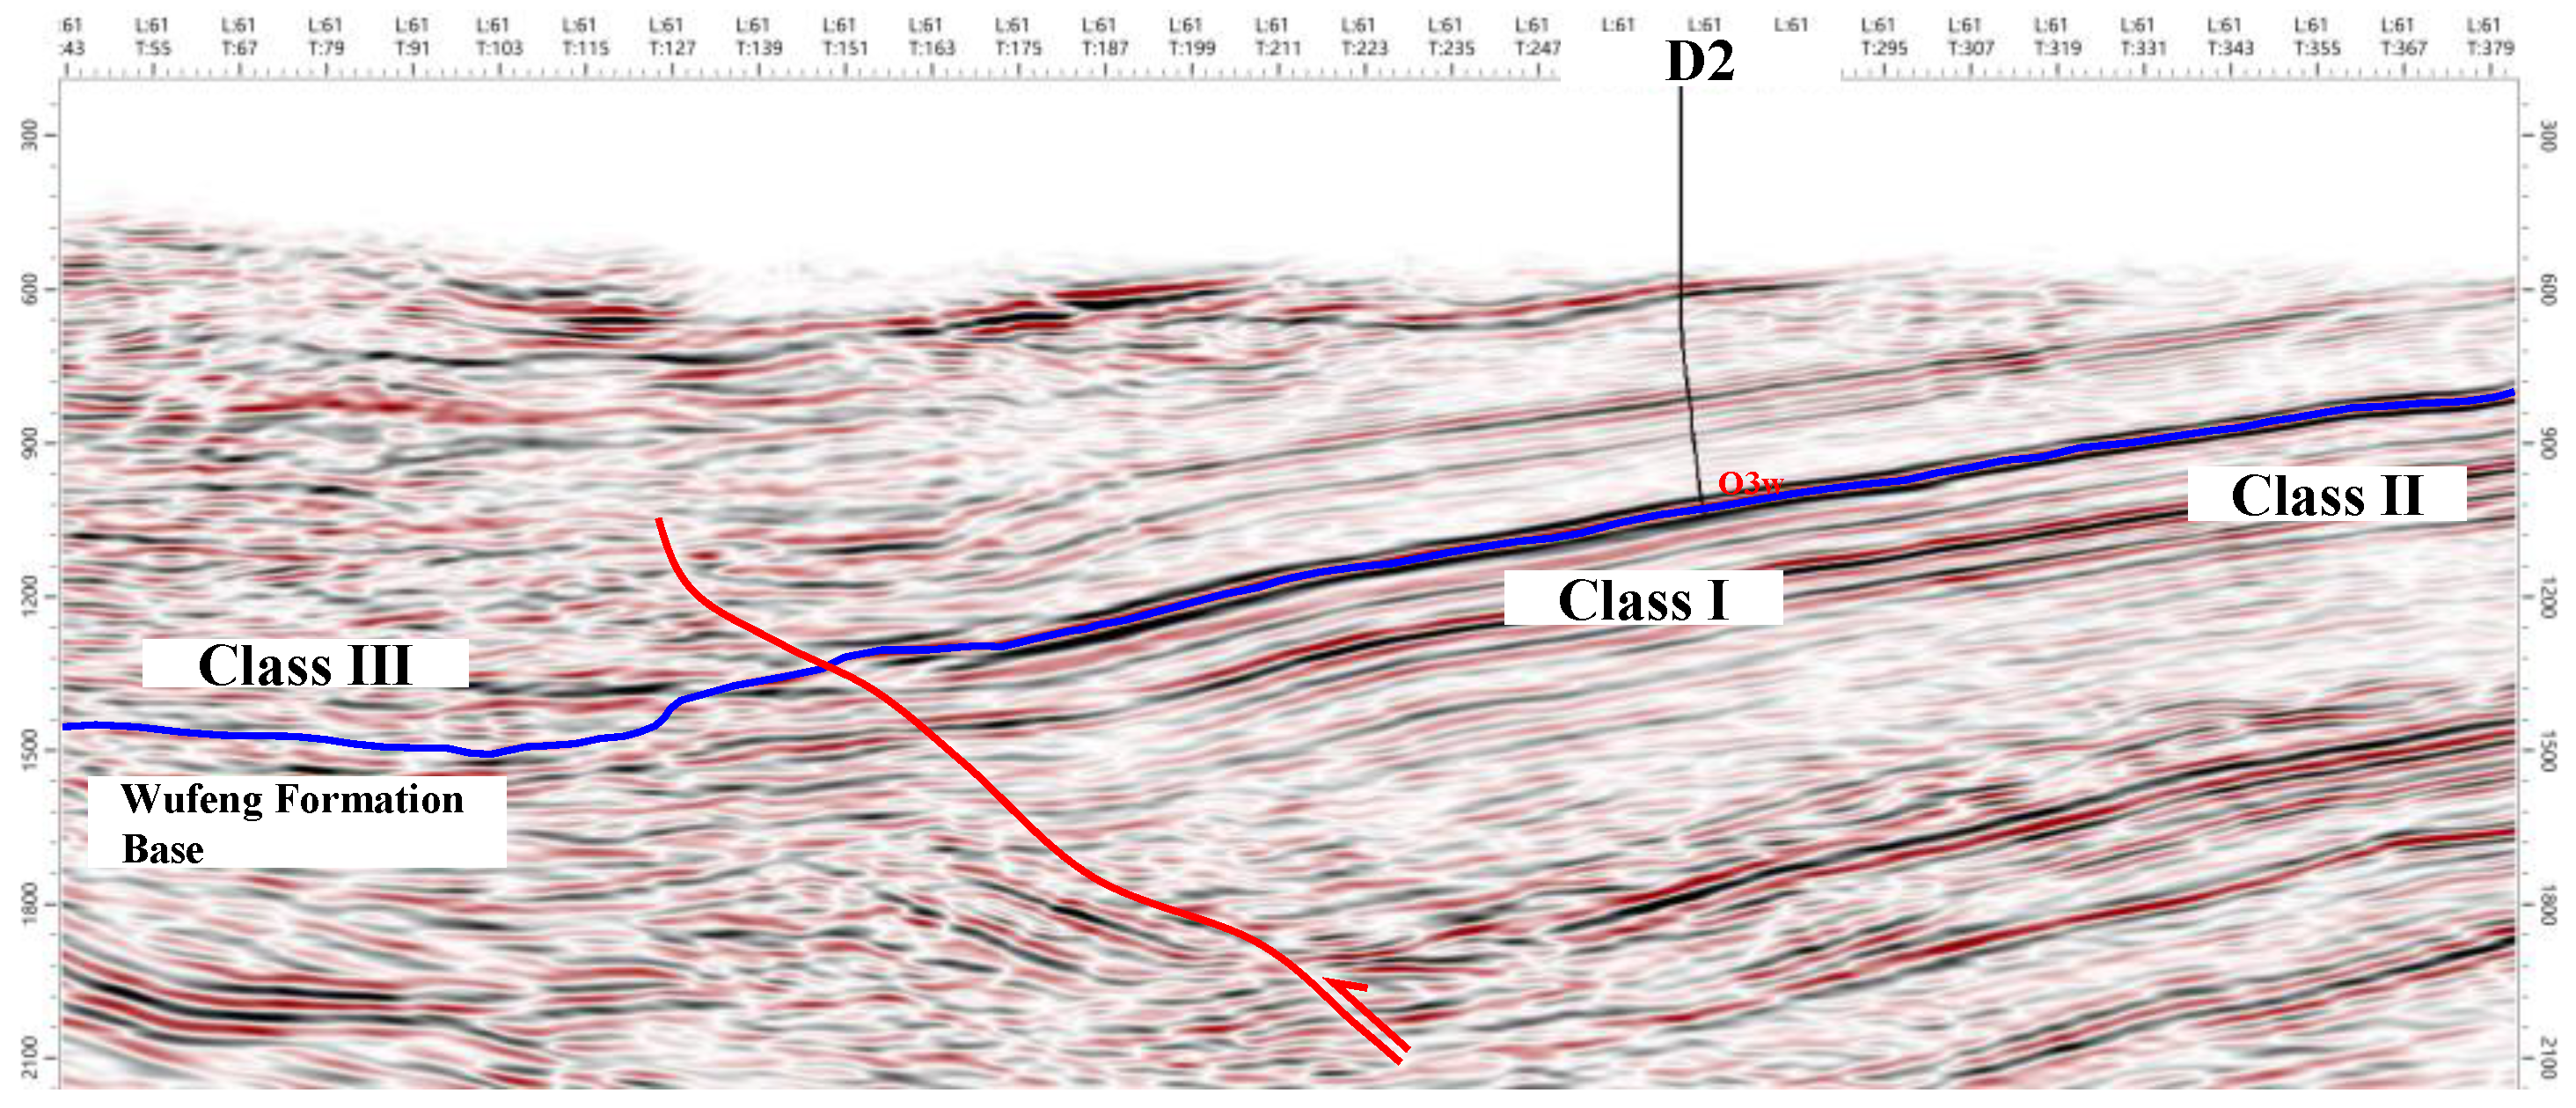
Figure 5). Class II data have an SNR of between 1 and 2, where reflectors are generally traceable but local energy variation exists; these data are suitable for framework modeling, but uncertainties should be considered. Class III data have an SNR lower than 1; reflections of target layers are weak and discontinuous, and both fault identification and horizon correlation become difficult, so these areas are treated as high-risk zones and mainly rely on geological reasoning and well control.
The SNR thresholds were calibrated by cross-referencing seismic data quality with the confidence levels of well-to-seismic ties at existing well locations (e.g., Shixi-1 and Shidi-1). Specifically, in areas where SNR > 2, the correlation coefficient between synthetic seismograms and real seismic traces consistently exceeds 0.75, providing a reliable basis for quantitative inversion. When the SNR falls below 1, the correlation decreases significantly, and seismic events become too blurred for deterministic interpretation. This statistical correlation between the SNR and well-tie confidence serves as the physical basis for our three-class grading system.
According to this standard, we evaluated multiple 3D seismic datasets with different vintages and processing versions, covering about 126 km
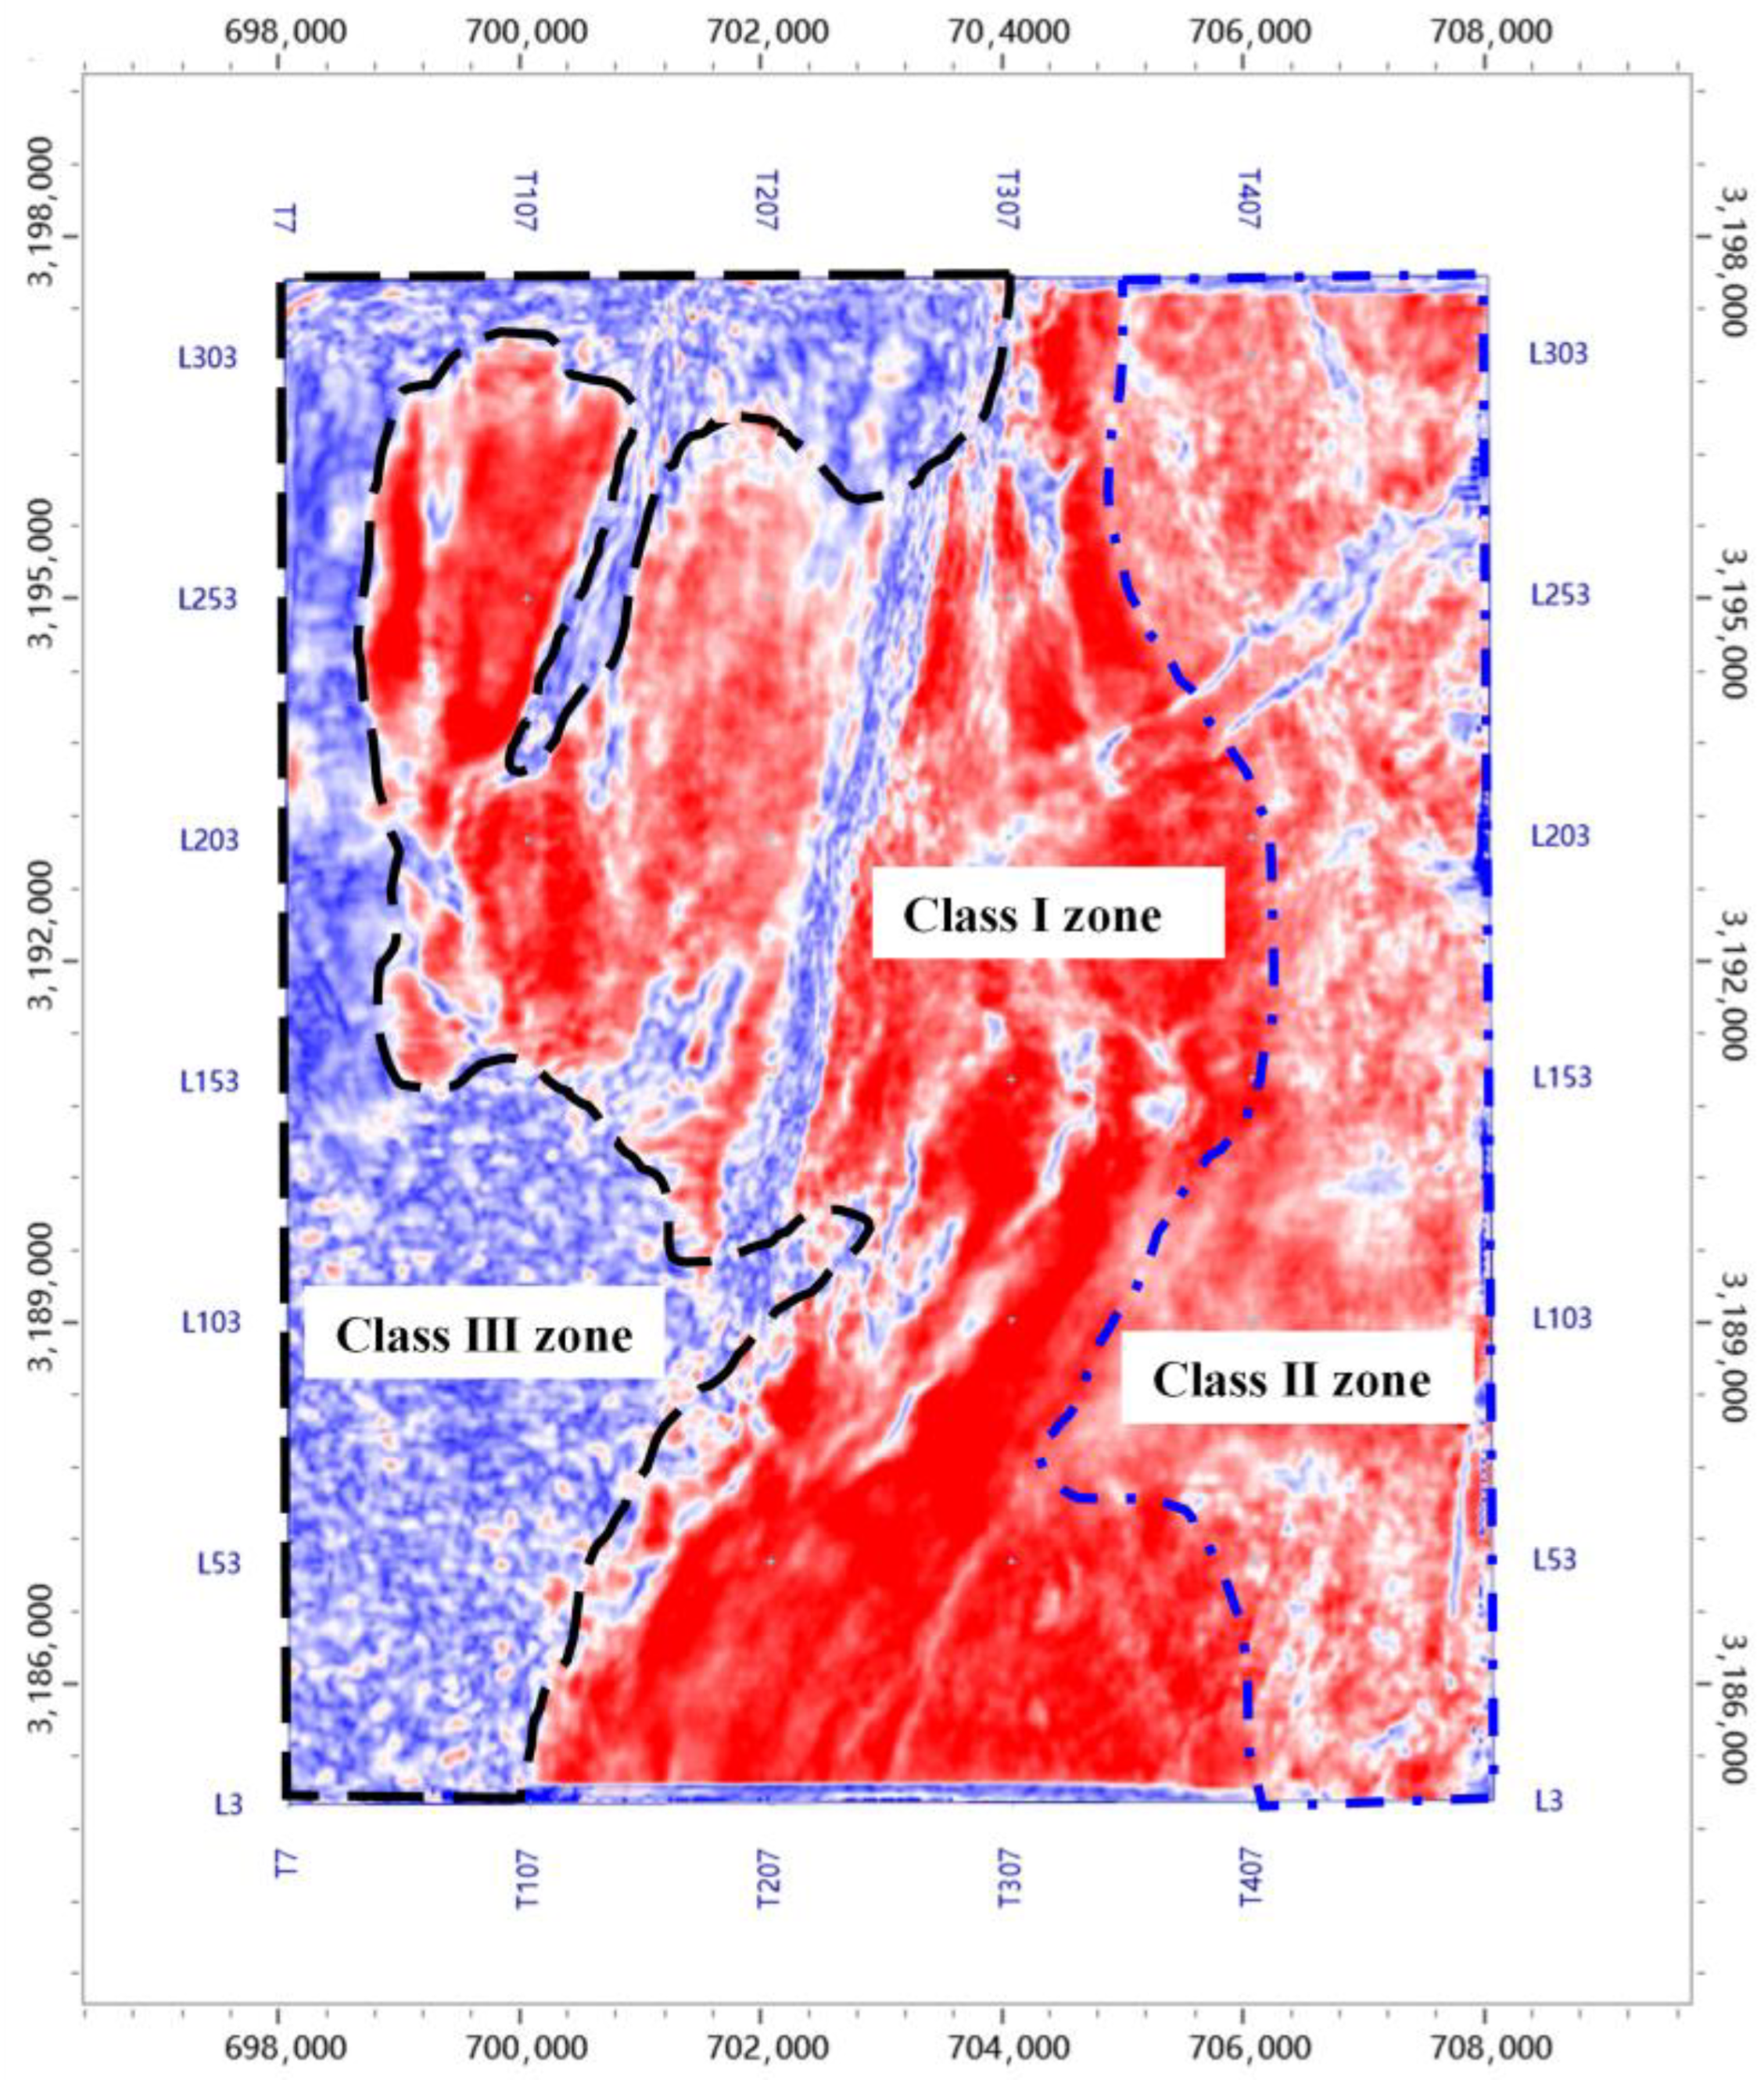
2. For the Wufeng–Longmaxi interval, Class I and Class II areas account for about 79.36% of the whole area (
Figure 6). In these areas, the dominant frequency is around 25 Hz with relatively clear wavelet characteristics, which essentially meet the requirements for detailed structural interpretation and sweet-spot prediction. Class III data are mainly located in the southwestern part and around major fault zones, indicating strong surface disturbance and/or complex deformation.
The inclusion of Class II and Class III data introduces varying degrees of uncertainty into the workflow. In Class II areas, although reflectors are generally traceable, the moderate SNR may lead to fluctuations in amplitude-based reservoir parameter predictions. To mitigate this, we applied more stringent spatial filtering and used well-log data as hard constraints during inversion. For Class III areas, which are characterized by high structural complexity and low signal quality, the seismic data were primarily used to infer regional structural trends rather than for quantitative sweet-spot mapping. In these zones, structural interpretation relied heavily on the ‘guardrail’ of regional structural styles and constraints from surface geological outcrops to reduce the risk of misinterpretation. This grading result provides direct guidance for seismic volume selection and uncertainty analysis in the following interpretation.
The subsequent interpretation and inversion outcomes are strictly tiered based on these SNR thresholds. For instance, in Class I zones (SNR > 2), we performed simultaneous pre-stack inversion to derive density and the Vp/Vs ratio for precise TOC mapping. In contrast, for Class II zones (SNR 1~2), the workflow automatically shifts to a more robust post-stack deterministic inversion to prioritize structural stability over high-resolution parameter extraction. This threshold-dependent strategy ensures that the complexity of the geophysical method matches the inherent quality of the data, thereby preventing over-interpretation in low-quality seismic regions.
3.2. Multi-Scale Fault and Fracture Detection
The Shixi block has been overprinted by multiple tectonic phases, so its discontinuities exist on a full spectrum: from kilometer-scale faults that shape the structural framework down to meter-scale fractures that impact stimulation. A single interpretation tool rarely covers that span, and low signal-to-noise ratios and messy near-surface effects can cause more uncertainty in fault detection.
Here we built and applied a practical workflow that mixes four ideas: a structural style model as the guardrail, geophysical-response calibration, tiered attribute detection, and finally a fused 3D fault model. The goal is not to chase every lineament, but to describe the fault–fracture system in a way that is detailed enough to be usable and still defensible.
3.2.1. Geological and Geophysical Basis for Tiered Detection
The tiered scheme starts from a simple question: what scale of fault can the seismic data actually respond to in this area? To make the detection strategy less subjective, we calibrated seismic responses using well logs from Shixi-1, Shidi-1, and Shidi-2. Using P-wave velocity and density, a representative model including the target interval and surrounding rocks was built, and forward simulations were run for fault throws of 5 m, 10 m, 15 m, 20 m, and 40 m. Simulations showed a fairly clear scale separation. Faults with throws larger than 20 m produced obvious reflector offsets and associated fault-plane or diffraction-like energy on seismic sections. Faults in the 5–20 m range did not always fully break reflectors, but commonly generated bending, twisting, or abrupt amplitude changes. For faults below 5 m, the direct seismic expression became very weak.
Based on this, we set a three-tier detection strategy: ① outlining large faults above a 20 m throw mainly by coherence plus careful manual closure on sections; ② targeting medium faults with a 5–20 m throw by curvature anomalies; ③ detecting small-scale fractures below 5 m with the ant-tracking method.
3.2.2. Fidelity-Oriented Preprocessing for Fault Detection
High-resolution fault work requires an awkward balance: noise suppression while keeping edges. Conventional smoothing can easily “polish away” the very discontinuities we need. We therefore used a serial workflow combining structural-oriented filtering (SOF) and anisotropic diffusion filtering (ADF).
- (1)
Structural-oriented filtering
For the structural-oriented filter (SOF), a coherence volume based on local trace similarity under trial dips was calculated:
where
C denotes the coherence value,
J is the total number of seismic traces,
uj(
t) represents the seismic trace data,
denotes the Hilbert transform, and
θx and
θy are the apparent dips in the inline and crossline directions, respectively.
Then, the local bedding attitude was estimated by searching for the dip and azimuth pair that maximizes coherence, implemented through a quadratic surface fit:
By solving for coefficients a–f, the optimal apparent dip angles
θx and
θy at the current point can be obtained. We then smooth primarily along reflectors, and apply no smoothing or only very weak smoothing across the reflector-normal direction to avoid smearing faults. The filtered amplitude
is:
where
M and
N denote the dimensions of the smoothing window, and Δt denotes the time delay calculated from the local dip angle.
- (2)
Anisotropic diffusion filtering
After SOF, anisotropic diffusion filtering (AOF) was applied for a second pass. The workflow started from the structure tensor
Jp computed from the gradient of Gaussian-smoothed data:
where
denotes the gradient of the seismic image after Gaussian pre smoothing;
denotes the tensor product; and
is a Gaussian convolution kernel used for local, window-based averaging. Eigen decomposition of the tensor gives local structural directions, and the diffusion is designed to be strong along bedding directions but weak across the main gradient direction, which is commonly where faults sit. The diffusion equation is:
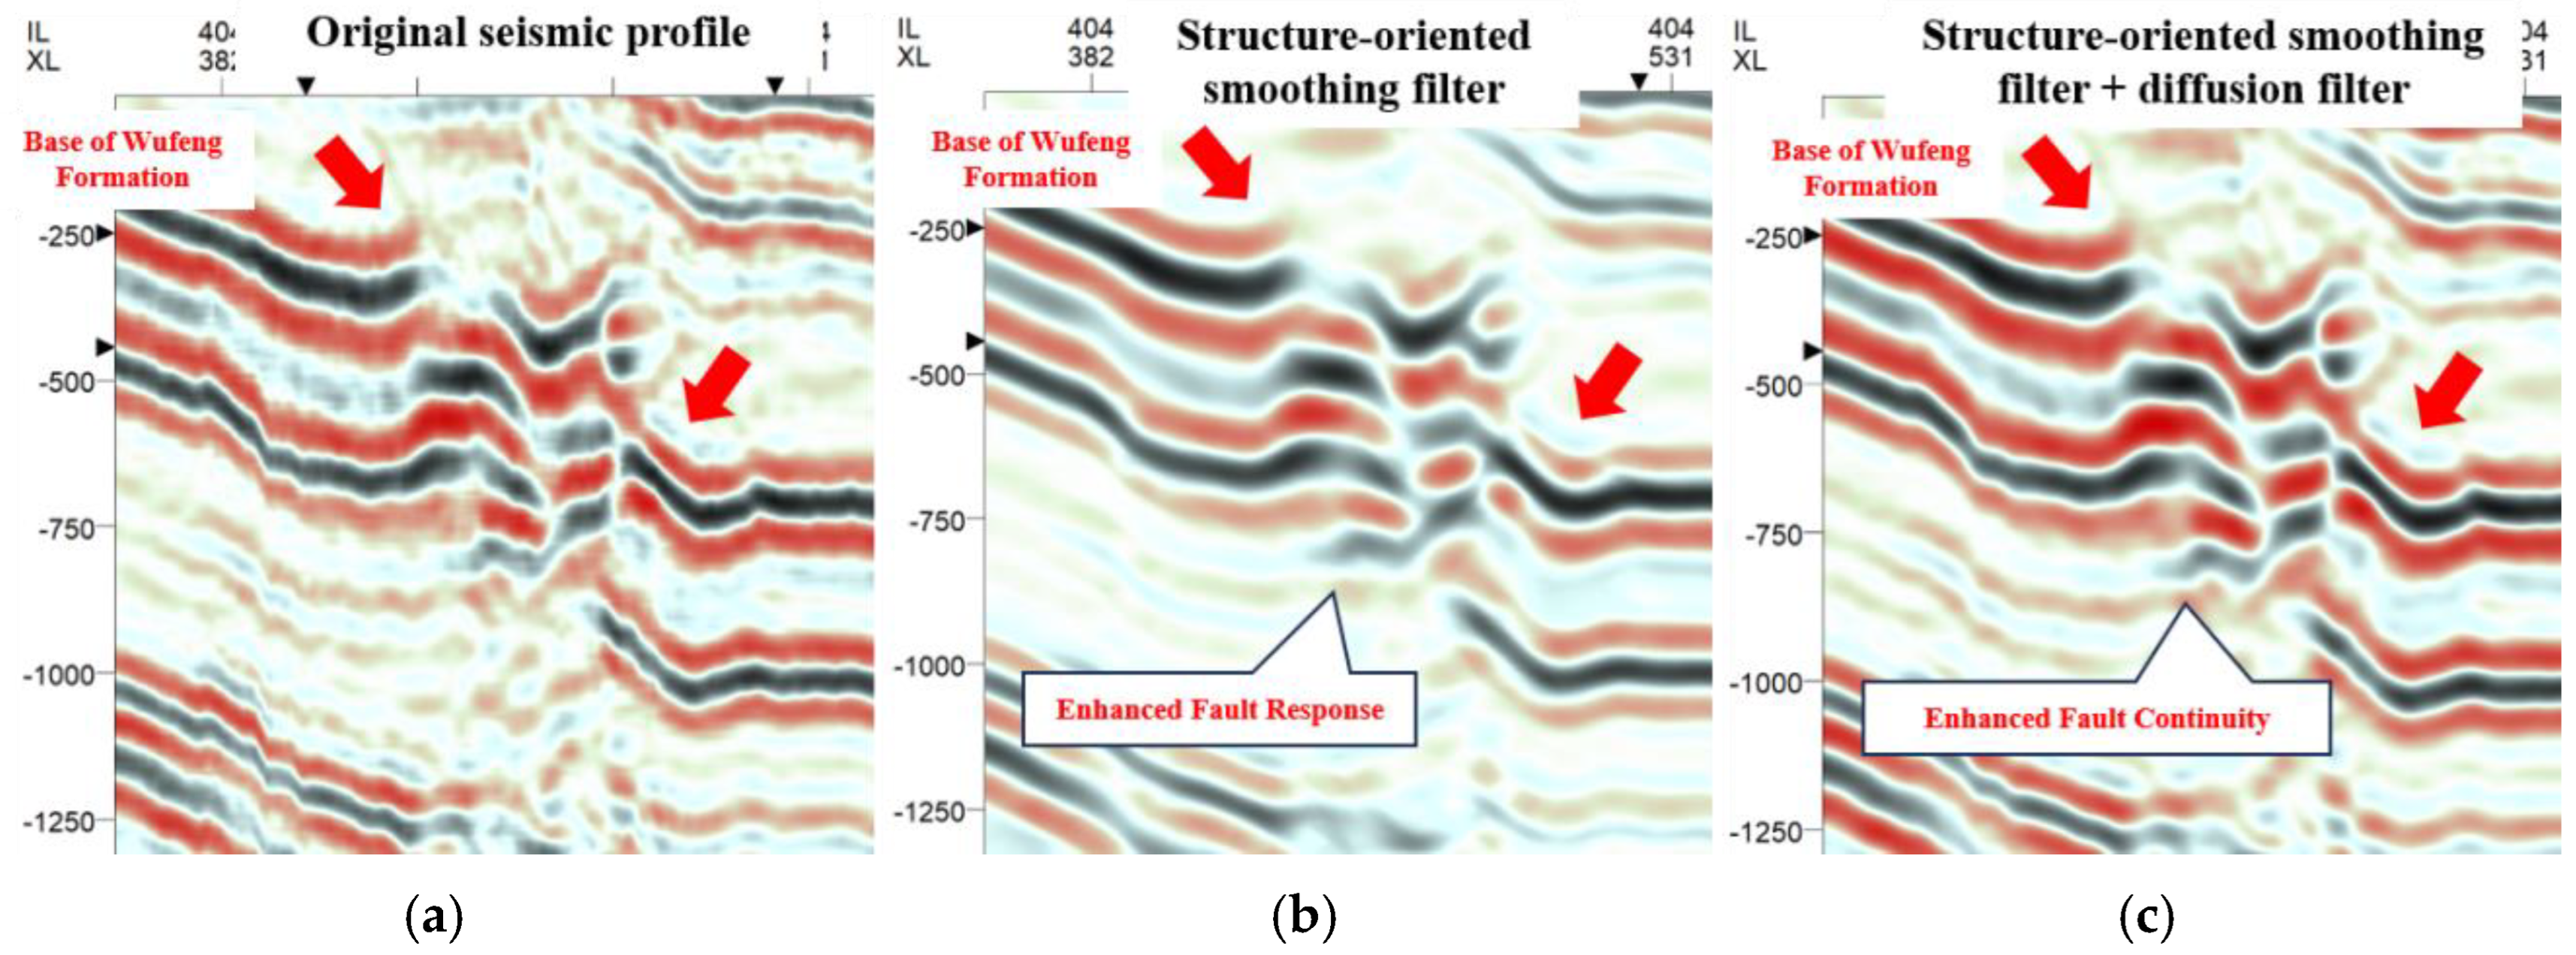
where D is the diffusion tensor associated with the eigenvalues of the structure tensor, which controls the diffusion coefficients in different directions. By these two steps, the signal-to-noise ratio was improved and reflectors became more continuous, but the key point is that fault and fracture edges were not blurred (
Figure 7).
3.2.3. Core Attributes and Implementation Across Scales
Using the preconditioned seismic volume, we adopted a tiered, attribute-based workflow to delineate faults and fractures across different displacement scales. The key idea was to avoid forcing one “best” attribute to do everything: large throws were handled first to build a robust structural framework; then, progressively subtler discontinuities were extracted with more sensitive measures.
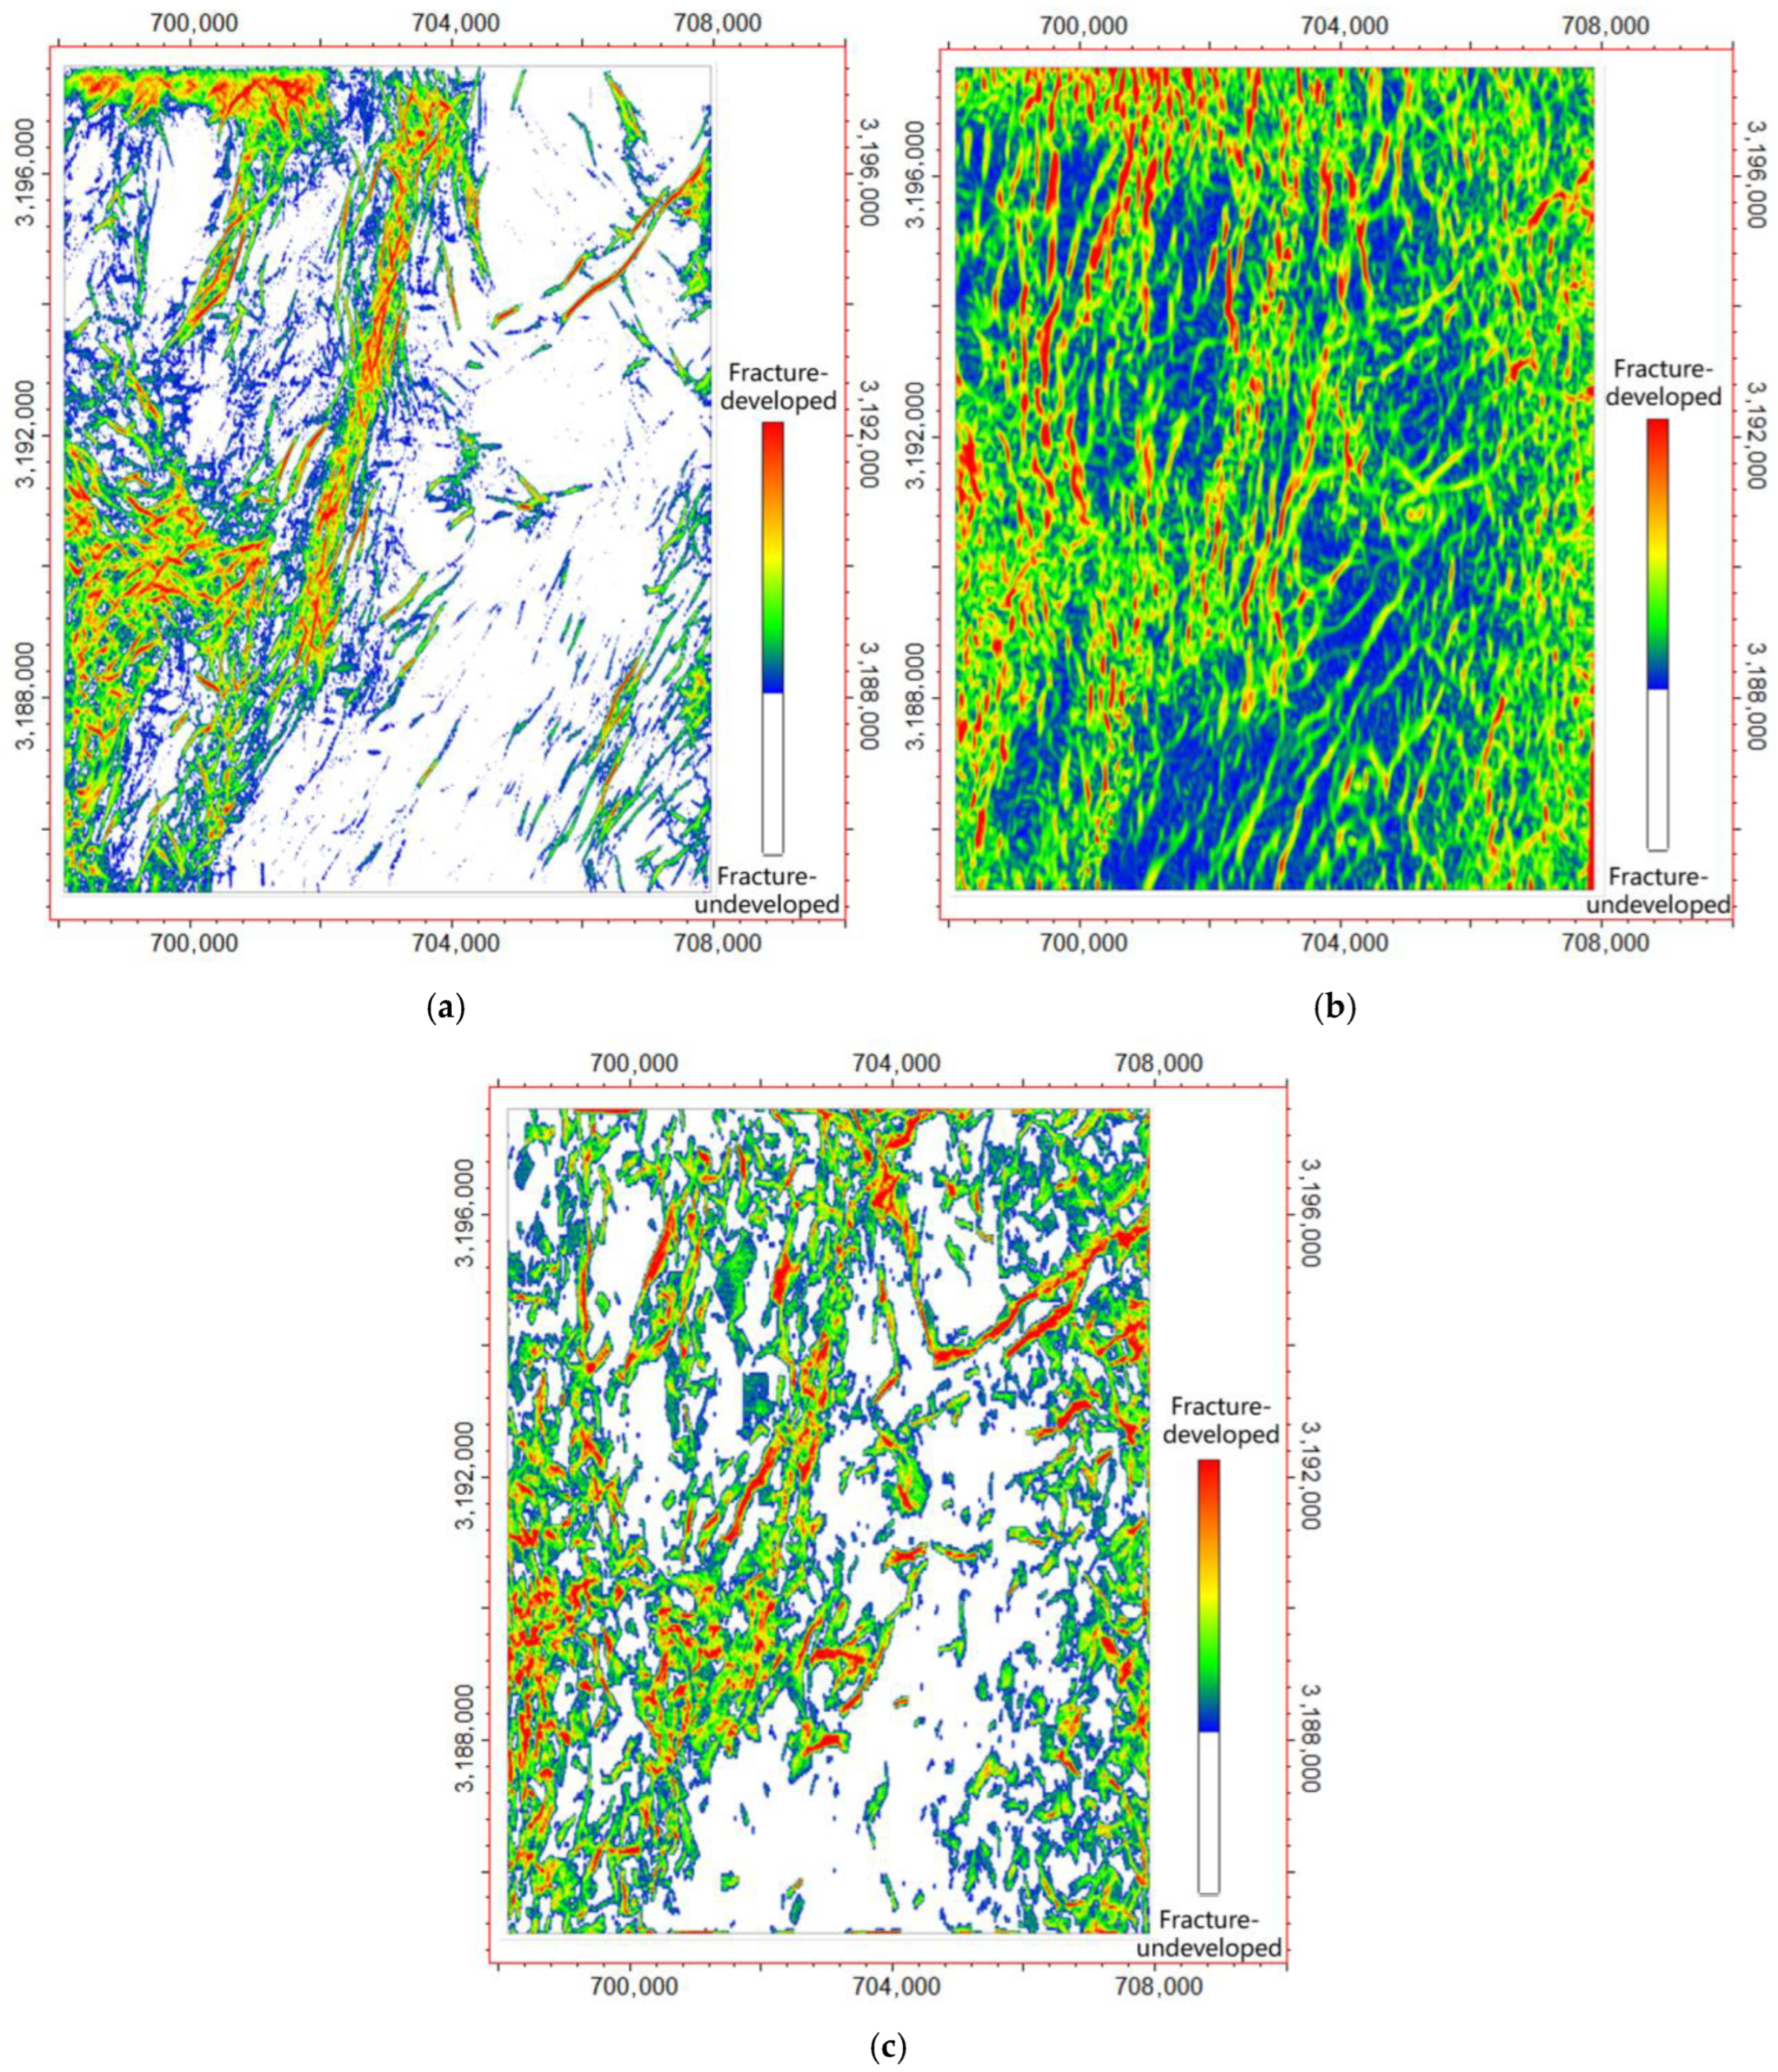
For large-scale faults with throws greater than about 20 m, we began with a rapid screening on variance-based coherence volumes and time or horizon slices. Coherence anomalies, however, are well known to be non-unique: a lineament may indicate a fault, but it may also reflect stratigraphic edges, noise, or acquisition and processing footprints. For this reason, we followed a strict interpretation logic of “attribute guidance, section-based verification, and closure under a regional structural style”. In practice, candidate fault trends were first highlighted on coherence, then manually tracked and corrected on vertical profiles where reflector terminations and offsets could be checked directly, and finally tested for three-dimensional consistency and geometric closure in the context of the regional tectonic pattern. This step yielded a fault framework that is interpretable and internally consistent, rather than a coherence-driven map with ambiguous meanings (
Figure 8a).
Once the main framework was in place, we targeted medium-scale faults that produce only subtle reflector bending and small offsets, typically in the 5–20 m throw range. In this displacement window, curvature attributes tend to be more diagnostic than coherence because they respond to gentle flexure that may not generate strong discontinuities. Based on the dip attribute volume, a local surface-fitting algorithm was used to compute the maximum positive curvature
Kmax and the maximum negative curvature
Kmin. For the fitted quadratic surface
z(
x,
y) =
Ax2 +
By2 +
Cxy +
Dx +
Ey +
F, the Gaussian curvature
K and the mean curvature
H are expressed as follows:
The principal curvatures can then be derived accordingly:
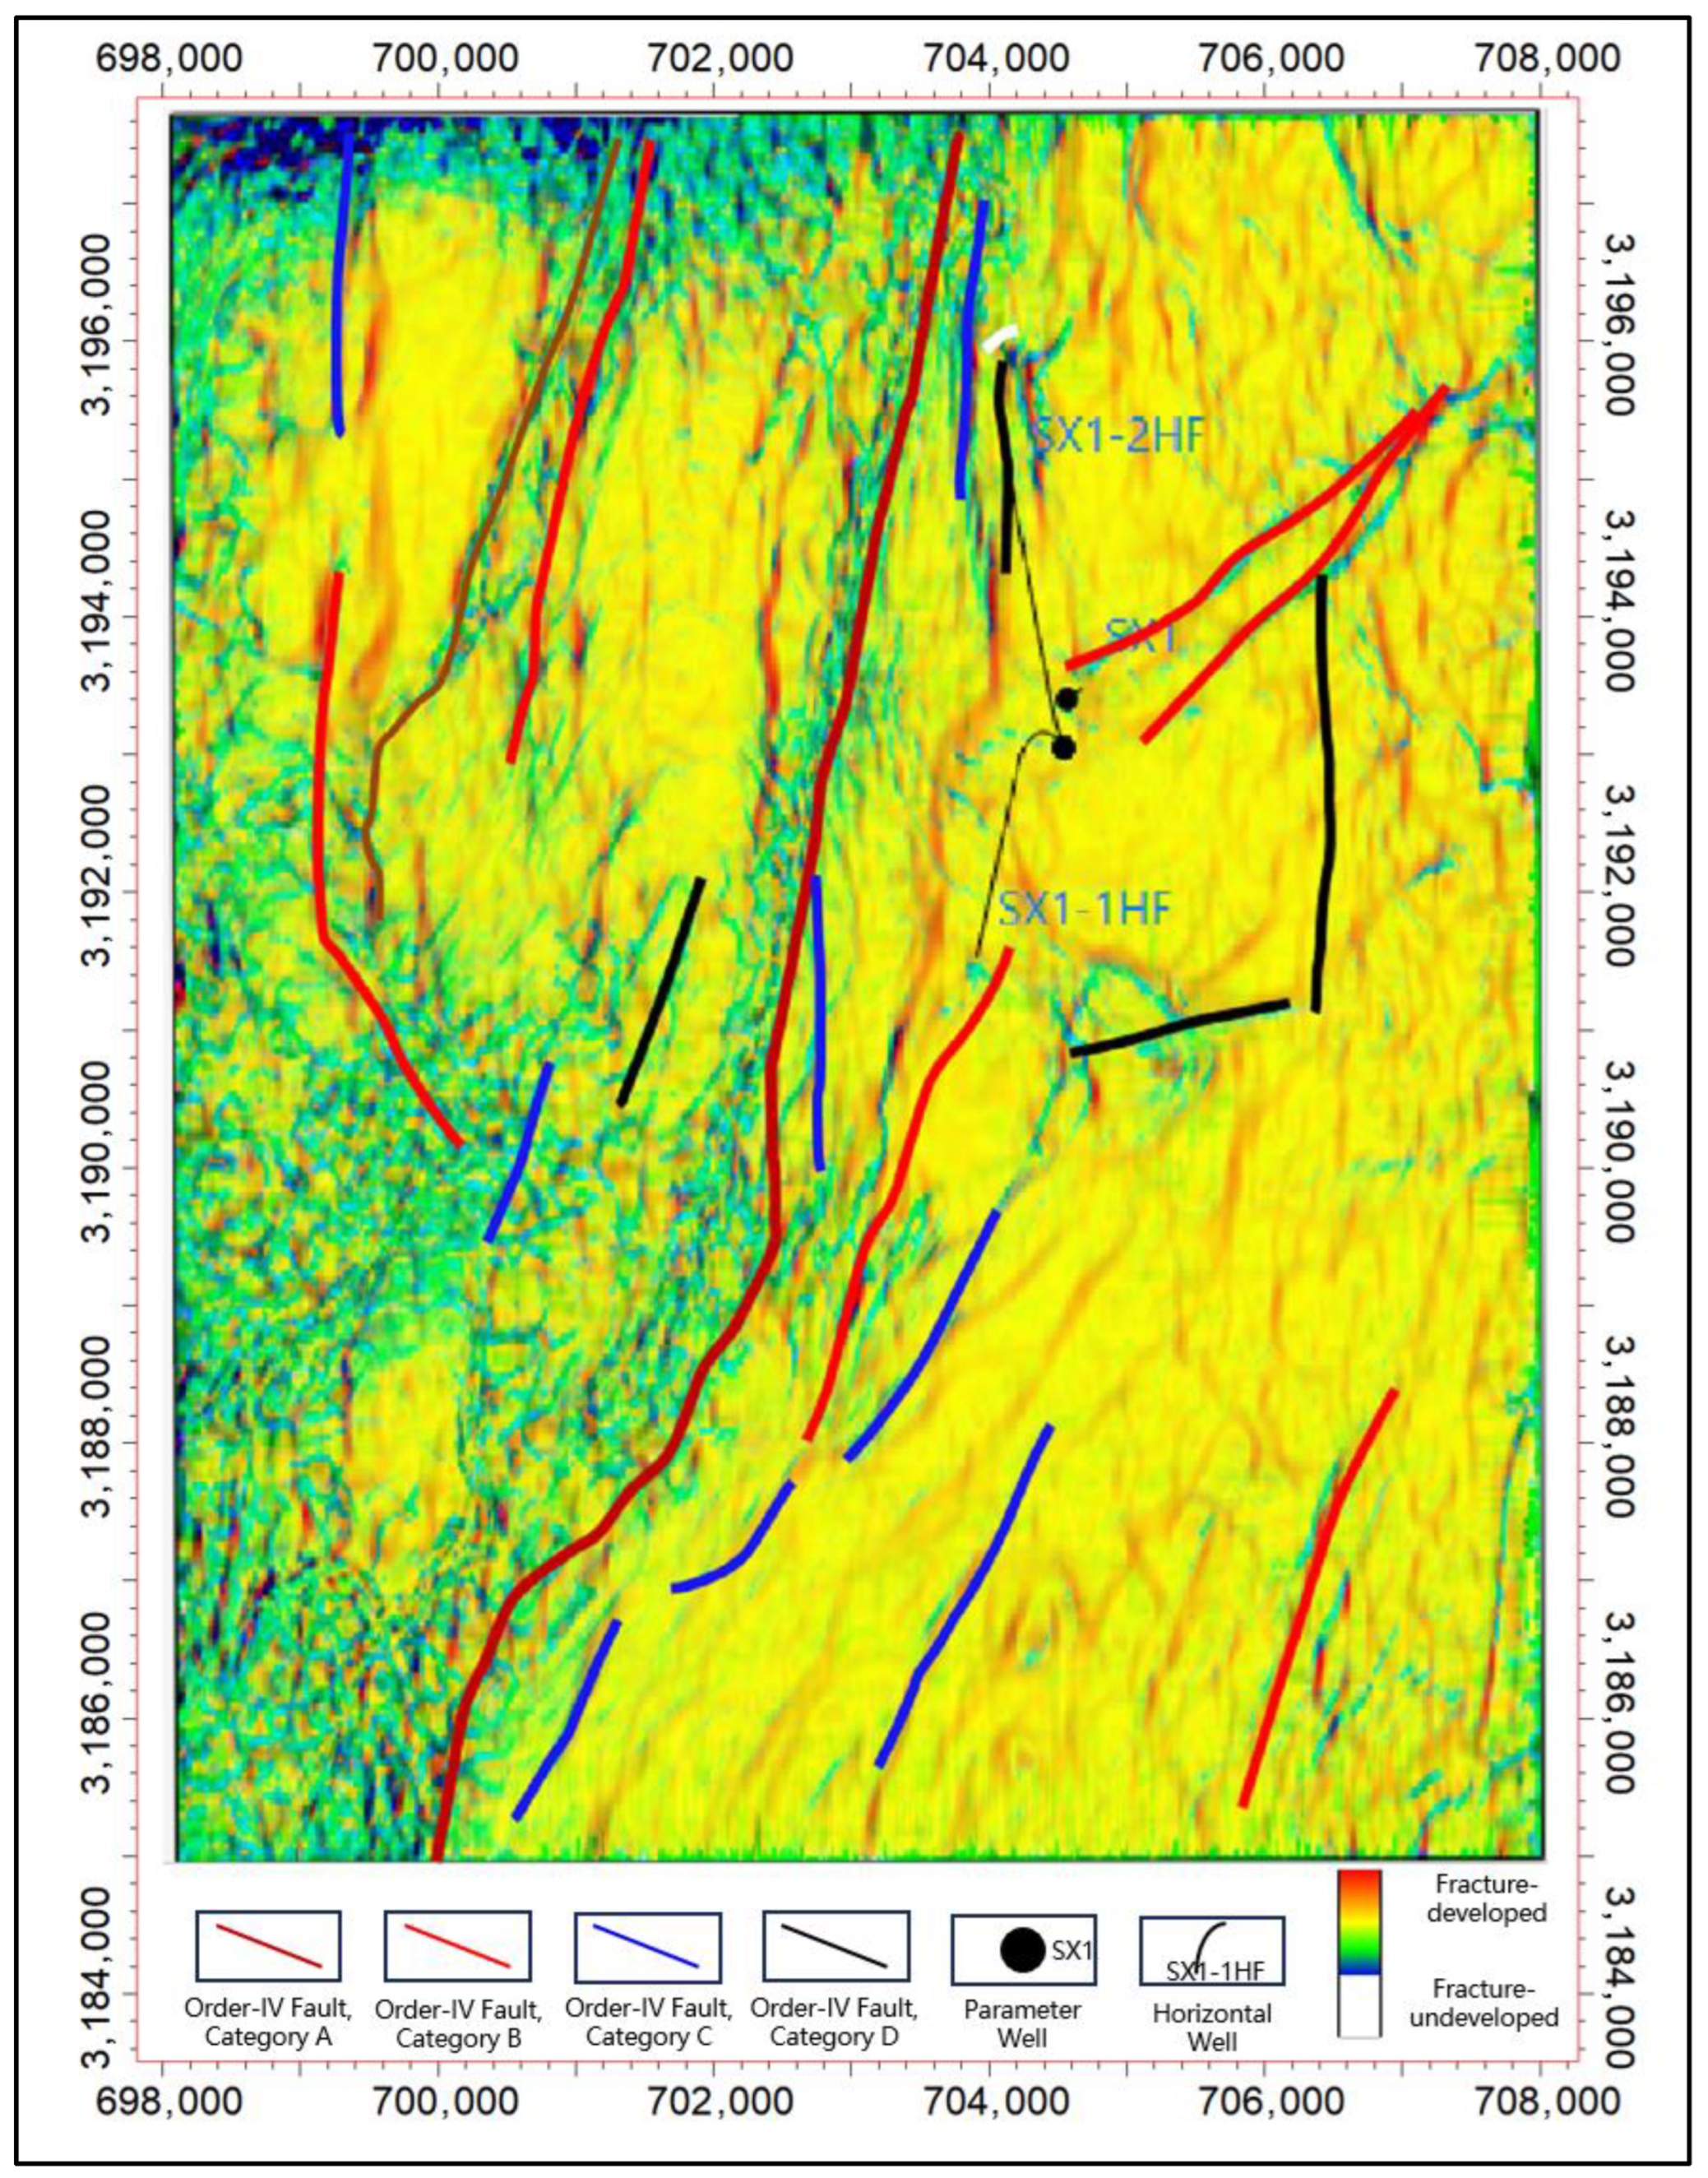
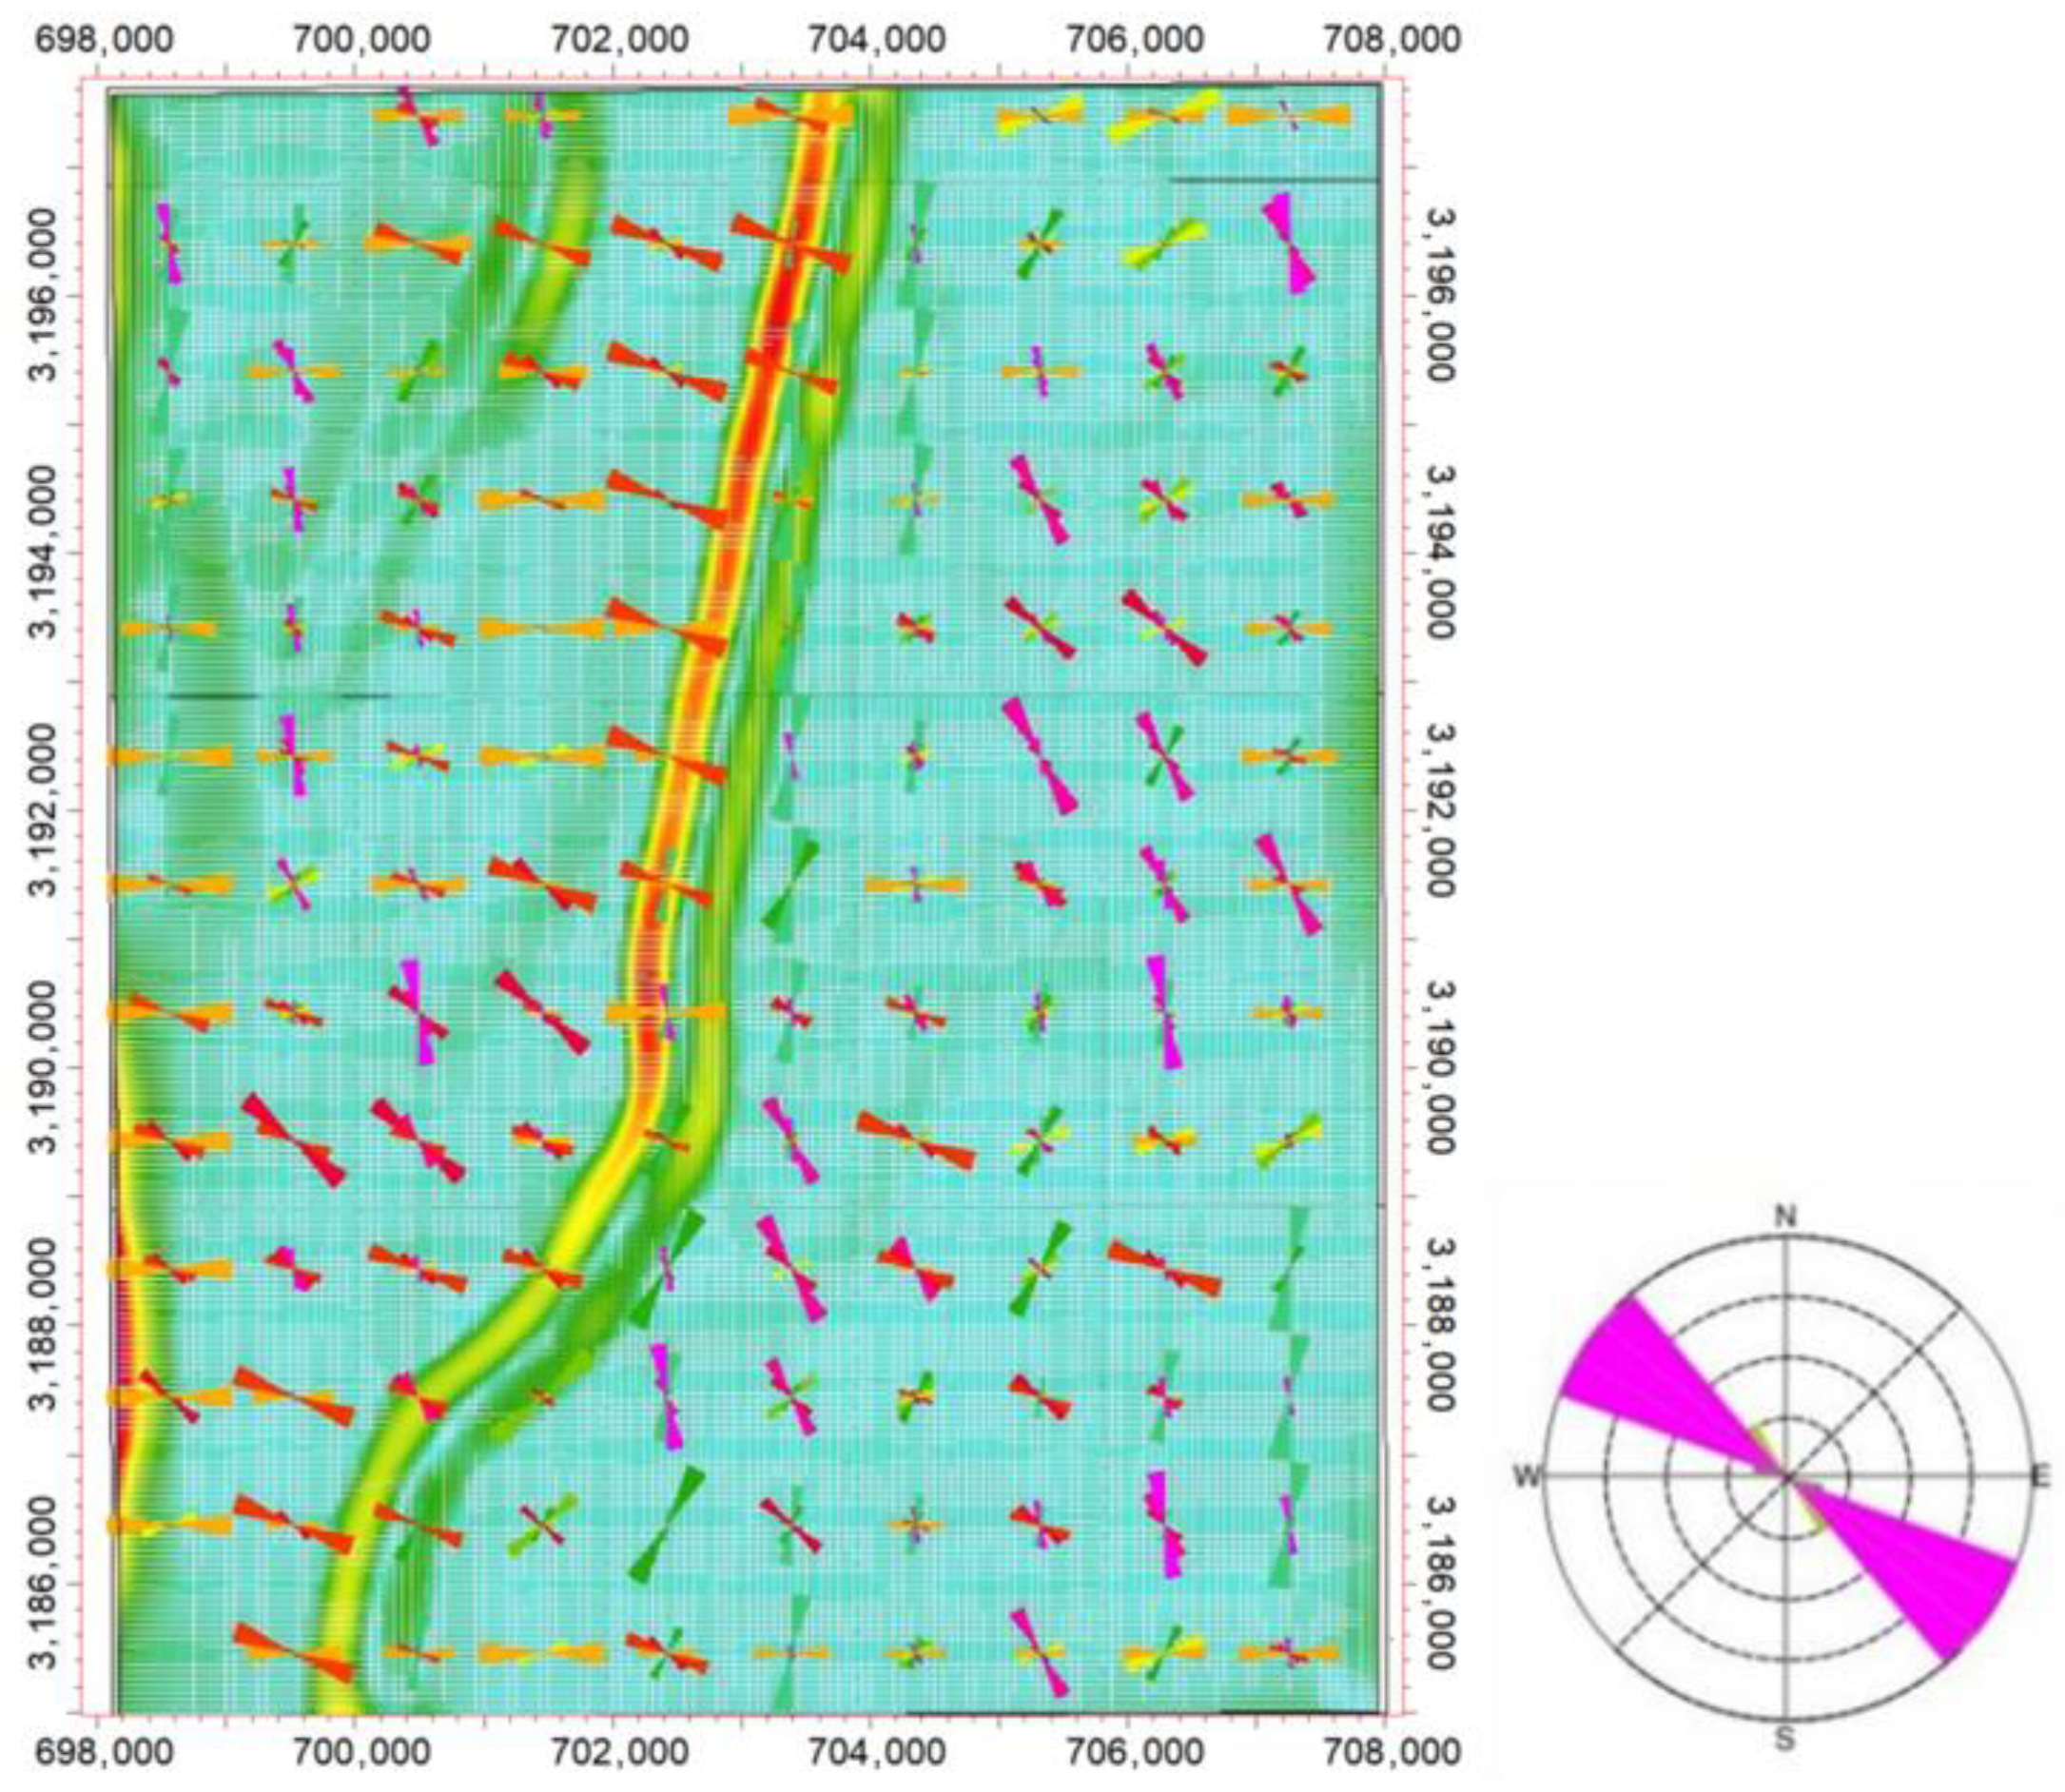
The resulting high-curvature anomalies appear as narrow, laterally continuous linear belts. These belts match the flexure patterns observed on seismic sections, which allowed us to map a large number of medium-scale faults with better confidence (
Figure 8b).
Finally, for micro-fracture systems with very weak direct seismic expression and throws below roughly 5 m, we used an ant-tracking technique to enhance and connect discontinuity cues into a coherent fracture image. The workflow was implemented as an iterative optimization process: a “pheromone” field was initialized using a discontinuity-sensitive attribute such as chaos. Virtual ants were then released to explore pathways guided by the local pheromone strength and heuristic rules, while depositing additional pheromones along preferred routes. After multiple iterations, pheromones progressively accumulate along consistent fracture trends and suppress scattered noise responses, and the procedure converges to a clear, skeletonized three-dimensional fracture network (
Figure 8c).
To ensure the reliability of the multi-scale fault and fracture interpretation, the results were validated using independent geological and engineering data. The large-scale faults identified by coherence attributes were cross-checked with surface geological surveys and outcrop observations, showing high consistency in both spatial location and strike direction. For the medium-to-small-scale fractures identified by curvature and ant-tracking, we compared the predicted fracture orientations with the interpretation results from image logs in key horizontal wells, such as Shixi 1-1HF. The comparison confirms that the dominant predicted fracture trends (NWW–SEE and NE–SW) are highly consistent with the natural fractures observed in the wellbore, thereby validating the effectiveness of the tiered attribute-based detection workflow.
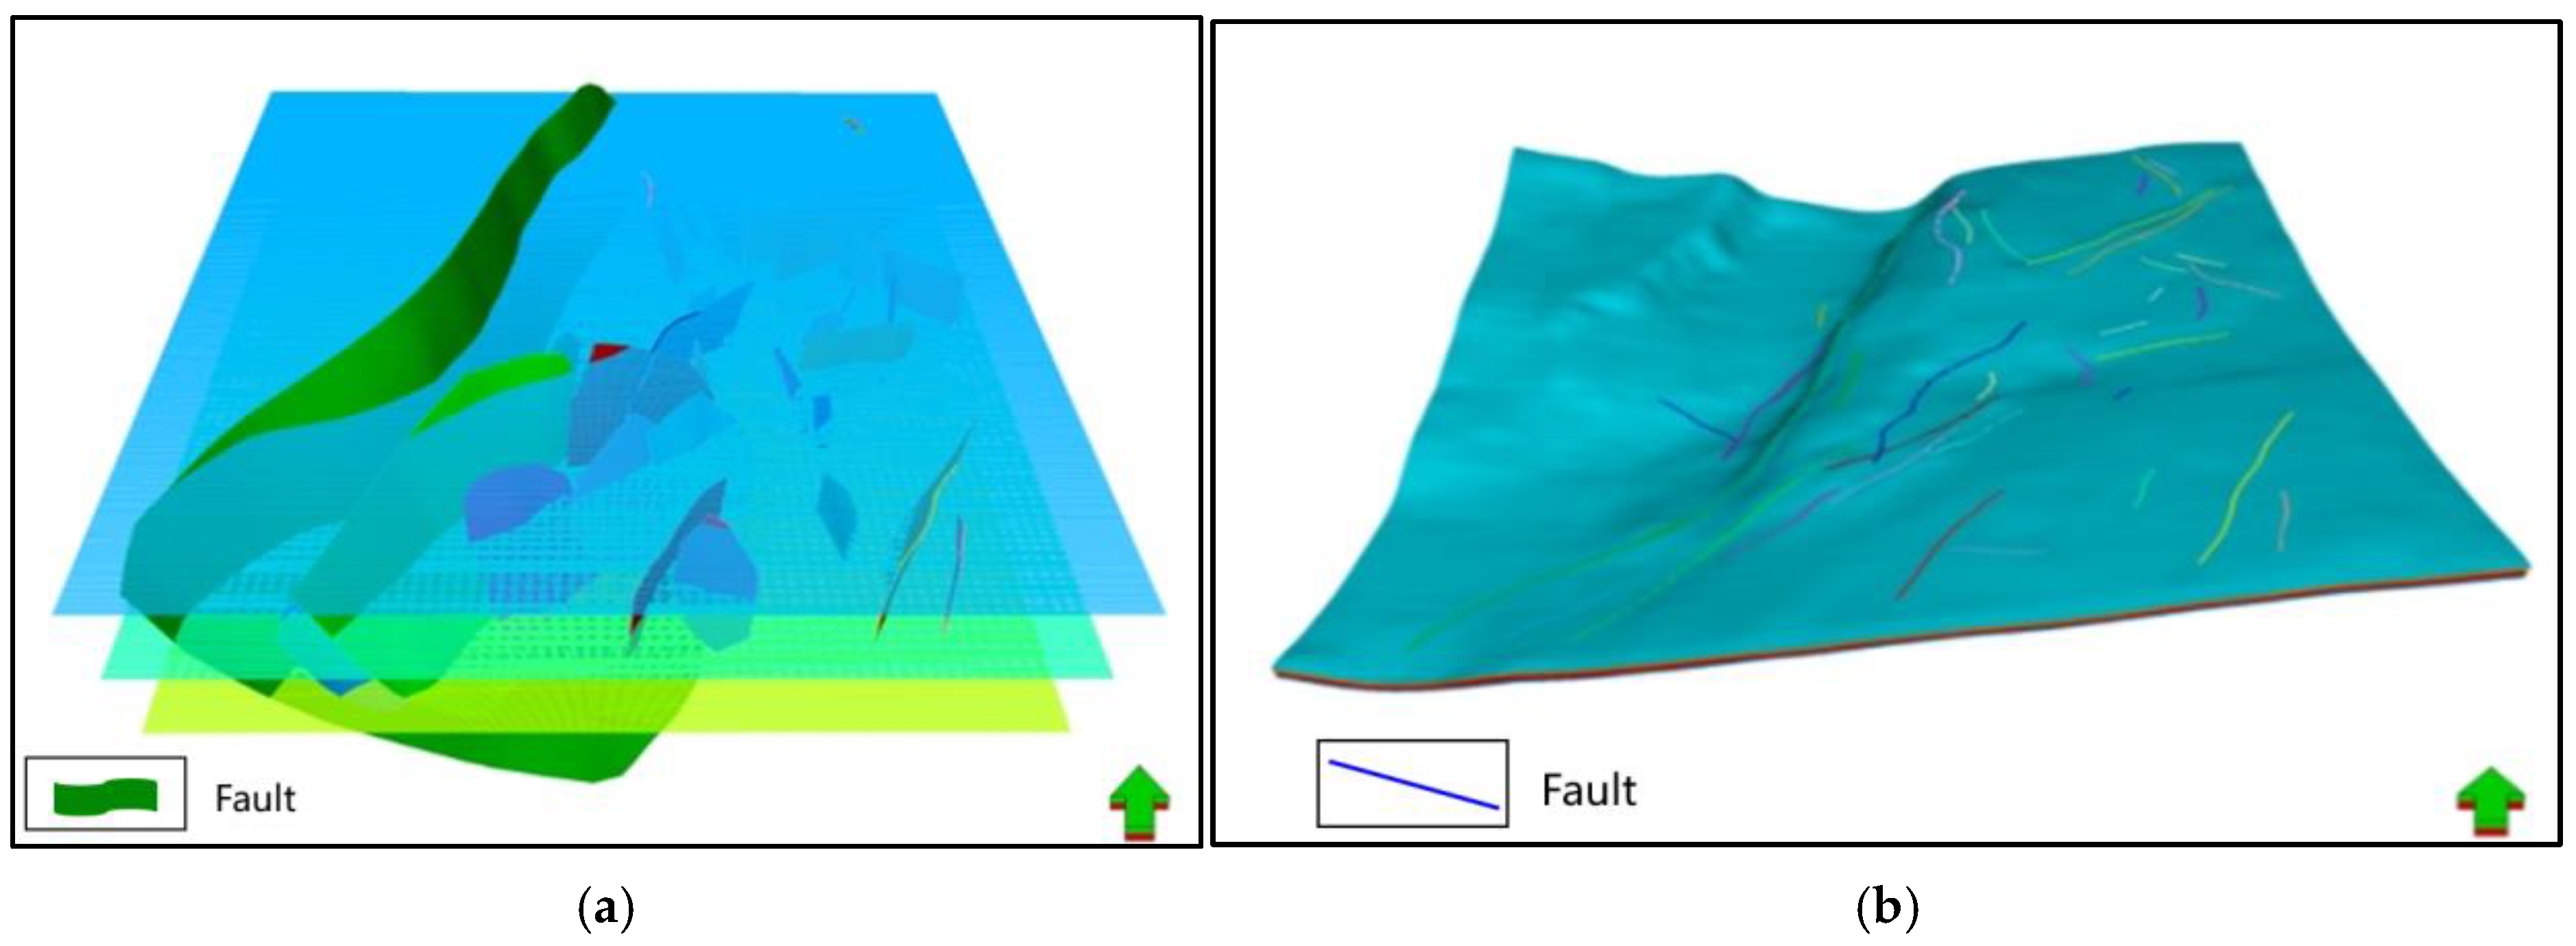
The above results were fused into a hierarchical 3D fault system, including regional faults, major faults with a throw >20 m, secondary faults with a throw of 5–20 m, and micro-fracture trends (<5 m). The fused model shows a dominant NE to NNE trend and clear spatial zonation (
Figure 9). The synclinal core and the steep western limb form the main fault-dense belt with more complicated fault styles, while the eastern limb is relatively gentle with smaller fault sizes and lower density. This model provides a consistent structural basis for subsequent work such as fracture-density analysis, fault sealing discussion, stress modeling and well trajectory optimization.
3.3. High-Precision 3D Structural Modeling and Depth Conversion
A reliable 3D structural model is the basis for shale gas sweet-spot evaluation and well planning. In Shixi, the main difficulties are sparse wells and uneven seismic quality. Therefore, we integrated multi-source constraints for horizon calibration, and used an iterative well-controlled velocity modeling approach for time–depth conversion, and then constructed a deterministic structural framework model.
For horizon calibration, we applied a “three-in-one” strategy: well-to-seismic tie using synthetic seismograms, shallow constraint by surface outcrops, and regional comparison for deep horizons without direct control. Eight key reflection interfaces from the Cambrian to the Triassic were finally correlated (
Table 2). Among them, the base of the Wufeng formation (T
O3w) is a stable regional marker with strong amplitude and good continuity, and it was treated as the main reference horizon in structural modeling.
For depth conversion, an initial layered velocity model was built based on interpreted time horizons and interval velocities. Then, well stratigraphic tops were used as hard constraints to calculate depth residuals at well locations. These residuals were interpolated to continuous correction surfaces (Kriging method), and the interval velocities were updated iteratively. After several iterations (typically 3–5 times), the depth mismatch in calibration wells was controlled to a low level, and the final 3D velocity field was used for depth conversion.
Structural modeling was carried out in a fault-first manner. Interpreted faults were built into a 3D fault framework, and key depth horizons (e.g., top S1l14 and base T
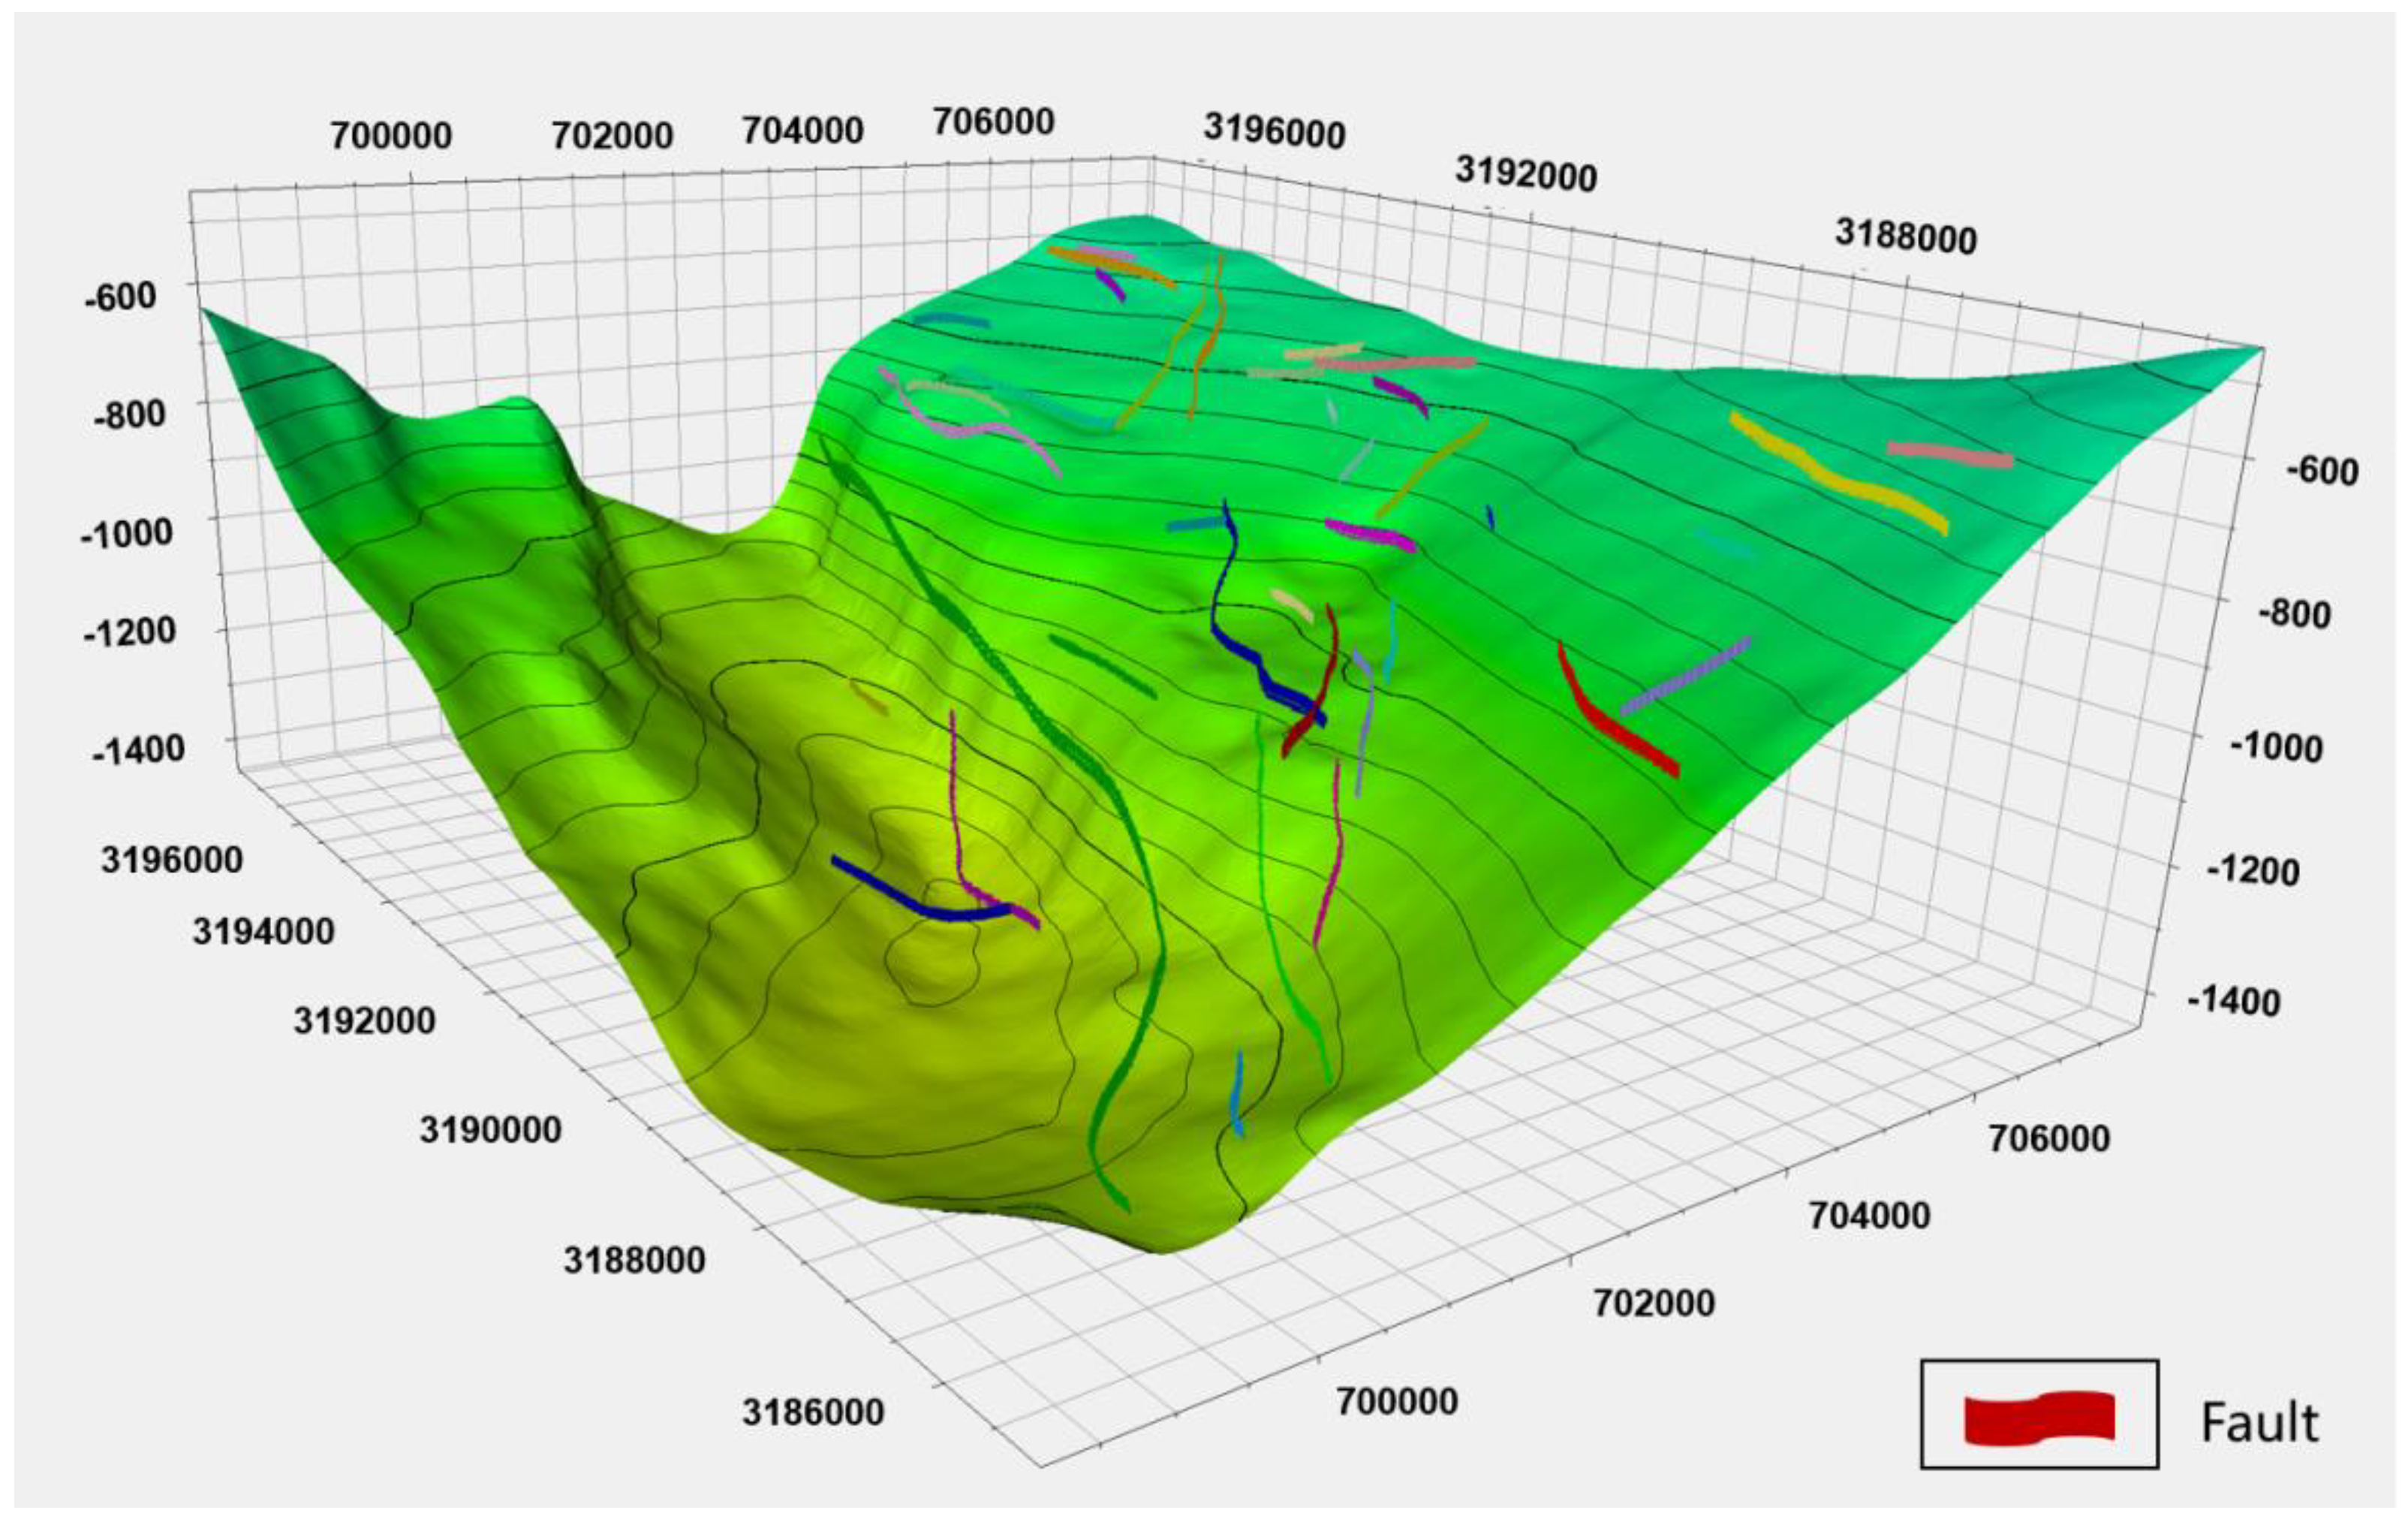
O3w) were generated with fault constraints. Seismic-derived interpretation points were used as trend control, while well tops were enforced as hard data, so the model honors both seismic geometry and well markers. Internal sublayers were then constructed using thickness trend constraints to obtain a high-resolution 3D structural grid. The final model indicates that Shixi is a narrow and steep syncline with a gentle eastern limb and a steeper western limb, and it can be divided into a western depression and an eastern slope (
Figure 10).
Model validation was performed using blind wells not involved in modeling. The uncertainty in structural modeling, primarily stemming from velocity variations in the complex overburden, was quantified through blind well validation. By excluding 15% of the available wells during the initial velocity modeling phase, we measured the depth residuals at these locations. The results showed a mean relative error of less than 1.8%, which served as a quantitative measure of the structural framework’s reliability. This uncertainty was further mitigated through an iterative well-controlled velocity updating process, where residuals were Kriging-interpolated to refine the 3D velocity field until the model converged with the hard data from all calibration wells. The depth prediction errors are generally less than 2%, indicating that the structural model has acceptable accuracy for subsequent reservoir modeling, geomechanical simulation and well trajectory design.
4. Sweet-Spot Prediction
Seismic inversion is one of the important approaches for quantitative descriptions of shale gas reservoirs because it integrates seismic data, well logs, and geological interpretation and has relatively high vertical and lateral resolution compared with conventional seismic attribute interpretation. In this study, based on the detailed well interpretation in the Shixi area, we carried out well-to-seismic calibration and rock-physics analysis to determine the optimal sensitive parameters for identifying high-quality shale. Meanwhile, several targeted preprocessing steps (e.g., noise attenuation and gather flattening) were applied to improve the amplitude fidelity of seismic data for reservoir prediction. According to the sensitivity results from rock physics, we selected and combined different prediction strategies, including post-stack inversion, pre-stack inversion, and facies-controlled geostatistical inversion, to achieve a higher-accuracy sweet-spot delineation for the Wufeng formation and the lower Longmaxi formation.
In order to satisfy the production-support requirement, the work was implemented in two stages. In the early stage, seismic facies and sensitive attributes were analyzed first, and post-stack deterministic inversion was used for preliminary identification of favorable intervals. In the later stage, following the mid-term review suggestions and considering impedance prior constraints, a pre-stack, phase-controlled geostatistical inversion was conducted to further improve the prediction precision for thin high-quality shale.
4.1. Rock-Physics Analysis and Reservoir-Sensitive Parameters
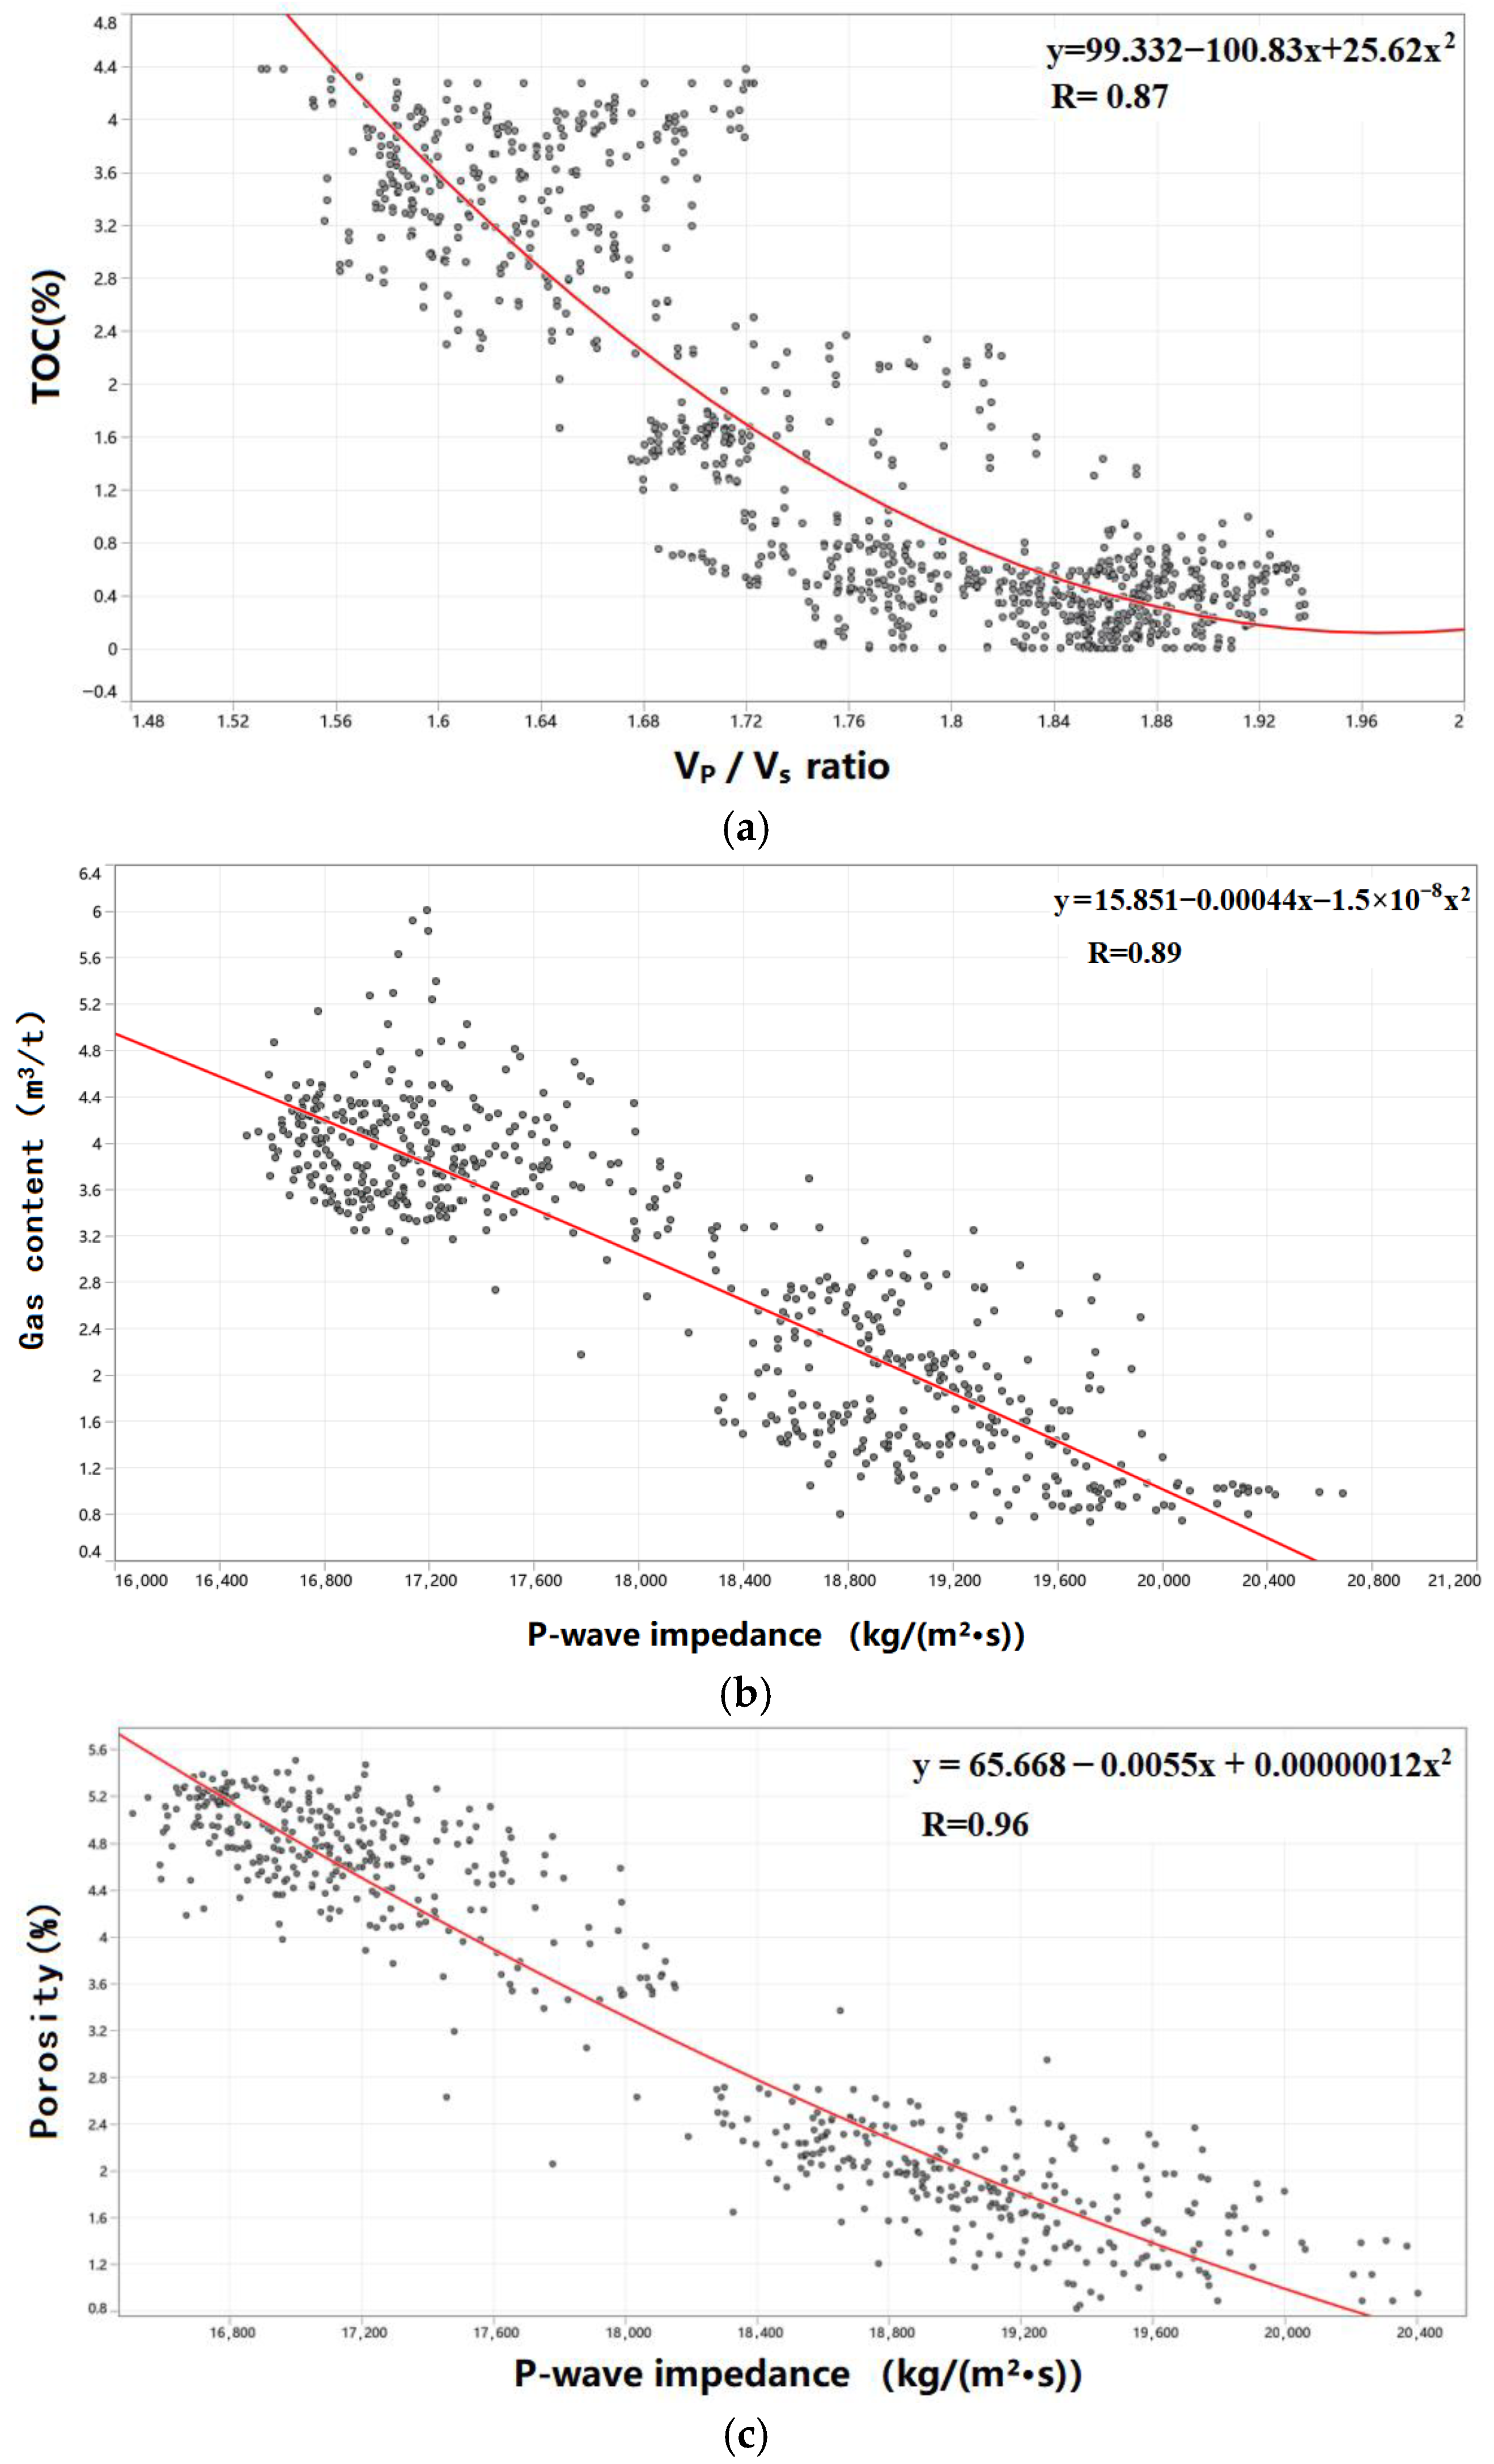
According to the current cognition in the Shixi block, shale gas-bearing intervals generally show the integrated responses of low P-wave velocity, low density, low Vp/Vs ratio, high natural gamma, high TOC, relatively high porosity, and high total gas content. Rock-physics analysis was mainly based on crossplots between elastic parameters (from sonic and density logs) and reservoir quality indicators (such as TOC, total gas, and porosity). The analysis used three representative wells in/near the study area (Shixi-1, Shidi-1, and Shidi-2), and aimed to confirm whether elastic-property separation is sufficiently clear for seismic inversion to discriminate high-quality shale.
The crossplot results indicate that the total gas content has a strong correlation with P-wave impedance (ZP) (
Figure 11), with a correlation coefficient around 0.93. Similarly, porosity also shows a very high correlation with P-wave impedance, reaching about 0.97. Therefore, both total gas and porosity can be predicted indirectly through an impedance volume derived from either post-stack or pre-stack inversion. For TOC, the relationship with Vp/Vs is relatively better than with impedance, with a correlation coefficient around 0.7, suggesting that Vp/Vs derived from pre-stack inversion is more meaningful for TOC prediction in this area. These observations provide the quantitative basis to select Zp and Vp/Vs as the key elastic sensitive parameters for subsequent sweet-spot prediction.
While the crossplot results in
Figure 11 demonstrate strong empirical correlations at well locations, the application of these relationships across the entire 3D volume involves inherent uncertainties. The reliability of reservoir parameter prediction (e.g., TOC and porosity) is highly dependent on the seismic amplitude fidelity. In regions with a low seismic signal-to-noise ratio (Class III data), the elastic-to-reservoir property conversion may suffer from increased ambiguity due to weak seismic responses and the lack of direct shear-wave control. Consequently, in areas far from well control or with complex deformation, these seismic-derived predictions are treated as spatial trend indicators rather than absolute quantitative values, and should be integrated with geological reasoning for decision-making.
4.2. Qualitative Screening by Seismic Facies, Forward Modeling, and Waveform-Guided Simulation
Because the Wufeng–Longmaxi high-quality shale thickness is commonly only 10–30 m and the internal layering is thin, purely deterministic methods may have limitations in identifying subtle variations. In the early stage, we first carried out qualitative screening, mainly including forward modeling for seismic response understanding, amplitude-based sensitive attribute mapping, and waveform-guided simulation for “non-elastic” parameters (such as element or gamma-related indicators).
Forward modeling was constructed using wedge-shaped bodies representing three reservoir grades within the Wufeng–Longmaxi interval, plus the underlying Baota limestone as the fourth lithologic unit. The modeling suggests that when high-quality shale develops, a strong composite reflection is generated at the basal boundary of the Wufeng formation, typically showing a “trough-over-peak” waveform pair, and the lower peak becomes stronger with increasing reservoir thickness. These results suggest that the reflection energy and amplitude strength along the basal Wufeng boundary may serve as a first-order indicator of thickness and possible sweet-spot development.
Based on this understanding, amplitude attributes were extracted along the basal Wufeng horizon (
Figure 12). The map shows that strong amplitudes mainly occur on both sides of the Shixi fault zone. In the western part, amplitudes are stronger overall, implying that the reservoir may be thicker; in the eastern part, the strong-amplitude zones are more continuous and cover a broader area, which may indicate more laterally stable development. This qualitative attribute recognition supported the preliminary block evaluation and early well-location optimization.
However, some important indicators (for instance, element curves used in mud logging) do not have direct physical linkage with elastic parameters, so they cannot be obtained directly from seismic elastic inversion. Considering that seismic waveforms represent the vertical tuning pattern of lithologic assemblages and their lateral variation reflects facies changes, we applied post-stack waveform-indicative simulation under a Bayesian framework. In this method, training samples are selected by both waveform similarity and spatial distance, instead of only distance-based variogram statistics, which is considered more consistent with sedimentary control.
Using three data wells as constraints, the waveform-indicative simulation suggests that the high values of the element-sensitive parameter are mainly concentrated in the central and western part of the area, with the western part being more dominant. By applying empirical thresholds (type I reservoir greater than 230; high-quality reservoir between 165 and 230), a type I thickness map was calculated. The type I interval is interpreted to be concentrated in the eastern depression with a thickness of up to around 20 m, which is basically consistent with the well understanding. At the same time, it should be noted that this kind of simulation strongly depends on well control; thus, in areas with sparse wells, the prediction matching rate may decrease. Therefore, elastic-parameter-based inversion is still necessary for more reliable fine-scale characterization.
4.3. Quantitative Prediction by Deterministic Inversion, Pre-Stack Simultaneous Inversion, and Phase-Controlled Geostatistical Inversion
Given the burial depth and velocity conditions of the target interval, both post-stack and pre-stack deterministic inversions are feasible to predict the overall shale distribution and to identify favorable zones. Nevertheless, because the truly high-quality shale is relatively thin, conventional methods may not well resolve its lateral variation, and the prediction of velocity–density-related sensitive parameters is required. After method screening, the main quantitative approach in this study is a pre-stack, phase-controlled geostatistical inversion constrained by impedance priors, with deterministic inversion providing trend and geological guidance. Multiple equiprobable realizations were generated to evaluate the uncertainty and possible fluctuation range of prediction results.
First, post-stack sparse-spike inversion was carried out to obtain a P-wave impedance volume (
Figure 13), which was used as a prior constraint and also for controlling the overall shale distribution. On the planar view, the low-impedance favorable zones are mainly concentrated in the central and eastern parts, consistent with geological expectations. Vertically, the favorable interval tends to occur below sublayer 4, matching the well understanding. However, the vertical resolution is still relatively low, and further refinement is required.
Second, pre-stack simultaneous inversion was implemented to retrieve multiple elastic parameter volumes (Zp, Zs, density), and then derive secondary parameters such as Vp/Vs, Poisson’s ratio, and Young’s modulus. The inversion strategy follows the Zoeppritz-based AVO theory and commonly used approximations (e.g., Fatti-type formulation), and a sparse-spike approach was adopted due to the limited well distribution. In practical operation, pre-stack inversion requires at least three angle-stacked seismic volumes and corresponding wavelets, plus density- and velocity-related log curves. For our data, the maximum incident angle can reach above 30°, and to meet the requirement that angles beyond about 20° contribute to fluid/lithology discrimination, three angle stacks were designed: near, 9–18°; mid, 15–24°; and far, 21–30°.
A key issue is data quality control. For well logs, preprocessing included abnormal point removal, depth correction, baseline shift correction, and curve standardization to reduce non-geological noise and to improve stability of inversion. For seismic gathers, conventional processing is often more aimed at structure imaging, but may not satisfy AVO-preserving inversion demands. Therefore, targeted gather optimization was conducted, including OVT gather migration, noise attenuation (random and linear noise), anisotropy-related flattening, stretch correction, AVO amplitude correction, and regularization to mitigate uneven offset distribution. After these steps, the gathers show clearer AVO behavior and better event alignment. Well-seismic calibration at Shixi-1 shows that the synthetic and real seismic wave groups are basically consistent, and the basal Wufeng boundary presents a strong, continuous reflection due to the large impedance contrast between the overlying low-impedance shale and the underlying high-impedance Baota limestone. In the absence of measured shear-wave logs in the study area, Vs-related information was estimated using a combination of the Greenberg–Castagna empirical relationship and local calibration [
31]. Specifically, a multi-linear regression model was established based on P-wave velocity and density data from an adjacent syncline with identical lithofacies (Wufeng–Longmaxi formations). This calibrated model was then applied to the Shixi block to derive the initial Vs curves for pre-stack inversion. This is a practical choice but will introduce some uncertainty, which should be considered when interpreting TOC and brittleness results.
Based on crossplots between elastic and reservoir parameters, TOC, total gas, and effective porosity can be converted from the inverted elastic parameters, with moderate-to-good correlations (roughly 0.62–0.73 in this work). The brittleness index was computed using elastic-parameter-based Young’s modulus and Poisson’s ratio normalization. Finally, sweet-spot thickness was predicted by applying threshold criteria within a defined vertical time window (from Longmaxi sublayer 2 to Wufeng), counting samples meeting the criteria, and converting to thickness using velocity. A TOC threshold of about 2% was adopted as the main criterion, and for development consideration, the prediction focused on Longmaxi sublayer 1 as a preferred “box” for horizontal drilling. The 3D finite-element model was constrained by specific elastic parameters and boundary conditions. The Young’s modulus (E) and Poisson’s ratio (ν) were derived from pre-stack seismic inversion and calibrated by well-log data, with E ranging from 25 to 45 GPa and ν from 0.18 to 0.28 in the target shale interval. For the boundary conditions, the model was subjected to a vertical stress (σv) of approximately 93 MPa, calculated from the overburden density. The horizontal stress magnitudes were constrained by the regional tectonic stress field, with the maximum horizontal stress (σH) azimuth set at 115° ± 10° NWW. Rigid plates were applied to the lateral boundaries to ensure uniform loading, and the model was extended to include overburden and underburden layers to minimize boundary effects.
In the later stage, the phase-controlled geostatistical inversion was used to integrate the deterministic impedance trend, stratigraphic layering constraints, and seismic lateral continuity. By running multiple realizations, this approach not only improves resolution for thin sweet spots but also provides a way to evaluate uncertainty, which is important for decision-making under limited well constraints. To further address the potential bias introduced by analog-derived shear-wave data, we utilized phase-controlled geostatistical inversion to perform sensitivity analysis. By running multiple equiprobable realizations, we introduced stochastic perturbations based on the statistical distribution of well-log data and spatial variograms. This approach allows us to simulate the range of uncertainty in elastic-to-reservoir property conversion. The results indicate that while the absolute values of predicted parameters may vary across realizations, the spatial distribution patterns and relative trends of high-quality shale remain remarkably consistent, suggesting that the inversion framework is robust enough to capture the primary reservoir heterogeneities.
4.4. Geomechanical Simulation
According to the relative magnitudes, the Shixi area is interpreted as the third-type stress regime, namely σH > σv > σh, where vertical stress is the intermediate principal stress and vertical fractures are more likely generated. This stress framework is one important basis for shale gas evaluation and stimulation design, since wellbore stability, permeability anisotropy, and hydraulic fracture geometry are all sensitive to the magnitude and azimuth of principal stresses.
The geomechanical model was built following the conventional finite-element-based idea: discretizing the geological body into elements, assigning mechanical properties, applying boundary constraints, and solving stress distribution numerically. A 1D geomechanical model was first conducted at wells using conventional logs (e.g., GR, density, sonic, porosity) together with special logs when available, and then calibrated by laboratory and field measurements. Based on the 1D results, 3D property models (elastic parameters, strength parameters, and pore pressure) were generated to represent reservoir heterogeneity. A well–seismic combined method was applied, taking well discrete data as hard data and seismic inversion as soft data, with seismic trend constraints and stochastic simulation plus cokriging interpolation. For the 3D finite-element model, the reservoir grid was extended to include overburden, underburden, and sideburden to reduce the boundary effect, and the lateral boundary size was set to about three times the reservoir dimensions. Rigid plates were added at the outer boundary to ensure uniform loading. Material models were assigned to shale reservoir and surrounding formations, and discontinuities such as faults and fractures were included because they can locally disturb stress orientation. Temperature was set using a regional gradient of about 3 °C per 100 m. Boundary conditions indicate that the maximum horizontal stress azimuth is around NWW, about 115° ± 10°, and vertical stress was taken as about 93 MPa. The simulation was implemented in Petrel Visage, and the 3D initial stress results were checked against 1D calculations, showing good consistency, which supports the model’s reliability.
The simulated stress orientation is consistent with log-based interpretation from borehole breakouts and drilling-induced fractures, showing an overall NWW-trending σ
H (
Figure 14). In the magnitude distribution, the depression center has relatively higher stress, and stress decreases gradually towards the flanks; σ
H and σ
h show similar spatial trends, while fault-developed zones may cause local rotation of stress direction. These results provide practical guidance for horizontal well trajectory planning and hydraulic fracturing azimuth selection in the Shixi shale gas development.
To ensure the reliability of the geomechanical simulation, the following modeling assumptions were adopted: (1) The shale reservoir and surrounding formations are assumed to be mechanically homogeneous within each discretized element, with properties assigned based on log-derived elastic parameters. (2) Although shale exhibits inherent anisotropy, for the purpose of this regional-scale stress modeling, the formations are assumed to be isotropic at the simulation scale to maintain computational stability. (3) The sealing capacity of large-scale regional faults is assumed to be primarily controlled by the effective normal stress acting on the fault plane, where higher normal stress promotes fault closure and gas retention. (4) The model assumes a uniform loading state at the outer boundaries, maintained by rigid plates to simulate the regional tectonic stress field.
5. Preservation Condition Assessment
Shale gas “sweet-spot” evaluation is a multi-factor undertaking, which usually includes preservation condition, reservoir properties, and engineering feasibility. For the study area, we still follow the technical idea that preservation is the key for shallow, normal-pressure shale gas. The main indicators involved include structural style, fault and fracture development, burial depth, dip angle, formation pressure coefficient, effectiveness of roof and floor sealing, brittleness and stress field for later fracturing, etc. In this section, we focus on the geological factors that directly control gas retention and the method to delineate favorable preservation zones.
5.1. Geological Background and Main Controlling Factors of Preservation
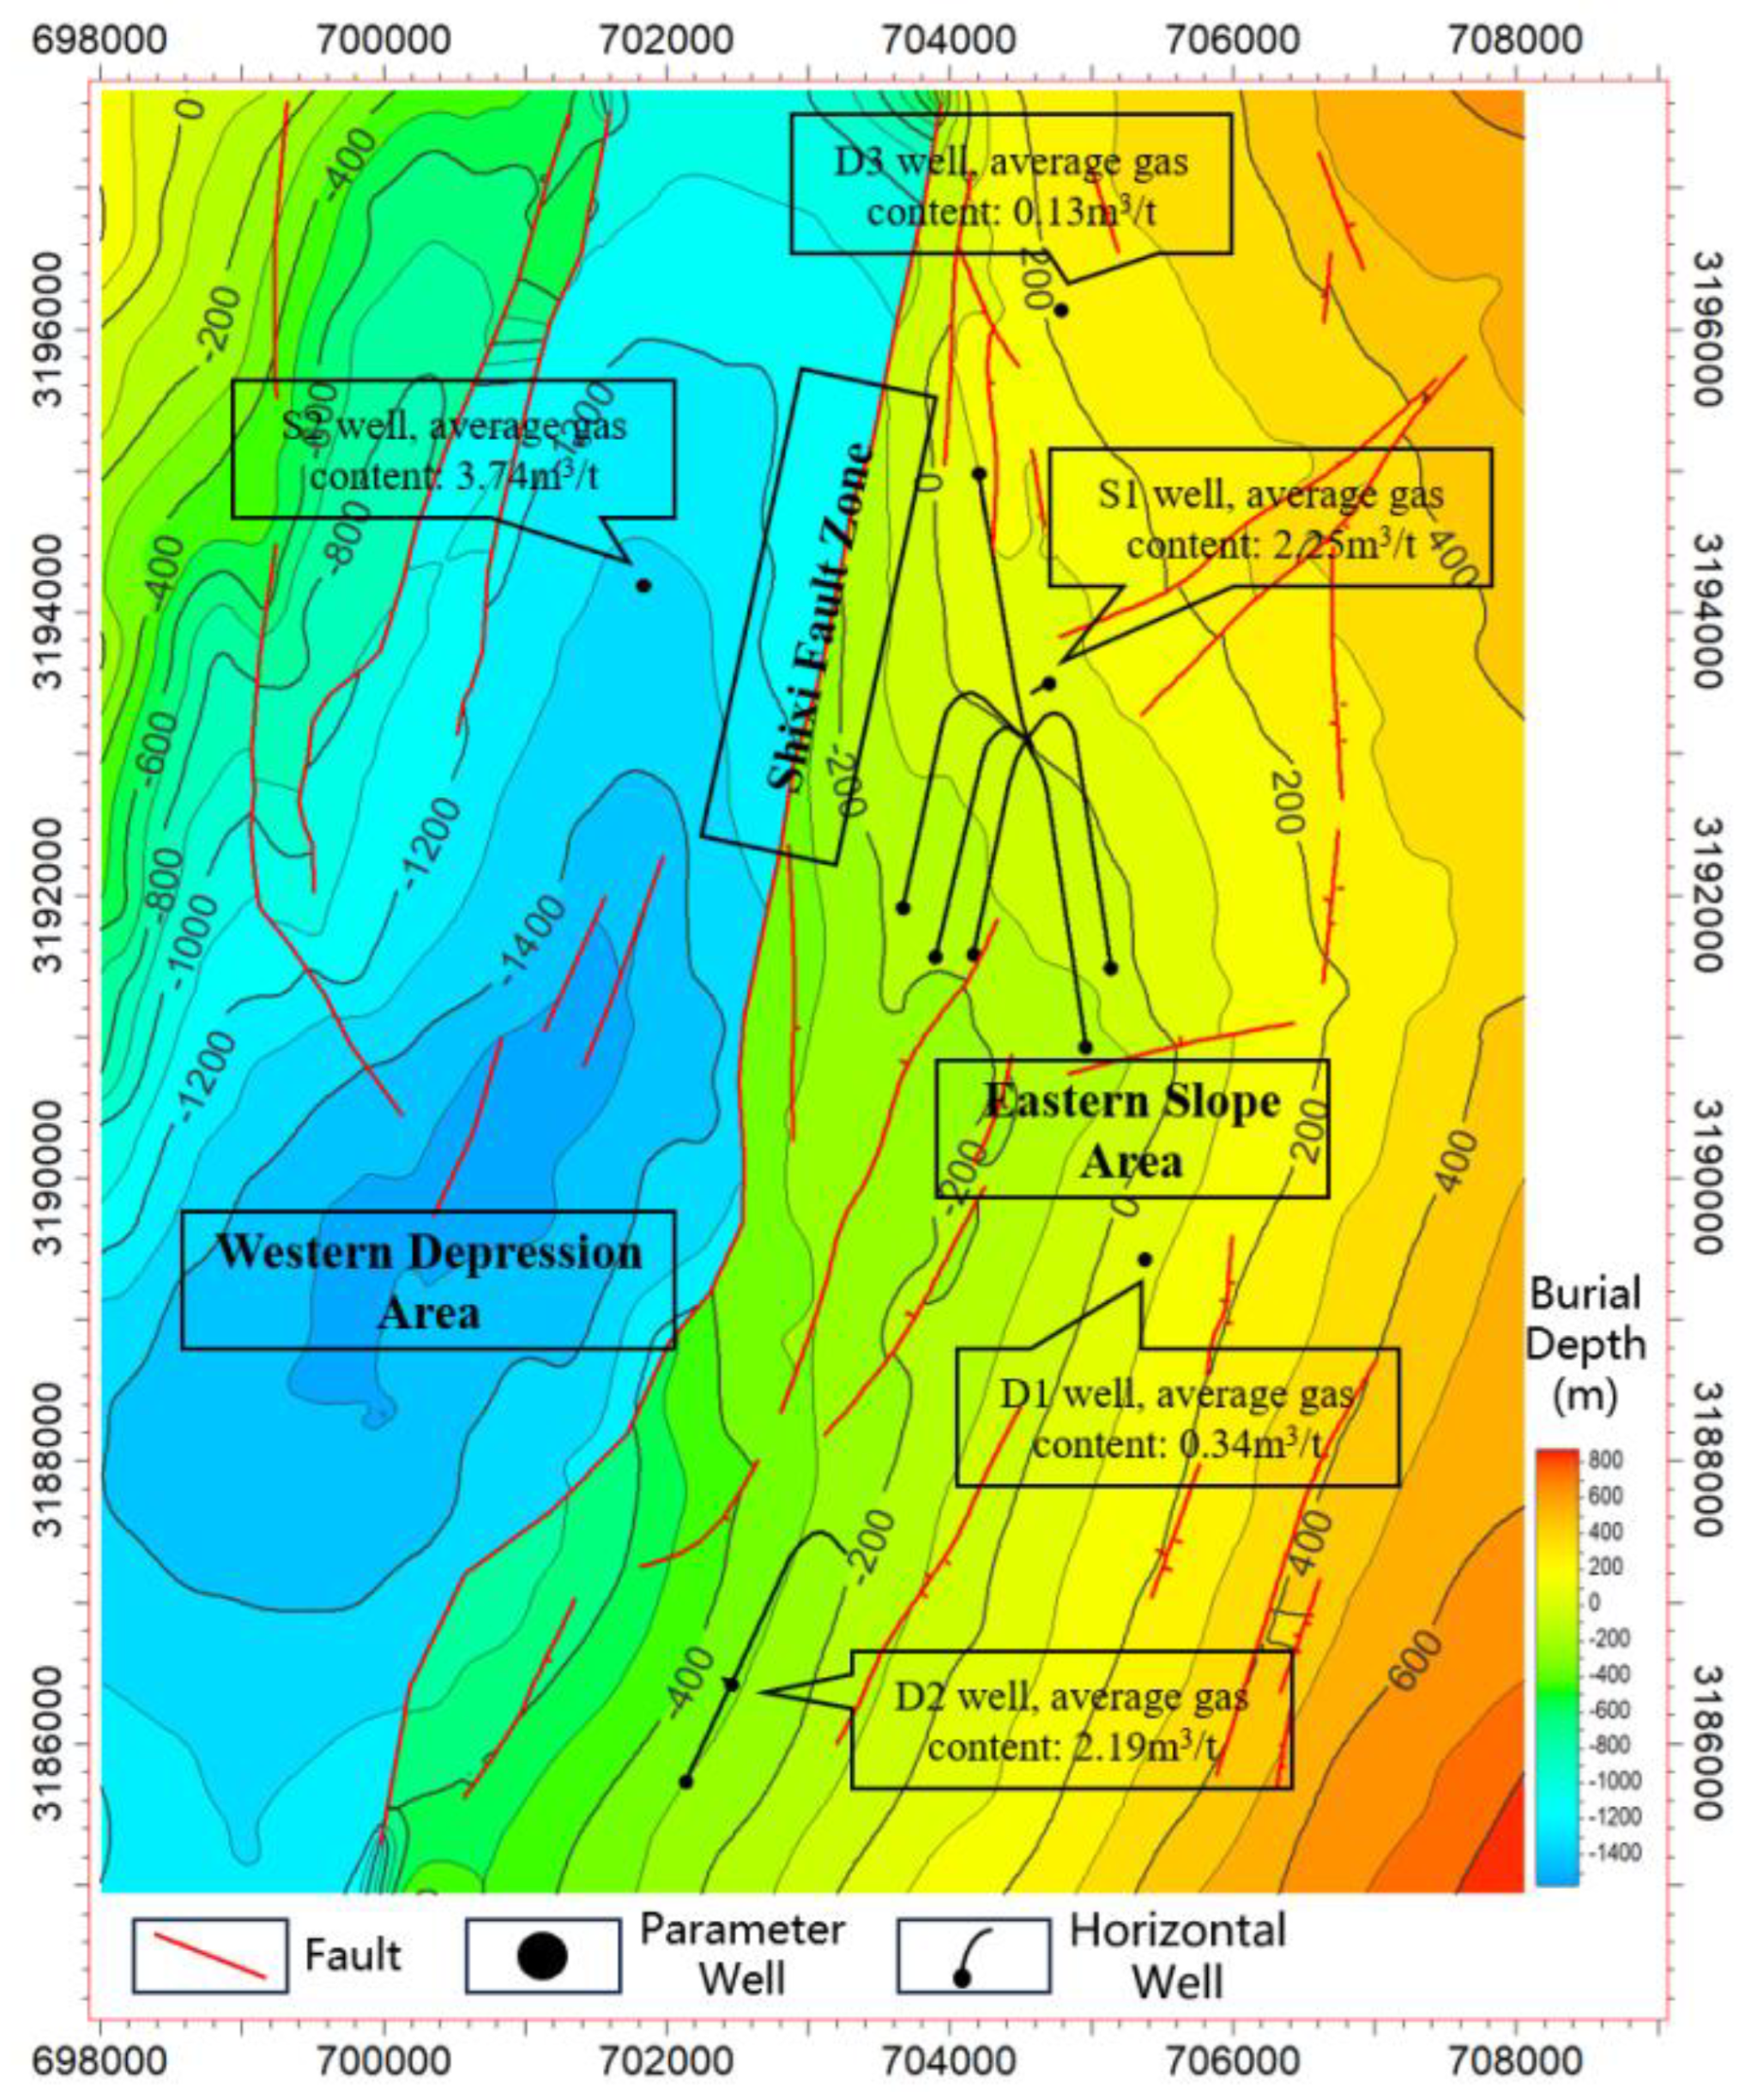
Drilling results confirm that the Wufeng formation–Longmaxi formation shale in the Shixi area has a relatively good hydrocarbon generation basis and reservoir capacity. However, the region has experienced multi-stage tectonic superposition and reworking, including Caledonian, Hercynian, Indosinian, Yanshanian, and Himalayan movements. Therefore, the preservation condition becomes complicated, and the gas content shows a large difference among drilled wells. This is clearly reflected by the inter-well gas content comparison, where some wells exhibit a higher gas content but some wells are obviously poorer. Such strong heterogeneity suggests that, for shallow shale gas, “good shale” is not enough, and “good sealing and stable structure” are more important.
Faults are the most direct geological factor destroying vertical sealing. When a fault cuts through the regional caprock or connects the shale to high-permeability strata, it creates an open pathway. This acts as a leakage channel for free gas and enhances diffusion, leading to a decrease in gas contents. The influence degree is related to fault sealing property and the damage intensity, and is commonly controlled by fault density, fault spacing, and distance to large-scale faults. In practical work, the fractured damage zone becomes wider when the fault throw becomes larger, so even a limited number of faults can still generate local unfavorable belts. Based on the current seismic interpretation, the overall faulting in the Shixi block appears to be relatively minor, and most faults are small-scale. A previously supposed larger Class III fault is considered to not exist, based on field investigations, shallow drilling information from coal mines, and forward modeling consistency. Even so, in the corresponding location there is a steep belt with relatively developed fractures, which still may weaken preservation locally. For the Class IV faults, only some higher sub-classes have limited influence range, while the smaller ones are not significant for preservation.
In assessing fault sealing capacity, two fundamental geomechanical assumptions were made: (1) Vertical Sealing: Small-to-medium-scale faults (Class III and IV) are assumed to pose a high leakage risk if their vertical throw exceeds the thickness of the immediate caprock (Longmaxi Member 2), potentially creating open pathways for gas escape. (2) Lateral Sealing: Large-scale regional faults are interpreted as structural boundaries that facilitate compartmentalization. Their sealing capacity is assumed to be controlled by the effective normal stress acting on the fault plane. Higher normal stress in the synclinal core promotes fault closure, which enhances gas retention within specific structural compartments.
Uplift and denudation also damage preservation, because erosion can break the continuity of shale interval, roof, or overburden. Under a stable condition, shale gas mainly migrates along bedding by diffusion and seepage. If the target interval is exposed or partly missing, gas can more easily migrate along the layer toward the outcrop or missing zone, and the shallower burial depth near the erosion boundary generally leads to higher permeability and stronger diffusion, so the preservation becomes worse. Exploration experience suggests that within about 2 km from the outcrop of the target interval, the preservation condition tends to be damaged. In the Shixi syncline, the east wing is relatively gentle and farther from the erosion boundary in general; thus, the preservation is relatively better.
The dip angle and effective normal stress on bedding planes are also key. Laboratory and test data indicate that the permeability along the bedding is commonly 2 to 8 times the vertical permeability. When no large faults or high-angle open fractures exist, gas leakage is dominated by bedding-parallel pathways. The closure degree of bedding-related fractures depends on the normal stress acting on bedding planes, which is mainly controlled by burial depth and dip angle. Higher normal stress can close the lamination fractures, increase adsorption dominance, and reduce free-gas mobility, so it is beneficial to preservation. Field-based understanding also indicates that when the bedding-plane normal stress is higher than about 15 MPa, the horizontal lamination fractures may close rapidly and permeability decreases sharply; then, sealing becomes much better. This point provides a semi-quantitative criterion for evaluating gentle structure with sufficient cover.
The dip angle further affects buoyancy and lateral sealing requirement. With a larger dip angle, the gas column height tends to increase, buoyancy becomes larger, and the updip component of buoyancy along the bedding also increases. This will require better roof sealing and stronger lateral sealing in the updip direction; otherwise, gas can continue to migrate and leak. Therefore, a gentle dip structure is more favorable for gas accumulation and long-term preservation, which is consistent with many shale gas cases in South China.
Our finding that the preservation condition is the primary controlling factor for gas accumulation in the Shixi block is consistent with the study by [
32,
33] in northern Guizhou. They demonstrated that in normal-pressure systems, the integrity of the ‘source–seal’ coupling is more critical for high yields than reservoir quality alone, as tectonic reworking can easily lead to gas dissipation despite a high TOC content.
5.2. Seismic-Based Evaluation Method and Delineation of Favorable Zones
In this work, post-stack seismic data were used for fine structural interpretation, and the preservation evaluation was carried out by integrating structure, faults, burial depth, dip angle, formation pressure coefficient, and paleogeomorphology. For horizontal well planning, the basic selection principle is to prefer areas with a relatively gentle surface and subsurface structure, a burial depth generally within 500 m to 3500 m, a dip angle of about 0° to 30°, and with a distance of more than 200 m from medium-scale faults, while the seismic signal-to-noise ratio should be sufficient to support well trajectory design.
The formation pressure coefficient threshold of >1.0 was derived from the statistical distribution of tested production rates from 24 regional wells. Our analysis shows that 85% of high-yield wells in the Shixi and adjacent Zheng’an blocks are located in zones with a pressure coefficient above 1.0. Furthermore, the burial depth threshold of >700 m was established by analyzing the crossplot of gas content versus depth, which revealed a clear ‘tipping point’ where gas saturation drops by more than 40% when depth is less than 700 m due to erosion-related leakage. These thresholds represent the statistical ‘critical points’ validated by cross-regional data.
The structural pattern of Shixi is overall a syncline with depression and slope elements. The western depression part is relatively simple and gentle, and the preservation condition is better than the slope part (
Figure 15). From dip angle mapping, the strata are generally gentle, mainly less than 20°, and only near the main structural belt and in the southwest area does the dip angle increase. These structural characteristics are interpreted as providing a favorable geological background for shale gas preservation.
The burial depth is another necessary condition for shallow normal-pressure shale gas. The depth of the Wufeng base is mainly distributed from 500 m to 2500 m in the block, which is generally favorable for both preservation and development. A northwest-trending shallow strip in the northeast, with a depth of less than 500 m due to river downcutting, is considered as a preservation-risk area (
Figure 16). Although the whole area is relatively shallow, drilling practice in Shixi demonstrates that when the Wufeng base depth is larger than about 700 m, the gas content in several wells can be higher than 1 cubic meter per ton, which supports that shallow shale gas still has exploration potential if preservation is not damaged.
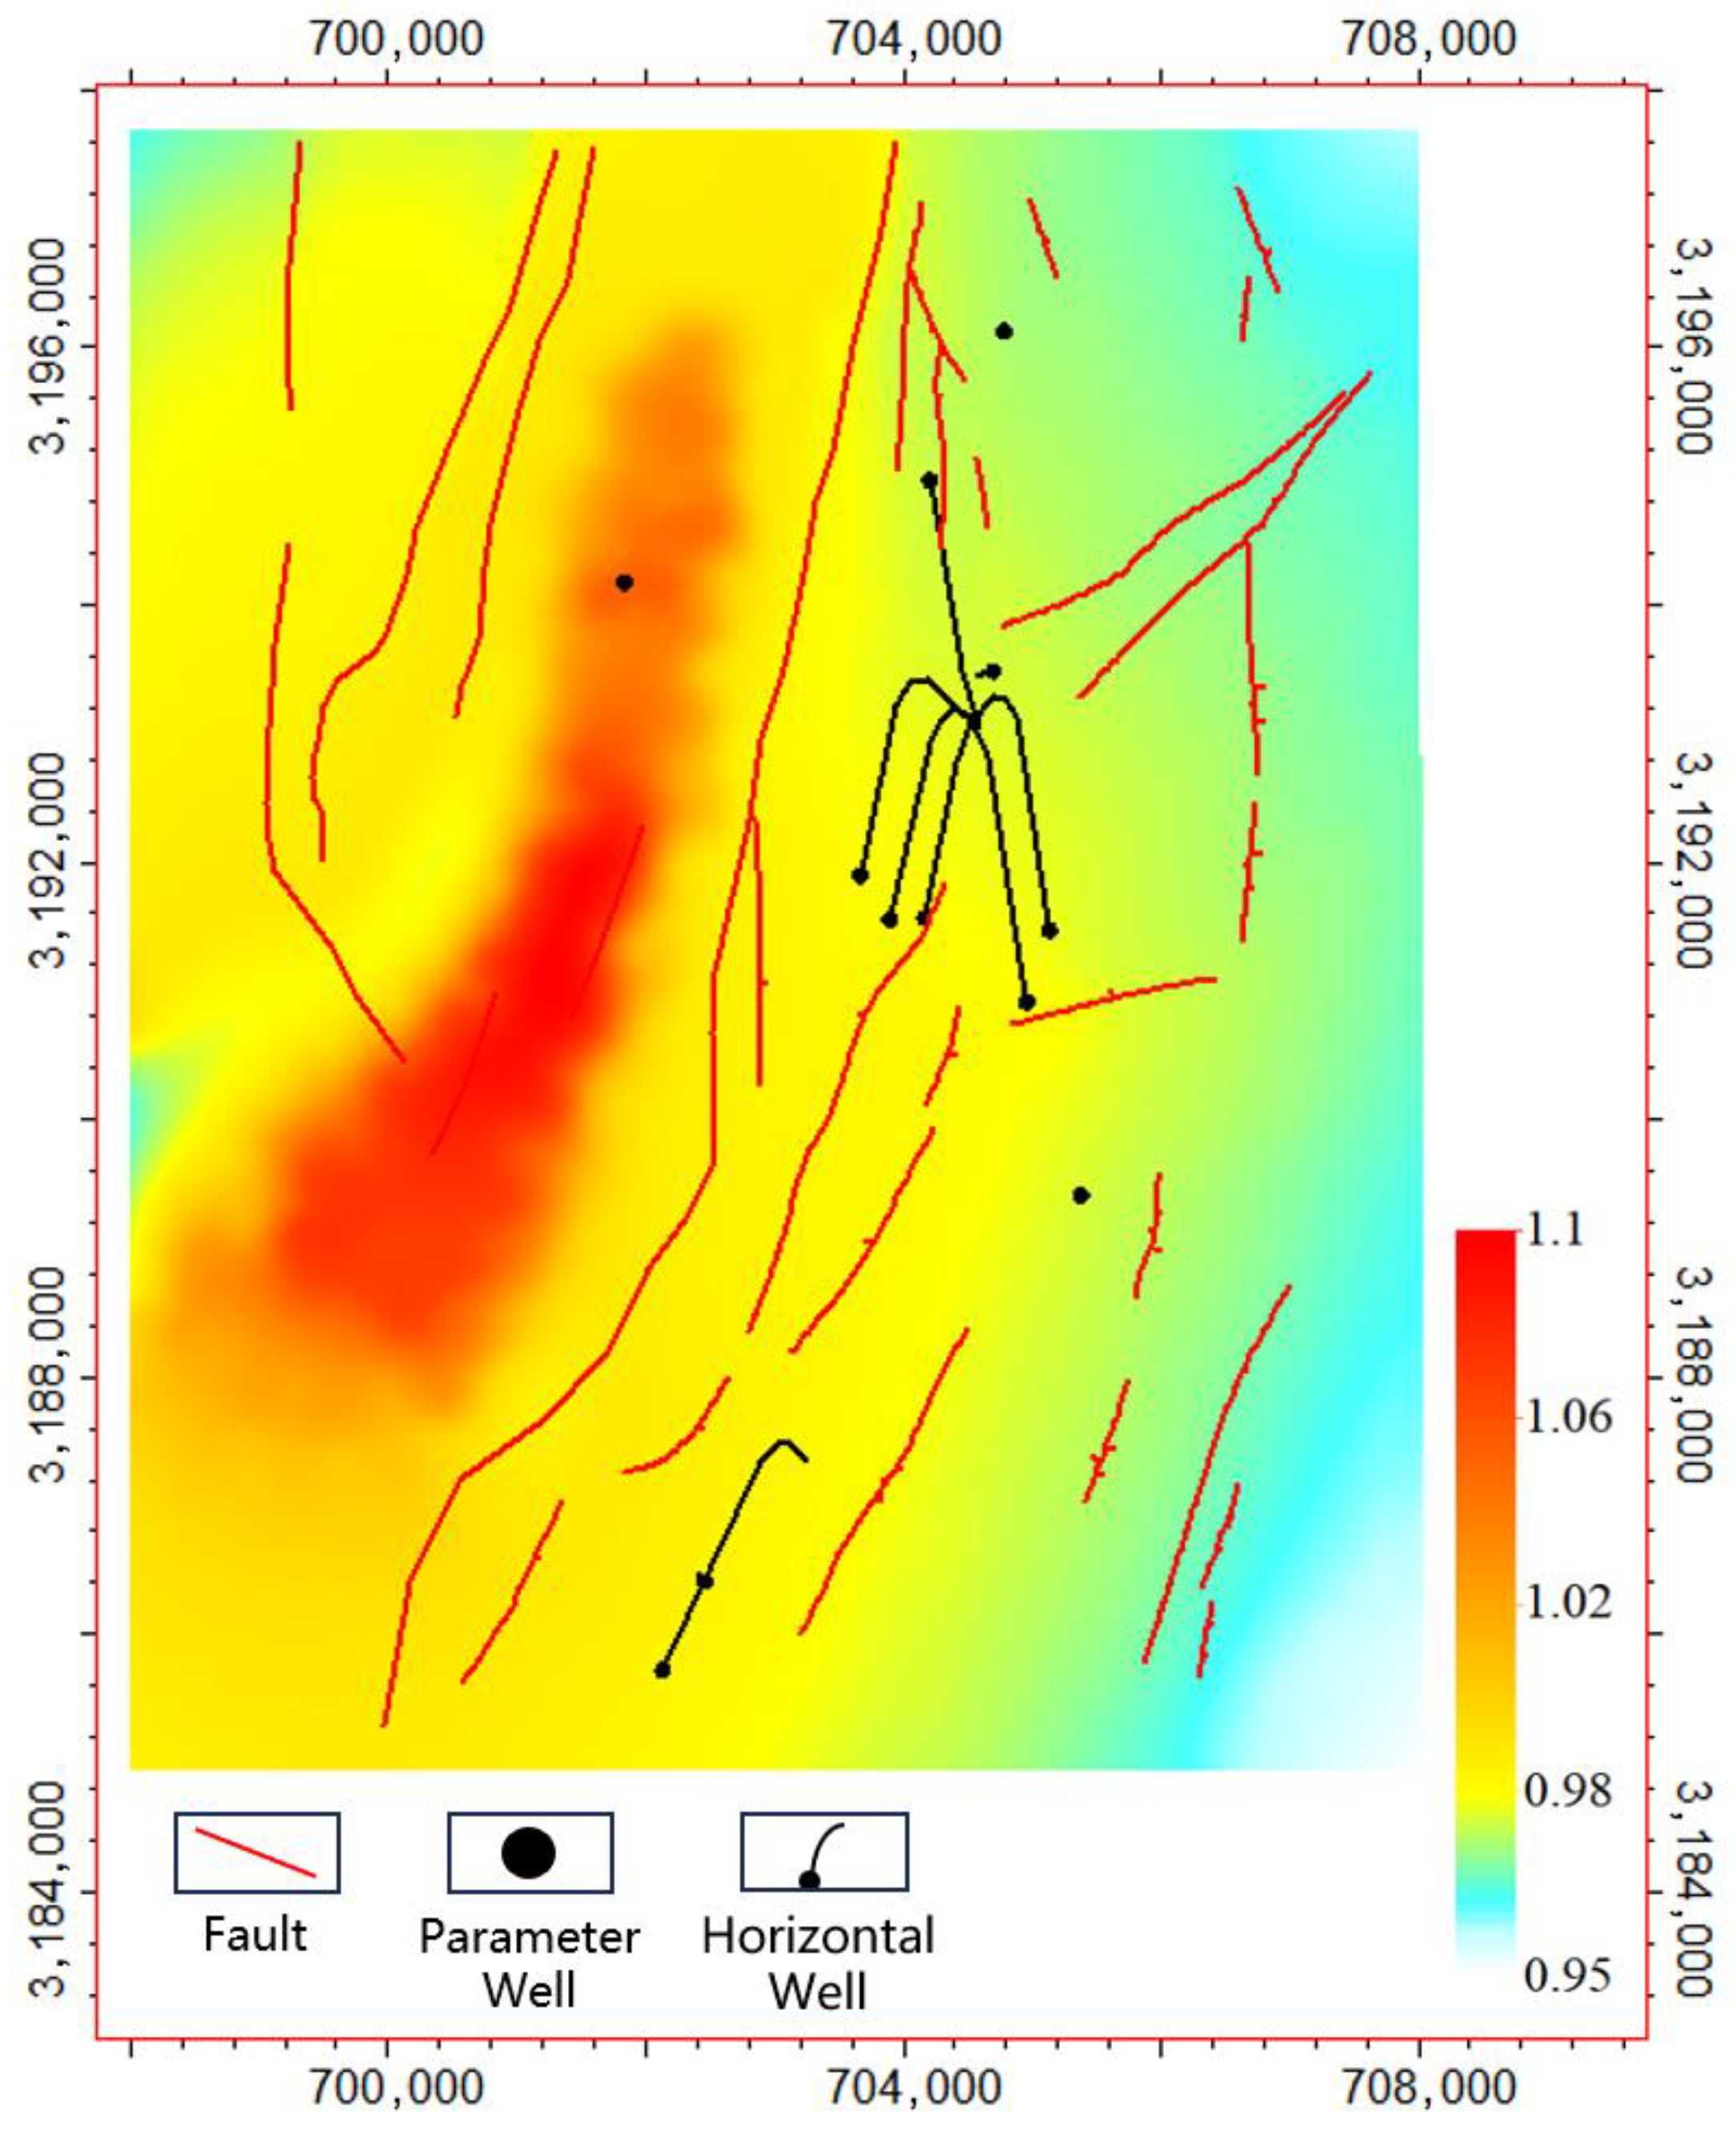
The formation pressure coefficient is a direct response to sealing and gas retention. The pressure coefficient in Shixi is approximately 0.95 to 1.10. The depression zone tends to have a higher pressure coefficient, while the two wings of the syncline show lower values. Especially in the eastern and southern parts where the overburden is thinner, when the pressure coefficient is lower than about 0.98, drilled wells usually have a gas content lower than 1 cubic meter per ton. In contrast, the syncline core and western area have a thicker overburden and a relatively high pressure coefficient (
Figure 17). This relation suggests that, in the shallow normal-pressure setting, a minor reduction in the pressure coefficient could potentially signify a loss of preservation integrity.
Paleogeomorphology provides critical insights into the spatial variation in preservation conditions. In the Shixi block, the relationship between paleo-topography and modern preservation is coupled through tectonic evolution. While paleo-structural highs were conducive to the enrichment of organic matter, subsequent tectonic inversion and differential subsidence resulted in these favorable facies being preserved at relatively greater modern burial depths with thicker overburden in certain synclinal compartments. This increased burial depth enhances the bedding-plane normal stress, which promotes the closure of horizontal lamination fractures and reduces permeability, thereby creating a more favorable environment for gas retention. This observation aligns with the ‘effective stress controlling bedding closure’ mechanism mentioned above.
The quantitative thresholds used for preservation classification were determined based on a combination of physical principles and statistical regression of local drilling results from 24 regional wells. Specifically, the burial depth threshold of >700 m was established by analyzing the crossplot of gas content versus depth, which revealed a clear ‘tipping point’ where gas saturation drops by more than 40% when depth is less than 700 m due to erosion-related leakage. The formation pressure coefficient threshold of >1.0 was derived from the statistical distribution of tested production rates, showing that 85% of high-yield wells in the Shixi and adjacent Zheng’an blocks are located in zones with a pressure coefficient above 1.0. These thresholds represent the statistical ‘critical points’ validated by cross-regional data.
The robustness of these thresholds was further validated through sensitivity analysis and comparison with independent datasets from the neighboring Zheng’an and Wulong shale gas fields. By ranking the impact of various geological factors on the tested gas production of 24 regional wells, we identified that the pressure coefficient and burial depth are the most sensitive parameters for gas retention in normally pressured settings. The established thresholds (e.g., pressure coefficient > 1.0 and depth > 700 m) represent the ‘critical tipping points’ observed in these analog fields, where gas content typically drops sharply below these values. This cross-regional statistical consistency, supported by sensitivity testing, ensures that the classification scheme is not only case-specific but also applicable to other similar normally pressured shale gas systems in the region.
Based on the above understandings, a multi-parameter preservation classification was established in practice. In general, the most favorable class corresponds to a depression-type gentle structure: only small Class IV faults with lower influence, a dip angle of less than about 20°, and a pressure coefficient higher than 1.00, together with a burial depth larger than about 700 m. The medium favorable class allows for a slightly larger dip and a slightly lower pressure coefficient, but still avoids higher-class faults. The unfavorable class is characterized by complex structures with more influential faults, a dip angle of around or above 25°, and a pressure coefficient lower than about 0.98, which is commonly associated with low gas contents in drilling. Using these criteria, three favorable preservation zones were delineated in the Shixi exploration area, providing guidance for shallow shale gas deployment.
6. Integrated Geology–Engineering Evaluation of Favorable Shale Gas Zones
Following the workflow summarized in
Figure 4, the final stage of this study integrates reservoir quality, engineering fracability, preservation condition, and structural–geomorphic constraints to rank favorable shale-gas zones in the Shixi block.
6.1. Integrated Prediction of Reservoir Quality and Engineering Fracability
For shale gas enrichment and high productivity, the gas content is the direct material basis, and it is also strongly related to organic matter and the pore system. Based on the core experimental analysis in the Shixi area and the reservoir classification schemes of nearby normal-pressure shale gas blocks, a geological classification criterion is established mainly using TOC, gas content, porosity and gas saturation. In general, a Type I reservoir is defined by a TOC of no less than 4 percent, a gas content of no less than 2.5 m
3 per ton, porosity of no less than 4 percent, and gas saturation of no less than 60 percent. Type II reservoirs correspond to a TOC of 2 to 4 percent, a gas content of 1.5 to 2.5 m
3 per ton, a porosity of 2 to 4 percent, and gas saturation of 40 to 60 percent, while Type III is lower than these thresholds. These classification criteria are established based on the reservoir evaluation standards for normal-pressure shale gas in the Sichuan Basin and its periphery, with reference to previous studies on similar marine shale plays [
1].
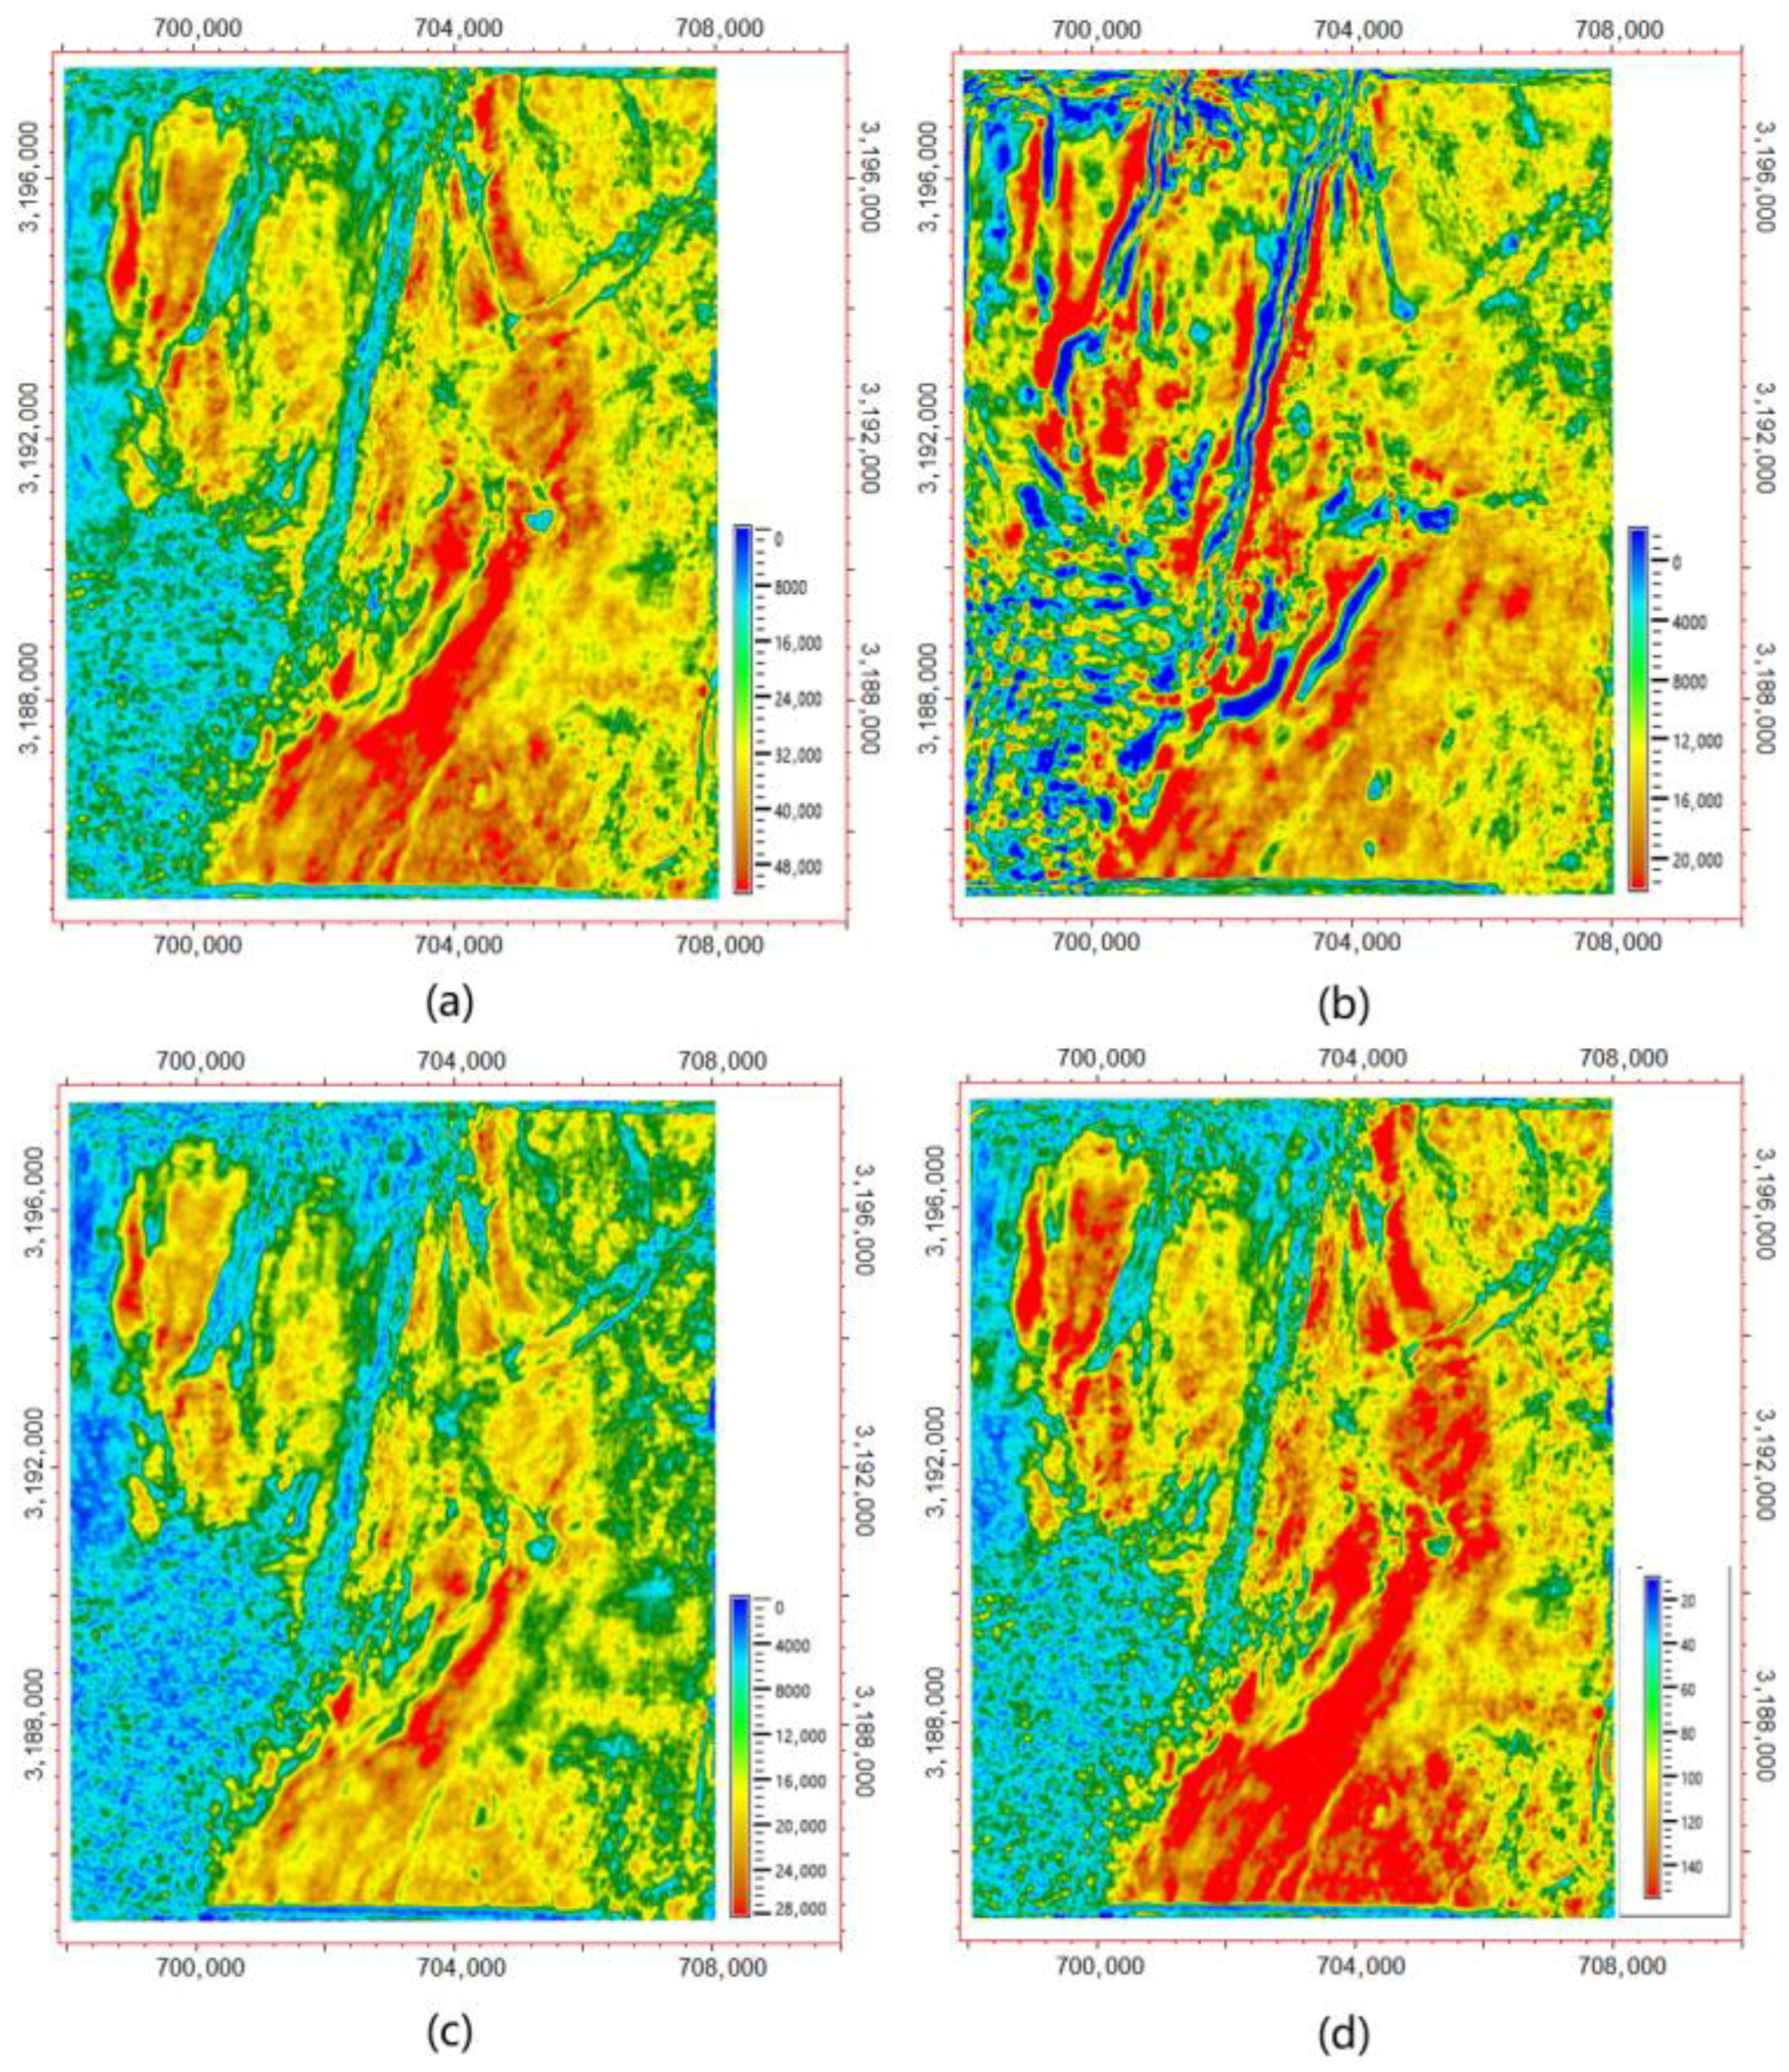
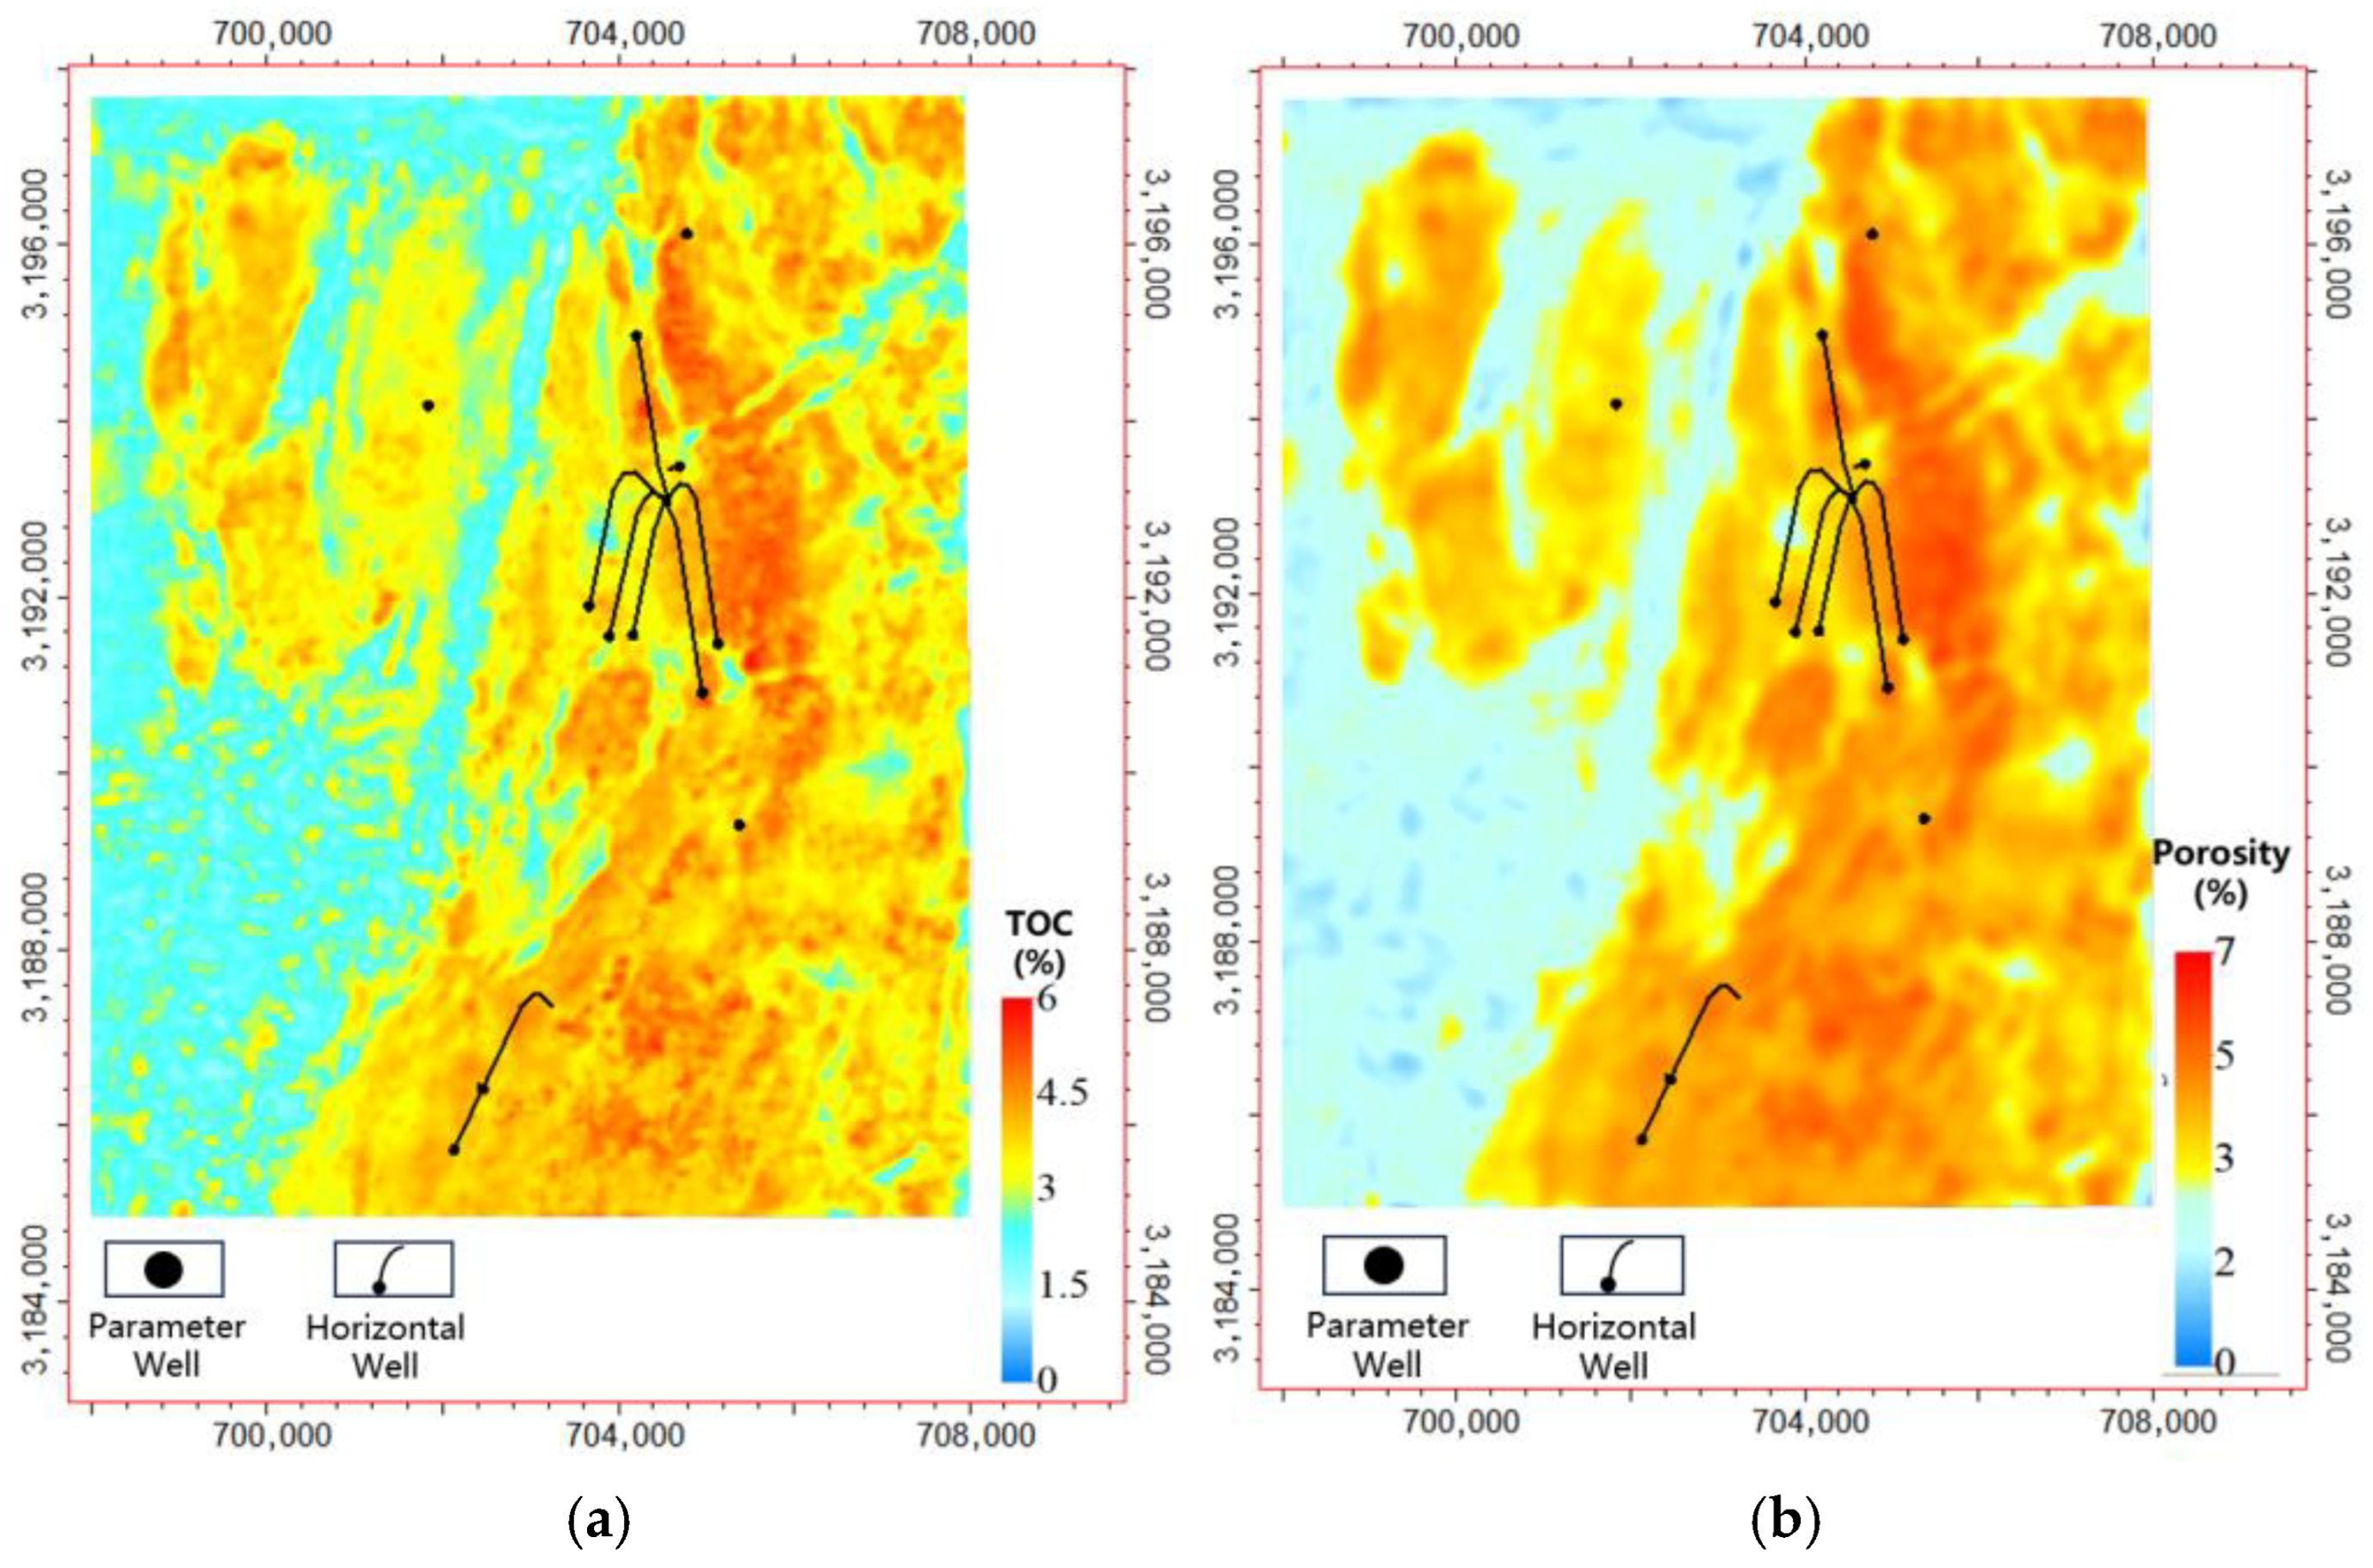
TOC prediction was performed by converting seismic inversion results using the relatively good empirical relationship between TOC and P-wave impedance. The predicted TOC varies from about 2.23 to 5.5 percent, and the mean value is generally 3 to 4 percent. The planar distribution of TOC is basically consistent with the impedance inversion trend, showing an overall stable pattern in the block, but TOC becomes lower in the central strata broken zone. In the southwest part, the predicted TOC is also relatively low, and it is mainly affected by poorer seismic data quality. These features can be clearly observed in
Figure 18a.
Porosity prediction was carried out based on the relationship between porosity and VP over VS. The predicted porosity in the study interval is about 1.5 to 7.0 percent. Higher-porosity zones occur in the northwest and southeast parts of the block, locally reaching above 4.5 percent. Similar to TOC, porosity is reduced in the central fractured or broken zone, and the southwest part still shows lower values influenced by seismic quality. This coincidental finding implies that the local structural disruption, data disruption and data uncertainty may potentially limit the reliability of reservoir parameter prediction. It should be noted that the correlations between elastic parameters and reservoir characteristics are most reliable near the calibration wells. Spatially, these relationships may drift due to facies changes or seismic quality variations. For the purpose of prospective area evaluation and ranking, the relative spatial trends are considered highly reliable as they are cross-validated by both seismic attributes and structural reasoning. While absolute quantitative accuracy may require further refinement with additional drilling data, these trends provide a defensible basis for the current three-level classification and horizontal well deployment.
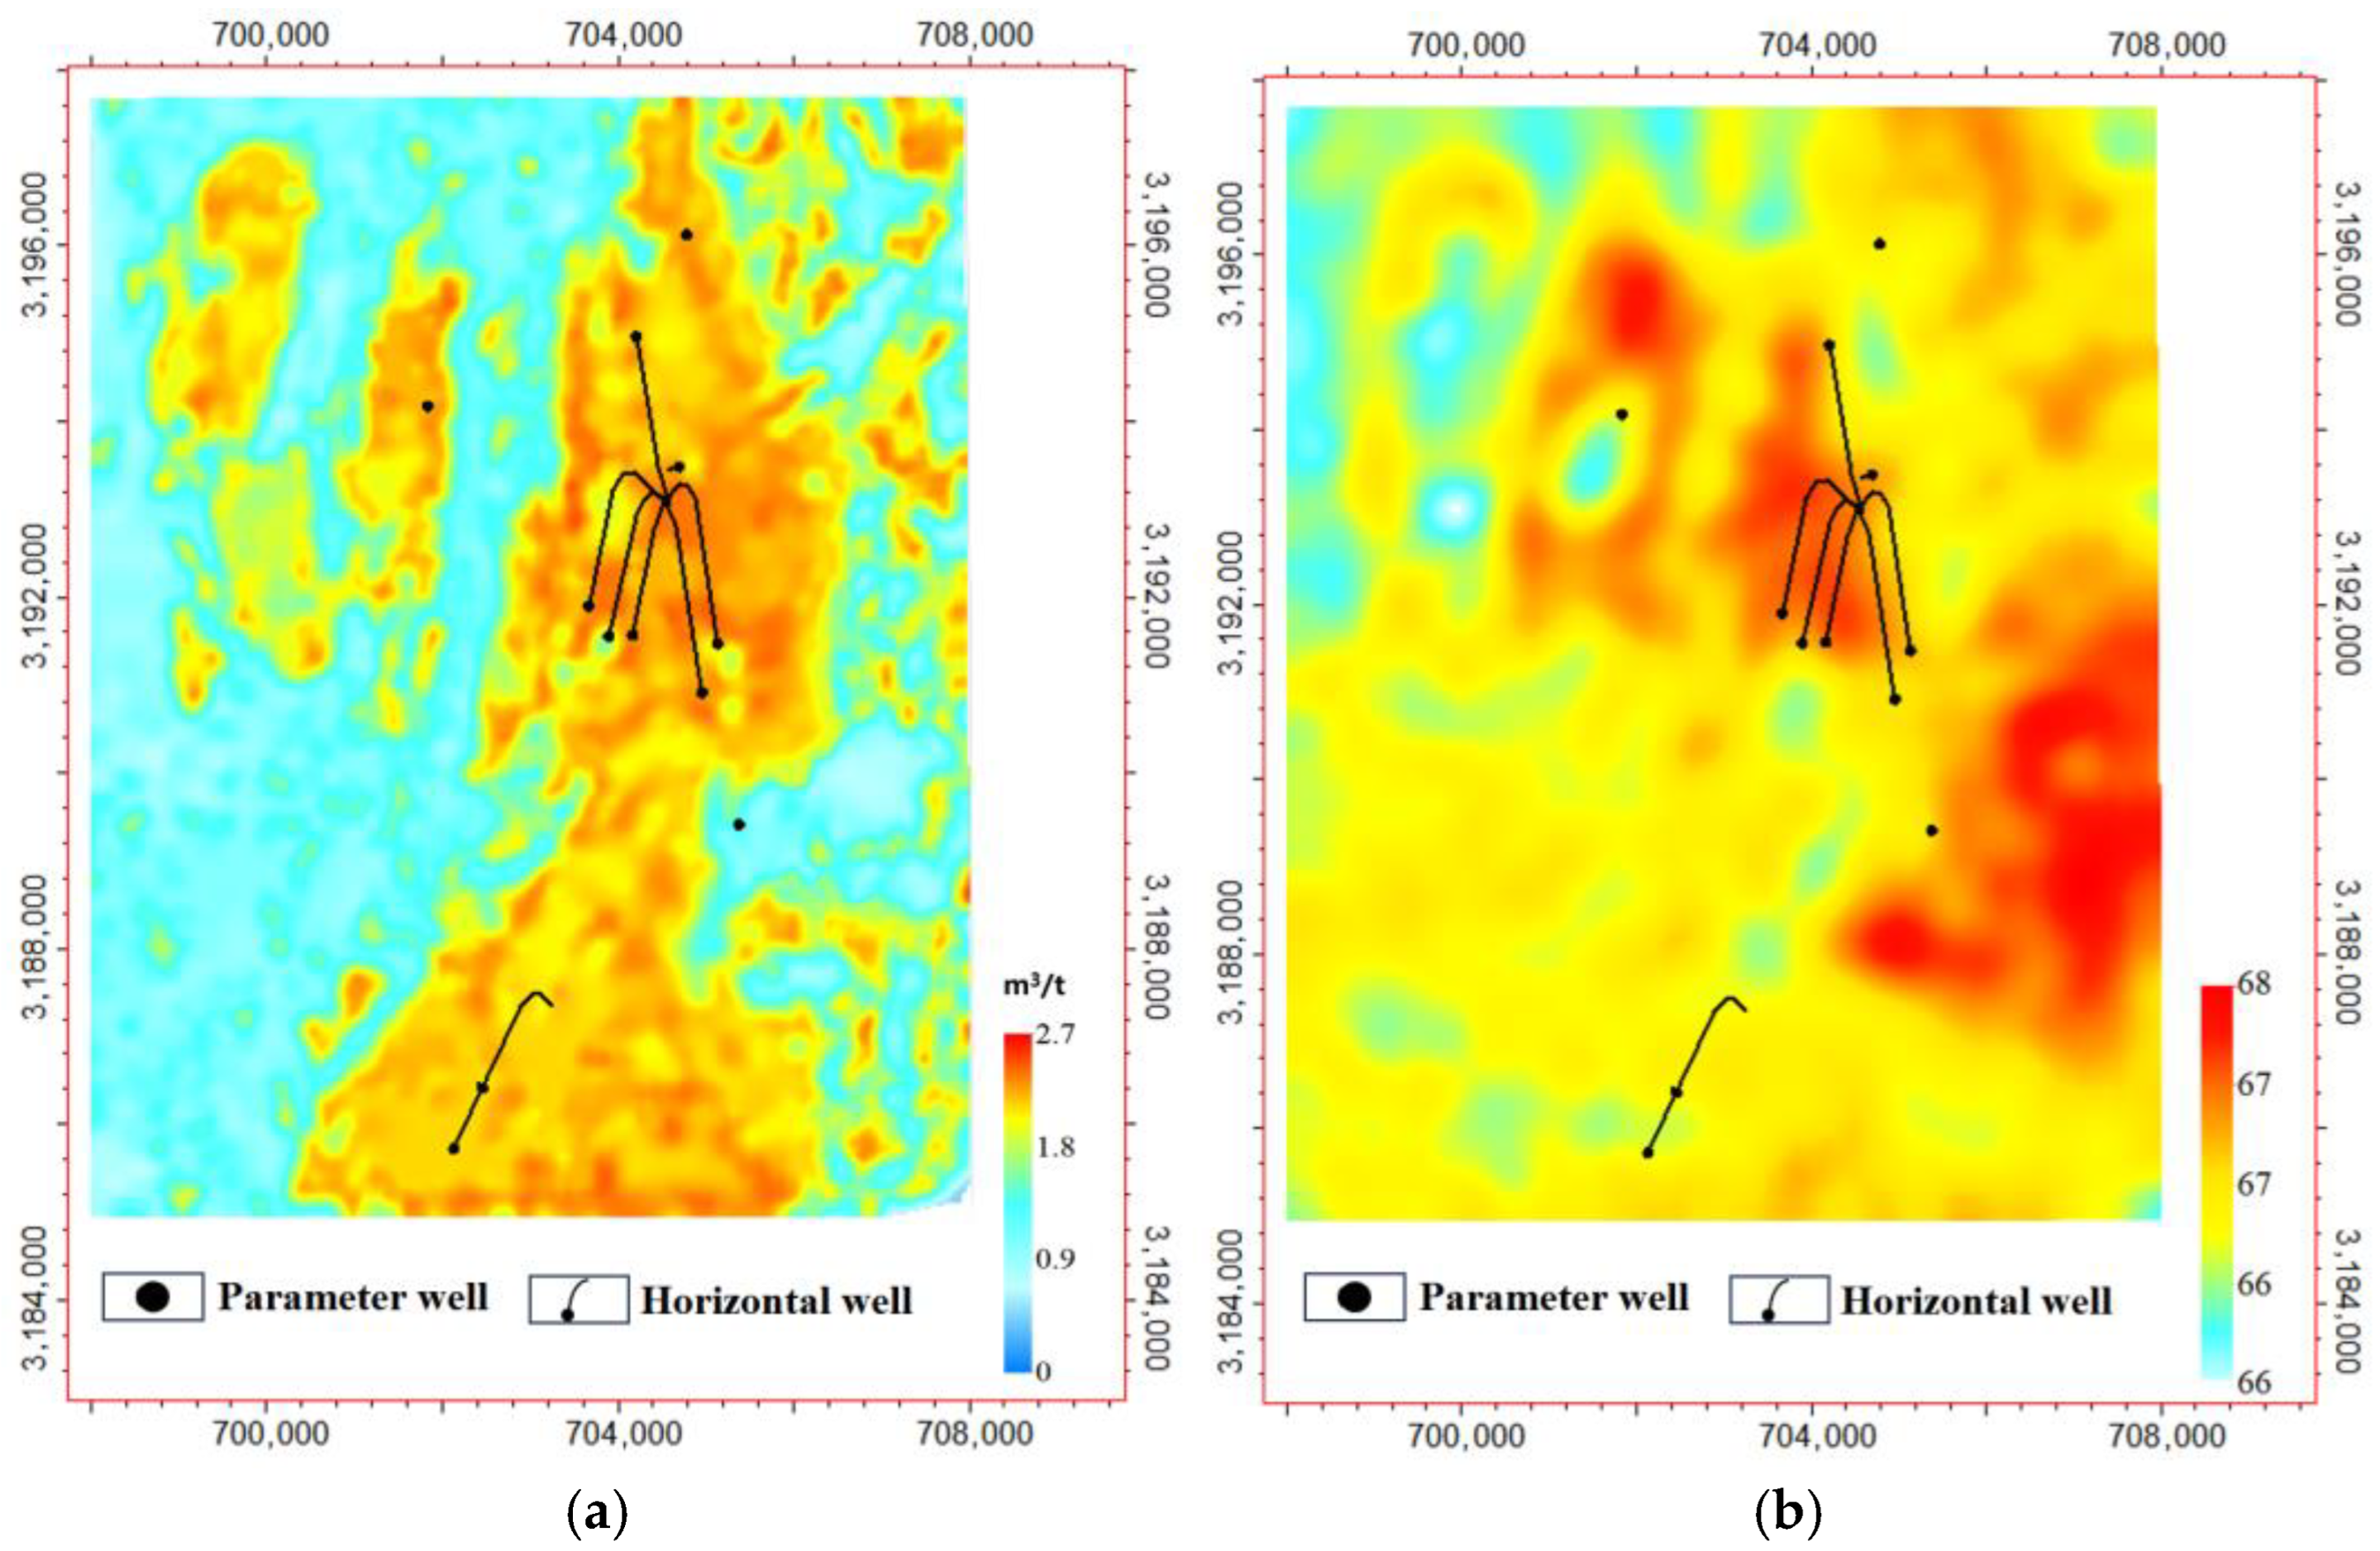
The gas content was also derived from impedance-based inversion and parameter conversion. The predicted gas content ranges approximately from 0.8 to 3.0 m
3 per ton, and the average is commonly 2 to 3 m
3 per ton. A low gas content is mainly distributed in the central broken zone and the southwest area with a low seismic signal-to-noise ratio (
Figure 19a). From the integrated view, the “low gas–low TOC–low porosity” area is a key unfavorable factor for sweet-spot screening.
Brittleness is a key engineering parameter for hydraulic fracturing. In this work, the brittleness index was calculated from the directly inverted Young’s modulus and Poisson’s ratio. The predicted brittleness index shows strong stability in the whole area, mainly around 66 to 68 percent (
Figure 19b). According to the practical production experience in Zheng’an and Shixi and with reference to [
35] the engineering fracability grading can be simplified as follows: a higher brittleness index, higher Young’s modulus, and lower Poisson’s ratio correspond to better compressibility. In Shixi, the brittleness level is generally favorable, so the main risk for engineering sweet spots more likely comes from stress conditions and local structural complexity rather than brittleness itself.
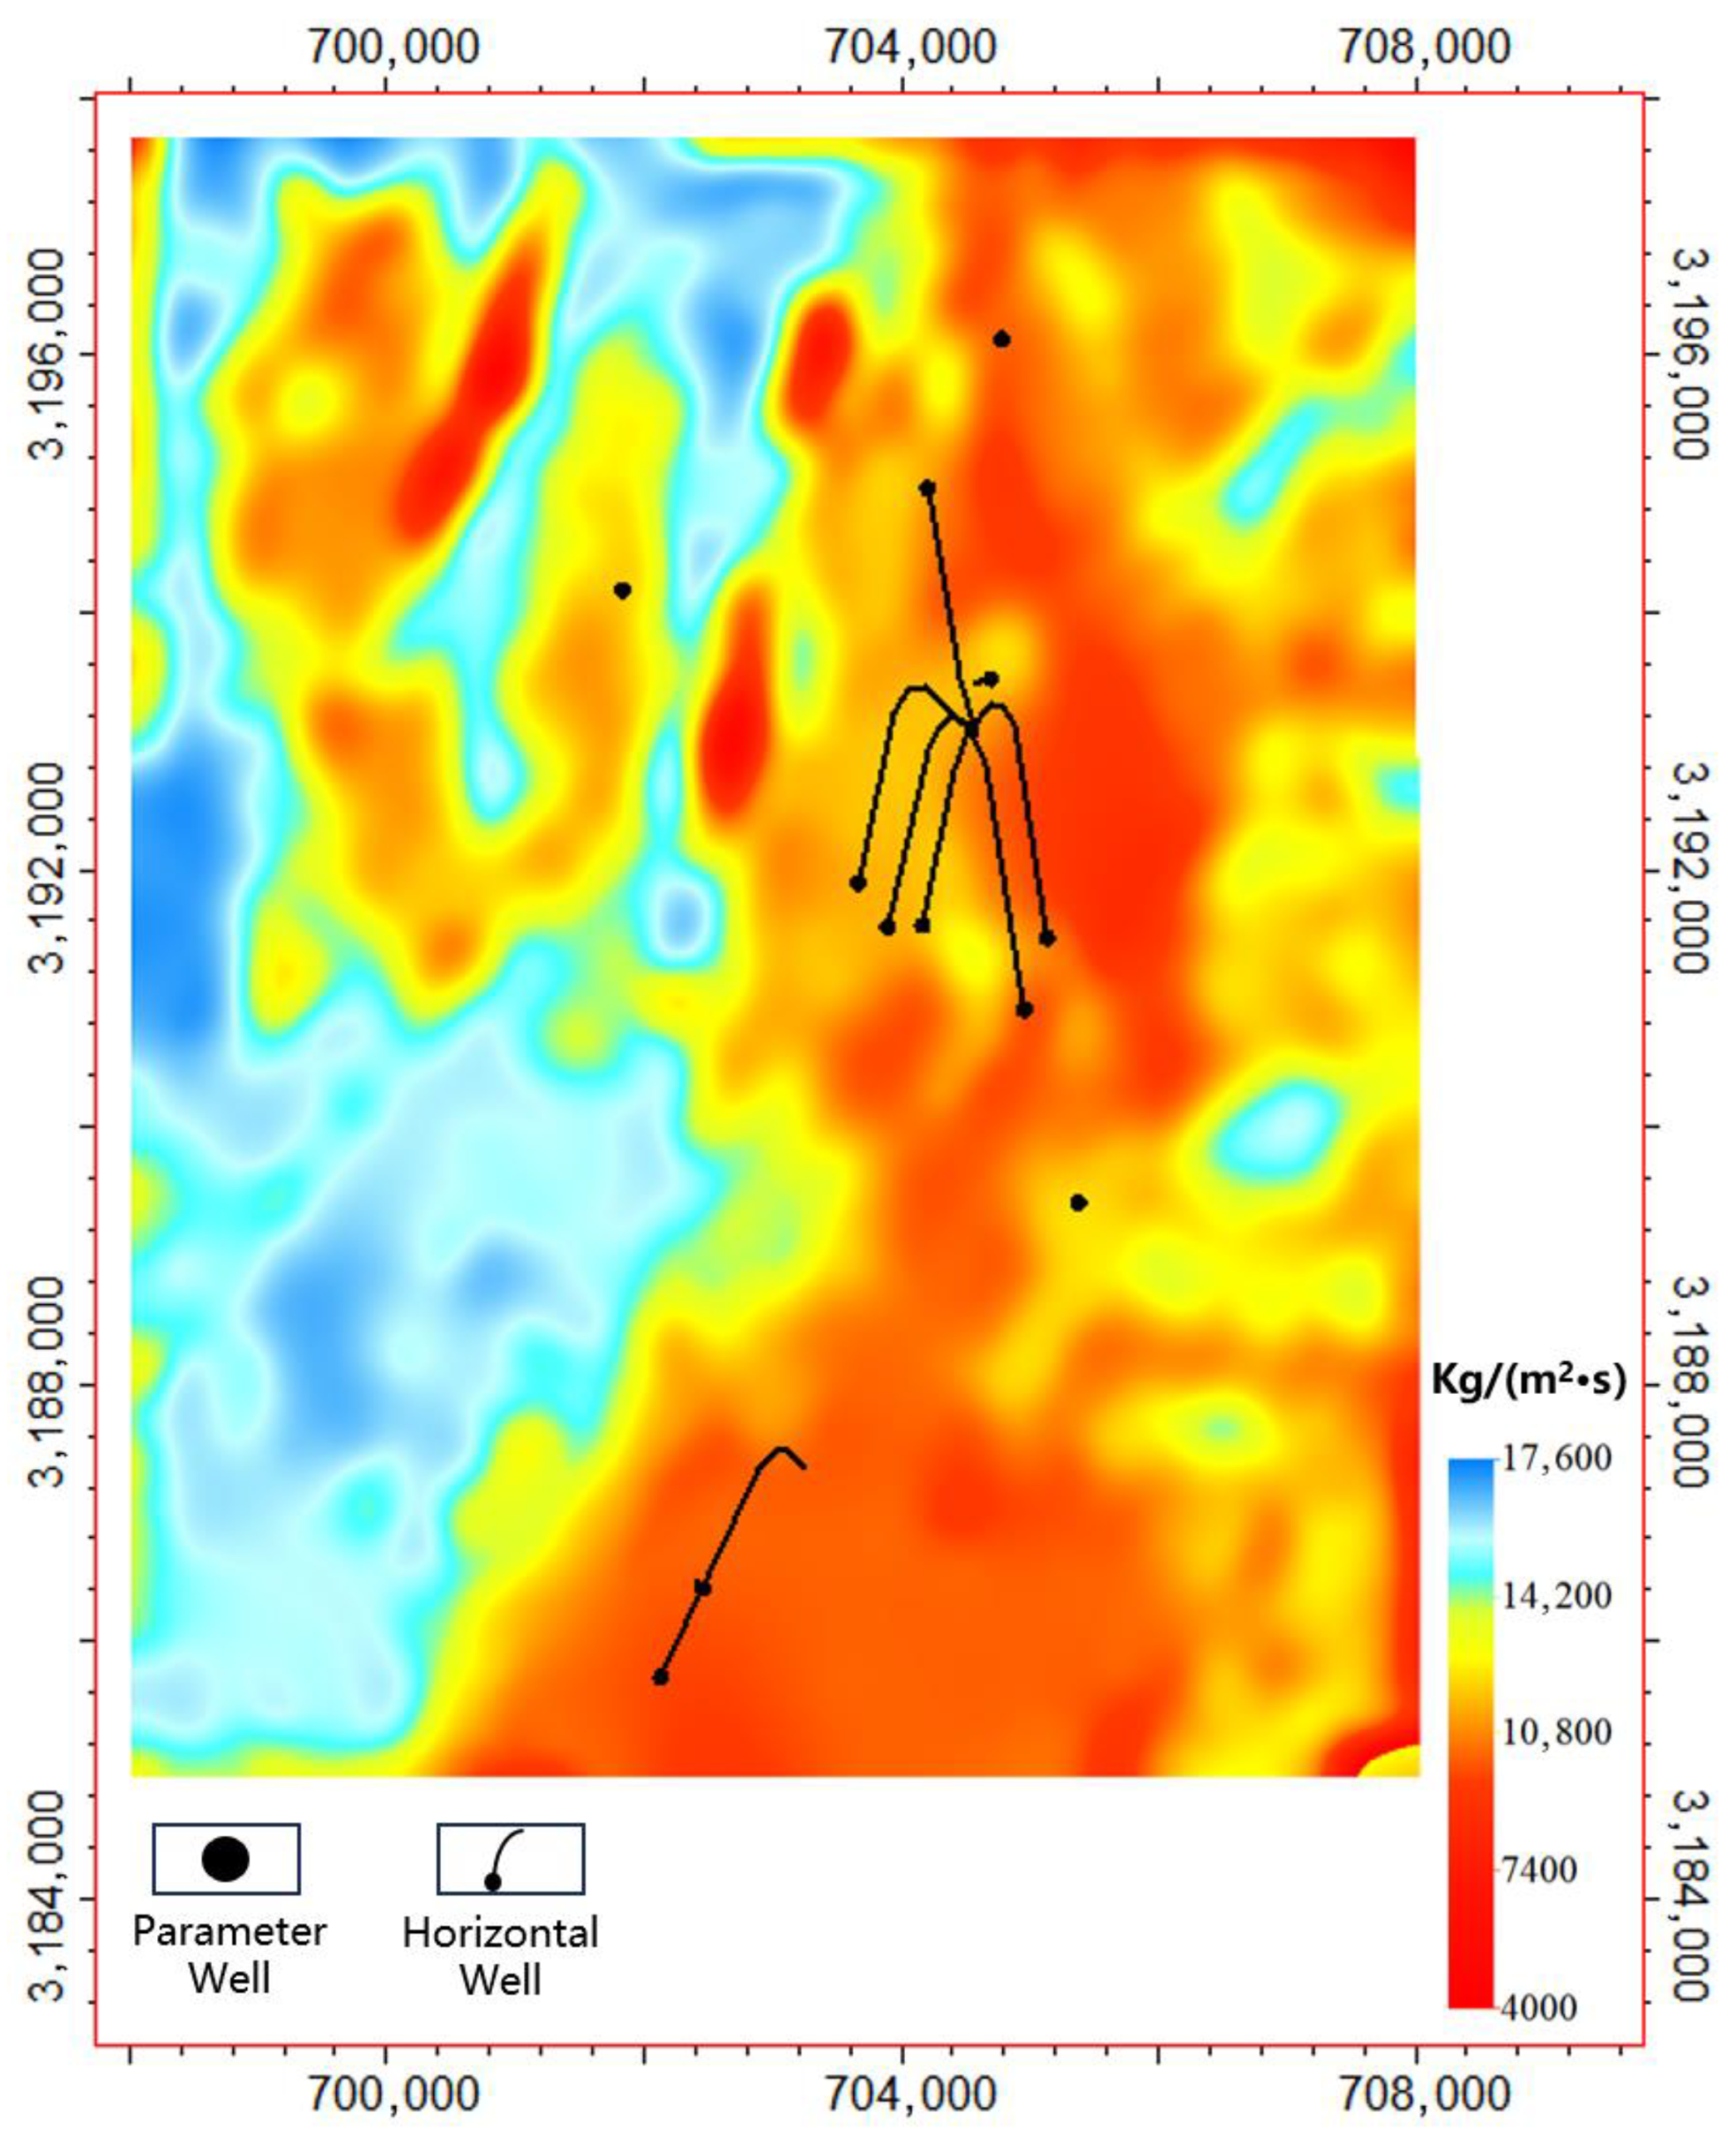
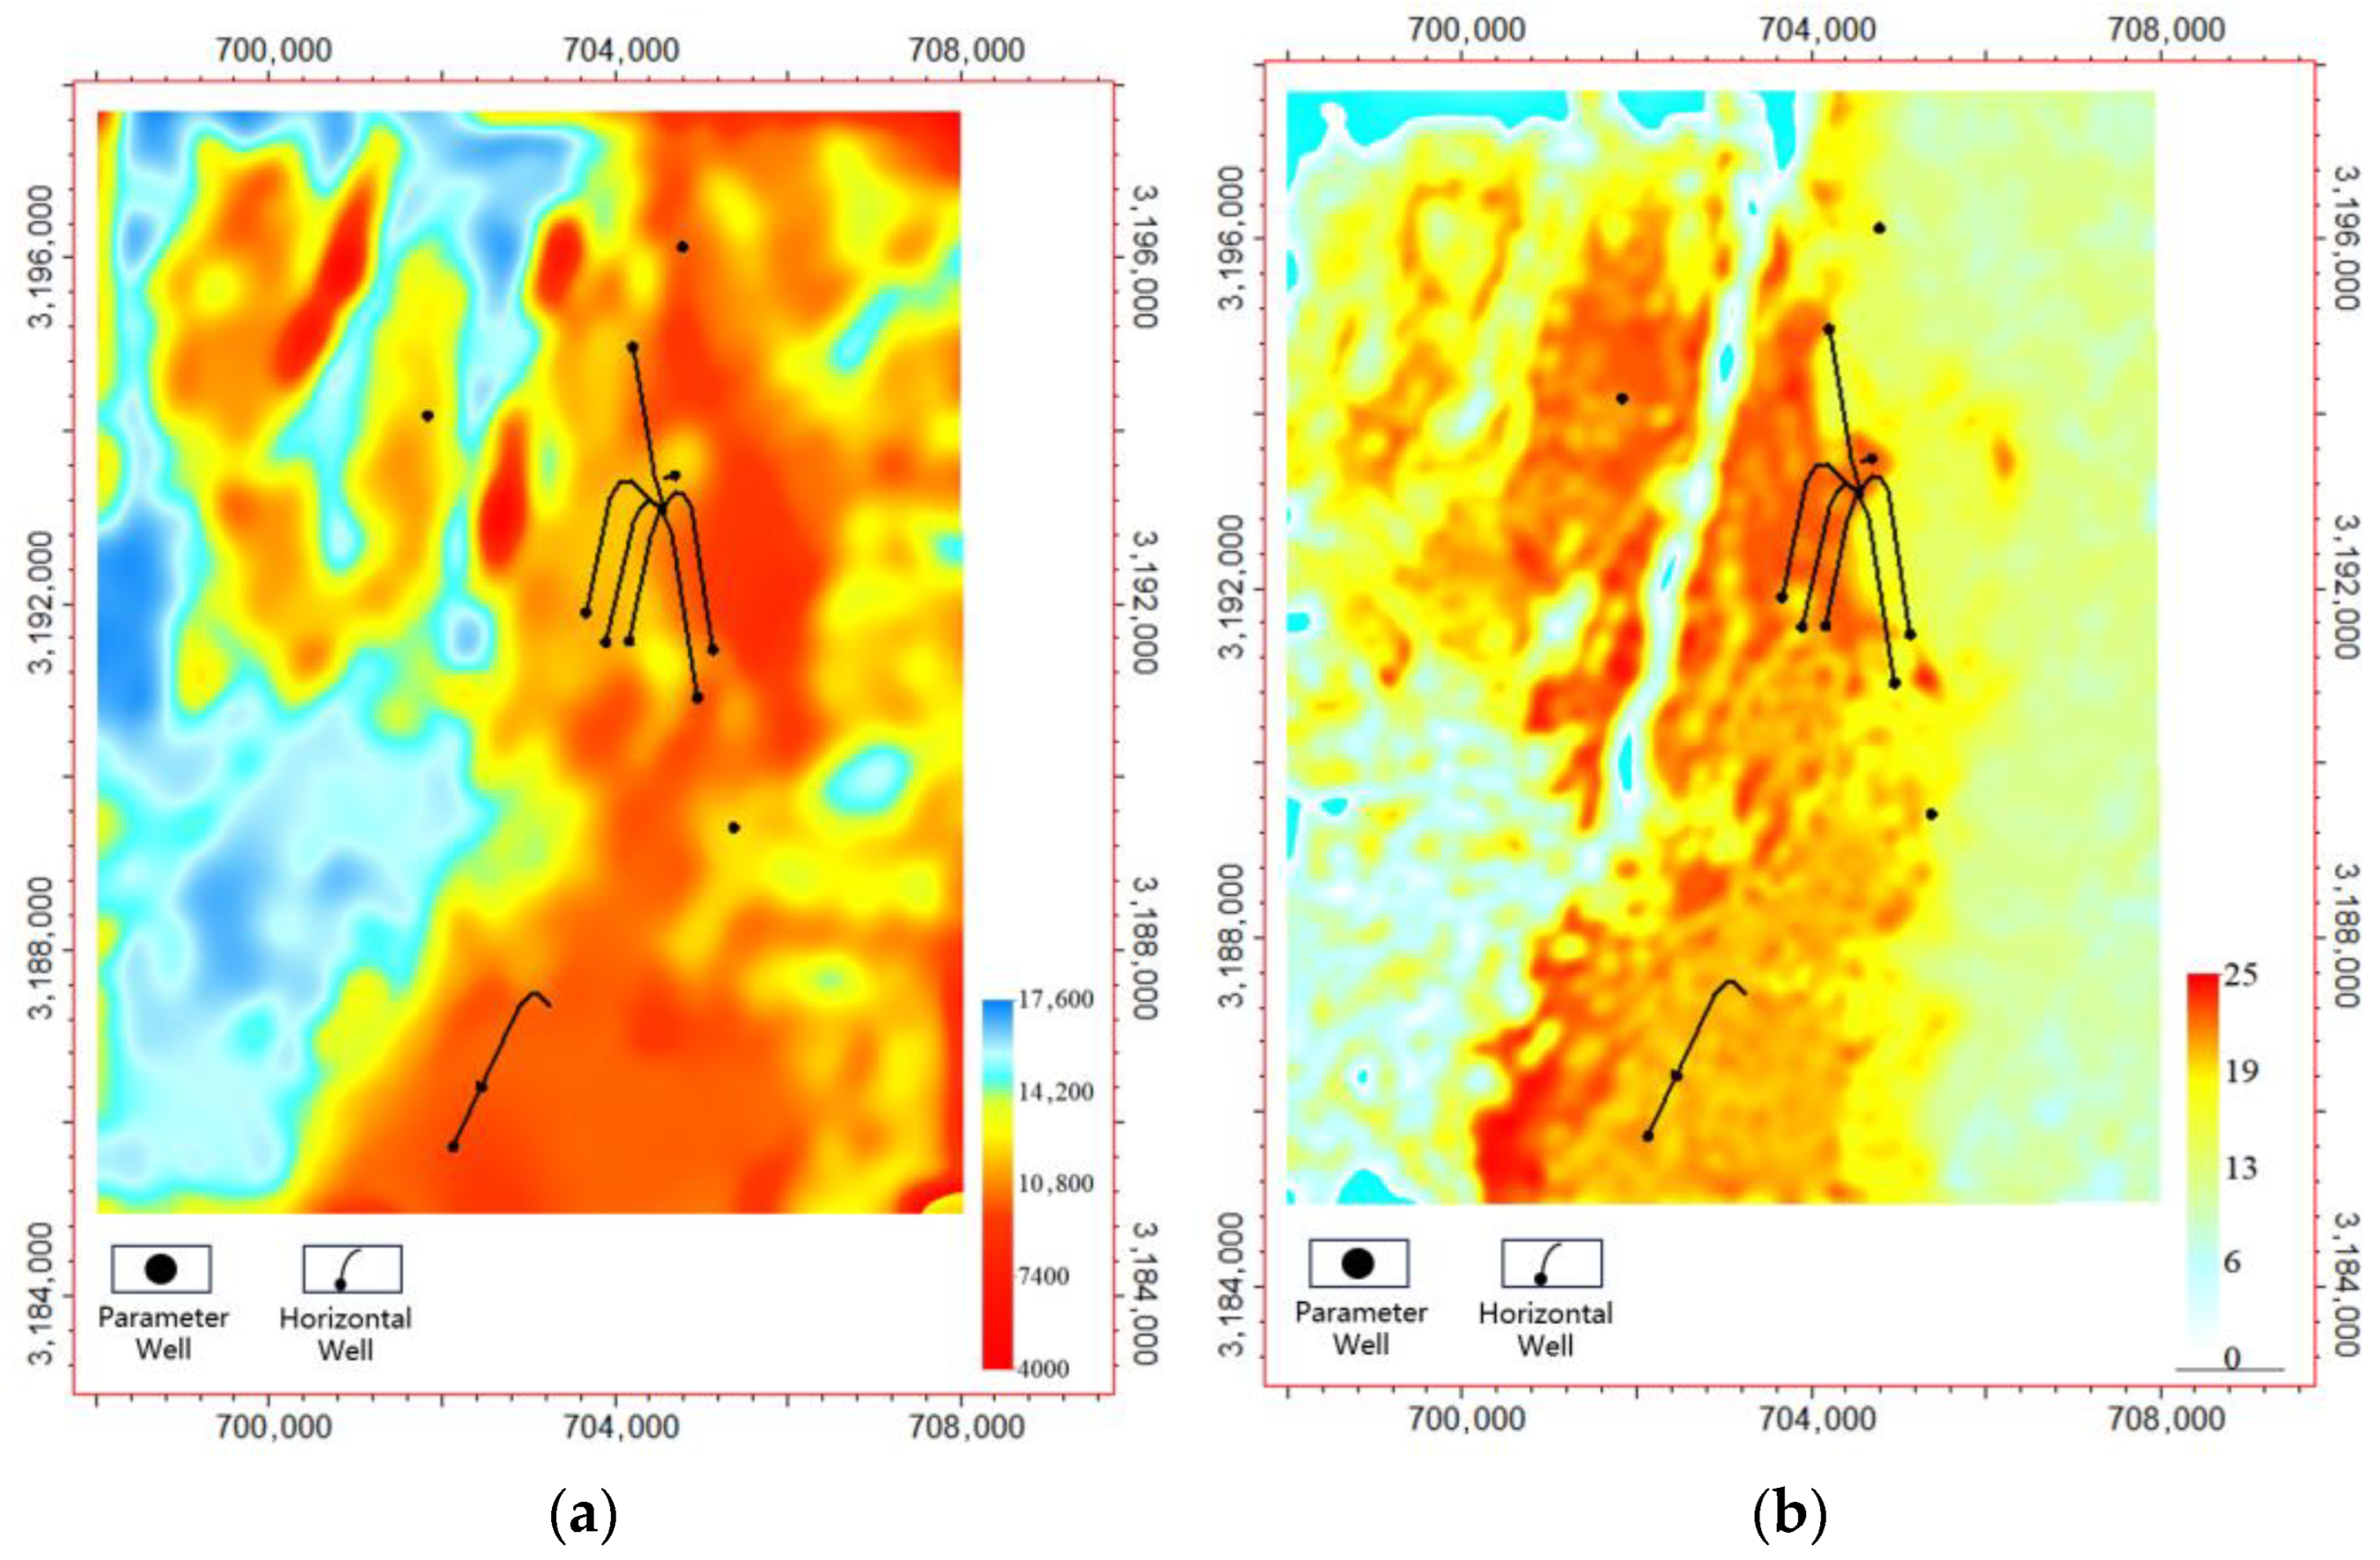
The sweet-spot thickness is another important parameter for both reserve estimation and well placement. Considering that shale reservoirs show relatively low P-wave impedance, the reservoir thickness was predicted from impedance inversion with an additional constraint of a TOC cutoff of 2 percent. The results indicate that the shale interval is widely distributed and relatively stable, with a total thickness of around 25 to 35 m in most areas (
Figure 20). The Type I sweet spot is interpreted to be primarily concentrated in the bottom part of the interval, where P-wave impedance is less than about 10,500 g/cm
3·m/s, and the thickness is about 15 m. However, because the gas-bearing property is laterally variable, the Type I sweet-spot thickness is not fully continuous, and uncertainty is higher near the central broken zone and the southwest area.
6.2. Shale Gas Accumulation Conditions and Reservoir Characteristics
Structurally, the Shixi area shows a syncline pattern with depression plus slope. The syncline axis is near the north–south direction. The core and the eastern limb are relatively gentle, while the western limb is steeper. The burial depth of the bottom boundary of the target shale interval in Wufeng formation-to-Longmaxi formation Member 1 varies from about 700 to 3920 m across the wider area, and in the main proposed block it is about 1500 to 2000 m, located on the eastern part of the syncline. This depth range is considered acceptable for normal-pressure shale gas exploration and development, and it also provides a certain preservation condition.
The target interval is mainly deposited in the deep-water shelf environment. In such a setting, high-carbon and high-silica shale facies are developed, and the thickness of high-quality shale is large and the distribution is stable. Based on the mineral composition and biological enrichment, the biogenic siliceous shale in Longmaxi layers 1 to 4 is considered as the most favorable lithofacies in the block.
Reservoir quality indicators show that the shale in Shixi has relatively good properties: the median Ro is about 2.25 percent, median TOC is about 3.47 percent, median total gas content is about 1.77 m3 per ton, median brittle mineral content is 70.6 percent, and median clay mineral content is 21.3 percent. The pore types include organic matter pores, intercrystalline pores within clay minerals, pyrite intercrystalline pores, and intergranular pores, indicating a diversified pore system. The reservoir is dominated by micro-to-meso pores, with median porosity of about 4.65 percent. Therefore, the reservoir can be summarized as having “high thermal evolution, high organic carbon, relatively high gas content, high brittle mineral content, and low clay mineral content”. Overall, the static geological parameters in the area satisfy the reserve calculation threshold.
For sealing conditions, drilling results indicate that the roof strata are mainly silt shale and mudstone of Longmaxi Member 2 and the Xintan formation, which are dense, thick and stable, providing good caprock. The floor strata are mainly limestone and calcareous shale of the Linxiang to Baota formation, and are also thick with a high breakthrough pressure, and no water indication was observed. This dense limestone floor is characterized by a high Young’s modulus and Poisson’s ratio, and it is favorable for sealing. The measured pressure coefficient in the block is about 1.0, indicating normal pressure. Under the syncline setting and relatively good roof–floor sealing, the preservation condition of shale gas is considered relatively good for a normal-pressure system.
The natural gas is interpreted as self-generated and self-stored oil-type dry gas, mainly from secondary cracking of retained oil. The gas composition is characterized by a high methane content, with levels of 91.05 to 97.15 percent and an average of about 94.95 percent; a low nitrogen content; and no H2S, which is different from the gas in the Lower Cambrian and Permian Maokou formation with H2S and higher N2. It is inferred that a carbon isotope reversal pattern may also exist in this block, similar to shale gas fields like Fuling and Zheng’an, reflecting a late-stage cracking origin of retained oil or bitumen.
From an evolutionary viewpoint, the maximum paleotemperature of the Longmaxi shale in northern Guizhou reached approximately 190 to 210 °C. This temperature range was beneficial for kerogen and early oil cracking, which generated large amounts of hydrocarbons. Later tectonic uplift in the Late Cretaceous caused a temperature decrease and hydrocarbon generation termination. Such evolution is consistent with the present over-mature stage and dry gas-dominated system.
The relationship between the pressure coefficient of ~1.0 and gas retention in Shixi aligns with the comparative analysis in [
34]. Their research indicated that while overpressured reservoirs (e.g., Fuling) rely on high formation energy, normal-pressure reservoirs in the Sichuan Basin margin require superior roof and floor sealing to maintain commercial gas saturation. This supports our conclusion that even under normal pressure, stable structural compartments can effectively preserve shale gas resources.
6.3. Multi-Parameter Favorable Zone Delineation and Resource Implication
Although the overall geological condition in Shixi is relatively good, the enrichment and producibility are still controlled by several factors. Based on the evaluation work and drilled well analysis, the main controlling factors include the burial depth, preservation condition, fault or fracture development degree, formation dip angle, and reservoir parameters such as porosity and gas-bearing property. In this study, a multi-parameter quantitative evaluation model was built by integrating geological sweet-spot parameters, engineering sweet-spot parameters, palaeogeomorphology and preservation indicators, with different weights assigned according to their influence degree. Typically, geological sweet spots focus on TOC, porosity and gas content; engineering sweet spots focus on brittleness and stress conditions; palaeogeomorphology considers high-quality shale thickness and depth; and preservation considers fault characteristics, distance to major faults, fault density, and formation dip.
To quantitatively differentiate the leakage risk of faults utilizing the advantages of structural compartmentalization, we incorporated the ‘distance-to-fault’ and ‘fault-scale’ as dynamic weighting factors in the evaluation model. Specifically, a negative buffer zone (typically 200–500 m) was assigned to medium-scale faults to represent the leakage-prone fractured damage zone. Conversely, large-scale faults were treated as compartment boundaries. Areas located in the stable interior of these compartments, characterized by gentle dips and a high burial depth, received higher scores for preservation. This dual-index approach ensures that the model penalizes proximity to potential leakage pathways while rewarding the structural stability provided by compartmentalization.
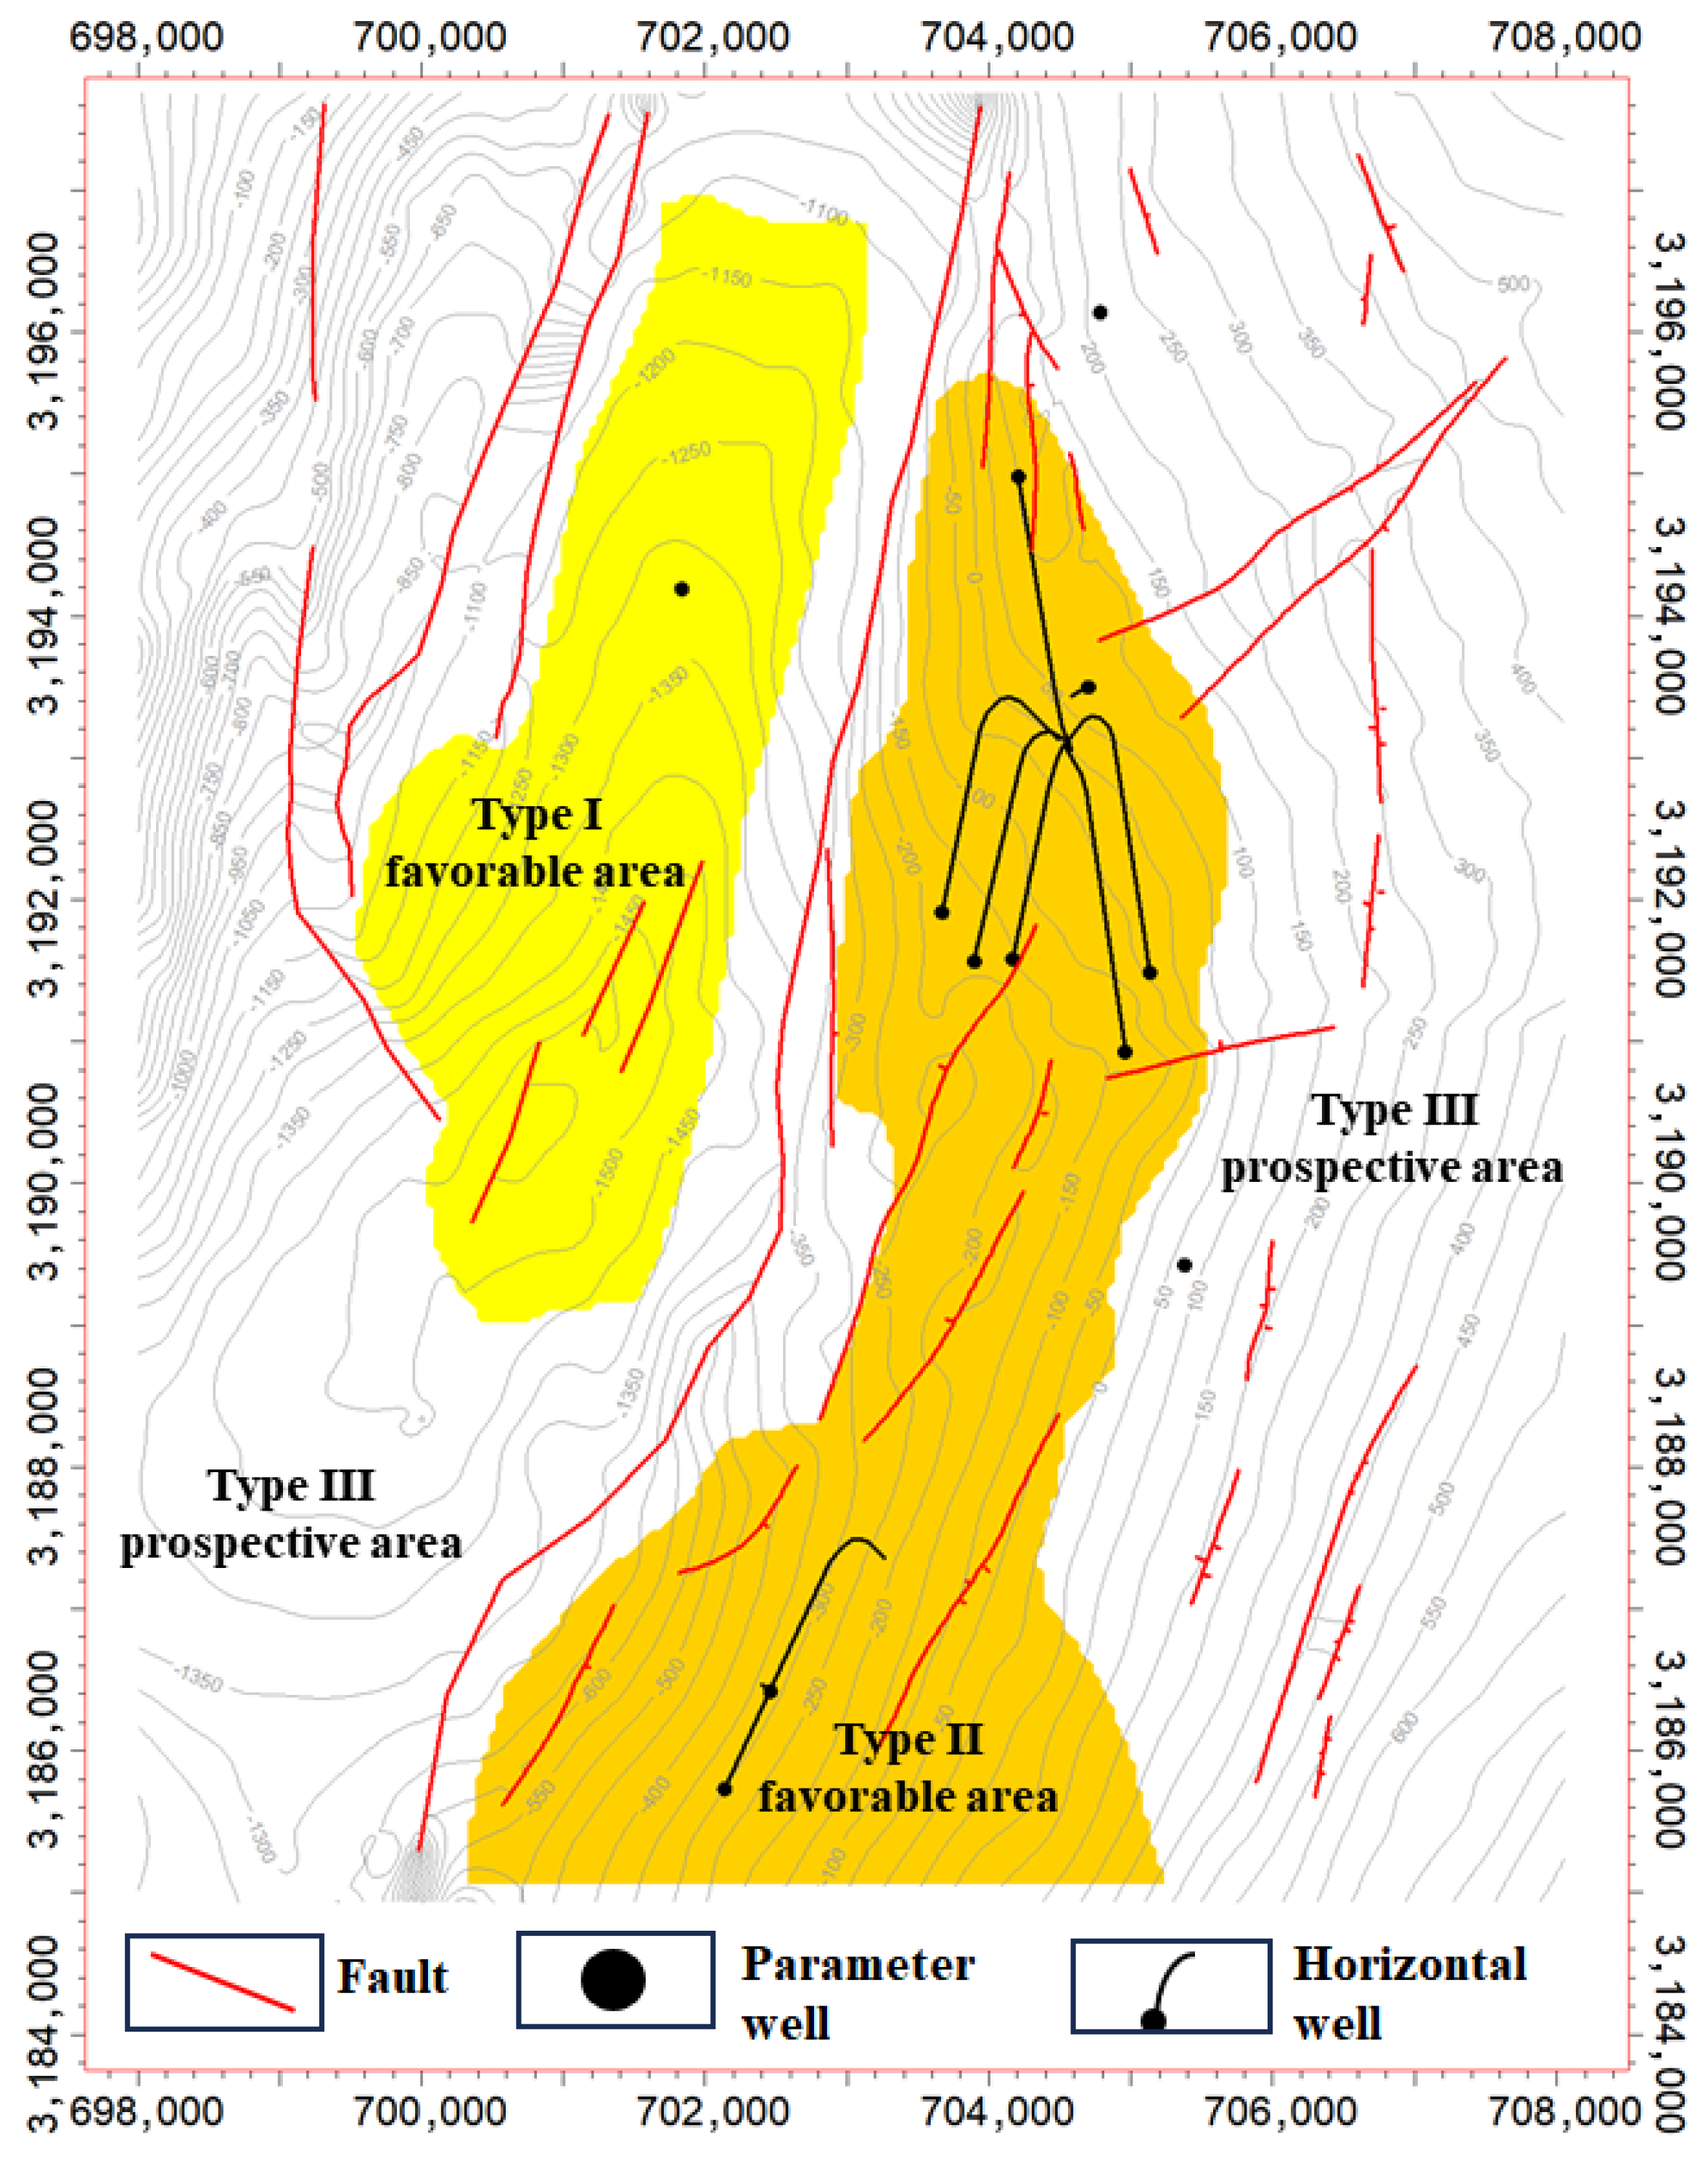
By superposing the normalized scores of each parameter and combining surface constraints, for example, by avoiding ecological protection zones, water source protection areas and towns, the target interval in Shixi block was divided into three classes: type I favorable areas, type II favorable areas and type III prospective areas. The type I favorable area covers about 42.61 km
2, and the type II favorable area covers about 55 km
2. The spatial distribution of the integrated favorable zones is shown in
Figure 21, which provides the main basis for subsequent well deployment optimization.
For resource estimation, the Wufeng–Longmaxi shale gas reservoir in Shixi is regarded as a continuous, self-generated and self-stored shale gas system, where gas is present as adsorbed gas, free gas and locally dissolved gas. According to [
36] and considering the current exploration degree, a static method is used, in which free gas is calculated by the volumetric method and adsorbed gas is calculated by the mass or volume method. The total geological gas in the main favorable area is estimated to be about 83.33 × 10
8 m
3, and the reserve abundance is about 1.96 × 10
8 m
3/km
2. This result indicates that the Shixi area has a certain resource basis for further appraisal and development, but the uncertainty related to seismic quality and structural broken zones should be carefully considered in later work.
6.4. Model Updating During Drilling and Development
Considering the normal-pressure characteristic and local structural complexity, it is necessary to continuously update the prediction model during drilling and testing. By tracking drilling, logging, testing and pressure data, the structural interpretation and seismic inversion products can be iteratively corrected, so as to improve the prediction accuracy of TOC, porosity, gas content and sweet spot thickness. Such iteration is particularly important for the central broken zone and the southwest area, where seismic data quality is weaker, and it can provide more reliable technical support for later fine development in the Shixi block.
6.5. Discussion on Uncertainty Propagation and Mitigation
In this integrated workflow, uncertainties propagate from seismic data quality to sweet-spot ranking. To address this, we implemented a multi-stage mitigation strategy:
(1) The SNR-based grading (
Section 3.1) identifies high-risk zones (Class III) where deterministic results are treated with lower confidence, preventing the propagation of noise-induced artifacts into the final decision. (2) To measure the uncertainty in reservoir parameter prediction, we utilized phase-controlled geostatistical inversion with multiple equiprobable realizations. By analyzing the standard deviation across 50 realizations, we quantified the spatial fluctuation range of TOC and porosity, particularly in areas with sparse well control. (3) The final sweet-spot ranking integrates these uncertainties by assigning lower weights to parameters derived from low-SNR seismic zones. The total uncertainty is managed through an iterative feedback loop (as shown in
Section 6.4), where real-time drilling data are used to ‘back-calibrate’ the seismic-derived predictions, ensuring that well placement decisions are based on the most current and validated model.
To further quantify the impact of seismic quality on prediction confidence, we performed a sensitivity analysis by comparing the standard deviation of predicted TOC and porosity across the 50 realizations against the SNR grading. Our results indicate that in Class I zones (SNR > 2), the standard deviation of predicted TOC is approximately 0.2–0.3%, whereas in Class III zones (SNR < 1), this value increases to 0.6–0.8%. This quantitative relationship confirms that seismic quality is the primary driver of prediction uncertainty. Consequently, we implemented a ‘confidence-weighted’ ranking system, where the final sweet-spot score is adjusted by a factor proportional to the local SNR, ensuring that high-risk zones are not over-interpreted.
6.6. Discussion and Benchmarking
Compared with the standard evaluation workflows used in North American shale plays (e.g., Barnett or Marcellus), which focus heavily on ‘fracability’ and ‘TOC’, the Shixi workflow emphasizes ‘structural compartmentalization’ and ‘dynamic preservation’. This shift is necessitated by the intense tectonic reworking characteristic of South China. Our integrated approach successfully differentiates ‘resource existence’ from ‘resource retention’, a distinction that is less critical in the stable tectonic settings of North America but is the decisive factor in the ‘dual-complexity’ regions of the Sichuan Basin margin, as corroborated by regional studies in similar settings [
22,
32,
33].
6.7. Quantitative Performance Assessment
To quantitatively evaluate the performance of our integrated workflow, we compared the prediction accuracy of sweet-spot thickness and gas content against the results obtained from a conventional ‘standard’ workflow (which relies solely on seismic amplitude and basic structural interpretation without the ‘cap-constraint’ velocity model or tiered attribute detection). Based on the drilling results of 56 horizontal wells, the prediction accuracy (defined as the match rate between predicted and drilled reservoir thickness) improved from 68% using the conventional workflow to 89% using our integrated approach. Furthermore, the ‘false-positive’ rate in identifying favorable zones in structurally complex areas was reduced by approximately 25%. These quantitative improvements demonstrate that our workflow significantly mitigates exploration risk in ‘dual-complexity’ settings by effectively integrating multi-scale structural constraints and preservation-related indicators.
6.8. Cross-Disciplinary Insights for Reservoir Modification
While our study focuses on shale gas, recent advances in coal reservoir modification offer valuable insights for further enhancing the producibility of normally pressured shale. For instance, the mechanisms of enhanced wettability and nanomechanical strength in soft coal seams modified by acidic SiO
2 nanofluids [
37] suggest potential pathways for improving shale fracability. Furthermore, the cross-scale transportation mechanism of CBM in coal beds fractured by high-voltage electric pulses (HVEPs) [
38] provides a promising reference for optimizing fracture network connectivity in structurally complex shale reservoirs. Integrating these cross-disciplinary techniques into our ‘Four-in-One’ workflow could further refine stimulation strategies in future development phases.
6.9. Broader Applicability of the Integrated Workflow
The proposed ‘Four-in-One’ integrated workflow is not limited to the Shixi block but offers a practical reference for shale gas assessment in other structurally complex and normally pressured regions globally. Many unconventional plays, such as the Appalachian Basin (e.g., Marcellus Shale) or various South American shale systems, exhibit similar ‘dual-complexity’ characteristics, including multi-stage tectonic reworking and normal-pressure regimes. In these settings, the traditional ‘reservoir-centric’ evaluation often fails to account for the critical role of preservation. Our workflow, by elevating the ‘preservation condition’ to an equal weight with ‘reservoir quality’ and utilizing tiered multi-scale discontinuity detection, provides a robust framework for identifying favorable zones in such challenging environments. We believe this integrated approach can be adapted to other basins by adjusting the specific thresholds for preservation and structural parameters based on local geological conditions.