Article

Mechanistic Modeling of Carrot Slice Drying: Lattice Boltzmann Simulation Coupled with Weibull-Based Quality Kinetics

1
Laboratory of Wind Power Control and Waste Energy Recovery, Research and Technologies Centre of Energy, Hammam-Lif 2050, Tunisia
2
Laboratory for the Study of Thermal & Energy Systems, National Engineering School of Monastir, Street Ibn El Jazzar, Monastir 5019, Tunisia
3
Higher Institute of Applied Sciences and Technology of Sousse, University of Sousse, Street Tahar Ben Achour, Sousse 4003, Tunisia
*
Author to whom correspondence should be addressed.
Processes 2026, 14(7), 1169; https://doi.org/10.3390/pr14071169
Submission received: 7 March 2026 / Revised: 30 March 2026 / Accepted: 2 April 2026 / Published: 4 April 2026
(This article belongs to the Special Issue Drying Kinetics and Quality Control in Food Processing, 2nd Edition)

Abstract

The prediction of drying kinetics in hygroscopic biological materials remains challenging due to the strong coupling between internal moisture diffusion, evolving surface wettability, material deformation and thermolabile bioactive compounds degradation. In this context, periodic temperature variations are inherent to many industrial and solar drying systems, yet most experimental and modeling studies evaluate product quality under constant-temperature conditions. This work provides a demonstration that periodic drying can alter quality degradation pathways in ways that may not be captured by constant-temperature experiments. A coupled non-isothermal lattice Boltzmann method (LBM) model for heat and moisture transport was integrated with a Weibull kinetic formulation to describe the degradation of total carotenoids, total polyphenols, and antioxidant activity in carrot slices. Validation against experimental data across 50–70 °C demonstrates excellent agreement (R2 > 0.96 for moisture ratio; quality retention within ±2% of the literature values). Seven drying scenarios were systematically evaluated: constant temperature (60 °C), fast and slow periodic oscillations, high-amplitude cycles, a mixed strategy combining constant initial drying with subsequent oscillations, and two intermittent ON/OFF profiles. Results reveal that while total polyphenol degradation within the present model is constrained to ~13.3% retention under the adopted kinetic parameters, carotenoid and antioxidant retention are highly sensitive to temperature history. The mixed strategy (60 °C for 2 h followed by 50–60 °C oscillations) achieves the highest quality retention (TC: 51.6%, AA: 34.4%) while requiring the lowest energy input (0.512 kJ), outperforming constant drying (TC: 48.8%, AA: 32.9%, 0.563 kJ). Conversely, high-amplitude intermittent drying (70/25 °C) accelerates carotenoid degradation (TC: 46.7%) despite shorter drying time (8.81 h), and low-amplitude intermittent cycling (65/55 °C) yields the poorest mean quality (31.4%) with the highest energy consumption (0.583 kJ). The framework reveals that oscillation frequency critically determines quality outcomes: slow cycles (8 h period) marginally improve retention, while fast cycles (2 h) offer no benefit over constant drying. These findings provide quantitative insights toward the design of drying strategies, demonstrating that optimal strategies must account for the coupling between temperature history and moisture-dependent vulnerability, with the mixed strategy emerging as the best-performing strategy among the tested scenarios.

1. Introduction

The need to develop sustainable and efficient food processing technologies is closely aligned with several United Nations Sustainable Development Goals [1], particularly SDG 2 (Zero Hunger), SDG 9 (Industry, Innovation and Infrastructure), and SDG 12 (Responsible Consumption and Production) [2]. As global food demand grows and post-harvest losses continue to pose significant challenges, improving the sustainability of food preservation methods has become critical [3]. Drying, one of the most energy-intensive processes in the food industry, offers a major opportunity for innovation. The high energy requirement is largely due to the thermodynamic demand for the latent heat of vaporization. This fundamental limitation underscores the importance of designing drying technologies with improved energy efficiency, which can reduce energy consumption, lower carbon emissions, and minimize waste. Enhancing drying processes is therefore not just a technical goal but a necessary step toward resilient food systems, more sustainable food processing, and the economic sustainability of agricultural value chains. Consequently, a substantial body of research has focused on optimizing drying technologies to improve both efficiency and product quality, as reflected in the recent literature.
According to Bhattacharjee et al. [4], managing the fundamental trade-offs between energy consumption, ultimate product quality, and process complexity is the ongoing issue in food dehydration. While sophisticated procedures can result in problems with uniformity and expensive capital costs, traditional methods frequently sacrifice efficiency and quality. A change in the field toward more complex, integrated approaches has been sparked by this fundamental conundrum. Building on this need for a multimodal approach, recent studies have focused on product shrinkage, a crucial component of quality decline. Shrinkage, which was once thought to be only a visual flaw, is now understood to be a key phenomenon that significantly affects the final texture and structure of the dried good as well as the effectiveness of the drying process. According to Li et al. [5], for example, shrinkage is mostly controlled by water migration within the cellular structure and the properties of the cell wall, with drying temperature having a greater impact than humidity or wind speed. Additionally, drying below the transition temperature might keep the material in a high-viscosity condition that eventually reduces volumetric decrease, making this temperature a crucial threshold. The development of ways to reduce shrinkage, frequently through the use of pre-treatments and hybrid drying systems, has naturally been prompted by this improved understanding of its mechanics. The relationship between cause and mitigation is evident; processes that modify internal structure and moisture movement can be advantageous if they are important. This is strongly supported by Liu et al. [6], who showed that ultrasonic (US) pre-treatment can change the critical moisture threshold at which glass transition takes place, reducing shrinkage and encouraging pore development during the drying of scallop adductors. Similar to this, research on particular drying methods identifies crucial control points. For example, Yang et al. [7] discovered that the moisture content at the transition from sublimation to evaporation (TPS-E) in multiphase microwave drying of Chinese yam is a crucial factor influencing bulk density and final shrinkage. In order to preserve quality, new, non-thermal technologies are being used in addition to traditional techniques. Electrohydrodynamic (EHD) drying, which operates at room temperature to exceptionally retain a product’s original vitamins, color, and bioactive chemicals, is highlighted by Prakasha et al. [8] as a particularly promising technology in this regard, even though it is still mostly a lab-scale breakthrough.
The literature demonstrates a significant tendency toward hybridizing techniques to maximize their benefits and minimize their individual drawbacks as we move from the analysis of single technologies to combined systems. Strategic combination may frequently overcome the drawbacks of any one approach, such as the uneven heating of microwaves or the high energy cost of freeze drying. Both Bhattacharjee et al. [4] and Kilic et al. [9] stress that hybrid methods, like convective drying followed by vacuum–microwave finishing, freeze drying [10] or solar-assisted heat pump systems, successfully shorten drying times and increase energy efficiency, but at the expense of more complicated processes. In this context, it has been demonstrated that the passive greenhouse dryer is a suitable and efficient method for drying potato chips [11]. A technically better approach might not be the most feasible, thus the systems’ economic viability is an important factor to take into account. Delfiya et al. [12] conducted a thorough study on clam drying and found that, although infrared drying produced the best sensory and quality characteristics, a solar–LPG hybrid dryer was the best overall option when balancing performance with economic indicators like payback period and benefit-cost ratio, highlighting the fact that selection is not solely based on quality. These developments in drying technology and process control are supported by a simultaneous revolution in artificial intelligence and computer modeling, which are turning into essential instruments for optimization and prediction. Sophisticated analytical techniques are required due to the intricate, multi-scale nature of drying and its nonlinear connections between factors. Despite issues with computational expense, Li et al. [5] support multi-scale models as the best course of action. More specifically, Han and Yuying [13] show how crucial it is to include physical deformation in these models by creating a Heat–Moisture–Mechanical (HMM) coupling model for microwave–vacuum drying that faithfully replicates the effects of shrinkage on temperature and moisture profiles. These predictions differed greatly from models that disregarded mechanical strain. Xing et al. [14] successfully used variable selection methods and AI models like Extreme Learning Machine (ELM) to generate very accurate forecasts of maize moisture content during drying, demonstrating the impact of data-driven approaches. The automation and optimization of industrial processes depend on this skill. Kilic et al. [9] highlight the ability of Artificial Neural Networks (ANNs) to handle these nonlinearities, pointing out their expanding use in predictive modeling and parameter optimization in the field. The capacity of artificial intelligence and statistical modeling techniques—ANFIS, ANN, and RSM—to forecast moisture reduction during potato slice drying based on drying duration, air speed, and temperature is examined by Onu et al. [15]. The authors found that although all three methods work well, RSM and ANFIS offer the most accurate drying behavior predictions.
The challenge of optimizing drying parameters to prevent under- or over-dried foods is critically addressed by Asrate et al. [16], who reviewed a wide array of drying technologies and emphasized the pivotal role of advanced computational tools like CFD and Genetic Algorithm-tuned ANNs for parameter optimization, while identifying non-uniform airflow as a key obstacle to quality and efficiency. This pursuit of optimal drying is increasingly applied to novel food resources, as highlighted by Guo et al. [17], who detail how drying insects, microalgae, and edible mushrooms is essential for converting them into stable, nutrient-rich functional ingredients for future foods, including 3D-printed products. The critical importance of tailored drying is further exemplified in the work of Hernández et al. [18], who stress that for high-value materials like microalgae, efficient drying is a vital step for preserving sensitive bioactive compounds and improving economic viability across the pharmaceutical, nutraceutical, and biofuel industries.
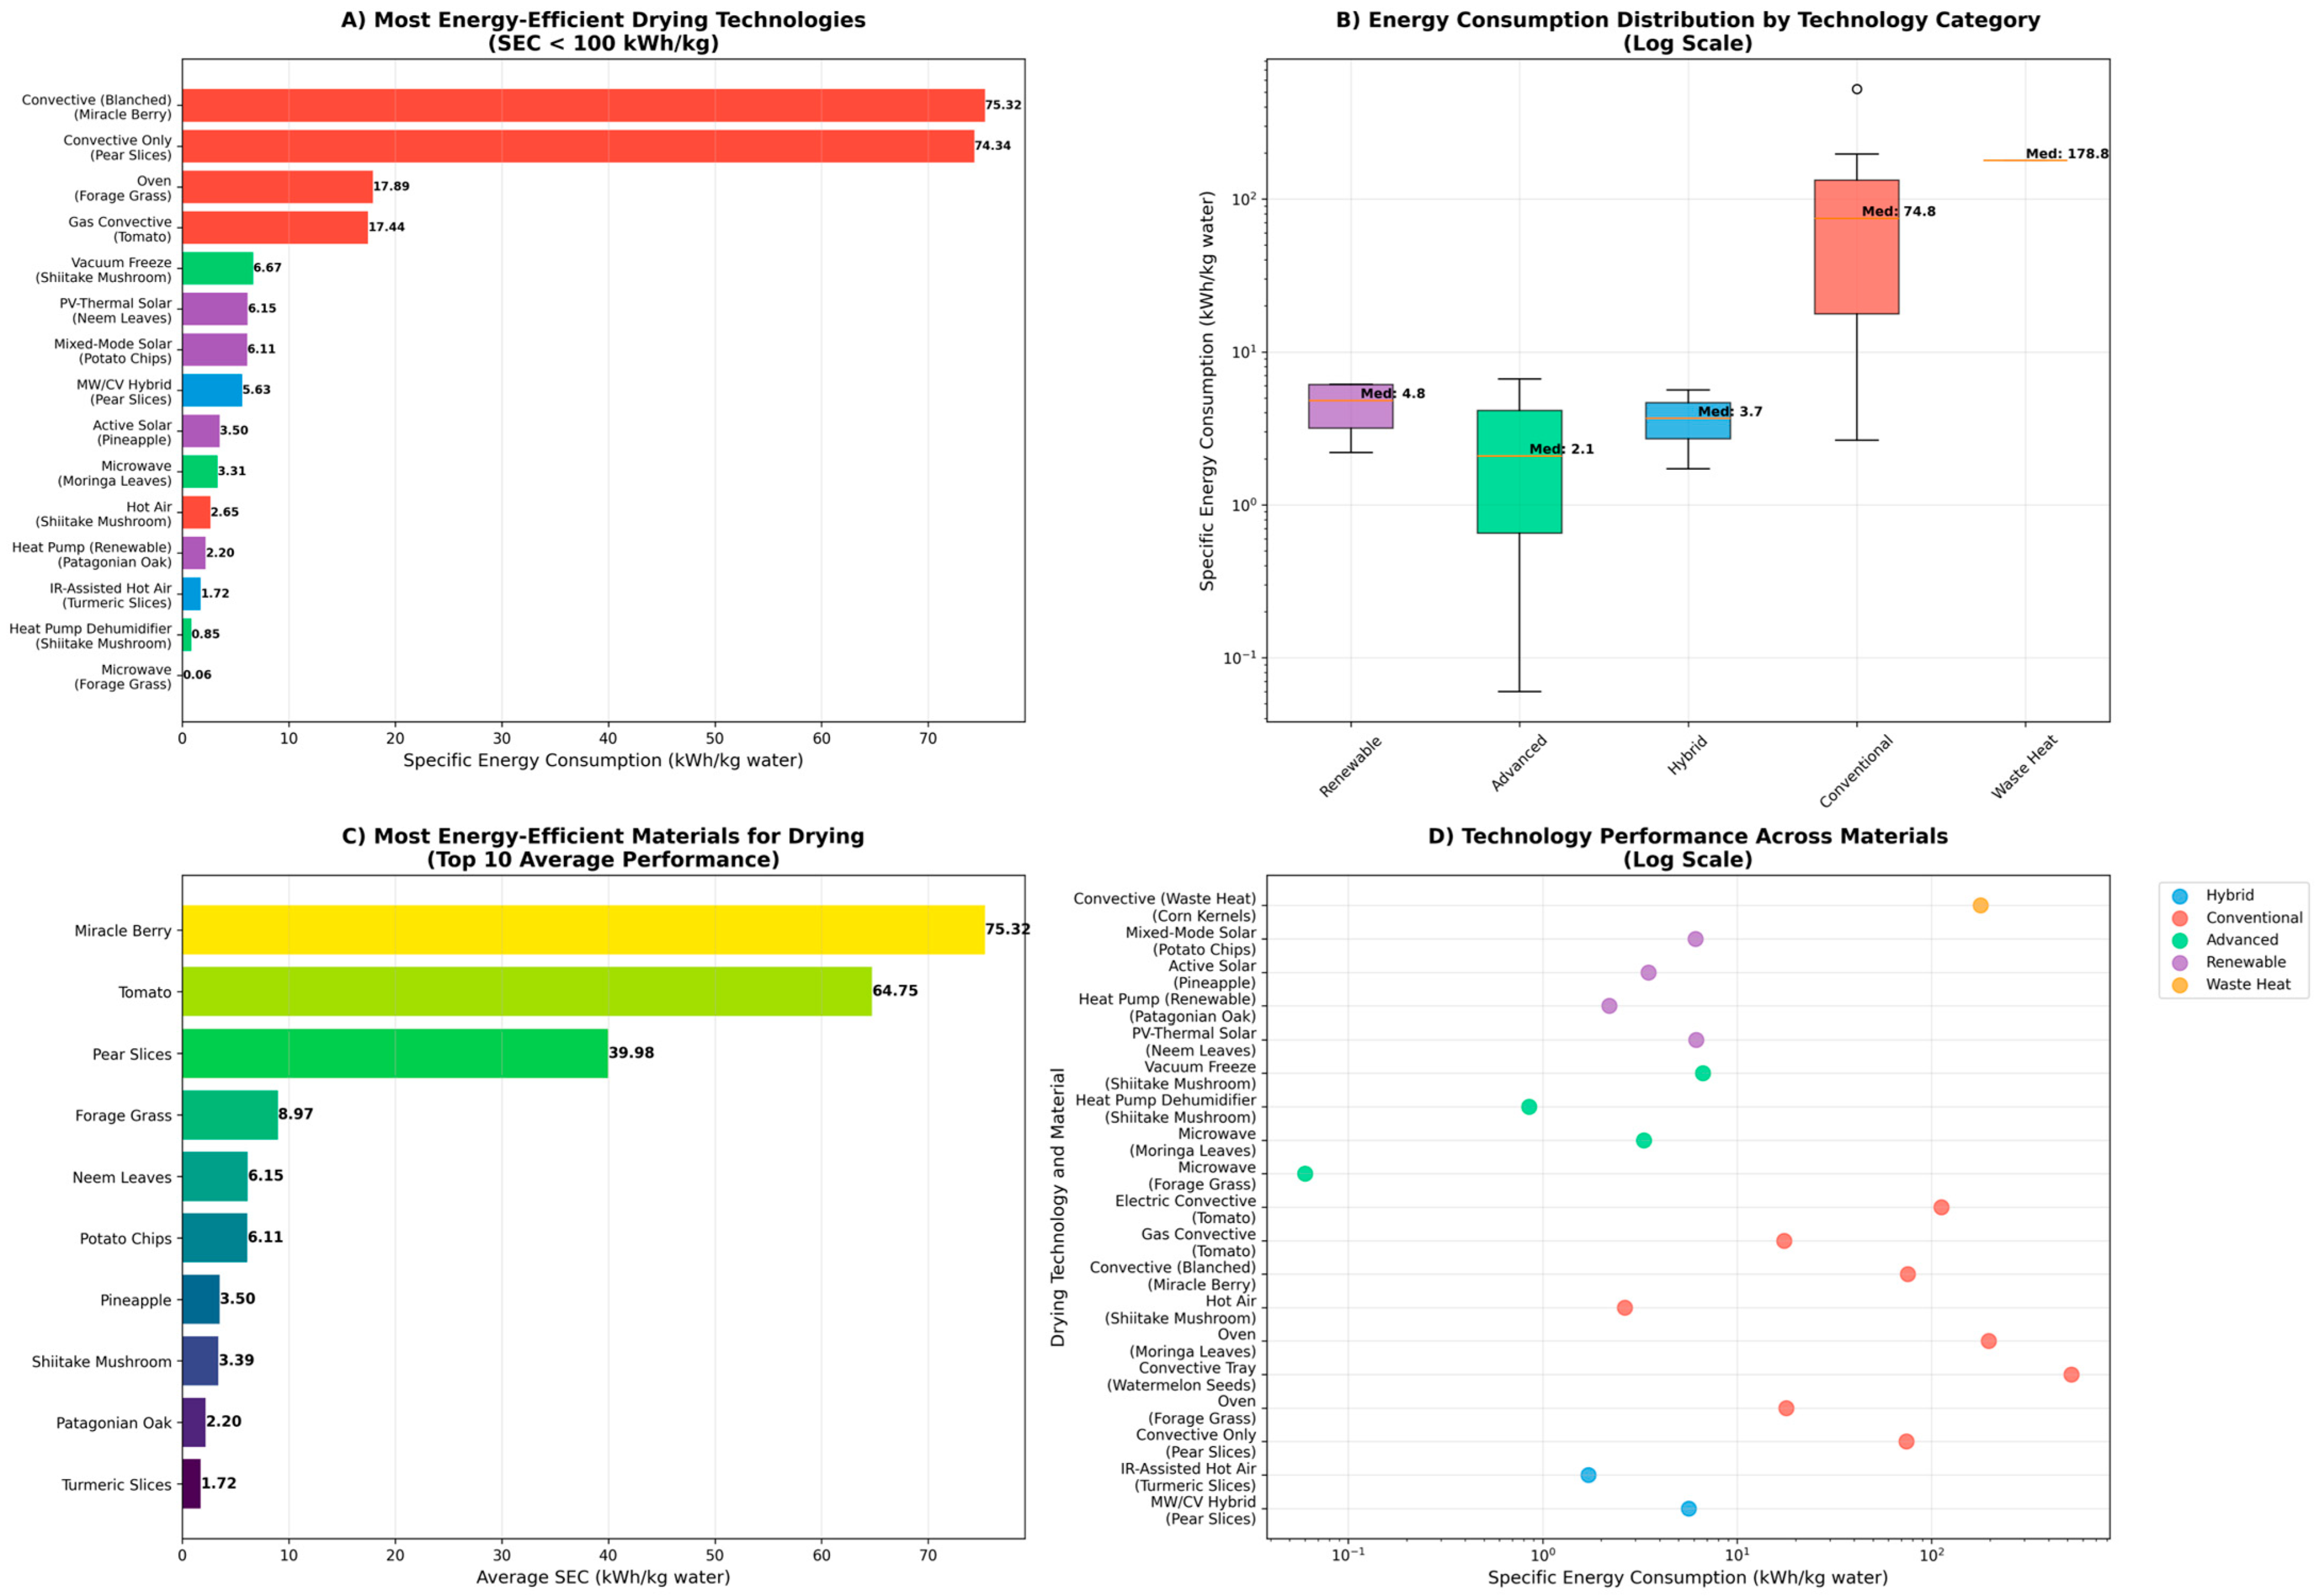
As shown in Figure 1, the comparative analysis of drying technologies across diverse materials reveals substantial disparities in energy efficiency, environmental impact, and product quality, emphasizing the importance of technology selection. Hybrid microwave–convective (MW/CV) drying of pear slices achieved a dramatically lower SEC of 5.63 kWh/kg compared to 74.34 kWh/kg for conventional convective drying, while also minimizing GHG emissions and maximizing rehydration quality [19]. Microwave drying of forage grass similarly demonstrated exceptional efficiency (0.04–0.072 kWh/kg) due to extremely short drying times, outperforming oven drying (8.38–27.4 kWh/kg) which is highly species-dependent [20]. Seeds and grains, such as watermelon seeds (524.09 kWh/kg) and corn kernels (130–228 kWh/kg), represent energy-intensive challenges, requiring carefully controlled drying conditions or waste-heat integration for optimization [21,22]. Leafy materials, including moringa and neem leaves, show substantial efficiency gains with microwave and solar-assisted systems (2.71–6.15 kWh/kg), preserving product quality while reducing environmental impact compared to conventional oven drying [23,24]. Heat pump systems offer low-energy solutions for slow-drying or quality-sensitive products such as shiitake mushrooms (0.85 kWh/kg) and Patagonian oak (SMER: 2.2 kg/kWh), delivering superior sensory quality and energy autonomy [25,26]. Infrared-assisted and hybrid solar methods, exemplified by turmeric slices (1.24–2.20 kWh/kg) and pineapple or potato chips (3.5–6.11 kWh/kg), provide balanced performance, combining low SEC with economic feasibility [27,28,29]. Freeze drying and lyophilization maintain high product quality, particularly for probiotics, but at considerable energy cost [25,29]. Conventional electric convective dryers consistently underperform, with high SEC and low thermal efficiency, while gas-assisted drying offers moderate efficiency improvements [30]. Overall, the data highlight that advanced technologies—microwave, heat pump, infrared hybrid, and solar-assisted—deliver transformative energy savings, environmental benefits, and superior product quality, whereas conventional approaches remain inefficient and unsustainable, necessitating targeted adoption and process-specific optimization [19,20,23].
Overall, the development of intelligent, integrated systems that specifically prioritize quality preservation—particularly the reduction in shrinkage—alongside energy efficiency and economic viability is the clear direction of food drying research. A more sophisticated paradigm characterized by hybrid techniques, informed by sophisticated multi-physics models, and optimized through artificial intelligence is replacing the days of depending solely on one drying method in order to provide superior dried food products in a sustainable way.
Despite extensive advances in agrifood drying research, a fundamental assumption remains largely unchallenged: that product quality degradation can be predicted solely from constant-temperature experiments and mean thermal conditions. Most drying models are calibrated under steady air temperatures and subsequently extrapolated to practical systems by assuming thermal equivalence between constant and time-varying regimes. Under this assumption, periodic drying at a given mean temperature is implicitly considered equivalent to constant drying at that same temperature in terms of quality outcomes. However, degradation reactions in biological materials follow Arrhenius-type kinetics, which are intrinsically nonlinear with respect to temperature. Because the Arrhenius function is convex, the average reaction rate under temperature oscillations is not equal to the reaction rate at the mean temperature. This mathematical property implies the potential for amplification of degradation under fluctuating thermal conditions, particularly when temperature peaks coincide with moisture-rich stages of drying. Yet, this nonlinear amplification effect has not been systematically incorporated into multiphysics drying models, nor rigorously evaluated against a constant-temperature reference at identical mean conditions. Existing numerical frameworks focus primarily on moisture transport and drying time prediction, often treating quality degradation as a secondary or post-processing calculation under steady assumptions. Few studies integrate transient boundary conditions, validated kinetic models, and thermodynamically consistent transport simulations in a manner that isolates the independent roles of temperature amplitude and oscillation period. Consequently, it remains unclear whether mean temperature alone is a sufficient descriptor for quality evolution in realistic drying systems. This gap is particularly critical for solar and industrial dryers, where large-amplitude and long-period thermal oscillations are unavoidable. Without explicitly accounting for the nonlinear Arrhenius response to transient temperature histories, current models may underestimate quality degradation under certain conditions and misguide process optimization strategies. On the other hand, extensive research on intermittent drying [31,32,33] has elucidated the benefits of time-varying conditions on macroscopic drying kinetics—such as reduced drying time, improved energy efficiency, and enhanced moisture removal rates—these studies have predominantly focused on physical water transport. The impact of dynamic temperature profiles on the real-time evolution of multiple quality attributes (e.g., carotenoids, polyphenols, antioxidant activity) remains largely unexplored. Existing models for intermittent drying are typically empirical, fitted to moisture loss data, and do not incorporate the coupled kinetics of heat-sensitive nutrients. Furthermore, constant-temperature experiments, such as those of Eim et al. [34], can identify optimal isothermal conditions but cannot predict how quality degrades under fluctuating temperatures, nor can they reveal the differential sensitivity of short- vs. long-half-life compounds to thermal oscillations. Consequently, there is no mechanistic framework to explore how the frequency, amplitude, and waveform of temperature cycles could be tuned to selectively preserve targeted quality attributes—a concept that requires a non-isothermal, multi-attribute kinetic model. The present study addresses this gap by combining a lattice Boltzmann-based transport model with multi-component degradation kinetics to analyze the real-time evolution of heat, mass transfer, and quality under periodic drying conditions. The kinetic foundation makes the lattice Boltzmann method particularly well suited for coupled heat and mass transfer problems, strongly transient boundary conditions, complex interfacial flux coupling and local conservation consistency. Additionally, because the degradation kinetics depend on the instantaneous temperature field, accurate time-resolved temperature prediction is essential. LBM provides smooth, stable temporal evolution without oscillations that can contaminate reaction-rate integration. By integrating the non-isothermal Weibull formulation, the model accounts for the irreversibility and non-linearity of thermal degradation. Using this tool, we aim to study the effect of temperature oscillations on the energy efficiency, the product deformation as well as on the final quality. These insights, inaccessible from constant-temperature experiments alone, establish a new paradigm for designing dynamic drying schedules that optimize not only energy and time but also the retention of multiple quality attributes. The main contributions of this work are: (i) the implementation of a lattice Boltzmann framework for transient drying simulations, (ii) its coupling with multi-component degradation kinetics for key quality attributes, and (iii) a systematic analysis of how periodic temperature profiles influence degradation pathways beyond mean-temperature effects.

2. Materials and Methods

2.1. Drying Model

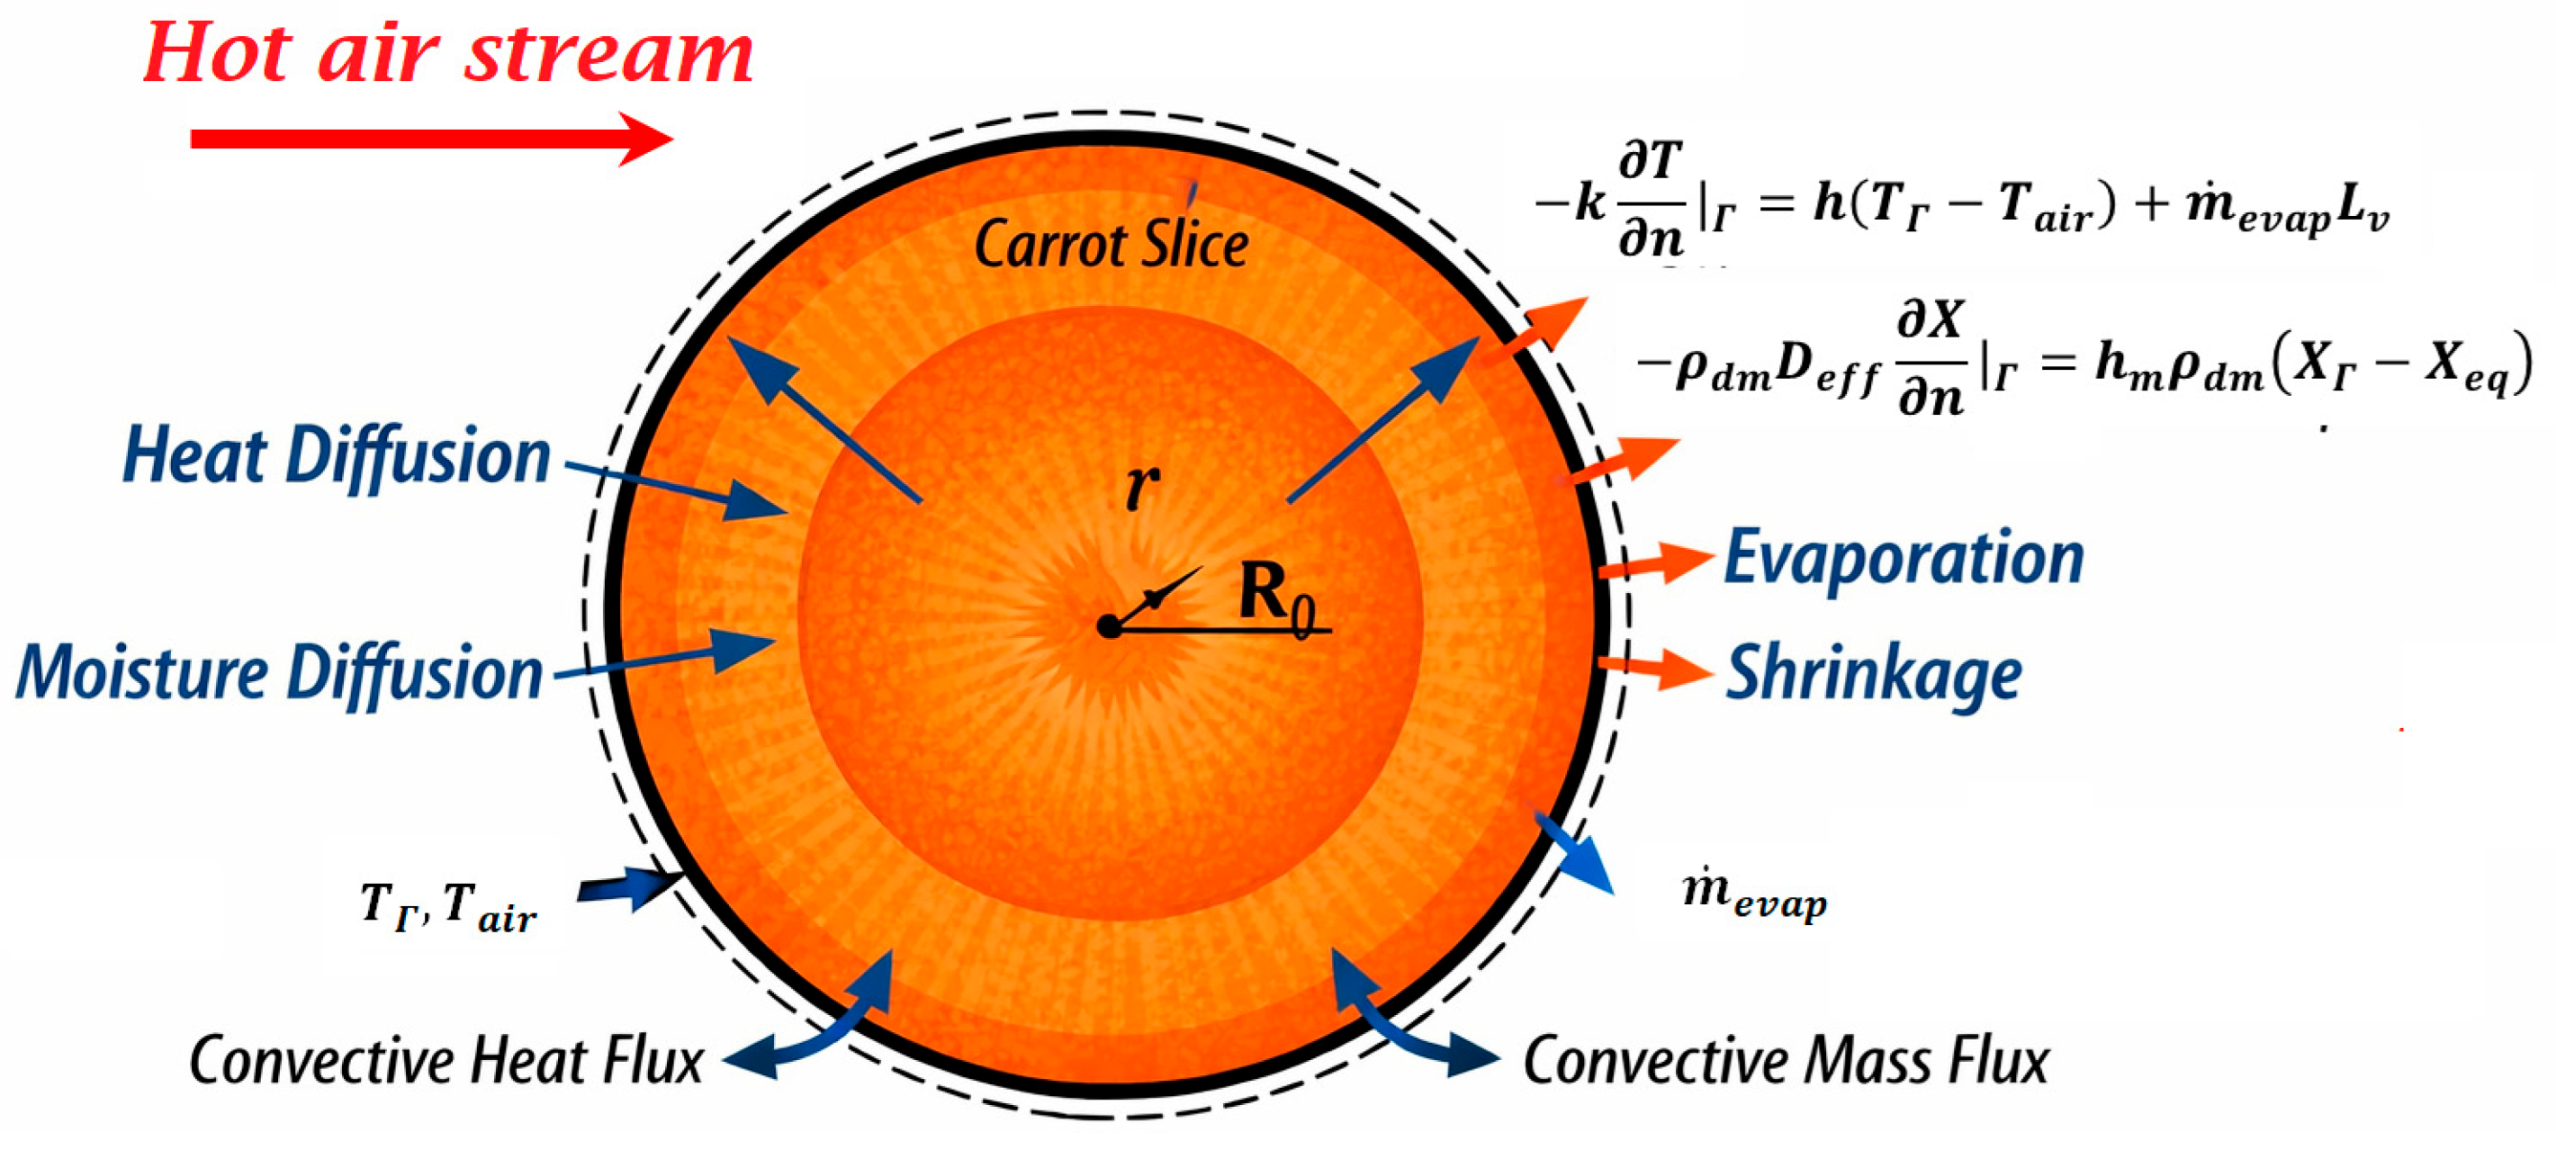
As displayed in Figure 2, the considered model consists of a drying a cylindrical carrot slice of initial radius R 0 exposed to a hot air stream at temperature T a i r and velocity v a i r . Heat and moisture transport inside the solid are governed by diffusion, while evaporation occurs exclusively at the solid–air interface. The evaporation rate is limited by the available convective heat flux, ensuring strict consistency with the surface energy balance. Shrinkage accompanies moisture removal, and the effective moisture diffusivity follows an Arrhenius temperature dependence calibrated from experimental data. The following assumptions are adopted: The problem is formulated in a two-dimensional Cartesian domain representing the cross-section of a cylindrical carrot slice. Internal convection within the solid is neglected, and both heat and moisture transport are assumed to occur purely by diffusion. Local thermal equilibrium between the solid matrix and the liquid water phase is assumed, and thermophysical properties are considered constant except for the effective moisture diffusivity, which varies with temperature. Heat and mass transfer at the solid–air interface are described by convective boundary conditions, while evaporation is restricted to the surface and consumes latent heat locally. As drying proceeds, the sample undergoes isotropic shrinkage that is correlated to the spatially averaged moisture content through an empirical power-law relationship. Finally, quality degradation is modeled using a lumped approach in which the kinetics depend only on the volume-averaged sample temperature, justified by the thermally thin nature of the product (Biot number ≪ 1), allowing the use of a single kinetic time scale for each quality attribute.
The temperature field T x , t and moisture content (dry basis) X x , t evolve according to:
T t = α 2 T , X t = D e f f T X
where α = k / ρ c p is the thermal diffusivity and D e f f T is the effective moisture diffusivity. The latter follows an Arrhenius law [35]:
D e f f T = D 0 e x p E a R T
where E a is the activation energy. At the solid–air interface Γ , the heat flux consists of two parts: convective exchange with the air and the latent heat consumed by evaporation:
k T n | Γ = h T Γ T a i r + m ˙ e v a p L v
where h is the convective heat transfer coefficient, L v is the latent heat of vaporization, and m ˙ e v a p is the evaporation mass flux (kg·m−2·s−1). The moisture flux at the interface equals the evaporation rate and is driven by the difference between the surface moisture content and the equilibrium moisture content X e q :
ρ d m D e f f X n | Γ = m ˙ e v a p = h m ρ d m X Γ X e q
where ρ d m is the dry-matter density and h m is the convective mass transfer coefficient.
However, in the present formulation, the evaporation rate is not imposed independently by both balances. Instead, it is constrained by the available convective heat supply:
m ˙ e v a p = m i n q c o n v L v , h m ρ d m X Γ X e q
where q c o n v = h T a i r T Γ is the purely convective heat flux. This ensures that the energy required for evaporation does not exceed the heat actually transferred to the surface. The evaporation rate at the solid–air interface is governed by the simultaneous availability of heat and moisture. For a wet surface, water is abundant, and the rate of evaporation is limited by the rate of heat transfer from the air to the interface (the so-called constant-rate period). This approach automatically switches from heat control at high moisture contents to mass transfer (internal diffusion) control once the surface dries below a critical moisture content. It avoids prescribing a fixed “constant-rate period” and instead allows the transition to emerge from the coupled heat and mass balances. For food materials, it is recognized that during the initial stage, the surface remains saturated, and the evaporation rate is primarily determined by the heat transfer coefficient and the air–surface temperature difference. Only when the surface moisture falls below the equilibrium value does internal diffusion become the controlling resistance. The present formulation captures this transition without requiring an a priori definition of the critical moisture content.
The heat and mass transfer coefficients h = N u k a i r d and h m = S h D A B d are obtained from empirical correlations for flow past a cylinder. The Nusselt and Sherwood numbers are given by [36]:
N u = 0.683 R e 0.466 P r 1 / 3 , R e < 4000 , 0.193 R e 0.618 P r 1 / 3 , R e 4000 , S h = 0.683 R e 0.466 S c 1 / 3 , R e < 4000 0.193 R e 0.618 S c 1 / 3 , R e 4000
where R e = ρ a i r v a i r d μ a i r is the Reynolds number, d = 2 R 0 is the cylinder diameter, P r = 0.71 and S c = 0.6 . The Biot numbers for heat and mass are computed using the characteristic half-length R 0 :
B i h = h R 0 k c a r r o t , B i m = h m R 0 D e f f T a i r
The actual boundary conditions are implemented in the LBM framework via a local Robin-type discretization. The sample shrinks isotropically as drying proceeds. The instantaneous radius R t is related to the average moisture content X ¯ t through an empirical linear relation derived from experimental data [37]:
R t R 0 = a + b X ¯ t   X 0 1 / 3
where a and b are constants. The computational mask defining the solid domain is updated at each time step to reflect the new radius, ensuring geometric consistency with mass loss.

2.2. Lattice Boltzmann Method (LBM)

The advection–diffusion equations for temperature and moisture are solved using a passive-scalar lattice Boltzmann approach on a D2Q9 lattice. The model consists of discrete velocity vectors c i ( i = 0 , , 8 ) with corresponding weights w i . For each scalar field ϕ (temperature T or moisture content X ), a set of distribution functions f i x , t evolves according to the single-relaxation-time (BGK) collision operator [38]:
f i x + c i Δ t , t + Δ t = f i x , t 1 τ f i x , t f i e q x , t
where the equilibrium distribution is as follows:
f i e q x , t = w i ϕ x , t
The macroscopic scalar field is recovered as the zeroth moment:
ϕ x , t = i = 0 8 f i x , t
Through Chapman–Enskog expansion, the scheme recovers the unsteady diffusion equation as follows [39]:
ϕ t = D · 2 ϕ
where the diffusion coefficient is related to the relaxation time τ by:
D = c s 2 τ 1 / 2 Δ x 2 Δ t
The lattice speed of sound is c s = 1 / 3 and the boundary condition at the solid–air interface is implemented locally on the boundary nodes (those belonging to the solid but having at least one fluid neighbor). For each boundary node, the neighboring interior node in the normal direction is identified. Let T b and X b be the values at the boundary node, and T n , X n be the values at the adjacent interior node. A local Robin-type discretization is applied at boundary nodes. The diffusive flux is approximated by a first-order finite difference:
k T n T b Δ x = h T b T a i r + m ˙ e v a p L v
ρ d m D e f f X n X b Δ x = m ˙ e v a p
The scheme is fully explicit and enforces both mass and energy conservation at each boundary node. The cooling term m ˙ e v a p introduces the evaporative temperature depression automatically.
These equations are rearranged to give explicit updates. First, the purely convective surface temperature (without evaporation) is introduced:
T b c o n v = T n + B i h l o c a l T a i r 1 + B i h l o c a l , B i h l o c a l = h Δ x k
The corresponding convective heat flux is as follows:
q c o n v = h T a i r T b c o n v
The maximum evaporation rate supported by this heat flux is as follows:
m ˙ m a x = q c o n v L v
The diffusive moisture flux is expressed as:
m ˙ d i f f = ρ d m D e f f Δ x X n X e q
Consequently, moisture transport is governed by internal diffusion resistance, which becomes increasingly dominant as the material approaches equilibrium conditions. Then the boundary values are updated in a fully explicit scheme:
X b n e w = X b m ˙ e v a p Δ t ρ d m
T b n e w = T n + B i T a i r m ˙ e v a p L v Δ x k 1 + B i
This update automatically respects both the energy balance and the moisture balance. The term subtracted in the numerator of T b n e w represents the cooling effect of evaporation. For nodes outside the solid domain, the temperature and moisture are set to the air values ( T a i r , X e q ) to maintain a consistent reference for the next time step. After each time step, the average moisture content over all solid nodes X ¯ t is computed. A new circular mask is generated from the updated radius.
To verify the energy balance, the cumulative heat transferred into the domain and the energy consumed by evaporation are recorded. The convective heat flux used for the evaporation limit ( q c o n v ), the heat used for evaporation Q e v a p and the stored sensible heat Q s e n are integrated over time and along the boundary length as follows:
Q i n = 0 t Γ q c o n v d A d t
Q e v a p = 0 t Γ m ˙ e v a p L v d A d t
Q s e n = m t C p , C a r r o t T ¯ T 0
This definition isolates the fraction of the supplied convective heat that is effectively utilized for phase change, thereby enabling a direct assessment of drying energetics and confirming compliance with the first law of thermodynamics in the numerical outputs. Using the moisture content at time t , M t , the equilibrium moisture content M e and the initial moisture content M 0 , the moisture ratio (MR) is then calculated using the following equation:
M R = M t M e M 0 M e
where M e is the equilibrium moisture content. Statistical validation of the numerical model was performed by comparing the simulated moisture ratio M R s i m t i with the corresponding experimental measurements M R e x p t i at the same drying times using two standard indicators. The model accuracy was quantified by the Root Mean Square Error (RMSE), defined as:
R M S E = 1 N 1 N M R s i m t i M R e x p t i 2
R M S E measures the average magnitude of the deviation between predicted and experimental values. In addition, the coefficient of determination R 2 was calculated as using the mean experimental moisture ratio M R ¯ e x p as follows:
R 2 = 1 1 N M R s i m t i M R e x p t i 2 1 N M R s i m t i M R ¯ e x p 2

2.3. Quality Degradation Kinetics

While prediction of moisture removal is essential for estimating drying time and energy consumption, process optimization cannot rely on transport phenomena alone. The commercial and nutritional value of dried products is ultimately determined by the retention of thermolabile bioactive compounds, whose degradation is strongly temperature-dependent and evolves continuously throughout the drying history. Because the internal temperature field is governed by coupled heat and mass transfer, quality loss emerges as a secondary, yet mechanistically linked, consequence of the transport process. Therefore, a comprehensive drying model must extend beyond diffusion-driven moisture kinetics to incorporate temperature-driven reaction pathways responsible for the degradation of carotenoids, polyphenols, and antioxidant activity. This coupling between transport dynamics and thermo-kinetic deterioration forms the basis of the quality degradation framework developed in the following section. In this context, three quality attributes are tracked as total carotenoids ( T C ), total phenolics ( T P ), and antioxidant activity ( A A ). Their degradation is described by a Weibull model with an Arrhenius-type temperature dependence of the scale parameter. The Weibull distribution model is a highly accurate, empirical tool for predicting food moisture content during drying, generally yielding high regression coefficients [40]. Since the sample is thermally thin, a lumped (volume-averaged) approach is adopted: the degradation depends only on the average sample temperature T ¯ t . For a constant temperature T , the retention ratio C / C 0 is [34]:
C t C 0 = e x p t α T β
where α ( T ) is the scale parameter (in hours) and β is the dimensionless shape parameter. The scale parameter follows an Arrhenius law (Perera, 2005) [41]:
α T = α 0 e x p E α R T
where α 0 and E α (J/mol) are specific to each attribute. The half-life (time to 50% retention) at a given temperature is:
t 1 / 2 = l n 2 α T 1 / β
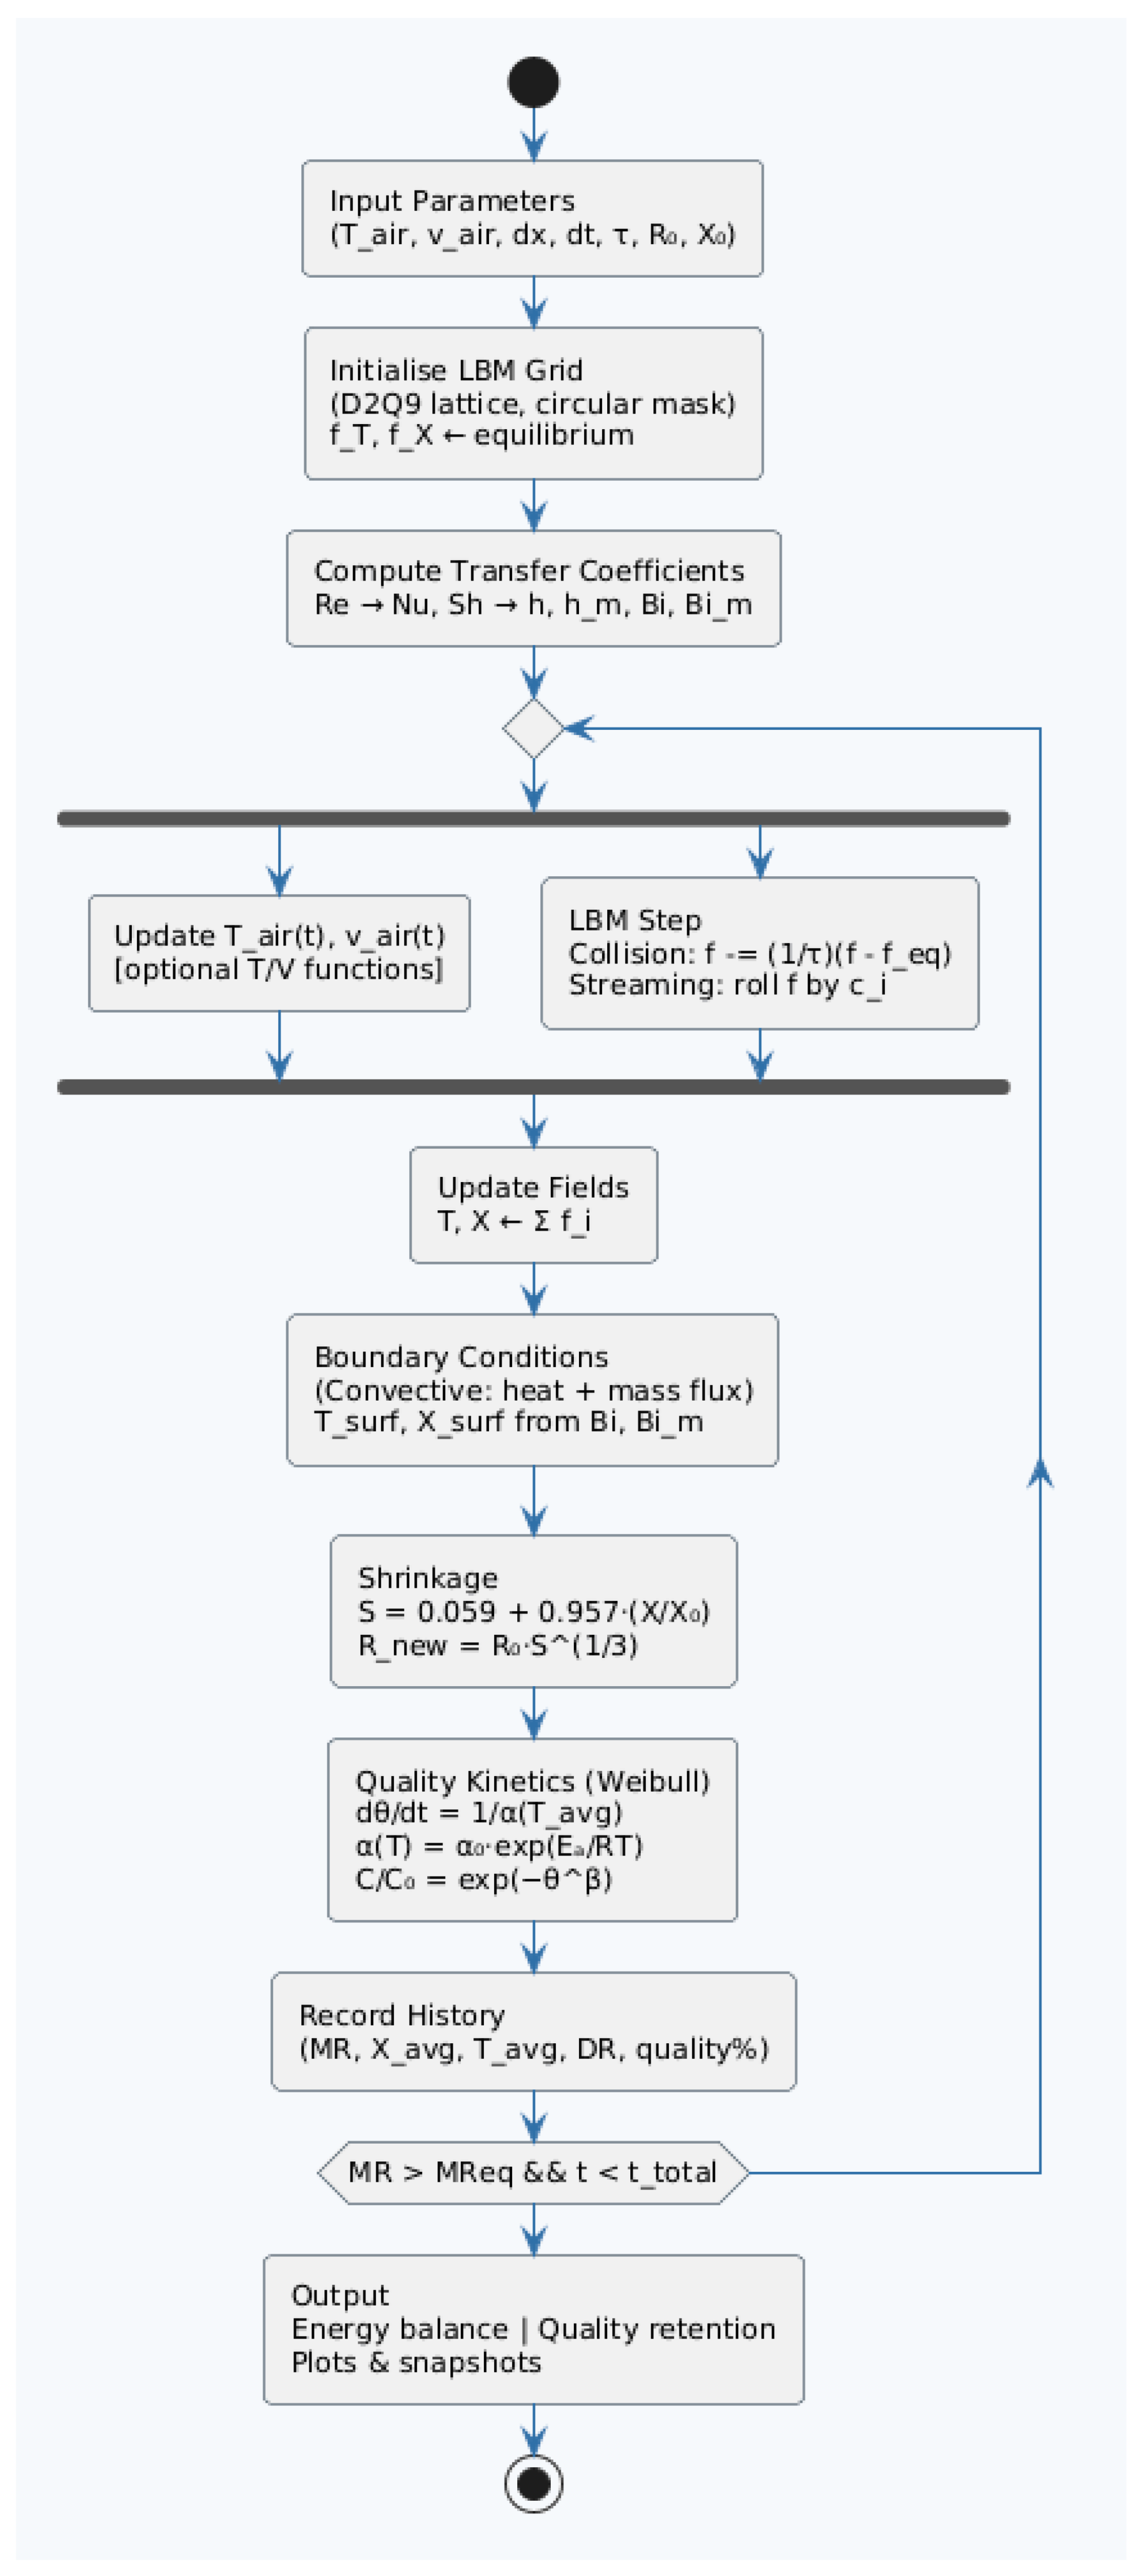
The coupled thermo–mass transfer drying model based on the LBM with dynamic shrinkage and temperature-dependent quality degradation is shown in Figure 3. The simulation begins by defining the input parameters (air temperature, air velocity, spatial and temporal steps, relaxation time, initial radius, and initial moisture content), where the relaxation time τ = 0.875 is explicitly imposed as an input to guarantee numerical stability and proper diffusivity control in the BGK collision operator. The D2Q9 lattice is initialized with a circular computational mask representing the carrot domain, and the distribution functions for temperature and moisture are set to equilibrium. Convective transfer coefficients are then computed using Reynolds-based correlations. At each time step, optional time-dependent air conditions are updated, followed by the LBM collision and streaming steps. Macroscopic temperature and moisture fields are reconstructed from the distribution functions, and convective boundary conditions are applied via Biot formulations for heat and mass transfer. Shrinkage is incorporated using an empirical moisture-dependent relation, updating the effective radius. Simultaneously, quality degradation (TC, TP, AA) is modeled using a temperature-dependent Weibull kinetic approach with Arrhenius dependence of the scale parameter α ( T ) . The model records moisture ratio, average temperature, drying rate, and quality retention until the termination criterion ( M R < M e q ) or final time is reached. Outputs include energy balance assessment, quality retention curves, and spatial field snapshots.
Table 1 summarizes the kinetic and structural parameters adopted in the present drying and quality degradation model. The drying kinetic uses an activation energy of 28.36 kJ/mol and a pre-exponential diffusivity ranging from 0.776 to 9.335 × 10⁻⁹ m2/s depending on the temperature, as reported by Doymaz [35]. Shrinkage is modeled using empirical coefficients a = 0.059 and b = 0.957 from Zielińska and Markowski [37]. Quality degradation kinetics for TC, TP, and AA follow the prescribed Weibull–Arrhenius approach based on parameters reported by Eim et al. [34], including specific pre-exponential factors, activation energies, and shape parameters (β). It is important to mention that the activation energy for moisture diffusion in carrots varies significantly in the literature, ranging from 22.14 kJ/mol [42] to 76 kJ/mol [34]. In this work, the validated parameters of Doymaz [35] (Ea = 28.36 kJ/mol) were adopted for drying kinetics, as they provided excellent agreement with experimental moisture ratio data across 50–70 °C. The quality degradation was then modeled using the Weibull parameters reported by Eim et al. [34] for the same quality attributes.

3. Results and Discussions

3.1. Model Validation

A systematic grid sensitivity study was conducted to evaluate the influence of spatial discretization on the accuracy of the LBM drying model. Simulations were performed on four uniform grids: 100 × 100, 200 × 300, 300 × 300, and 400 × 400, while keeping all other parameters constant. The statistical metrics—Root Mean Square Error (RMSE) and coefficient of determination (R2)—were computed by comparing the simulated moisture ratio with experimental data of Domaz [35] at three drying temperatures (50, 60, and 70 °C). The results are summarized in Table 2. Grid refinement systematically improved model accuracy at all temperatures. At 60 °C, for instance, RMSE decreased from 0.0870 (100 × 100) to 0.0450 (400 × 400), corresponding to nearly a 48% reduction, while R2 increased from 0.8815 to 0.9682. A similar trend was observed at 70 °C, where RMSE dropped from 0.0783 to 0.0400 and R2 improved from 0.8681 to 0.9656. At 50 °C, the improvement was more moderate but still evident, with RMSE decreasing from 0.0689 to 0.0471 and R2 increasing from 0.9403 to 0.9721. The most significant gains occurred between the 100 × 100 and 200 × 200 grids, whereas further refinement beyond 300 × 300 yielded progressively smaller improvements. The transition from 300 × 300 to 400 × 400 resulted in RMSE reductions below 0.004–0.005 across all temperatures, indicating that grid independence was effectively achieved. The model consistently performed best at 50 °C, where R2 exceeded 0.94 even on the coarsest grid and approached 0.97 on finer meshes. Slightly lower agreement at 60 and 70 °C may reflect increased internal moisture gradients and faster drying rates, conditions under which simplifying assumptions (e.g., constant thermophysical properties and simplified shrinkage representation) become more restrictive. Nevertheless, the monotonic improvement in both RMSE and R2 with grid refinement indicates that discretization errors were well controlled. Based on this analysis, the 400 × 400 grid was selected for all subsequent simulations to ensure negligible numerical error relative to experimental variability while maintaining acceptable computational cost.
It is important to note that the heat transfer Biot numbers for the carrot slices were consistently below 0.4 across the simulated conditions, satisfying the standard criterion for the lumped-capacitance assumption and indicating that internal temperature gradients were relatively small. Specifically, B i h values were 0.3735 at 50 °C, 0.3739 at 60 °C, and 0.3743 at 70 °C. Inspection of the spatial temperature fields obtained from the LBM simulations confirmed that temperature variations within the slices were minimal under these conditions, consistent with the low B i h values. Thus, solving the spatial temperature field with LBM does not contradict the lumped-capacitance assumption; instead, it allows for precise monitoring of any small gradients, ensuring consistency with the criterion B i h ≪ 1. In contrast, the mass transfer Biot numbers ( B i m ) were extremely large due to the low effective moisture diffusivity of carrot: 407,830 at 50 °C, 261,221 at 60 °C, and 187,848 at 70 °C. This indicates that the resistance to moisture transfer was overwhelmingly internal, with surface moisture rapidly approaching equilibrium with the drying air. Consequently, the drying rate was controlled by diffusion within the solid, justifying the use of the Arrhenius law in the LBM model without the need to account for external mass transfer resistance beyond setting the boundary condition to equilibrium.
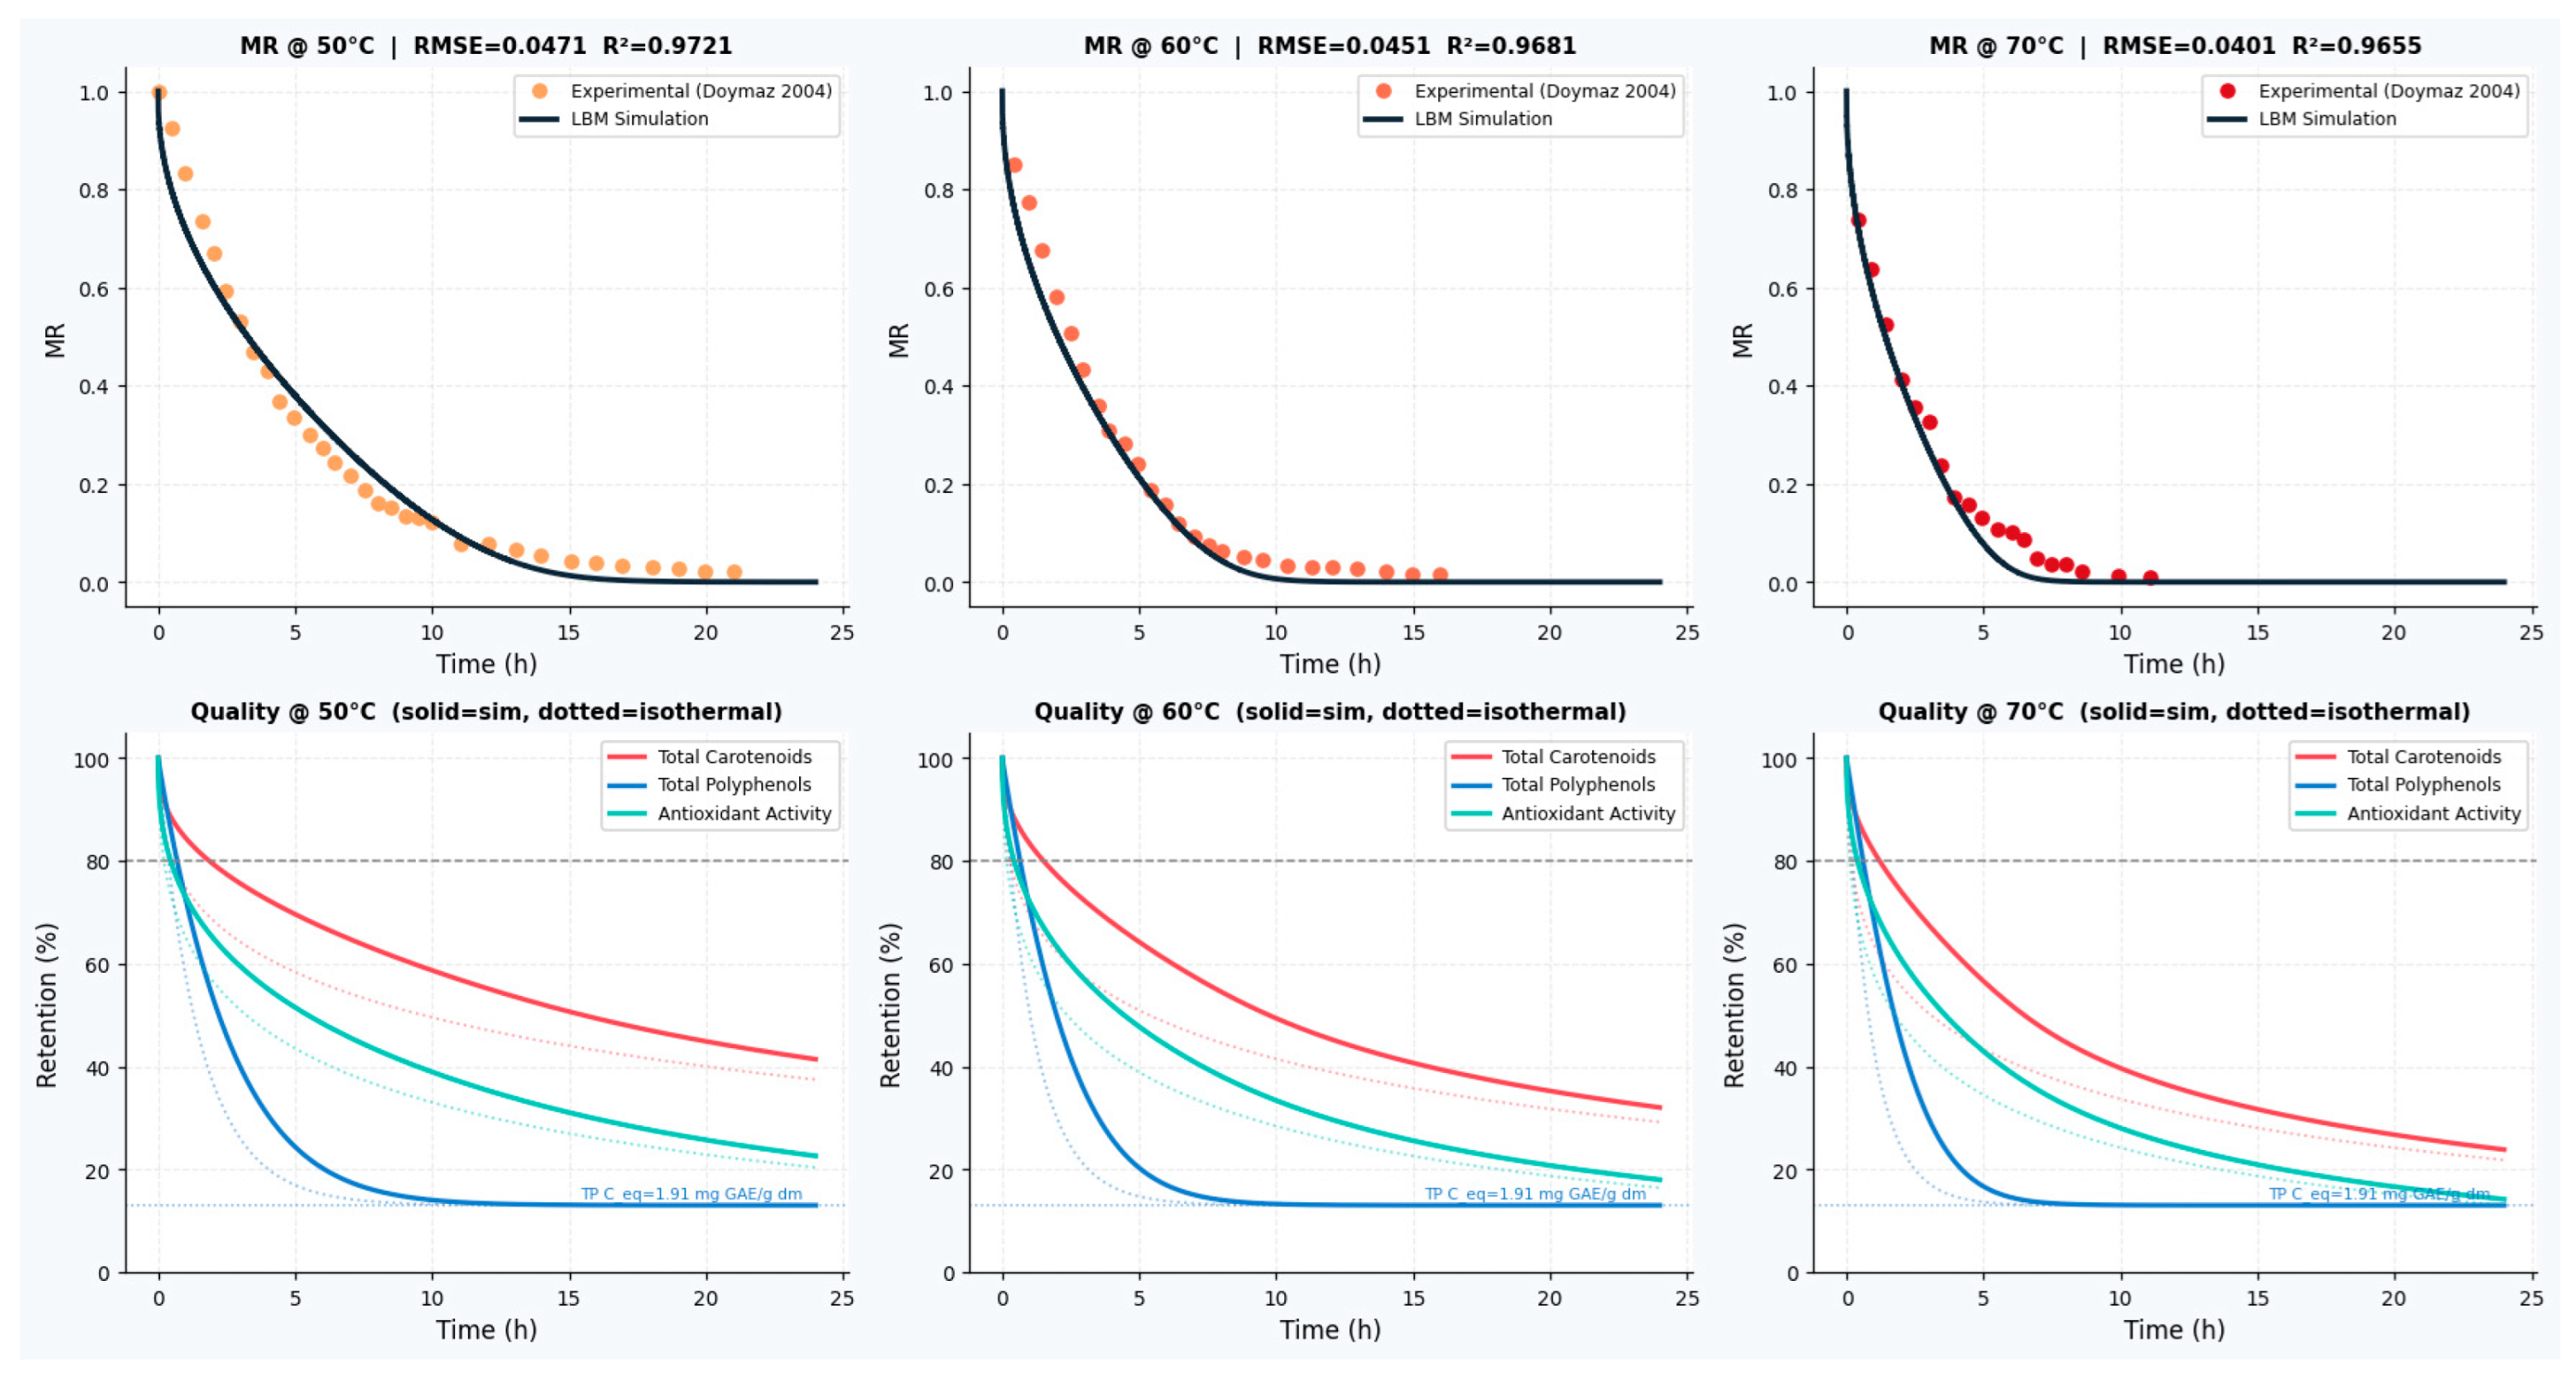
A comprehensive suite of statistical metrics was employed to evaluate the agreement between the LBM simulations and experimental drying data. Comparisons between the predicted moisture ratios (MR) from the LBM model with grid size 400 × 400 and the experimental results reported by Doymaz [35] for a thin-layer carrot slices dried at 50 °C, 60 °C, and 70 °C are illustrated in Figure 4. The figure indicates excellent agreement at 50 °C, with a high coefficient of determination (R2 = 0.97) and low prediction errors, supporting the robustness of the coupled heat–mass transfer formulation under moderate drying conditions. At 60 °C and 70 °C, although the prediction errors increase slightly and R2 decreases, the model still demonstrates strong predictive capability, with R2 values exceeding 0.96. The slight deterioration in accuracy at higher temperatures can be attributed to enhanced internal moisture gradients, stronger shrinkage dynamics, and the increased sensitivity of the Arrhenius-type diffusivity to temperature variations. Overall, the statistical analysis suggests that the LBM framework provides a reliable representation of thin-layer carrot drying kinetics across the investigated temperature range. The figure also shows that carotenoids degrade fastest, showing the sharpest decline in the early stage (consistent with Weibull shape parameter b < 1). Antioxidant activity shows intermediate behavior. Polyphenols are the most stable, exhibiting a slower and more gradual decrease, consistent with near-first-order kinetics and the presence of a residual concentration. The figure indicates that degradation kinetics are strongly time-controlled and temperature-sensitive, with carotenoids being the most vulnerable compound.
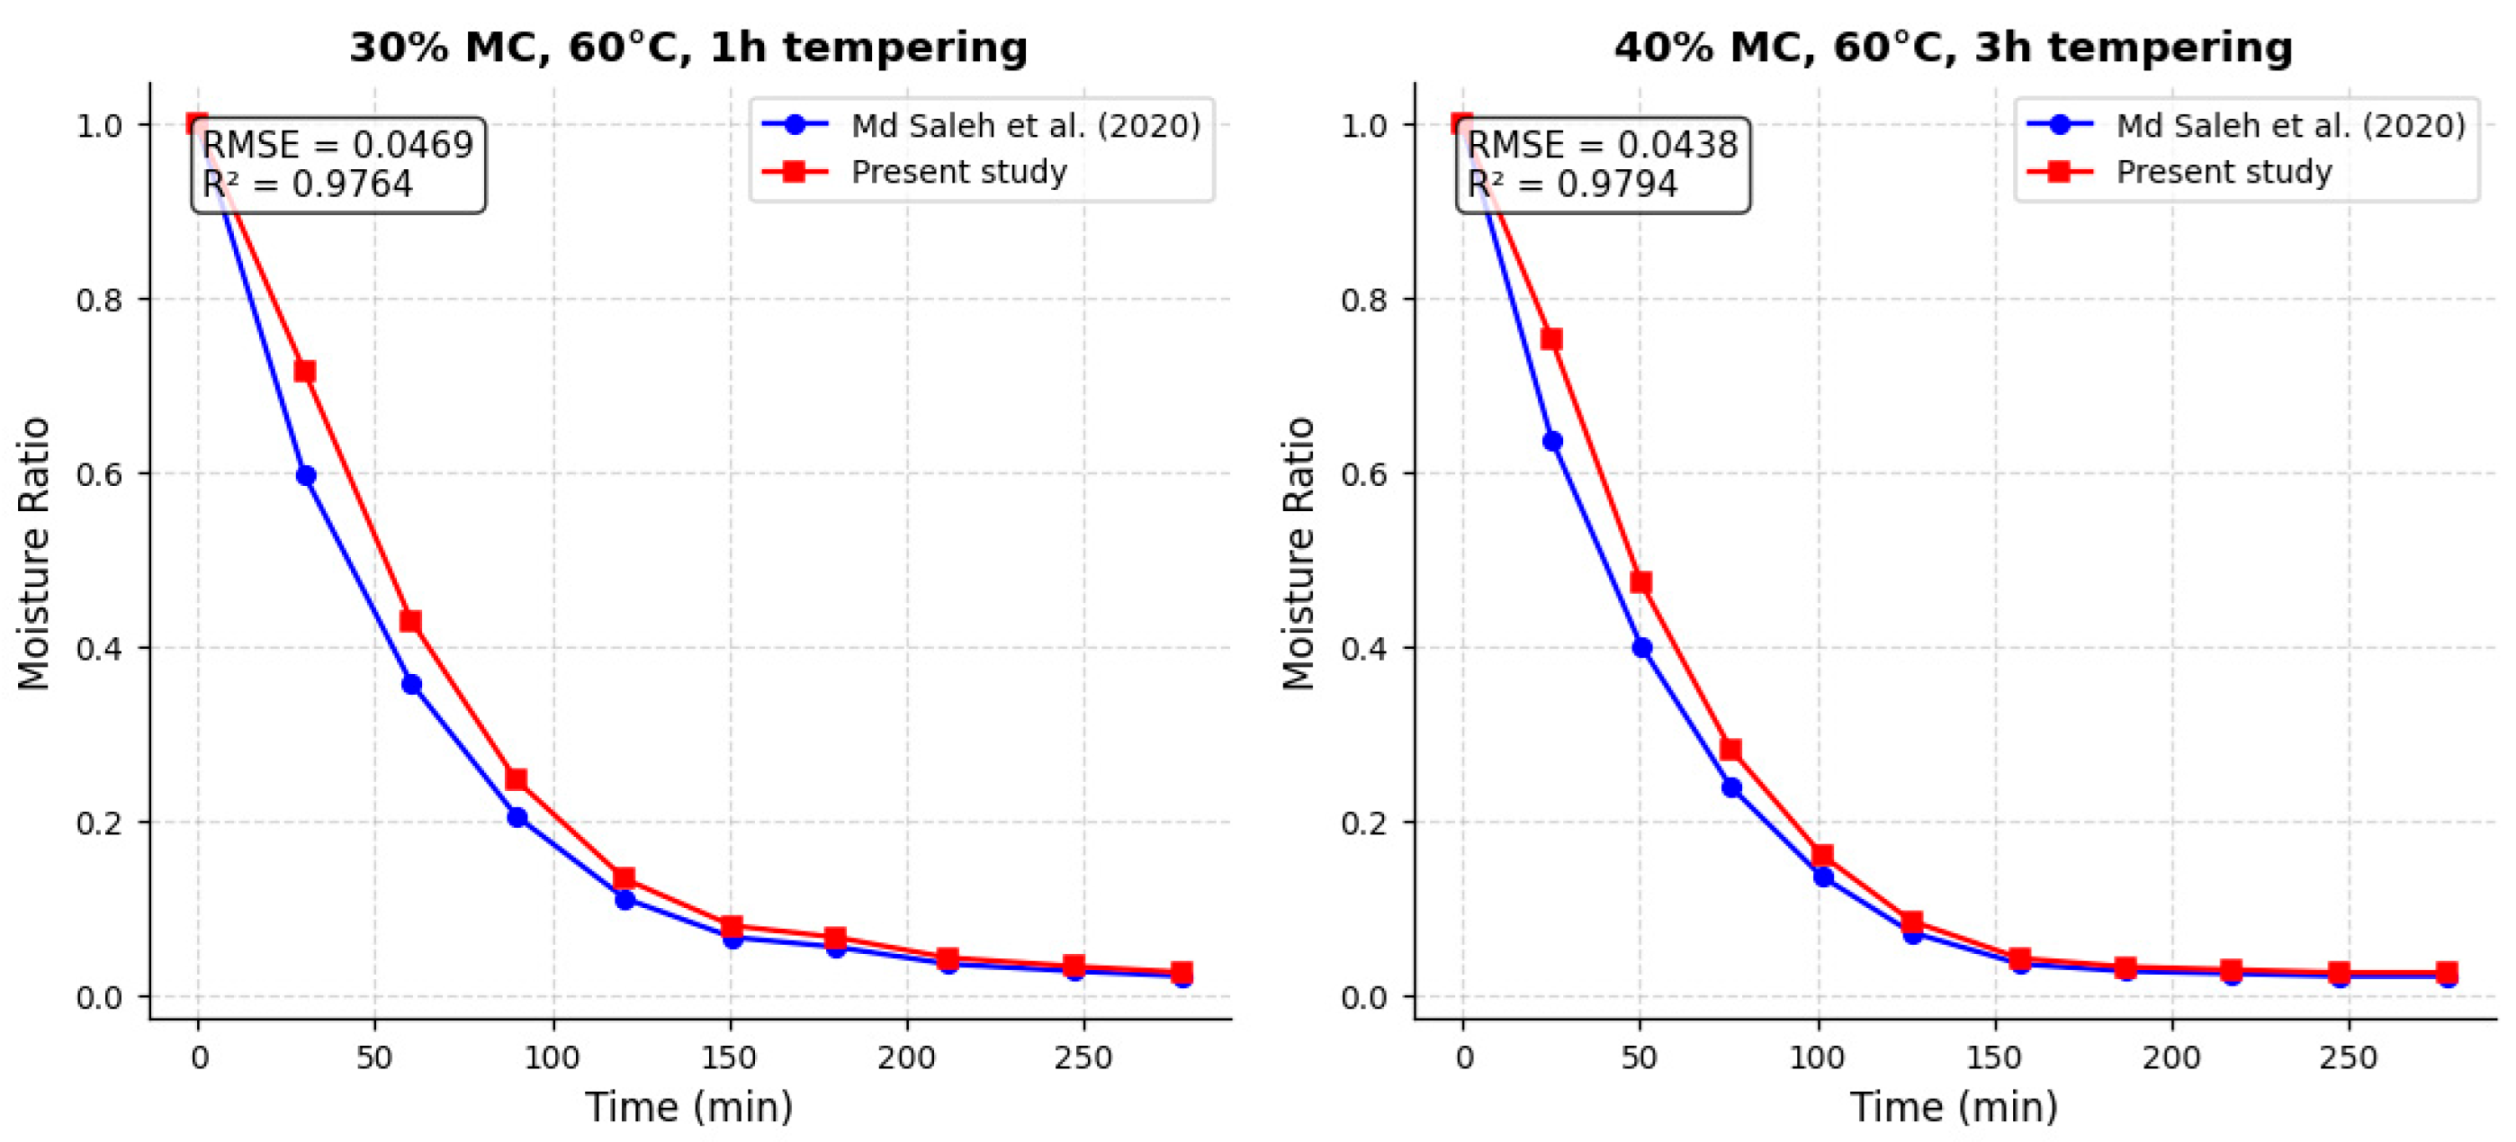
To evaluate the model’s capability under transient thermal conditions, the simulated moisture ratio was compared with the intermittent drying data of Saleh et al. [43] for carrot slices (Daucus carota var. laguna). In their experiments, carrot slices of 2.5 cm diameter and 3.5 mm thickness were dried at a constant air temperature of 60 °C and a velocity of 0.6 m/s. The drying process was paused when the sample reached a moisture content of either 30% or 40% (wet basis), followed by a tempering period under ambient conditions (28 ± 3 °C, 40 ± 3% RH) for 1 h or 3 h. Two representative protocols were simulated, namely 30% MC with 1 h tempering and 40% MC with 3 h tempering. As shown in Figure 5, the simulated moisture ratio curves closely match the experimental data across all three cases. The Root Mean Square Error (RMSE) values are 0.0469 and 0.0438, and the coefficients of determination (R2) are 0.9764 and 0.9794, respectively. These statistics confirm that the LBM–Weibull framework accurately captures the drying kinetics of carrot slices under non-isothermal, intermittent conditions, supporting its use for evaluating more complex periodic and intermittent drying strategies.
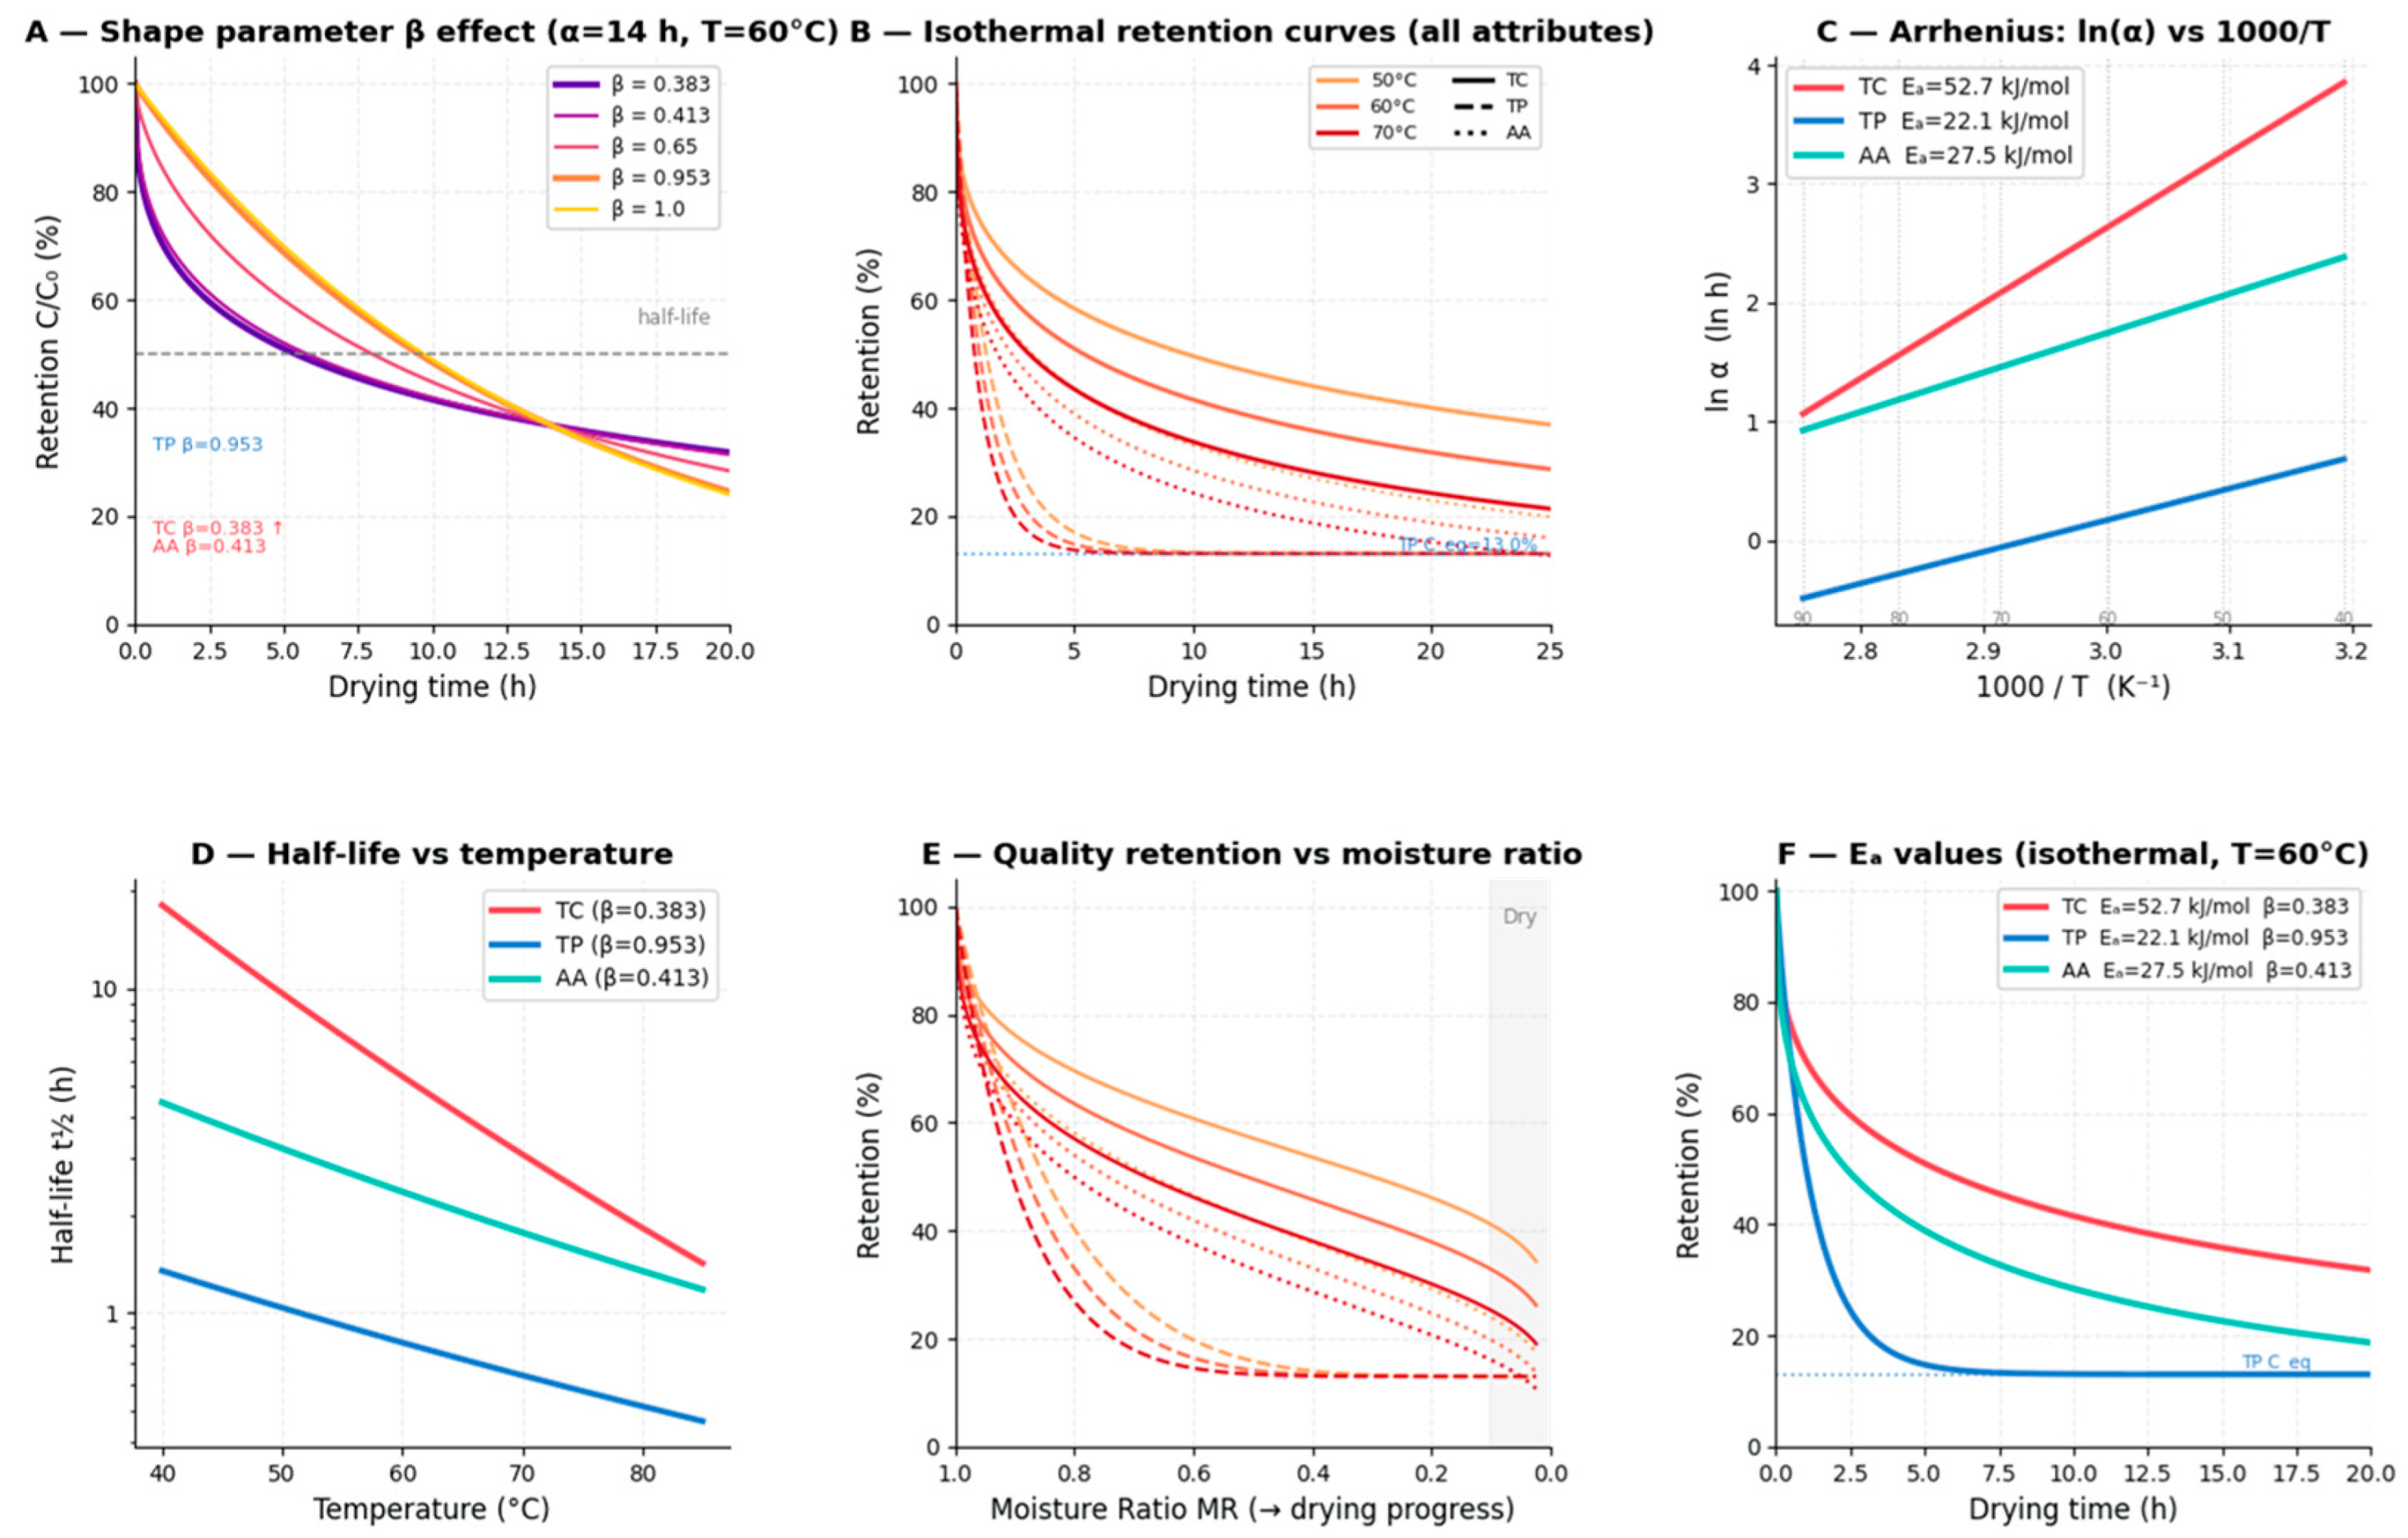
Figure 6 quantitatively demonstrates that quality degradation follows temperature-dependent Weibull kinetics with attribute-specific sensitivity. Decreasing β from 1.0 to 0.383 shifts the curve from near-exponential decay to strongly concave behavior, producing faster early-stage losses; for example, retention falls below 50% within ~5 h for β ≈ 0.38–0.41, whereas β ≈ 1 maintains higher retention over the same period. β determines the form of the degradation curve and reflects the underlying reaction mechanism. Values β indicate a decelerating degradation rate, where the most rapid loss occurs initially and then slows down, typical of systems with diffusion-limited kinetics or multiple parallel pathways that are rapidly depleted. For total carotenoids ( β = 0.383 ) and antioxidant activity β = 0.413 ), this low β corresponds to a sharp early decline followed by gradual approach to a plateau, consistent with the fast thermal degradation of these compounds at the product surface during the initial drying stage. A value β (total polyphenols, β = 0.953 ) implies near-first-order kinetics, where the degradation rate is proportional to the remaining concentration, characteristic of single-step thermally induced reactions. No attribute in this study exhibits β which would indicate an accelerating (e.g., autocatalytic) behavior. These β values, taken from the experimental work of Eim et al. [34], capture the distinct degradation behavior of each quality attribute under isothermal conditions and are essential for accurate prediction under time-varying temperature profiles. The figure also shows clear thermal acceleration: at 70 °C retention drops to ~20–30% within 10 h, while at 50 °C values remain above 40–50% over the same duration. Arrhenius behavior is confirmed with distinct activation energies: TC (Ea ≈ 52.7 kJ mol−1) exhibit the steepest ln(α)-1000/T slope, followed by AA (27.5 kJ mol−1) and TP (22.1 kJ mol−1), indicating TC are the most temperature sensitive. The figure quantifies this effect: the TC half-life decreases from ~15 h at 40 °C to ~1.5 h at 85 °C, whereas TP decline more moderately (from 1.2 h to 0.5 h). The most degradation occurs at high moisture ratios (MR > 0.8), confirming dominant early-stage quality loss. E α values consolidates these trends at 60 °C: TP degrade fastest initially (steep early drop), while TC retain higher levels over time despite their higher E a . Collectively, the data indicate that β governs degradation shape, E α governs temperature sensitivity, and the majority of quality loss occurs in the early drying period under elevated temperatures.
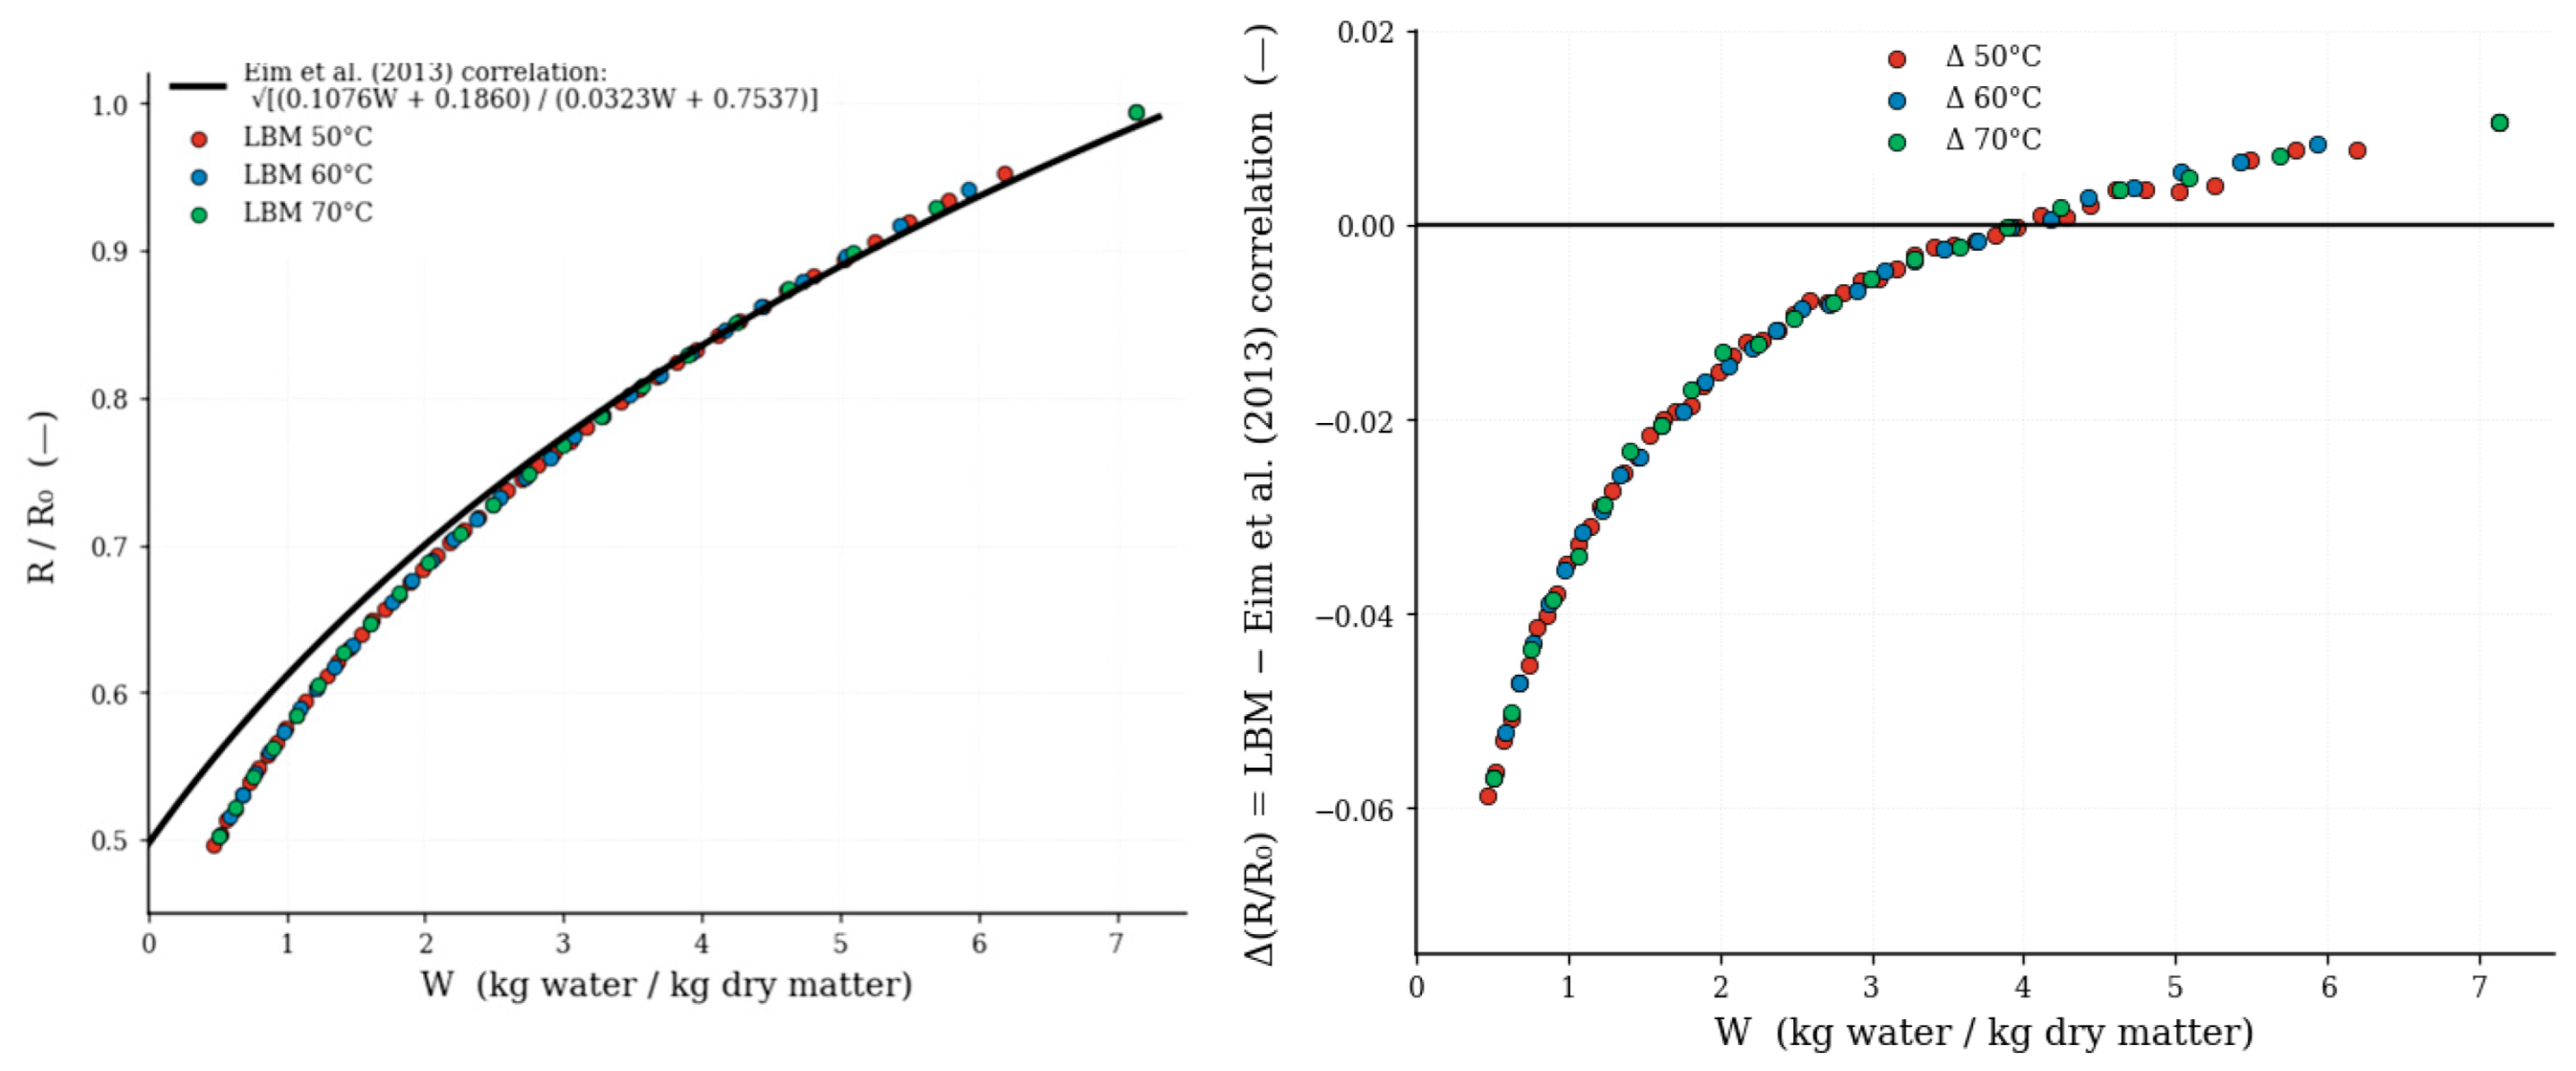
As shown, in Figure 7, across all three drying temperatures (50, 60, and 70 °C), the deviation in radius shrinkage ratio Δ evolution exhibits a clear temperature independence: at any given moisture content X , the discrepancy between the simulation and the reference remains nearly identical regardless of temperature. In each case, the crossover from positive to negative Δ consistently occurs at X 3 4   k g / k g   D M , and the final divergence converges to Δ ≈ −0.057 ± 0.001 at the end of drying. This uniform behavior strongly indicates that the deviation is governed primarily by moisture level rather than by temperature-induced moisture gradients or thermal effects. More importantly, at 60 °C, the LBM simulation yielded a final radius ratio of R/R0 = 0.496 when dried to a moisture content of approximately 0.5 kg·kg−1 DM (MR < 0.06). Li et al. [44] reported shrinkage ratios of 0.461, 0.453, and 0.449 at 40, 60, and 80 °C, respectively, for carrot samples dried to a final moisture content of 0.5 kg·kg−1 DM. The slightly higher value in the simulation is consistent with the greater water removal (lower final moisture), confirming that the shrinkage model correctly captures the relationship between moisture loss and volume reduction. More importantly, the observed systematic offset in the shrinkage ratio (Δ ≈ −0.057 ± 0.001) indicates that the empirical moisture–radius relationship slightly underestimates the actual contraction of the sample. Because shrinkage directly affects the characteristic diffusion length, this discrepancy may influence the predicted transport dynamics. A smaller simulated shrinkage (i.e., a larger effective radius) increases internal diffusion distances, which could lead to a slight underestimation of moisture removal rates during the falling-rate period, and consequently a marginal overprediction of drying time. Similarly, the extended transport path may reduce internal moisture gradients, potentially smoothing spatial heterogeneities compared to a fully accurate shrinkage representation. In terms of thermal behavior, the impact is expected to be limited due to the thermally thin assumption (Bi ≪ 1), which constrains temperature gradients inside the sample. Regarding quality prediction, since degradation kinetics are formulated using the volume-averaged temperature, the indirect effect of shrinkage mismatch is primarily mediated through its influence on drying time rather than local temperature fields. Given that the shrinkage deviation remains nearly constant across moisture levels and temperatures, its impact is systematic rather than scenario-dependent, and therefore does not alter the relative comparison between drying strategies, which is the primary objective of this study. Nonetheless, these findings highlight the importance of developing coupled moisture–temperature–structure models to improve predictive accuracy in future work.
Table 3 presents a comparison of quality retention results obtained from the LBM simulations with the experimental measurements reported by Eim et al. [34], specifically at a final moisture content of X e q = 0.5   k g · k g 1   D M . Both LBM results and the reference study converge on the same fundamental qualitative behavior: total carotenoids (TC), which exhibit a high activation energy ( E α = 52.7   k J / m o l ), are primarily sensitive to temperature. This explains why TC retention in the simulation shows only slight changes across 50, 60, and 70 °C, with values of 55.6%, 56.6%, and 56.1%, respectively, reflecting the trade-off between thermal degradation and reduced drying time; in contrast, total phenolics (TP) and antioxidant activity (AA) are predominantly time-dependent, so higher temperatures enhance their retention by shortening exposure duration, as confirmed by the monotonic TP increase from 13.4% to 14.7% and then 16.3% and similar AA behavior, in good agreement with the trends reported in the literature; consequently, both approaches identify an optimal operating window around 55–60 °C, with the simulated 60 °C case (TC = 56.6%, TP = 14.7%, AA = 39.9%) closely matching the reported global optimum at 57.7 °C (TC = 51.2%, TP = 14.4%, AA = 38.1%), the slight TC overprediction being attributable to differences in effective diffusivity and geometry assumptions, while overall the model captures the main physical behavior and kinetic tendencies observed experimentally and kinetic trends with good quantitative agreement. However, it should be noted that this agreement is based on literature-derived kinetic parameters and therefore reflects consistency with reported behavior rather than independent experimental validation under identical transient conditions.

3.2. Assessment of Drying Conditions and Temperature Cycling

To systematically investigate how intermittent drying compares with conventional constant drying, a set of simulation cases was designed as summarized in Table 4. All simulations employed a 400 × 400 grid with a physical domain size of four times the initial carrot slice radius, providing sufficient spatial resolution to capture the main trends of moisture and temperature gradients. Each case was simulated for a maximum of 24 h or until the moisture ratio dropped below 0.005, with snapshots of moisture, temperature, and product quality fields saved at selected time steps to visualize the drying front, shrinkage evolution, and local retention of bioactive compounds such as carotenoids, polyphenols, and antioxidant activity. Energy metrics—including total heat input, latent heat of evaporation, sensible heat change, and thermal efficiency—were recorded for each run. The baseline case (Case A) used constant air temperature (60 °C) and served as the reference drying curve, energy consumption, and product quality against which all intermittent strategies are compared. Cases B and C introduced sinusoidal temperature oscillations around a 60 °C mean, with fast (2 h) and slow (8 h) periods, respectively, isolating the impact of oscillation frequency on drying kinetics, energy efficiency, internal moisture uniformity, and spatial quality retention. Case D extended this concept by employing a higher amplitude oscillation (50–70 °C) with a fast period, examining the effects of stronger fluctuations that deviate substantially from the mean temperature. Case E represented a mixed drying strategy that began with a constant temperature period (60 °C for 2 h) before transitioning to high-amplitude periodic cycling, simulating a two-stage industrial process. Finally, Cases F and G implemented a stepwise ON/OFF temperature profile, presenting practical industrial temperature regulation where rapid switching between fixed set points is common. For all periodic cases, the average air temperature matched the baseline of 60 °C (except where noted for mixed and stepwise profiles), ensuring that any observed differences in drying performance or quality retention were attributable to the intermittent nature of the forcing rather than shifts in mean driving forces. Air velocity was maintained constant at 1.0 m/s across all cases to isolate temperature effects. Key outputs—including moisture ratio, drying rate, cumulative heat input, latent and sensible energy contributions, thermal efficiency, local and overall quality retention, and shrinkage history—were analyzed across all cases to evaluate the potential benefits and limitations of intermittent drying strategies for carrot slices, guiding the identification of optimal operating conditions for energy efficiency and product quality.
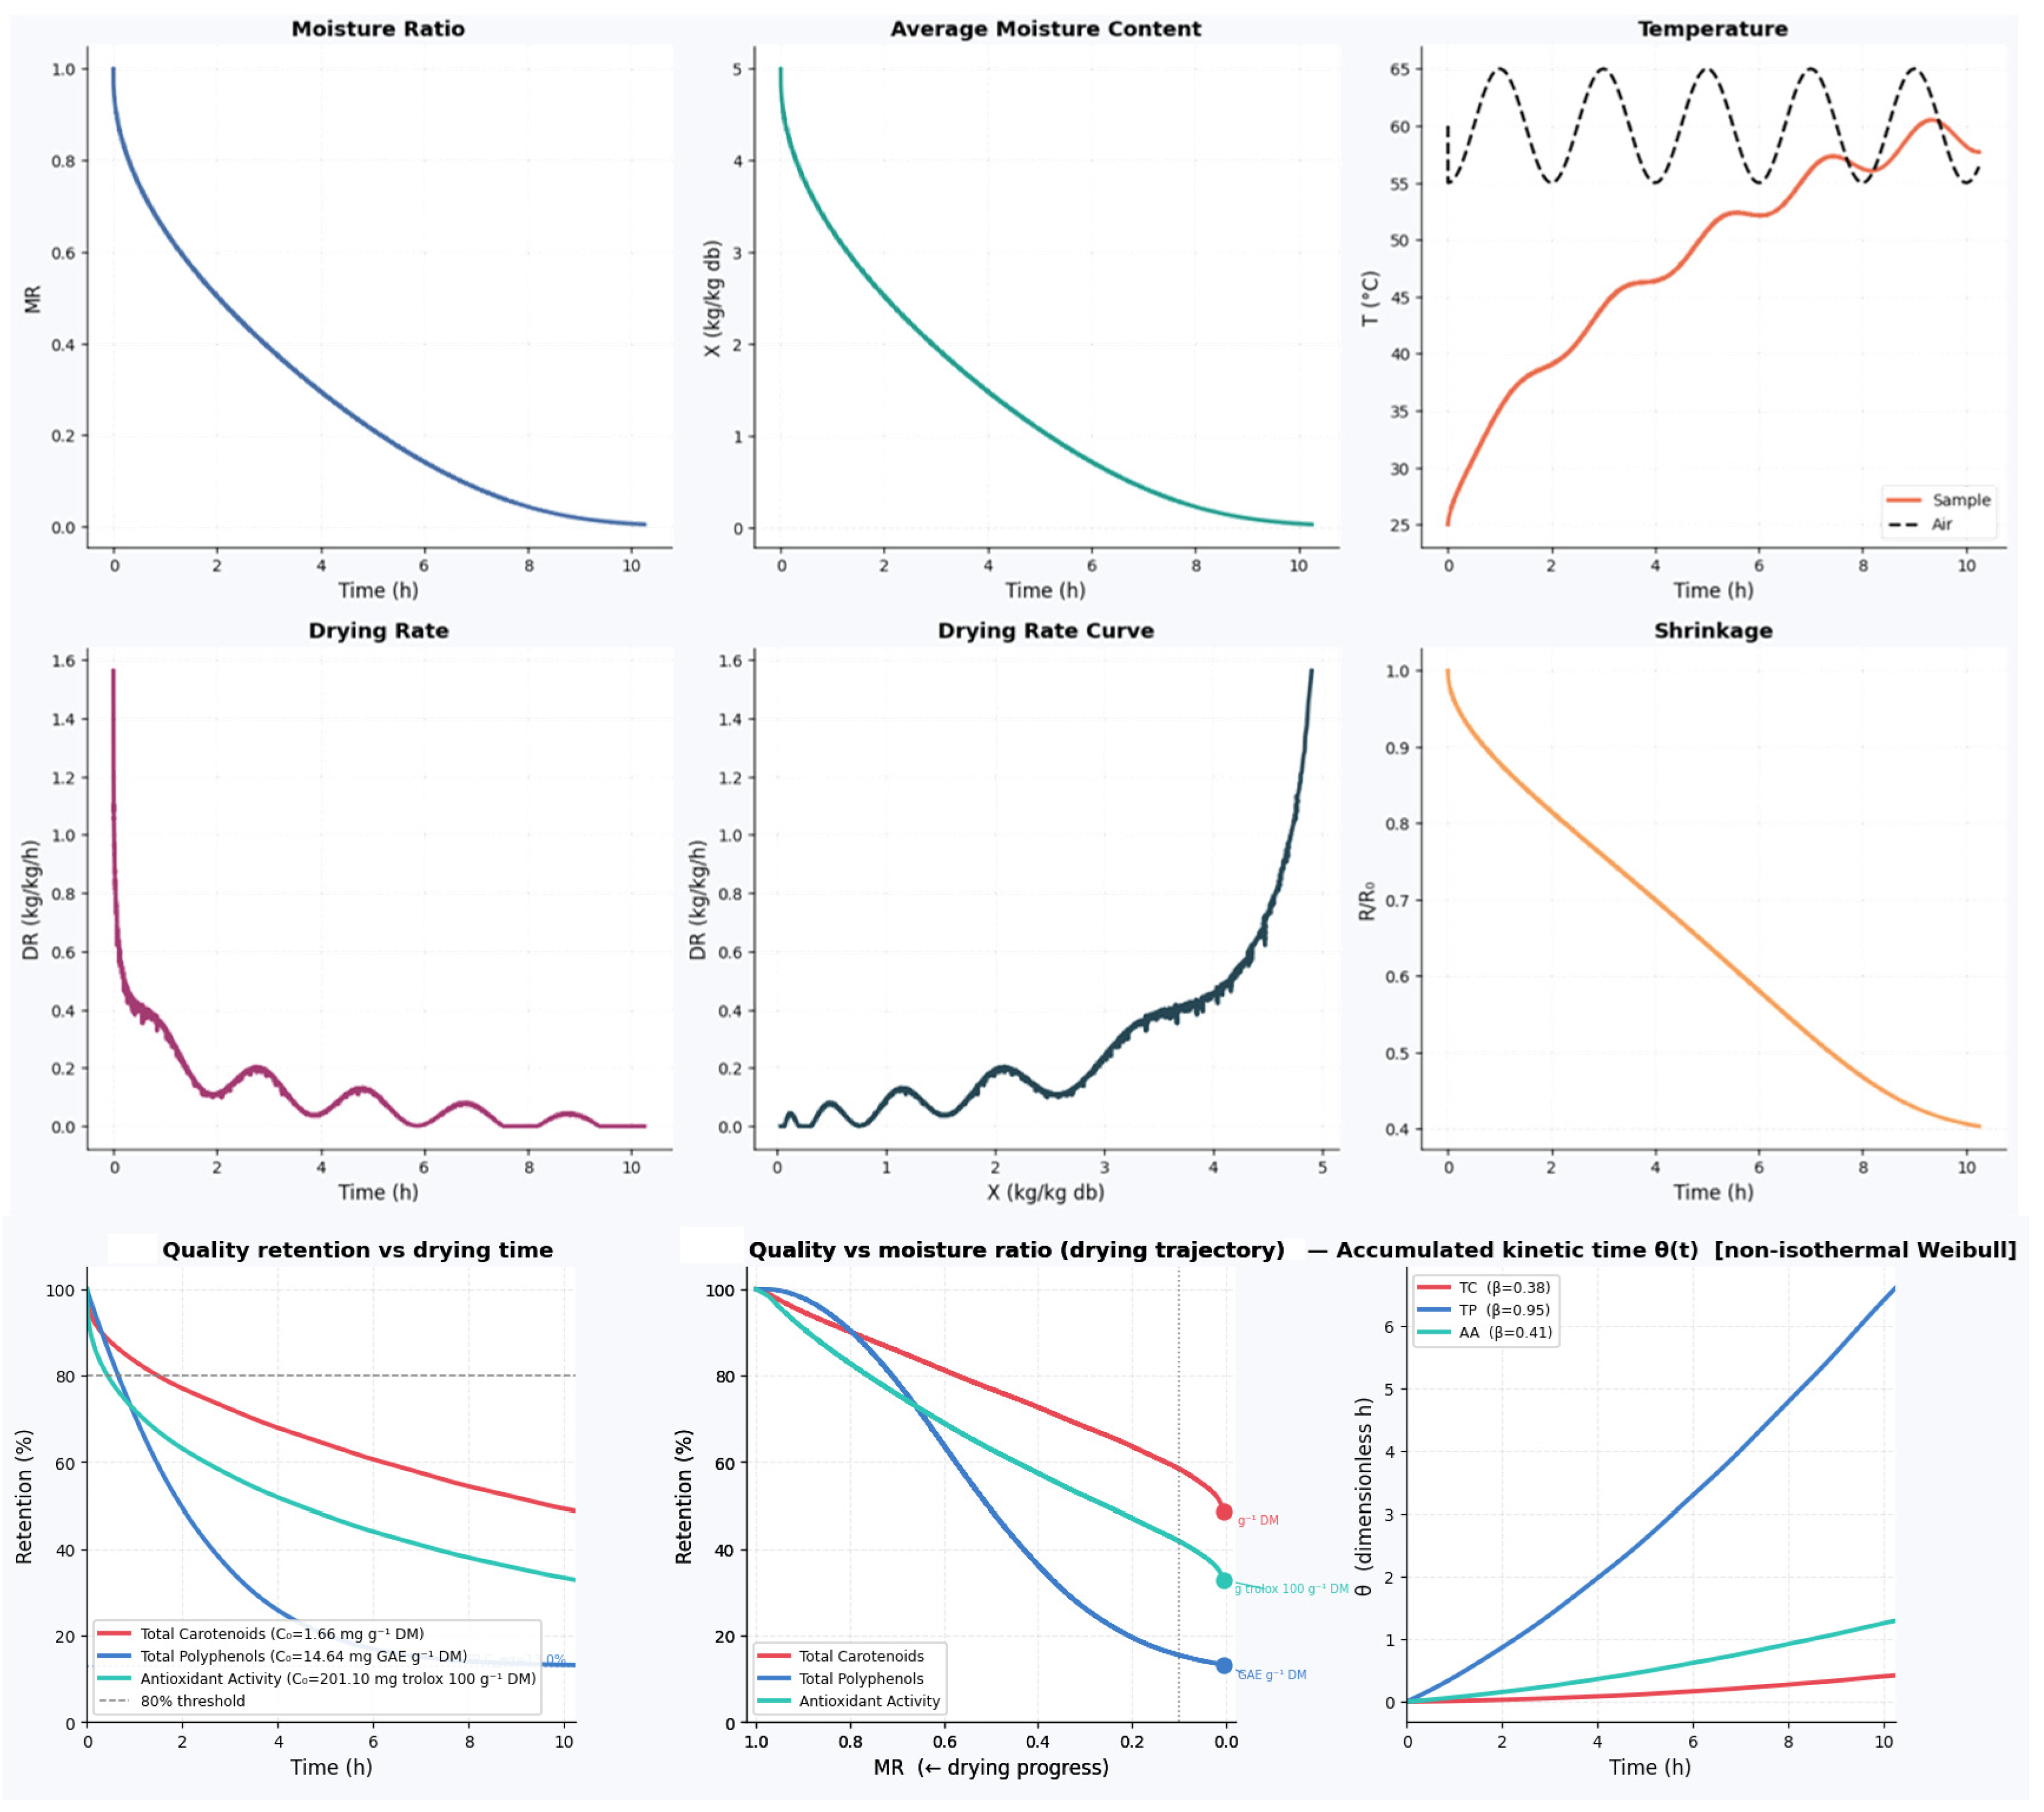
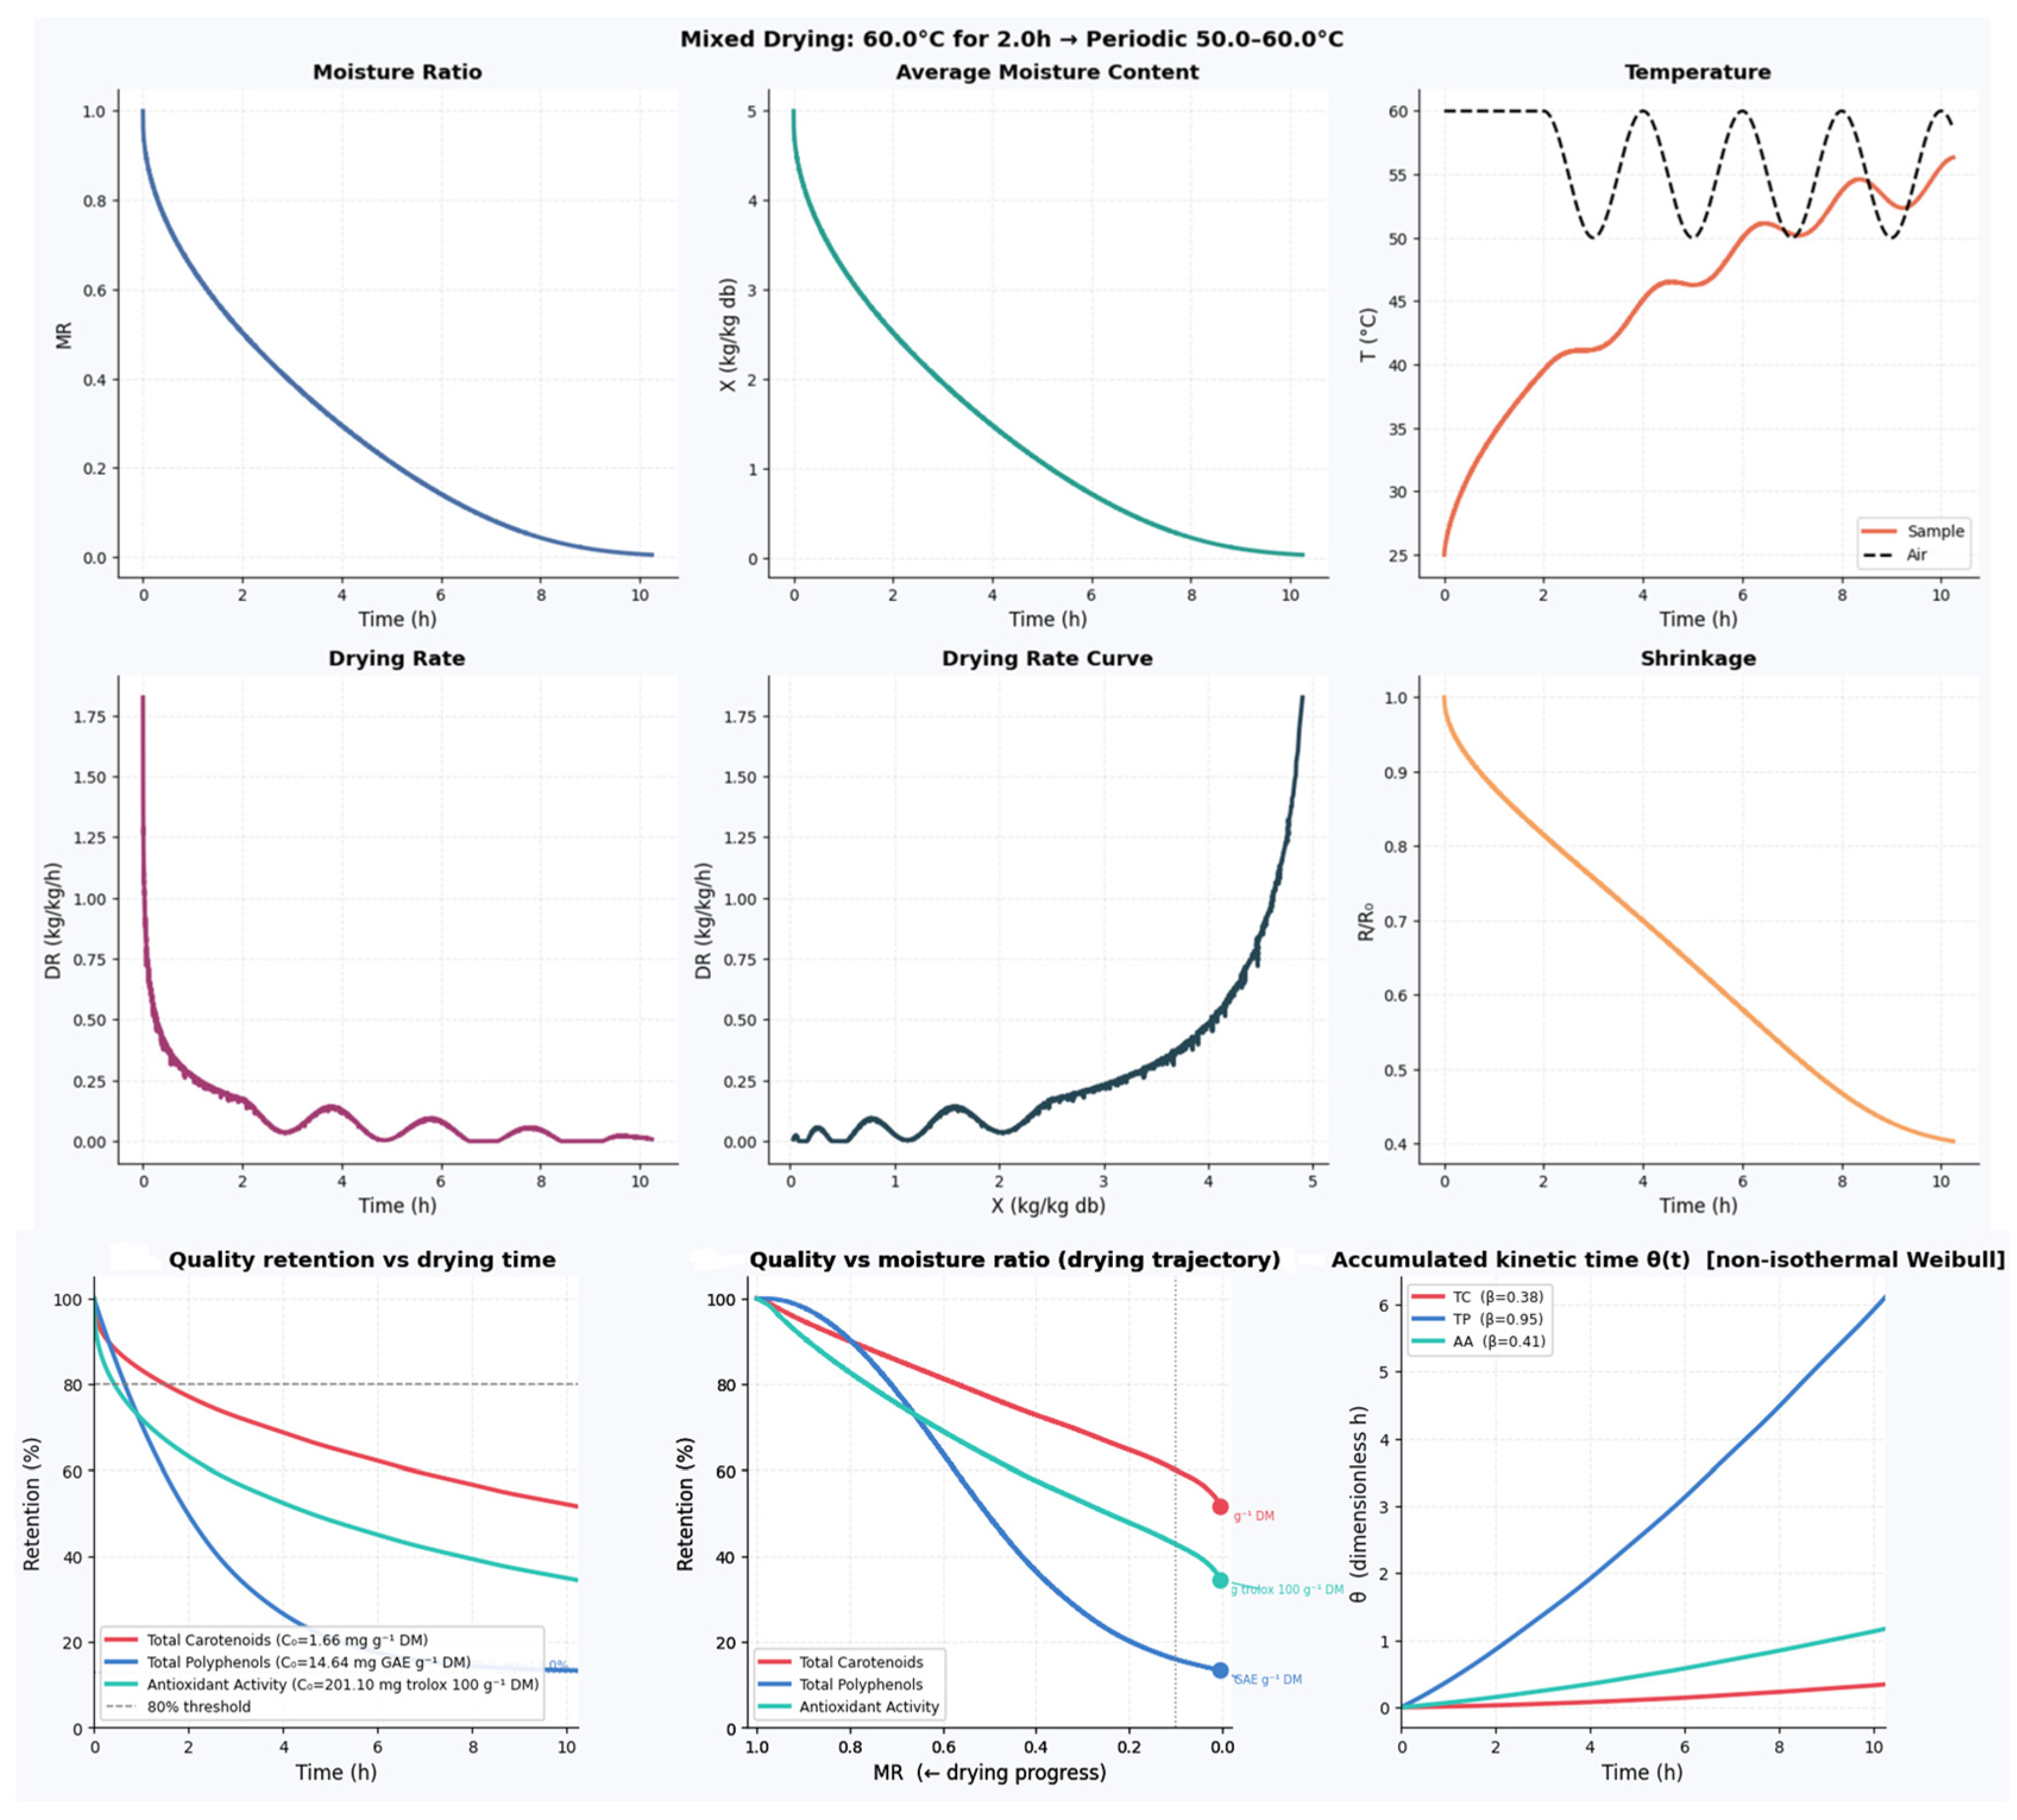
Figure 8 illustrates the drying behavior of the carrot slice under fast periodic temperature operation (Case B). Moisture ratio and average moisture content exhibit nearly identical declining trends, decreasing from initial values toward the target moisture ratio of 0.005. The curves show subtle inflections corresponding to each temperature cycle, where accelerated moisture removal occurs during 65 °C peaks, followed by slight deceleration during 55 °C troughs. The fast cycling frequency (2 h) prevents complete moisture equilibration between cycles, resulting in a generally smooth overall drying curve with superimposed periodic perturbations. Drying rate versus time reveals the most distinctive signature of fast periodic drying. The drying rate oscillates between approximately 0.08–0.12 kg/kg/h during peak temperature periods and 0.04–0.06 kg/kg/h during troughs, creating a regular waveform pattern.
These oscillations gradually dampen as the material enters the falling rate regime and internal diffusion becomes rate-limiting, reducing the system’s sensitivity to surface boundary condition variations. The drying rate curve, plotting drying rate against moisture content, provides critical insight into the drying mechanism. The curve exhibits a characteristic looping pattern rather than a smooth falling rate line. Each temperature cycle creates a hysteresis-like trajectory: during the heating phase, drying rate increases at nearly constant moisture content; during cooling, the rate decreases before significant moisture change occurs. This behavior suggests that fast periodic drying repeatedly shifts the material between different points on the characteristic drying curve, limiting the establishment of a single rate–moisture relationship and potentially improving internal moisture redistribution during low-temperature periods. The shrinkage evolution shows the normalized radius (R/R0) decreasing from 1.0 to approximately 0.406 over 10.25 h. The shrinkage curve closely follows the moisture content trend but with reduced sensitivity to temperature oscillations, indicating that structural changes respond to cumulative moisture loss rather than instantaneous thermal conditions. The relatively smooth shrinkage profile suggests that cell wall deformation and tissue collapse proceed irreversibly despite cyclic thermal forcing. Collectively, these six panels show that fast periodic drying (2 h cycles) creates distinct temporal patterns in all transport phenomena: temperature drives periodic acceleration and deceleration of drying rates, moisture content responds with damped oscillations, shrinkage proceeds monotonically, and the drying rate curve reveals complex rate–moisture trajectories not observed in constant drying. Overall, the fast cycling frequency maintains the average driving force while periodically relaxing temperature gradients, potentially allowing internal moisture redistribution during each low-temperature phase—a key mechanism for improving moisture uniformity in heat-sensitive materials like carrot slices.
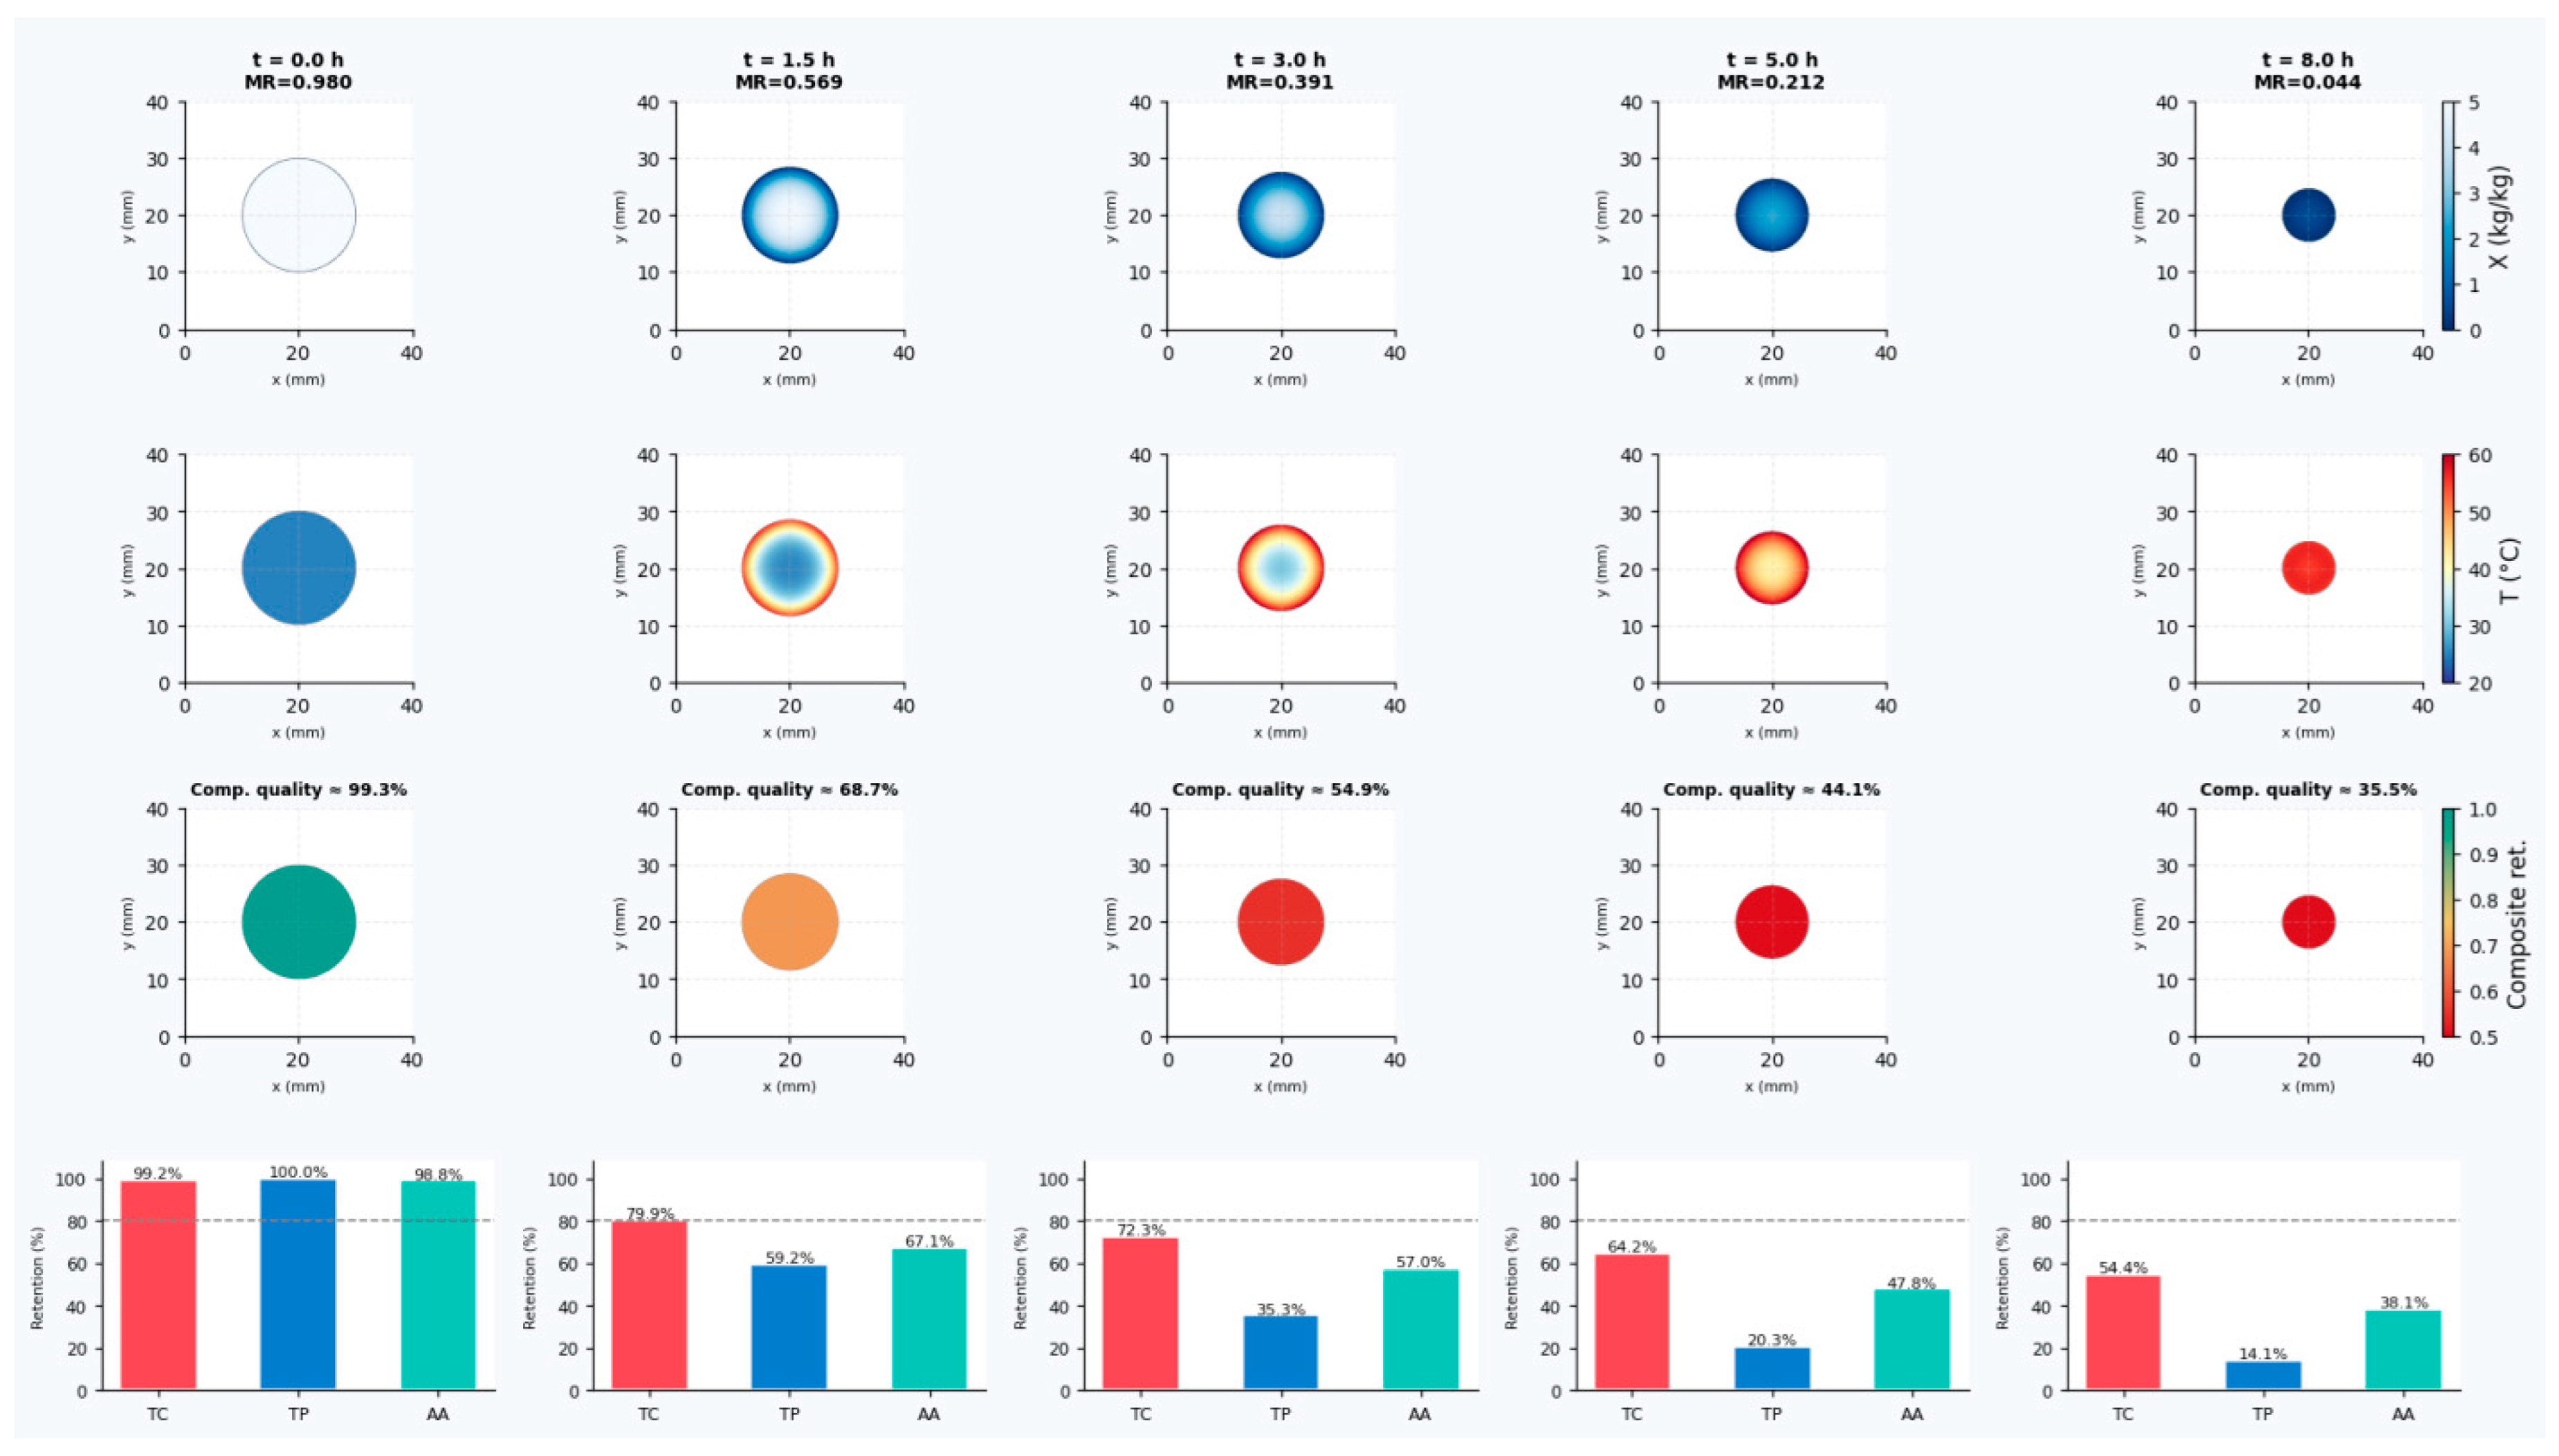
Figure 9 presents the spatial and temporal evolution of moisture content, temperature field, and quality degradation within a carrot slice subjected to fast periodic drying. As drying proceeds to t = 1.5 h (MR = 0.569) under fast periodic temperature cycling, significant moisture removal occurs and a pronounced radial moisture gradient develops, where the surface layers dry faster while the core retains higher moisture content. At the same time, the temperature field exhibits a clear gradient, with the outer region approaching the periodically varying hot air temperature (around 60 °C on average) while the center remains cooler due to evaporative cooling and limited internal heat transfer. These coupled heat and mass transfer effects initiate quality degradation, reducing the composite quality to 68.7%. Among the quality indicators, TP show the fastest degradation (59.2%), whereas TC (79.9%) and AA (67.1%) indicate relatively greater resistance. At t = 3 h (MR = 0.391), the internal moisture gradient remains visible but becomes less pronounced as diffusion progressively redistributes moisture within the material. The temperature distribution becomes more uniform, reflecting the increasing influence of internal heat conduction despite the external periodic temperature fluctuations. However, continued exposure to elevated temperatures leads to further chemical degradation of sensitive compounds. Consequently, the composite quality decreases to 54.9%, with TC, TP, and AA retentions reaching 72.3%, 35.3%, and 57.0%, respectively, again highlighting the high sensitivity of phenolic compounds to thermal processing. By t = 5 h (MR = 0.212), most of the removable moisture has already been extracted. The temperature field becomes nearly uniform across the sample, approaching the periodically varying drying air temperature, while the moisture field becomes more homogeneous at lower levels. At this stage, drying is mainly governed by the internal diffusion of bound moisture. Despite the progressive moisture reduction, the cumulative thermal exposure during periodic heating significantly impacts product quality. The composite quality declines to 44.1%, with TC, TP, and AA retentions dropping to 64.2%, 20.3%, and 47.8%, respectively. Finally, at t = 8 h (MR = 0.044), the product reaches a very low moisture level, indicating that drying is almost complete. Both the moisture and temperature fields become nearly uniform, reflecting the reduced influence of internal gradients during the final drying stage. Nevertheless, the prolonged exposure to elevated temperatures during repeated heating cycles results in substantial degradation of bioactive compounds. The final composite quality decreases to 35.5%, with individual retentions of 54.4% for TC, 14.1% for TP, and 38.1% for AA, confirming that phenolic compounds experience the most severe degradation, whereas carotenoids remain the most thermally stable among the considered quality attributes. Overall, the figure demonstrates the strong coupling between periodic thermal conditions, internal heat and mass transfer, and quality degradation, showing that although fast periodic drying effectively removes moisture, cumulative thermal exposure still significantly affects product quality.
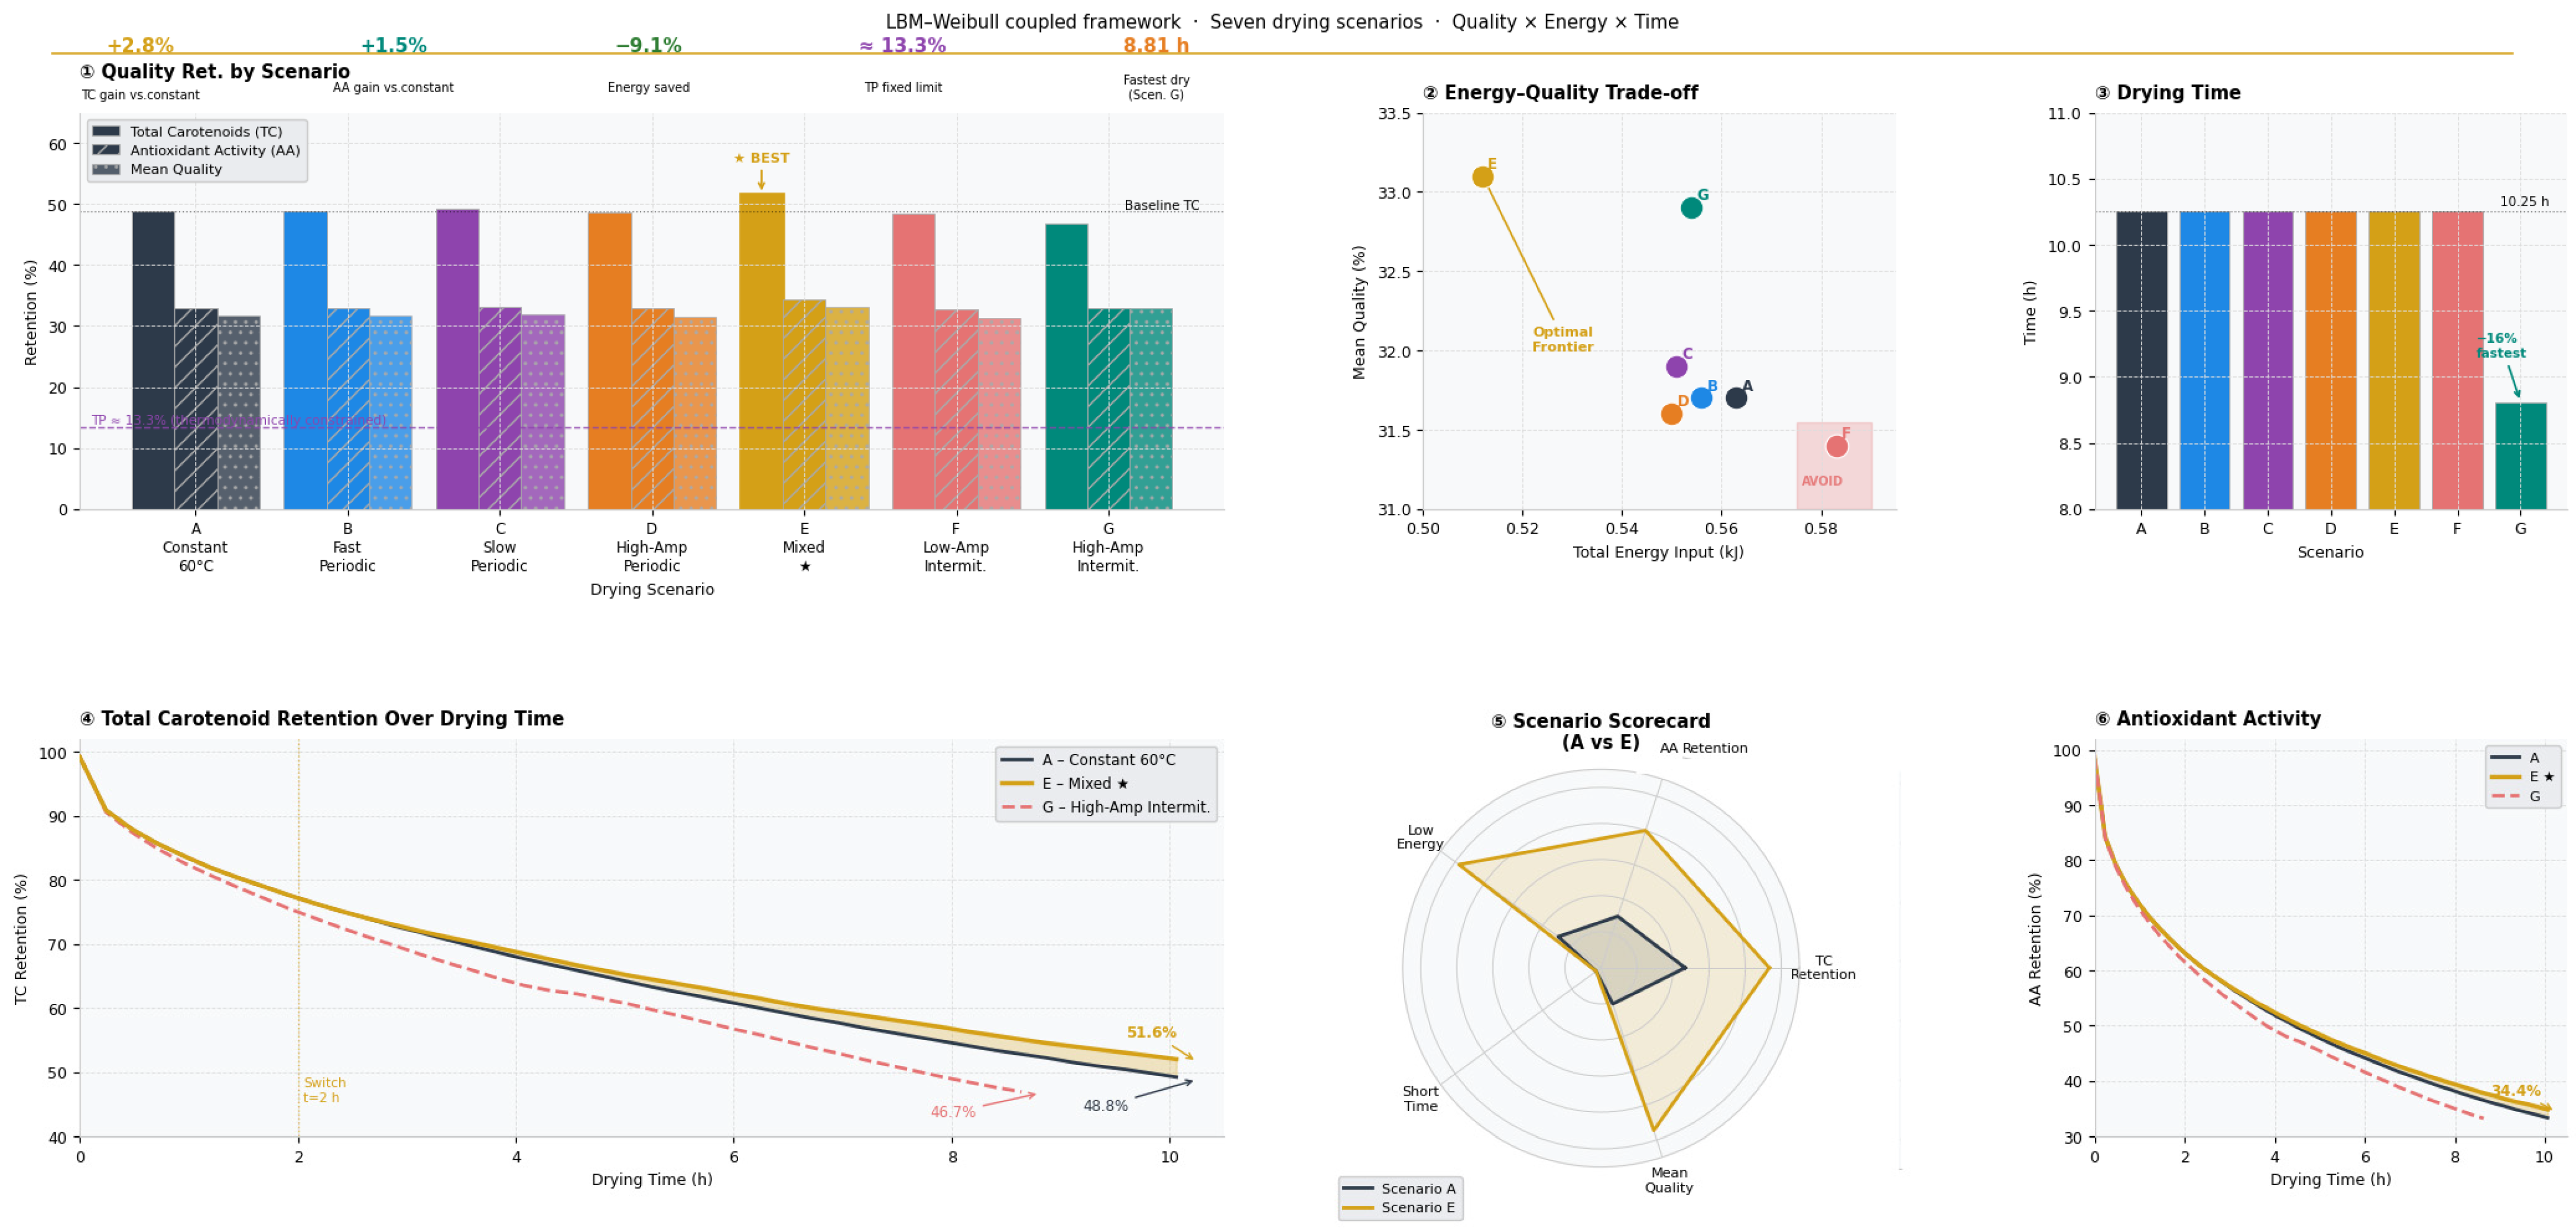
As shown in Table 5, the comparative evaluation of the seven drying scenarios (A–G) reveals distinct differences in how temperature profiles affect the retention of bioactive compounds in the dried product. While total polyphenols (TP) exhibit remarkable consistency across all strategies—stabilizing at approximately 13.3% of the initial value with a half-life of 0.8 h in most cases—the behavior of total carotenoids (TC) and antioxidant activity (AA) varies significantly depending on the thermal history imposed. The mixed drying strategy (Scenario E) emerges as the best-performing case within the investigated scenarios. This profile, which combines an initial two-hour constant phase at 60 °C followed by high-amplitude oscillations between 50 and 70 °C, achieves the highest retention across all quality indicators. TC reach 51.6% (0.856 mg g−1 DM), the highest among all scenarios, while AA attains 34.4% (69.21 mg Trolox 100 g−1 DM), also the top value. Even TP retention is marginally higher at 13.4%. The resulting mean quality of 33.1% suggests that this hybrid approach effectively balances rapid initial moisture removal with reduced thermal stress during the later stages of drying, when the product is more vulnerable to degradation. At the opposite extreme, the high-amplitude intermittent strategy (Scenario G)—cycling between 70 °C ON and 25 °C OFF—produces the worst preservation of carotenoids, with TC dropping to just 46.7% (0.775 mg g−1 DM). This poor performance is consistent with its shorter half-life for TC (4.1 h) compared to the 5.4 h observed in all other 60-based scenarios. The severe 70 °C peaks during the ON phase apparently cause immediate and irreversible damage to carotenoids, and the cooling periods at 25 °C cannot reverse this loss. Interestingly, AA retention in Scenario G (32.9%) remains comparable to the baseline, and its half-life for AA (2.0 h) is only slightly shorter than the 2.4 h seen elsewhere, suggesting that antioxidant compounds are somewhat less sensitive than carotenoids to these extreme temperature spikes, though still adversely affected. The low-amplitude intermittent strategy (Scenario F), cycling between 65 °C ON and 55 °C OFF, performs the poorest among the more moderate profiles. It yields the lowest AA retention at 32.7% (65.70 mg Trolox 100 g−1 DM) and the second-lowest TC retention at 48.4% (0.803 mg g−1 DM), resulting in the lowest mean quality of 31.4%. This indicates that even mild intermittent heating, without a sufficiently cool resting phase, offers no advantage over constant-temperature drying and may even accelerate quality losses. Among the periodic oscillation profiles, the slow periodic strategy (Scenario C, 8 h cycle) performs slightly better than the fast periodic (Scenario B, 2 h cycle) and Periodic-T wide (Scenario D) alternatives. Scenario C achieves a TC retention of 49.3% (0.818 mg g−1 DM) and an AA retention of 33.1% (66.63 mg Trolox 100 g−1 DM), yielding a mean quality of 31.9%. This modest improvement suggests that longer, gentler temperature cycles may provide some protective effect by reducing the frequency of high-temperature exposure, though the benefit is small compared to the mixed strategy. The Constant 60 °C baseline (Scenario A) and its close variants (B and D) all cluster tightly around a TC retention of 48.7–48.8%, an AA retention of 32.9%, and a mean quality of 31.6–31.7%, confirming that simple periodic oscillations without an initial constant phase do not substantially alter the degradation dynamics. Overall, the data clearly demonstrate that while polyphenol losses are thermodynamically constrained and largely unavoidable at these temperature ranges, carotenoid and antioxidant retention can be optimized through strategic temperature management. The mixed drying strategy (Scenario E) provides improved protection by combining an initial constant-temperature drying phase with subsequent oscillations, effectively navigating the trade-off between drying efficiency and quality preservation. Conversely, intermittent strategies with high peak temperatures (Scenario G) or inadequately cool resting phases (Scenario F) may be less favorable under the conditions considered, as they accelerate degradation without compensating benefits. While Kowalski et al. [45] demonstrated that non-stationary drying with short periods can preserve quality, the present study refines this understanding by showing that oscillation frequency is critical: low-frequency cycles (e.g., Scenario C) and high-amplitude intermittent profiles (Scenario G) actually accelerate the degradation of heat-sensitive compounds. This arises from a previously unrecognized coupling between temperature history and the moisture-dependent vulnerability of the product, whereby thermal exposure during critical low-moisture stages becomes disproportionately damaging. These findings suggest design considerations for periodic drying schedules that optimize both energy efficiency and quality retention.
The energy analysis in Table 6 reveals important trade-offs between drying time, total energy input, and the resulting product quality. Across most scenarios, the drying time remains constant at 10.25 h, with the notable exception of Scenario G, which completes drying in 8.81 h—a reduction of approximately 1.5 h. This accelerated drying in Scenario G is achieved through its aggressive high-amplitude intermittent profile (70 °C ON/25 °C OFF), which, despite the extended cooling periods, apparently drives faster moisture removal during the high-temperature phases. However, this time saving comes at the cost of carotenoid degradation, as previously noted. Examining the energy components, the total energy input ( Q i n ) consists primarily of latent heat for evaporation ( Q e v ), with a minor contribution from sensible heating ( Q s e n ). The evaporation energy ( Q e v ) ranges from a low of 0.485 kJ in Scenario E to a high of 0.553 kJ in Scenario F, reflecting differences in how efficiently each temperature profile utilizes thermal energy for moisture removal. Notably, Scenario E—the mixed strategy—requires the lowest total energy input at just 0.512 kJ, while simultaneously achieving the highest mean quality (33.1%). This combination of minimal energy consumption and maximal quality retention makes Scenario E the most efficient among the evaluated cases, as it balances thermal load with product preservation. In contrast, Scenario F (low-amplitude intermittent, 65/55 °C) demands the highest total energy input (0.583 kJ) while delivering the lowest mean quality (31.4%). This unfavorable combination indicates that this particular intermittent profile is thermally inefficient: it consumes more energy yet fails to protect sensitive compounds, likely because the moderate temperature difference between ON and OFF phases (only 10 °C) does not provide sufficient thermal relief to justify the extended processing time. The periodic oscillation scenarios (B, C, and D) all demonstrate slight energy savings compared to the Constant 60 °C baseline (Scenario A, 0.563 kJ). Scenario D (Periodic-T wide) achieves the lowest energy among the periodic group at 0.550 kJ, closely followed by Scenario C at 0.551 kJ. These marginal improvements suggest that oscillating profiles can reduce energy input by approximately 2–3% compared to constant-temperature drying, though the corresponding quality improvements are modest except in the case of Scenario C, where mean quality reaches 31.9%. Scenario G presents an interesting case: despite its shorter drying time (8.81 h), its total energy input (0.554 kJ) is nearly identical to that of Scenario B (0.556 kJ) and only slightly below the constant baseline. This indicates that while the aggressive 70/25 °C profile accelerates drying, it does so without substantial energy savings—the intense heating phases likely consume energy at a higher rate, offsetting the benefit of reduced total drying time. The obtained average quality of 32.9% ranks as the second highest among all cases, indicating that this approach can be considered when shortening the drying time is a priority. However, it still remains inferior to Scenario E in terms of both energy efficiency and product quality. Overall, the energy analysis clearly highlights the advantage of the mixed strategy (Scenario E), which delivers the lowest energy consumption (0.512 kJ) while simultaneously achieving the highest quality (33.1%). This improved performance stems from its optimized sequence: an initial constant phase at 60 °C effectively removes free moisture under low energy demand, followed by controlled temperature oscillations that limit unnecessary thermal exposure during the diffusion-controlled stage. In contrast, Scenario F exhibits the least favorable performance, combining high energy consumption with reduced product quality, thereby demonstrating that intermittent drying strategies are not inherently efficient and must be carefully designed.
When both energy efficiency and quality preservation are considered together, Scenario E emerges as the best-performing approach among the tested scenarios. More importantly, this study provides a validation of the principles observed by Chua et al. [32], while adding quantitative specificity about the conditions under which intermittent drying succeeds or fails. The mixed strategy emerges as a practical embodiment of the ideal described conceptually: it matches heat input to drying kinetics, provides tempering periods for moisture redistribution, limits peak temperatures to safe levels, reduces energy consumption, and delivers superior quality—all without extending drying time.
As shown in Figure 10, using the mixed drying scenario (Scenario E), the drying rate exhibits subtle fluctuations corresponding to the thermal cycles, though the overall downward trend continues. This reflects the transition from the constant-rate period (or early falling-rate period) to the diffusion-limited stage where internal moisture transport becomes rate-controlling. The figure also shows a relatively high rate at high moisture contents, followed by a continuous decline as moisture decreases. There is no extended constant-rate period, indicating that even at high moisture, internal resistance plays a role. The shrinkage ratio decreases progressively to approximately 0.406 by the end of drying, of the same order as that in all scenarios, confirming that the shrinkage is governed primarily by internal diffusion rather than the external temperature pattern. This demonstrates the direct relationship between water removal and structural collapse. The initial 2 h constant phase at 60 °C drives rapid early moisture loss when the product is wettest and most tolerant of heat. The subsequent oscillatory phase between 50 and 60 °C reduces thermal exposure during the critical later stages when internal diffusion limits drying and the concentrated solids become more susceptible to thermal degradation. This balanced approach explains why Scenario E achieves the highest quality retention (TC: 51.6%, AA: 34.4%) while maintaining comparable drying time and even reducing energy consumption ( Q i n = 0.512 kJ), as established in the quantitative analysis.

4. Practical Recommendations and Key Limitations

Figure 11 synthesizes the key insights from the seven drying scenarios studied in this contribution. Periodic drying temperature profiles can meaningfully alter bioactive compound degradation in carrot slices beyond what constant-temperature experiments can predict, owing to the nonlinear Arrhenius response to transient thermal histories. The most important practical finding is that a mixed drying strategy—maintaining 60 °C for the first two hours to rapidly remove free moisture, then transitioning to gentle 50–60 °C oscillations—consistently outperforms all other tested profiles, achieving the highest total carotenoid retention (51.6%) and antioxidant activity (34.4%) while simultaneously requiring the lowest energy input (0.512 kJ), confirming that intelligent thermal sequencing can improve both product quality and energy efficiency without extending drying time. Conversely, two strategies appear less suitable under the investigated conditions: high-amplitude ON/OFF intermittent drying (70 °C/25 °C) causes irreversible carotenoid degradation despite completing drying 1.44 h faster, and low-amplitude intermittent cycling (65 °C/55 °C) delivers the worst mean quality (31.4%) at the highest energy cost (0.583 kJ), proving that not all intermittent strategies are beneficial. Oscillation frequency emerges as a critical but underappreciated design variable—slow cycles (8 h period) offer marginal quality benefits over constant drying, while fast cycles (2 h period) provide no advantage whatsoever. Finally, total polyphenol losses in this study converge to approximately 13.3% retention across all scenarios, a behavior that arises from the adopted Weibull–Arrhenius kinetic parameters, which predict rapid early-stage degradation with limited sensitivity to temperature variations. This suggests that, under the present modeling framework, process optimization has a greater impact on preserving carotenoids and antioxidant activity, although this conclusion may depend on the specific material properties and kinetic parameters considered. Collectively, these findings establish that optimal periodic drying must couple temperature amplitude, oscillation period, and the timing of thermal exposure relative to the moisture content of the product—a design space that constant-temperature experiments alone cannot explore.
The coupled LBM–Weibull framework developed in this study successfully captures the main physical behavior and kinetic trends of quality degradation across multiple temperature scenarios. However, critical examination of the results reveals several limitations that should guide future investigations. The persistent offset of approximately Δ≈−0.057 ± 0.001 across all moisture levels suggests a systematic under prediction of shrinkage. This indicates that the empirical power-law correlation, calibrated from independent data, may not fully capture the shrinkage behavior of the specific carrot variety or drying conditions simulated. Future work should recalibrate the shrinkage model using simultaneous measurements of moisture content and volume under the exact temperature profiles investigated. Additionally, the data suggest that the current shrinkage model, being a function of moisture content alone, cannot capture potential temperature-induced structural changes. Experimental characterization of shrinkage under isothermal and non-isothermal conditions would be necessary to develop a temperature-dependent shrinkage formulation. Also, the Weibull parameters ( α 0 , E α , β ) used for TC, TP, and AA degradation were taken from the literature and assumed constant across all scenarios. The fact that TP half-life also drops slightly to 0.7 h in Scenario G supports the need for a more nuanced kinetic model that accounts for moisture-coupled degradation mechanisms. The periodic scenarios examined (B: 2 h fast cycles, C: 8 h slow cycles, D: high-amplitude 50–70 °C) represent only three points in a vast parameter space of amplitude, frequency, and waveform. The observation that Scenario C (slow cycles) yields marginally better quality (TC: 49.3%, AA: 33.1%) than Scenario B (TC: 48.8%, AA: 32.9%) suggests that frequency effects exist, but the limited sampling prevents generalization. Furthermore, no claim of global optimality is made; instead, the results identify trends and design principles within a limited but representative subset of operating conditions. Hence, the present results provide a physically grounded basis for future multi-objective optimization of periodic drying schedules. Also, it should be noted that the apparent convergence of total polyphenol retention to approximately 13.3% across all scenarios is a direct consequence of the specific Weibull–Arrhenius kinetic parameters adopted in this study. This behavior reflects the relatively low activation energy and near-first-order degradation kinetics reported in the literature, which lead to rapid early-stage losses with limited sensitivity to subsequent temperature variations. Therefore, this result should be interpreted as a model-based outcome under the present parameter set, rather than a universal thermodynamic constraint applicable to all drying conditions or carrot varieties. Experimental validation under transient temperature profiles would be required to confirm the generality of this behavior.
A systematic parametric sweep varying the oscillation period from 1 to 12 h and the amplitude from 5 to 20 °C would be required to map the quality–energy–time Pareto frontier and identify globally optimal cycling strategies. Additionally, the energy data reveal that total energy input ( Q i n ) varies by approximately 12% across scenarios, from 0.512 kJ (Scenario E) to 0.583 kJ (Scenario F). However, the partitioning between evaporation energy ( Q e v ) and sensible heat ( Q s e n ) shows remarkable consistency, with Q e v accounting for 92–95% of total energy in all cases. This suggests that the drying process is overwhelmingly dominated by latent heat requirements, and that energy savings arise primarily from reduced convective losses rather than from fundamental changes in evaporation efficiency. The lower Q e v in Scenario E (0.485 kJ) compared to Scenario A (0.534 kJ) indicates that the mixed profile achieves more efficient use of supplied heat, but the mechanism—whether reduced rehydration during cooling phases or better matching of heat supply to drying kinetics—remains speculative without direct measurement of surface heat fluxes. It is also important to mention that the present analysis evaluated scenarios based on individual metrics (drying time, final quality and total energy) in isolation. However, the data indicate clear trade-offs: Scenario G achieves the shortest drying time (8.81 h) but the poorest TC retention (46.7%); Scenario E achieves the best quality (33.1% mean) and lowest energy (0.512 kJ) but matches the baseline drying time (10.25 h). A formal multi-objective optimization approach—simultaneously minimizing time, minimizing energy, and maximizing quality—would be required to identify non-dominated solutions and guide process design. The current dataset, while limited to seven scenarios, already reveals conflicting objectives and provides a foundation for such analysis. Future work should employ genetic algorithms or response surface methodology to explore the full design space and generate Pareto frontiers for each quality attribute. Although the model was validated against experimental data from Doymaz [35] for constant-temperature drying and against the shrinkage correlation of Eim et al. [34], no direct experimental validation was performed for the periodic and intermittent profiles (Scenarios B–G). The predicted quality differences—ranging from 46.7% to 51.6% TC retention—fall within a range that experimental measurement could reliably detect. Dedicated drying experiments under the specific temperature histories simulated here would provide critical validation and potentially reveal degradation phenomena not captured by the current Weibull framework, such as stress-induced cracking or surface case hardening. Finally, the kinetic parameters used are specific to Nantes carrots dried under the conditions reported by Eim et al. [34]. Extension to other carrot varieties, different fruits, or heat-sensitive pharmaceutical materials would require re-estimation of the Arrhenius parameters ( α 0 , E α ) and shape factors ( β ). However, the modeling framework itself—coupling LBM–transport with Weibull degradation—is general and transferable. A valuable future direction would be to compile a database of quality degradation kinetics for common biomaterials and embed it within the model, enabling rapid scenario evaluation across diverse products.
Addressing these limitations through targeted experiments, expanded parametric studies, and multi-objective optimization would transform the current model into a comprehensive design tool capable of guiding industrial drying process development with confidence.

5. Conclusions

The growing demand for sustainable food processing necessitates drying technologies that balance energy efficiency with preservation of heat-sensitive bioactive compounds. While intermittent drying strategies offer potential advantages, the coupled effects of temperature oscillations on simultaneous heat and mass transport, product shrinkage, and quality degradation remain poorly understood due to the nonlinear Arrhenius kinetics governing thermal degradation. In this context, this study developed and validated a coupled lattice Boltzmann–Weibull framework for simulating drying kinetics, shrinkage, and quality degradation in carrot slices under constant and time-varying temperature profiles. The following conclusions can be drawn:
The LBM model captures the main trends of experimental drying kinetics across 50–70 °C, with RMSE decreasing from 0.087 to 0.040 upon grid refinement to 400 × 400 and R2 exceeding 0.96 at all temperatures. Quality degradation predictions agree with the literature data to within ±2% for TC, TP, and AA retention.
The nonlinear Arrhenius kinetics governing thermal degradation cause temperature oscillations to produce quality outcomes that differ from constant drying at the same mean temperature. This suggests that mean-temperature equivalence may underestimate degradation under fluctuating conditions.
The profile combining an initial 2 h constant phase at 60 °C followed by oscillations between 50 and 60 °C achieves the highest retention of total carotenoids (51.6%) and antioxidant activity (34.4%), the lowest total energy input (0.512 kJ), and a mean quality of 33.1%—the best among the investigated scenarios. This dual-phase approach appears to balance rapid early moisture removal with reduced thermal stress during the diffusion-limited stage.
TP are predicted to converge to approximately 13.3% across all scenarios, with a half-life of 0.8 h, indicating that losses are unavoidable at temperatures above 50 °C due to the low equilibrium concentration and near-first-order kinetics (β ≈ 0.95).
Although the mixed drying strategy demonstrated the best overall performance in terms of quality retention and energy efficiency among the investigated cases, it is important to emphasize that the present study does not constitute a global optimization of drying conditions. The analysis was limited to a finite set of predefined scenarios, whereas the parameter space governing periodic drying—particularly temperature amplitude, oscillation frequency, waveform, and stage sequencing—is considerably broader. Therefore, the identified strategy should be interpreted as a promising and well-performing configuration within the explored design space, rather than a universally optimal solution. Future work should focus on systematic parametric exploration and multi-objective optimization to establish generalized optimal drying protocols and fully map the trade-offs between energy consumption, drying time, and product quality.

Author Contributions

M.K.: Methodology, Conceptualization, Investigation, Writing—original draft. M.H.: Conceptualization, Investigation, Methodology, Software, Writing—original draft, review and editing, Revision. D.M.: Supervision, Revision. All authors have read and agreed to the published version of the manuscript.

Funding

This research did not receive any specific grant from funding agencies in the public, commercial, or not-for-profit sectors.

Data Availability Statement

All relevant data supporting the findings of this study are included within the article. Any additional data required to reproduce the results are available from the corresponding author upon reasonable request.

Conflicts of Interest

The authors declare no conflicts of interest.

Abbreviations

The following abbreviations are used in this manuscript:
EHDElectrohydrodynamic
GHGGreenhouse Gas
LBMLattice Boltzmann method
MW/CVMicrowave–convective
SDGSustainable Development Goals
SECSpecific energy consumption
SMERSpecific Moisture Extraction Rate
TPS-ETransition Point from Sublimation to Evaporation

Nomenclature

SymbolDescriptionUnit
B i h Biot number for heat
B i m Biot number for mass
C ( t ) Concentration of quality attribute mg/g DM
C 0 Initial concentrationmg/g DM or mg Trolox/100 g DM
c i Discrete velocity vectors in LBMlu/ts
c s Lattice speed of sound
d Cylinder diameter ( 2 R 0 )m
D 0 Pre-exponential for moisture diffusivitym2/s
D e f f Effective moisture diffusivitym2/s
E a Activation energy for moisture diffusionJ/mol
E α Activation energy for quality degradationJ/mol
f i x , t Lattice Boltzmann distribution function
f i e q x , t Equilibrium distribution function
h Convective heat transfer coefficientW/(m2·K)
h m Convective mass transfer coefficientm/s
L v Latent heat of vaporizationJ/kg
M Moisture content at time (t)kg/kg DM
M 0 Initial moisture contentkg/kg DM
M e Equilibrium moisture contentkg/kg DM
M R Moisture ratio (\frac{M(t) − M_e}{M_0 − M_e})
N u Nusselt number
P r Prandtl number
Q e v a p Energy consumed by evaporationJ
Q i n Total heat supplied by convectionJ
Q s e n Sensible heat stored in productJ
R 2 Coefficient of determination
R 0 Initial radius of carrot slicem
R ( t ) Instantaneous radius of carrot slicem
R e Reynolds number
R M S E Root Mean Square Error for model validation
S c Schmidt number
S h Sherwood number
T x , t Local temperature in the solid°C or K
T a i r Drying air temperature°C or K
τ LBM relaxation time
v a i r Drying air velocitym/s
w i Lattice weights
X x , t Moisture content (dry basis)kg/kg DM
X 0 Initial moisture contentkg/kg DM
X e q Equilibrium moisture contentkg/kg DM
T ¯ Volume-averaged temperature°C or K
X ¯ Volume-averaged moisture contentkg/kg DM
ϕ Macroscopic scalar field (T or X)
α 0 Pre-exponential for quality degradationh
α T Weibull scale parameterh
β Weibull shape parameter
t 1 / 2 Half-life at temperature (T)h

References

  1. Yumnam, G.; Yumnam, Y.G.; Singh, C.I. A systematic bibliometric review of the global research dynamics of United Nations Sustainable Development Goals 2030. Sustain. Futures 2024, 7, 100192. [Google Scholar] [CrossRef]
  2. Shafik, W. SDG 12: Responsible consumption and production—The circular economy. In Factoring Technology in Global Sustainability: A Focus on the Sustainable Development Goals; Springer Nature: Singapore, 2025; pp. 365–390. [Google Scholar]
  3. Raghavan, V. Innovative food drying solutions for enhancing global food security and sustainability. Dry. Technol. 2025, 43, 7–8. [Google Scholar] [CrossRef]
  4. Bhattacharjee, S.; Mohanty, P.; Sahu, J.K.; Sahu, J.N. A critical review on drying of food materials: Recent progress and key challenges. Int. Commun. Heat Mass Transf. 2024, 158, 107863. [Google Scholar] [CrossRef]
  5. Li, J.; Huang, Y.; Gao, M.; Tie, J.; Wang, G. Shrinkage properties of porous materials during drying: A review. Front. Mater. 2024, 11, 1330599. [Google Scholar] [CrossRef]
  6. Liu, J.; Zhao, Y.; Molaveisi, M.; Shi, Q. Effects of ultrasonic pretreatment on the porosity, shrinkage behaviors, and heat pump drying kinetics of scallop adductors considering shrinkage correction. Case Stud. Therm. Eng. 2024, 61, 104900. [Google Scholar] [CrossRef]
  7. Yang, M.; Li, L.; Liu, W.; Cao, W.; Chen, J.; Ren, G.; Gao, K.; Law, C.L.; Duan, X. An evaluation on the shrinkage deformation characteristics of Chinese yam during multiphase microwave drying based on digital image processing. Innov. Food Sci. Emerg. Technol. 2024, 95, 103725. [Google Scholar] [CrossRef]
  8. Prakasha, R.; Vinay, G.M.; Pandey, H.; Bhoi, P.M. Electrohydrodynamic drying: A comprehensive review of design considerations and quality effects on dried fruits and vegetables. J. Food Process Eng. 2025, 48, e70029. [Google Scholar] [CrossRef]
  9. Kilic, M.; Sahin, M.; Hassan, A.; Ullah, A. Preservation of fruits through drying—A comprehensive review of experiments and modeling approaches. J. Food Process Eng. 2024, 47, e14568. [Google Scholar] [CrossRef]
  10. Sikiru, Y.; Paliwal, J.; Erkinbaev, C. Three dimensional characterization of potatoes under different drying methods: Quality optimization for hybrid drying approach. Foods 2024, 13, 3633. [Google Scholar] [CrossRef] [PubMed]
  11. Kumar, L.; Prakash, O.; Ahmad, A.; Das, B.; Brar, L.S. Performance evaluation and development of FE modeling for passive greenhouse solar dryer for potato chips drying. Environ. Prog. Sustain. Energy 2024, 43, e14373. [Google Scholar] [CrossRef]
  12. Delfiya, D.S.A.; Mathai, L.; Murali, S.; Neethu, K.C.; Nair, A.R.; Ninan, G. Comparison of clam drying in solar, solar hybrid, and infrared dryer: Drying characteristics, quality aspects, and techno economic analysis. Sol. Energy 2024, 274, 112554. [Google Scholar] [CrossRef]
  13. Han, L.; Yan, Y. Heat moisture mechanical bidirectional coupling multiphase porous media model for microwave vacuum drying of pitaya. Int. J. Heat Fluid Flow 2025, 112, 109731. [Google Scholar] [CrossRef]
  14. Xing, S.; Lin, Z.; Gao, X.; Wang, D.; Liu, G.; Cao, Y.; Liu, Y. Research on Outgoing Moisture Content Prediction Models of Corn Drying Process Based on Sensitive Variables. Appl. Sci. 2024, 14, 5680. [Google Scholar] [CrossRef]
  15. Onu, C.E.; Igbokwe, P.K.; Nwabanne, J.T.; Nwajinka, C.O.; Ohale, P.E. Evaluation of optimization techniques in predicting optimum moisture content reduction in drying potato slices. Artif. Intell. Agric. 2020, 4, 39–47. [Google Scholar] [CrossRef]
  16. Asrate, D.A.; Ali, A.N. Review on the recent trends of food dryer technologies and optimization methods of drying parameters. Appl. Food Res. 2025, 5, 100927. [Google Scholar] [CrossRef]
  17. Guo, Q.; Zhang, M.; Mujumdar, A.S.; Yu, D. Drying technologies of novel food resources for future foods: Progress, challenges and application prospects. Food Biosci. 2024, 60, 104490. [Google Scholar] [CrossRef]
  18. Hernández, A.; González Moya, M.; Márquez, A.; Acevedo, L. Review microalgae drying: A comprehensive exploration from conventional air drying to microwave drying methods. Future Foods 2024, 10, 100420. [Google Scholar] [CrossRef]
  19. Kaveh, M.; Çetin, N.; Gilandeh, Y.A.; Sharifian, F.; Szymanek, M. Comparative evaluation of greenhouse gas emissions and specific energy consumption of different drying techniques in pear slices. Eur. Food Res. Technol. 2023, 249, 3027–3041. [Google Scholar] [CrossRef]
  20. Ihediwa, V.E.; Ndukwu, M.C.; Abada, U.C.; Ekop, I.E.; Bennamoun, L.; Simo Tagne, M.; Abam, F.I. Optimization of the energy consumption, drying kinetics and evolution of thermo-physical properties of drying of forage grass for haymaking. Heat Mass Transf. 2022, 58, 1187–1206. [Google Scholar] [CrossRef]
  21. Dhurve, P.; Arora, V.K.; Yadav, D.K.; Malakar, S. Drying kinetics, mass transfer parameters, and specific energy consumption analysis of watermelon seeds dried using the convective dryer. Mater. Today Proc. 2022, 59, 926–932. [Google Scholar] [CrossRef]
  22. Ononogbo, C.; Nwufo, O.C.; Nwakuba, N.R.; Okoronkwo, C.A.; Igbokwe, J.O.; Nwadinobi, P.C.; Anyanwu, E.E. Energy parameters of corn drying in a hot air dryer powered by exhaust gas waste heat: An optimization case study of the food energy nexus. Energy Nexus 2021, 4, 100029. [Google Scholar] [CrossRef]
  23. Kusuma, H.S.; Al Lantip, G.I.; Mutiara, X.; Lestari, F.W.; Jaya, D.E.C.; Illiyanasafa, N.; Nida, R.A.; Sari, T.A.; Diwiyanto, Y.M.; Listiawati, V.; et al. Experimental investigation in the drying process of moringa leaves using microwave drying: Drying kinetics, energy consumption, and CO2 emission. Appl. Food Res. 2024, 4, 100401. [Google Scholar] [CrossRef]
  24. Gupta, A.; Das, B.; Biswas, A.; Mondol, J.D. Assessment of performance and quality parameters for drying neem leaves in photovoltaic thermal solar dryer. Therm. Sci. Eng. Prog. 2023, 43, 101989. [Google Scholar] [CrossRef]
  25. Liu, Q.; Bau, T.; Jin, R.; Cui, X.; Zhang, Y.; Kong, W. Comparison of different drying techniques for shiitake mushroom (Lentinus edodes): Changes in volatile compounds, taste properties, and texture qualities. LWT 2022, 164, 113651. [Google Scholar] [CrossRef]
  26. Escalona, A.; Cuevas, C.; Salazar, L.; Hernandez, V. Modelling of heat pump drying system powered by a hybrid PV wind battery plant for slow drying hardwoods. Energy Sustain. Dev. 2023, 76, 101282. [Google Scholar] [CrossRef]
  27. Jeevarathinam, G.; Pandiselvam, R.; Pandiarajan, T.; Preetha, P.; Krishnakumar, T.; Balakrishnan, M.; Thirupathi, V.; Ganapathy, S.; Amirtham, D. Design, development, and drying kinetics of infrared assisted hot air dryer for turmeric slices. J. Food Process Eng. 2022, 45, e13876. [Google Scholar] [CrossRef]
  28. Gilago, M.C.; Chandramohan, V.P. Study of drying parameters of pineapple and performance of indirect solar dryer supported with thermal energy storage: Comparing passive and active modes. J. Energy Storage 2023, 61, 106810. [Google Scholar] [CrossRef]
  29. Lamrani, B.; Elmrabet, Y.; Mathew, I.; Bekkioui, N.; Etim, P.; Chahboun, A.; Draoui, A.; Ndukwu, M.C. Energy, economic analysis and mathematical modelling of mixed mode solar drying of potato slices with thermal storage loaded V groove collector: Application to Maghreb region. Renew. Energy 2022, 200, 48–58. [Google Scholar] [CrossRef]
  30. Oxley, J.D.; Castilla Gutierrez, C.; Collazos, S.R.; Garza, C.H.; Garza, E.R.; Lange, K.J.; Mamori, M.M.; Zwiener, A.M. Comparison of energy consumption and probiotic stability with pilot scale drying processes. LWT 2024, 211, 116937. [Google Scholar] [CrossRef]
  31. Polat, A.; Taşkın, O.; İzli, N. Assessment of freeze, continuous, and intermittent infrared drying methods for sliced persimmon. J. Food Sci. 2024, 89, 2332–2346. [Google Scholar] [CrossRef]
  32. Chua, K.J.; Mujumdar, A.S.; Chou, S.K. Intermittent drying of bioproducts—An overview. Bioresour. Technol. 2003, 90, 285–295. [Google Scholar] [CrossRef]
  33. Aranha, A.C.R. Conventional and intermittent drying modeling of agricultural products: A review. J. Food Process Eng. 2023, 46, e14206. [Google Scholar] [CrossRef]
  34. Eim, V.S.; Urrea, D.; Rossell, C.; García-Pérez, J.V.; Femenia, A.; Simal, S. Optimization of the drying process of carrot (Daucus carota v. Nantes) on the basis of quality criteria. Dry. Technol. 2013, 31, 951–962. [Google Scholar] [CrossRef]
  35. Doymaz, I. Convective air drying characteristics of thin layer carrots. J. Food Eng. 2004, 61, 359–364. [Google Scholar] [CrossRef]
  36. Žukauskas, A. Heat transfer from tubes in crossflow. Adv. Heat Transf. 1972, 8, 93–160. [Google Scholar]
  37. Zielińska, M.; Markowski, M. Air drying characteristics and moisture diffusivity of carrots. Chem. Eng. Process. Process Intensif. 2010, 49, 212–218. [Google Scholar] [CrossRef]
  38. Hamdi, M.; Elalimi, S.; Nasrallah, S.B. Large Eddy Simulation-Based Lattice Boltzmann Method with Different Collision Models. In Exergy for a Better Environment and Improved Sustainability 1. Green Energy and Technology; Aloui, F., Dincer, I., Eds.; Springer: Cham, Switzerland, 2018. [Google Scholar]
  39. Wolf-Gladrow, D. A lattice Boltzmann equation for diffusion. J. Stat. Phys. 1995, 79, 1023–1032. [Google Scholar] [CrossRef]
  40. Corzo, O.; Bracho, N.; Alvarez, C. Weibull model for thin-layer drying of mango slices at different maturity stages. J. Food Process. Preserv. 2010, 34, 1093–1106. [Google Scholar] [CrossRef]
  41. Perera, C.O. Selected quality attributes of dried foods. Dry. Technol. 2005, 23, 717–730. [Google Scholar] [CrossRef]
  42. Singh, B.; Gupta, A.K. Mass transfer kinetics and determination of effective diffusivity during convective dehydration of pre-osmosed carrot cubes. J. Food Eng. 2007, 79, 459–470. [Google Scholar] [CrossRef]
  43. Saleh, R.M.; Kulig, B.; Emiliozzi, A.; Hensel, O.; Sturm, B. Impact of critical control-point based intermittent drying on drying kinetics and quality of carrot (Daucus carota var. laguna). Therm. Sci. Eng. Prog. 2020, 20, 100682. [Google Scholar] [CrossRef]
  44. Li, Y.; Liang, M.; Li, J.; Jiang, K.; Li, X.; Zheng, Z. Simulation and Experimental Studies of Heat-Mass Transfer and Stress–Strain in Carrots During Hot Air Drying. Agriculture 2025, 15, 484. [Google Scholar] [CrossRef]
  45. Kowalski, S.J.; Szadzińska, J.; Łechtańska, J. Non-stationary drying of carrot: Effect on product quality. J. Food Eng. 2013, 118, 393–399. [Google Scholar] [CrossRef]
Figure 1. Comparative analysis of drying technologies: specific energy consumption (SEC).
Processes 14 01169 g001
Figure 2. Physical problem and boundary conditions.
Processes 14 01169 g002
Figure 3. Flowchart of the developed coupled LBM-based drying model incorporating shrinkage and Weibull quality kinetics.
Processes 14 01169 g003
Figure 4. Comprehensive validation versus experimental data of Doymaz [35] at 50 °C, 60 °C and 70 °C ( d = 2   c m ,   v a i r = 1   m / s ): moisture ratio and quality degradation.
Processes 14 01169 g004
Figure 5. Validation of LBM drying model against Saleh et al. [43].
Processes 14 01169 g005
Figure 6. Weibull quality degradation model using parameters reported by Eim et al. [34].
Processes 14 01169 g006
Figure 7. Radial shrinkage vs. moisture content: comparison with R / R 0 2 = 0.1076 X + 0.1860 / 0.0323 X + 0.7537 , the correlation found by Eim et al. [34].
Processes 14 01169 g007
Figure 8. Drying kinetics, temperature evolution, shrinkage and quality degradation under fast periodic temperature operation.
Processes 14 01169 g008
Figure 9. Internal moisture, temperature, and quality evolution under fast periodic thermal operation ( X 0 = 5.0   k g · k g 1   D M ,   v a i r = 1   m / s ) .
Processes 14 01169 g009
Figure 10. Drying kinetics, temperature evolution, shrinkage and quality degradation under mixed scenario operation.
Processes 14 01169 g010
Figure 11. Carrot slice drying: key findings and practical recommendations.
Processes 14 01169 g011
Table 1. Thermophysical, shrinkage, and quality degradation kinetic parameters used in the drying model.
Category ParameterValueUnitRef.
Drying kinetics E a 28.36kJ/mol[35]
D 0 × 10 9 0.776–9.335m2/s[35]
Shrinkage model a 0.059[37]
b 0.957
Degradation kinetics α 0 × 10 4 2.767s[34]
T C E α 52.69kJ/mol
β 0.383
α 0 × 10 4 1.456s
T P E a 22.125kJ/mol
β 0.953
A A E a 27.52kJ/mol
β 0.413
Table 2. Grid sensitivity analysis showing Root Mean Square Error (RMSE) and coefficient of determination (R2) for moisture ratio predictions at 50, 60, and 70 °C.
Temperature (°C)Grid SizeRMSER2
100 × 1000.06890.9403
50200 × 2000.04990.9687
300 × 3000.04750.9717
400 × 4000.04710.9721
100 × 1000.08700.8815
60200 × 2000.05750.9482
300 × 3000.04910.9623
400 × 4000.04510.9681
100 × 1000.07830.8681
70200 × 2000.05190.9421
300 × 3000.04380.9586
400 × 4000.04010.9655
Table 3. Comparison between LBM simulation and Eim et al. [34] experimental data: quality retention at 0.5   k g · k g 1   D M (1 result interpolated near TC optimum (45.9 °C); 2 global optimum; 3 near AA/TP optimum (69.6 °C)).
Attribute50 °C (LBM)50 °C [34] 160.0 °C (LBM)57.7 °C [34] 270 °C (LBM)70 °C [34] 3
TC55.6%52–56%56.6%51.2%56.1%48–52%
TP13.4%13.4%14.7%14.4%16.3%15–16%
AA35.7%34.7%39.9%38.1%42.4%39–42%
Table 4. Simulation cases for comparing constant and intermittent drying of carrot slices ( X 0 = 5.0   k g · k g 1   D M , v a i r = 1   m / s ).
CaseTypeTemperature ProfilePeriodPurpose
AConstant (baseline)60 °CReference drying curve at typical operating temperature
BFast periodic 55 + 10   s i n 2 π t 2 °C2 hFast temperature cycling
CSlow periodic 55 + 10   s i n 2 π t 8 °C8 hSlow temperature cycling
DHigh amplitude 50 + 20   s i n 2 π t 2 °C2 hStrong fluctuation (large deviation from mean)
EMixed drying 60   ( 0 2   h ) 50 + 20   s i n 2 π t 2 ON/OFF temperature cycling
FLow-amplitude intermittent 65   ° C   ON / 55   ° C OFF (2 h/2 h)Mild temperature oscillation to maintain near-steady thermal conditions
GHigh-amplitude intermittent 70   ° C   ON / 25   ° C OFF (4 h/0.5 h)Stepwise heating to mimic industrial ON/OFF temperature regulation
Table 5. Scenarios scorecard: comparison of drying scenarios and quality retention for carotenoids (TC), polyphenols (TP), and antioxidant activity (AA).
Scenario →ABCDEFG
Parameter ↓
[TC] (mg g−1 DM)0.8110.8100.8180.8090.8560.8030.775
TC final (%)48.848.849.348.751.648.446.7
t 1 2 TC (h)5.45.45.45.45.45.44.1
[TP] (mg GAE g−1 DM)1.9401.9401.9421.9401.9561.9381.946
TP final (%)13.313.313.313.313.413.213.3
t 1 2 TP (h)0.80.80.80.80.80.80.7
[AA] (mg Trolox 100 g−1 DM)66.19966.17366.62666.13569.21065.70166.191
AA final (%)32.932.933.132.934.432.732.9
t 1 2 AA (h)2.42.42.42.42.42.42.0
Mean quality (%)31.731.731.931.633.131.432.9
Table 6. Energy performance comparison: drying time and thermal energy requirements across temperature profiles.
ScenarioTemperature ProfileDrying Time (h) Q e v
(kJ)
Q s e n
(kJ)
Q i n
(kJ)
AConstant 60 °C10.250.5340.0290.563
BPeriodic-T fast10.250.5280.0280.556
CPeriodic-T slow10.250.5230.0280.551
DPeriodic-T wide10.250.5240.0260.550
EMixed10.250.4850.0270.512
FLow-amplitude intermittent10.250.5530.0300.583
GLow-amplitude intermittent8.810.5320.0220.554
Disclaimer/Publisher’s Note: The statements, opinions and data contained in all publications are solely those of the individual author(s) and contributor(s) and not of MDPI and/or the editor(s). MDPI and/or the editor(s) disclaim responsibility for any injury to people or property resulting from any ideas, methods, instructions or products referred to in the content.