Abstract
Jerusalem artichoke (Helianthus tuberosus L.) is a valuable source of inulin and fructooligosaccharides—compounds with well-documented prebiotic and functional food properties. However, its high moisture content significantly limits storage stability. This study aimed to assess the effects of drying method and process temperature on the drying kinetics and selected physicochemical properties of Jerusalem artichoke. Convective drying (AD) and combined convective–microwave drying (AMD), using a microwave power of 100 W, were employed. Drying was conducted at air temperatures of 40 °C, 60 °C, and 80 °C. Among the mathematical models evaluated, the Page model provided the best fit to the experimental drying data for both methods. Samples dried at 80 °C using the AMD technique exhibited the most pronounced changes in color, significant polyphenol losses, and a substantial reduction in antioxidant capacity compared to the fresh material. The lowest polyphenol degradation and the highest retention were observed in products dried at 40 °C using both AD and AMD methods. Notably, the AMD method significantly reduced drying time and improved the grindability of the dried Jerusalem artichoke samples. Although AMD contributed to certain quality deterioration, it also promoted a higher degree of particle size reduction. However, this increased degree of particle size reduction had only a limited effect on the extraction efficiency of fructooligosaccharides and inulin. The results of the present study suggest that AMD may serve as a competitive alternative to AD for drying Jerusalem artichoke, particularly when processing time and grindability are critical considerations.
1. Introduction
Jerusalem artichoke (JA) (Helianthus tuberosus L.), also known as the tuberous sunflower, is a perennial plant belonging to the family Asteraceae. It originates from North America, where it was cultivated by Indigenous peoples long before the arrival of Europeans. It was introduced to Europe in the early 17th century, initially as an ornamental and forage plant, and later as a vegetable recognized for its nutritional and medicinal properties [1,2,3]. From an economic perspective, JA is a highly versatile crop. Its tubers contain significant amounts of inulin, a polysaccharide with prebiotic properties, rendering it particularly valuable to the dietary and pharmaceutical industries [4,5]. This plant is also utilized in the production of alcohol, biogas, and as animal fodder [6,7]. JA is characterized by its high tolerance to adverse soil and climatic conditions, allowing cultivation on marginal lands with challenging agricultural conditions [8,9,10].
The biological and chemical properties of JA—including its high inulin content, dietary fiber, B vitamins, and mineral components—make its tubers a valuable dietary component for individuals with diabetes, obesity, or metabolic disorders [11,12]. Furthermore, compounds present in the tubers have demonstrated immunomodulatory and antioxidant activities, reinforcing their role in the prevention of lifestyle-related diseases [13,14]. In light of the growing interest in natural and functional food products, JA has been attracting increasing attention not only as a food crop but also as an industrial and bioenergy raw material [6,15].
Inulin is a natural polysaccharide, classified as a soluble dietary fiber and belonging to the group of fructans. Chemically, it is a mixture of oligomers and polymers of fructose residues terminated by a glucose unit, linked via β-(2→1) bonds [16,17,18]. Its general chemical formula is GFn, where G denotes glucose, F denotes fructose, and n indicates the number of fructose units, which can range from 2 to over 60 depending on the source and extraction method [19,20]. Inulin naturally occurs in various plants such as chicory (Cichorium intybus), Jerusalem artichoke (Helianthus tuberosus), agave (Agave spp.), and onion (Allium cepa), serving as a storage carbohydrate [21,22,23]. In terms of its physical properties, inulin is a white, odorless powder with a slightly sweet taste, readily soluble in hot water. Its solubility and functional properties—such as gelling, emulsifying, and water-holding capacity— have led to its wide use in the food industry as a texturizing agent and as a fat or sugar substitute [17,24,25]. Inulin also exhibits cryoprotective and stabilizing effects in frozen products and improves the organoleptic properties and nutritional quality of food products [26]. From a chemical standpoint, inulin is resistant to enzymatic hydrolysis in the human gastrointestinal tract; it is not digested in the stomach or small intestine but reaches the colon unchanged, where it is fermented by the gut microbiota [16,27]. The fermentation process yields short-chain fatty acids (SCFAs), such as acetic, propionic, and butyric acids, which exert health-promoting effects, including modulating lipid profiles, enhancing mineral absorption, and strengthening the intestinal barrier [28,29]. Due to these characteristics, inulin is recognized as a prebiotic, selectively stimulating the growth and activity of beneficial microorganisms [30,31]. The physicochemical and functional properties of inulin underpin its increasing importance in the food, pharmaceutical, and cosmetic industries, as well as in dietetics and medicine, particularly in the prevention and treatment of diet-related diseases [32,33,34].
Drying is one of the most critical unit operations in the food, chemical, and pharmaceutical industries. Its primary goal is to extend shelf life, improve microbiological stability, and reduce transportation and storage costs [35,36,37]. Among the various drying techniques, thermal methods—such as convective and convective–microwave drying—play a crucial role. These differ in their energy transfer mechanisms, processing times, and impacts on the quality of the final product [38,39].
Convective drying (hot-air drying) is a widely applied technique that relies on heat exchange between a heated medium (typically air) and the surface of the material. This process is technologically straightforward, requires relatively low capital investment, and allows for easy control of operating parameters. However, prolonged exposure of the material to high temperatures can result in the degradation of thermolabile components, deterioration of sensory qualities, and structural changes in the dried product [40,41,42]. An alternative to conventional convective drying is the convective–microwave method, which combines hot-air heating with microwave energy. This approach excites polar water molecules throughout the material’s volume, thereby delivering thermal energy directly to the interior of the product. This significantly reduces drying time and minimizes the risk of surface overheating [43]. The method supports higher product quality, better retention of bioactive compounds, and a more uniform moisture distribution [38,44]. Comparative analysis of the efficiency and product quality outcomes of both methods represents an important area of research, particularly in the context of optimizing drying processes while preserving the nutritional value, structural integrity, and sensory attributes of food products [45,46].
The aim of this study was to investigate the effect of convective drying (AD) and combined convective–microwave drying (AMD) on the drying kinetics and selected physicochemical properties of Jerusalem artichoke. The study hypothesized that AMD improves drying kinetics without compromising inulin content.
2. Materials and Methods
2.1. Material
The research material consisted of Jerusalem artichoke (Helianthus tuberosus L.) of the ‘Albik’ cultivar. The raw material was sourced from a local producer in the Lublin region, harvested in 2024. The tubers were cleaned and sliced into approximately 5 mm (±0.5 mm) thick pieces using a rotary slicer RCAM-300PRO (Royal Catering, Munich, Germany). The thickness of the slices was checked using an electronic caliper L400 (Varel, Hamburg, Germany). For both drying methods analyzed, the material was dried until a target final moisture content of 10% was achieved. Reducing the moisture content to 10% limits the growth of microorganisms and molds. According to industrial standards, a moisture content of ≤10% is preferred for many applications.
2.2. Drying Method
Convective and convective–microwave-drying processes were carried out using a dryer manufactured by PROMIS-TECH (Wroclaw, Poland). The airflow was directed through the bottom of the sample dish, perpendicularly to the material layer, at a velocity of 0.5 ± 0.05 m·s−1, measured directly beneath the dryer screen. The calibration process was conducted in accordance with the manufacturer’s recommendations at a temperature of 20 °C, 50% relative humidity, and atmospheric pressure. The dish containing the material was placed on a laboratory scale with a measurement accuracy of 0.1 g. During each weighing, the motor rotating the dish and the airflow were temporarily stopped. Mass measurements were taken every five minutes. Convective drying was performed at temperatures of 40 °C, 60 °C, and 80 °C. In the convective–microwave-drying process, the same temperatures were applied, supplemented with microwave power of 100 W per 100 g of raw material. The initial air humidity ranged between 50% and 60%. Temperature control was ensured by a heating element and a temperature probe located between the fan and the airflow speed control module. The device allowed continuous regulation of temperature, airflow velocity, and microwave power (at a frequency of 2450 MHz). Integrated computer software enabled real-time monitoring of drying parameters and data export to a spreadsheet. Each drying variant was repeated five times with drying continuing until a target final moisture content of 10% was achieved.
2.3. Modeling of Drying Curves
For both drying methods investigated, the water content (ur—expressed in kgH2O·kgdm−1, where dm denotes dry matter) in the dried JA was determined at each measurement point using the following equation:
where
m—the mass of the material at a given measurement point [g],
ms—the dry matter content in JA [g].
The final mass of the sample (mk), at which the desired final moisture content is achieved, was calculated using the following expression:
where
wp—initial moisture content of the raw material [%],
wk—assumed final moisture content of the dried material [%].
The drying kinetics were presented as the change in the reduced moisture content (MR) as a function of drying time:
where
uτ—moisture content at a given measurement point [kgH2O·kgdm−1],
up—initial moisture content [kgH2O·kgdm−1],
ur—equilibrium moisture content [kgH2O·kgdm−1].
The equilibrium moisture content (ur) after both convective and convective–microwave drying is very low; therefore, it was assumed that ur is zero throughout the entire measurement range.
To describe the drying curves for convective and convective–microwave drying, six models most commonly used in the literature were applied (Table 1).

Table 1.
Models utilized for description of course convective and microwave–convective drying.
2.4. Color Measurement
Color analysis was performed using the reflectance method with a spherical spectrophotometer X-Rite 8200 (X-Rite, Grand Rapids, MI, USA), equipped with a measurement aperture of 12.7 mm in diameter. Measurements were conducted using a D65 light source and a standard colorimetric observer with a 10° viewing angle. Before each measurement, the spectrophotometer was calibrated using a white standard. Color was determined in the CIELab* color space, in which three coordinates are obtained: L*, a*, and b*. The L* value represents lightness, ranging from 0 (black) to 100 (white). The a* coordinate indicates the color direction from green (negative values) to red (positive values), while the b* coordinate corresponds to the transition from blue (negative values) to yellow (positive values).
Based on the a* and b* coordinates, additional color parameters expressed in cylindrical coordinates were calculated—chroma (c) and hue angle (h)—according to the following formulas:
2.5. Total Phenolic Compounds Content
The total phenolic content (TPC) was determined using the Folin–Ciocalteu method [36]. A 0.5 mL aliquot of the extract was mixed with 0.5 mL of water and 2 mL of Folin reagent (diluted 1:5 with water), and after 3 min, 10 mL of a 10% Na2CO3 solution was added. After 30 min, the absorbance of the mixture was measured at a wavelength of 725 nm using a UV Mini 1240 spectrophotometer (Shimadzu, Kyoto, Japan). The total phenolic content was expressed as gallic acid equivalents (GAE) per gram of dry matter.
2.6. Antiradical Activity
The antioxidant activity in scavenging free radicals was assessed using both ABTS (2,2′-azino-bis(3-ethylbenzothiazoline-6-sulfonic acid)) and DPPH (2,2-diphenyl-1-picrylhydrazyl) assays. The ABTS assay was performed based on the method proposed by Re et al. (1999) [53], with minor adjustments. Specifically, the ABTS•+ radical cation was generated by combining a 7 mM ABTS stock solution with 2.45 mM potassium persulfate and allowing the mixture to stand in the dark at room temperature for 12 to 16 h. Prior to measurement, the radical solution was diluted with ethanol to achieve an absorbance of 0.70 ± 0.02 at 734 nm. Subsequently, 0.1 mL of the test extract was added to 3.9 mL of the ABTS•+ solution, and absorbance was recorded at 734 nm after 6 min of incubation. For the DPPH assay, the procedure outlined by Brand-Williams et al. (1995) [54] was followed. A 0.1 mM methanolic solution of DPPH was prepared, and 0.1 mL of the extract was mixed with 3.9 mL of this solution. The reaction mixture was incubated in the dark at room temperature for 30 min, and the absorbance was measured at 517 nm.
In both methods, 50% methanolic extracts were employed. The extracts were obtained by homogenizing the dried plant material with 50% methanol (v/v), followed by filtration and storage at 4 °C until use. Trolox served as the reference antioxidant, and results were expressed as millimoles of Trolox equivalents per 100 g of dry matter (mmol Trolox/100 g d.m.).
2.7. Grinding of the Dried Samples
The grinding of the dried material was performed using a GRINDOMIX GM 200 (Retsch GmbH, Haan, Germany) knife mill (Retsch). The device was equipped with two stainless steel blades, each 1 mm thick, mounted on opposite sides of the shaft at different levels. A 100 g sample of the dried material was fed into the grinding chamber, and milling was performed at a shaft rotational speed of 7000 rpm. The process lasted for 30 s.
To eliminate the influence of final moisture content on grinding efficiency, all samples were conditioned for 48 h in a climate chamber under controlled conditions of 20 °C and 50% relative humidity prior to grinding. Each measurement was performed in five replicates.
2.7.1. Particle Size Distribution of the Dried Material and Mean Particle Size
The ground dried material was subjected to particle size distribution analysis by sieving the sample using a Retsch AS 200 (Retsch GmbH, Haan, Germany) vibratory sieve shaker. The device was equipped with a set of sieves with the following mesh sizes: 800 μm, 600 μm, 400 μm, 200 μm, and 100 μm. The sieving process of 20 g of dried material was carried out for 2 min at a vibration amplitude of 1.5 mm. The individual fractions were weighed, and their percentage share was determined. Measurements were conducted in five replicates.
Based on the particle size distribution, the mean particle size (ds) was determined [55]:
where
hi—mean value of the class interval,
Pi—percentage share of the given class,
u—number of sieves used.
2.7.2. Eefficiency Indicators of Grinding
The measurements of electrical energy supplied to the knife mill were recorded as the power distribution over the duration of the grinding process (sampling interval of 0.5 s). Power measurements were performed using a digital multimeter M-4660-M (Conrad Electronic SE, Hirschau, Bavaria, Germany) with DIGISCOP v. 2.05 software, connected to a computer. A detailed description of the search methodology is provided by Hassoon et al. [56].
The grinding efficiency index of the JA dried material was calculated as the ratio of the surface area generated by grinding to the energy consumed during the grinding process [57].
2.8. Extraction and Isolation of Inulin
The extraction process of sugars, fructooligosaccharides (FOS: 1-kestose [GF2], nystose [GF3], and β-fructofuranosyl nystose [GF4]), and inulin was based on the methodology developed by Khuenpet et al. [20] with certain modifications. Prior to extraction, the dried material was ground. A 100 g sample of dried material was subjected to two-step extraction with water at 70 °C for 30 min. The extraction was carried out at a water-to-dried material ratio of 20:1 (w/w). After extraction, the solution was centrifuged, heated to 80 °C, and alkalized using lime milk (Ca(OH)2) for 30 min to achieve a pH of 11–12. The pH meter was calibrated using buffer solutions with pH values of 4.0, 7.0, and 10.0. Buffer control of the pH meter was performed using a buffer solution at pH 9.18, with the obtained results showing deviations not exceeding 0.1 pH units. Subsequently, the solutions were neutralized for approximately 30 min to reach a pH of 6.0–6.5. The obtained solution was then filtered. The resulting solutions were subjected to crystallization at 3–4 °C for 48 h. The inulin preparations were filtered under reduced pressure. The obtained preparations were then freeze-dried at 20 °C (the freeze-drier was equipped with a shelf heating system) under a drying chamber pressure of 100 Pa. The drying process lasted 24 h, with the final moisture content of the preparations not exceeding 3%. The determination of simple sugars, disaccharides, FOS, and inulin content was performed using high-performance anion-exchange chromatography with pulsed amperometric detection (HPAEC-PAD) on a Dionex ICS-3000 (Dionex Corporation, Sunnyvale, CA, USA) system equipped with a Dionex CarboPac column and an electrochemical detector. Prior to analysis, samples were centrifuged at 5000 rpm for 10 min and filtered through a 0.45 µm filter. A volume of 20 µL of the solution was injected into the column. The mobile phase consisted of 30 mM NaOH, with a flow rate of 0.6 mL/min.
2.9. Statistical Analysis
A one-way analysis of variance (ANOVA) was performed. To determine the significance of differences between means, Tukey’s test was applied. All experiments and analyses were conducted in five replications. Drying kinetics regression analysis was carried out using nonlinear least squares estimation, with the coefficient of determination (R2), root mean square error (RMSE), and the reduced chi-square value (χ2) calculated. Additionally, the RMSE and χ2 values were computed to assess the goodness of fit:
where
MRi,p—predicted value of the moisture ratio,
MRi,e—experimental value of the moisture ratio,
N—number of observations,
n—number of parameters in the model equation.
Furthermore, to compare the performance and parsimony of different drying models, the Akaike Information Criterion (AIC) and Bayesian Information Criterion (BIC) were also calculated. These information criteria help assess model adequacy by balancing the goodness of fit and the complexity of the model. Lower values of AIC and BIC indicate better model performance with fewer risks of overfitting.
The AIC and BIC were calculated using the following formulas:
where RSS—residual sum of squares:
Statistical analysis was performed using Statistica 13 software (StatSoft, Tulsa, OK, USA). All calculations were conducted at a significance level of α = 0.05. Means marked with different lowercase letters in the columns of the tables (in superscript) differ significantly (p < 0.05).
3. Results and Discussion
3.1. Drying Kinetics
The changes in the moisture ratio (MR) as a function of drying time during convective and convective–microwave drying of JA are presented in Figure 1 and Figure 2. For each of the analyzed drying methods, an increase in drying air temperature resulted in a reduction in drying time. The drying time for convective drying at 80 °C was approximately 26% of that at 40 °C, and about 55% at 60 °C (Table S1). Increasing the drying air temperature from 40 °C to 80 °C during convective–microwave drying led to a more than twofold reduction in process duration, while at 60 °C the drying time was reduced by about 1.5 times. At the same temperature, convective drying was consistently characterized by significantly longer drying times. The application of microwave radiation shortened the drying time by approximately 400 min at 40 °C, 190 min at 60 °C, and 65 min at 80 °C. As the drying air temperature increased, the relative impact of microwave radiation on drying time decreased. Microwave-assisted convective drying allows for a substantial reduction in the total drying time due to the rapid volumetric heating of the material, which enhances the water diffusion coefficient from the interior to the surface of the material—particularly during the falling-rate period of drying [38,58]. The drying kinetics depend on several factors, including the drying air temperature, air velocity, material thickness, and internal structure of the product, which affect heat and mass transfer rates. Additionally, the moisture content and its binding state (free vs. bound water) significantly influence the drying rate. Higher temperatures increase the vapor pressure gradient and accelerate moisture migration, while microwave energy contributes to volumetric heating, enhancing internal moisture diffusion. As a result, the observed differences in drying kinetics between methods and temperatures are the outcome of combined thermal and mass transfer mechanisms occurring within the drying matrix.
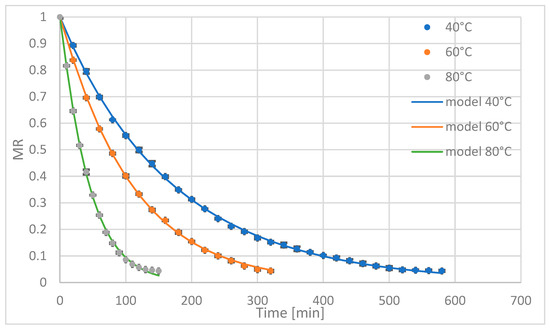
Figure 1.
Drying curves of the air-drying process.
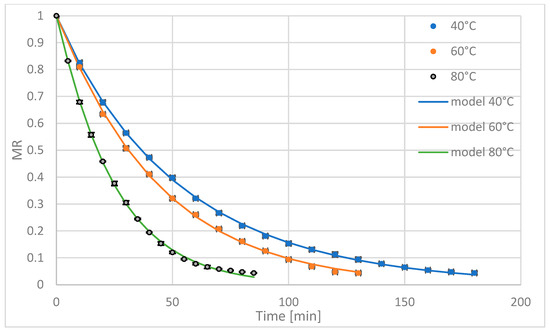
Figure 2.
Drying curves of the microwave–air-drying process.
The results of the regression analysis for the drying models describing the kinetics of convective and convective–microwave drying are presented in Table 2 and Table 3. Based on this analysis, it can be concluded that all the evaluated models showed good agreement with the experimental data. The coefficient of determination for the fitted equations across the entire measurement range varied between 0.9764 and 0.9999. Similarly, the root mean square error and the reduced chi-square values were low, ranging from 0.0025 to 0.0426 and from 0.0001 to 0.0009, respectively.
Table 2.
Statistical analysis of models describing kinetics of air drying of JA.
Table 3.
Statistical analysis of models describing kinetics of air–microwave drying of JA.
Across the full measurement range, the best fit to the experimental data was achieved using the Page, Logarithmic, and Logistic models which were further confirmed by the lowest values of the Akaike Information Criterion (AIC) and the Bayesian Information Criterion (BIC) (Tables S2 and S3, respectively). However, the Logarithmic and Logistic models were not statistically significant for drying at both 40 °C (Logistic) and 80 °C (Logarithmic). Therefore, to standardize the obtained results and to enable the interpretation of the effects of temperature and drying method on the value of the drying rate constant (k), the Page model was selected for modeling both convective and convective–microwave drying. The Page model was also previously applied to describe the convective drying of JA by Khuenpet et al. [59]. The modeling results, along with the experimental data, are shown in Figure 1 and Figure 2.
For both analyzed drying methods, the value of the drying rate constant k in the Page model increased with rising drying temperature (Table 4 and Table 5). At each temperature, the k values were significantly higher—more than twice as high—during convective–microwave drying compared to conventional convective drying. The highest k value was observed during convective–microwave drying at 80 °C.
Table 4.
Coefficient values in the models describing the air drying of JA.
Table 5.
Coefficient values in the models describing the air–microwave drying of JA.
The selection of the Page model as the most appropriate across both drying methods and temperature levels allows for a consistent and reliable description of the drying kinetics. Its empirical nature and flexibility in fitting experimental data make it particularly suitable for modeling the falling-rate period observed in plant-based materials such as JA. Furthermore, accurate modeling of drying kinetics provides a valuable tool for optimizing drying parameters, predicting process behavior at different scales, and enhancing energy efficiency. However, it is worth noting that empirical models, while statistically effective, may lack a direct physical interpretation of mass transfer mechanisms. Therefore, future studies could benefit from incorporating semi-theoretical or mechanistic models to further explore the internal moisture movement dynamics under different drying conditions.
3.2. Color Assessment
Drying of JA resulted in a darker color of the dried material, irrespective of the drying method or temperature applied (Table 6). The lightness coordinate (L*) of the fresh raw material was significantly higher than that of the dried samples, with a difference of approximately 19 to 25 units, depending on the drying method used. As the drying air temperature increased, the L* value decreased for both drying methods analyzed. The differences in L* were smaller at 40 °C and 60 °C but became more pronounced at 80 °C, particularly in the case of convective–microwave drying. Dried material produced by AMD (air–microwave drying) at 40 °C and 60 °C was lighter than that produced using conventional air drying (AD) at the same temperatures. The brightest dried sample was obtained using AMD at 40 °C, whereas the darkest one was obtained using AMD at 80 °C. The use of convective–microwave drying contributed to higher L* values at lower temperatures owing to significantly shortened drying times compared to convective drying. In contrast, the decrease in L* at the highest temperature was likely attributable to surface damage of the material caused by the degradation of carbohydrates.
Table 6.
Influence of drying method and temperature on the color of JA.
Color saturation exhibited the highest value in the raw material (Table 6). Increasing the drying air temperature contributed to a decrease in the chroma (c*) coordinate in convection-dried samples. Raising the temperature from 40 °C to 80 °C resulted in a reduction of approximately 2.3 units in c* value. The material dried using convective–microwave drying (AMD60 and AMD80) showed identical chroma values, both of which were lower than that obtained for AMD40. At each drying temperature, convection-dried samples exhibited higher c* values than those obtained through convective–microwave drying. For all tested drying methods, the hue angle (h*) of the dried material was lower than that of the raw material (Table 6). With increasing drying air temperature, the h* value decreased in both drying methods. At the same temperature, AD samples had higher hue angles than those dried by the AMD method. The dried sample with the hue angle closest to that of the raw material was obtained after convection drying at 40 °C (AD40), with a decrease of approximately 8.6% compared to the raw material. In contrast, the greatest deviation in hue was observed in the AMD80 sample, with a decrease of approximately 38.7%.
These changes in the three analyzed color coordinates (L*, c*, h*) may result from the formation of colored pigments due to non-enzymatic browning reactions, which intensify at higher temperatures—particularly during convective–microwave drying, where localized overheating of the material may occur [59,60,61].
3.3. Antioxidant Activity and Total Phenolic Content
JA tubers exhibited higher antioxidant activity against both tested radicals and a greater total polyphenol content compared to the dried samples, regardless of the drying method used (Table 7). For all analyzed drying methods and temperatures, the antioxidant capacity measured with the DPPH radical was consistently higher than that measured with the ABTS•+ radical. At the same temperature (within the range of 60 °C to 80 °C), the convection-dried samples demonstrated higher antioxidant potential. However, at 40 °C, the opposite trend was observed—higher antioxidant activity against both radicals was recorded after convective–microwave drying (AMD), likely due to the significantly shorter drying time associated with this method. The lowest antioxidant potential values were observed at the highest temperature tested. The decrease in antioxidant capacity was particularly pronounced in samples dried using the AMD method at 80 °C. Total polyphenol content (TPC), at a given temperature (except at 40 °C), was generally lower in the samples obtained by convective–microwave drying. With an increase in drying temperature from 40 °C to 60 °C (for convection drying), the TPC declined only slightly compared to that of the raw material, with reductions of 40.5% and 42%, respectively. However, at 80 °C, a significant decrease in TPC was observed, amounting to a 50.2% loss. The decrease in TPC with increasing temperature was even more evident in the samples dried by the AMD method, with losses of 37.6% at 40 °C, 51.2% at 60 °C, and 65.9% at 80 °C. At higher drying temperatures, convective–microwave drying negatively impacted TPC due to increased internal material temperatures, especially in the final stage of drying, caused by microwave energy absorption.
Table 7.
The antioxidant capacity and total phenolic content of dried JA.
The drying process can accelerate the release and degradation of phenolic compounds as a result of cell wall disruption, elevated temperature, and the presence of oxygen [7,62].
3.4. The Susceptibility of the Dried Product to Fragmentation
As the drying temperature increased, the particle size distribution of the dried product shifted towards larger particle size fractions, regardless of the drying method (Table 8). For the largest size fractions, greater than 800 µm and 800–600 µm, at a given temperature, the convective–microwave-dried samples exhibited lower percentage proportions compared to the convective-dried samples. An opposite trend was observed for the smallest fractions, where higher shares were found in the samples obtained by the AMD method. Based on these observations, it can be concluded that the material dried using the convective–microwave method was more susceptible to grinding than the material dried by convection. The sample dried by AMD at 40 °C showed the lowest proportion of larger fractions and the highest proportion of the smallest fractions, whereas the sample dried by AD at 80 °C exhibited the highest proportion of larger fractions and the lowest proportion of fine fractions. Convective–microwave drying causes less shrinkage of the dried material due to its heat delivery mechanism. This likely explains the higher susceptibility to grinding compared to convectively dried material [63,64,65].
Table 8.
Particle size distribution of JA powder (%).
Regardless of the drying method used, the specific energy consumption for grinding increased with rising drying air temperature (Table 9). At a given temperature, the dried material obtained using the AD method exhibited higher grinding energy values. The lowest specific energy consumption for grinding (6548 J·100 g−1) was recorded after convective–microwave drying at 40 °C (AMD40), while the highest value (7604 J·100 g−1) was observed after convective drying at 80 °C (AD80). Across the entire measurement range, the mean particle size (ds) of the dried JA ranged from 372.4 to 474.5 µm. The value of ds increased with rising drying air temperature for both drying methods. The powder obtained by the AMD method had smaller particle sizes than that obtained by the AD method at the same temperature. In terms of particle size, drying using the AMD40 method was the most favorable process. The drying method significantly influenced the grinding efficiency index. The highest value of this index (the lowest grinding energy requirement) was found for the powder dried by the convective–microwave method at 40 °C (AMD40)—3.7 m2·MJ−1—while the lowest value was observed for the powder obtained by convective drying at 80 °C (AD80)—2.47 m2·MJ−1. For both drying methods, this index decreased as drying temperature increased. At a given temperature, this index was higher for powders obtained by convective–microwave drying.
Table 9.
Specific grinding energy, average final particle size and grinding efficiency index from dried JA.
3.5. Content of Carbohydrates, Fructooligosaccharides, and Inulin
Fresh JA tubers exhibited the lowest levels of glucose, fructose, sucrose, and fructooligosaccharides (FOS: 1-kestose [GF2], nystose [GF3], and β-fructofuranosyl nystose [GF4]), and the highest content of inulin, compared to the dried samples derived from the same raw material. An increase in drying temperature resulted in higher contents of monosaccharides and disaccharides. These differences were particularly pronounced at the highest temperature tested, for both drying methods. At each temperature, higher levels of glucose, fructose, and sucrose were observed in the samples obtained through convective–microwave drying. The increased concentration of simple sugars was associated with the hydrolysis of inulin, induced by inulinase activity, which accelerates inulin hydrolysis at elevated temperatures. Drying temperatures in the range of 40–60 °C did not significantly affect FOS content in the dried material, regardless of drying method. However, at 80 °C, higher FOS content was observed compared to that at lower temperatures. The highest FOS concentrations were recorded in the samples dried using the AMD80 method. The drying process led to a reduction in inulin content ranging from 4.7% to 14.4%, relative to the fresh material. At each temperature, the samples obtained using the AMD method exhibited lower inulin content. Within the 40–60 °C range, no significant differences in inulin content were observed between the two methods; however, a notable decrease in inulin was recorded at 80 °C. The lowest inulin content was observed in JA dried using the AMD80 method (Table 10).
Table 10.
Content of carbohydrates, fructooligosaccharides, and inulin in JA dried material.
The glucose and fructose concentrations in the extracts obtained from ground dried JA material ranged from 0.21 to 0.52 g·(100 gdm)−1 and from 1.31 to 2.07 g·(100 gdm)−1, respectively (Table 11). Convective drying temperature had no statistically significant effect (α = 0.05) on the glucose concentrations in the extracts. In contrast, the fructose content increased with rising drying temperature. At each temperature, extracts derived from AMD-dried material exhibited higher concentrations of both glucose and fructose compared to those obtained from AD-dried material. The lowest glucose and fructose contents (among AMD-dried samples) were recorded for the AMD40 method. No statistically significant differences (α = 0.05) were found between the AMD60 and AMD80 extracts with respect to sugar concentrations. The increase in fructose content with higher drying temperatures was likely due to the thermal breakdown of fructose-containing oligosaccharides and polymers present in JA material, a phenomenon also observed by other researchers [66,67]. The lowest sucrose concentration, amounting to 1.17 g·(100 gdm)−1, was recorded in the extract obtained from the AD60-dried material, whereas the highest value, 3.05 g·(100 gdm)−1, was observed in the extracts derived from AMD80 (Table 11). At each temperature, sucrose concentration was higher in extracts obtained using the AMD method. Convective–microwave drying may cause localized overheating of the material, which can contribute to an increase in sucrose concentration as a result of inulin degradation in JA [68,69].
Table 11.
Content of carbohydrates, fructooligosaccharides, and inulin in JA dried material after extraction.
An increase in drying temperature led to a corresponding rise in the FOS concentration in JA extracts. At a given temperature, higher FOS levels were observed in samples dried using the AMD method. The lowest FOS concentration (7.32 g·(100 gdm)−1) was detected in extracts from AD40, while the highest (11.27 g·(100 gdm)−1) was observed following AD80 drying. The highest inulin concentration in JA extracts, approximately 78 g·(100 gdm)−1, was obtained from material dried at 40 °C and 60 °C using the AD method; however, these differences were not statistically significant (α = 0.05). An increase in drying temperature to 80 °C (AD80) resulted in a decrease in inulin content by approximately 4.2 g·(100 g DM)−1. At each temperature, inulin concentrations in extracts from AMD-dried material were lower than those from AD-dried samples. The differences were as follows: 3.4% at 40 °C, 4.2% at 60 °C, and 2.2% at 80 °C.
The glucose and fructose contents in the final product (after purification and precipitation) were not statistically significant (α = 0.05) across the entire measurement range. Their concentrations ranged from 0.03 to 0.05 g·(100 gdm)−1 (Table 12). The inulin powder obtained from the AD40-dried material contained the lowest sucrose content of 0.4 g·(100 gdm)−1. For the other five drying methods, sucrose content ranged between 0.55 and 0.64 g·(100 gdm)−1 and was not statistically significant (α = 0.05). The lack of statistically significant differences in glucose, fructose, and sucrose contents resulted from the good solubility of these carbohydrates in water, which remained in the aqueous solution after inulin powder precipitation. The FOS content in the inulin preparation ranged from 4.2 to 5.11 g·(100 gdm)−1. The drying method at a given temperature did not significantly affect (α = 0.05) the FOS content. The FOS content in the final product obtained by the AD method increased with drying temperature by 0.4 g·(100 gdm)−1 (AD60) and 0.91 g·(100 g)−1 (AD80), respectively. The highest inulin content in the final product was obtained from material dried by the AD40 method, amounting to 92.46 g·(100 gdm)−1. The lowest content, 90.95 g·(100 gdm)−1, was also observed. The inulin content in the inulin preparation decreased with increasing drying temperature of JA by the AD method, with a reduction of approximately 1.5 g·(100 gdm)−1 at the highest temperature. The drying temperature using the AMD method did not significantly affect (α = 0.05) the inulin content in the final product, which ranged from 90.95 to 91.64 g·(100 gdm)−1. According to the analyzed literature, the composition of inulin preparations was characterized by higher contents of fructose, sucrose, and FOS, and lower inulin content ranging from approximately 74 to 83%. This was due to the fact that these preparations were obtained from extracts via spray drying rather than by precipitation of inulin from cooled aqueous solutions [3,24,70].
Table 12.
Content of carbohydrates, fructooligosaccharides, and inulin in JA dried matter after purification and precipitation.
4. Conclusions
Among the drying methods analyzed, the Page model provided the best fit to the experimental data. Due to the shorter process duration, convective–microwave drying was the most advantageous. The shortest drying time was observed at the highest temperature within the tested range (AMD80 method). As the drying air temperature increased, values of lightness, chroma, and hue angle decreased. The powder obtained by convective–microwave drying exhibited higher lightness values and lower chroma and hue angle compared to convective drying. The powder color closest to the raw material was obtained after drying by the AD40 method, whereas the color coordinates after AMD80 drying differed the most from the raw material. The powder with the highest total polyphenol content and greatest antioxidant potential was obtained after AMD40 drying, while the poorest results were observed for the AMD80 method. Increasing drying temperature negatively affected indicators related to powder grinding. At a given temperature, these indicators were always better for powder obtained by convective–microwave drying. The drying process increased the content of glucose, fructose, sucrose, and fructooligosaccharides but decreased the inulin content. The highest inulin content in extracts and the final product was observed for the AD40 process (specifically 78.35 g·(100 gdm)−1 and 92.46 g·(100 gdm)−1, respectively). The lowest inulin content was found following the AMD80 method (72.2 g·(100 gdm)−1 and 91.33 g·(100 gdm)−1, respectively). Considering drying kinetics, the quality characteristics of the powder, and the concentrations of FOS and inulin, the most favorable drying process was convective–microwave drying at 40 °C.
Based on the conducted research, valuable insights were gained into the influence of drying methods and conditions on the fundamental quality characteristics of the dried material—factors crucial for the application of inulin powders in the food industry—as well as on the inulin content in these powders, which serve as important additives in functional foods. Given the growing interest in both inulin and fructooligosaccharides, it would be worthwhile to conduct similar investigations using freeze-drying. Future studies will aim to perform a comprehensive techno-economic analysis and evaluate the industrial implications of the examined drying methods, including energy consumption and quality trade-offs, to further support their practical implementation.
Supplementary Materials
The following supporting information can be downloaded at: https://www.mdpi.com/article/10.3390/pr13082553/s1, Table S1. Drying times (min) of Jerusalem artichoke samples under various drying methods and temperatures; Table S2. Comparison of model fit using AIC and BIC values for air-dried Jerusalem Artichoke samples (lower values indicate a better trade-off between model fit and complexity); Table S3. Comparison of model fit using AIC and BIC values for air–microwave-dried Jerusalem Artichoke samples.
Author Contributions
Conceptualization, S.R.; methodology, S.R. and D.D.; software, S.R.; validation, S.R., B.B. and A.K.; formal analysis, S.R.; investigation, B.B., R.P., A.K., M.D., M.K.-G. and G.R.; resources, S.R.; data curation, R.P.; writing—original draft preparation, S.R. and D.D.; writing—review and editing, S.R. and D.D.; visualization, S.R.; supervision, D.D. All authors have read and agreed to the published version of the manuscript.
Funding
This research received no external funding.
Data Availability Statement
The original contributions presented in the study are included in the article/Supplementary Materials, further inquiries can be directed to the corresponding authors.
Conflicts of Interest
The authors declare no conflicts of interest.
References
- Jahromi, M.S.B.; Iranmanesh, M.; Akhijahani, H.S. Thermo-Economic Analysis of Solar Drying of Jerusalem Artichoke (Helianthus tuberosus L.) Integrated with Evacuated Tube Solar Collector and Phase Change Material. J. Energy Storage 2022, 52, 104688. [Google Scholar] [CrossRef]
- Barakayev, N.; Beshimov, Y.; Beshimov, M. Importance of Technological Properties of Jerusalem Artichoke. E3S Web Conf. 2024, 548, 03018. [Google Scholar] [CrossRef]
- Khuenpet, K.; Truong, N.D.P.; Polpued, R. Inulin Extraction from Jerusalem Artichoke (Helianthus tuberosus L.) Tuber Powder and Its Application to Yoghurt Snack. Int. J. Agric. Technol. 2020, 16, 271–282. Available online: https://www.thaiscience.info/Journals/Article/IJAT/10992803.pdf (accessed on 5 June 2025).
- Afoakwah, N.A.; Zhao, Y.; Dong, Y. Biological Functionality and Characteristics of Jerusalem Artichoke (Helianthus tuberosus L.) Tuber Extracts. Acta Aliment. 2023, 52, 12–26. [Google Scholar] [CrossRef]
- Dalmis, R. Description of a New Cellulosic Natural Fiber Extracted from Helianthus tuberosus L. as a Composite Reinforcement Material. Physiol. Plant. 2023, 175, e13960. [Google Scholar] [CrossRef]
- Dubkova, N.Z.; Kharkov, V.V.; Vakhitov, M.R. Using Jerusalem Artichoke Powder in Functional Food Production. Foods Raw Mater. 2021, 9, 69–78. [Google Scholar] [CrossRef]
- Puyanda, I.R.; Uriyapongson, S.; Uriyapongson, J. Influence of Drying Method on Qualities of Jerusalem Artichoke (Helianthus tuberosus L.) Tuber Harvested in Northeastern Thailand. Songklanakarin J. Sci. Technol. 2020, 42, 1279–1285. Available online: https://www.cabidigitallibrary.org/doi/full/10.5555/20203349829 (accessed on 10 May 2025).
- Qiu, Y.; Zhu, Y.; Sha, Y.; Lei, P.; Luo, Z.; Feng, X.; Li, S.; Xu, H. Development of a Robust Bacillus Amyloliquefaciens Cell Factory for Efficient Poly(γ-Glutamic Acid) Production from Jerusalem Artichoke. ACS Sustain. Chem. Eng. 2020, 8, 9763–9774. [Google Scholar] [CrossRef]
- Shao, T.; Chen, Y.; Gao, X.; Zhou, Z.; Long, X.; Rengel, Z. Salt Stress Affects the Biomass of Industrial Crop Jerusalem Artichoke by Affecting Sugar Transport and Metabolism. Heliyon 2023, 9, e14107. [Google Scholar] [CrossRef] [PubMed]
- Zhao, M.; Ren, Y.; Wei, W.; Yang, J.; Zhong, Q.; Li, Z. Metabolite Analysis of Jerusalem Artichoke (Helianthus tuberosus L.) Seedlings in Response to Polyethylene Glycol-Simulated Drought Stress. Int. J. Mol. Sci. 2021, 22, 3294. [Google Scholar] [CrossRef]
- Horochowska, M.; Kołeczek, E.; Zdrojewicz, Z.; Jagiełło, J.; Pawlus, K. Topinambour—Nutritional and Medical Properties of the Jerusalem Artichoke (Helianthus tuberoses L.). Pediatr. Endocrinol. Diabetes Metab. 2017, 23, 30–36. [Google Scholar] [CrossRef]
- Li, J.; Jia, S.; Yuan, C.; Yu, B.; Zhang, Z.; Zhao, M.; Liu, P.; Li, X.; Cui, B. Jerusalem Artichoke Inulin Supplementation Ameliorates Hepatic Lipid Metabolism in Type 2 Diabetes Mellitus Mice by Modulating the Gut Microbiota and Fecal Metabolome. Food Funct. 2022, 7, e13960. [Google Scholar] [CrossRef]
- Takur, S.; Khan, A.A.; Azmi, W. Potential of Oligosaccharides from Inulin in Human Nutrition and Health. Ann. Phytomed. An Int. J. 2020, 9, 141–146. [Google Scholar] [CrossRef]
- Afoakwah, N.A. Jerusalem Artichoke (Helianthus tuberoses) Dietary-Fiber Powder Functionality. Heliyon 2022, 8, e12426. [Google Scholar] [CrossRef]
- Rubel, I.A.; Iraporda, C.; Novosad, R.; Cabrera, F.A.; Genovese, D.B.; Manrique, G.D. Inulin Rich Carbohydrates Extraction from Jerusalem Artichoke (Helianthus tuberosus L.) Tubers and Application of Different Drying Methods. Food Res. Int. 2018, 103, 226–233. [Google Scholar] [CrossRef]
- Gunnarsson, I.B.; Svensson, S.E.; Johansson, E.; Karakashev, D.; Angelidaki, I. Potential of Jerusalem Artichoke (Helianthus tuberosus L.) as a Biorefinery Crop. Ind. Crops Prod. 2014, 56, 231–240. [Google Scholar] [CrossRef]
- Zhang, Y.; Liu, R.; Song, B.; Li, L.; Shi, R.; Ma, X.; Zhang, L.; Li, X. Recent Advances in Inulin Polysaccharides Research: Extraction, Purification, Structure, and Bioactivities. Chem. Biol. Technol. Agric. 2024, 11, 136. [Google Scholar] [CrossRef]
- Bhanja, A.; Sutar, P.P.; Mishra, M. Inulin-A Polysaccharide: Review on Its Functional and Prebiotic Efficacy. J. Food Biochem. 2022, 46, e14386. [Google Scholar] [CrossRef] [PubMed]
- Alabadi, A.M.D.; Abood, S.C. Extraction and Acid Hydrolyses of Fresh Jerusalem Artichoke Inulin for Fructooligosaccharide Production. Iraqi J. Agric. Sci. 2020, 50, 1551–1560. [Google Scholar] [CrossRef]
- Khuenpet, K.; Jittanit, W.; Sirisansaneeyakul, S.; Srichamnong, W. The Application of Purification Process for Inulin Powder Production from Jerusalem Artichoke (Helianthus tuberosus L.) Tuber Powder. J. Food Process. Preserv. 2018, 42, e13695. [Google Scholar] [CrossRef]
- Qiu, Y.; Lei, P.; Zhang, Y.; Sha, Y.; Zhan, Y.; Xu, Z.; Li, S.; Xu, H.; Ouyang, P. Recent Advances in Bio-Based Multi-Products of Agricultural Jerusalem Artichoke Resources. Biotechnol. Biofuels 2018, 11, 151. [Google Scholar] [CrossRef] [PubMed]
- Puttha, R.; Jogloy, S.; Suriharn, B.; Wangsomnuk, P.P.; Kesmala, T.; Patanothai, A. Variations in Morphological and Agronomic Traits among Jerusalem Artichoke (Helianthus tuberosus L.) Accessions. Genet. Resour. Crop Evol. 2013, 60, 731–746. [Google Scholar] [CrossRef]
- Canli Tasar, O.; Tasar, G.E. Optimization of Inulinase Production Using Jerusalem Artichoke (Helianthus tuberosus) as Cheap Substrate and Comparison with Pure Chicory Inulin. Prep. Biochem. Biotechnol. 2023, 53, 101–107. [Google Scholar] [CrossRef]
- Khuenpet, K.; Jittanit, W.; Sirisansaneeyakul, S.; Srichamnong, W. Inulin Powder Production from Jerusalem Artichoke (Helianthus tuberosus L.) Tuber Powder and Its Application to Commercial Food Products. J. Food Process. Preserv. 2017, 41, e13097. [Google Scholar] [CrossRef]
- Pinar, H.; Kara, K.; Hanci, F.; Kaplan, M. Nutritional Composition of Herbage of Different Jerusalem Artichoke Genotypes. J. Anim. Feed Sci. 2021, 30, 141–148. [Google Scholar] [CrossRef]
- Peng, H.; Wang, X.; Chen, K.; Yue, C.; Wang, L.; Bai, Z.; Han, S.; Zhang, Z.; Guo, J.; Luo, D. Effect of Long-Chain Inulin on the Rheological Properties, Water State, Gluten Structure, and Microstructure of Frozen Dough. Int. J. Food Sci. Technol. 2024, 59, 9117–9130. [Google Scholar] [CrossRef]
- Bedzo, O.K.K.; van Rensburg, E.; Görgens, J.F. Investigating the Effect of Different Inulin-Rich Substrate Preparations from Jerusalem Artichoke (Helianthus tuberosus L.) Tubers on Efficient Inulooligosaccharides Production. Prep. Biochem. Biotechnol. 2021, 51, 440–449. [Google Scholar] [CrossRef] [PubMed]
- Rößle, C.; Ktenioudaki, A.; Gallagher, E. Inulin and Oligofructose as Fat and Sugar Substitutes in Quick Breads (Scones): A Mixture Design Approach. Eur. Food Res. Technol. 2011, 233, 167–181. [Google Scholar] [CrossRef]
- Birkeland, E.; Gharagozlian, S.; Valeur, J.; Aas, A.M. Short-Chain Fatty Acids as a Link between Diet and Cardiometabolic Risk: A Narrative Review. Lipids Health Dis. 2023, 22, 40. [Google Scholar] [CrossRef]
- Shao, T.; Yu, Q.; Zhu, T.; Liu, A.; Gao, X.; Long, X.; Liu, Z. Inulin from Jerusalem Artichoke Tubers Alleviates Hyperglycaemia in High-Fat-Diet-Induced Diabetes Mice through the Intestinal Microflora Improvement. Br. J. Nutr. 2020, 123, 308–318. [Google Scholar] [CrossRef] [PubMed]
- Mutanda, T.; Mokoena, M.P.; Olaniran, A.O.; Wilhelmi, B.S.; Whiteley, C.G. Microbial Enzymatic Production and Applications of Short-Chain Fructooligosaccharides and Inulooligosaccharides: Recent Advances and Current Perspectives. J. Ind. Microbiol. Biotechnol. 2014, 41, 893–906. [Google Scholar] [CrossRef]
- Zhang, H.; Tong, H.; Yin, Q.; Qiu, Y.; Xu, H.; Li, S. Efficient Production of Ectoine from Jerusalem Artichoke Using Engineered Escherichia coli. Bioresour. Technol. 2025, 431, e132589. [Google Scholar] [CrossRef]
- Rubel, I.A.; Iraporda, C.; Manrique, G.D.; Genovese, D.B.; Abraham, A.G. Inulin from Jerusalem Artichoke (Helianthus tuberosus L.): From Its Biosynthesis to Its Application as Bioactive Ingredient. Bioact. Carbohydr. Diet. Fibre 2021, 26, e100281. [Google Scholar] [CrossRef]
- Ni, D.; Zhang, S.; Liu, X.; Zhu, Y.; Xu, W.; Zhang, W.; Mu, W. Production, Effects, and Applications of Fructans with Various Molecular Weights. Food Chem. 2024, 437, 137895. [Google Scholar] [CrossRef] [PubMed]
- Zahoor, I.; Mir, T.A.; Ayoub, W.S.; Farooq, S.; Ganaie, T.A. Recent Applications of Microwave Technology as Novel Drying of Food—Review. Food Humanit. 2023, 1, 92–103. [Google Scholar] [CrossRef]
- Riaz, S.; Kabir, A.; Haroon, A.; Ali, A.; Faisal Manzoor, M. Food Dehydration Recent Advances and Approaches. In A Comprehensive Review of the Versatile Dehydration Processes; Intech Open: London, UK, 2023. [Google Scholar] [CrossRef]
- Santos, A.A.d.L.; Leal, G.F.; Marques, M.R.; Reis, L.C.C.; Junqueira, J.R.d.J.; Macedo, L.L.; Corrêa, J.L.G. Emerging Drying Technologies and Their Impact on Bioactive Compounds: A Systematic and Bibliometric Review. Appl. Sci. 2025, 15, 6653. [Google Scholar] [CrossRef]
- Rattanadecho, P.; Makul, N. Microwave-Assisted Drying: A Review of the State-of-the-Art. Dry. Technol. 2016, 34, 1–38. [Google Scholar] [CrossRef]
- Ramachandran, R.P.; Nadimi, M.; Cenkowski, S.; Paliwal, J. Advancement and Innovations in Drying of Biopharmaceuticals, Nutraceuticals, and Functional Foods. Food Eng. Rev. 2024, 16, 540–566. [Google Scholar] [CrossRef]
- Osae, R.; Essilfie, G.; Alolga, R.N.; Bonah, E.; Ma, H.; Zhou, C. Drying of Ginger Slices—Evaluation of Quality Attributes, Energy Consumption, and Kinetics Study. J. Food Process Eng. 2020, 43, e13348. [Google Scholar] [CrossRef]
- Espinoza-Espinoza, L.A.; Juárez-Ojeda, C.E.; Ruiz-Flores, L.A.; Moreno-Quispe, L.A.; Anaya-Palacios, M.S.; Cárdenas-Quintana, H. Influence of Convection Drying with Hot Air on the Physicochemical and Phytochemical Properties of Green Banana Flour (Musa cavendish). Front. Sustain. Food Syst. 2023, 7, 1204349. [Google Scholar] [CrossRef]
- ElGamal, R.; Song, C.; Rayan, A.M.; Liu, C.; Al-Rejaie, S.; ElMasry, G. Thermal Degradation of Bioactive Compounds during Drying Process of Horticultural and Agronomic Products: A Comprehensive Overview. Agronomy 2023, 13, 1580. [Google Scholar] [CrossRef]
- Man, Y.; Tong, J.; Wang, T.; Wang, S.; Xu, H. Study on Intermittent Microwave Convective Drying Characteristics and Flow Field of Porous Media Food. Energies 2023, 16, 441. [Google Scholar] [CrossRef]
- Maskan, M. Drying, Shrinkage and Rehydration Characteristics of Kiwifruits during Hot Air and Microwave Drying. J. Food Eng. 2001, 48, 177–182. [Google Scholar] [CrossRef]
- Jia, Y.; Khalifa, I.; Hu, L.; Zhu, W.; Li, J.; Li, K.; Li, C. Influence of Three Different Drying Techniques on Persimmon Chips’ Characteristics: A Comparison Study among Hot-Air, Combined Hot-Air-Microwave, and Vacuum-Freeze Drying Techniques. Food Bioprod. Process. 2019, 118, 67–76. [Google Scholar] [CrossRef]
- Huang, J.; Zhang, M. Effect of Three Drying Methods on the Drying Characteristics and Quality of Okra. Dry. Technol. 2016, 34, 900–911. [Google Scholar] [CrossRef]
- Sarimeseli, A. Microwave Drying Characteristics of Coriander (Coriandrum sativum L.) Leaves. Energy Convers. Manag. 2011, 52, 1449–1453. [Google Scholar] [CrossRef]
- Demir, V.; Gunhan, T.; Yagcioglu, A.K.; Degirmencioglu, A. Mathematical Modelling and the Determination of Some Quality Parameters of Air-Dried Bay Leaves. Biosyst. Eng. 2004, 88, 325–335. [Google Scholar] [CrossRef]
- Henderson, S.M.; Pabis, S. Grain Drying Theory II: Temperature Effects on Drying Coefficients. J. Agric. Eng. Res. 1961, 6, 169–174. [Google Scholar]
- Dandamrongrak, R.; Young, G.; Mason, R. Evaluation of Various Pre-Treatments for the Dehydration of Banana and Selection of Suitable Drying Models. J. Food Eng. 2002, 55, 139–146. [Google Scholar] [CrossRef]
- Arslan, D.; Özcan, M.M.; Menges, H.O. Evaluation of Drying Methods with Respect to Drying Parameters, Some Nutritional and Colour Characteristics of Peppermint (Mentha × Piperita L.). Energy Convers. Manag. 2010, 51, 2769–2775. [Google Scholar] [CrossRef]
- Soysal, Y.; Öztekin, S.; Eren, Ö. Microwave Drying of Parsley: Modelling, Kinetics, and Energy Aspects. Biosyst. Eng. 2006, 93, 403–413. [Google Scholar] [CrossRef]
- Re, R.; Pellegrini, N.; Proteggente, A.; Pannala, A.; Yang, M.; Rice-Evans, C. Antioxidant Activity Applying an Improved ABTS Radical Cation Decolorization Assay. Free Radic. Biol. Med. 1999, 26, 1231–1237. [Google Scholar] [CrossRef] [PubMed]
- Brand-Williams, W.; Cuvelier, M.E.; Berset, C. Use of a Free Radical Method to Evaluate Antioxidant Activity. LWT—Food Sci. Technol. 1995, 28, 25–30. [Google Scholar] [CrossRef]
- Velu, V.; Nagender, A.; Prabhakara Rao, P.G.; Rao, D.G. Dry Milling Characteristics of Microwave Dried Maize Grains (Zea mays L.). J. Food Eng. 2006, 74, 30–36. [Google Scholar] [CrossRef]
- Hassoon, W.H.; Dziki, D.; Miś, A.; Biernacka, B. Wheat Grinding Process with Low Moisture Content: A New Approach for Wholemeal Flour Production. Processes 2021, 9, 32. [Google Scholar] [CrossRef]
- Dziki, D. Effect of Preliminary Grinding of the Wheat Grain on the Pulverizing Process. J. Food Eng. 2011, 104, 585–591. [Google Scholar] [CrossRef]
- Feng, H.; Tang, J.; Cavalieri, R.P.; Plumb, O.A. Heat and Mass Transport in Microwave Drying of Porous Materials in a Spouted Bed. AIChE J. 2001, 47, 1499–1512. [Google Scholar] [CrossRef]
- Khuenpet, K.; Jittanit, W.; Sirisansaneeyakul, S. Comparison of Hot Air and Superheated Steam Drying of Jerusalem Artichoke (Helianthus tuberosus L.) Tubers and Inulin Powder Production. Trans. ASABE 2015, 58, 1113–1125. [Google Scholar] [CrossRef]
- Cecchini, M.; Contini, M.; Massantini, R.; Monarca, D.; Moscetti, R. Effects of Controlled Atmospheres and Low Temperature on Storability of Chestnuts Manually and Mechanically Harvested. Postharvest Biol. Technol. 2011, 61, 131–136. [Google Scholar] [CrossRef]
- Doymaz, İ. Effect of Pre-Treatment and Air Temperature on Drying Kinetics and Quality of Jerusalem Artichoke. Sci. Study Res. Chem. Chem. Eng. Biotechnol. Food Ind. 2018, 19, 395–409. [Google Scholar]
- Inchuen, S.; Porniammongkol, O.; Duangkhamchan, W. Effect of Drying Methods on Chemical and Functional Properties Jerusalem Artichoke (Helianthus tuberosus L.) Powders. Adv. Mater. Res. 2014, 931–932, 1512–1517. [Google Scholar] [CrossRef]
- Eliasson, L.; Labrosse, L.; Ahrné, L. Effect of Drying Technique and Particle Size of Bilberry Press Cake on the Extraction Efficiency of Anthocyanins by Pressurized Carbon Dioxide Extraction. LWT 2017, 85, 510–516. [Google Scholar] [CrossRef]
- Rudy, S.; Dziki, D.; Biernacka, B.; Polak, R.; Krzykowski, A.; Krajewska, A.; Stanisławczyk, R.; Rudy, M.; Żurek, J.; Rudzki, G. Impact of Drying Process on Grindability and Physicochemical Properties of Celery. Foods 2024, 13, 2585. [Google Scholar] [CrossRef]
- Krajewska, A.; Dziki, D.; Yilmaz, M.A.; Özdemir, F.A. Physicochemical Properties of Dried and Powdered Pear Pomace. Molecules 2024, 29, 742. [Google Scholar] [CrossRef]
- Jiao, J.; Wang, J.; Zhou, M.; Ren, X.; Zhan, W.; Sun, Z.; Zhao, H.; Yang, Y.; Liang, M.; Ende, W. Van den Characterization of Fructan Metabolism during Jerusalem Artichoke (Helianthus tuberosus L.) Germination. Front. Plant Sci. 2018, 9, 1384. [Google Scholar] [CrossRef]
- Zhang, X.; Zhu, X.; Shi, X.; Hou, Y.; Yi, Y. Extraction and Purification of Inulin from Jerusalem Artichoke with Response Surface Method and Ion Exchange Resins. ACS Omega 2022, 7, 12048–12055. [Google Scholar] [CrossRef]
- Cheng, X.; Pan, L.; Li, N.; Chen, J. Moisture Diffusivity Characteristics and Model Fitting of Jerusalem Artichoke(Helianthus tuberosus L.) during Microwave Vacuum Drying. Sci. Technol. Food Ind. 2022, 43, 33–40. [Google Scholar] [CrossRef]
- Aksüt, B.; Dursun, S.K.; Polatcı, H.; Taşova, M. Effects of Microwave Dryers on the Properties of Jerusalem Artichoke: Physico-Chemical, Thermo-Physical, Energy Consumption. J. Microw. Power Electromagn. Energy 2023, 57, 28–43. [Google Scholar] [CrossRef]
- Redondo-Cuenca, A.; Herrera-Vázquez, S.E.; Condezo-Hoyos, L.; Gómez-Ordóñez, E.; Rupérez, P. Inulin Extraction from Common Inulin-Containing Plant Sources. Ind. Crops Prod. 2021, 170, 113726. [Google Scholar] [CrossRef]


Disclaimer/Publisher’s Note: The statements, opinions and data contained in all publications are solely those of the individual author(s) and contributor(s) and not of MDPI and/or the editor(s). MDPI and/or the editor(s) disclaim responsibility for any injury to people or property resulting from any ideas, methods, instructions or products referred to in the content. |
© 2025 by the authors. Licensee MDPI, Basel, Switzerland. This article is an open access article distributed under the terms and conditions of the Creative Commons Attribution (CC BY) license (https://creativecommons.org/licenses/by/4.0/).