Article

Modelling the Effect of Vertical Alternating Current Electric Field on the Evaporation of Sessile Droplets


School of Energy and Power Engineering, University of Shanghai for Science and Technology, Shanghai 200093, China
*
Author to whom correspondence should be addressed.
Processes 2026, 14(7), 1066; https://doi.org/10.3390/pr14071066
Submission received: 4 March 2026 / Revised: 23 March 2026 / Accepted: 25 March 2026 / Published: 26 March 2026
(This article belongs to the Section Energy Systems)

Abstract

We developed an arbitrary Lagrangian–Eulerian (ALE)-based multiphysics model for evaporation from a contact-line-pinned sessile drop of neat water subject to a vertically oriented sinusoidal alternating current (AC) electric field applied across parallel-plate electrodes. The framework fully couples electrostatics, incompressible flow, heat transfer with evaporative cooling, and transient vapour transport in air, and includes an instantaneous, voltage-controlled electrowetting contact-angle response under constant-contact-radius conditions. Validation against published data shows that the model captures both pinned-droplet evaporation and electrically induced deformation. Because Maxwell traction scales with the squared electric-field magnitude, droplet height and contact angle exhibit a robust 2:1 frequency-doubled response, producing two peak–trough events per voltage period. The resulting periodic deformation drives oscillatory interfacial shear and internal recirculation, yielding a synchronous double-peaked evaporative-flux waveform. Gas-side analysis quantifies a time-varying diffusion-layer thickness via a characteristic diffusion length; two thinning events per period coincide with flux maxima, indicating that AC enhancement is dominated by periodic compression of the vapour boundary layer and reduced gas-side mass-transfer resistance. Increasing voltage amplitude (0–60 kV) strongly accelerates volume loss, while frequency has a secondary effect: the cycle-averaged flux rises from 1 to 10 Hz but decreases slightly at 20 Hz due to phase lag and weaker boundary-layer modulation.

1. Introduction

Evaporation from sessile droplets is prevalent in nature and in many engineering applications, such as spray cooling [1], inkjet printing [2], coating [3], and DNA mapping [4]. The process is intrinsically multiphysical: heat is delivered from the substrate, phase change takes place at the liquid–gas interface, and the vapour produced is conveyed through the ambient gas. Consequently, evaporation is governed by heat conduction within the droplet, evaporative cooling at the interface, internal circulation (for example, thermocapillary convection), and vapour diffusion—sometimes accompanied by gas-phase convection—particularly near the contact line, where transport is most intense. Ultimately, the observed evaporation dynamics reflect the coupled evolution of droplet shape, internal flow, temperature, and the local vapour field.
In recent years, considerable efforts have been directed towards enhancing droplet evaporation performance using external physical fields, because such approaches offer effective and controllable regulation of interfacial transport. Among external stimuli such as acoustic [5], magnetic [6] and electric fields [7,8], electric-field-assisted approaches have attracted particular attention because of their high efficiency, low energy consumption and ease of implementation in thermal management systems. Experiments have reported enhanced evaporation under non-uniform electric fields, which has been attributed to reduced effective surface tension and intensified gas-side transport [9]. In addition, field-induced deformation can modify contact-line characteristics and heat transfer across substrates of different wettability, thereby altering evaporation behaviour and thermal performance [10]. Electric actuation can also accelerate evaporation on inclined substrates [11]. Conversely, evaporation suppression has been observed in some cases—for example, when electric forcing restructures the internal flow and weakens Marangoni convection in saline droplets [12]. These seemingly contradictory observations suggest that the dominant mechanism is highly condition-dependent and may shift among: (a) morphology- and contact-line-controlled heat supply, (b) liquid-side convection and thermal homogenization, and (c) gas-side modulation of the vapour boundary layer.
Numerical simulations have therefore emerged as a powerful tool for elucidating coupled transport processes and interfacial dynamics that are difficult to resolve experimentally. Compared with purely experimental investigations, numerical methods enable detailed, concurrent analysis of droplet deformation, internal flow, temperature distributions, vapour-concentration fields and electric-field-induced stresses. For example, Wang et al. [13] adopted an arbitrary Lagrangian–Eulerian (ALE) formulation to accurately track droplet deformation in the presence of a direct-current (DC) electric field, and examined the corresponding velocity, temperature, and concentration fields. In addition, Yang et al. [14] established a transient, ALE-based framework for substrate-free droplet evaporation, further demonstrating the ability of ALE formulations to resolve moving interfaces and time-dependent evaporation dynamics. Interface-capturing methods, approaches including the level-set method [15], and mesoscopic approaches, such as notably the lattice Boltzmann method (LBM) [16], have likewise been employed to investigate interfacial dynamics and transport under electric forcing. Nazari et al. [17] developed a numerical model based on the level-set and ghost-fluid methods to simulate the impact of a conductive droplet on a hot surface under an applied electric field in the Leidenfrost regime.Nevertheless, most existing numerical studies have focused on DC or quasi-steady electric fields. By contrast, an alternating current (AC) electric field introduces intrinsically time-dependent forcing and additional time scales that may fundamentally reshape deformation dynamics, internal circulation modes and near-interface vapour transport.
Unlike uniform DC fields, for which enhancement can depend strongly on field orientation, an AC electric field is inherently time-varying and can induce periodic deformation and flow restructuring, thereby non-steadily modulating interfacial heat and mass fluxes and the gas-side vapour boundary layer. However, systematic investigations of AC-field-modulated evaporation of sessile droplets are still scarce, because most AC work has focused on electrowetting-driven actuation rather than evaporation and heat-transfer enhancement [18]. To elucidate how a vertically applied alternating electric field influences the evaporation of sessile droplets, we develop a fully coupled multiphysics model within an ALE framework and systematically investigate the evaporation dynamics of pinned water droplets subjected to a sinusoidal AC electric field. The results show that both droplet deformation and contact-angle evolution exhibit a pronounced frequency-doubling response, oscillating at twice the applied field frequency. Moreover, the AC electric field enhances evaporation by periodically modulating the thickness of the gas-phase vapour boundary layer, thereby reducing gas-phase mass-transfer resistance. Further analysis indicates that the voltage amplitude primarily governs the mean enhancement in evaporation, whereas the field frequency plays a comparatively minor modulatory role. These findings advance the fundamental understanding of electrically controlled droplet evaporation and provide a theoretical basis for applications in microfluidics as well as heat and mass transfer.
The present study is deliberately restricted to a pure-water Newtonian droplet under pinned constant-contact-radius (CCR) conditions, enabling the fundamental coupling among Maxwell electric stress, droplet deformation, electrohydrodynamic circulation, gas-side diffusion-layer modulation and evaporation enhancement to be isolated with minimal rheological complexity. In complex fluids with viscoelastic, yield-stress or elastoviscoplastic character, additional mechanisms including stress memory, elastic energy storage, transient yielding, post-forcing relaxation/recovery, free-surface instabilities and more general moving-contact-line dynamics may substantially alter the response to AC forcing [19]. This view is also consistent with recent perspectives in non-Newtonian fluid mechanics, which emphasise stress memory, multiphysics coupling, and unified descriptions of oscillatory flows. Therefore, extending the present framework to rheologically complex droplets with moving contact lines and interfacial instabilities constitutes an important direction for future work.

2. Numerical Methods

This section describes the underlying physical model and the governing set of equations. Numerical simulations were performed using the finite element method (FEM) in COMSOL Multiphysics 6.1, which provides comprehensive capabilities for multiphysics coupling. Time integration of the fully coupled transient problem is carried out with a backward differentiation formula (BDF) scheme, whose order is automatically adjusted between 1 and 2 to enable adaptive time stepping and enhance numerical stability. A time-dependent solver is employed, with the step size controlled by residual-based convergence; the initial time step is chosen as 1 × 10⁻⁷ s. The assembled linear systems were solved using the PARDISO direct solver implemented in COMSOL Multiphysics 6.1. Nonlinear behaviour was handled via Newton’s method with a constant damping factor ( α = 1), and the Jacobian was updated at each iteration.

2.1. Computational Domain

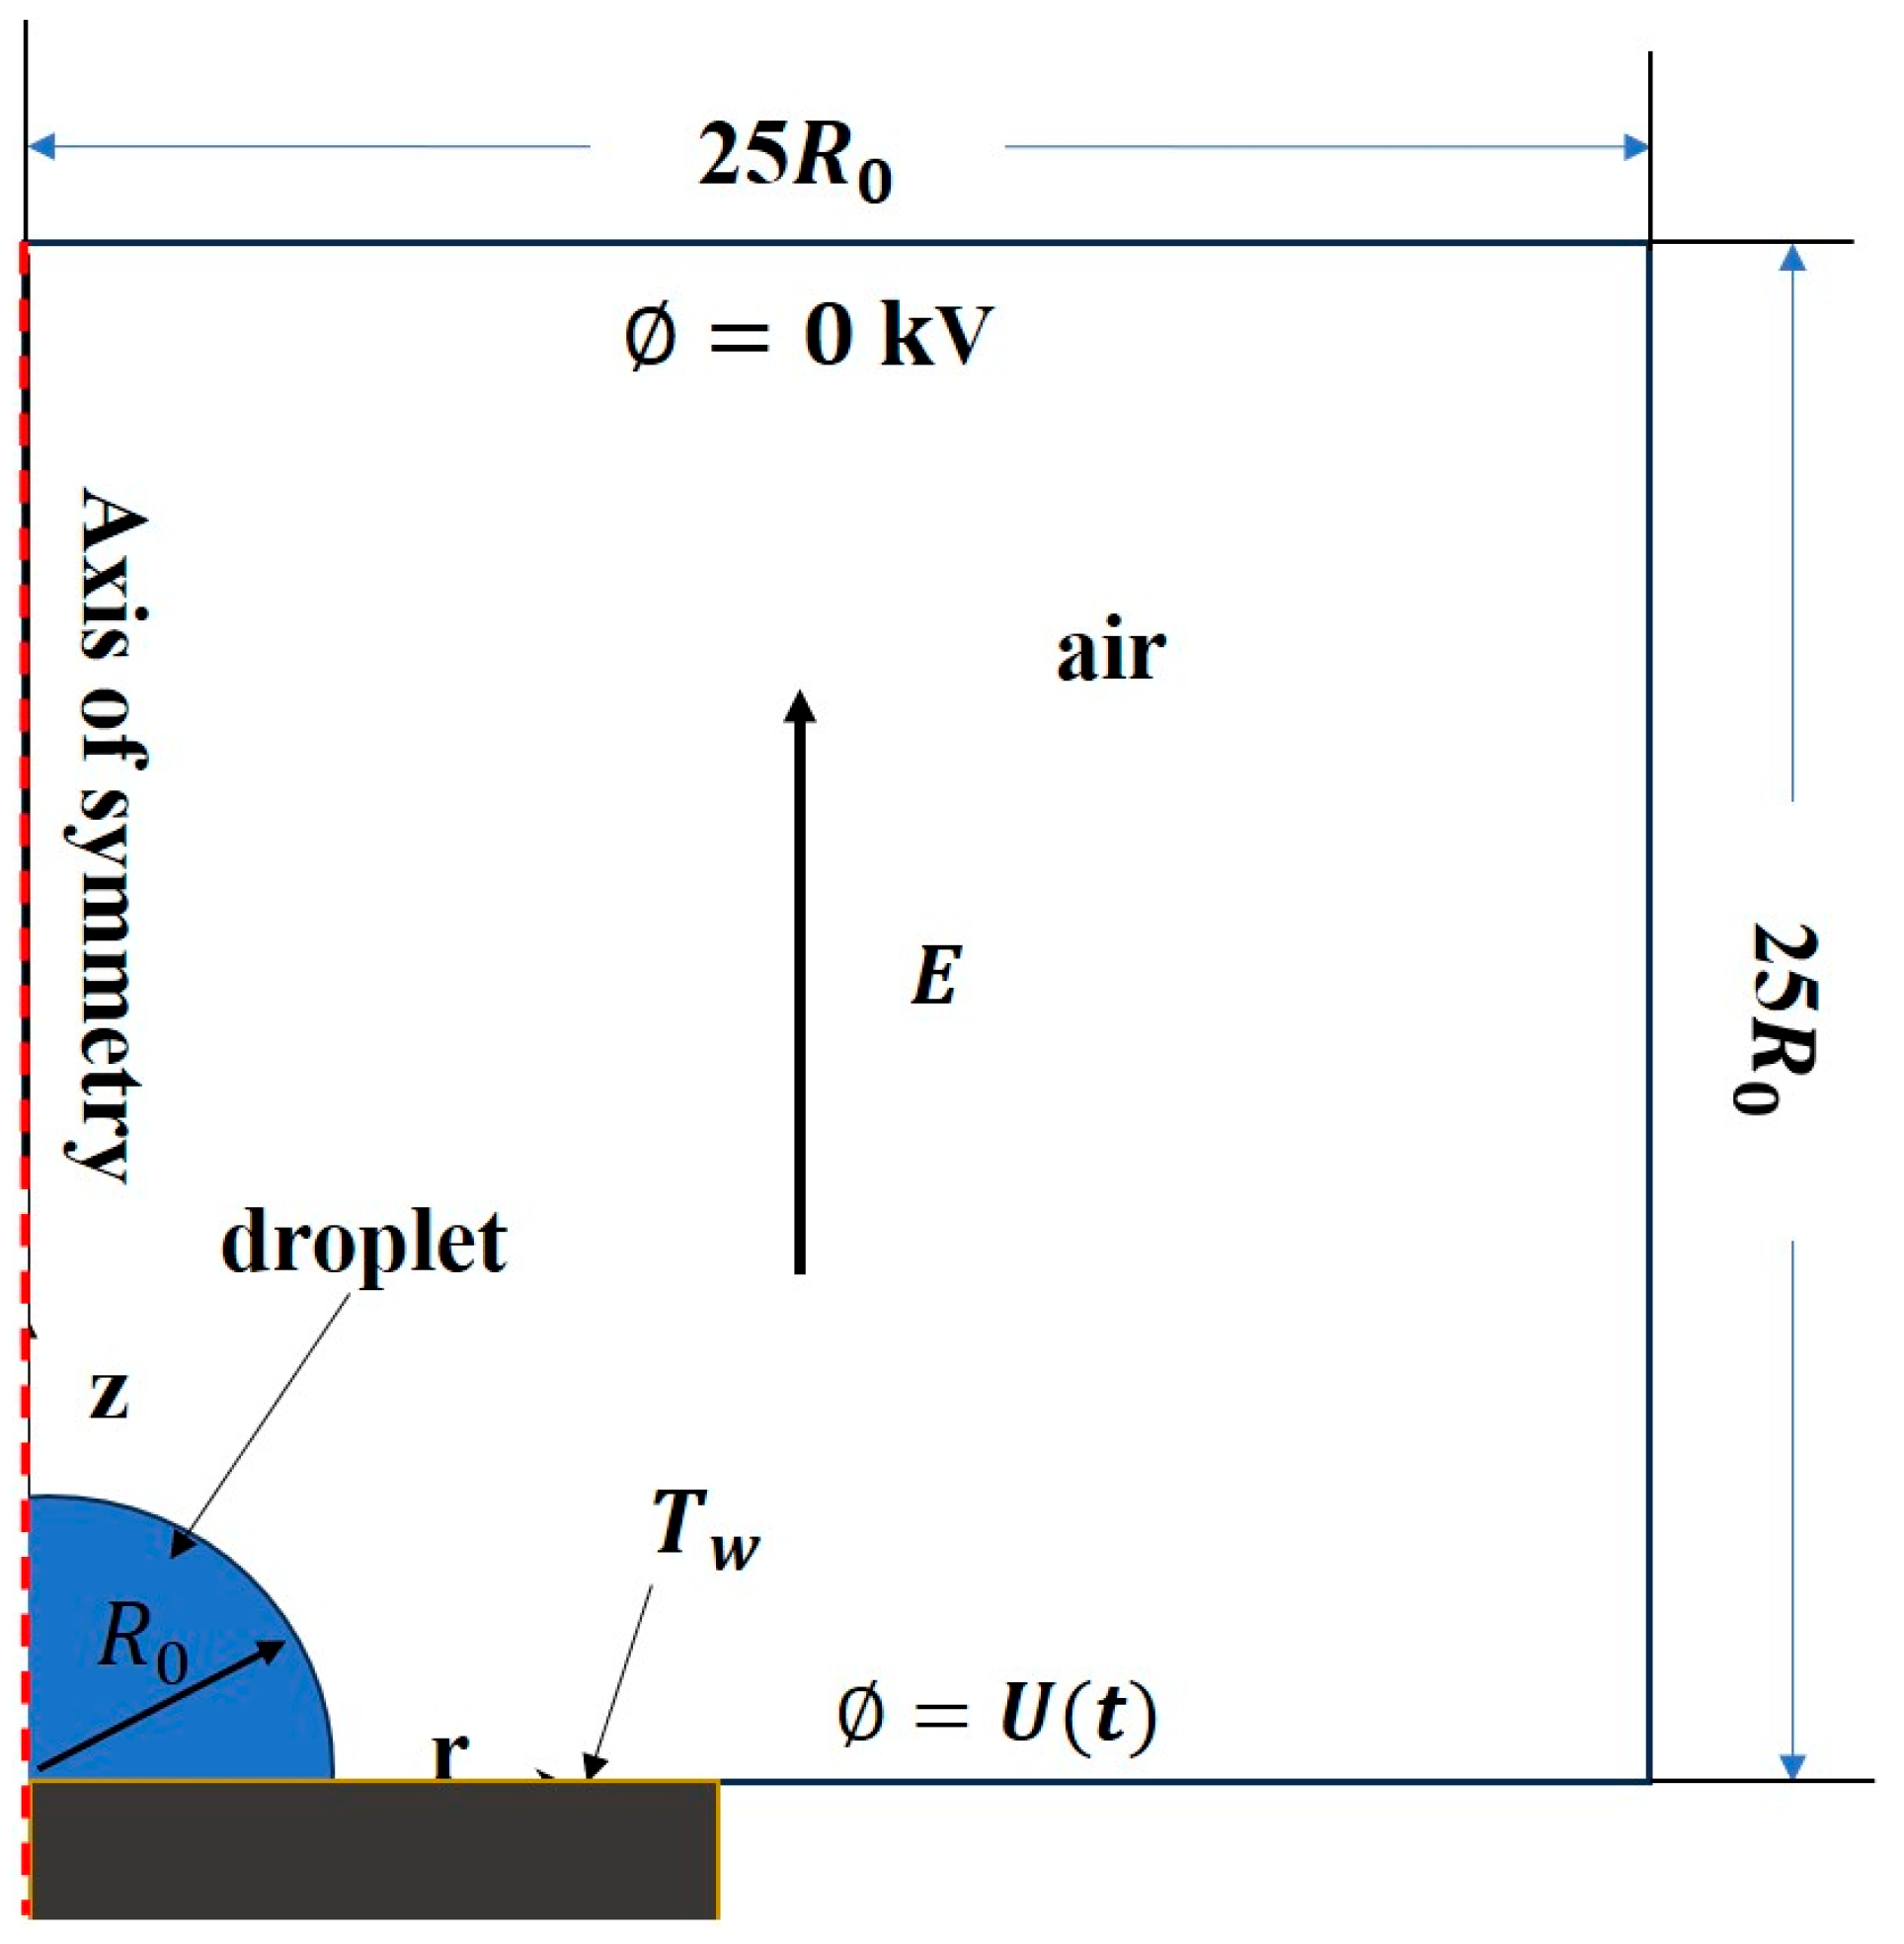
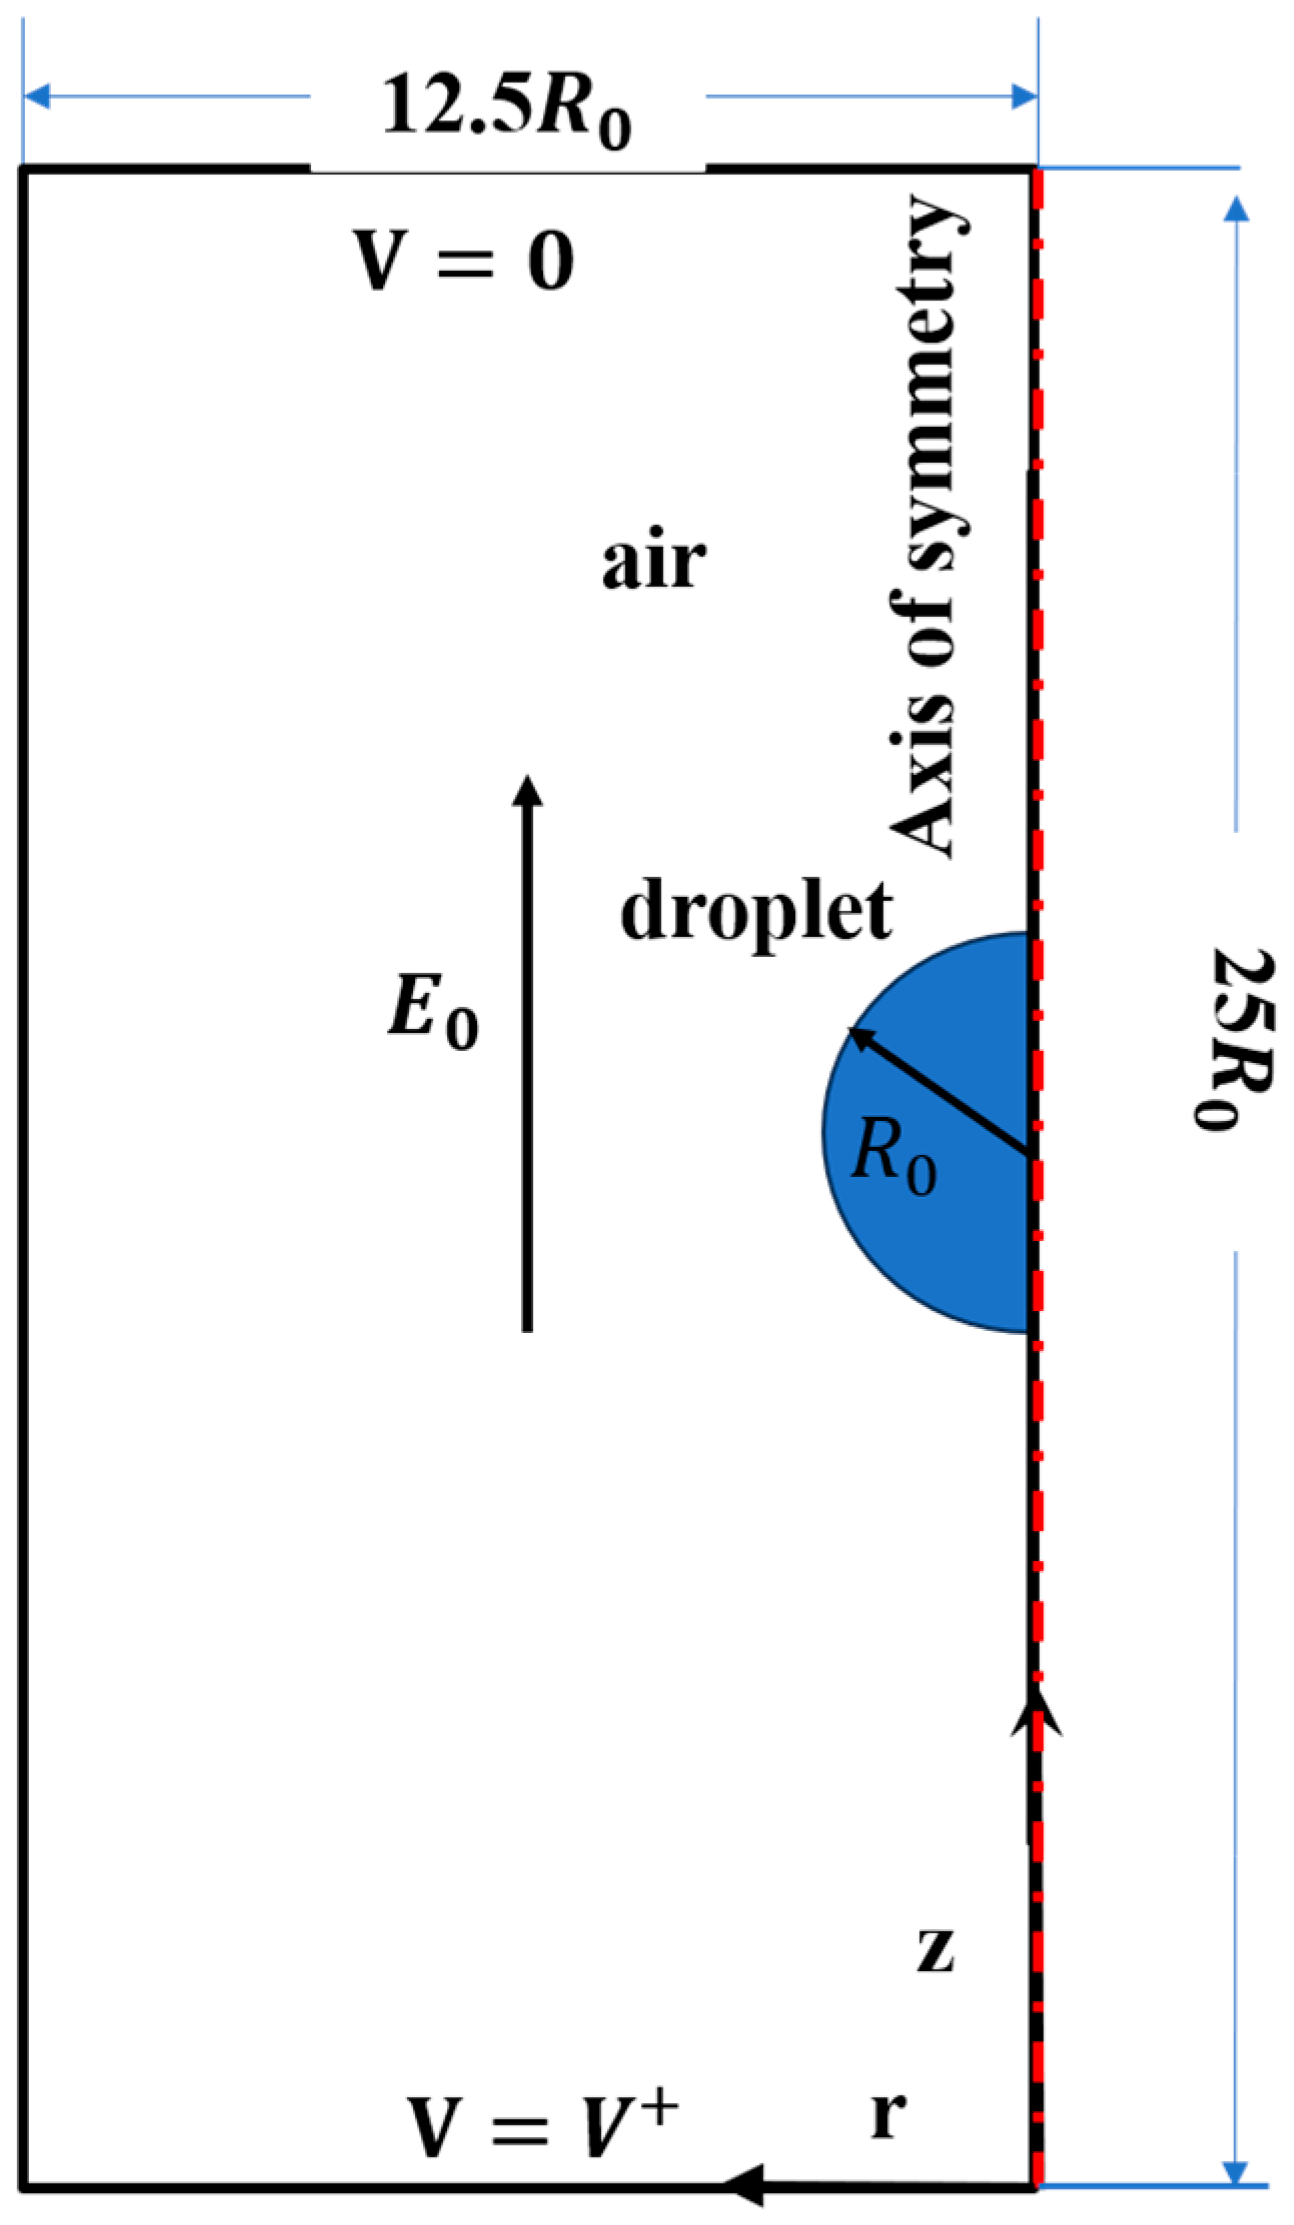
Figure 1 schematically depicts the computational configuration for simulating droplet evaporation, having an initial radius R 0 under an AC electric field. To reduce the computational cost, a two-dimensional axisymmetric geometry is adopted. The droplet radius is taken as R 0 , and the applied electric field is modelled as that generated between two parallel-plate electrodes. The substrate and the lower boundary of the air domain are assigned a positive potential, while the upper boundary is grounded. To mitigate edge effects, the square air domain spans 25 R 0 laterally, thereby maintaining an electric field that is nearly uniform in the droplet vicinity and directed opposite to gravity.

2.2. Material Properties

In this study, the evaporation and deformation of pure water droplets subjected to an AC electric field were examined. Material properties were calculated by Equations (1)–(3), and properties at 25 °C are summarised in Table 1.
Surface tension of water, γ T (mN/m), for T < 100 °C is given by [20]
γ T = 75.796 0.154 ( T 273.15 ) 0.00024 ( T 273.15 ) 2
where T denotes the temperature in kelvin (K).
The latent heat of evaporation of water, L (kJ/kg), is evaluated using Ref. [21]:
L = ( 2.5314 ( T 273.15 ) + 2508.6 )
For the diffusion coefficient D (m2/s), we adopt the temperature scaling proposed in Ref. [22]:
D = D 0 T T 0 2
where D 0 (m2/s) denotes the diffusion coefficient evaluated at the reference temperature T 0 (K).

2.3. Assumptions

The numerical model is based on the following assumptions for droplet evaporation in an AC electric field:
1.
The droplet is initially modelled as a spherical cap; accordingly, an arc is used to represent the droplet profile in the two-dimensional axisymmetric geometry. Once evaporation begins, the droplet morphology evolves through the joint effects of AC-electric-field-induced stresses and the prescribed boundary conditions; the liquid–gas interface is updated using an ALE moving-mesh formulation.
2.
The characteristic molecular transfer time across the gas–liquid interface ( t r ~ 10 10 s) is far shorter than the diffusive timescale in air ( t D = R d 2 / D ) [23]. We therefore prescribe saturation at the droplet surface, such that evaporation is controlled mainly by vapour transport in the gas. For R d = 1.44 mm, t D 0.08 0.10 s, comparable to the AC period for f 10 Hz (period 0.01 s). Accordingly, gas-phase vapour transport is treated as transient in the simulations.
3.
Given the low flow velocities, the liquid and gas phases are treated as incompressible.
4.
The droplet is in the micro-scale regime, yielding a Bond number B o = ρ g R d 2 / ( 2 γ g ) ~ 10 2 1 . Consequently, gravitational effects are negligible compared with surface tension and are therefore neglected.
5.
In the present model, corona discharge and space-charge injection in air are neglected, such that the classical ionic-wind mechanism is absent [24]. Gas-phase motion associated with evaporation is represented solely by Stefan outflow [25]. From interfacial mass conservation, the characteristic Stefan-flow velocity scales as u s J ¯ / ρ g [26]. Using J ¯ = 5.26 × 10 3 kg/(m2∙s) and ρ g 1.2 kg/m3 gives u s 4.4 × 10 3 m/s, which is much smaller than the cycle-averaged maximum interfacial velocity, u ¯ m a x = 0.210 m/s, yielding u s / u ¯ m a x 0.021 . Gas-phase Stefan convection is therefore regarded as a secondary effect under the present conditions.
6.
Evaporation is assumed to occur in the CCR mode, with the three-phase contact line pinned. Under this constraint, we examine how a vertical AC electric field influences the evaporation process.
Evaporation is assumed to proceed in the CCR mode, with the three-phase contact line remaining pinned. Within this framework, we examine how a vertical AC electric field modulates the evaporation process. This assumption defines an idealised pinned-contact-line limit, enabling the field-induced interfacial deformation and vapour-flux modulation to be isolated. In practice, however, depinning or stick–slip motion may arise during electrowetting-assisted evaporation owing to contact-angle hysteresis and the interplay among electric, capillary and viscous forces. If contact-line motion is permitted, part of the electrical forcing may be accommodated through radial spreading or recession of the wetted area, rather than being manifested entirely as droplet-shape oscillation under fixed-radius conditions [27]. Consequently, the present model may yield an upper-bound estimate of the evaporation enhancement, because suppressing contact-line migration tends to amplify droplet deformation and the associated modulation of evaporative flux.

2.4. Governing Equations

In the present work, the computational model of droplet evaporation is based on the ALE method, which introduces a third coordinate system (the grid coordinate) to describe mesh motion. The governing partial differential equations are then formulated in this grid-coordinate framework. For brevity, we omit the derivation of the ALE-based governing equations; details are available in ref. [14]. Droplet evaporation is governed by the coupled interactions among hydrodynamics, heat transfer, vapour transport and electrostatics.
The governing equations are summarised below.

2.4.1. Flow Equations

The incompressible-flow model is governed by the continuity equation and the momentum balance:
u = 0
ρ u t + ρ ( u c ) u = [ P I + μ ( u + ( u ) T ) ] + F
Here, u denotes the fluid velocity and u c is the ALE convective velocity, defined as the velocity of the material relative to the moving mesh. The remaining symbols are: P (pressure), ρ (density), μ (dynamic viscosity), I (identity tensor), and F (total body force per unit volume). Buoyancy-driven natural convection is regarded as a secondary effect under the present conditions. Using the cycle-averaged temperature difference, T ¯ = 3.68 K, and droplet radius, R d = 1.44 mm, the droplet-scale Rayleigh number is estimated to be R a 7.4 × 10 1 , or O ( 10 2 ) , indicating weak buoyancy at the present scale. By contrast, the corresponding Marangoni number reaches M a T 6.8 × 10 3 , or O ( 10 3 ) , indicating that thermocapillary flow dominates over buoyancy. This interpretation is consistent with prior studies showing that, in small evaporating sessile droplets, Marangoni effects tend to dominate over thermal Rayleigh convection [28,29].

2.4.2. Thermal Transport in Liquid and Gas Phases

The transient energy equation governing heat transfer in the liquid and gas phases is written as follows:
ρ C P T t + ρ C P ( u c ) T = ( k T )

2.4.3. Heat-Conduction Equation in the Solid

Heat conduction in the solid substrate is described by the transient heat-conduction equation:
ρ C P T t = ( k T )
Here, C P denotes the specific heat at constant pressure, u c the convective velocity, and k the coefficient of thermal conductivity.

2.4.4. Vapour Transfer Equation

Vapour transport in the gas phase is governed by the transient convection–diffusion equation:
c t + ( u c ) c = ( D c )
Here, c is defined as the vapour concentration.

2.4.5. Electrostatic Governing Equations

The electric response is characterised by a timescale much larger than that of magnetic phenomena [30]; hence, a quasi-electrostatic (curl-free) approximation applies:
× E = 0
The electric field is obtained from the scalar potential as
E =
The constitutive relation for the electric displacement field D is given by
D = ε 0 ε r E
where ε 0 denotes the vacuum permittivity and ε r the relative permittivity.
The resulting electrostatic problem is governed by the Poisson equation [31]:
D = ( ε 0 ε r E ) = ρ v ,
where ρ v is the volume charge density, satisfying
ρ ν t + ( ρ ν u c ) = ( σ )
where σ is the liquid conductivity. In the present model, the droplet is assumed to be pure water with σ = 5.5 × 10 6 S/m at room temperature. The associated charge relaxation time is τ e = ε 0 ε r / σ 1.26 × 10 4 s. For the applied AC field with f = 1–20 Hz (period T = 1 / f = 1 0.05 s), the non-dimensional parameter ω τ e = 2 π f τ e ranges from 7.9 × 10 4 to 1.6 × 10 2 , i.e., ω τ e 1 . This indicates that free charges relax much faster than the field oscillation and the electric response is quasi-electrostatic (fast charge-relaxation limit of the leaky-dielectric regime) under the present conditions.
It is important to note that in the aforementioned governing equations, u denotes the velocity at the grid points, whereas u c denotes the convective velocity, given by the material-point velocity minus the grid-point velocity.
Under an applied AC electric field, the electric-field force exerted on the drop may be treated as the source term F   in Equation (5), which is obtained from the Maxwell stress tensor T M [23]:
F = T M
where the T M is expressed as
T M = ε 0 ε r E E 1 2 ( E · E ) I
Here, E is the electric field intensity with the unit of V/m; ε 0 is the permittivity of free space with a value of 8.854 × 10 12 (F/m); and ε r is the relative permittivity.
Within the continuum surface force (CSF) framework, interfacial electric traction can be implemented numerically as an equivalent volumetric force distributed over a finite-thickness band adjacent to the liquid–gas interface, rather than being applied solely as a boundary traction on the sharp geometric interface [32]. Accordingly, electric-field effects are incorporated via the volumetric forcing term · T M in the momentum equation, which drives droplet deformation and the associated flow.

2.5. Boundary and Initial Conditions

2.5.1. At r = 0

Along the symmetry axis, the following axisymmetric condition is applied:
u · n = 0   ,   n · P I + μ u + u T = 0   ,   n   · D c = 0   ,   n · k T = 0   ,   n · ε 0 ε r E = 0  

2.5.2. At the Far-Field Boundary ( r = 25 R 0 )

The following electrical boundary condition is imposed:
n ( ε 0 ε r E ) = 0

2.5.3. Boundary Conditions at the Droplet Liquid–Gas Interface

Mechanical equilibrium in terms of interfacial stresses is enforced on the liquid–gas interface:
n τ g = n τ l + f s t
Here, τ l and τ g represent the overall stress tensors in both the liquid and gas phases, respectively; n is the unit normal vector to the interface; and f s t is the surface-tension force per unit area of interface, consisting of two contributions:
f s t = γ T ( s n ) n s γ T ( T )
where s denotes the surface-gradient operator, given by
s = ( I n n T )
The surface-tension term can be decomposed into normal and tangential components. Along the interface normal, the force balance yields
( n τ g n τ l ) n = γ T r c n
where r c is the radius of the curvature. Along the tangential direction, the balance is written as
( n τ g n τ l ) t = t s γ T ( T )
where t represents the interface unit tangent vector at the interface. The right-hand-side term accounts for the thermocapillary (Marangoni) shear induced by surface-temperature gradients, which drives Marangoni convection/flow [14].
The saturation vapour pressure of water [33]:
P s a t = e x p ( 9.487 3893 T 42.68 ) × 10 6
The interfacial saturation vapour concentration is prescribed as
c s a t = P s a t R T ,
The interfacial evaporation mass flux is evaluated as
J = M ( D c + u c ) n
where J represents the evaporative mass flux (kg/(m2 · s)), accounting for both diffusion and convective transport. The term u c in Equation (25) represents convection of vapour. M denotes the molar mass (g/mol), and n is the interfacial unit normal vector.
The gas-phase Stefan flow can be expressed as
u d u c = J 1 ρ d 1 ρ c n
Here, the subscripts d and c are used to indicate the dispersed and continuous phases, respectively.
The interfacial heat-flux jump associated with evaporative cooling is written as
n ( k c ( T ) c k d ( T ) d ) = J L

2.5.4. Other Boundary Conditions

In the CCR model, a no-slip condition is enforced on the liquid–solid interface so that the three-phase contact line (TPCL) remains stationary. On the dry solid surface, both no-slip and impermeability (no-penetration) conditions are enforced, implying zero tangential velocity and zero normal flux at the wall. The upper and right sides of the computational domain are treated as open (outer) boundaries, where appropriate open-boundary conditions are prescribed to represent the surrounding gas region. The substrate is held at a fixed temperature T w , whereas the outer-boundary temperature is prescribed as T 0 . The far-field (outer-boundary) vapour concentration is set to
c = R H c s a t
where R H denotes the relative humidity.
At z = 25 R 0 , the potential is set to 0 V, while at z = 0 , the potential is specified as U ( t ) . The applied voltage is assumed to be sinusoidal:
U ( t ) = U 0 s i n ( 2 π f t )

2.5.5. The Dynamic Contact Angle

The relationship between the droplet solid–liquid contact angle, the interfacial tension near the three-phase contact line, and the applied voltage is governed by Young’s equation:
γ S L O F F = γ S G γ L G c o s θ s , O F F
Here, “OFF” refers to the field-free state; θ s , O F F denotes the solid–liquid–gas contact angle in the absence of an applied electric field; and γ S G , γ S L , and γ L G respectively denote the interfacial tensions associated with the solid–gas, solid–liquid, and liquid–gas boundaries.
Applying an electric potential between the solid surface and the droplet causes opposite charges to accumulate near the TPCL on the solid side. This charge redistribution reduces the surface energy and, in turn, decreases the surface tension. The voltage dependence of the surface tension is given by the Lippmann equation:
c o s θ s , O N = c o s θ s , O F F + ( ε 0 ε d / 2 γ L G d ) U ( t ) 2
where ε 0 , ε d , and d denote the vacuum permittivity, the relative permittivity, and the dielectric-layer thickness, respectively. The symbol θ s , O N refers to the droplet contact angle on the solid surface when an external voltage U ( t ) is applied. To represent the time-dependent contact-angle response of a sessile droplet under an AC electric field, we employ an instantaneous dynamic contact-angle model for AC forcing proposed by Ahmad et al. [34], which is based on molecular dynamics theory. In this model, electrowetting is incorporated through a voltage-squared contribution, while contact-line dissipation is described by a term proportional to the contact-line velocity, yielding
θ s , D = c o s 1 c o s θ s , O F F + ( ε 0 ε d / 2 γ L G d ) U ( t ) 2 ( f c l u c l / γ L G )
Here, θ s , O F F represents the static contact angle under field-free conditions; ε 0 is the vacuum permittivity; ε d and d ( d = 5 × 10 7 m) are the relative permittivity and thickness of the dielectric layer, respectively; γ L G denotes the liquid–gas interfacial tension; U ( t ) is the applied AC voltage specified by the electrical boundary condition; f c l is the contact-line friction coefficient; and u c l is the contact-line velocity. The contact-line velocity can be expressed as the time rate of change in the droplet contact radius [17]:
u c l = d R d t = 0
with R being the droplet contact radius. In this work, the evaporation is assumed to follow the CCR mode with a pinned three-phase contact line; therefore, R is constant and u c l = 0 . Accordingly, the dissipation term in Equation (32) vanishes under CCR, and Equation (32) reduces to a voltage-controlled instantaneous electrowetting contact-angle response. Here, the CCR condition constrains the contact-line position (i.e., the contact radius) rather than the contact angle itself. Therefore, the time-dependent variation in the apparent contact angle represents electric-field-induced reshaping of the droplet free surface under a pinned contact line, rather than lateral motion of the three-phase contact line.

2.5.6. Initial Conditions

The gas and liquid velocities are initialised to 0 m/s, and a spatially uniform initial temperature T 0 is prescribed for the entire system. The gas-phase vapour concentration is set to c , while the volumetric charge density is initialised as 0 C/m3.
For clarity and reproducibility, the key input parameters used in the baseline simulations are summarised in Table 2.

2.6. Validation

2.6.1. Grid-Independence Verification

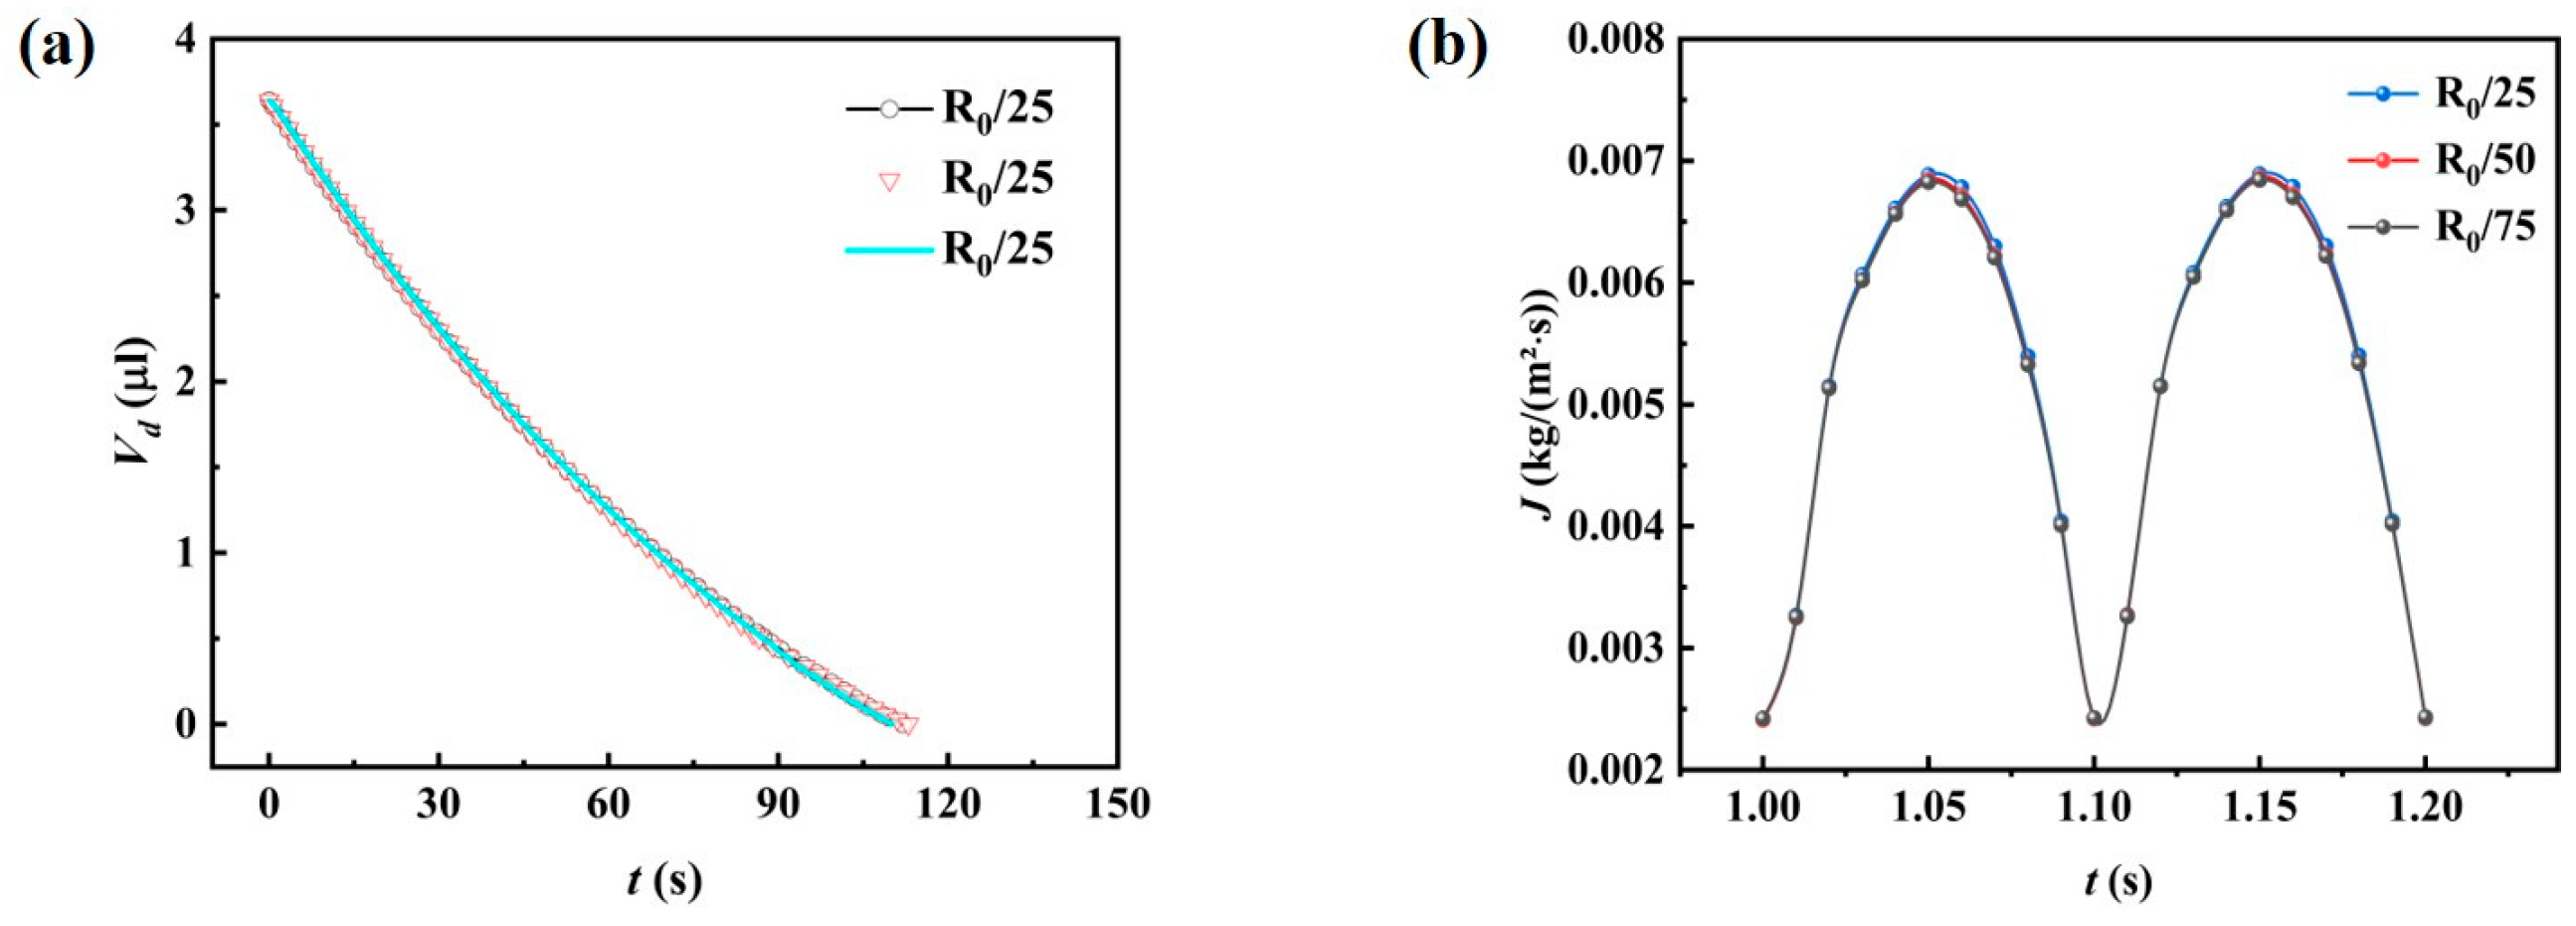
As shown in Figure 2, grid independence was assessed for a representative case with an applied AC voltage amplitude of U 0 = 40 kV. The mesh was systematically refined near the liquid–gas interface, with characteristic grid sizes of R 0 / 25 , R 0 / 50 and R 0 / 75 , where R 0 is the initial droplet radius. The temporal evolution of droplet volume, V d ( t ) , is shown in Figure 2a. The maximum relative deviation between the adopted R 0 / 50 mesh and the finest R 0 / 75 mesh remains below 3% throughout evaporation, indicating negligible grid dependence of the predicted volume decay. Because the main conclusions also rely on the evaporation-flux response, the instantaneous evaporation flux was further compared across mesh resolutions (Figure 2b). The corresponding curves almost overlap, and the double-peaked feature is captured consistently in all cases. The cycle-averaged evaporation flux over the same time window is 5.29601 × 10 3 kg/(m2 · s), 5.25862 × 10 3 kg/(m2 · s) and 5.25222 × 10 3 kg/(m2 · s) for R 0 / 25 , R 0 / 50 and R 0 / 75 , respectively. Using R 0 / 75 as the reference, the relative deviation of the adopted R 0 / 50 mesh is only 0.12%. These results indicate that the adopted mesh is sufficient to resolve both droplet-volume evolution and the flux-related behaviour underlying the main conclusions. The intermediate mesh, R 0 / 50 , was therefore used in all simulations to balance accuracy and computational cost.

2.6.2. Verification of the Time-Step Resolution

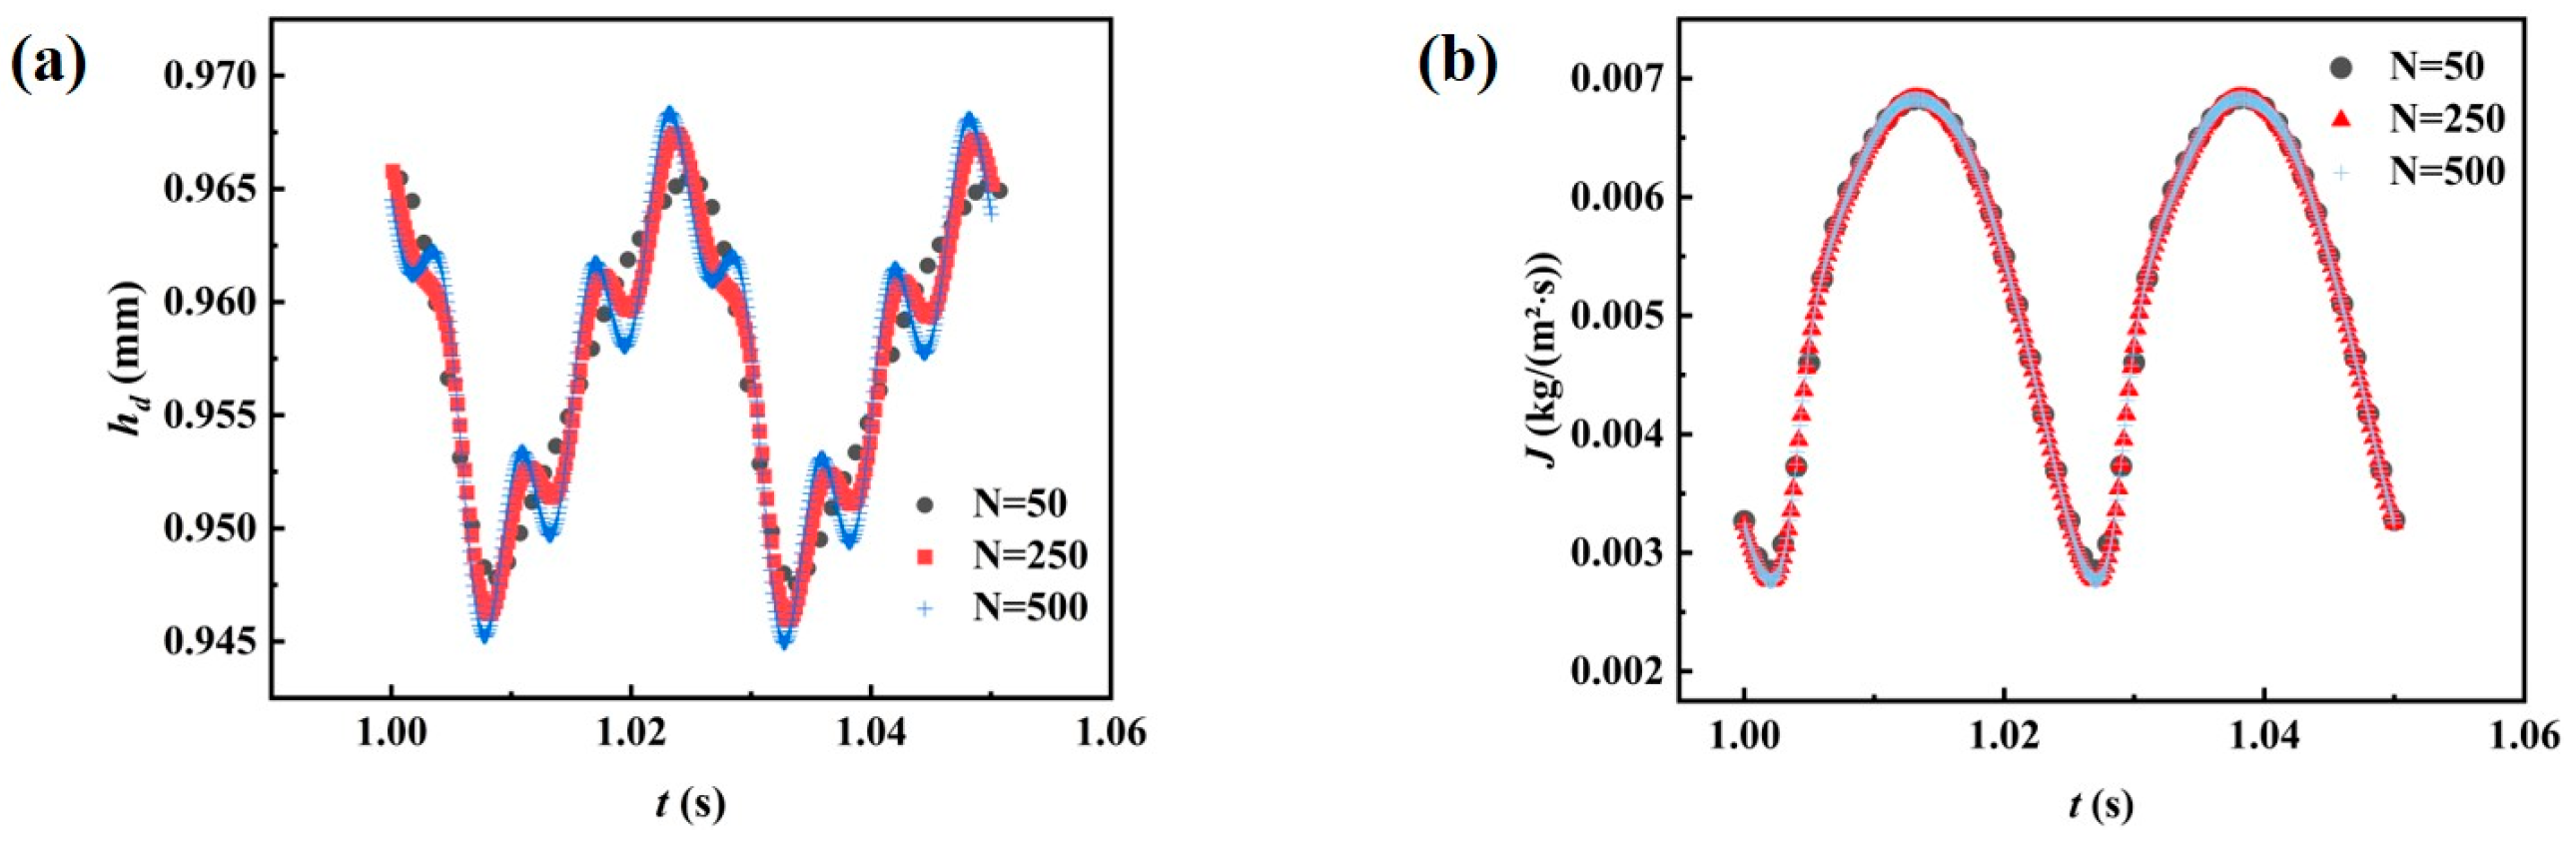
As shown in Figure 3, temporal sensitivity was assessed at the highest forcing frequency, f = 20 Hz (forcing period T = 0.05 s), using N = 50, 250 and 500 time steps per period over a steady-state cycle ( t = 1.00–1.05 s). The droplet-height trajectories for N = 250 and N = 500 are nearly indistinguishable (Figure 3a). Quantitatively, the relative differences in peak and valley heights are approximately 0.11% and 0.10%, respectively, with a peak-time shift of about 1.0 × 10 3 s, or 2.0% of the forcing period. The instantaneous evaporation flux over the same cycle was also compared across temporal resolutions (Figure 3b). The corresponding curves almost overlap, and the double-peaked evaporation-flux response is resolved consistently in all cases. The cycle-averaged evaporation flux J is 5.29601 × 10 3 kg/(m2 · s), 5.29032 × 10 3 kg/(m2 · s) and 5.29043 × 10 3 kg/(m2 · s) for N = 50 , 250 and 500, respectively. Using N = 500 as the reference, the relative deviation of the adopted resolution, N = 250 , is only about 0.002%, whereas even N = 50 differs by only about 0.11%. These results confirm that N = 250 is sufficient to resolve both the droplet geometric response and the flux-related behaviour underpinning the main conclusions.

2.6.3. Verification of the Electric Field Model

To quantify the transient deformation of the droplet under electrical forcing, we define the deformation degree as
D E = a b a + b
Here, a and b are the axial and transverse semi-axes of the droplet, respectively, defined with respect to the electric-field direction (parallel vs. perpendicular).
The electrocapillary number quantifies the relative magnitude of electric to capillary stresses and is defined as
C a = ε 0 ε c E 0 2 R d γ
The parameters ε 0   ,   ε c   ,   E 0   , R d ,   and γ correspond, respectively, to the vacuum permittivity, the relative permittivity of the continuous phase, the initial electric-field intensity, the droplet radius, and the surface tension.
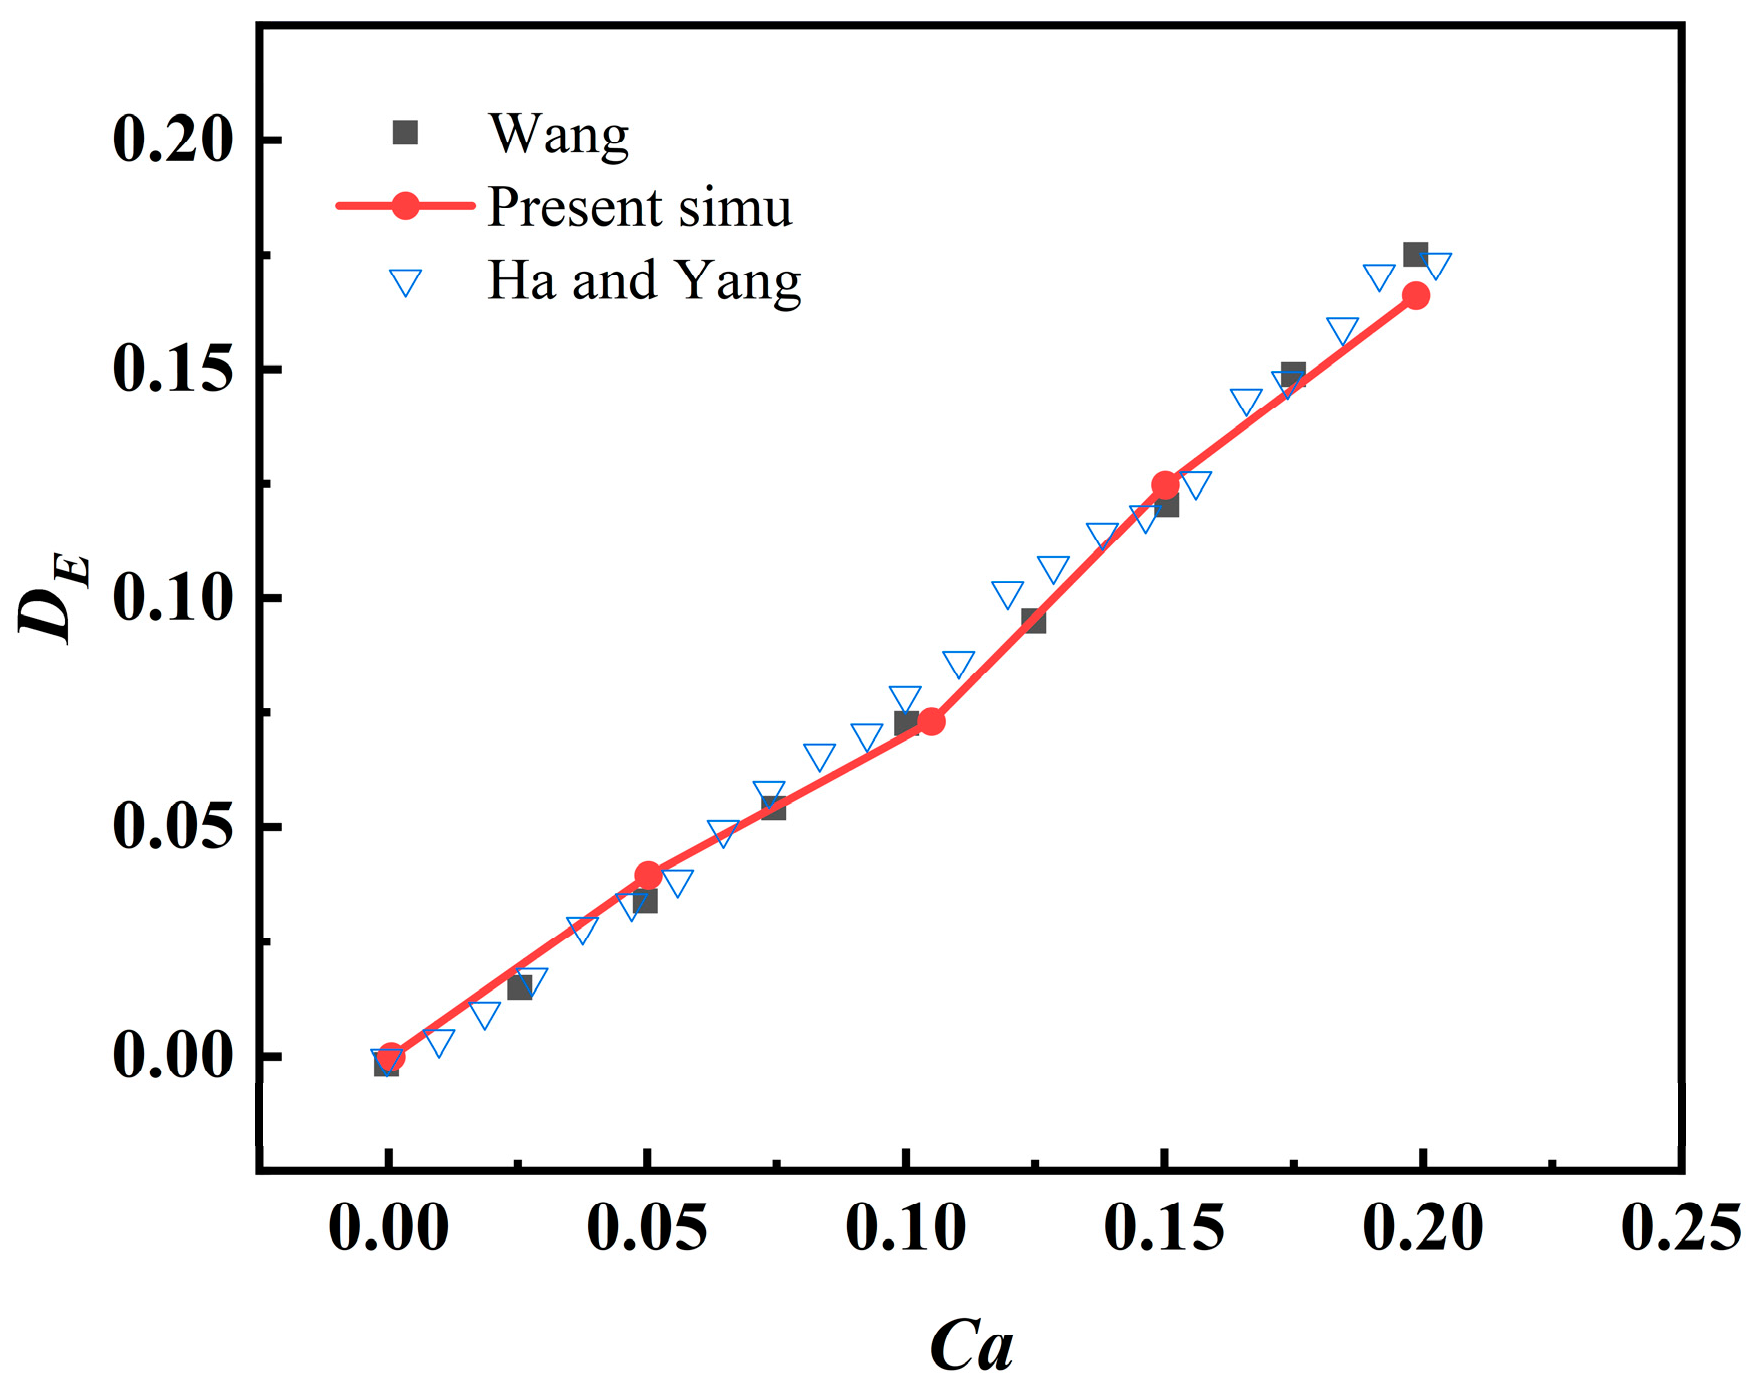
To evaluate the ALE framework in predicting AC-field-induced droplet deformation, we analyse the steady-state shape of a water droplet suspended in silicone oil over a range of electric capillary numbers, C a . The computational configuration is shown in Figure A1 (Appendix A). As presented in Figure 4, the deformation parameter D E increases approximately linearly with C a , indicating the progressive dominance of electric stress over capillary stress. The present simulations agree well with the results reported by Wang et al. [13] and Ha and Yang [35]. For C a < 0.15, deviations remain within 5%, while at higher C a the present results show slightly larger deformation, with a maximum discrepancy of about 8%. Overall, the ALE-based electric-field model accurately captures the steady-state droplet deformation behaviour, demonstrating its suitability for simulating electrically driven droplet dynamics.

2.6.4. Model Verification for Sessile-Droplet Evaporation

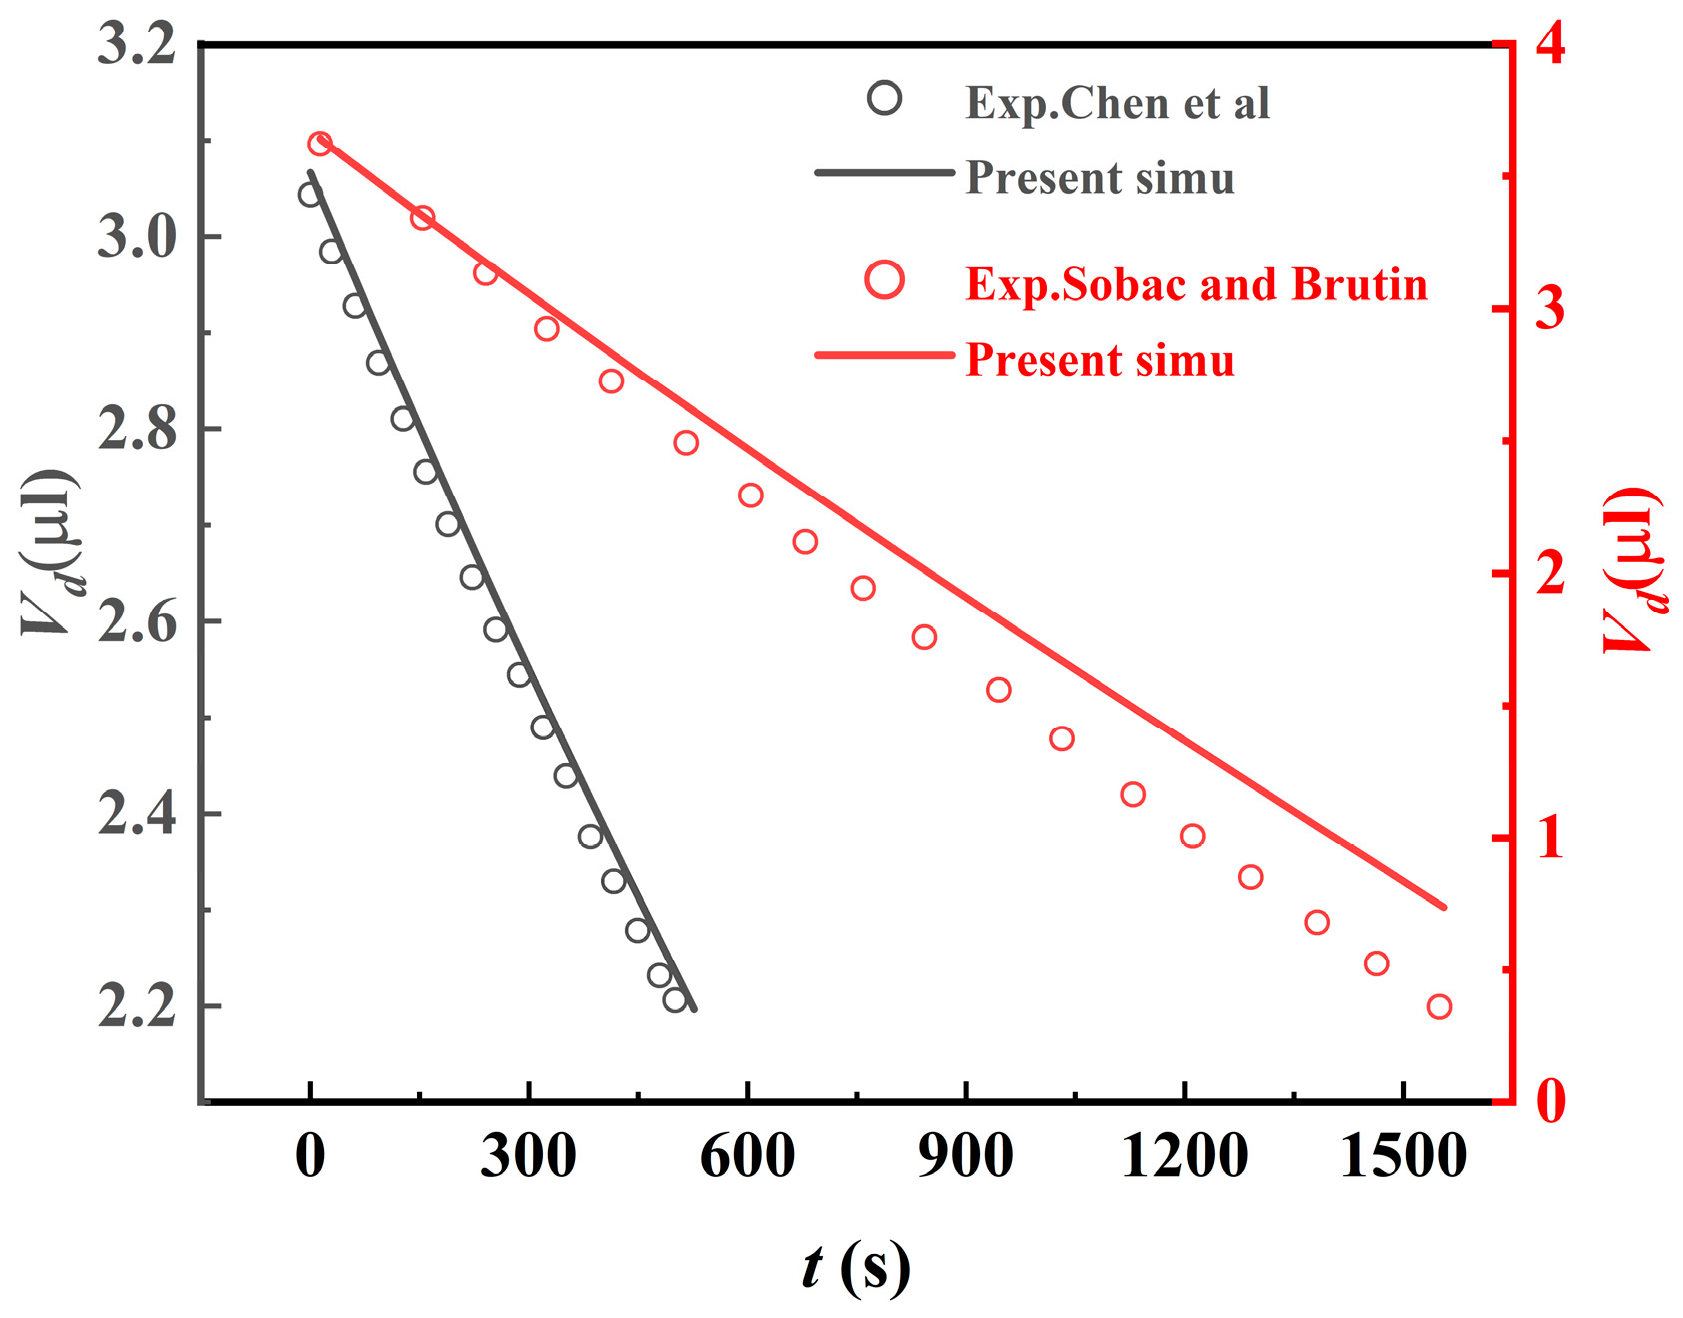
Under zero-field conditions ( E = 0 ), we validated the droplet evaporation simulations by comparing them against experimental data reported in the literature (Figure 5). To comprehensively assess the model applicability, two substrates with markedly different thermophysical and wetting characteristics were selected: (i) a hydrophobic PTFE substrate with low thermal conductivity and a relatively large initial contact angle, following the experiments of Chen et al. [33]; and (ii) a hydrophilic aluminium (Al) substrate with high thermal conductivity and a relatively small initial contact angle, following the experiments of Sobac and Brutin [36]. In Figure 5, the black open circles denote the experimental data reported by Chen et al. [33], and the black solid line represents the present simulation; the red open circles denote the experimental data of Sobac and Brutin [36], and the red solid line represents the present simulation. The horizontal axis is the evaporation time t (s), and the left/right vertical axes report the droplet volume V d ( μ L) for the two substrates. Under CCR conditions with a pinned contact line, the simulated volume decay for both cases matches the experimental measurements closely, demonstrating the reliability of the ALE approach for pinned-droplet evaporation.
The model accuracy was evaluated by comparing our predictions with experimental measurements of droplet deformation under AC electric fields and droplet evaporation in the field-free case [8,37]. Deformation validation focused on the steady-state deformation magnitude, whereas evaporation was validated against the temporal evolution of droplet volume across different evaporation modes. Additional comparisons with published data further confirmed the robustness of the ALE approach in capturing both electrically induced deformation and droplet evaporation.

3. Results and Discussion

An AC electric field generates periodic droplet deformation and EHD circulation via Maxwell stresses. These coupled effects reshape the internal temperature field while perturbing the gas-side diffusion layer and interfacial temperature/concentration gradients, thereby modifying both the instantaneous and time-averaged evaporation flux. Accordingly, we first relate Maxwell stresses to droplet deformation, then connect the resulting internal flow and temperature redistribution to gas-phase transport and the resulting evaporation rate. We use a pinned, CCR droplet with an initial contact angle of 68° as a representative case, highlighting the 2:1 response and an enhancement trend dominated by the deformation amplitude.

3.1. AC-Field-Induced Dynamics and Coupled Transport

3.1.1. Electrostatic Forcing and Interfacial Maxwell Stresses

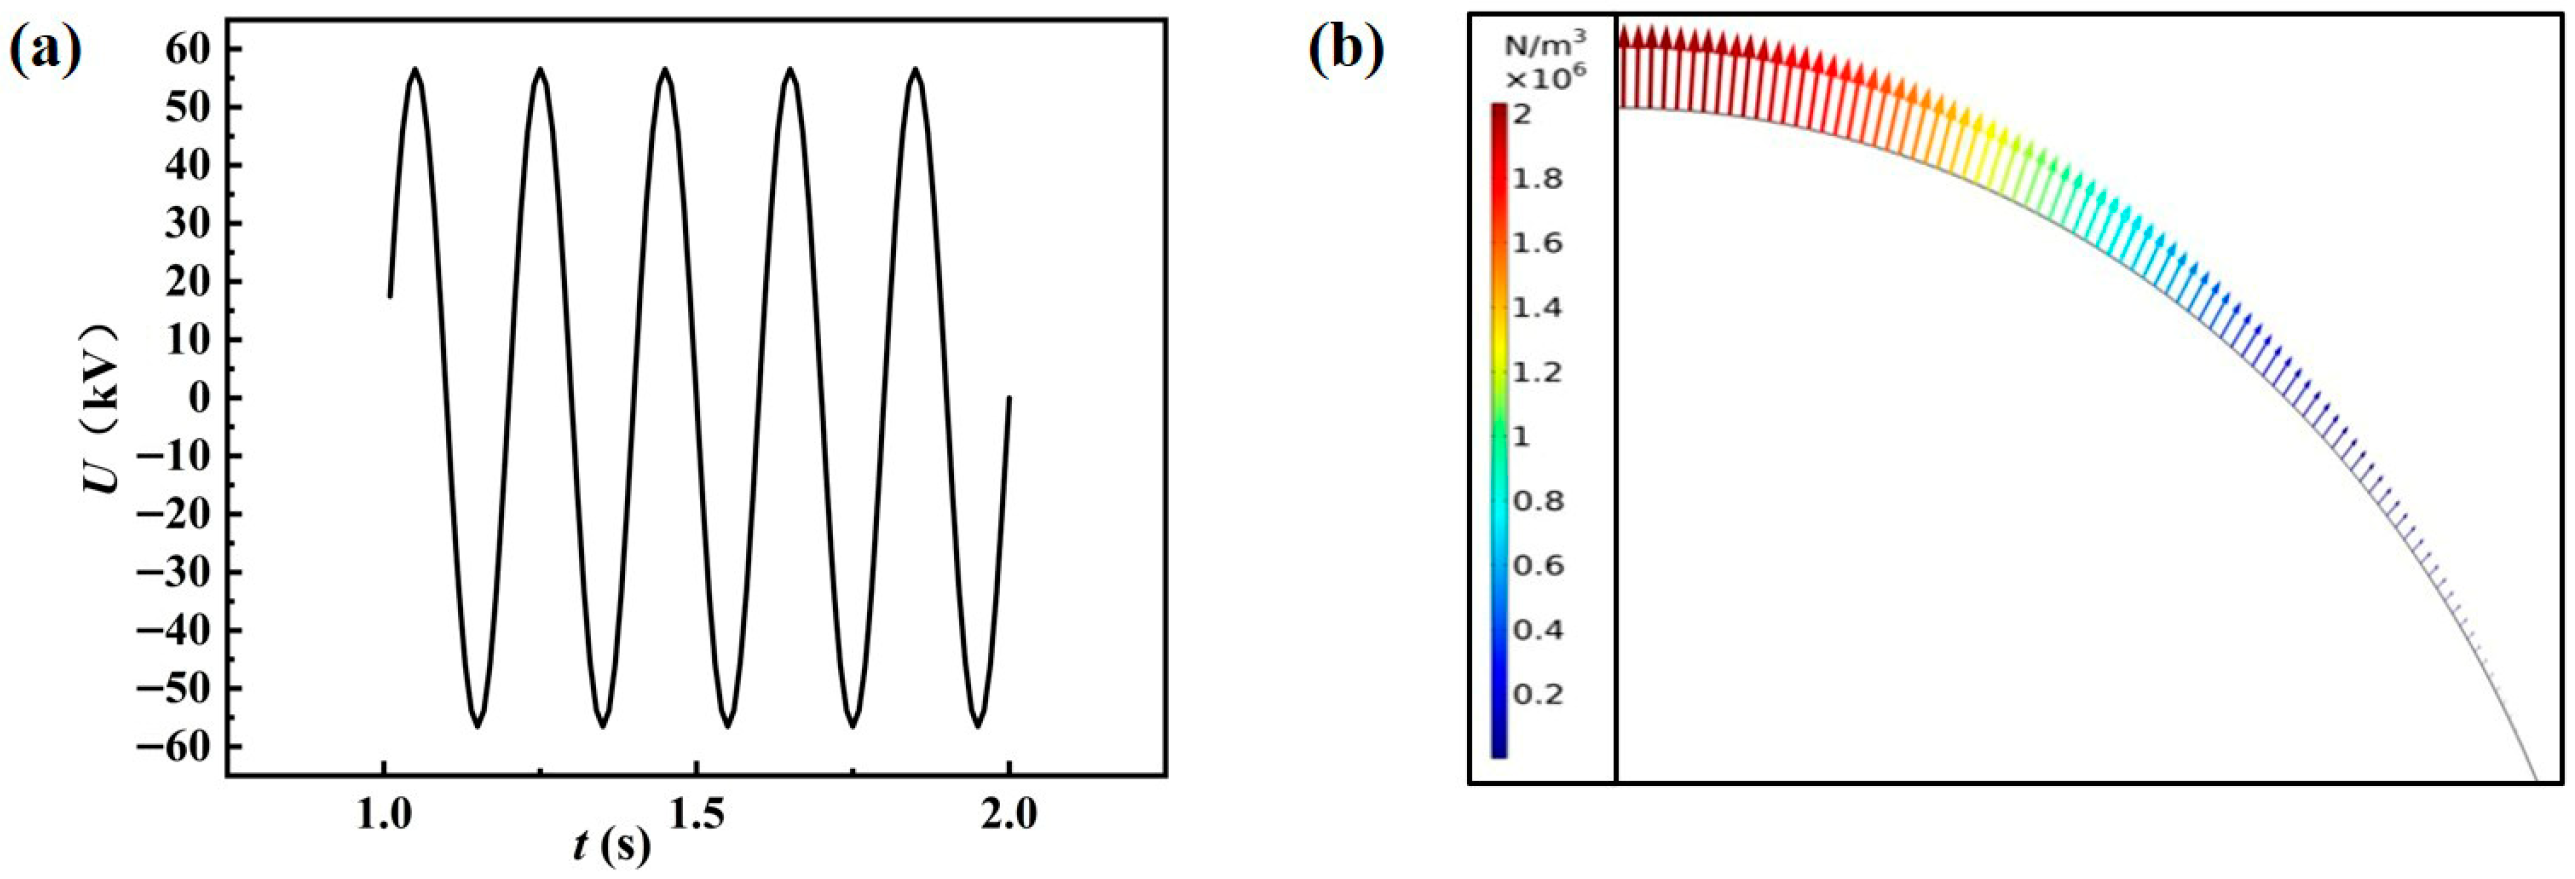
To clarify how an AC electric field drives droplet deformation and internal motion, and how these responses ultimately regulate evaporation, we first characterise the interfacial electric stresses and the associated electric potential. As shown in Figure 6a, we apply a sinusoidal voltage U ( t ) to the upper electrode (representative case: U 0 = 40 kV, f = 5 Hz), yielding a steady periodic waveform over 1–2 s. This imposed voltage sets the time-dependent electric-field intensity around the droplet and, through the Maxwell stress tensor, produces an electric traction at the gas–liquid interface. Because Maxwell stress scales quadratically with the field characteristic interfacial electric stress, σ e , ( σ e E 2 U ( t ) 2 ), the interfacial stress exhibits two maxima within each voltage period, providing a direct physical basis for the 2:1 frequency-doubling response observed in the ensuing deformation. Specifically, for U ( t ) = U 0 s i n ( 2 π f t ) , σ e ( t ) U 2 ( t ) = U 0 2 s i n 2 ( 2 π f t ) = U 0 2 2 [ 1 c o s ( 4 π f t ) ] , revealing an inherent 2   f component and two stress peaks per cycle. Figure 6b shows the spatial distribution of surface electric stress at representative instants. The interfacial stress is strongly non-uniform, intensifying near the apex (high-curvature region) and progressively weakening toward the lower hemisphere. This “top-strong, bottom-weak” pattern generates both normal (extensional) traction and tangential shear along the interface, thereby promoting periodic deformation and driving internal recirculation. The resulting deformation and electrically driven recirculation reorganise the internal temperature field and perturb the gas-side diffusion layer and interfacial gradients, thereby modulating gas-phase mass transfer and, ultimately, the evaporation rate.
Having established the electrostatic forcing, we next quantify the droplet’s periodic deformation under AC actuation using the droplet height and contact angle as the primary metrics.

3.1.2. Frequency-Doubled Deformation Response Under Sinusoidal Forcing

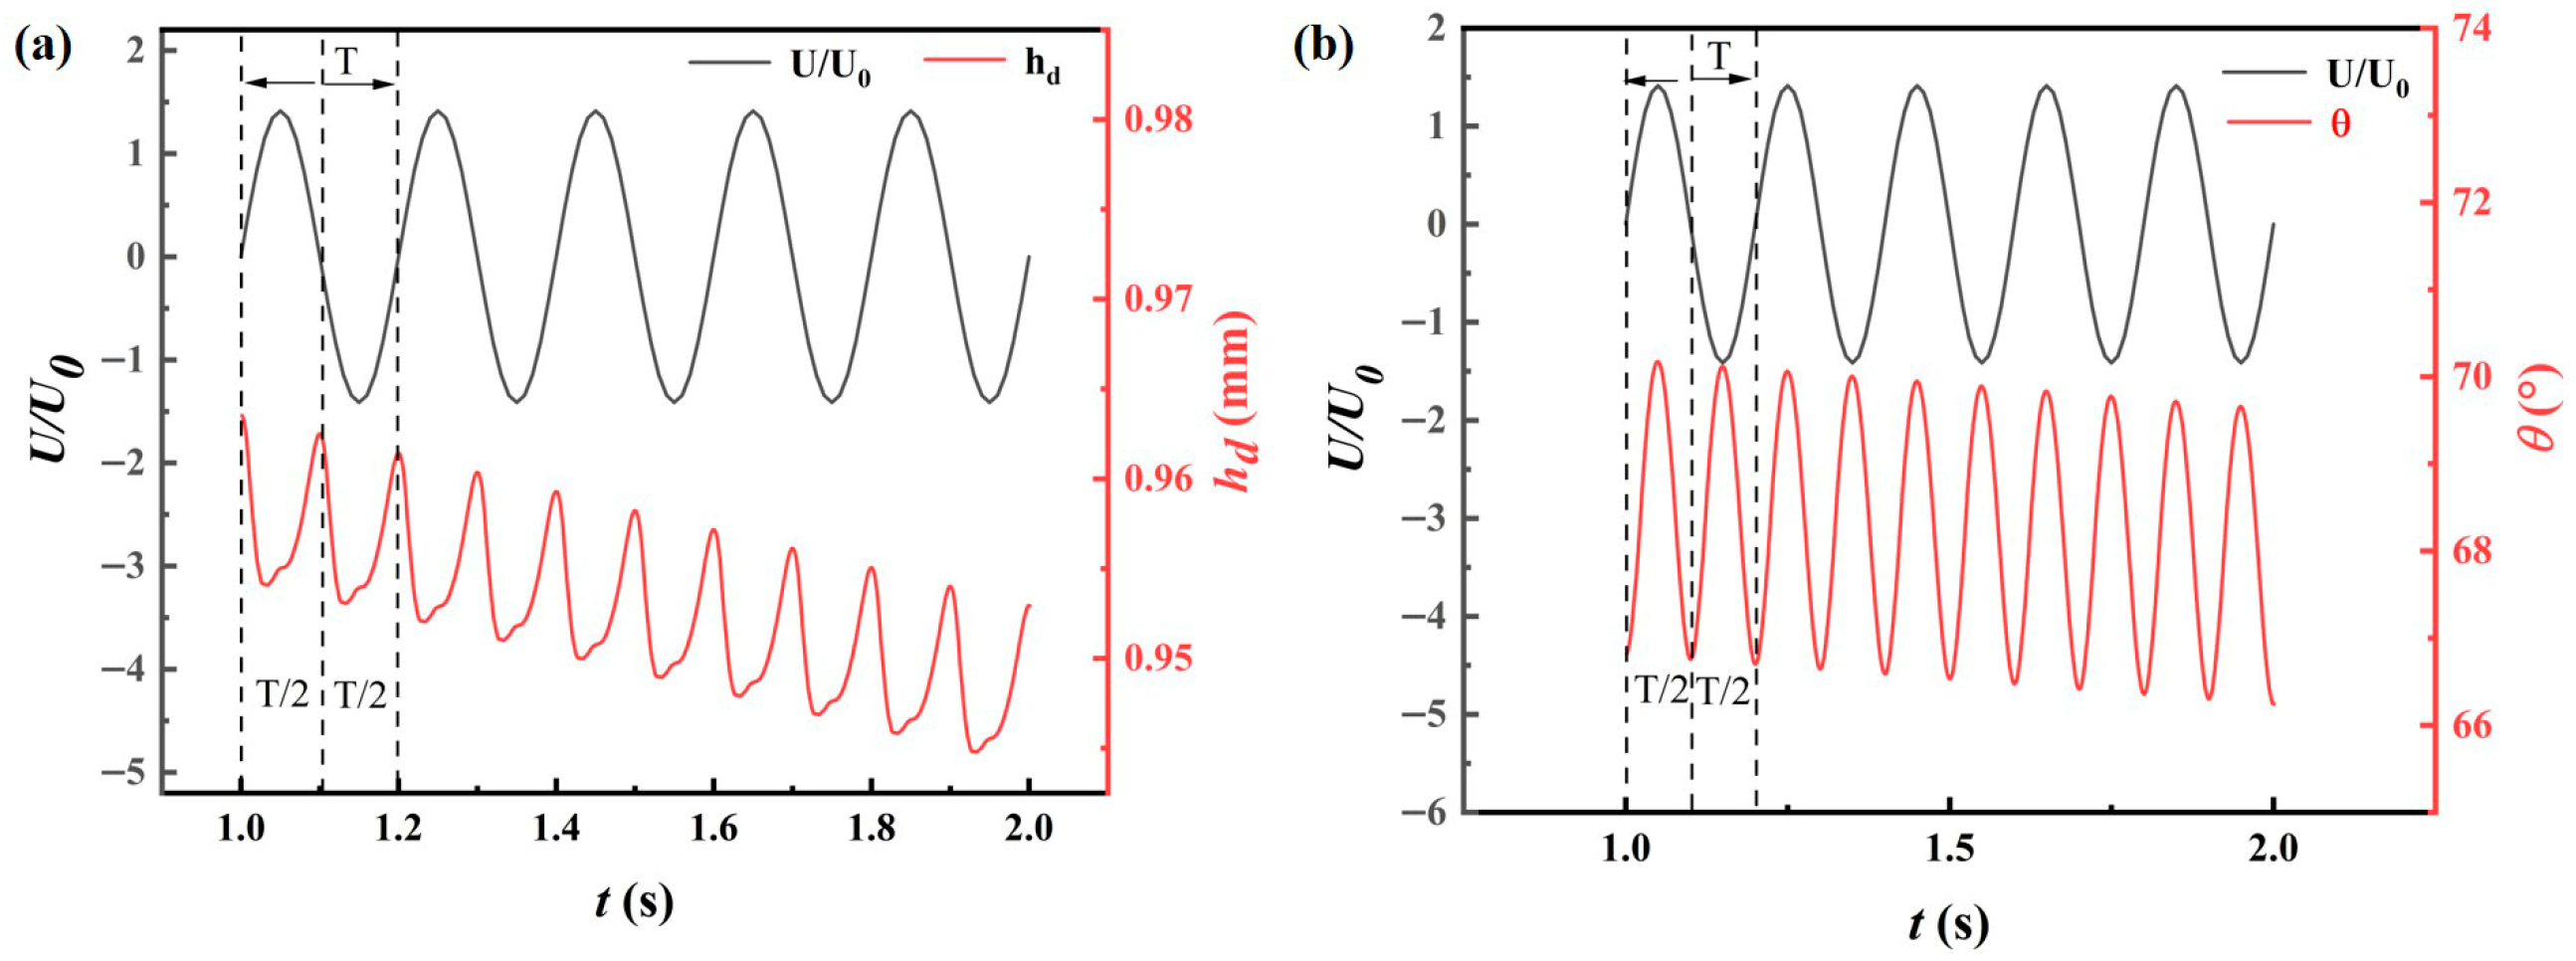
To visualise the phase relation between AC actuation and geometric response, Figure 7 overlays the normalised voltage U / U 0 (black) with the time histories of droplet height h d and contact angle θ (red). At f = 5 Hz, the voltage oscillates with period T (dashed markers), whereas h d and θ exhibit two pronounced peak–trough excursions within each cycle. The dominant geometric period is therefore ~ T / 2 , consistent with a robust 2:1 frequency-doubling response. This 2:1 correspondence arises from the quadratic dependence of electrostatic stress on the electric-field magnitude: the normal Maxwell traction on the interface scales as E 2 . For E ( t ) = U 0 s i n ( ω t ) , the stress varies as E 2 ( t ) s i n 2 ( ω t ) = 1 2 [ 1 c o s ( 2 ω t ) ] , and it contains an oscillatory component at 2 ω . Consequently, because deformation reflects a balance between electric traction and surface tension, the droplet undergoes two deformation events within each field cycle. Thus, the deformation is governed primarily by the stress magnitude rather than the instantaneous field polarity.
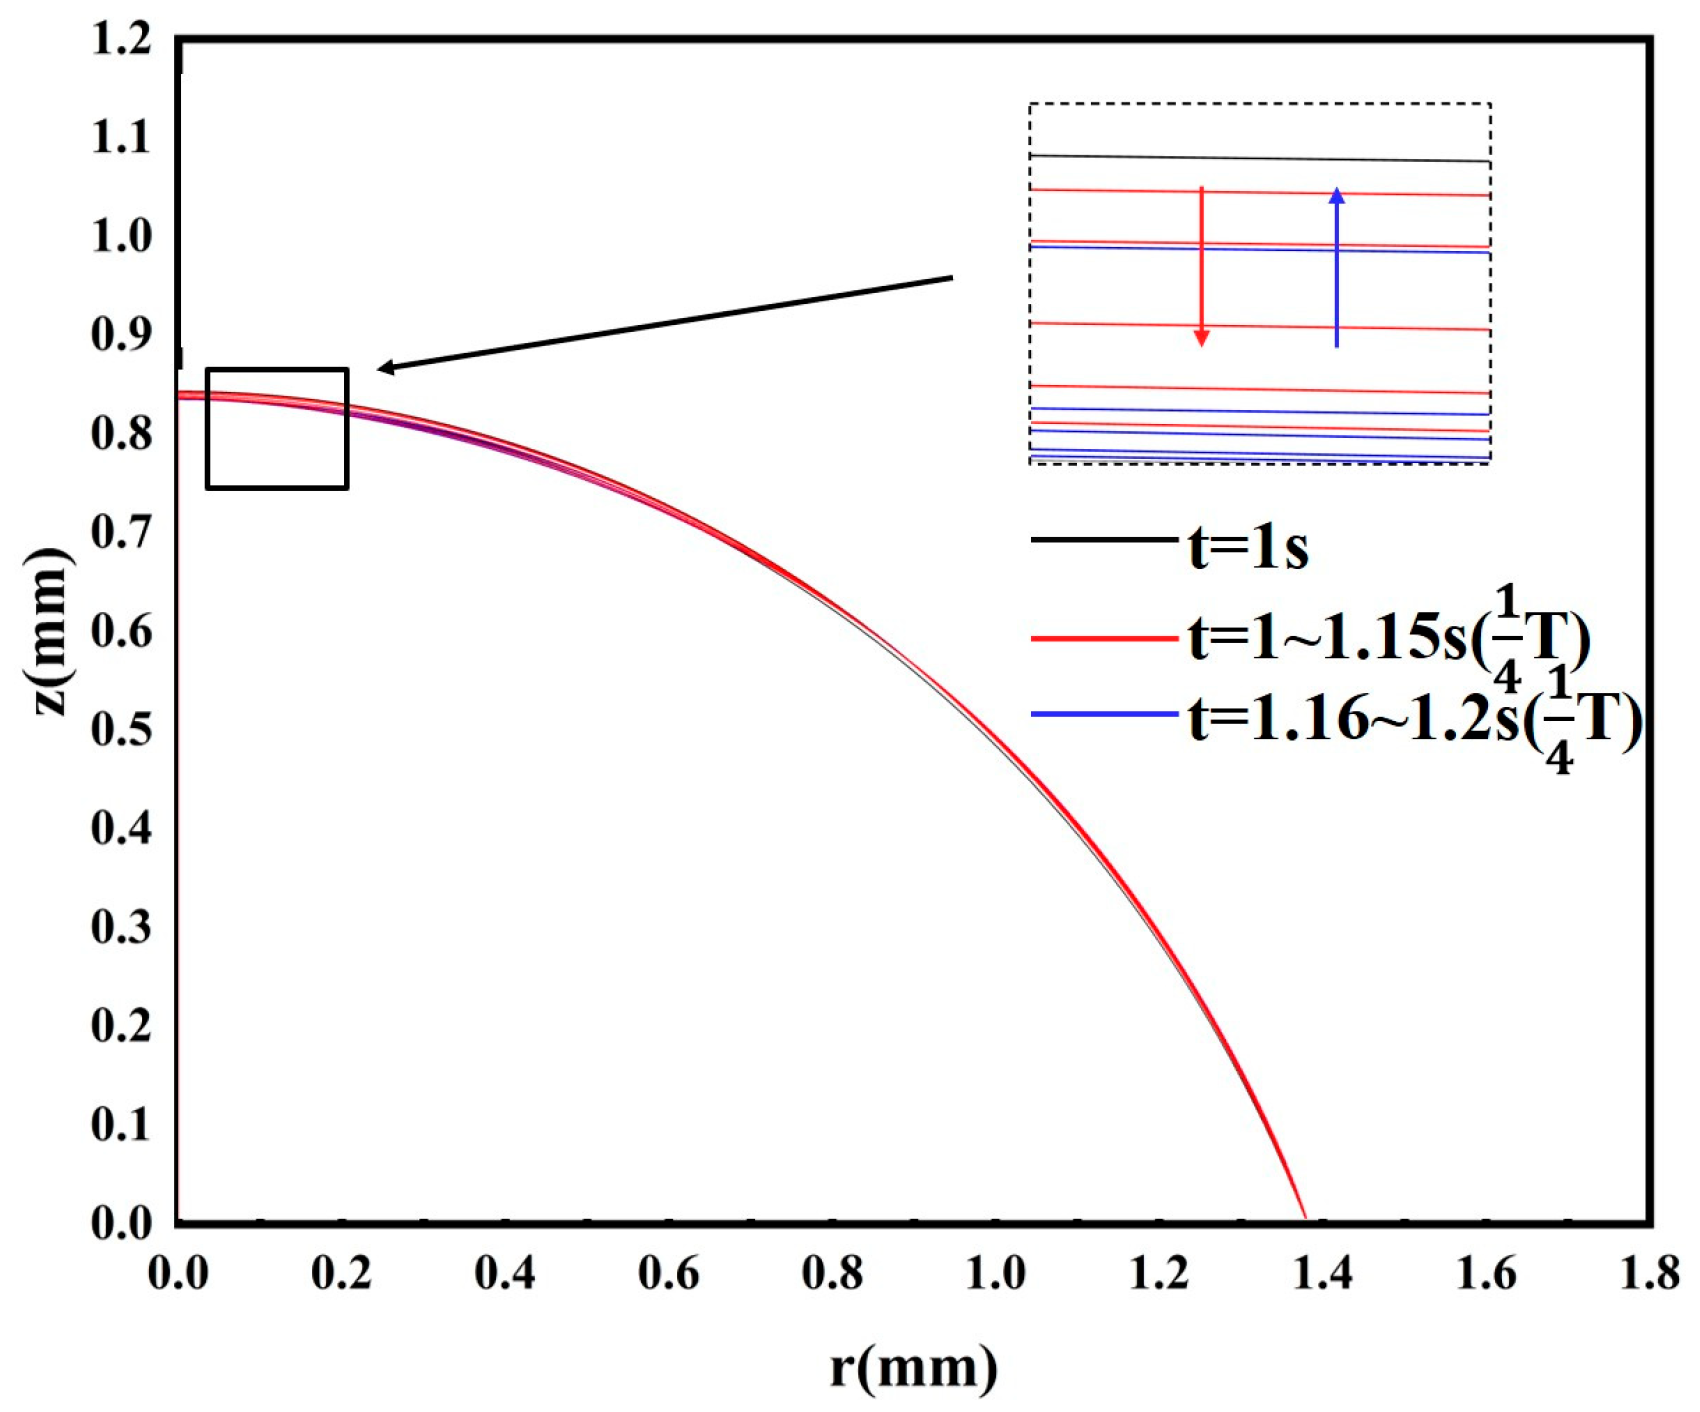
Figure 8 visualises the droplet’s periodic deformation under an AC electric field and corroborates the time-domain trends in Figure 7. For U 0 = 40 kV and f = 5 Hz, interface profiles at successive times are compared with the reference shape at t = 1 s. Within a single voltage cycle, the upper free surface alternates between stretching and relaxation while the contact line stays pinned (CCR); consequently, deformation is confined to the free surface above the contact line. Notably, profiles from two phase windows ( t = 1.00–1.15 s and t = 1.16–1.20 s) show nearly repeatable upper-surface displacements (inset). This is consistent with the frequency-doubled response in Figure 7, where both the droplet height h d and contact angle θ exhibit two peak–trough events within one period T , implying a dominant timescale of T / 2 . Figure 8 therefore confirms that the 2:1 behaviour in Figure 7 reflects a genuine, stress-driven periodic deformation of the free surface rather than a signal-processing artefact. This 2:1 frequency-doubled response is consistent with Pillai et al. [38], indicating that the droplet deformation frequency is twice the applied electric-field frequency because the Maxwell stress depends on the square of the electric-field strength. This deformation is expected to modify near-interface shear and internal recirculation, providing the geometric basis for subsequent analyses of the velocity field, temperature redistribution and the gas-side concentration boundary layer.

3.1.3. Electrohydrodynamic Circulation and Thermal-Field Homogenization

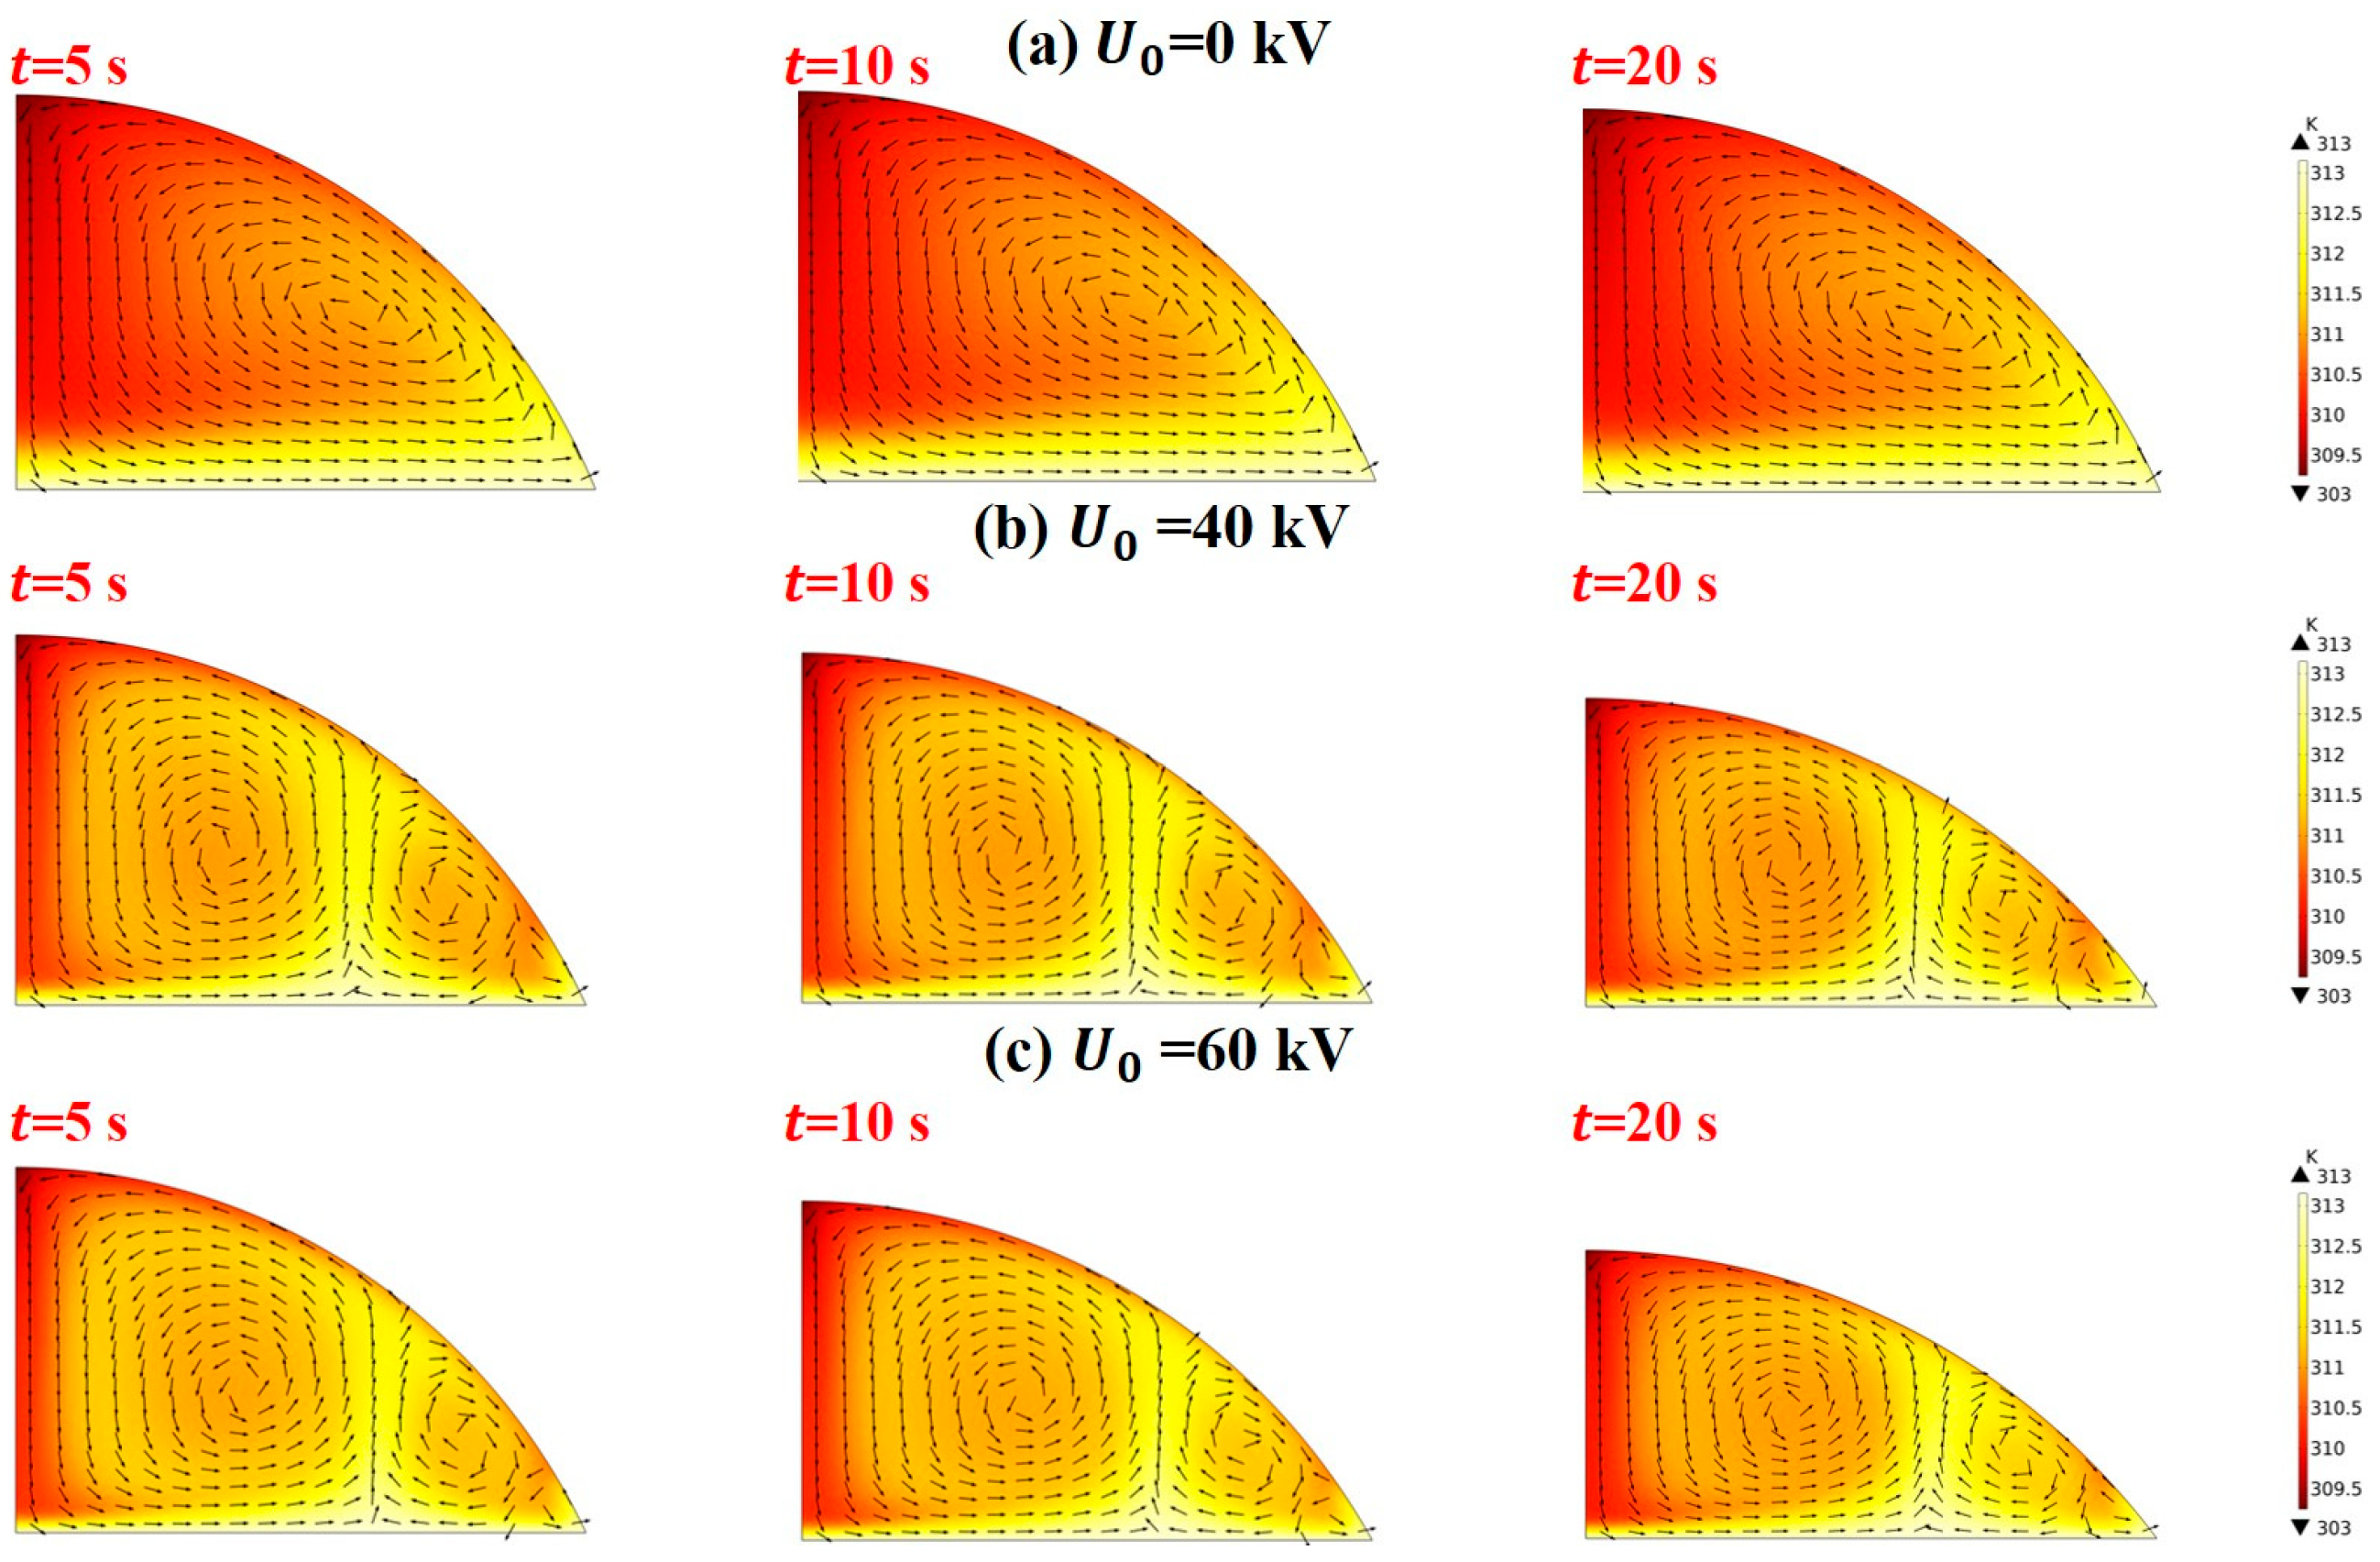
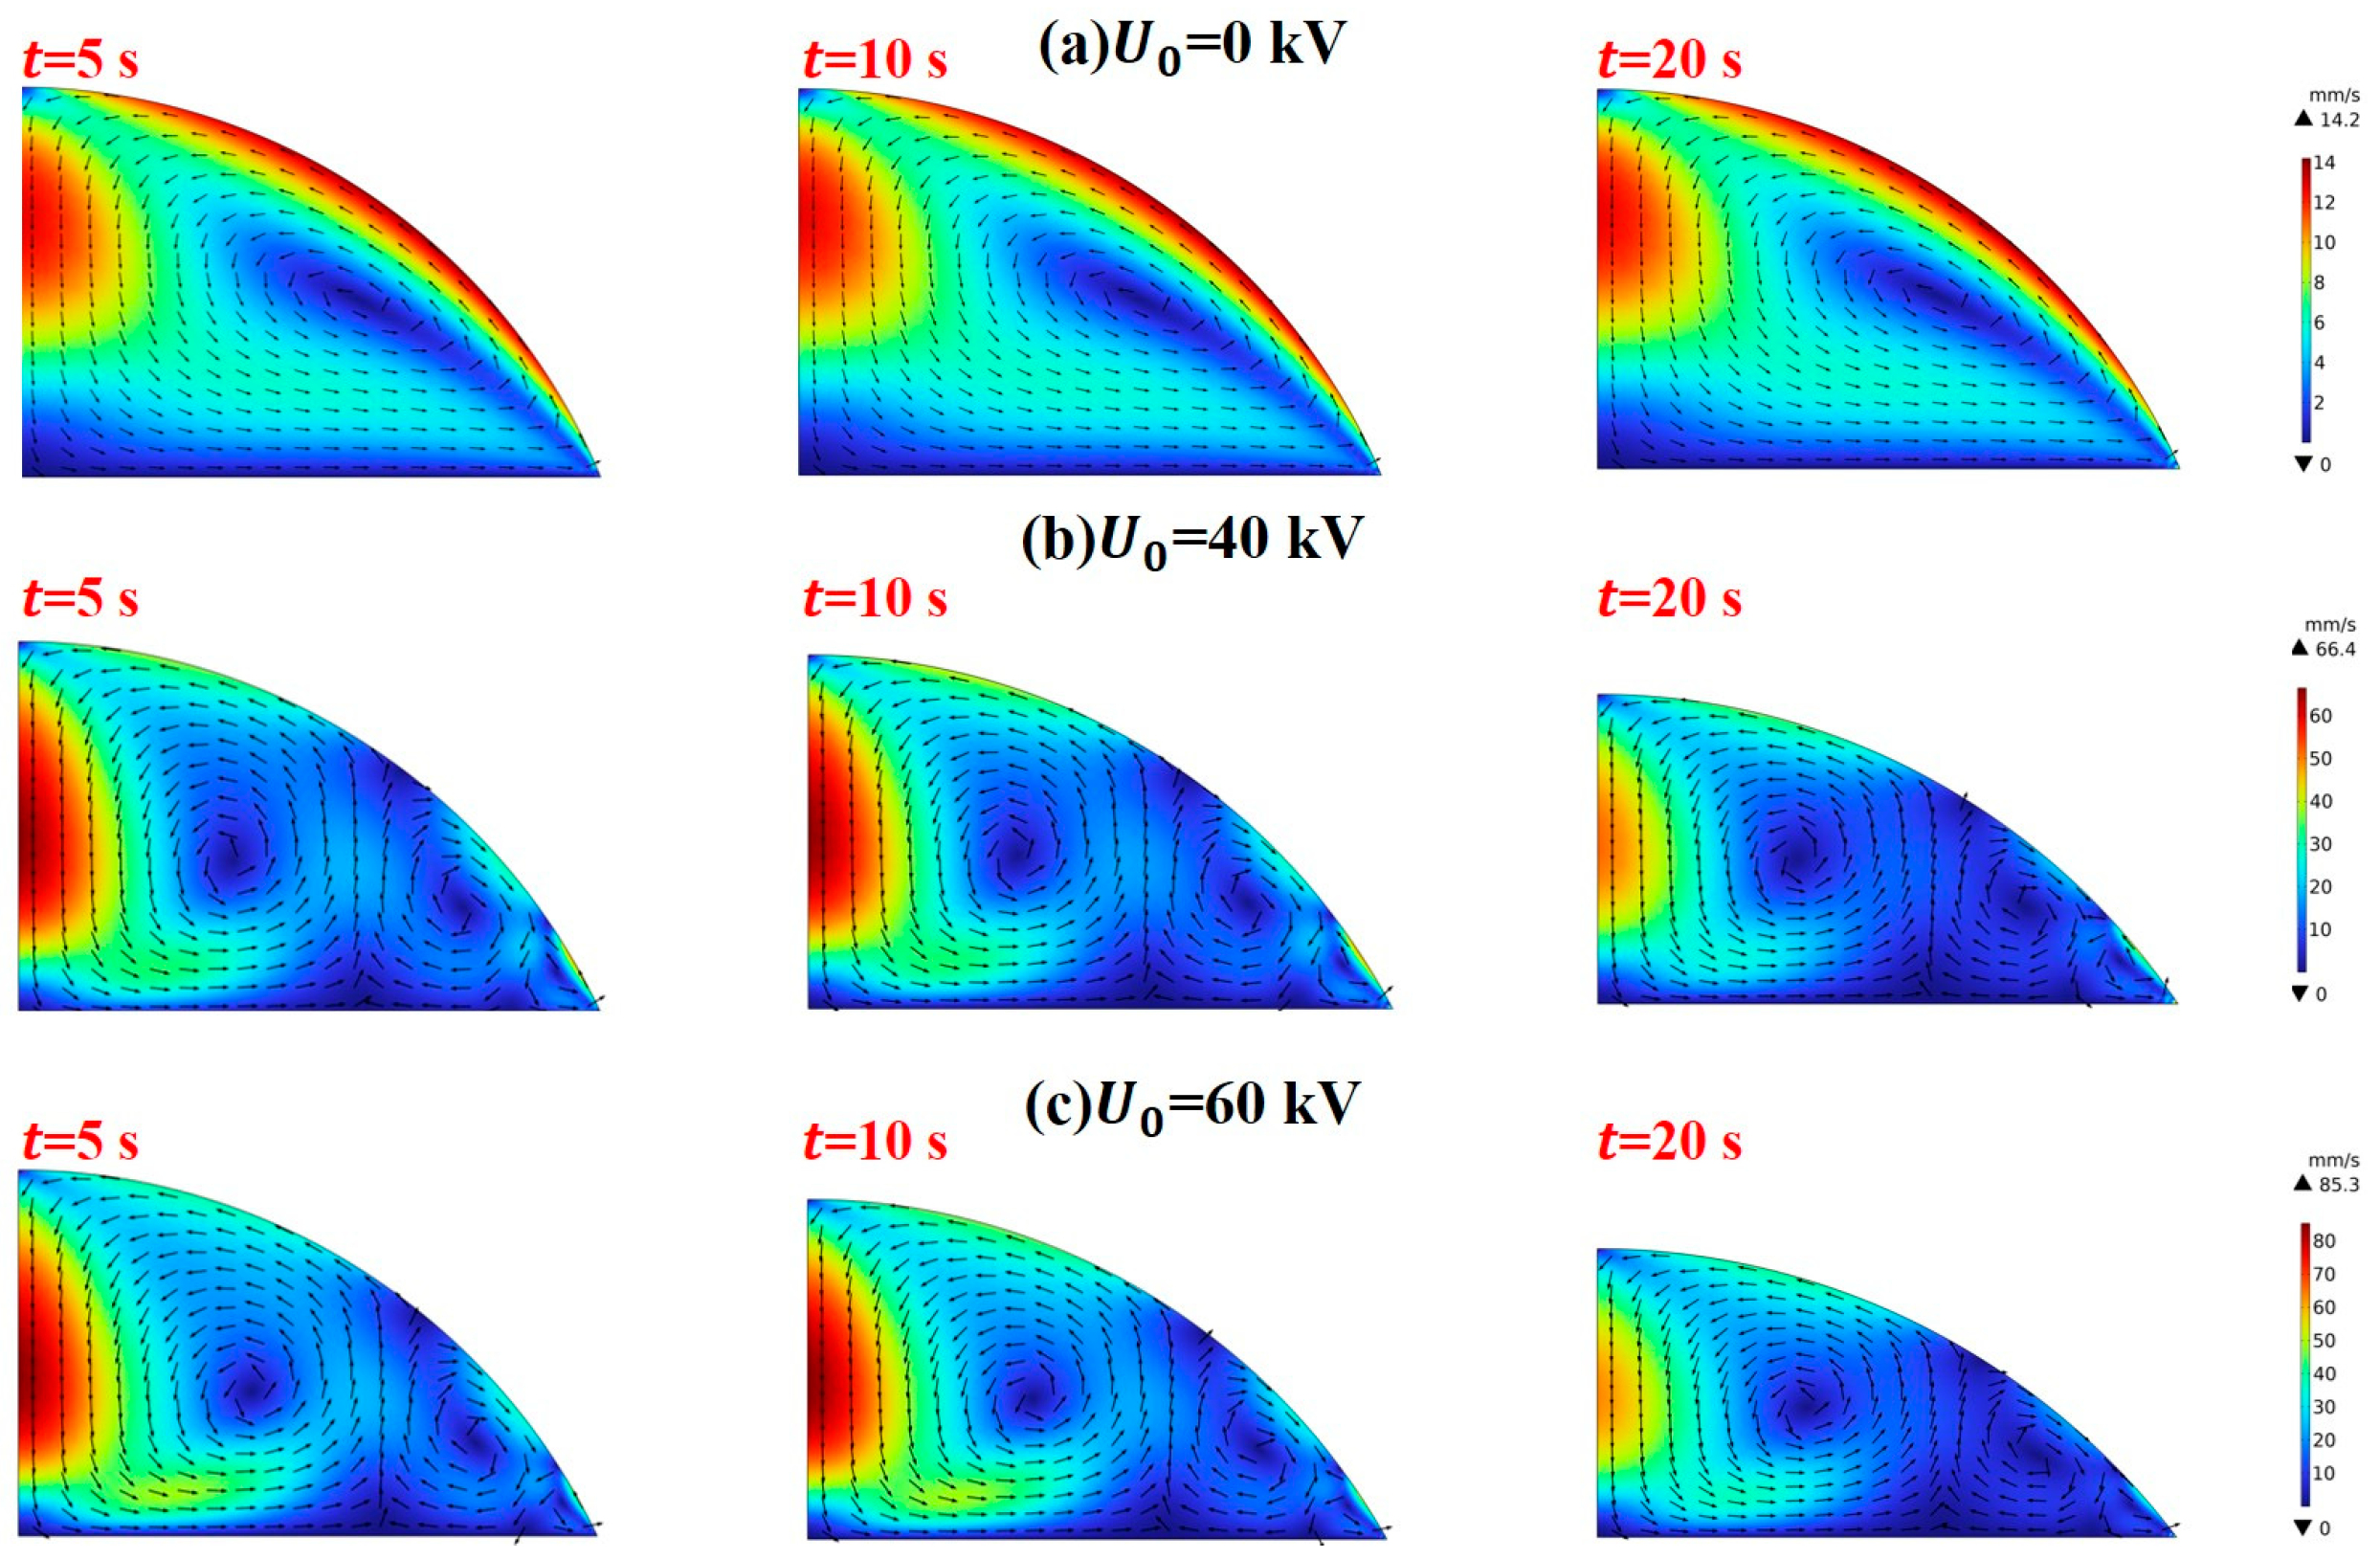
Deformation is accompanied by marked changes in the structure and intensity of the internal flow. As shown in Figure 9, at f = 5 Hz the internal circulation strengthens markedly as the voltage increases from 0 to 40 and 60 kV. Consistent with the enhanced recirculation, the temperature field is reorganised under electric forcing (Figure 10).
An electric field not only alters the droplet interface but also drives internal recirculation via electrostatic stresses and redistributes the temperature field, thereby enabling control of the evaporation rate. Figure 9a shows the internal flow of a freely evaporating droplet without AC forcing, whereas Figure 9b,c presents the corresponding flow structures at different voltage amplitudes. Without an electric field, the droplet exhibits a predominantly single-vortex circulation driven by temperature-induced surface-tension gradients, characteristic of thermocapillary (Marangoni) convection. When the apex is cooler than the base, the circulation is directed from the contact line toward the droplet interior; at   t = 20 s the maximum interfacial speed reaches 14.2 mm/s. These maximum interfacial velocities may be taken as representative characteristic circulation velocities within the droplet. With AC forcing, multiple vortices spanning different length scales emerge and the flow intensifies markedly. As shown in Figure 9b,c, at t = 20 s the maximum interfacial speed increases to 66.4 mm/s and 85.3 mm/s for U 0 = 40 kV and 60 kV, respectively. This flow amplification arises from coupling between thermocapillary convection and electrohydrodynamics: the non-uniform field generates distributed Maxwell stresses that act as a body force, driving additional EHD recirculation. The EHD-driven flow superposes constructively with the Marangoni vortex, strengthening the primary circulation aligned with the surface-tension-driven direction while simultaneously generating counter-rotating secondary eddies. As the voltage increases, the amplified Maxwell forcing intensifies the primary vortex, substantially raising interfacial speeds and promoting heat and mass transport within the evaporating droplet. Together, these results show that AC actuation—through the combined action of interfacial electric stress and surface tension—induces pronounced deformation and electrohydrodynamic flow. However, these electromechanical responses do not determine evaporation directly; instead, they act indirectly by altering internal heat transfer and interfacial mass transport. Under electric forcing, both the internal flow topology and the heat-transfer pathway can change substantially. For a levitated droplet heated by the surrounding fluid, Jiang et al. [39] showed that field-induced vortices advect warm fluid from the near-interface region into the interior while transporting cooler core fluid toward the surface, establishing a sustained convective loop. This field-driven exchange markedly enhances internal energy transport.
As shown in Figure 10, applying an AC electric field induces pronounced vortical structures within the droplet. The resulting electrohydrodynamic disturbance disrupts the initially stable thermal boundary layer. The ensuing multiscale vortical motion accelerates transport of warm fluid from the heated base toward the cooled apex, leading to a more uniform internal temperature field (Figure 10c versus Figure 10a; the high-temperature region occupies a larger fraction). By promoting mixing, the field reduces the effective internal thermal resistance, enabling heat supplied at the substrate to be conveyed more efficiently to the interface. This raises the droplet-averaged temperature and favours phase change. In conjunction with the subsequent vapour-field and mass-loss analyses, this reconstructed temperature field alters the local interfacial temperature and the mass-transfer driving force. Together with the periodic modulation of the gas-side diffusion boundary layer, it governs both the instantaneous and cycle-averaged evaporation intensity.
To clarify the relative importance of thermocapillary and electrically induced flows, we briefly examine the relevant dimensionless groups, including the thermal Marangoni number [28]:
M a T = γ T Δ T R d μ α ,
where R d is the characteristic droplet length scale.
The thermal Péclet number [40]:
P e T = u R d α ,
where u is a representative interfacial velocity.
For the representative condition of 40 kV and 5 Hz, with Δ T ≈ 3.68 K and R d = 1.44 × 10 3 m, the thermal Marangoni number is estimated to be M a T 6.8 × 10 3 , indicating that thermocapillary convection is sufficiently strong to sustain the baseline circulation in the absence of an electric field. On the basis of Equation (35), the electric capillary number is estimated to be C a 0.19 at 40 kV and C a 0.43 at 60 kV, demonstrating that the contribution of electric stress becomes increasingly significant as the applied voltage increases. In addition, based on the representative interfacial velocity at 40 kV, the thermal Péclet number is estimated to be P e T 6.8 × 10 2 , indicating that internal heat transport under AC forcing is strongly dominated by convection [39].

3.1.4. Gas-Side Vapour Boundary-Layer Modulation and Interfacial Concentration Response

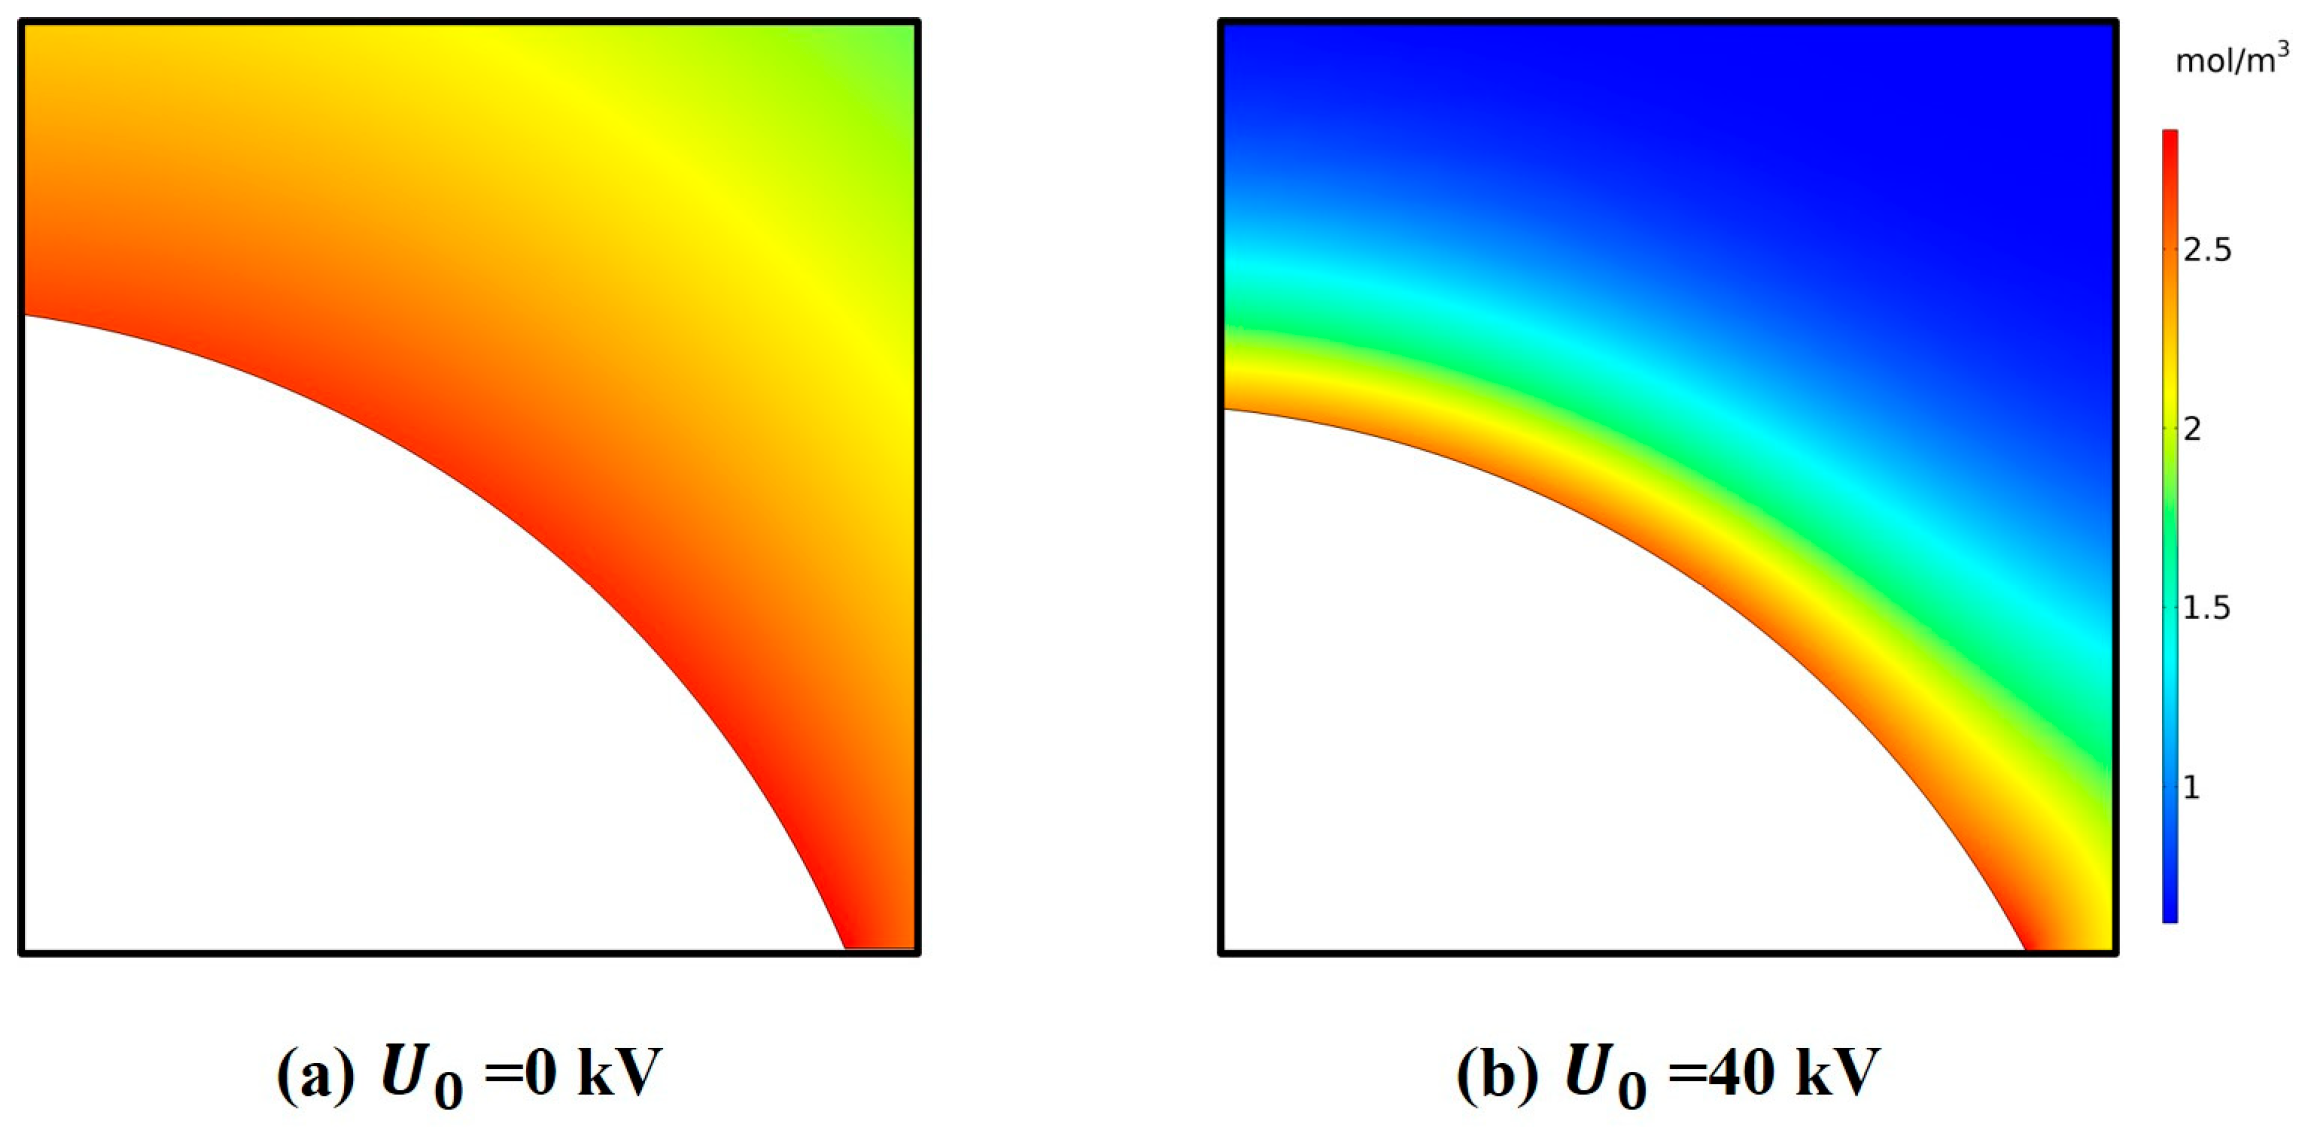
Figure 11 shows the water-vapour concentration field in the gas phase surrounding the droplet, which we use to assess the gas-side mass-transfer resistance and its modification by the electric field. A thicker near-interface high-concentration layer (the concentration boundary layer) implies a smaller normal concentration gradient and thus a larger gas-side mass-transfer resistance. At U 0 = 0   kV (Figure 11a), a pronounced high-concentration region forms near the interface and decays gradually outward. The iso-concentration contours are widely spaced, indicating a relatively thick boundary layer in which vapour tends to accumulate during evaporation. By contrast, with the field applied ( U 0 = 40 kV; Figure 11b), the high-concentration region is confined closer to the interface and the contours compress markedly near the surface, producing a steeper normal gradient. This indicates that the gas-side concentration boundary layer is effectively thinned. These observations suggest that the electric field reduces the gas-side diffusion-layer thickness and increases the interfacial normal concentration gradient, thereby lowering the mass-transfer resistance and enhancing the interfacial evaporation flux.
Owing to the periodic oscillations of the evaporation flux, the surface vapour concentration exhibits corresponding periodic variations, as illustrated in Figure 12. The surface concentration closely follows the temporal evolution of the evaporation flux, confirming that the vapor concentration at the droplet interface is dynamically regulated through instantaneous mass transfer.
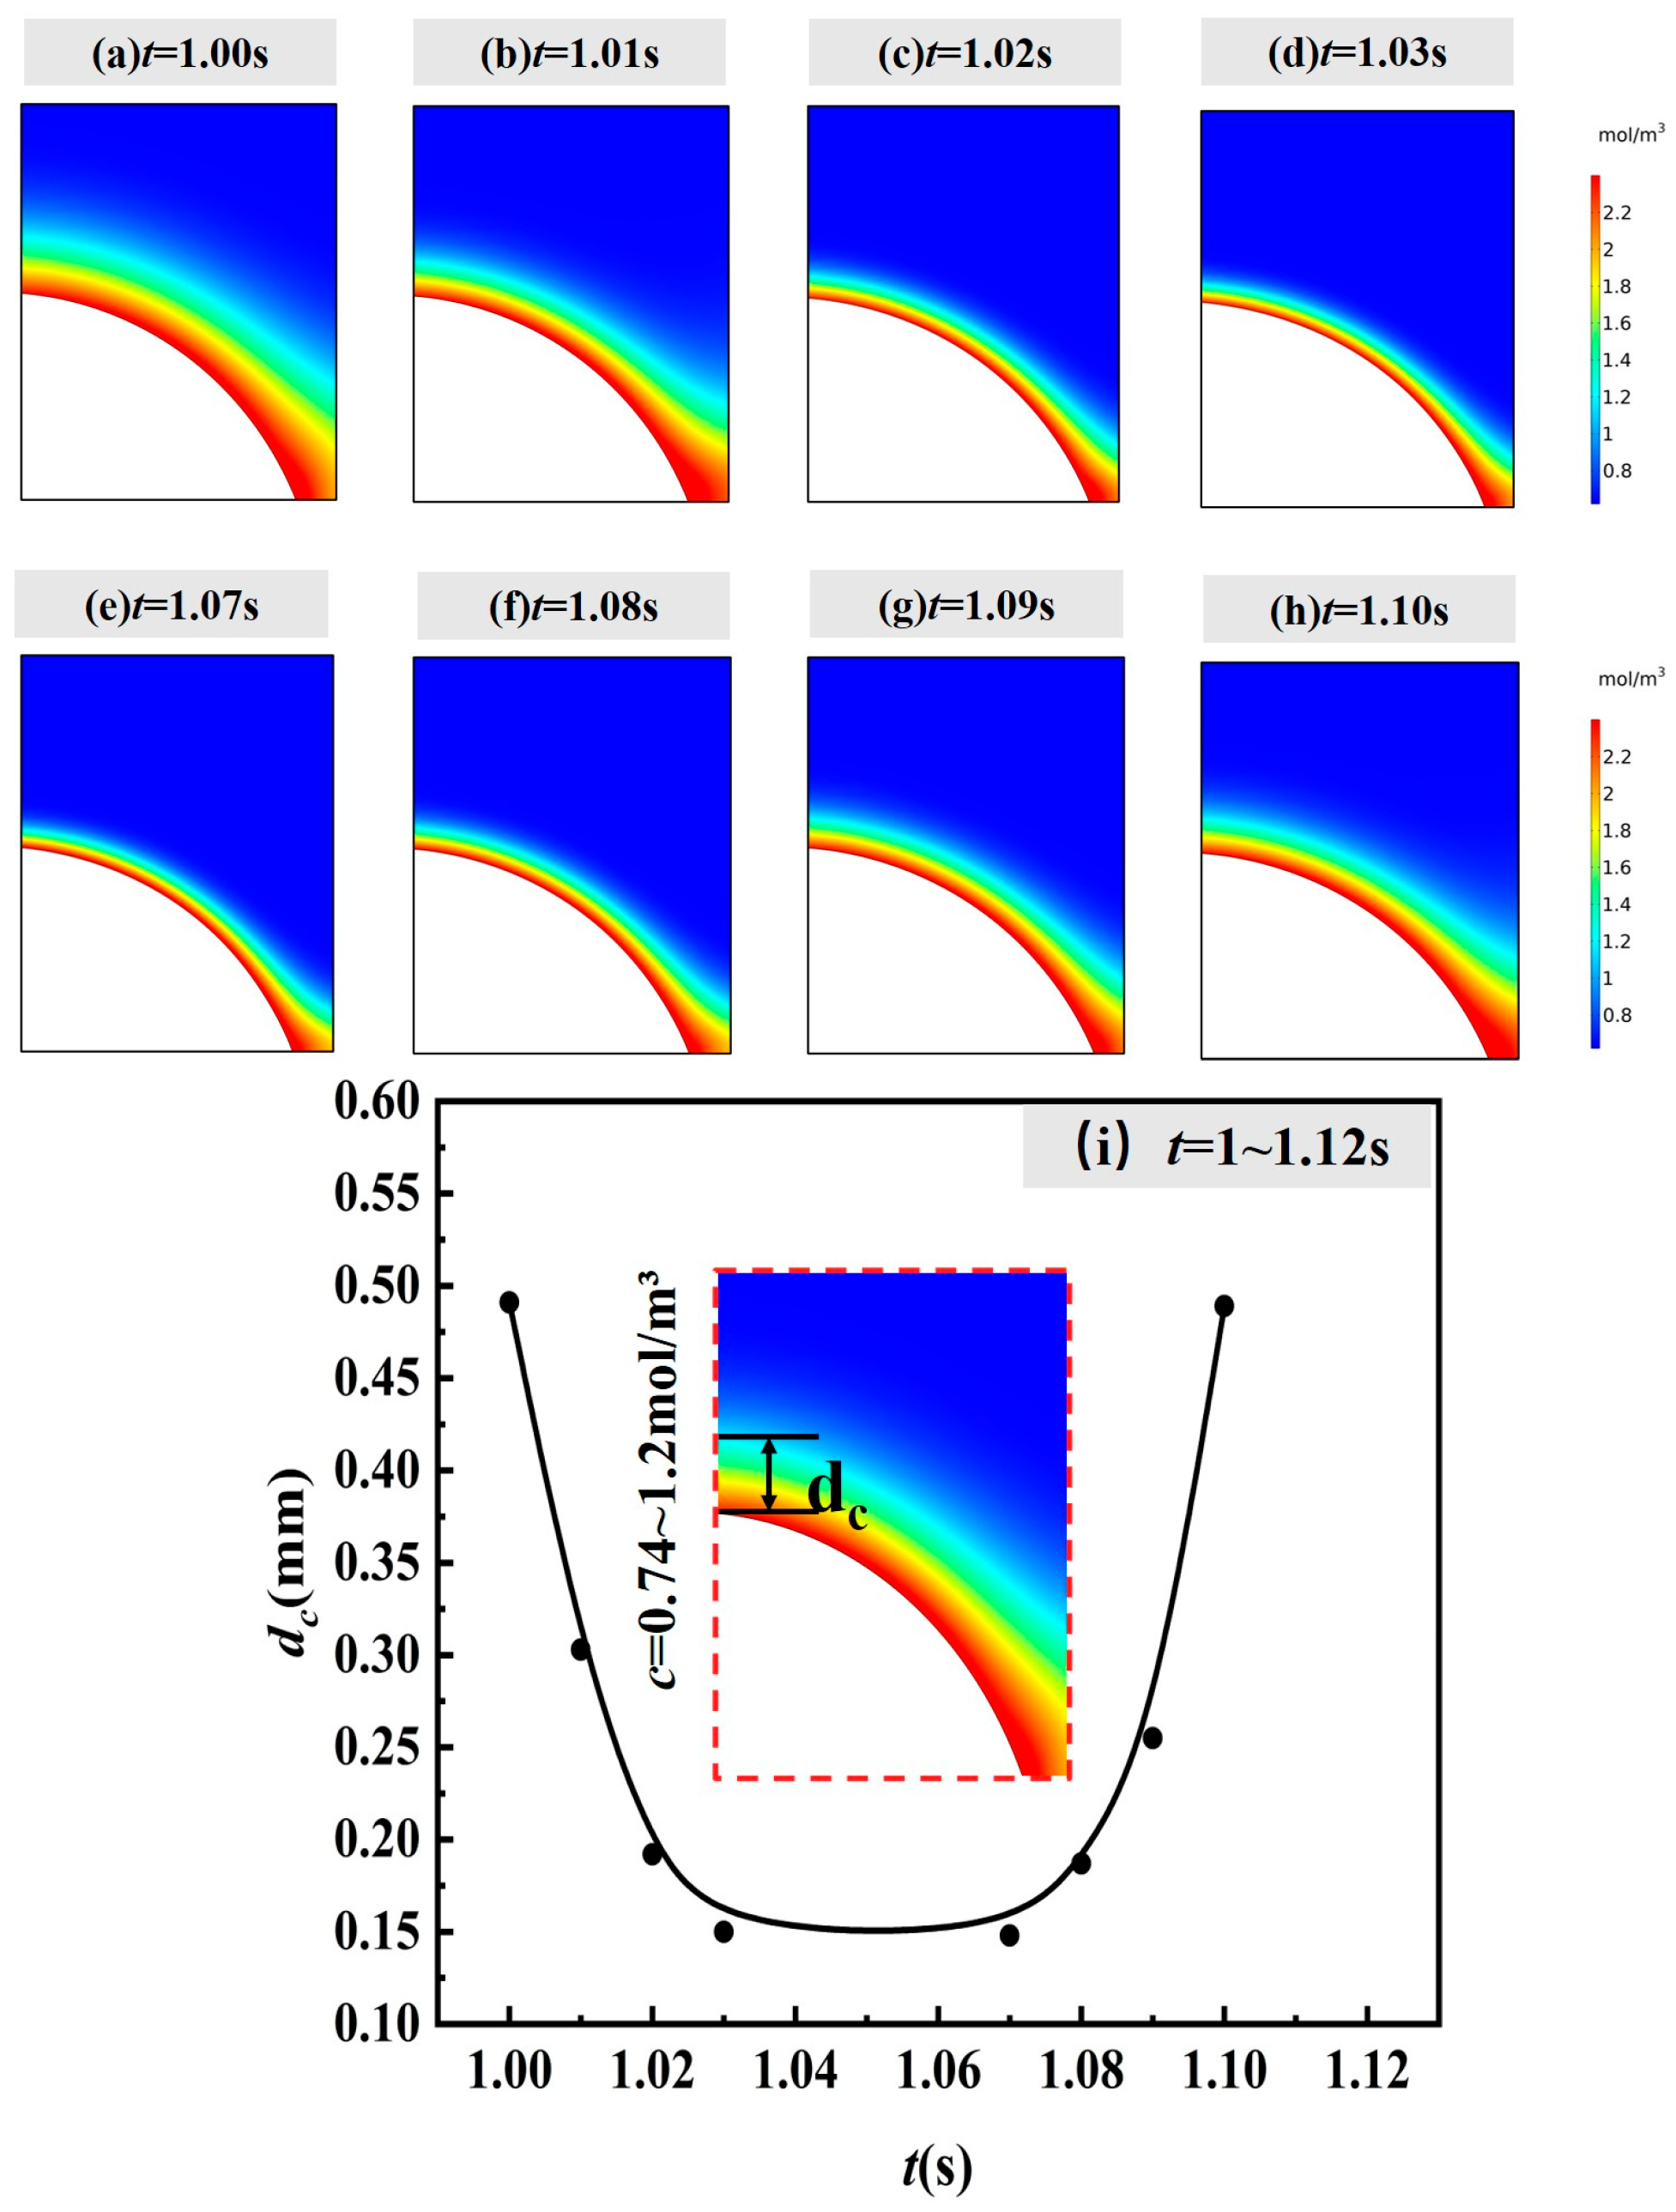
Figure 12 further illustrates, for U 0 = 40 kV and f = 5   Hz, the short-time evolution of the near-interface vapour concentration field (top snapshots) and the corresponding characteristic diffusion distance (boundary-layer thickness) d c t   (bottom curve). Here, d c is defined as the normal distance from the interface (starting at the saturated interfacial concentration c s ) to a prescribed concentration level ( c = 0.74–1.2 mol/m3), serving as a proxy for the instantaneous gas-side diffusion-layer thickness. The near-interface high-concentration band is not stationary; instead, it undergoes periodic compression and relaxation in response to electrically driven deformation and the associated modulation of interfacial flux. Accordingly, d c ( t ) exhibits clear periodic oscillations and undergoes two thinning events within each voltage period. When the iso-concentration contours compress and the normal gradient steepens, d c decreases, indicating reduced gas-side mass-transfer resistance and an enhanced instantaneous evaporation flux; conversely, when the layer relaxes and thickens, d c increases and the instantaneous flux decreases. These results indicate that the AC field regulates droplet evaporation primarily by periodically reshaping the interfacial vapour concentration boundary layer and thus dynamically modulating gas-phase mass transfer, rather than by directly altering the phase-change mechanism itself.

3.2. Evaporation Performance Under AC Electric-Field Actuation

3.2.1. Phase-Locked Oscillations of Surface Velocity and Evaporation Flux

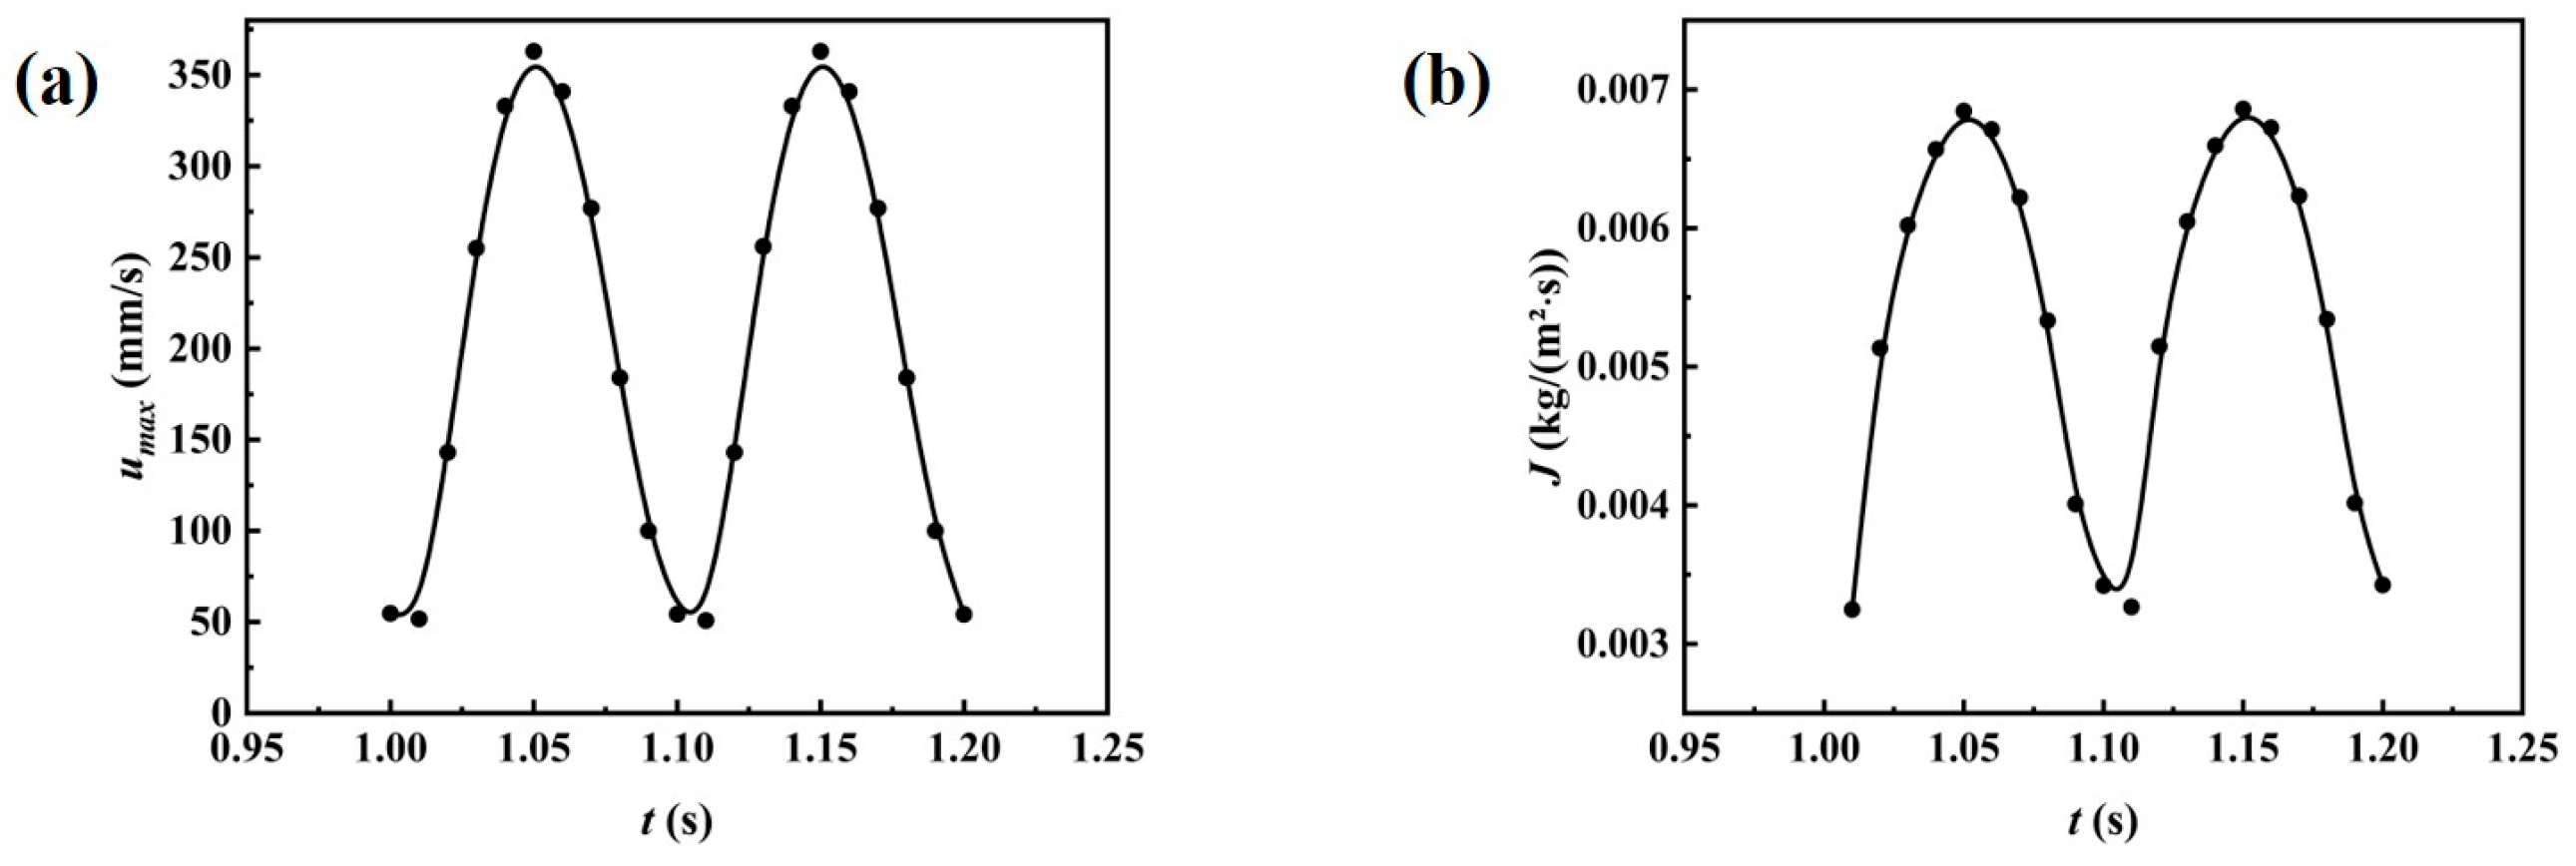
Figure 13 shows the coupled time evolution of the maximum interfacial speed, u m a x , and the interfacial evaporative mass flux, J , over a representative time window under AC forcing ( U 0 = 40   kV, f = 5   Hz; t = 1.0 1.2   s). The u m a x signal exhibits a periodic rapid rise–fall pattern, with two pronounced intensification events per voltage period. The evaporative flux, J , shows a highly synchronous double-peaked oscillation: it increases as u m a x rises and decreases as the speed weakens, indicating a direct transient coupling between flux modulation and electrically enhanced interfacial shear/internal recirculation. This double-peaked behaviour is consistent with the 2:1 geometric response in Figure 7. Because Maxwell stress scales as U 2 , the interfacial forcing peaks twice within each voltage cycle, triggering a frequency-doubled pathway from deformation/flow intensification to enhanced interfacial mass transfer. Gas-side analyses (Figure 11 and Figure 12) further show that flux maxima coincide with periodic thinning of the concentration boundary layer and a steeper normal concentration gradient, closing the transient coupling loop under AC forcing: enhanced interfacial motion reduced gas-side resistance increased evaporation flux.

3.2.2. Voltage-Amplitude Dependence of Volume Decay and Droplet Lifetime

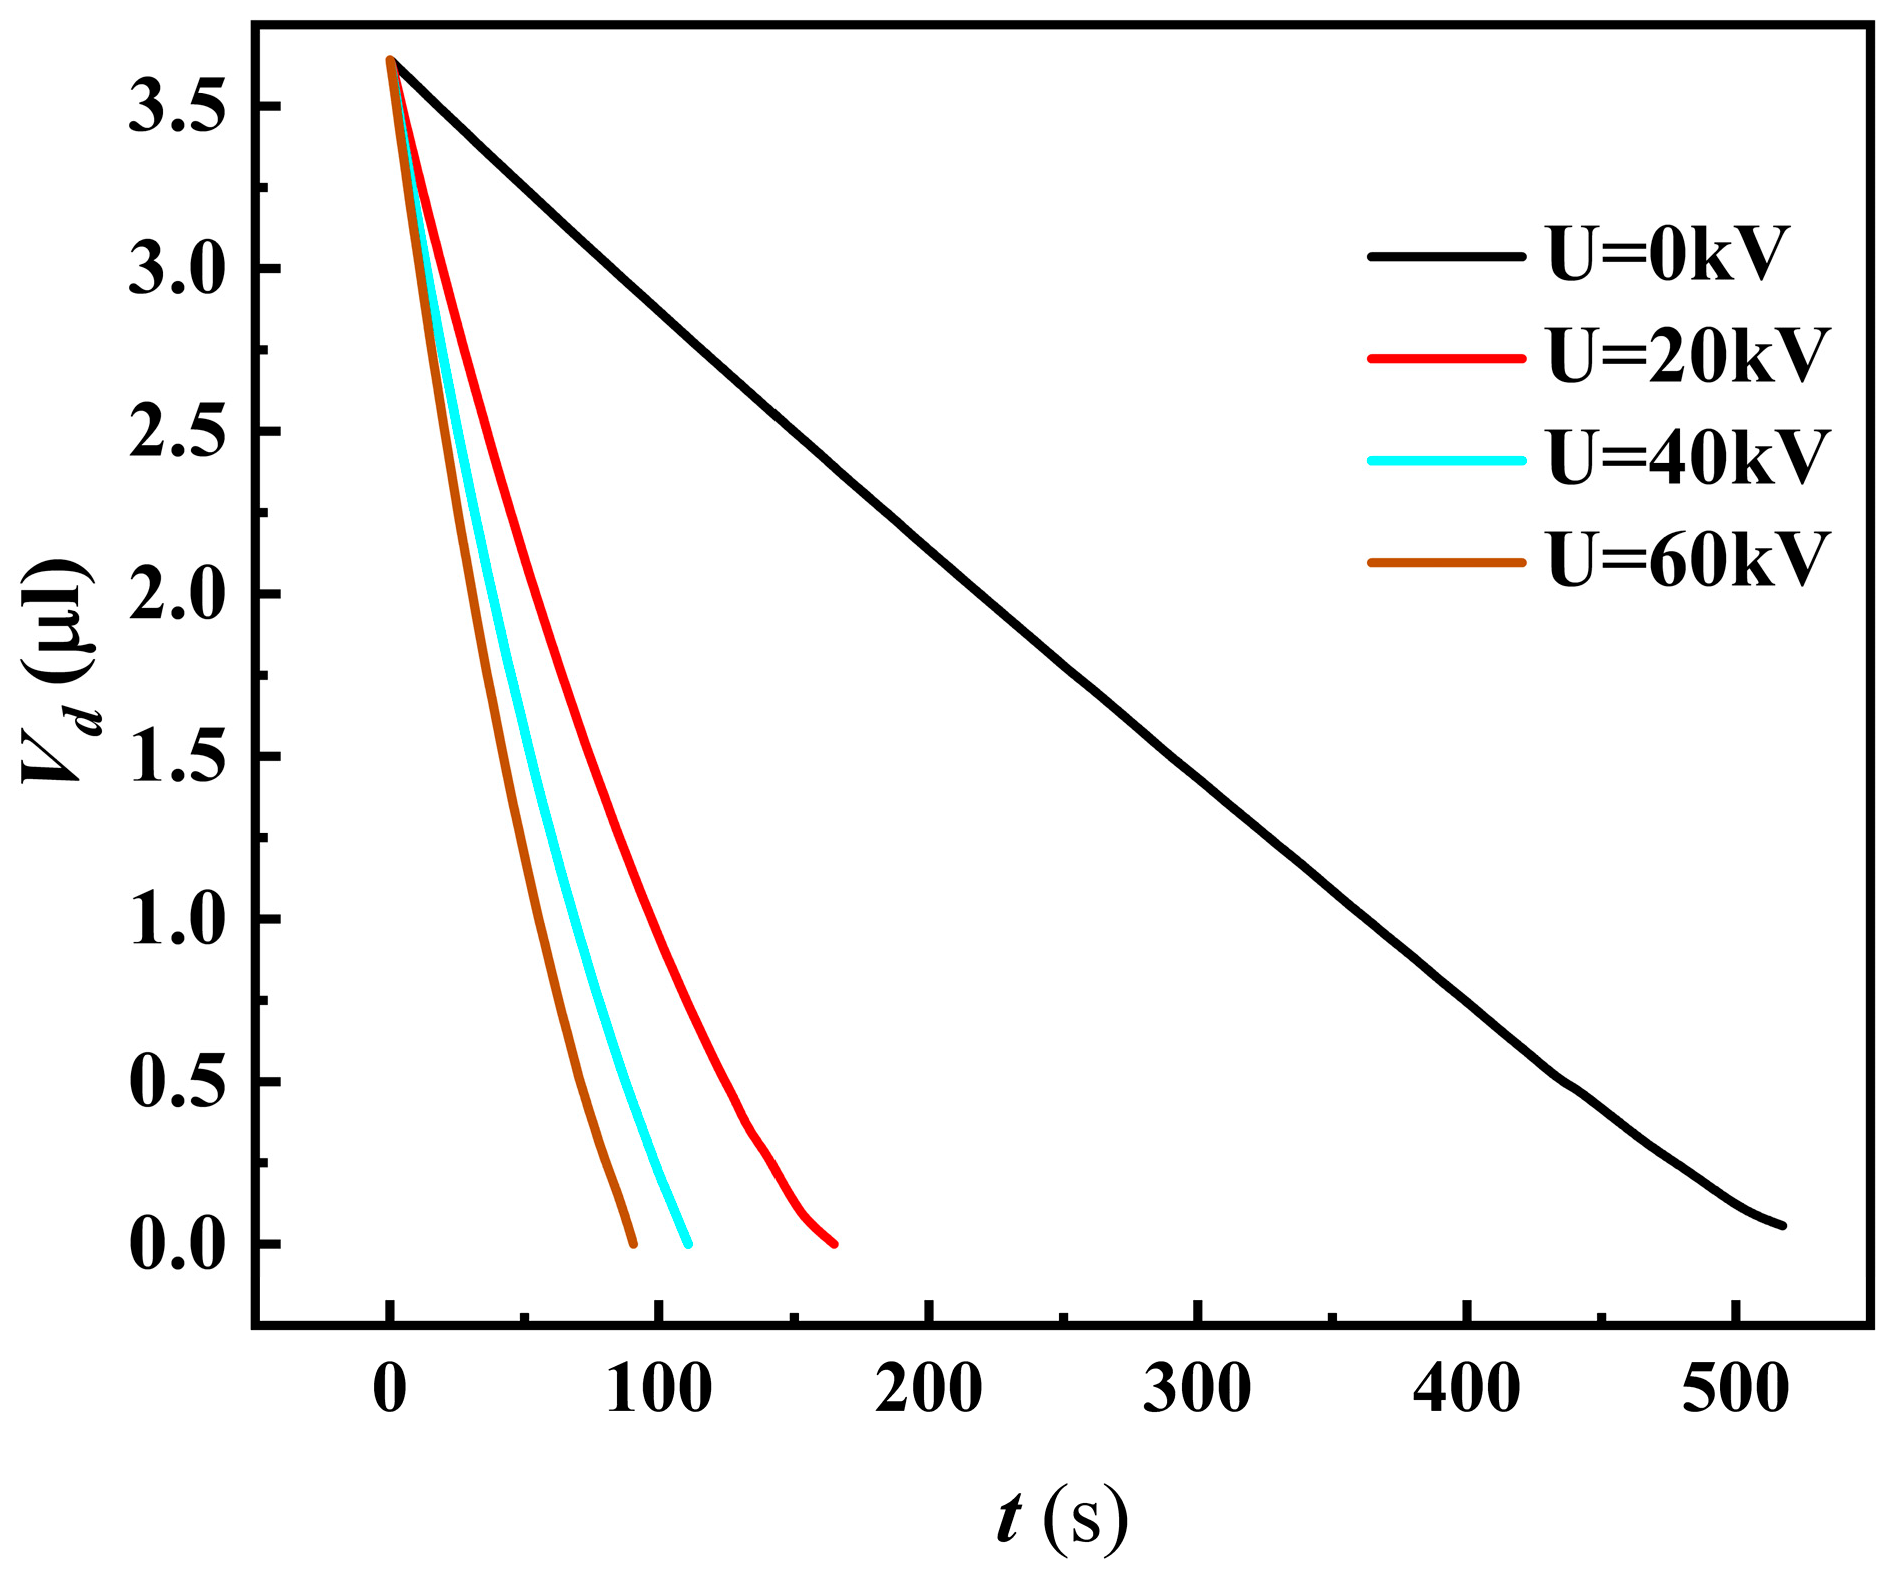
As shown in Figure 14, the evolution of V d over time is compared across voltage amplitudes, offering a direct assessment of AC-field forcing on the global evaporation dynamics. As the voltage increases from 0 to 20, 40 and 60 kV, V d decreases monotonically at a faster rate and the droplet lifetime shortens substantially, indicating a clear enhancement of the macroscopic evaporation rate under AC actuation. This acceleration is consistent with the transient and gas-side mechanisms described above. The present trend that increasing voltage accelerates evaporation is consistent with previous studies on electric-field-enhanced evaporation [9], indicating that the electric field promotes evaporation by enhancing interfacial deformation and flow and by thinning the boundary layer [41]. In Figure 13, AC forcing produces synchronous periodic intensification of the maximum interfacial speed u m a x and the evaporative mass flux J . In Figure 12, the external concentration field exhibits a compressed gas-side concentration boundary layer and a steeper normal gradient, which reduces gas-side mass-transfer resistance and increases the cycle-averaged flux J , ultimately accelerating the cumulative volume loss. Moreover, because Maxwell stress scales as U 2 , higher voltages drive stronger deformation and coupled electrohydrodynamic motion, and more effectively thin the gas-side diffusion layer, explaining the strong sensitivity of volume decay to voltage amplitude. Overall, Figure 13 quantitatively confirms a marked increase in evaporation under AC forcing and shows that the enhancement is dominated by the voltage amplitude.

3.2.3. Frequency Dependence of Cycle-Averaged Evaporation Flux

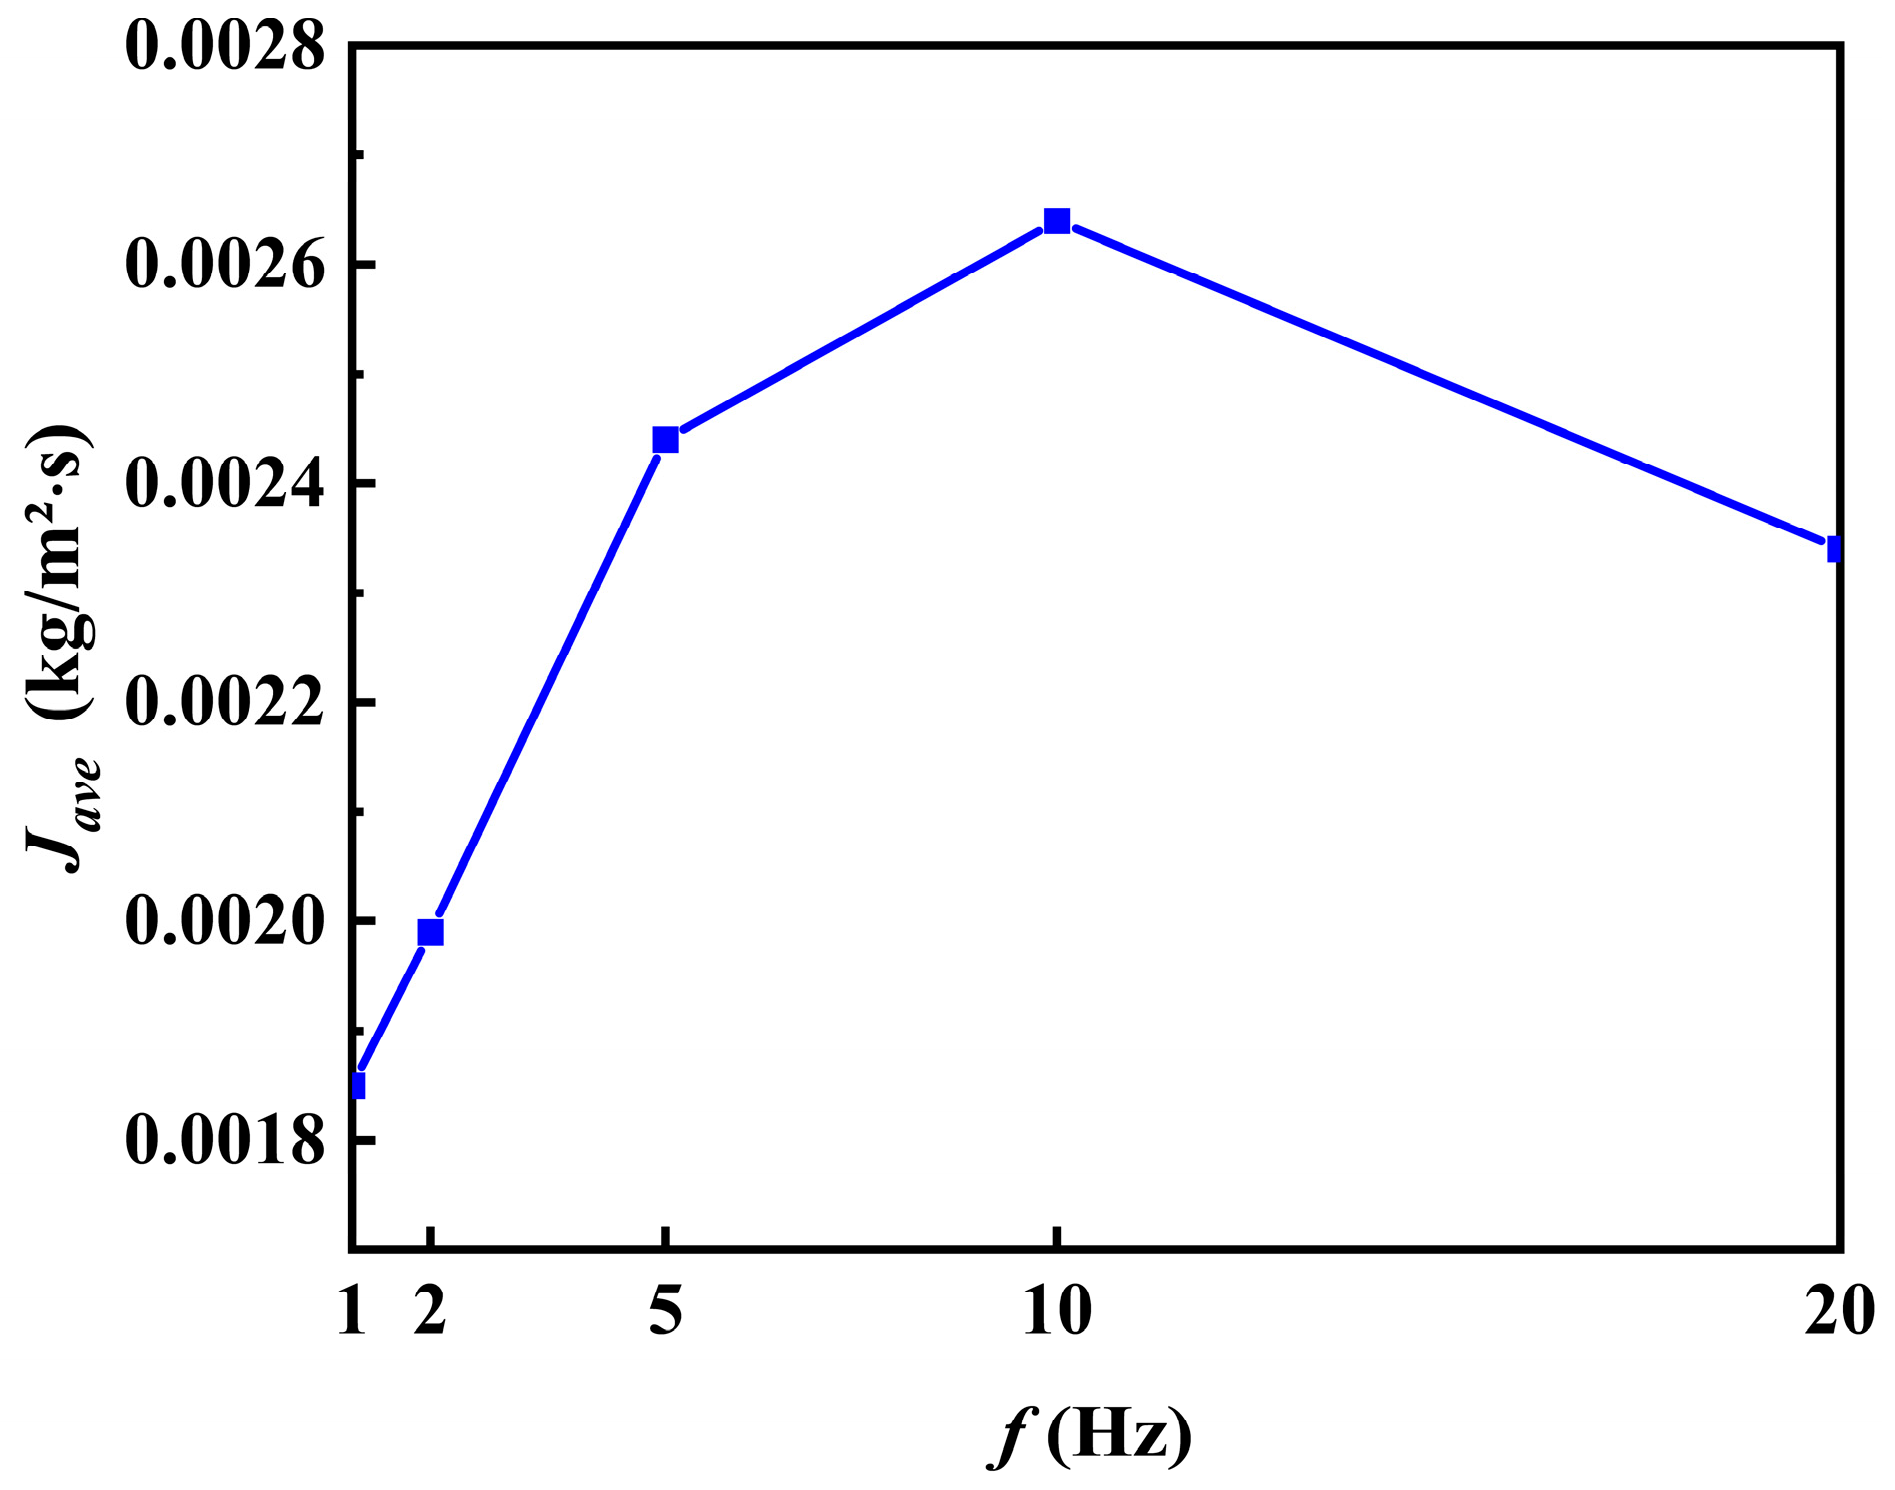
Under an applied AC electric field, interfacial evaporation (mass rate or mass flux) becomes distinctly unsteady and exhibits periodic oscillations that are approximately in phase with the external forcing. To quantify evaporation performance, we define the cycle-averaged evaporation rate (or flux) over one AC period T , J a v e = 1 T t 0 t 0 + T J ( t ) d t , where J ( t ) is the instantaneous evaporation rate (or mass flux) and t 0 denotes the start of the selected cycle. Figure 15 shows J a v e as a function of frequency f at fixed voltage amplitude: J a v e increases markedly as f increases from 1 to 10 Hz, but decreases slightly at 20 Hz. Mechanistically, AC-driven deformation and the coupled electrohydrodynamics periodically compress and relax the gas-side concentration boundary layer, d c ( t ) , thereby modulating the interfacial normal concentration gradient and, in turn, J ( t ) . Increasing f from low values makes these compression events occur more frequently per unit time, helping to sustain a higher mean interfacial gradient and thus a larger J a v e . At higher frequencies (20 Hz), the deformation and the diffusion layer may not fully track the rapid forcing owing to phase lag and a reduced modulation amplitude; this weakens boundary-layer thinning and leads to a slight reduction in J a v e . Importantly, the frequency-induced variation in J a v e   is modest compared with the strong amplitude-driven acceleration in Figure 13, indicating that over the present range the overall enhancement is dominated by voltage amplitude—consistent with the U 2 scaling of electric stress—whereas frequency plays a secondary role. Moreover, the non-monotonic frequency dependence of the cycle-averaged evaporation flux is consistent with the frequency-selective evaporation behaviour reported by Ye et al. [11], indicating that the frequency effect is not simply monotonic. It should be noted that the relative importance of gas-side boundary-layer compression and liquid-side homogenization may vary with ambient and interfacial conditions. Higher ambient humidity weakens the gas-side mass-transfer driving force and thus reduces the effect of boundary-layer compression [42,43]. By contrast, a higher substrate temperature enhances thermal input and internal heat redistribution, making liquid-side thermal homogenization relatively more important. Lower surface tension may also strengthen gas-side vapour-layer compression by increasing interfacial deformability. However, if surfactants are present, additional interfacial adsorption and Marangoni stresses may further modify the internal flow structure.

4. Conclusions

We developed a fully coupled, transient ALE multiphysics model to examine AC-field-modulated evaporation of a pinned (CCR) sessile water droplet, resolving electrostatics, EHD-driven flow, heat transfer with evaporative cooling, and transient vapour transport in air. We incorporated an instantaneous electrowetting contact-angle law; under CCR conditions, the response is purely voltage-controlled. The simulations reveal a robust 2:1 frequency-doubled deformation: because the Maxwell stress scales as E 2 , the droplet height and contact angle exhibit two deformation events per voltage cycle. This electromechanical response propagates directly to evaporation, producing synchronised double-peaked oscillations in the interfacial velocity and evaporative flux. By introducing a characteristic gas-side diffusion length, we show that flux maxima coincide with the periodic thinning of the vapour-concentration boundary layer, indicating that AC enhancement is governed primarily by the time-resolved modulation of gas-side mass-transfer resistance. Overall, increasing the voltage amplitude markedly accelerates volume loss and shortens droplet lifetime, whereas frequency provides only secondary tuning within the present range (increasing from 1 to 10 Hz and decreasing slightly at 20 Hz).
These findings are relevant to spray cooling, inkjet printing, and coating processes, where repeated interfacial renewal, reduced gas-side transport resistance, and enhanced near-interface transport are all beneficial to evaporation and drying control. In this sense, voltage amplitude acts as the dominant enhancement parameter, while frequency mainly provides auxiliary tuning of the response rhythm and mean evaporation intensity. This voltage-dominant, frequency-tuning behaviour offers useful guidance for balancing evaporation enhancement and process controllability in practical applications. Because directly matching experimental data remain limited, the present results are validated mainly through consistency in trends and physical mechanisms with related published studies. The present conclusions are restricted to stationary droplets under pinned-contact-line CCR conditions. Future work should therefore extend the framework to moving contact lines, contact-angle hysteresis, mixed CCR/CCA modes, complex fluids, interfacial instabilities, and structured or deformable substrates.

Author Contributions

Y.L.: Investigation, writing—original draft, and investigation. Y.S.: Conceptualization, funding acquisition, and writing—review and editing. All authors have read and agreed to the published version of the manuscript.

Funding

This work is supported by the National Natural Science Foundation of China (No.NSFC 52176159).

Data Availability Statement

The data present in this study are available on request from the first author (Y.L.).

Conflicts of Interest

The authors declare no conflicts of interest.

Appendix A

Validation of the electric-field model is performed using the computational configuration shown in Figure A1, where a silicone-oil droplet of radius R 0 deforms under an AC electric field as the capillary number C a is varied.
Figure A1. Schematic of the computational setup for AC-electric-field-induced deformation of a suspended droplet.
Processes 14 01066 g0a1

Appendix A.1. Governing Equations

Appendix A.1.1. Flow Equations

The validation case shown in Figure A1 uses the same incompressible ALE flow formulation as that adopted in the main text. Therefore, the continuity and momentum equations are not repeated here, and the reader is referred to Equations (4) and (5).

Appendix A.1.2. Electrostatic Equations

The electric-field validation problem is governed by the same quasi-electrostatic formulation as that used in the main text. Accordingly, the curl-free condition, electric-potential relation, constitutive equation for the electric displacement, Poisson equation, and charge-conservation equation are not repeated here; see Equations (9)–(13) in the main text.

Appendix A.2. Initial and Boundary Condition Settings

Appendix A.2.1. At r = 0

Axisymmetry was enforced as shown below:
u n = 0 , n P I + μ ( u + ( u ) T ) = 0 , n ( ε 0 ε r E ) = 0

Appendix A.2.2. At r = 12.5 R 0

u = 0 , n ( ε 0 ε r E ) = 0

Appendix A.2.3. At the Droplet Interface

At the liquid–gas interface, the same interfacial stress balance and surface-tension decomposition as those used in the main text are applied. Therefore, the detailed expressions are not repeated here; the reader is referred to Equations (18)–(22).

Appendix A.2.4. The Remaining Boundary Conditions Are Given by

The electric potential is prescribed as U ( t )   at z = 0 , while the boundary at z = 25 R 0 is grounded ( U ( t ) = 0 V).

Appendix A.2.5. The Initial State Is Defined by

The initial condition was prescribed such that the velocity is zero, and the initial volumetric charge density is fixed at 0 C/m3.

References

  1. Yang, H.; Rong, L.; Liu, X.; Liu, L.; Fan, M.; Pei, N. Experimental Research on Spray Evaporative Cooling System Applied to Air-Cooled Chiller Condenser. Energy Rep. 2020, 6, 906–913. [Google Scholar] [CrossRef] [Scilit]
  2. Lim, T.; Han, S.; Chung, J.; Chung, J.T.; Ko, S.; Grigoropoulos, C.P. Experimental Study on Spreading and Evaporation of Inkjet Printed Pico-Liter Droplet on a Heated Substrate. Int. J. Heat Mass Transf. 2009, 52, 431–441. [Google Scholar] [CrossRef] [Scilit]
  3. Shan, Y.; Hu, Y. Heat and Mass Transfer Within an Evaporating Solution Droplet in a Plasma Jet. J. Therm. Spray Technol. 2012, 21, 676–688. [Google Scholar] [CrossRef] [Scilit]
  4. Dugas, V.; Broutin, J.; Souteyrand, E. Droplet Evaporation Study Applied to DNA Chip Manufacturing. Langmuir 2005, 21, 9130–9136. [Google Scholar] [CrossRef] [Scilit]
  5. Zhang, X.; Chen, H.; Wang, Y.; Gao, X.; Wang, Z.; Wang, N.; Zang, D. Ultrasound Induced Grain Refinement of Crystallization in Evaporative Saline Droplets. Ultrason. Sonochem. 2024, 107, 106938. [Google Scholar] [CrossRef] [Scilit] [PubMed]
  6. Kichatov, B.; Korshunov, A.; Sudakov, V.; Golubkov, A. Evaporation of Ferrofluid Drop in Magnetic Field in Leidenfrost Mode. J. Magn. Magn. Mater. 2023, 588, 171410. [Google Scholar] [CrossRef] [Scilit]
  7. Yao, J.; Wang, J.; Dong, Q.; Xu, H.; Zhang, W.; Zuo, L.; Liu, R. Investigation of Electrohydrodynamic Effects on Sessile Droplet Evaporation Using the Lattice Boltzmann Method. Appl. Therm. Eng. 2024, 236, 121739. [Google Scholar] [CrossRef] [Scilit]
  8. Yao, J.; Wang, J.; Dong, Q.; Wang, D.; Zhang, W.; Xu, H.; Zuo, L. Lattice Boltzmann Study of Droplet Evaporation on a Heated Substrate under a Uniform Electric Field. Appl. Therm. Eng. 2022, 211, 118517. [Google Scholar] [CrossRef] [Scilit]
  9. Xu, H.; Wang, J.; Tian, J.; Huo, Y.; Li, B.; Wang, D.; Zhang, W.; Yao, J. Evaporation Characteristics and Heat Transfer Enhancement of Sessile Droplets under Non-Uniform Electric Field. Exp. Therm. Fluid Sci. 2021, 126, 110378. [Google Scholar] [CrossRef] [Scilit]
  10. Gibbons, M.J.; Garivalis, A.I.; O’Shaughnessy, S.; Di Marco, P.; Robinson, A.J. Evaporating Hydrophilic and Superhydrophobic Droplets in Electric Fields. Int. J. Heat Mass Transf. 2021, 164, 120539. [Google Scholar] [CrossRef] [Scilit]
  11. Ye, S.; Lei, S.; Liu, X.; He, D.; Chen, Y. Experimental Study of Droplet Evaporation on the Inclined Plane under the Periodically Varying Directional Electric Field. Sens. Actuators A Phys. 2023, 360, 114551. [Google Scholar] [CrossRef] [Scilit]
  12. Kaushal, A.; Mehandia, V.; Dhar, P. Regulating Complex Fluid Sessile Droplet Evaporation Kinetics by Suppression of Internal Electro-Convection. Colloids Surf. A Physicochem. Eng. Asp. 2022, 653, 130010. [Google Scholar] [CrossRef] [Scilit]
  13. Wang, W.; Huang, X.; Wang, L.; Teng, L.; Luo, X.; Li, W.; Li, J.; Yin, P.; Luo, Y.; Jiang, L. Study on the Mechanism of Sessile Droplets Evaporation Enhanced by the Electric Field. Chem. Eng. Sci. 2024, 288, 119768. [Google Scholar] [CrossRef] [Scilit]
  14. Yang, K.; Hong, F.; Cheng, P. A Fully Coupled Numerical Simulation of Sessile Droplet Evaporation Using Arbitrary Lagrangian–Eulerian Formulation. Int. J. Heat Mass Transf. 2014, 70, 409–420. [Google Scholar] [CrossRef] [Scilit]
  15. Li, B.; Wang, Z.; Vivacqua, V.; Ghadiri, M.; Wang, J.; Zhang, W.; Wang, D.; Liu, H.; Sun, Z.; Wang, Z. Drop-Interface Electrocoalescence Mode Transition under a Direct Current Electric Field. Chem. Eng. Sci. 2020, 213, 115360. [Google Scholar] [CrossRef] [Scilit]
  16. Chen, N.; Gan, Y.; Shi, Y. Enhanced Controllability of Droplet Evaporation via DC Electric Field. Chem. Eng. J. 2024, 479, 147488. [Google Scholar] [CrossRef] [Scilit]
  17. Nazari, H.; Pournaderi, P. The Electric Field Effect on the Droplet Collision with a Heated Surface in the Leidenfrost Regime. Acta Mech. 2019, 230, 787–804. [Google Scholar] [CrossRef] [Scilit]
  18. Lee, H.; Yun, S.; Ko, S.H.; Kang, K.H. An Electrohydrodynamic Flow in Ac Electrowetting. Biomicrofluidics 2009, 3, 044113. [Google Scholar] [CrossRef] [Scilit]
  19. Garg, A.; Akkinepally, B.; Sarkar, J.; Pattanayek, S.K. Emerging Perspectives in Non-Newtonian Fluid Dynamics: Research Gaps, Evolving Methods, and Conceptual Limitations. Phys. Fluids 2025, 37, 071401. [Google Scholar] [CrossRef] [Scilit]
  20. Wang, W.; Han, B.; Zhang, Y.; Li, Q.; Zhang, Y.; Han, D.; Sun, H. Laser-Induced Graphene Tapes as Origami and Stick-On Labels for Photothermal Manipulation via Marangoni Effect. Adv. Funct. Mater. 2021, 31, 2006179. [Google Scholar] [CrossRef] [Scilit]
  21. Bhardwaj, R.; Fang, X.; Attinger, D. Pattern Formation during the Evaporation of a Colloidal Nanoliter Drop: A Numerical and Experimental Study. New J. Phys. 2009, 11, 075020. [Google Scholar] [CrossRef] [Scilit]
  22. Kelly-Zion, P.L.; Pursell, C.J.; Vaidya, S.; Batra, J. Evaporation of Sessile Drops under Combined Diffusion and Natural Convection. Colloids Surf. A Physicochem. Eng. Asp. 2011, 381, 31–36. [Google Scholar] [CrossRef] [Scilit]
  23. Semenov, S.; Starov, V.M.; Rubio, R.G.; Velarde, M.G. Instantaneous Distribution of Fluxes in the Course of Evaporation of Sessile Liquid Droplets: Computer Simulations. Colloids Surf. A Physicochem. Eng. Asp. 2010, 372, 127–134. [Google Scholar] [CrossRef] [Scilit]
  24. Liu, G.; Zhang, Y.; Li, D.; Peng, Y.; Wu, J. Review on Electro-Convection and Electro–Thermo-Convection in Dielectric Liquids within Different Geometrical Models. J. Electrost. 2025, 137, 104089. [Google Scholar] [CrossRef] [Scilit]
  25. Davis, J.E.; Kabov, O.A.; Zaitsev, D.V.; Ajaev, V.S. Heat transfer, vapour diffusion and Stefan flow around levitating droplets near a heated liquid surface. J. Fluid Mech. 2023, 964, A3. [Google Scholar] [CrossRef] [Scilit]
  26. Cipriano, E.; Saufi, A.E.; Frassoldati, A.; Faravelli, T.; Popinet, S.; Cuoci, A. Multicomponent Droplet Evaporation in a Geometric Volume-of-Fluid Framework. J. Comput. Phys. 2024, 507, 112955. [Google Scholar] [CrossRef] [Scilit]
  27. Bernetski, K.A.; An, H.T.; Maki, K.L.; Schertzer, M.J. Predicting Actuated Contact Line Pinning Forces and the Elimination of Hysteresis under AC Electrowetting. Microfluid. Nanofluid 2022, 26, 94. [Google Scholar] [CrossRef] [Scilit]
  28. Rocha, D.; Lederer, P.L.; Dekker, P.J.; Marin, A.; Lohse, D.; Diddens, C. Evaporating Sessile Droplets: Solutal Marangoni Effects Overwhelm Thermal Marangoni Flow. J. Fluid Mech. 2025, 1013, A39. [Google Scholar] [CrossRef] [Scilit]
  29. Diddens, C.; Li, Y.; Lohse, D. Competing Marangoni and Rayleigh Convection in Evaporating Binary Droplets. J. Fluid Mech. 2021, 914, A23. [Google Scholar] [CrossRef] [Scilit]
  30. Saville, D.A. Electrohydrodynamics: The Taylor-Melcher Leaky Dielectric Model. Annu. Rev. Fluid Mech. 1997, 29, 27–64. [Google Scholar] [CrossRef] [Scilit]
  31. Li, B.; Dou, X.; Yu, K.; Zhang, W.; Xu, H.; Sun, Z.; Wang, Z.; Wang, J. Electrocoalescence of Water Droplet Trains in Sunflower Oil under the Coupling of Non-Uniform Electric and Laminar Flow Fields. Chem. Eng. Sci. 2022, 248, 117158. [Google Scholar] [CrossRef] [Scilit]
  32. Tomar, G.; Gerlach, D.; Biswas, G.; Alleborn, N.; Sharma, A.; Durst, F.; Welch, S.W.J.; Delgado, A. Two-Phase Electrohydrodynamic Simulations Using a Volume-of-Fluid Approach. J. Comput. Phys. 2007, 227, 1267–1285. [Google Scholar] [CrossRef] [Scilit]
  33. Chen, Y.H.; Hu, W.N.; Wang, J.; Hong, F.J.; Cheng, P. Transient Effects and Mass Convection in Sessile Droplet Evaporation: The Role of Liquid and Substrate Thermophysical Properties. Int. J. Heat Mass Transf. 2017, 108, 2072–2087. [Google Scholar] [CrossRef] [Scilit]
  34. Gao, Y.-F.; He, W.-F. Transient study of droplet oscillation characteristics driven by an electric field. Chin. Phys. B 2023, 32, 128201. [Google Scholar] [CrossRef] [Scilit]
  35. Ha, J.-W.; Yang, S.-M. Deformation and Breakup of Newtonian and Non-Newtonian Conducting Drops in an Electric Field. J. Fluid Mech. 2000, 405, 131–156. [Google Scholar] [CrossRef] [Scilit]
  36. Sobac, B.; Brutin, D. Thermal Effects of the Substrate on Water Droplet Evaporation. Phys. Rev. E 2012, 86, 021602. [Google Scholar] [CrossRef] [Scilit] [PubMed]
  37. Jia, H.; Xiao, X.; Kang, Y. Investigation of a Free Rising Bubble with Mass Transfer by an Arbitrary Lagrangian–Eulerian Method. Int. J. Heat Mass Transf. 2019, 137, 545–557. [Google Scholar] [CrossRef] [Scilit]
  38. Pillai, D.S. Electrowetting of a Leaky Dielectric Droplet under a Time-Periodic Electric Field. Phys. Rev. Fluids 2021, 6, 073701. [Google Scholar] [CrossRef] [Scilit]
  39. Jiang, Z.; Gan, Y.; Shi, Y. Numerical Analysis on the Heat/Mass Transfer to a Deformed Droplet under a Steady Electric Field. Int. J. Heat Mass Transf. 2022, 188, 122617. [Google Scholar] [CrossRef] [Scilit]
  40. Peclet Number—An Overview|ScienceDirect Topics. Available online: https://www.sciencedirect.com/topics/chemical-engineering/peclet-number?utm_source=chatgpt.com (accessed on 22 March 2026).
  41. Jaiswal, V.; Dhar, P. Interplay of Electro-Thermo-Solutal Advection and Internal Electrohydrodynamics Governed Enhanced Evaporation of Droplets. Proc. A 2019, 475, 20190046. [Google Scholar] [CrossRef] [Scilit]
  42. Wilson, S.K.; D’Ambrosio, H.-M. Evaporation of Sessile Droplets. Annu. Rev. Fluid Mech. 2023, 55, 481–509. [Google Scholar] [CrossRef] [Scilit]
  43. Zhang, L.; Zhao, L.; Wang, E.N. Stefan Flow Induced Natural Convection Suppression on High-Flux Evaporators. Int. Commun. Heat Mass Transf. 2020, 110, 104255. [Google Scholar] [CrossRef] [Scilit]
Figure 1. Computational schematic for evaporation of a sessile droplet under an AC electric field.
Processes 14 01066 g001
Figure 2. Grid-independence verification: (a) temporal evolution of droplet volume; (b) instantaneous evaporation flux J for different mesh resolutions.
Processes 14 01066 g002
Figure 3. Time-step sensitivity test at the highest forcing frequency ( f = 20 Hz, T = 0.05 s): (a) droplet-height history, h d ( t ) , for N = 50, 250 and 500 time steps per forcing period during a steady-state cycle ( t = 1.00–1.05 s); (b) instantaneous evaporation flux J for the same cases.
Processes 14 01066 g003
Figure 4. Steady-state droplet deformation in silicone oil under AC electric forcing, comparing the present simulations with results reported in the literature. The oil properties are as follows: density ρ 0 = 960 kg/m3, the dynamic viscosity is μ = 1 Pa · s, and the relative permittivity is ε r , 0 = 2.26 , and surface tension γ = 31 mN/m [13,35].
Processes 14 01066 g004
Figure 5. Baseline validation of the droplet evaporation model (no electric field). For the CCR model, a water droplet fixed on a PTFE substrate undergoes evaporation in the air ( θ = 0.71 π rad, V d = 3.04 μ L, T w = T c = 294.05 K, R H = 0.4); additionally, a water droplet fixed on an aluminium substrate undergoes evaporation in the air ( θ = 0.38 π rad, V d = 3.64 μ L, T w = T c = 298.55 K, R H = 0.475). (PTFE; ρ = 2200 kg/m3, k = 0.25 W/(m · K), C P = 1050 J/(kg · K), Al ρ = 2700 kg/m3, k = 238 W/(m · K), C P = 900 J/(kg · K)) [33,36].
Processes 14 01066 g005
Figure 6. Spatial distributions of surface electric potential and interfacial electric stress on a droplet under AC forcing (a,b). ( U 0 = 40 kV.) ( θ = 0.38 π rad, V d = 3.64 μ L, T w = 313.15 K, R H = 0.475.) This figure highlights the strongly non-uniform distribution of interfacial electric stress along the droplet surface. The stress reaches its highest level near the apex, indicating localised Maxwell forcing that initiates droplet deformation and drives the subsequent internal circulation.
Processes 14 01066 g006
Figure 7. Frequency-doubled geometric response of a sessile droplet under an AC electric field (a,b): Time evolution of the normalised voltage, U / U 0 , together with the droplet height, h d , and contact angle, θ . ( θ = 0.38 π rad, V d = 3.64 μ L, T w = 313.15 K, R H = 0.475.).
Processes 14 01066 g007
Figure 8. AC-electric-field-induced deformation of a droplet. (The red and blue arrows schematically indicate the downward and upward displacement trends of the droplet interface, respectively.) ( U 0 = 40 kV, f = 5 Hz, t = 1–1.2 s.) ( θ = 0.38 π rad, V d = 3.64 μ L, T w = 313.15 K, R H = 0.475.).
Processes 14 01066 g008
Figure 9. Effect of voltage on the velocity field inside an evaporating droplet under an AC electric field at t = 5, 10 and 20 s. The arrows represent the instantaneous flow direction inside the evaporating droplet. (a) U 0 = 0 kV, (b) U 0 = 40 kV, and (c) U 0 = 60 kV. The corresponding maximum interfacial velocities are 14.2 mm/s, 66.4 mm/s, and 85.3 mm/s, respectively, which may be taken as representative characteristic circulation velocities. ( f = 5 Hz, ( θ = 0.38 π rad, V d = 3.64 μ L, T w = 313.15 K, R H = 0.475).).
Processes 14 01066 g009
Figure 10. Effect of AC electric field on the temperature field within a droplet. The colour contours represent the temperature distribution, and the arrows indicate the local flow direction inside the droplet. (a) U 0 = 0 kV, (b) U 0 = 40 kV, (c) U 0 = 60 kV. (   f = 5 Hz, ( θ = 0.38 π rad, V d = 3.64 μ L, T w = 313.15 K, R H = 0.475).) A common colour scale is used for all cases. The temperature field becomes more homogeneous as the voltage increases.
Processes 14 01066 g010
Figure 11. Concentration-field distribution in the gas phase surrounding the water droplet. (a)   U 0 = 0 kV, (b)   U 0 = 40 kV. ( θ = 0.38 π rad, V d = 3.64 μ L, T w = 313.15 K, R H = 0.475.).
Processes 14 01066 g011
Figure 12. Temporal evolution of the droplet surface vapour concentration. ( t = 1–1.12 s , U 0 = 40 kV, f = 5 Hz.) ( θ = 0.38 π rad, V d = 3.64 μ L, T w = 313.15 K, R H = 0.475.) The maximum and minimum values of the characteristic diffusion distance d c are 0.49 mm and 0.14 mm, respectively.
Processes 14 01066 g012
Figure 13. Changes in a droplet under an AC electric field ( U 0 = 40 kV, f = 5 Hz): (a) variation in maximum surface velocity with time from 1 to 1.2 s, (b) variation in evaporation flux J with time from 1 to 1.2 s. ( θ = 0.38 π rad, V d = 3.64 μ L, T w = 313.15 K, R H = 0.475.).
Processes 14 01066 g013
Figure 14. Variation in droplet volume with time under different voltage intensities. ( θ = 0.38 π rad, V d = 3.64 μ L, T w = 313.15 K, R H = 0.475.).
Processes 14 01066 g014
Figure 15. Relationship between the average evaporation flux J ave (kg/m2 · s) and electric field frequency. ( θ = 0.38 π rad, V d = 3.64 μ L, T w = 313.15 K, R H = 0.475.).
Processes 14 01066 g015
Table 1. Material properties of water and air listed at 25 °C.
PropertyWaterAir
Density ρ (kg/m3)9981.1841
Molecular weight M (g/mol)1829
Dynamic viscosity μ (Pa · s) 8.925 × 10 4 1.8385 × 10 5
Thermal conductivity k (W/(m · K))0.60260.0262
Specific heat capacity C P (J/(kg · K))4182.71005.6
Latent heat of vaporisation L (kJ/kg)2445.3-
Diffusion coefficient D (m2/s)2.52 × 10−5-
Saturation pressure P s a t Pa3177.8-
Evaporative cooling number E c 0.133-
Relative permittivity ε 821
Interfacial tension γ (mN/m)72-
Table 2. Summary of baseline simulation parameters.
Parameter (Symbol)ValueUnit
Initial droplet radius ( R 0 )1.44   × 10 3 m
Initial contact angle ( θ 0 )0.38 π rad
Initial droplet volume ( V 0 )3.64 μ L
Substrate temperature ( T w )313.15K
Relative humidity ( R H )0.475-
Voltage amplitude ( U 0 )0–60kV
Frequency ( f )1–20Hz
Disclaimer/Publisher’s Note: The statements, opinions and data contained in all publications are solely those of the individual author(s) and contributor(s) and not of MDPI and/or the editor(s). MDPI and/or the editor(s) disclaim responsibility for any injury to people or property resulting from any ideas, methods, instructions or products referred to in the content.