Article

Identification and Application of Carbonate Reservoir Based on Bayesian Model

1
Research Institute of Petroleum Exploration and Development, PetroChina Southwest Oil & Gas Field Company, Chengdu 610041, China
2
College of Energy, Chengdu University of Technology, Chengdu 610500, China
*
Author to whom correspondence should be addressed.
Processes 2026, 14(6), 955; https://doi.org/10.3390/pr14060955
Submission received: 29 December 2025 / Revised: 26 February 2026 / Accepted: 26 February 2026 / Published: 17 March 2026

Abstract

Aiming at the challenges in accurately identifying complex pore-space types, significant scale variations, and overlapping log responses in carbonate reservoirs, this study takes the Jurassic Da’anzhai Member in the central Sichuan Basin as the research object. By integrating core observations, cast thin sections, scanning electron microscopy, and well log data, the genetic types and log response characteristics of pore spaces at different scales are systematically analyzed. Building on this, a multivariate distribution identification model for pore-space scales is established based on Bayesian discriminant theory. To enhance the model’s identification accuracy, Z-score normalization is introduced to eliminate dimensional differences. Nonlinear combined features, such as the ratio of the compensated acoustic log (AC) to the gamma ray log (GR) and the logarithmic difference between deep and shallow resistivity logs (RT and RI), are constructed to achieve a multidimensional coupling representation of reservoir physical properties; a class-balancing augmentation method based on Gaussian perturbation is adopted to mitigate decision bias caused by sample imbalance. The results show that the improved Bayesian model achieves F1 scores exceeding 0.80 for large-, small-, and micro-scale pore spaces, with an overall identification accuracy of 84.38%, significantly outperforming the conventional crossplot method’s accuracy of 59.38%. Validation through experiments and well log data demonstrates that the model’s identification results are consistent with core and thin-section observations, indicating that this method can effectively identify large-, small-, and micro-scale pore spaces in strongly heterogeneous carbonate reservoirs. This study provides a valuable approach for reservoir log interpretation and favorable reservoir prediction.

1. Introduction

Carbonate reservoirs occupy an extremely important position in global oil and gas resources. They are widely distributed and of various types, constituting one of the most important oil-bearing rock series in the world. According to previous studies, the carbonate reservoirs in Iran, Saudi Arabia, Iraq, Russia, and Canada distributed in the Middle East are mainly marine carbonate rocks, while the carbonate reservoirs in the Congo rift basin, the Utah basin in the United States, the Campos basin in Brazil, and the Bohai Bay basin in China are typically represented by lacustrine carbonate rocks [1,2]. The carbonate reservoir reserves in the Congo Basin and Utah Basin are 4.76 × 10¹⁰ t and 6.46 × 10¹⁰ t, respectively [1,2], showing the importance of lacustrine carbonate rocks in global oil and gas exploration. The lacustrine carbonate rocks in China are widely developed in the Da’anzhai Formation of the Jurassic in the Sichuan Basin, the Chunhuazhen Formation of the Paleogene in the Bohai Bay Basin, the Lower Cretaceous in the Songliao Basin, and the Qianjiang Formation in the Jianghan Basin [3], in which the Da’anzhai Member of the Sichuan Basin is considered one of the most representative lacustrine tight complex heterogeneous carbonate reservoirs in China. Previous studies have shown that carbonate reservoir spaces are dominated by intercrystalline pores, solution pores, microfractures, and structural fractures [4,5,6,7,8,9,10]. The porosity is generally less than 10%, and the permeability is relatively low, belonging to a typical carbonate reservoir [9]. Fracture plays an extremely significant role in conductivity and reservoir enhancement in this reservoir [11] and plays a controlling role in oil and gas enrichment and productivity [12,13]. In complex, strongly heterogeneous carbonate rocks, pores and fractures together constitute a multi-scale reservoir space system, and their morphology and connectivity are controlled by diagenesis and tectonic stress [14,15,16,17]. However, this multi-scale reservoir spatial feature leads to complex logging response and obvious overlap, which limits the accuracy of traditional lithologic or pore type identification methods. For complex pore systems of carbonate reservoirs, scholars at home and abroad have adopted various identification and characterization methods [18]. Pore types and connectivity characteristics can be directly observed by means of coring, thin section and scanning electron microscope [19,20,21,22,23,24], but their sample representativeness is limited. Qualitative identification methods based on conventional logging, such as lithology-porosity crossplot, M-N crossplot [25], microresistivity imaging [26,27,28], and Cluster and Discriminant Analysis [29,30], although widely used in practice, still leaves great uncertainty in the identification effect of carbonate reservoirs with significant pore size difference and serious logging response superposition [31]. With the development of computers and intelligent algorithms, quantitative identification of log response characteristics in reservoir space gradually evolves towards automation and intelligence [32], such as self-organizing neural networks [33], BP neural networks [34], Fractal Geometric Constraint Modeling [35,36,37,38], and other methods that have achieved good results in the study of different types of reservoirs. However, these methods are still difficult to fully reflect the multi-dimensional characteristics of reservoir space for tight, complex, and highly heterogeneous carbonate reservoirs with complex pore and fracture structures and significant scale span. In recent years, the Bayesian discriminant model has been gradually introduced into the field of intelligent reservoir recognition because of its application in small-sample, multi-feature, and nonlinear problems [39,40]. The theoretical basis of the Bayesian model is to realize the optimal classification of multi-class samples through posterior probability maximization, which can describe and judge the reservoir space of different scales probabilistically. In addition, combining with the nonlinear combination relationship between logging data features, such as acoustic-gamma ratio (AC/GR) logarithmic difference in deep and shallow resistivity logs (RT and RI), a multi-dimensional coupling expression of reservoir physical property information can be realized so as to effectively distinguish reservoir spaces of different scales. Therefore, this paper systematically analyzes the logging response law of different scales of reservoir space, constructs the multi-distribution reservoir space scale recognition model based on Bayesian discrimination theory, and effectively improves the recognition accuracy of the model by introducing Z-score standardization, nonlinear feature combination, and Gaussian disturbance balance amplification methods. This study not only provides a new idea for pore-scale logging identification of tight carbonate reservoirs but also provides technical support for multi-scale characterization and favorable reservoir prediction of tight oil and gas reservoirs.

2. Reservoir Space Characteristics

2.1. Classification and Characteristics of Reservoir Spatial Scale

First, select carbonate reservoir core samples for analysis. The reservoir space is composed of various types of fractures, dissolution pores, holes, intergranular pores, intragranular pores, and intercrystalline pores of different scales, as well as nano-micron organic matter pores and matrix pores in mud shale. According to different scales of reservoir space, it can be divided into five types: macropores, mesopores, micropores, and nanopores; see Table 1. Large pores with diameters larger than 100 μm are mainly formed by late strong dissolution and local weak densification, and the pore types are mainly mold pores, solution pores between coarse grains and residual pores between coarse grains, with few pores; The pore size is about 40–10 μm, which is mainly formed by weak dissolution and moderate densification in late stage, and the main types of pores are fine-grained intergranular dissolution pores, fine-grained intragranular dissolution pores, fine-grained residual intergranular pores, and the number of pores is large. The pore size is 10–1 μm, which is mainly formed by weak dissolution and strong densification in the late-stage matrix, and the pore types mainly include residual intergranular pores and matrix dissolution pores in powder grade. Nanometer pores are pores with a pore diameter less than 1 μm, mainly intercrystalline pores and intracrystalline pores, and the number of pores is relatively large.
To facilitate the log evaluation of reservoir space at different scales and to reduce the mismatch between logging response scales and the fine pore classification from core samples, this paper further reclassifies the pores at different scales while keeping the original genetic classification of core pores unchanged. The large pores (pore diameter >100 μm) and medium pores (100–40 μm) from the original pore classification are merged into “large-scale pores”. This category is dominated by dissolution pores and intergranular residual pores and contributes significantly to permeability. The small pores (40–10 μm) are separately classified as “small-scale pores”. This type of pore is relatively abundant in the study area and has an important influence on the effective porosity of the reservoir. The micropores (10–1 μm) and nanopores (<1 μm) are combined into “micro-scale pores”. This category mainly includes matrix dissolution pores, intercrystalline pores, and intracrystalline pores, which exhibit similar logging response characteristics.
Therefore, in the Bayesian model used in this paper, large-scale pores, small-scale pores, and micro-scale pores are adopted. as shown in Table 2. Macropores are mainly visible pores in the core, formed by late strong dissolution, and pores are mainly mold pores, shadow pores, intragranular solution pores, and intergranular solution pores. The small-scale reservoir space is mainly solution pore, including intra-shell dissolution pore, intergranular pore, and intercrystalline dissolution pore, which is mainly caused by late weak dissolution.
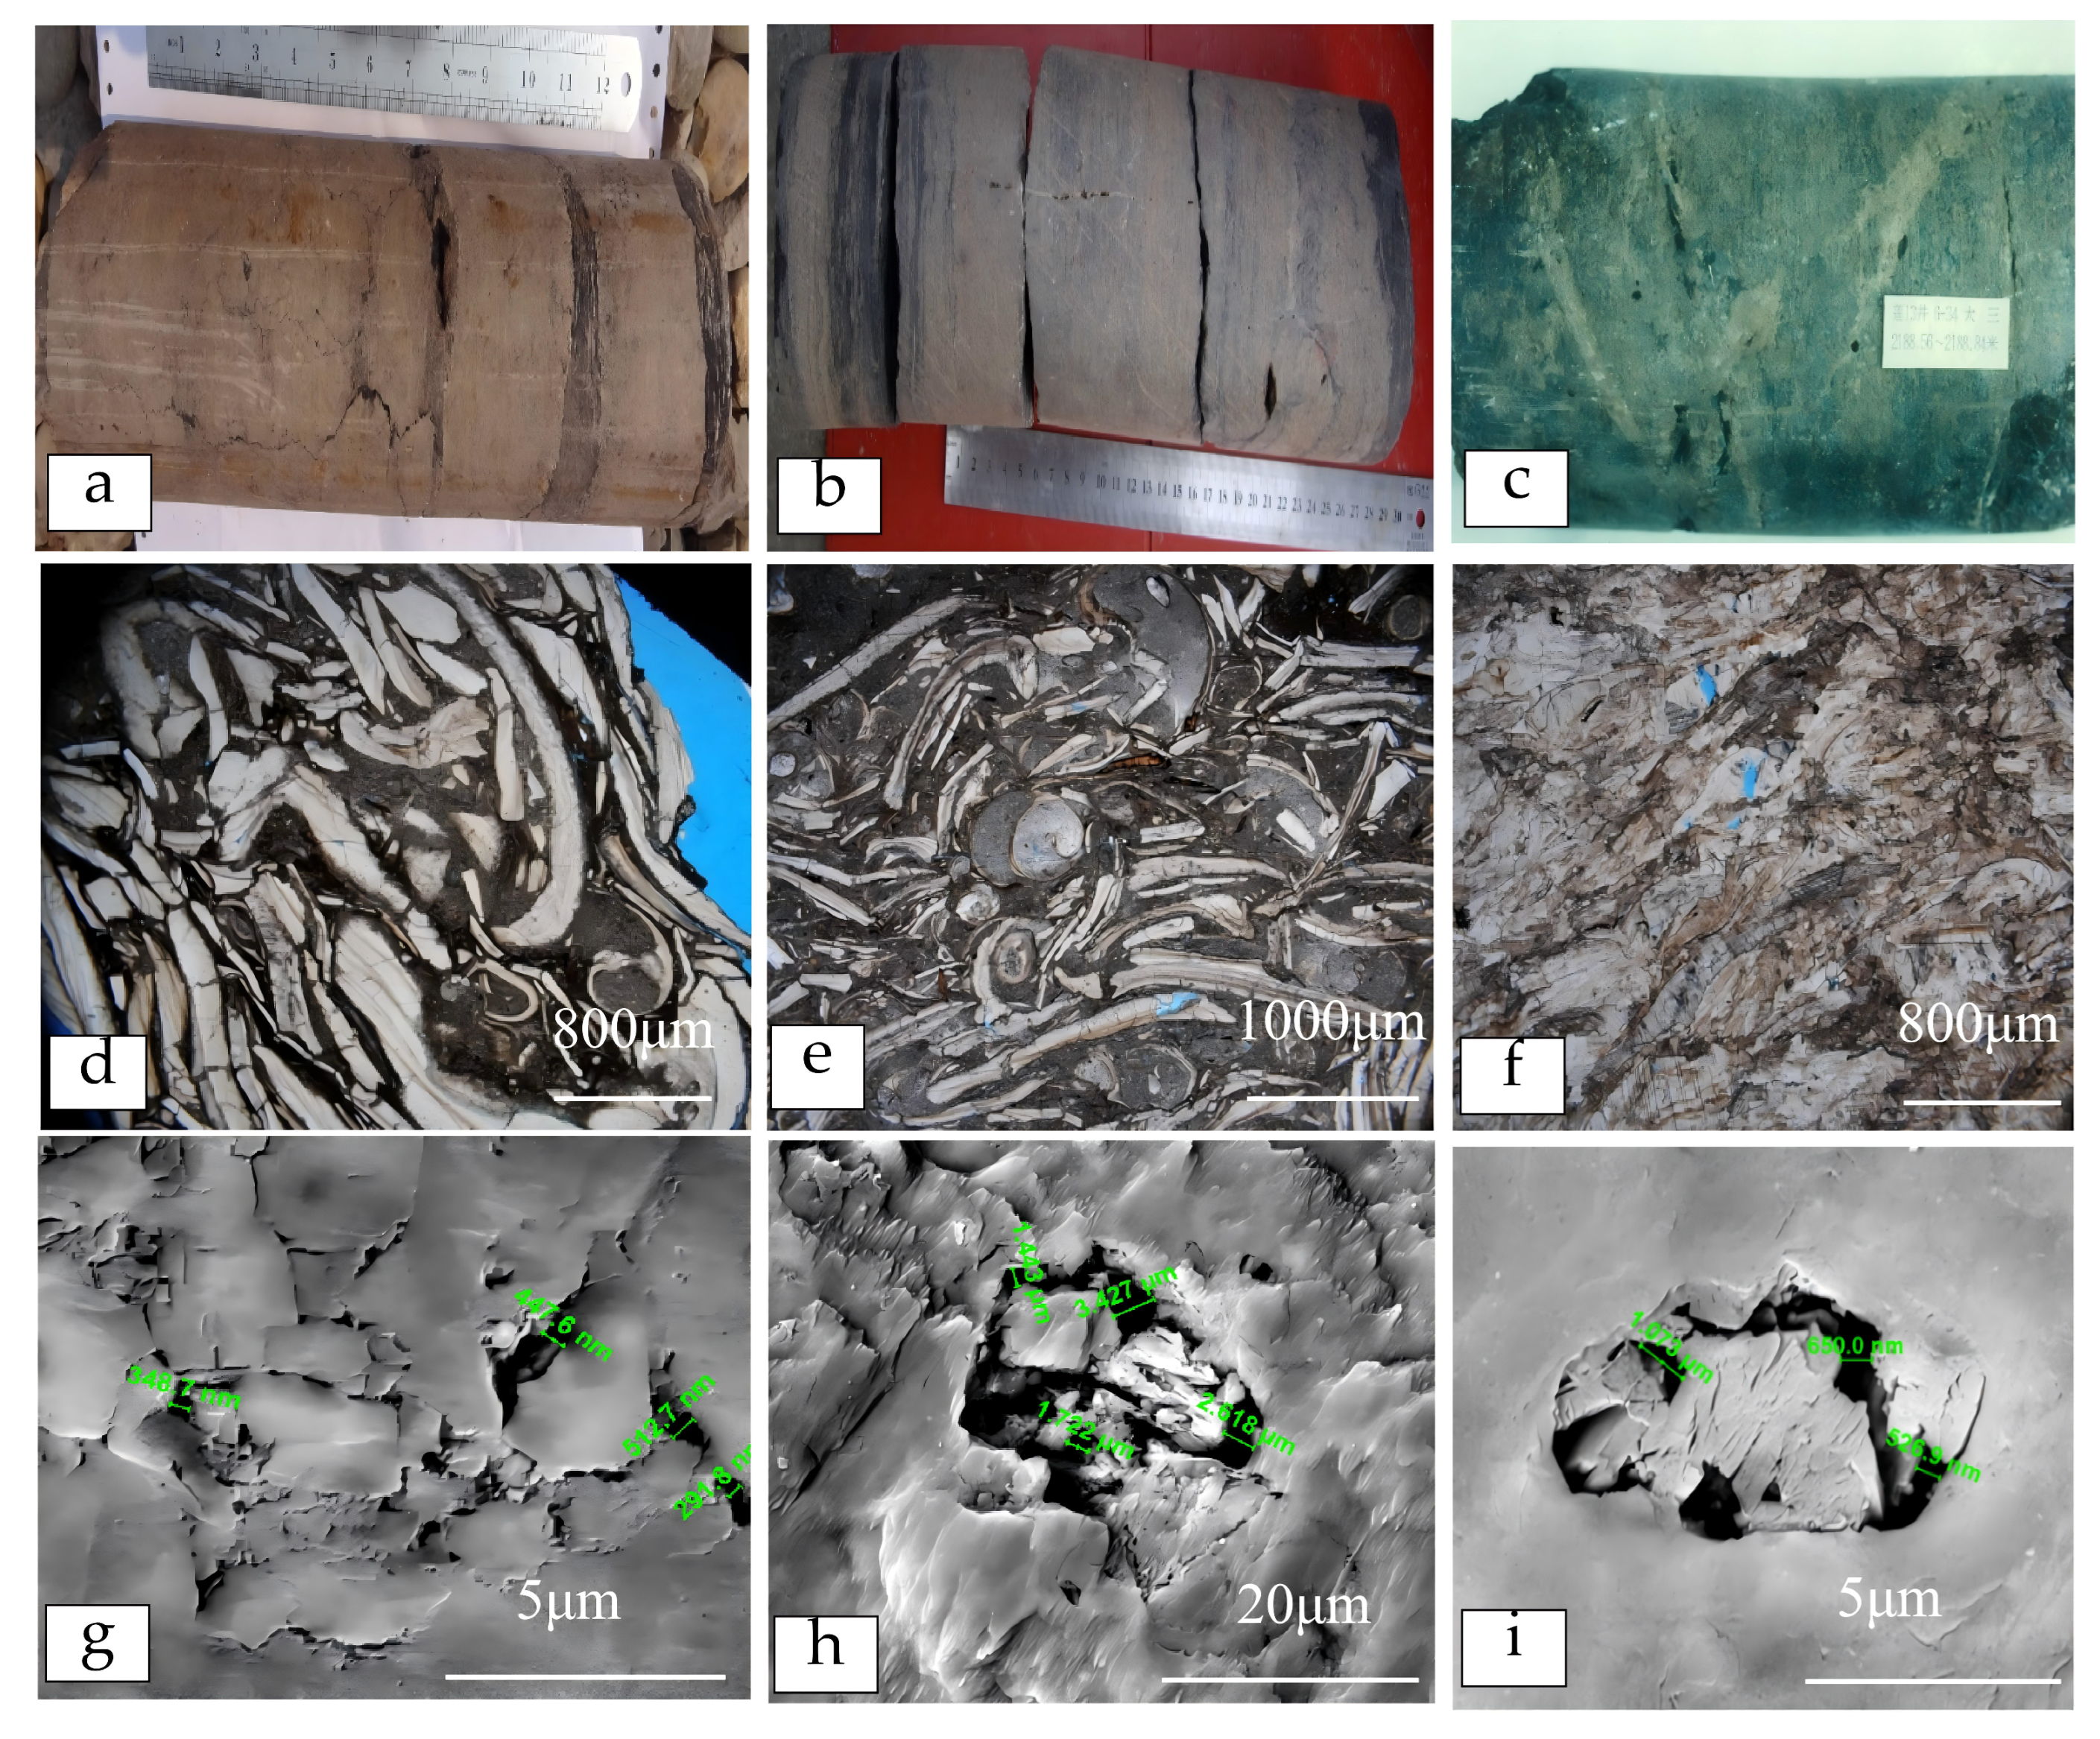
Large-scale pores generally have diameters at the millimeter level and are primarily formed by later intense dissolution processes. They mainly consist of millimeter-scale and larger pores, such as dissolution pores, intergranular dissolution pores, intragranular dissolution pores, moldic pores, and shelter pores. These pores are numerous and are mainly formed by later weak dissolution (Figure 1a–d).
Small-scale pores are intergranular dissolution pores and intragranular dissolution pores visible under thin section, primarily developed in argillaceous bioclastic limestone, micritic-sparitic bioclastic limestone, and argillaceous bioclastic limestone. They appear irregular in shape, with relatively large pore diameters, and are mostly micropores formed by dissolution along bioclast margins. Their development degree is moderate, and they are mostly formed by dissolution after diagenesis (Figure 1e,f).
The main particles in small-scale pores are silt-sized crystals and micrite, belonging to pores visible under thin section and scanning electron microscope. They are dominated by intercrystalline micropores, dissolution micropores, and matrix micropores formed by later weak dissolution of the matrix. These pores are irregular in shape, occur in relatively large numbers, and have pore sizes ranging from micrometers to nanometers (Figure 1g–i).

2.2. Response Characteristics of Pore Logs with Different Scales

2.2.1. Large-Scale Pore Characteristics

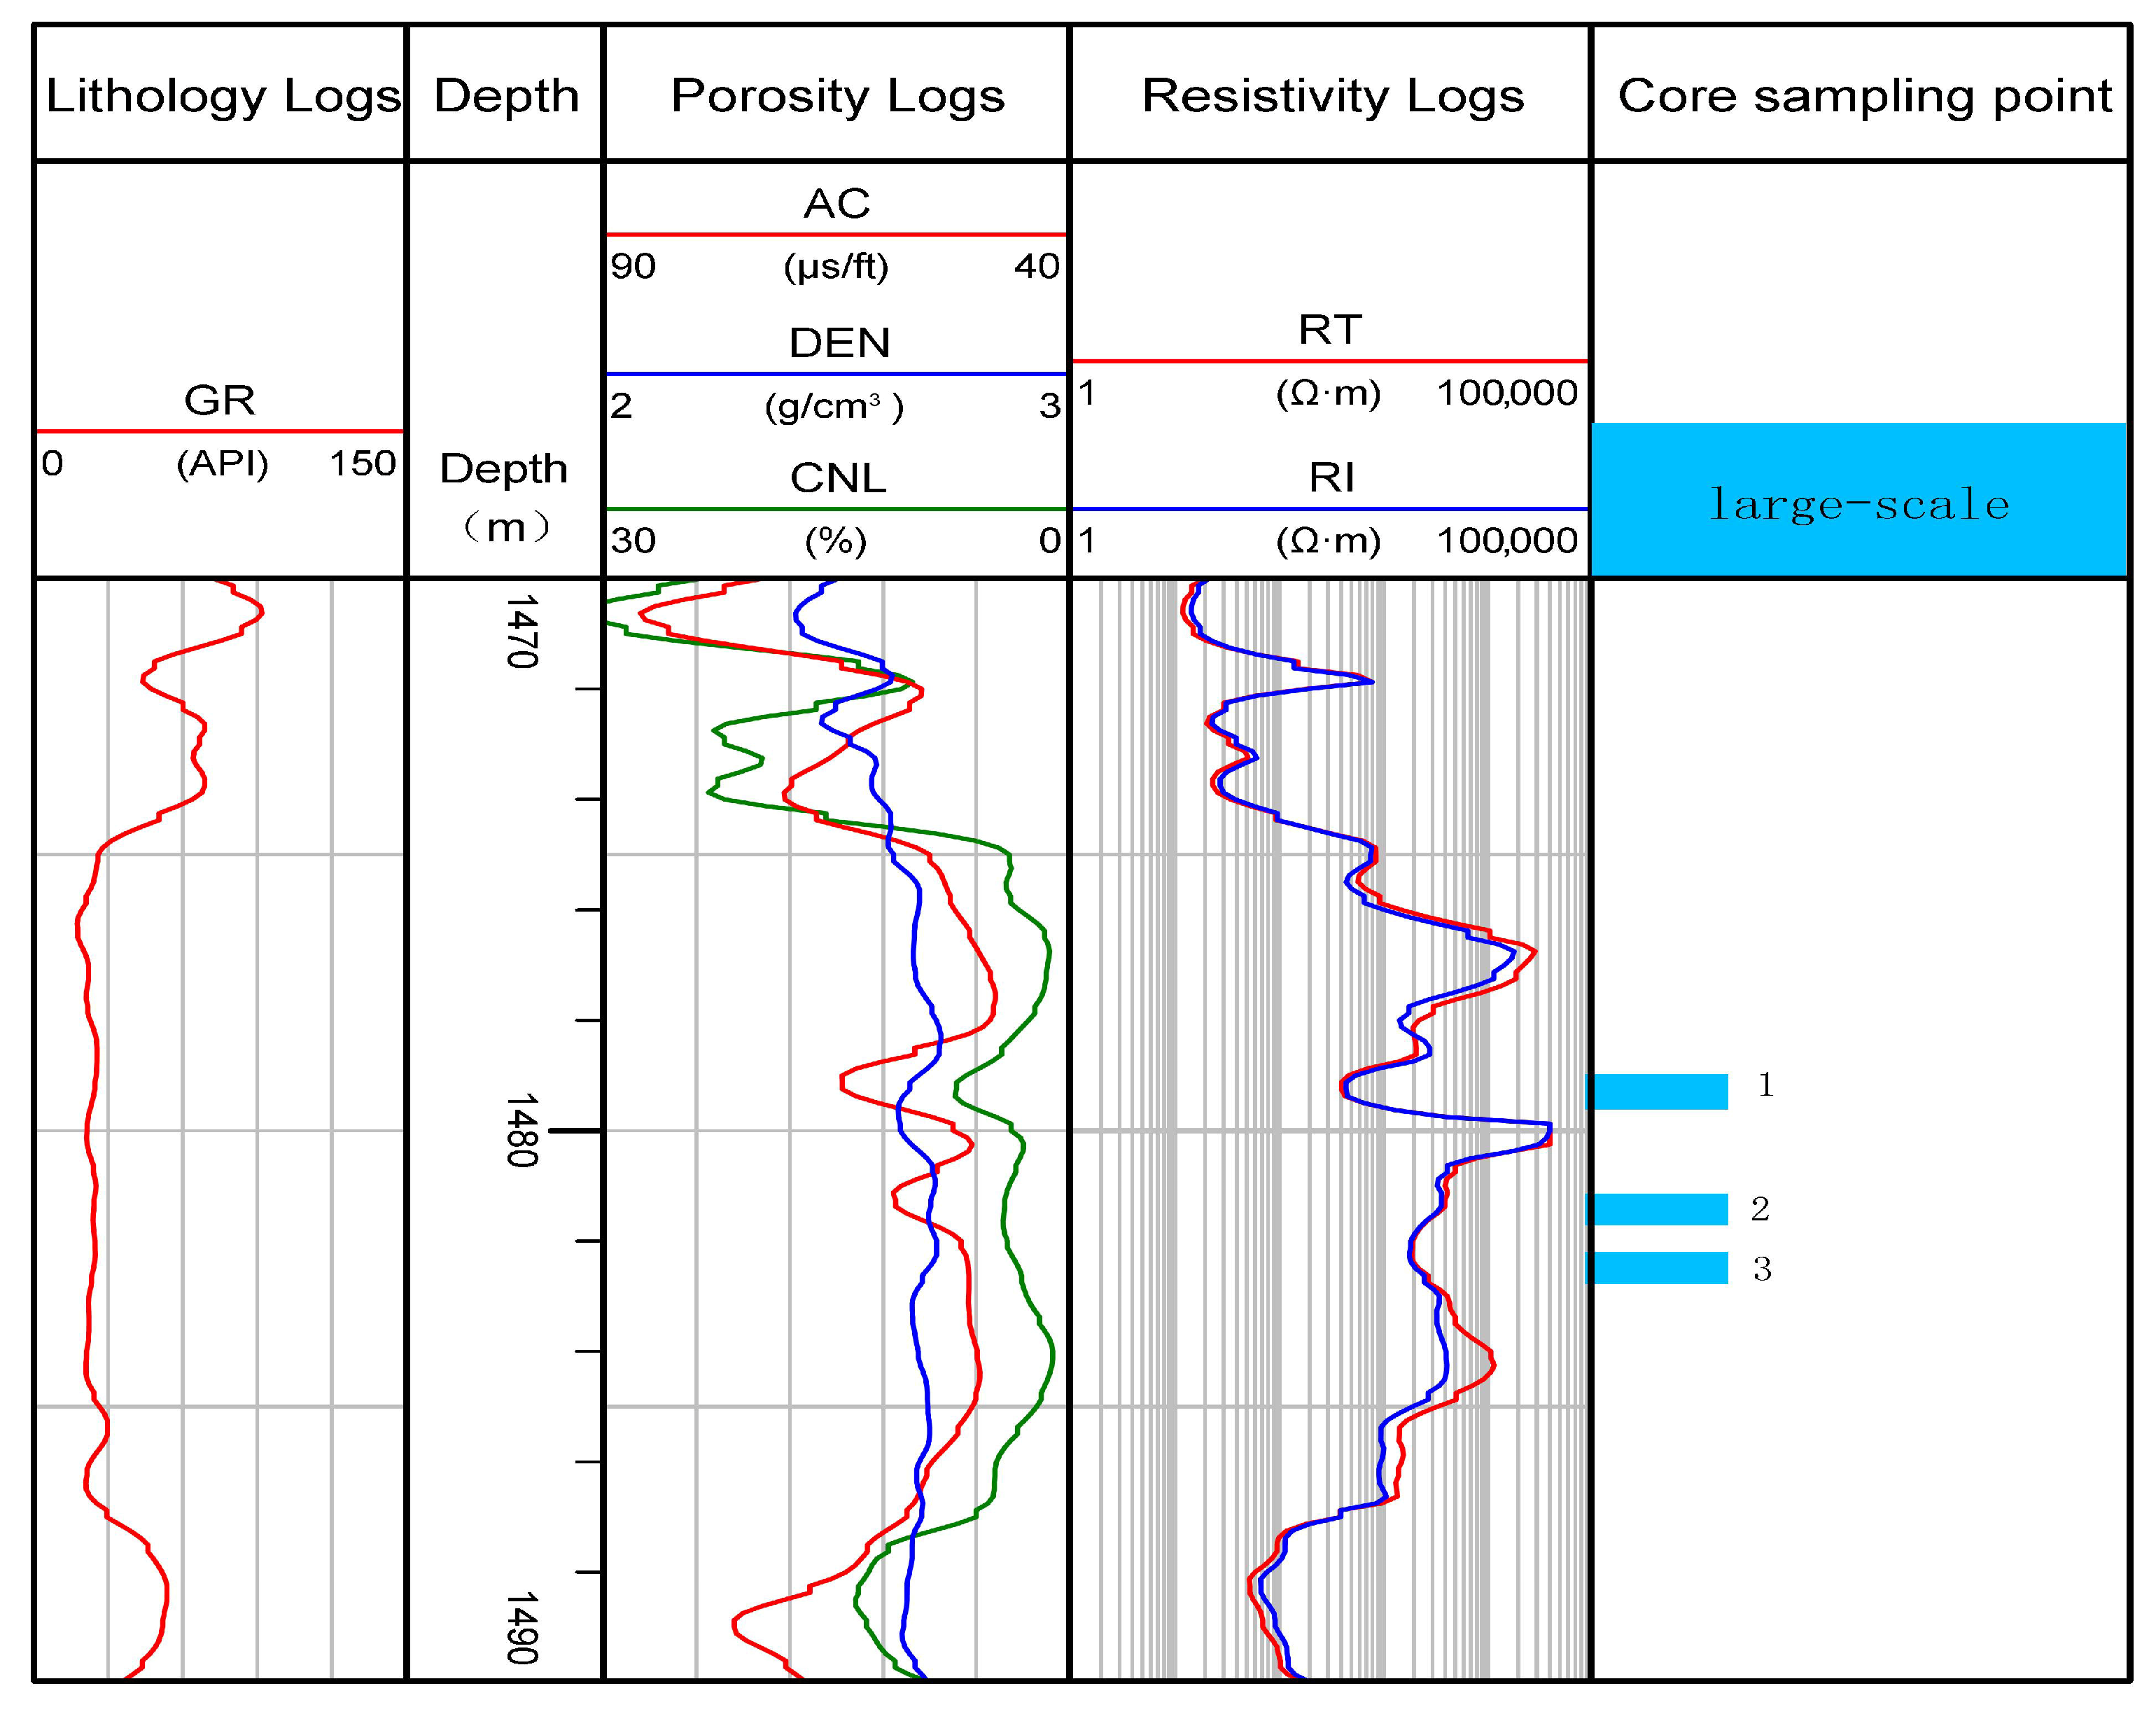
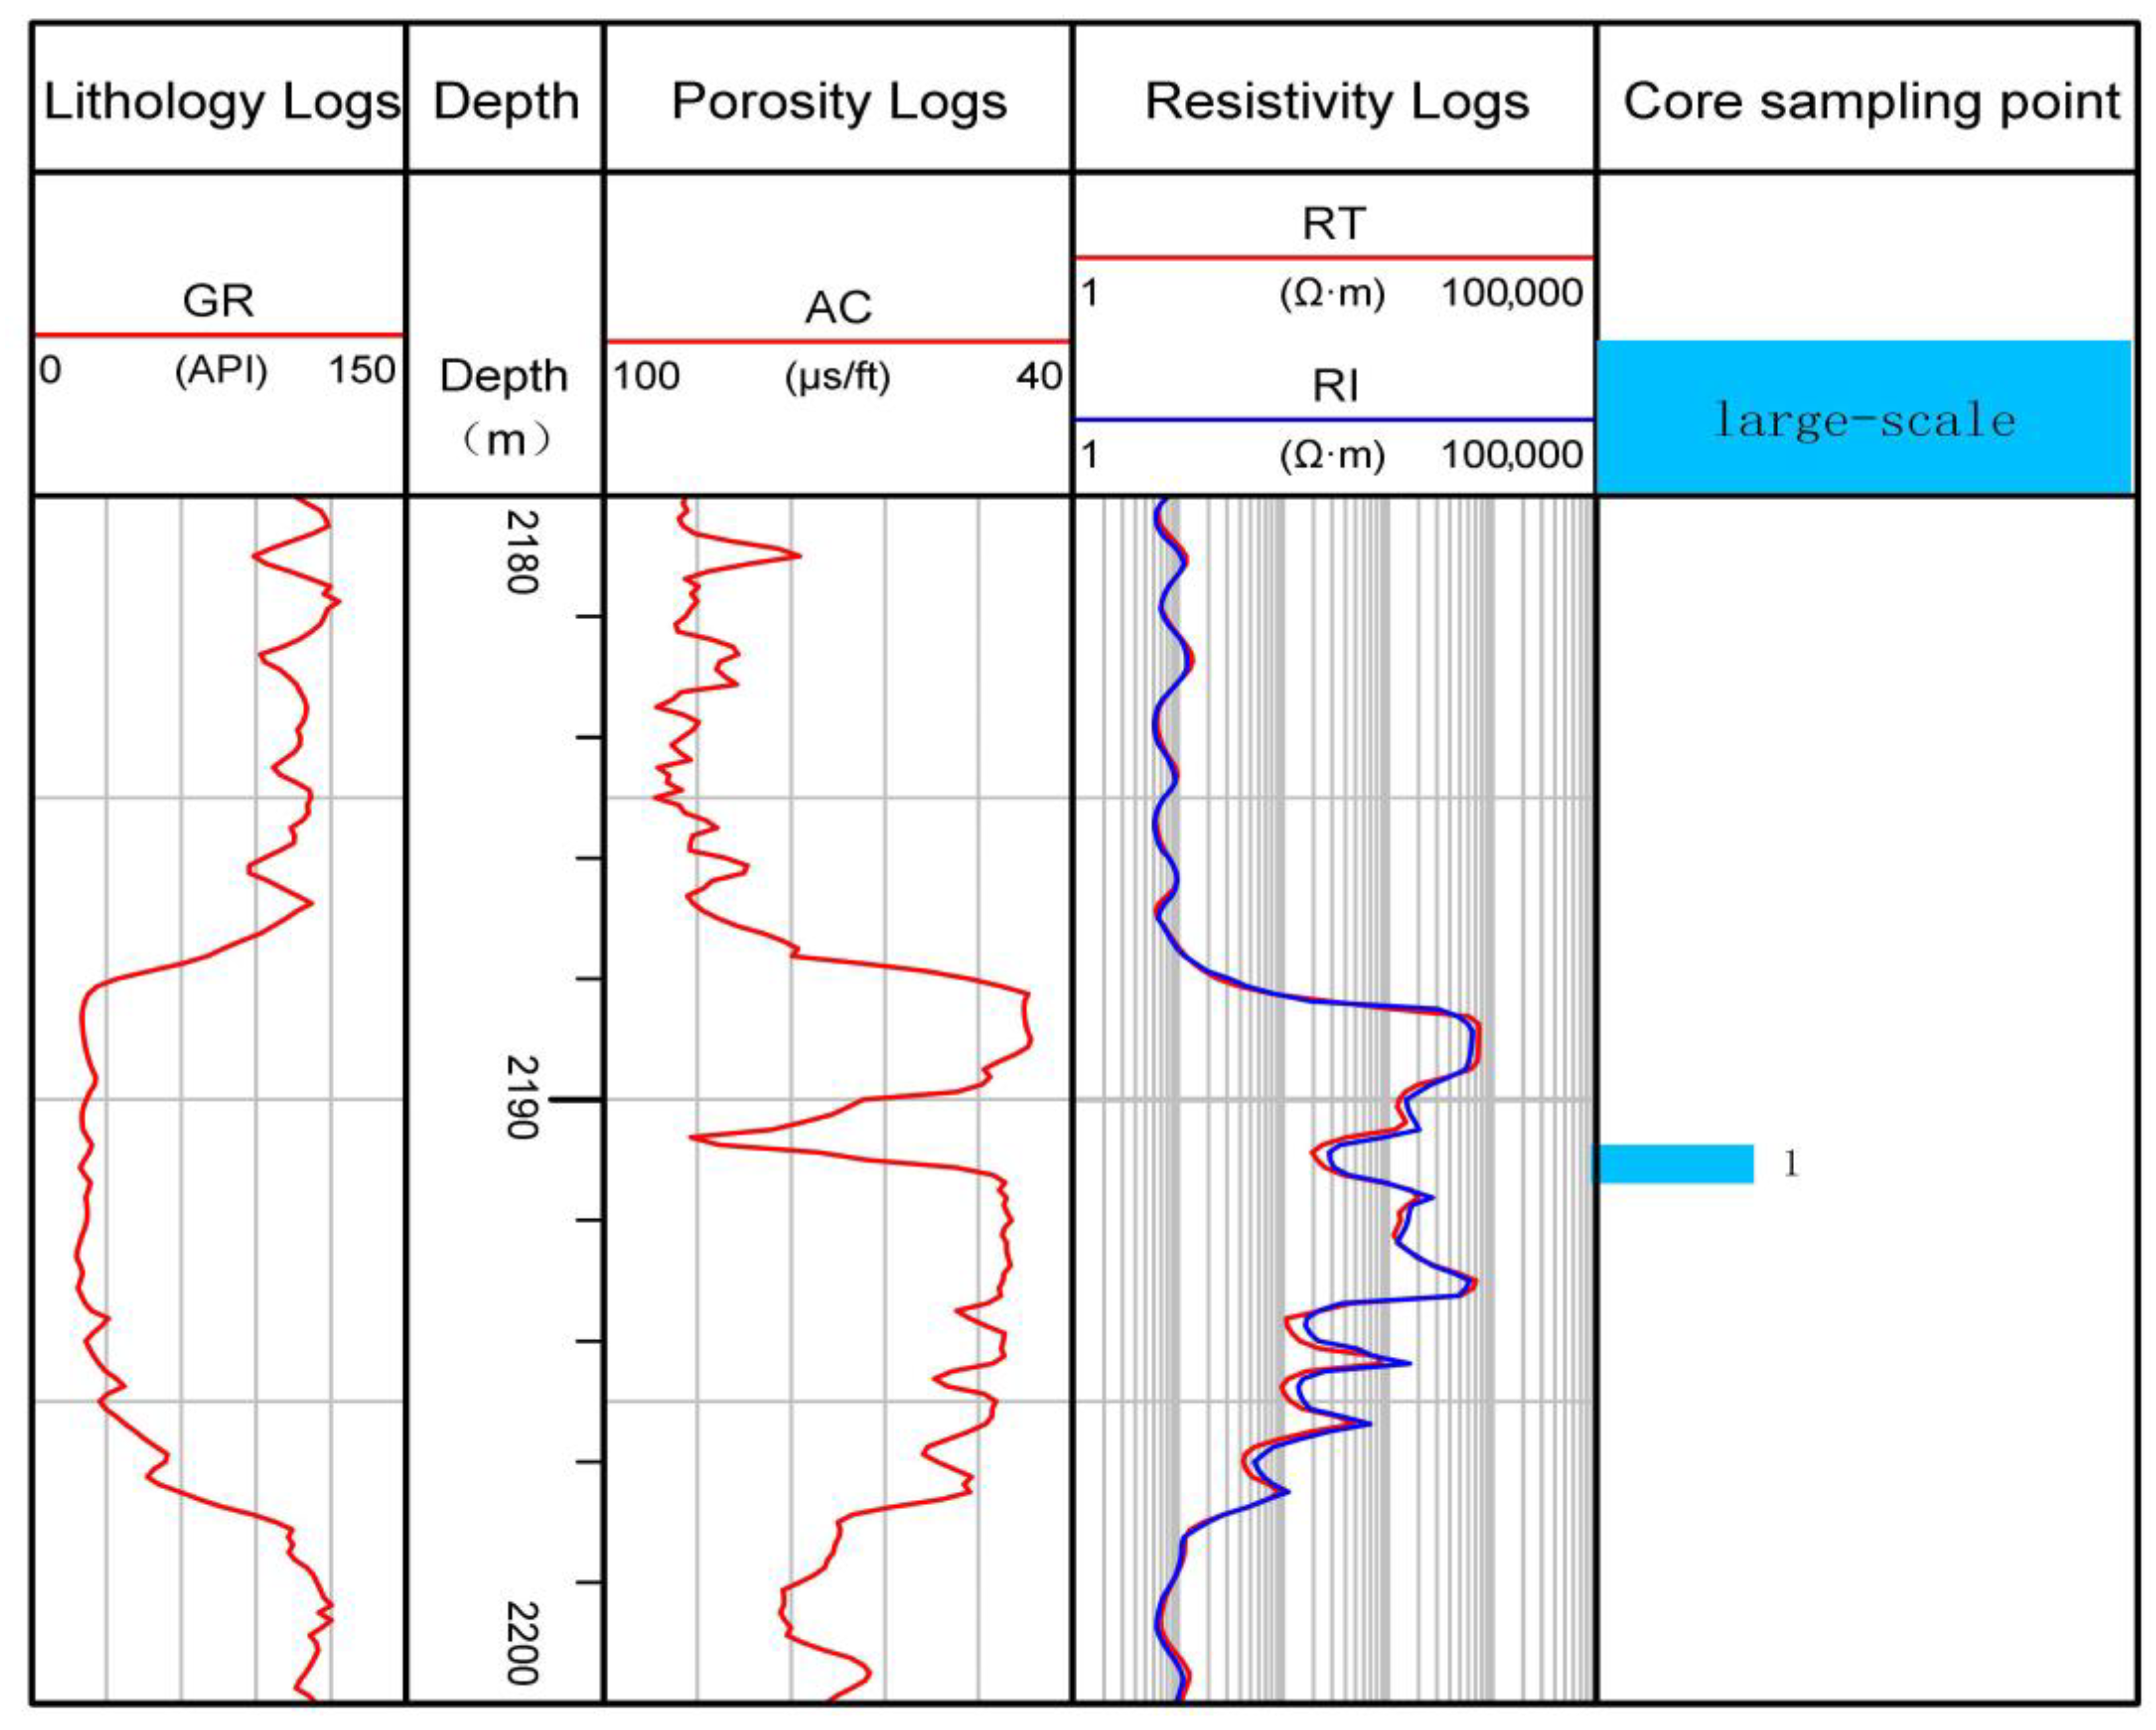
According to the characteristics of large-scale pores, they can be divided into two types: single-pore and fracture type. The logging response characteristics of these two types are different, but overall, large-scale pores are characterized by a low gamma ray log (GR) value, a middle and high tooth-shaped compensated acoustic log (AC) value, and a dentate negative deep resistivity log (RT) decrease. Logging is affected by fractures and the degree of development. The logging response characteristics of a single pore are characterized by dentate RT decrease, tooth-shaped AC value increase, and characteristics of middle and low GR, high AC, and middle and high RT (as shown in Figure 2). Fracture-vuggy large-scale pores have the following characteristics: Due to the development of reservoir fractures and vugs, pores are well developed, connectivity is good, and the conductivity path connectivity is high. Logging response characteristics are characterized by finger-like RT; AC value increases in tooth shape, and the AC value can reach more than 60 μs/ft. Logging response characteristics are shown in Figure 3.
For large-scale pores, the more holes that are developed, the better the conductivity of the rock is, the lower the RT is, and the AC increases with the increase in hole development degree. Therefore, the logging response characteristics change with the degree of pore development; when pore development is poor, heterogeneity increases, and the fracture and cavity logging response is obvious, RT gradually changes from dentate middle and high negative anomaly (3000 Ω∙m) to finger high value (6000 Ω∙m), and AC changes from dentate positive anomaly middle and low value (>50 μs/ft) to smooth box low value (48 μs/ft).

2.2.2. Small-Scale Pore

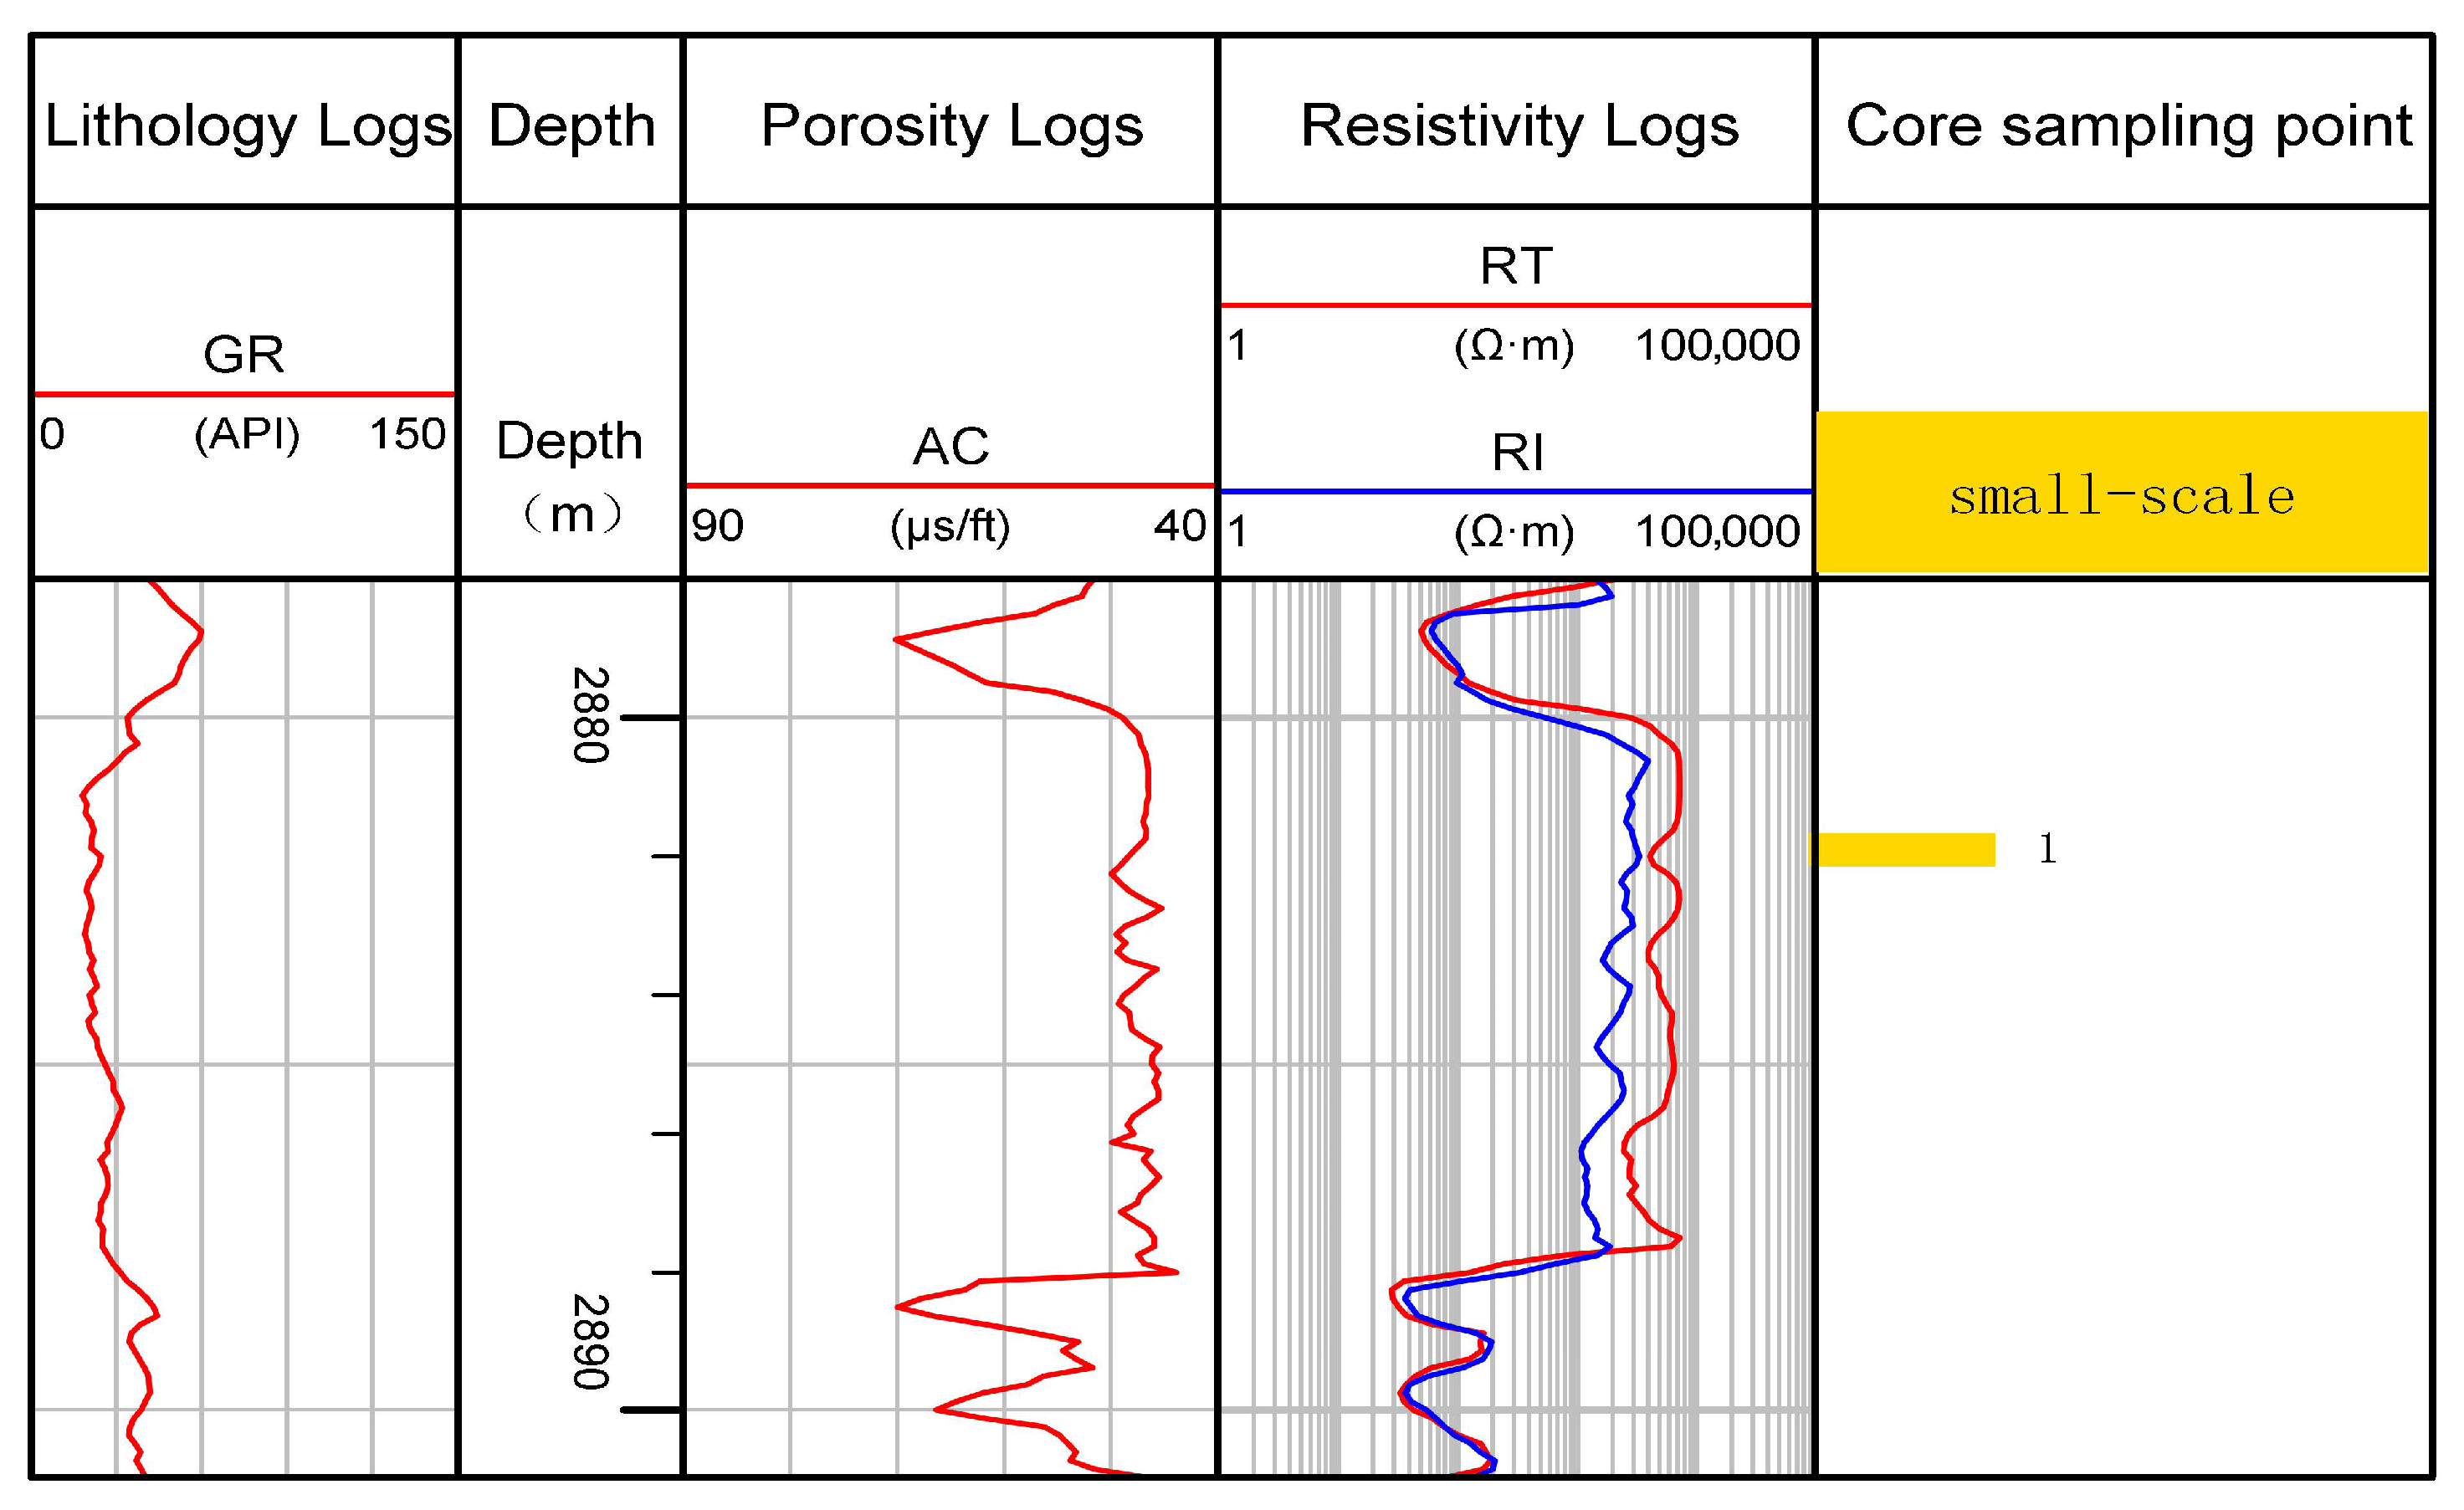
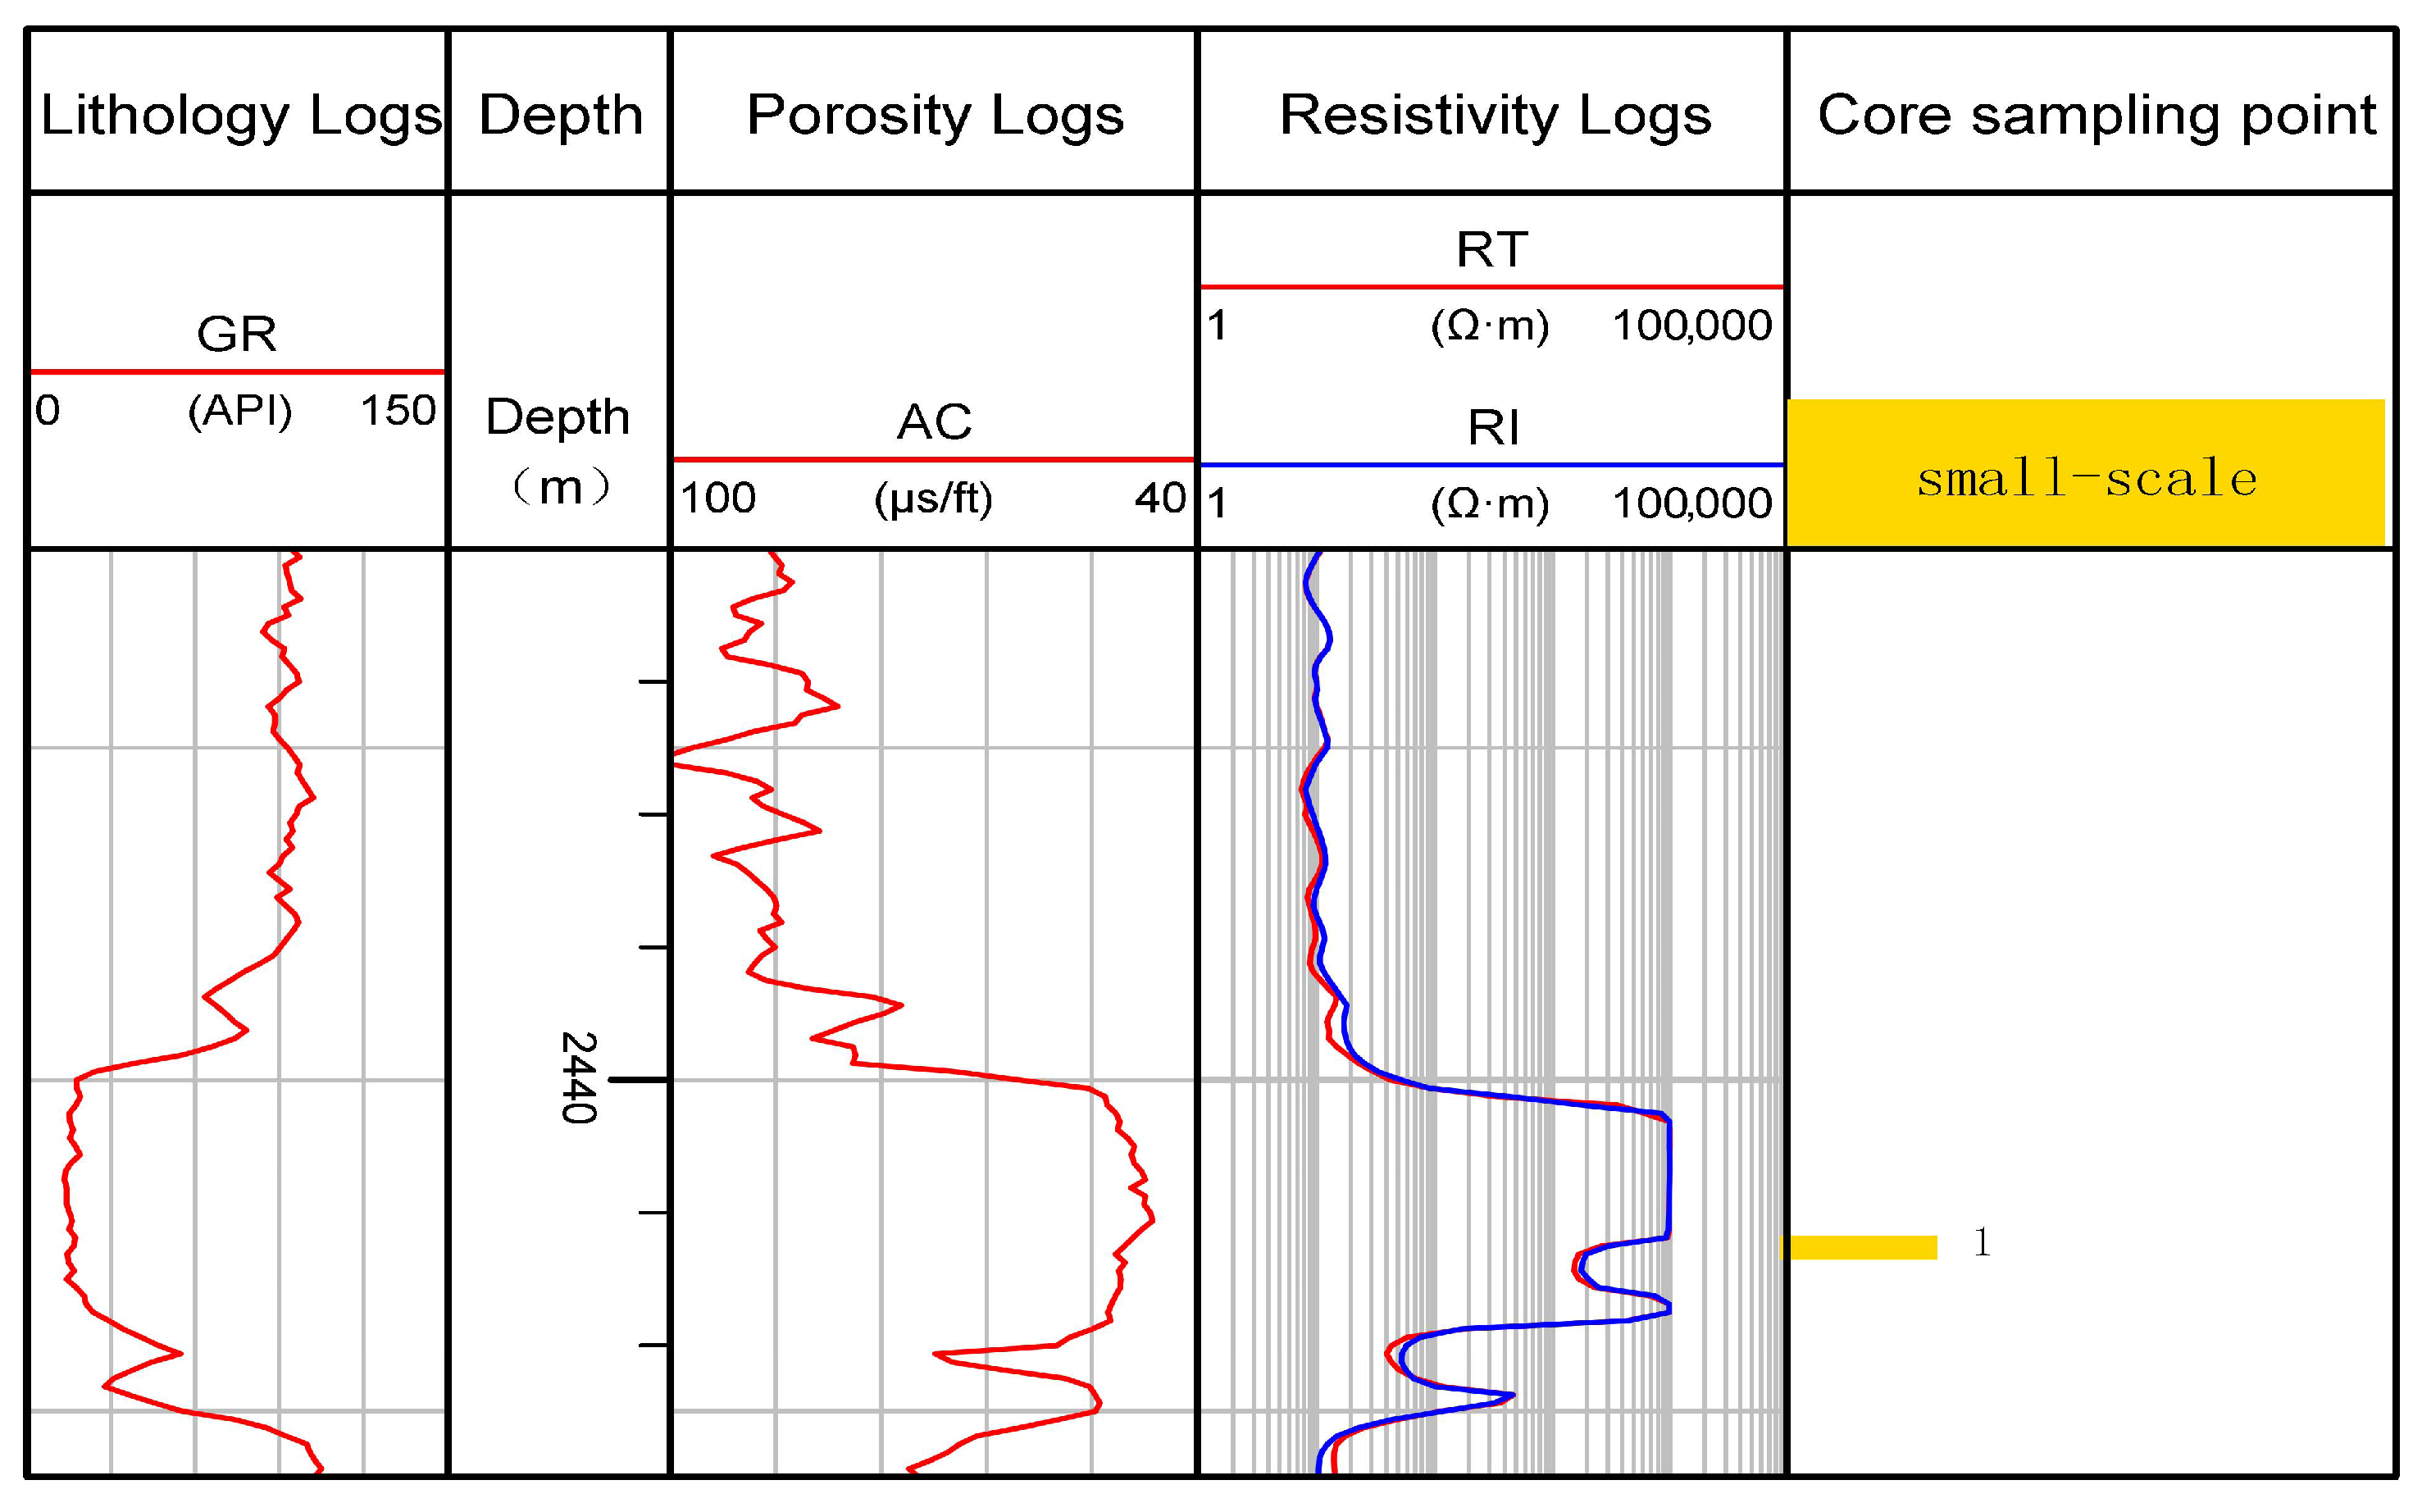
According to the distribution characteristics of small-scale pores, they can be divided into two types: single-pore type and pore-fracture type, which show different logging characteristics, but the RT of small-scale pores is generally high. After mud filling, the RT value will decrease, AC will increase, and the GR at the corresponding point will increase slightly, as shown in Figure 4. The response characteristics of pore-and-fracture type small-scale pore logging show that RT decreases to 1000 Ω∙m–3000 Ω∙m when fractures are developed, and RT can form a “platform notch type”. AC value increases in burr shape, as shown in Figure 5.

2.2.3. Micro-Scale Pore

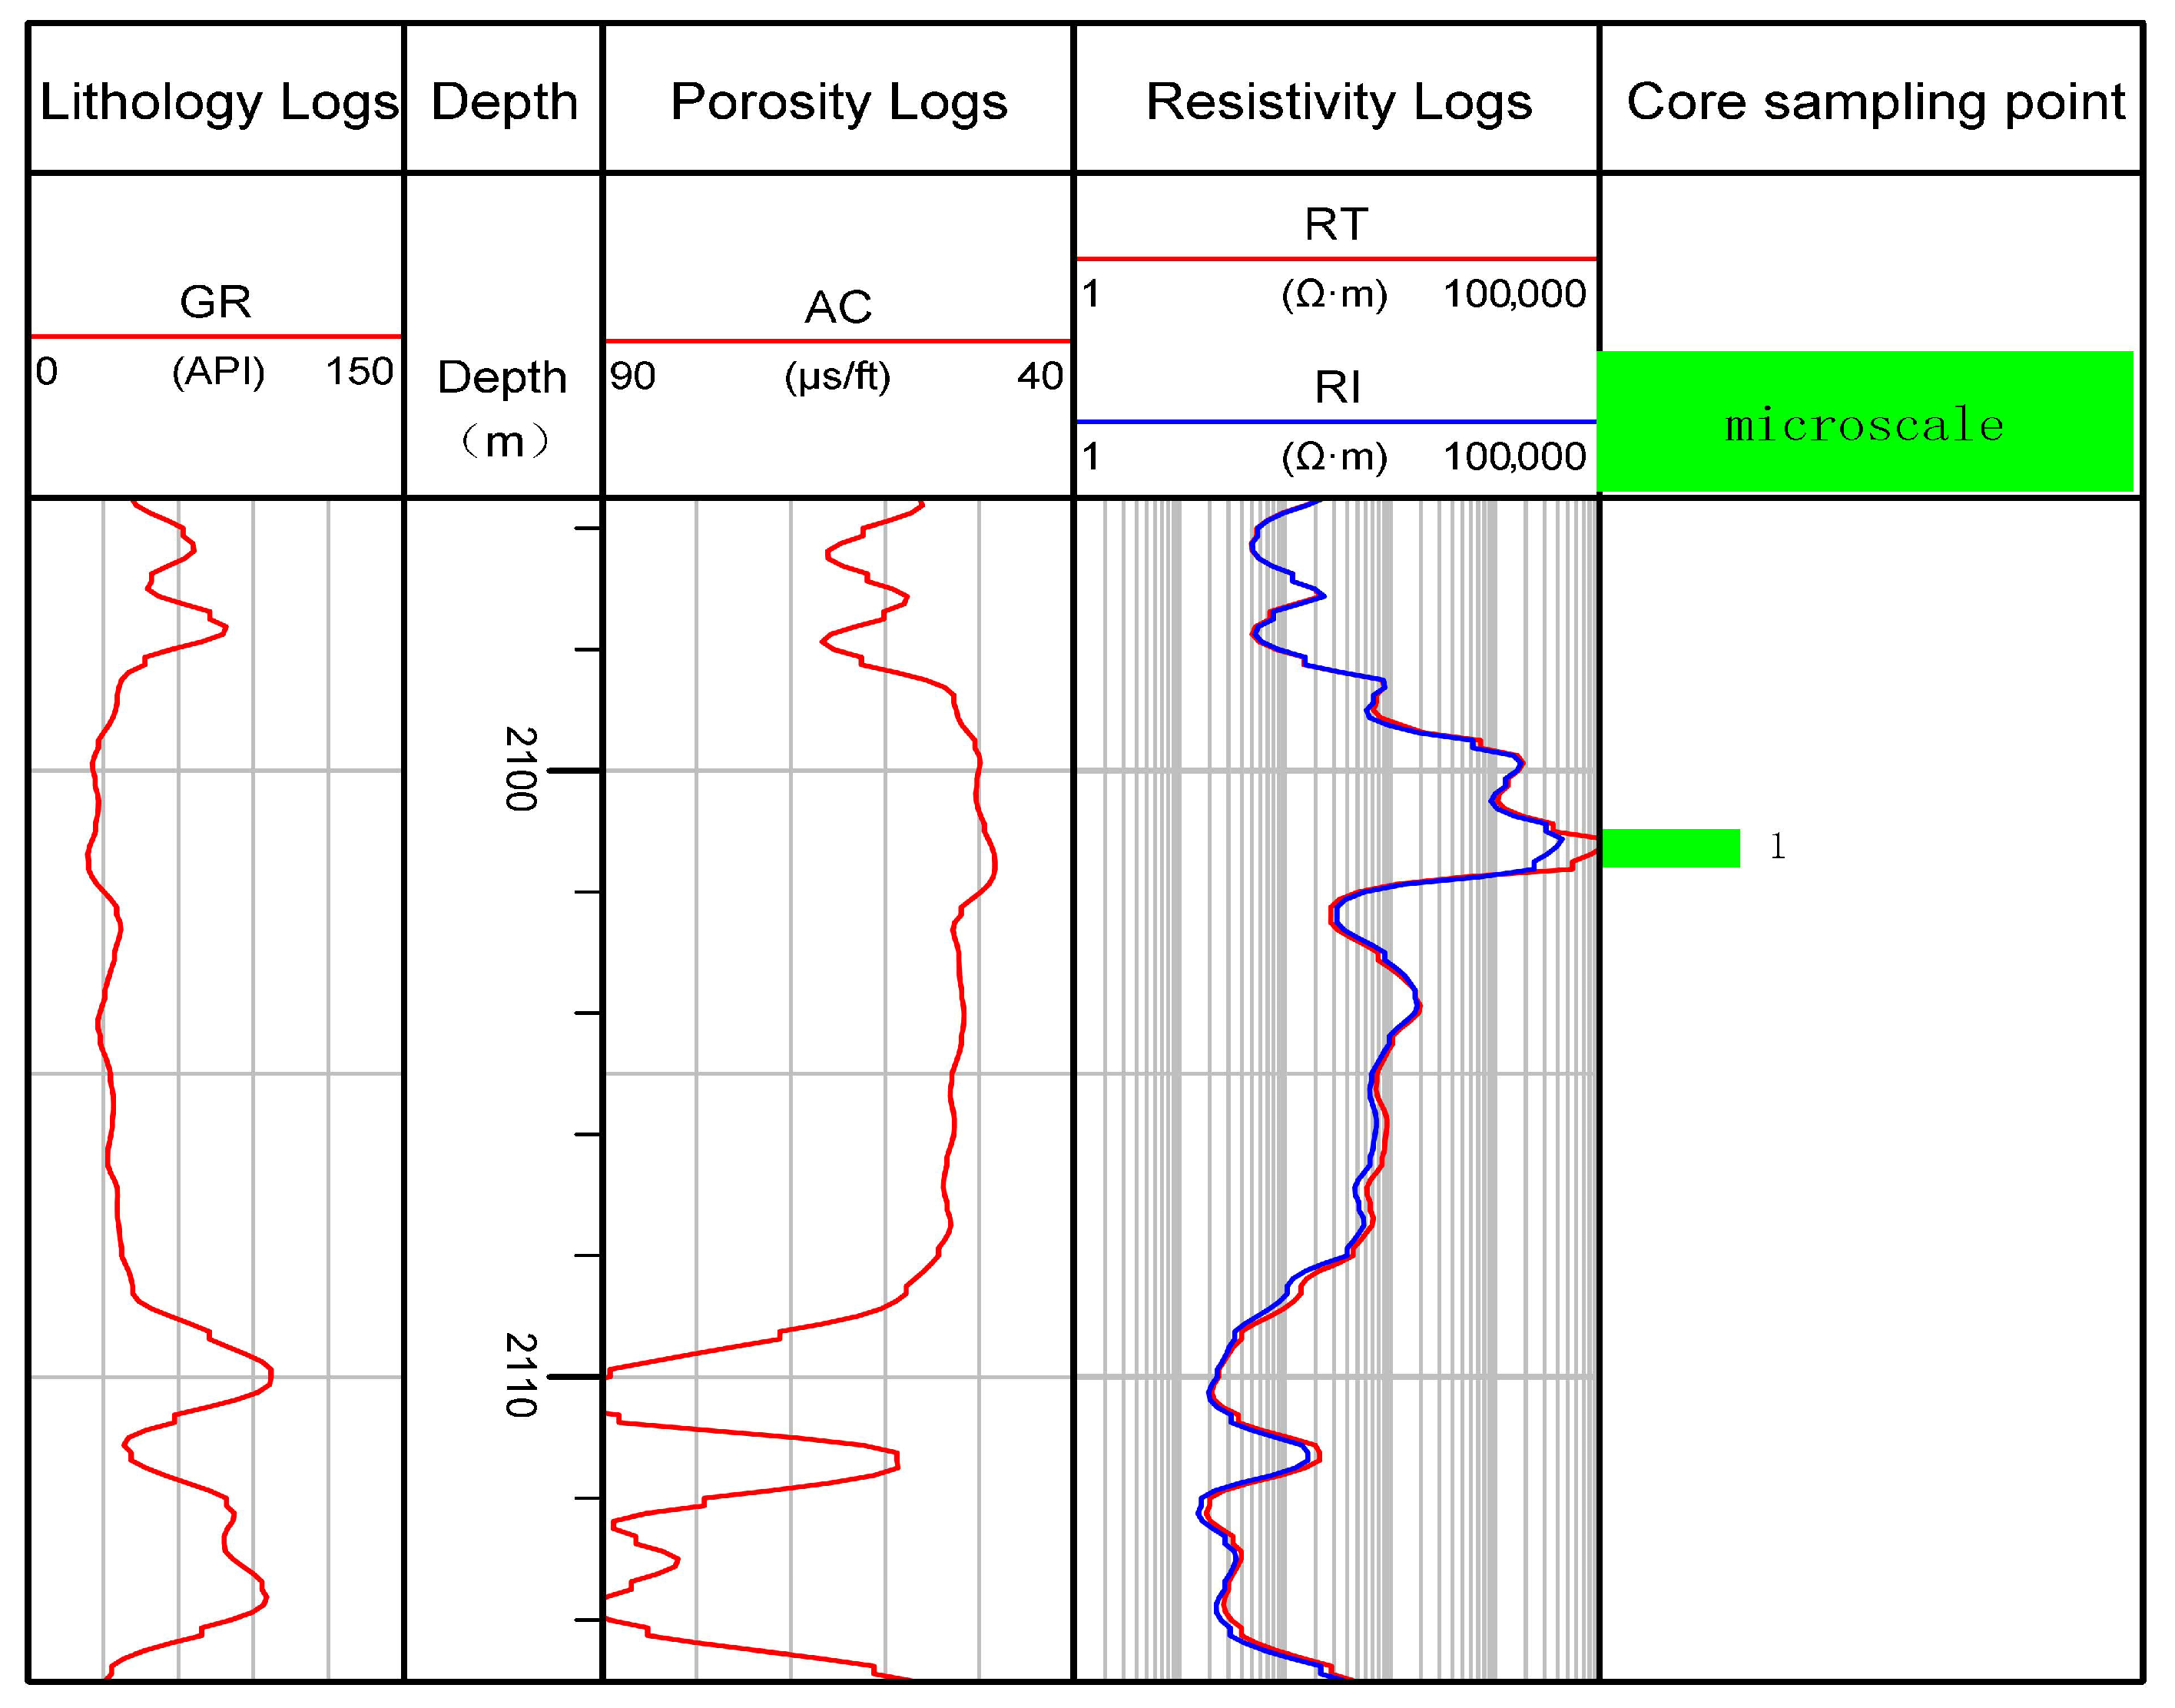
According to the distribution and development characteristics of micro-scale pores, they are mainly a small-scale pore-fracture composite type. Such pores are mainly matrix intercrystalline micropores, intergranular micropores, and associated microfractures. Microfractures are generally distributed along bedding, grain, or grain boundaries, with strong directivity and connectivity, and are important seepage channels in carbonate tight reservoirs. In terms of logging response (Figure 6), micro-scale pores usually show bedrock response characteristics. GR values are generally lower (less than 40 API), curves are smooth box type, and mud content is low. Due to the existence of microfractures, amplitude differences often occur between RT and RI, and RT is obviously higher than those of the other pore scale types. RT is often greater than 10,000 Ω·m, reflecting the characteristics of poor pore connectivity and low fluid saturation. AC is generally less than 50 μs/ft, the curve is smooth, and the amplitude change is small, indicating that the rock matrix is dense, showing local conduction path difference and weak anisotropy.

3. Reservoir Spatial Scale Identification

3.1. Bayesian Method Principle

According to the analysis of reservoir spatial characteristics, reservoir spatial scales can be divided into three types: large-scale pores, small-scale pores, and micro-scale pores, and the parent sets are X1, X2, X3……Xn; L parent has NL index, and all kinds of samples are independent normal distribution random vectors, so XL obeys the mean vector μL. Because some wells lack compensated neutron log (CNL) and compensated density log (DEN), GR, AC, RT, and shallow resistivity log (RI) are selected to construct multivariate normal distribution XLN (μL, ∑L) with covariance matrix ∑L.
P ( B | A ) = P ( A | B ) × P ( B ) P ( A )
From Equation (1), the posterior probability P of the L-th class sample is obtained, where it represents the conditional probability density function of class L given class X.
P ( L | X ) = q L × F L L = 1 L q L × F L
The probability density function FL is given by the following expression. Here, P is the feature dimension, μL is the mean vector of class L samples, X L is the curve vector of the L-th class sample, ΣL is the covariance matrix of the L-th class samples, and ∣ΣL∣ is the determinant of the covariance matrix.
F L = | Σ | 1 / 2 2 π e x p   [ 1 2 ( X L μ L ) T Σ 1 ( X L μ L ) ]
According to the probability density function, the lithologic curve vector XL is
X L = G R A C R T R I
Secondly, the mean phasor of each curve of the sample is obtained as μL.
μ L = G R ¯ A C ¯ R T ¯ R I ¯
The covariance matrix is obtained according to different lithologic samples, and the probability density function can be obtained by substituting the covariance matrix into Equation (3).
= 1 m 1 i = 1 m   ( G R i 1 G R ¯ ) 2 i = 1 m   ( G R i 1 G R ) × ( A C i 1 A C ¯ ) i = 1 m   ( A C i 1 A C ¯ ) × ( G R i 1 G R ) i = 1 m   ( A C i 1 A C ¯ ) 2 . . . i = 1 m   ( R I i 1 R I ) 2
In the formula:
q: prior probability;
P: posterior probability;
∑: covariance matrix;
X: construct vectors for curve data;
μ: mean phasor for each curve of the sample;
m: number of samples.
Substituting Equation (3) into Equation (2) shows that when the posterior probability P(L|X) of the L-type reservoir space is maximized, it corresponds to the L-type reservoir space; at the same time, when P(L|X) is maximized, qL × FL is also maximized. Therefore, it is only necessary to know the prior probability q of each type of reservoir space and the probability density function of the seven lithologies for the same data point to determine the reservoir space. Hence, before obtaining the probability density function, it is necessary to derive the curve vector X, the sample curve mean vector μ, and the covariance matrix ∑ from well logging data.

3.2. Method Improvement

A Bayes classifier is a probabilistic classification method based on Bayes’ theorem and the independent assumption of feature conditions. The traditional Bayes method has the advantages of simple calculation and fast speed, but the reservoir spatial scale discrimination has nonlinear characteristics and strong coupling problems, such as being easy to ignore the characteristics of log data, excessive idealization of sample distribution, and easy migration of classification boundaries to large sample categories.

3.2.1. Normalization Processing

In order to ensure the objectivity of model prediction and prevent the probability deviation caused by the difference in dimension and numerical range of logging parameters, Z-score standardization is introduced to preprocess logging data, which unifies all characteristics to the same scale with standard deviation as the unit before model fitting, thus effectively eliminating the interference caused by scale difference. This not only avoids the deviation of model discrimination results to large sample categories but also makes the model stable under multidimensional logging parameters, where Z is the normalized logging parameter, X is the logging value, μ is the average logging parameter, and σ is the standard deviation of the logging parameter.
Z = X μ σ

3.2.2. Feature-Enhanced Nonlinear Combination

In order to avoid this problem, the idea of feature enhancement and nonlinear combination is introduced to construct new reservoir spatial scale features according to the petrophysical model and logging interpretation principles. For example, the log difference between RT and RI can effectively indicate formation fluid properties and invasion characteristics; comparing AC with GR can reflect pore development; a combination of nonlinear methods, essentially a nonlinear mapping of original logging data, can fuse multiple single logging data into a comprehensive index. The combination feature is used as one of the sample analysis parameters so that the model is superimposed from a single linear variable to a nonlinear variable, thereby improving the identification accuracy of the reservoir space scale without increasing the complexity of the model. In the equations below, M is the ratio of AC to GR, Rratio is the ratio of the logarithms of RT and RI, and Rdiff is the difference between the logarithms of RT and RI.
M = A C G R
R ratio = log 10 R T log 10 R I
R diff = l o g 10 R T l o g 10 R I

3.2.3. Sample Class Equilibrium Amplification

In order to solve the problem, a class equilibrium amplification method based on Gaussian perturbation is introduced, where N is the number of new minority samples, Nc is the number of minimum class samples, and Nmax is the number of maximum class samples. In order to balance the weights of the classes, multiple synthetic samples Xnew need to be generated for the minority class, and for each original sample Xi in Xnew, new samples are generated by adding a random vector ε from a Gaussian distribution. ε can be determined from the covariance matrix of the minority class samples themselves to ensure that the disturbance is within a reasonable local range. The core advantage of the Gaussian perturbation-based amplification method is that it does not simply copy the samples but locally perturbs the existing minority samples in the feature space to achieve their density in the real distribution region. This makes the model contact more minority samples during the learning process, thus reducing the influence of the majority samples. The disturbance vector ε follows a multivariate Gaussian distribution with zero mean, and its covariance matrix is correlated with the local distribution characteristics of the class of samples to ensure that the resulting samples are statistically consistent with the original sample distribution.
The original training dataset consists of a total of 30 samples, including 11 samples of large-scale pores, 9 samples of small-scale pores, and 10 samples of micro-scale pores. To eliminate the impact of class imbalance on the Bayesian classification results, this study uses the class with the largest number of samples (11) as the reference and augments the minority classes by introducing zero-mean Gaussian perturbations with fixed variance. Specifically, two synthetic samples are generated for the small-scale class and one synthetic sample for the micro-scale class, making the number of samples consistent across all classes. After augmentation, the total number of training samples increases from 30 to 33. This process effectively achieves class balance while preserving the statistical distribution characteristics of the original samples in the feature space.
Most intelligent algorithms typically rely on a large number of training samples and often struggle to maintain stable performance when the number of training samples is limited. In contrast, the reservoir space scale identification method proposed in this paper, which is based on a Bayesian model, focuses on characterizing the probability distribution features of reservoir spaces at different scales and has a relatively low dependence on the quantity of training samples. Under small-sample conditions, the key factor is not the absolute number of samples, but rather whether the samples adequately cover the reservoir space types at each scale. When each scale of reservoir space is supported by a certain number of high-quality samples, this method can achieve reliable identification of reservoir space scales.
N = N m a x N c
X new = X i + ε
ε N ( 0 , Σ i )

3.3. Methodological Assessment

Passing accuracy (Precision), Recall, and F1 value (harmonic mean of precision and recall). Accuracy represents the proportion of samples in the validation set that the model correctly predicts. However, in the case of unbalanced class distribution, accuracy may bias the impact of model performance, so it needs to be evaluated in combination with other indicators. The recall rate reflects the proportion of samples belonging to a certain category successfully identified by the model. A high recall rate indicates that the model has a better recognition effect on coal structure. The F1 value is a commonly used optimization objective function in classification tasks. Combined with the common characteristics of accuracy rate and recall rate, the model is comprehensively evaluated. As shown in Table 3, the F1 values of large-scale and small-scale are all above 0.8, indicating that the model classification effect is better. However, large-scale and micro-scale are affected by a small sample size, and the accuracy rate and recall rate are low. In total, 30 samples are selected for model training, 32 samples are selected for validation, and through the analysis of the confusion matrix (Table 4), all 11 validation samples of large-scale are identified, 9 samples of small-scale are accurately identified, and 7 of 10 samples of micro-scale are identified, with an identification accuracy rate of 84.4%. To sum up, the Bayesian classification method has a good effect on pore-scale classification, especially in the case of sufficient sample size; it can effectively identify different types of pore scale. For samples with a small data size, the model recognition effect can be improved by increasing the sample size or adopting data enhancement methods.

4. Result Analysis

4.1. Conventional Crossplot Analysis

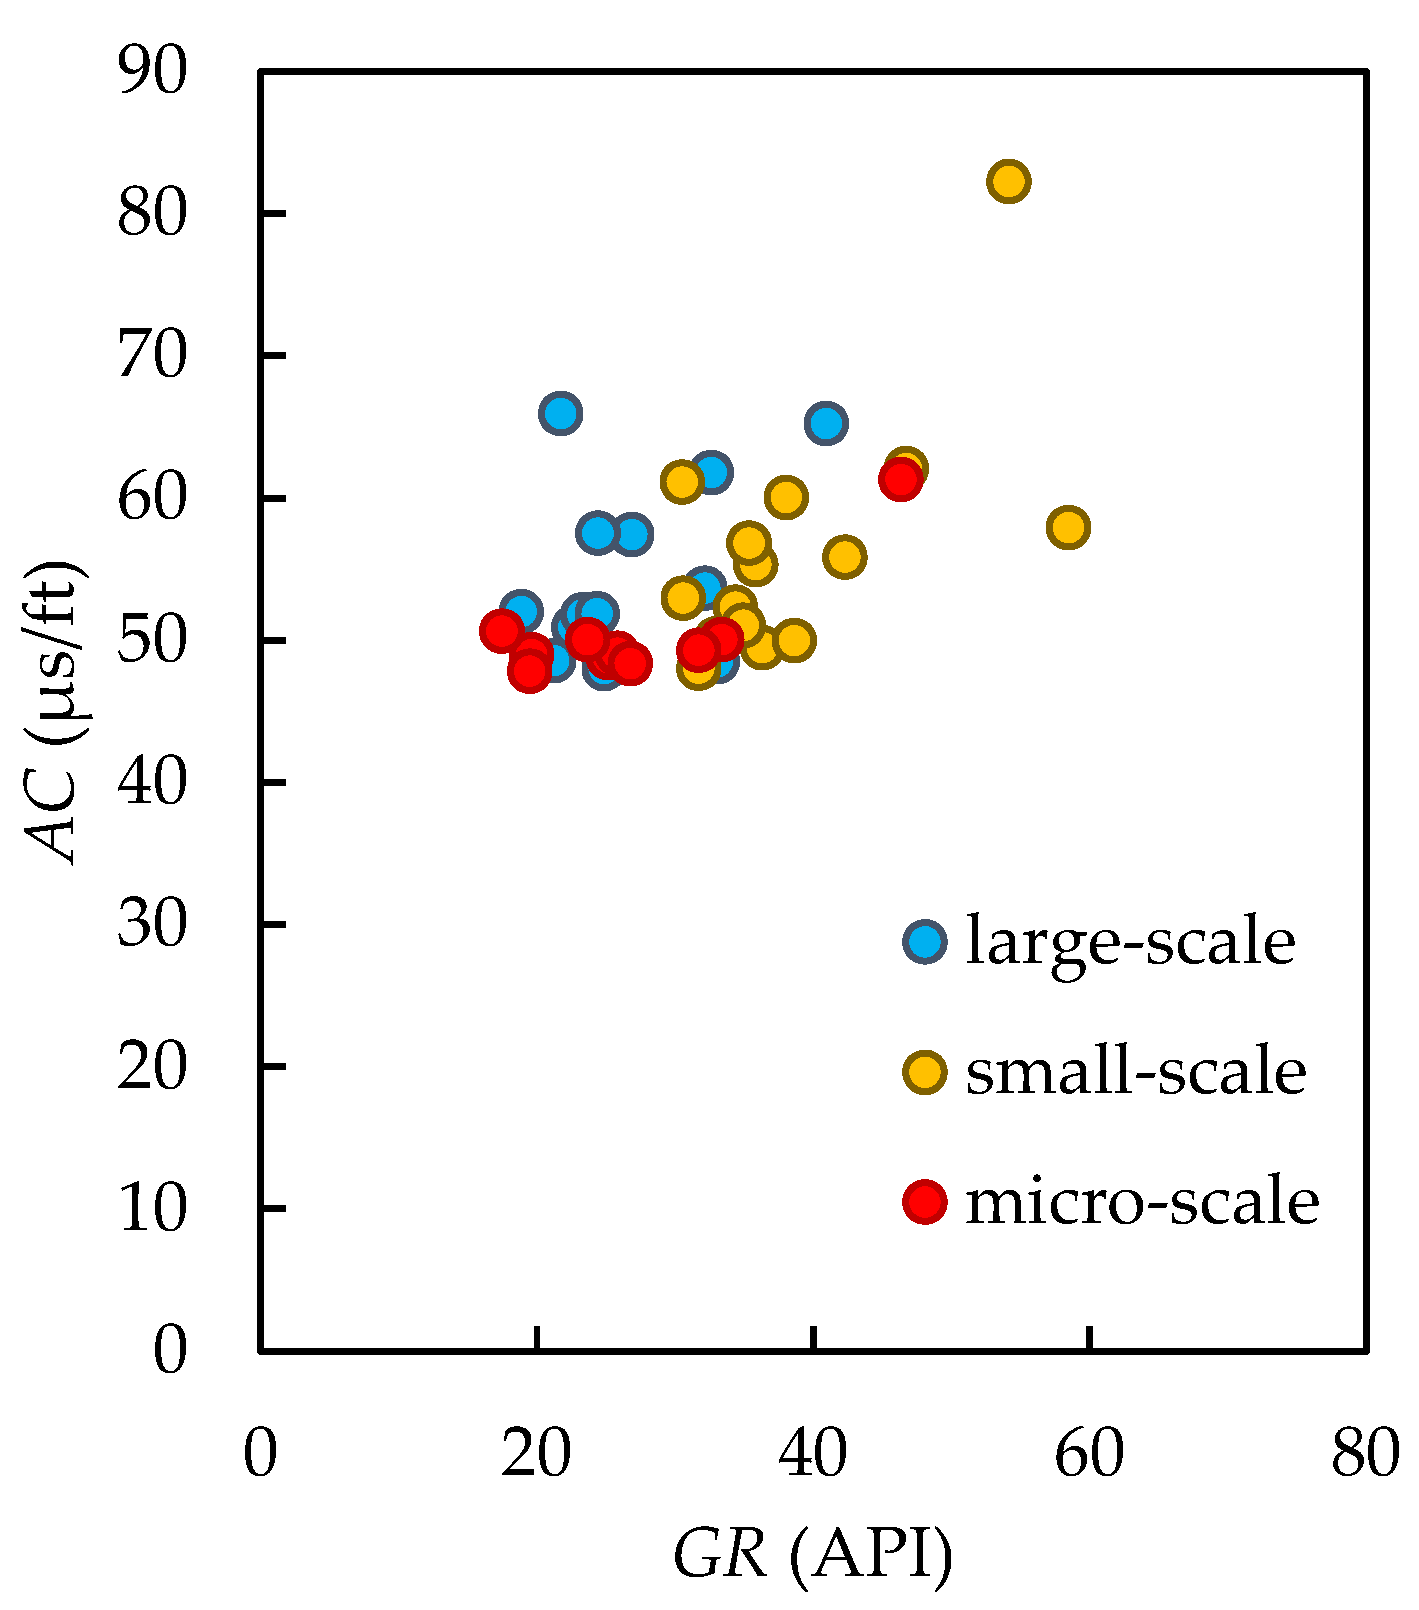
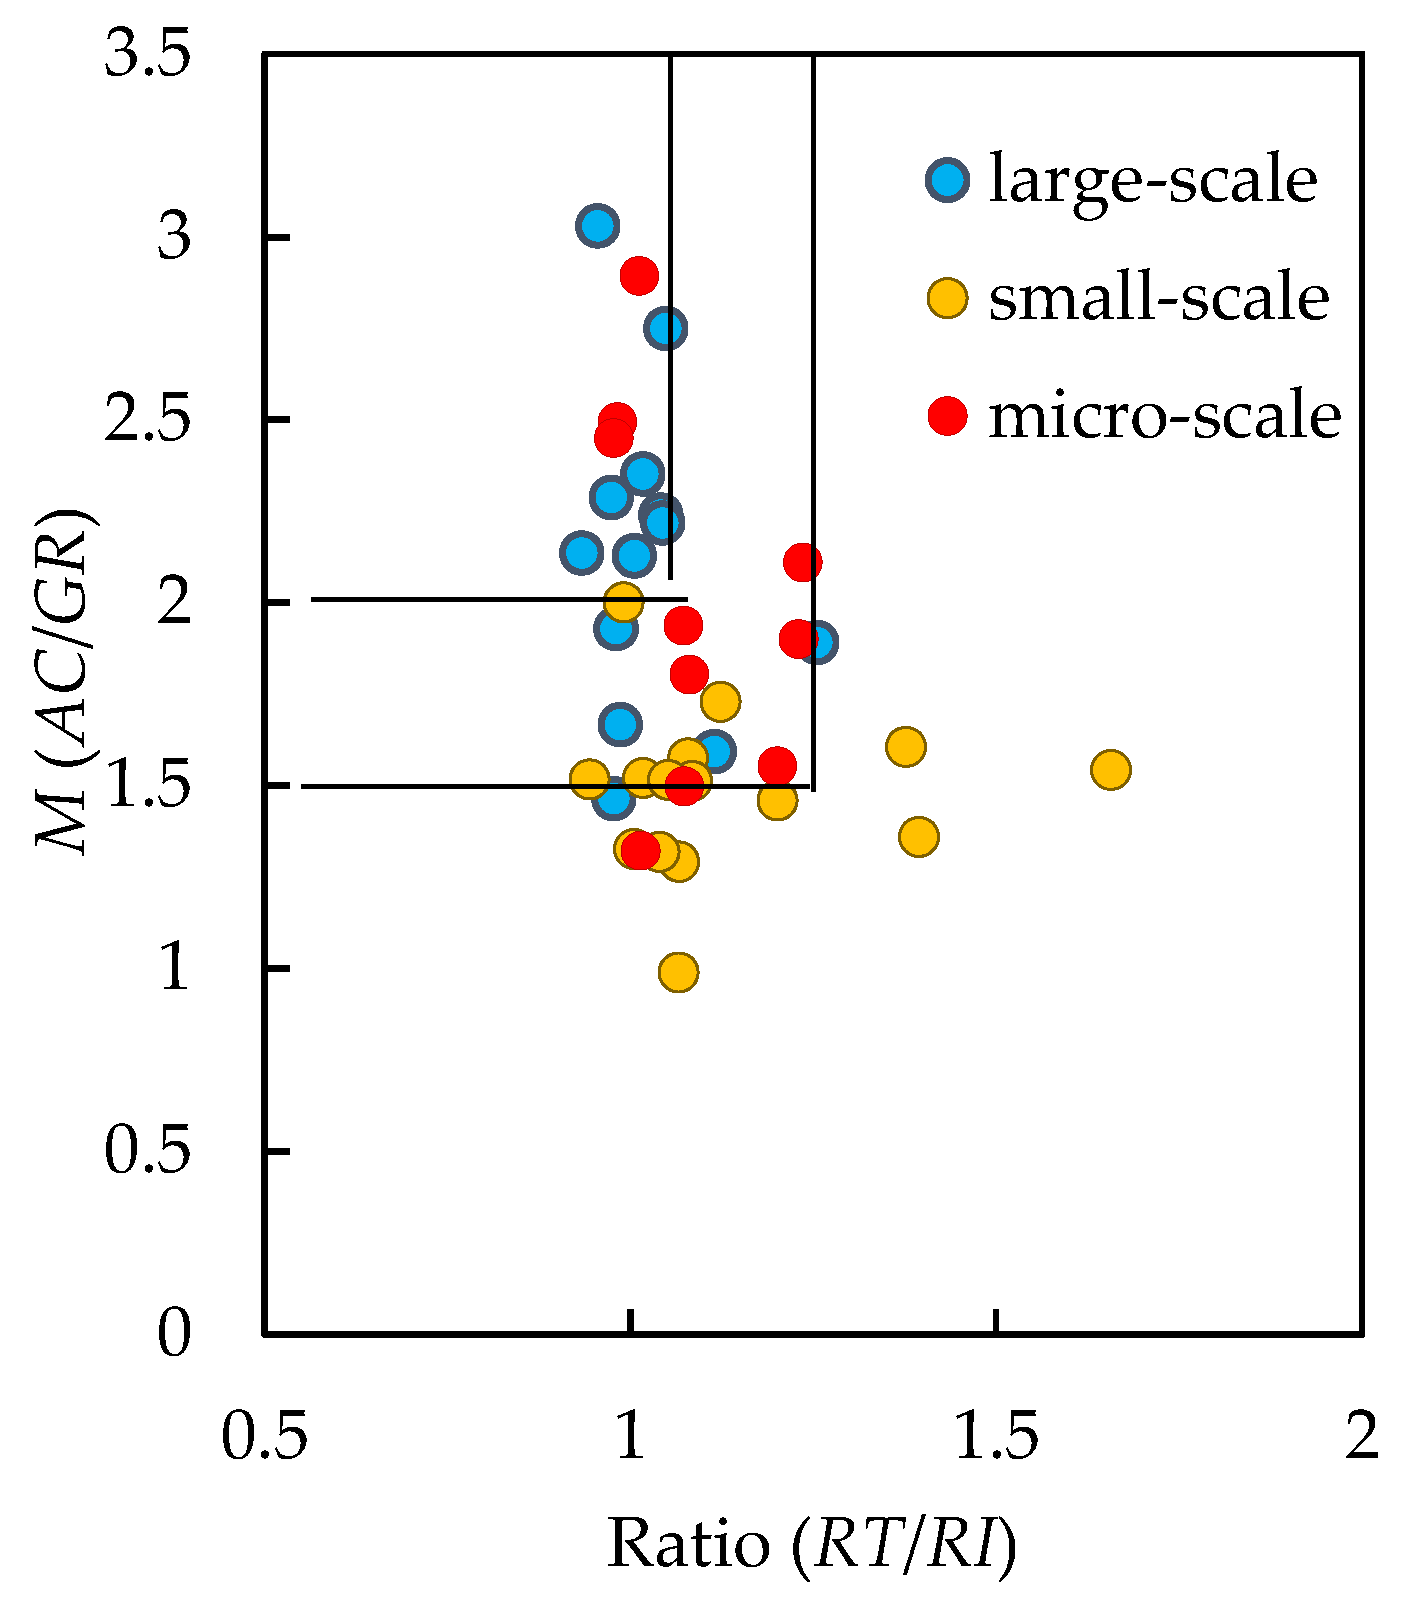
It can be seen from Figure 7 that conventional AC and GR crossplots cannot effectively distinguish large-scale, small-scale, and micro-scale pores. By comparing the log ratio of RT and RI and AC with GR through feature enhancement nonlinear combination, reservoir physical property characteristics can be effectively reflected, and the distribution rules of large-scale, small-scale, and micro-scale pores can be enhanced. Figure 8 shows that the data processed by the feature enhancement nonlinear combination can effectively distinguish large-scale and micro-scale pores, while the small-scale differentiation effect is poor. The large-scale M value (AC-GR ratio) is greater than or equal to 2, and the value (logarithmic ratio of RT and RI) is less than or equal to 1.1. The small-scale M value is distributed between 1.55 and 2, with a ratio between 1.1 and 1.56. The micro-scale M value is less than 1.1, and the ratio is greater than or equal to 1.56.
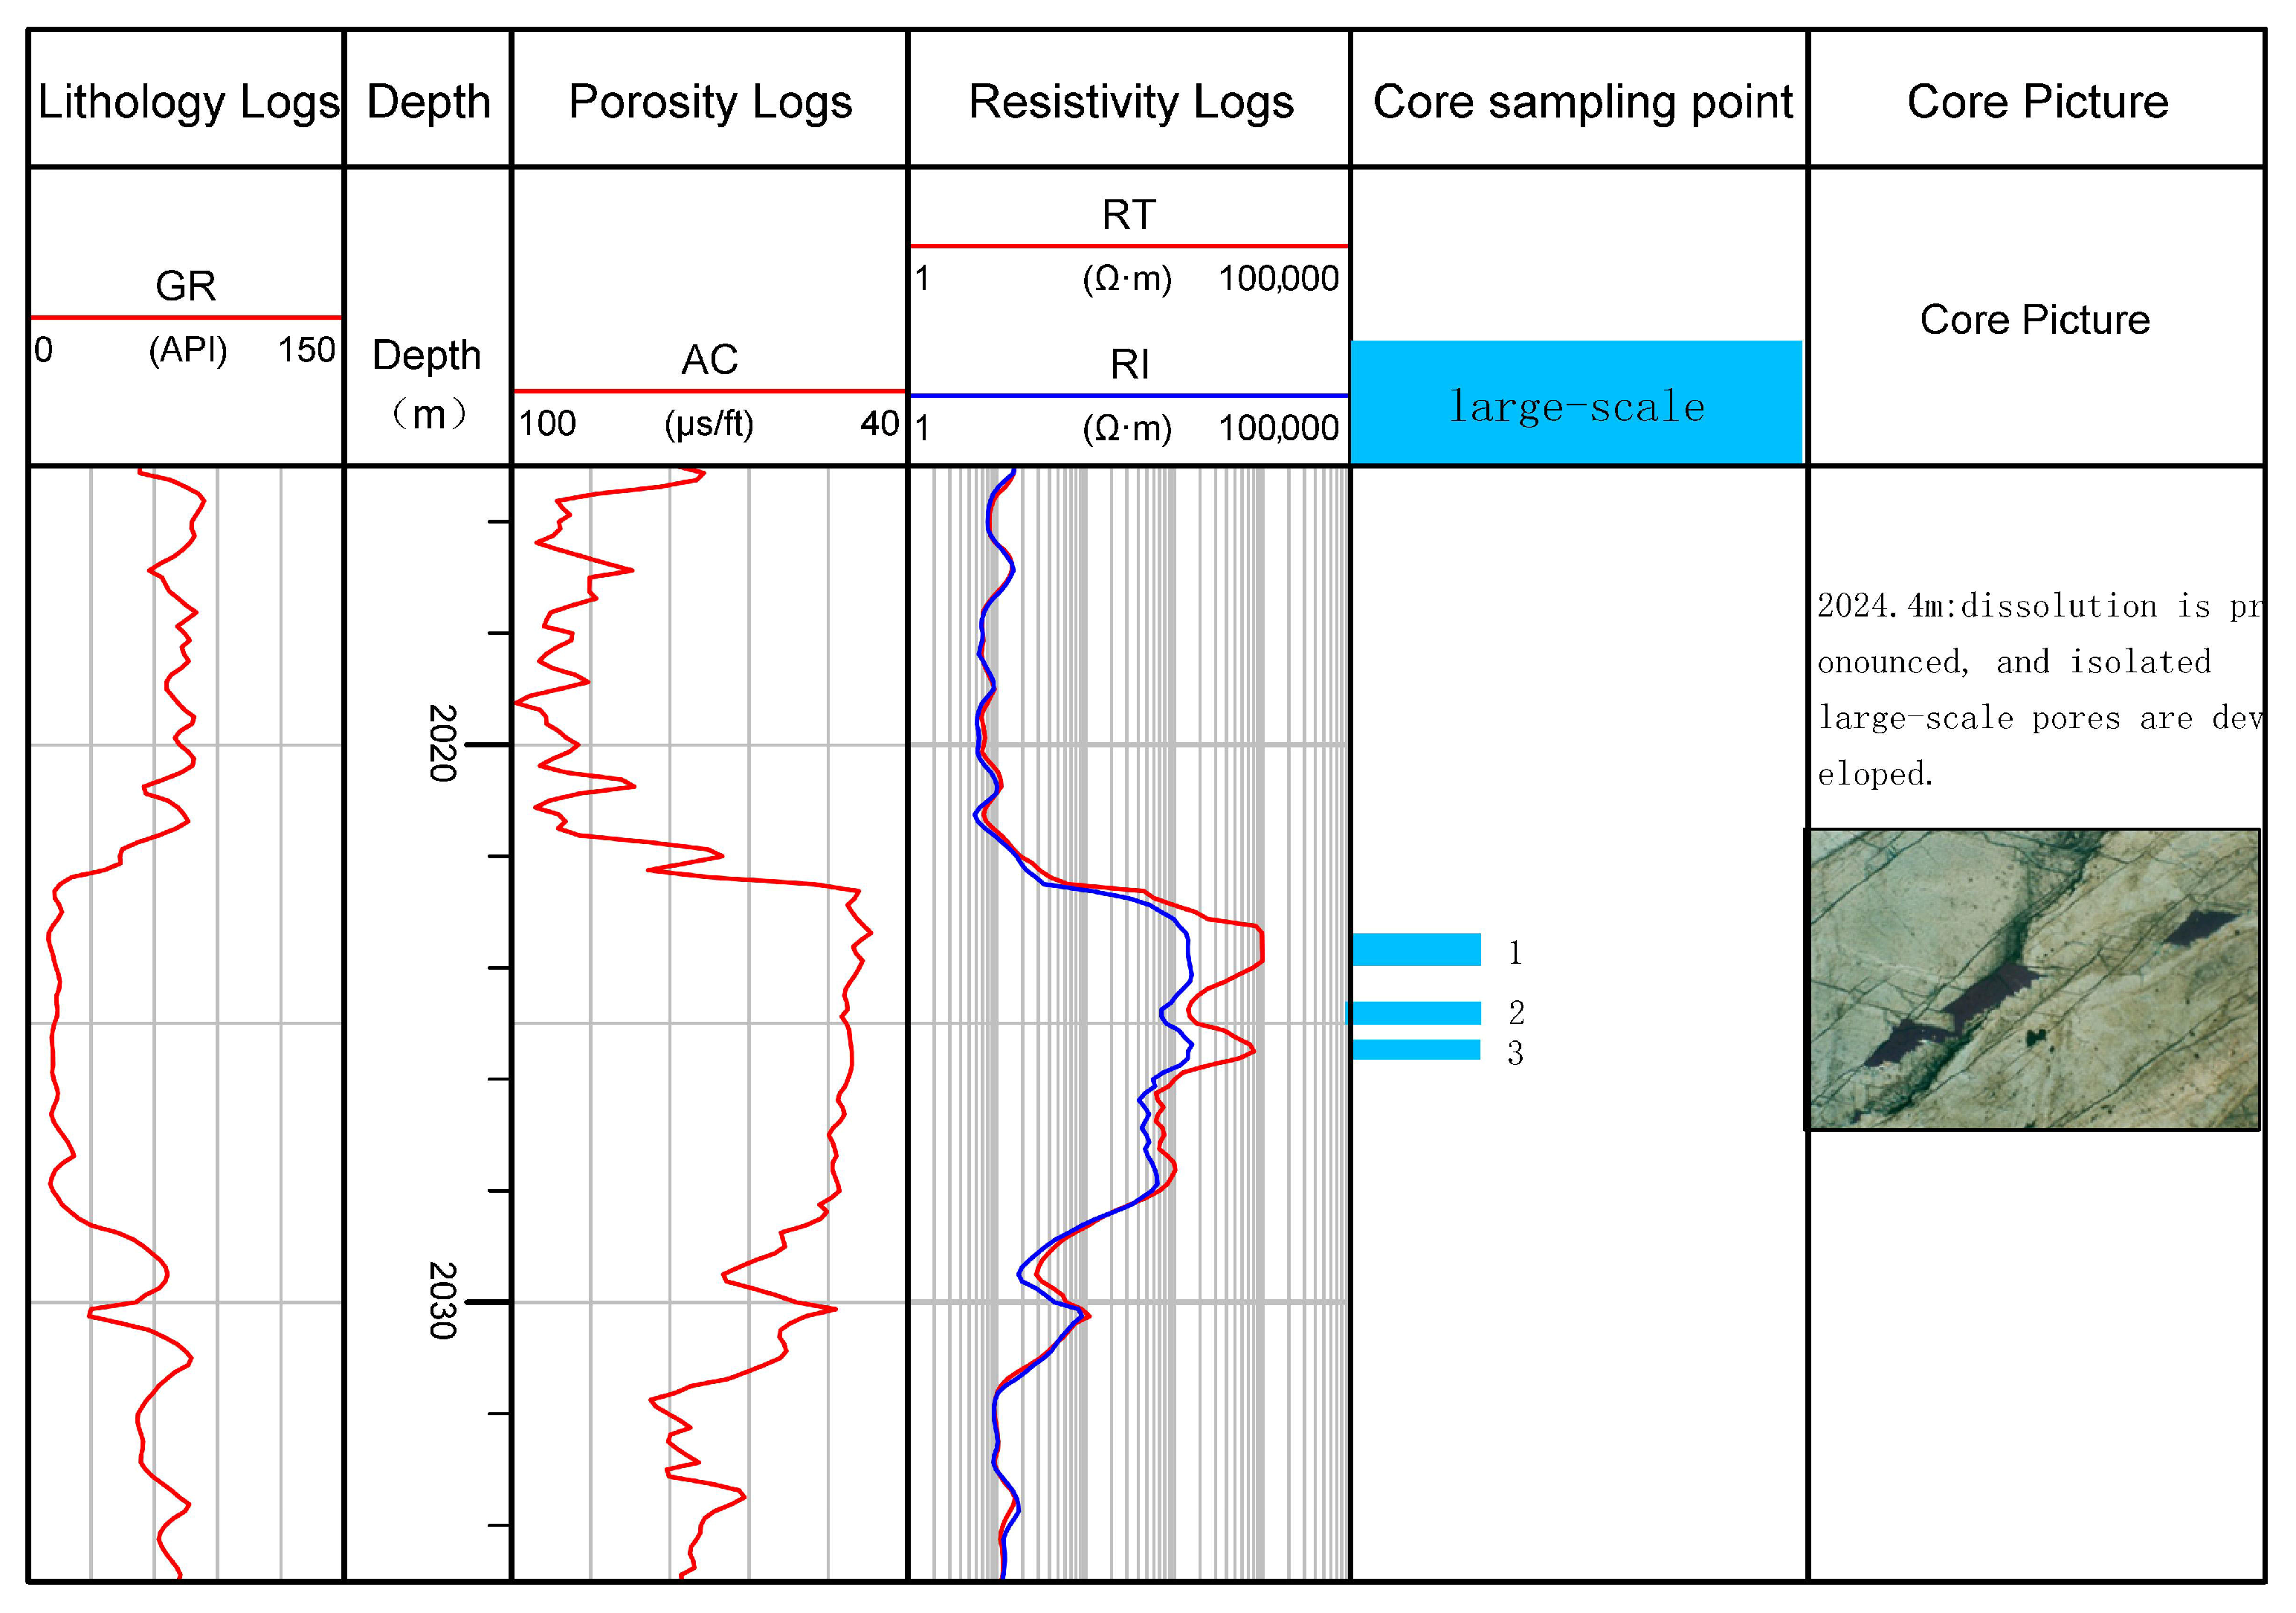
The thin section data of Well X28 (Figure 9) shows that isolated large-scale pores are developed at 2024.4 m. According to Figure 9, in the stable interval of the D3 Member, natural gamma is of medium-low value box type, mud content is low, the curve is smooth, AC is of low value box type accompanied by micro-tooth change, and resistivity at 2024.4 m is of high amplitude finger type, which can reach more than 10,000 Ω·m and has obvious negative anomaly. The ratio of AC depth to gamma is 3.94, the ratio of the logarithm of RT and RI is 1.1, and the crossplot shows large-scale pores, which is consistent with thin section data.

4.2. Bayesian Method Applications

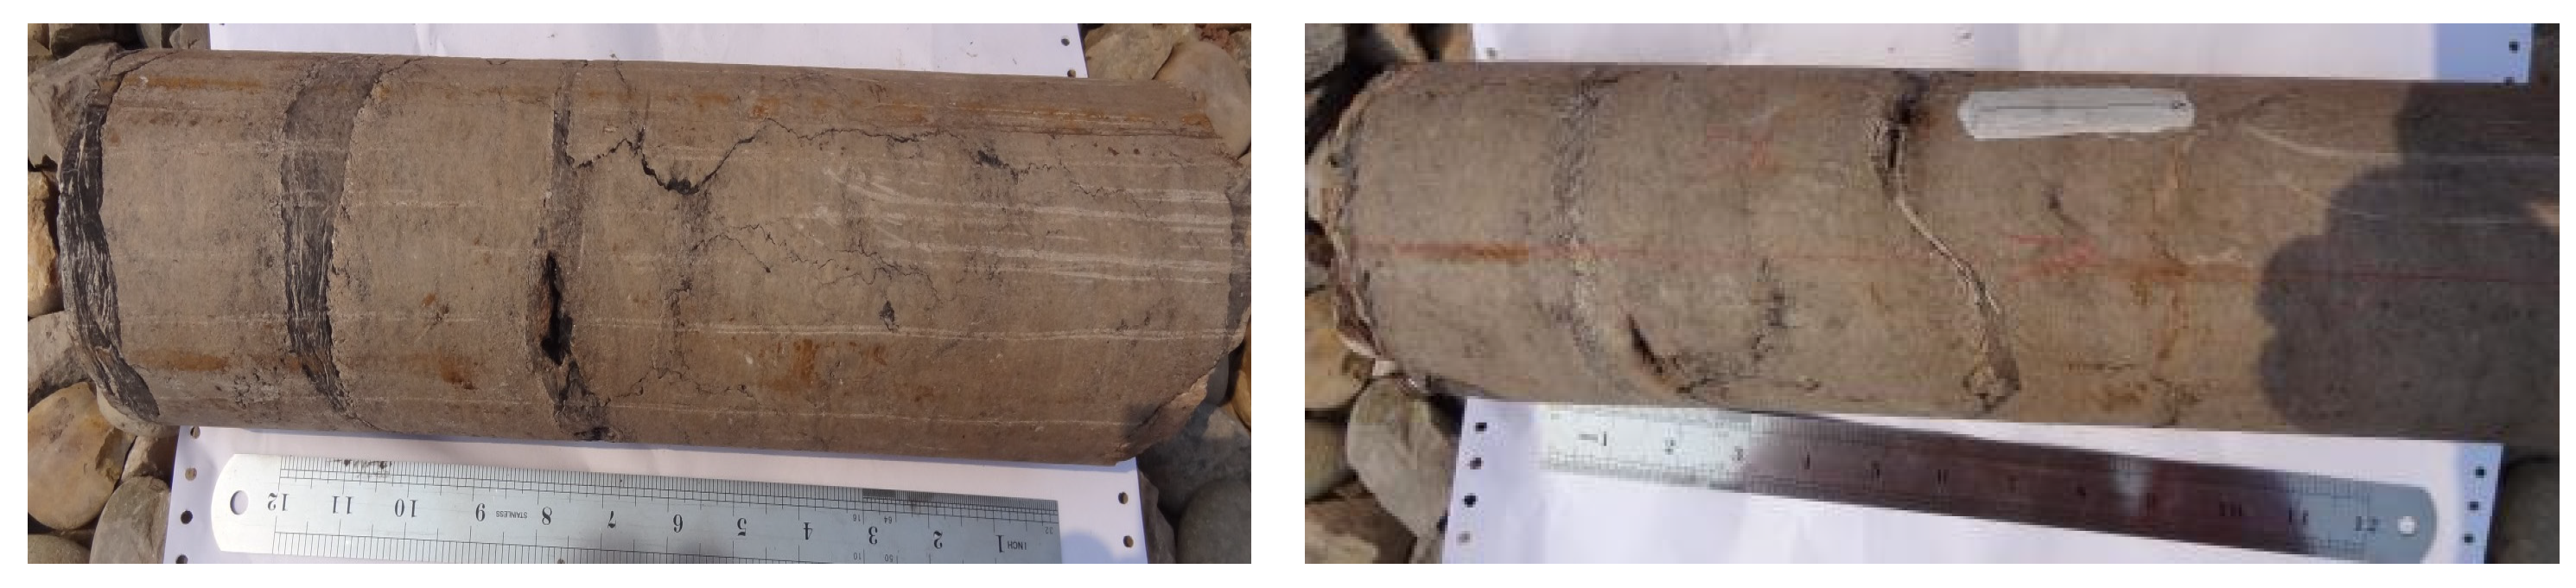
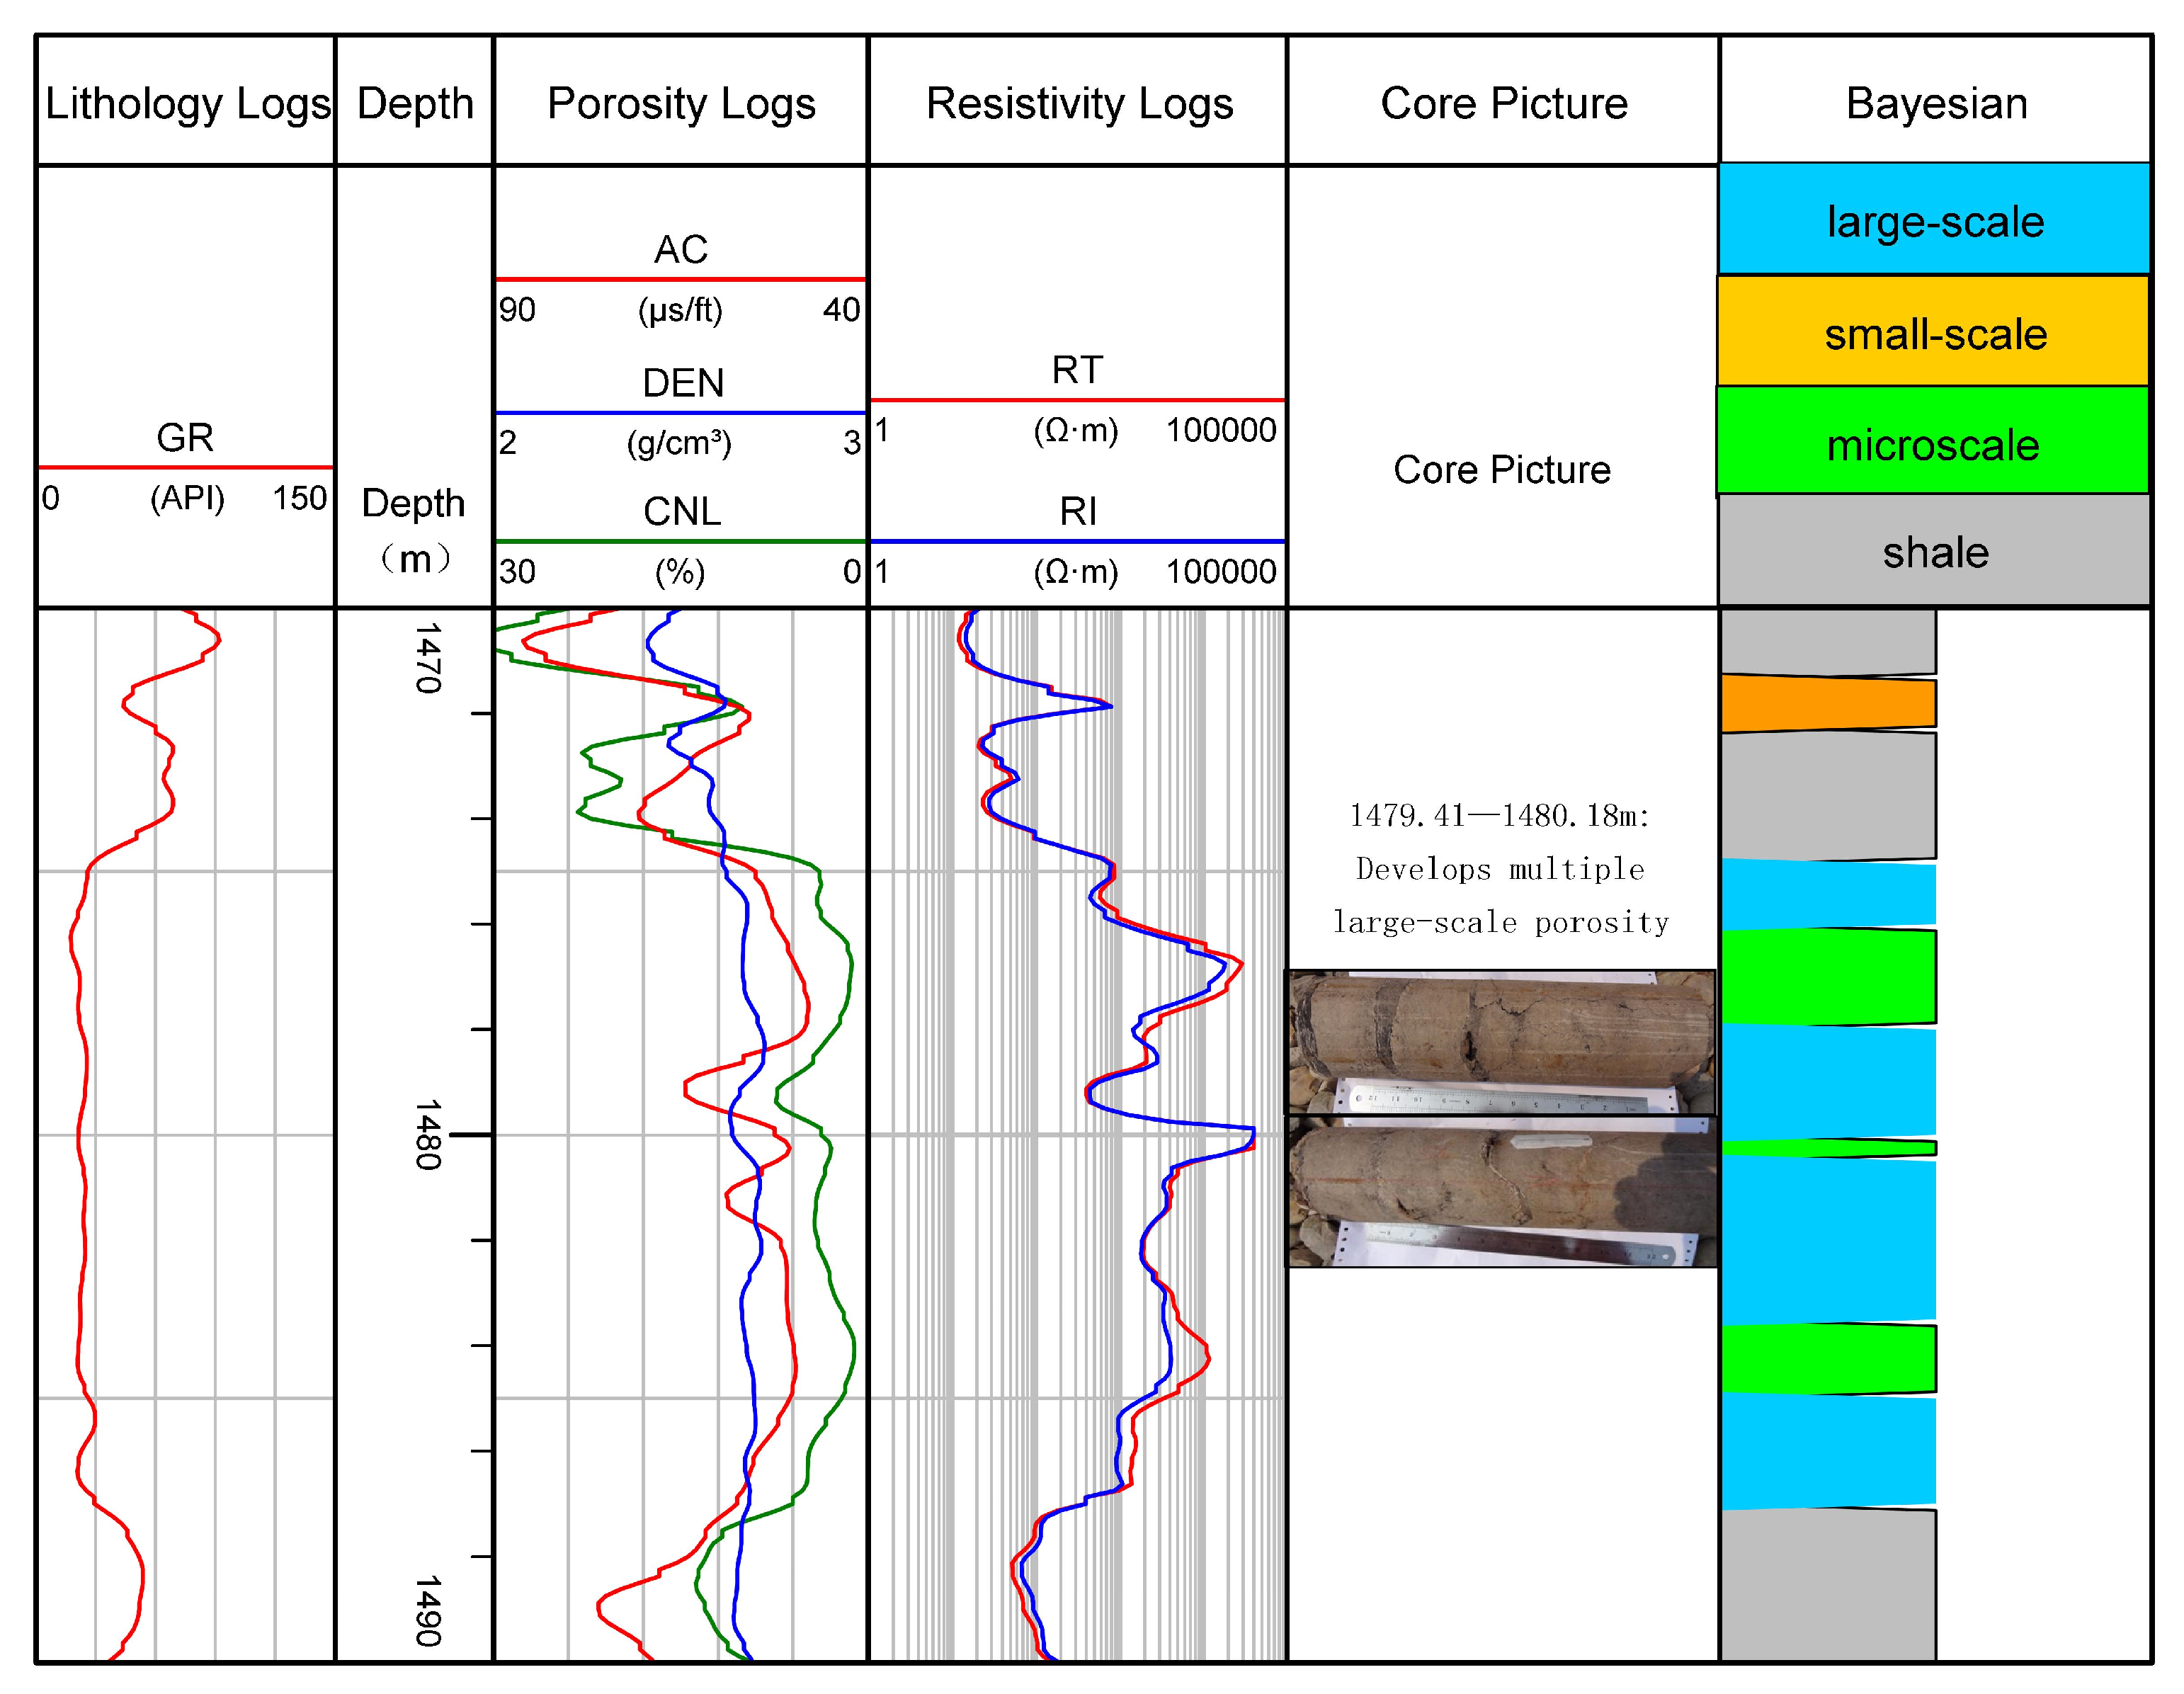
Using 30 samples from the same well block as those used in the crossplot analysis for model training, the data of well HC125-H1 are analyzed. It can be seen from the core photo (Figure 10) that multiple large-scale pores are developed within the depth range of 1479.41–1480.18 m. According to the analysis of Figure 11, in stable intervals, natural gamma is of medium and low value box type, the curve is smooth, AC at 1479.5 m shows a finger-like increase, and corresponding resistivity shows a finger-like decrease. The lithology of this interval is relatively stable. Due to the development of pores in this interval, rock conductivity is relatively good, which is consistent with the response characteristics of large-scale pore logging. The Bayesian method classifies this interval as a large-scale pore, which is consistent with thin-section data.

4.3. Method Comparison

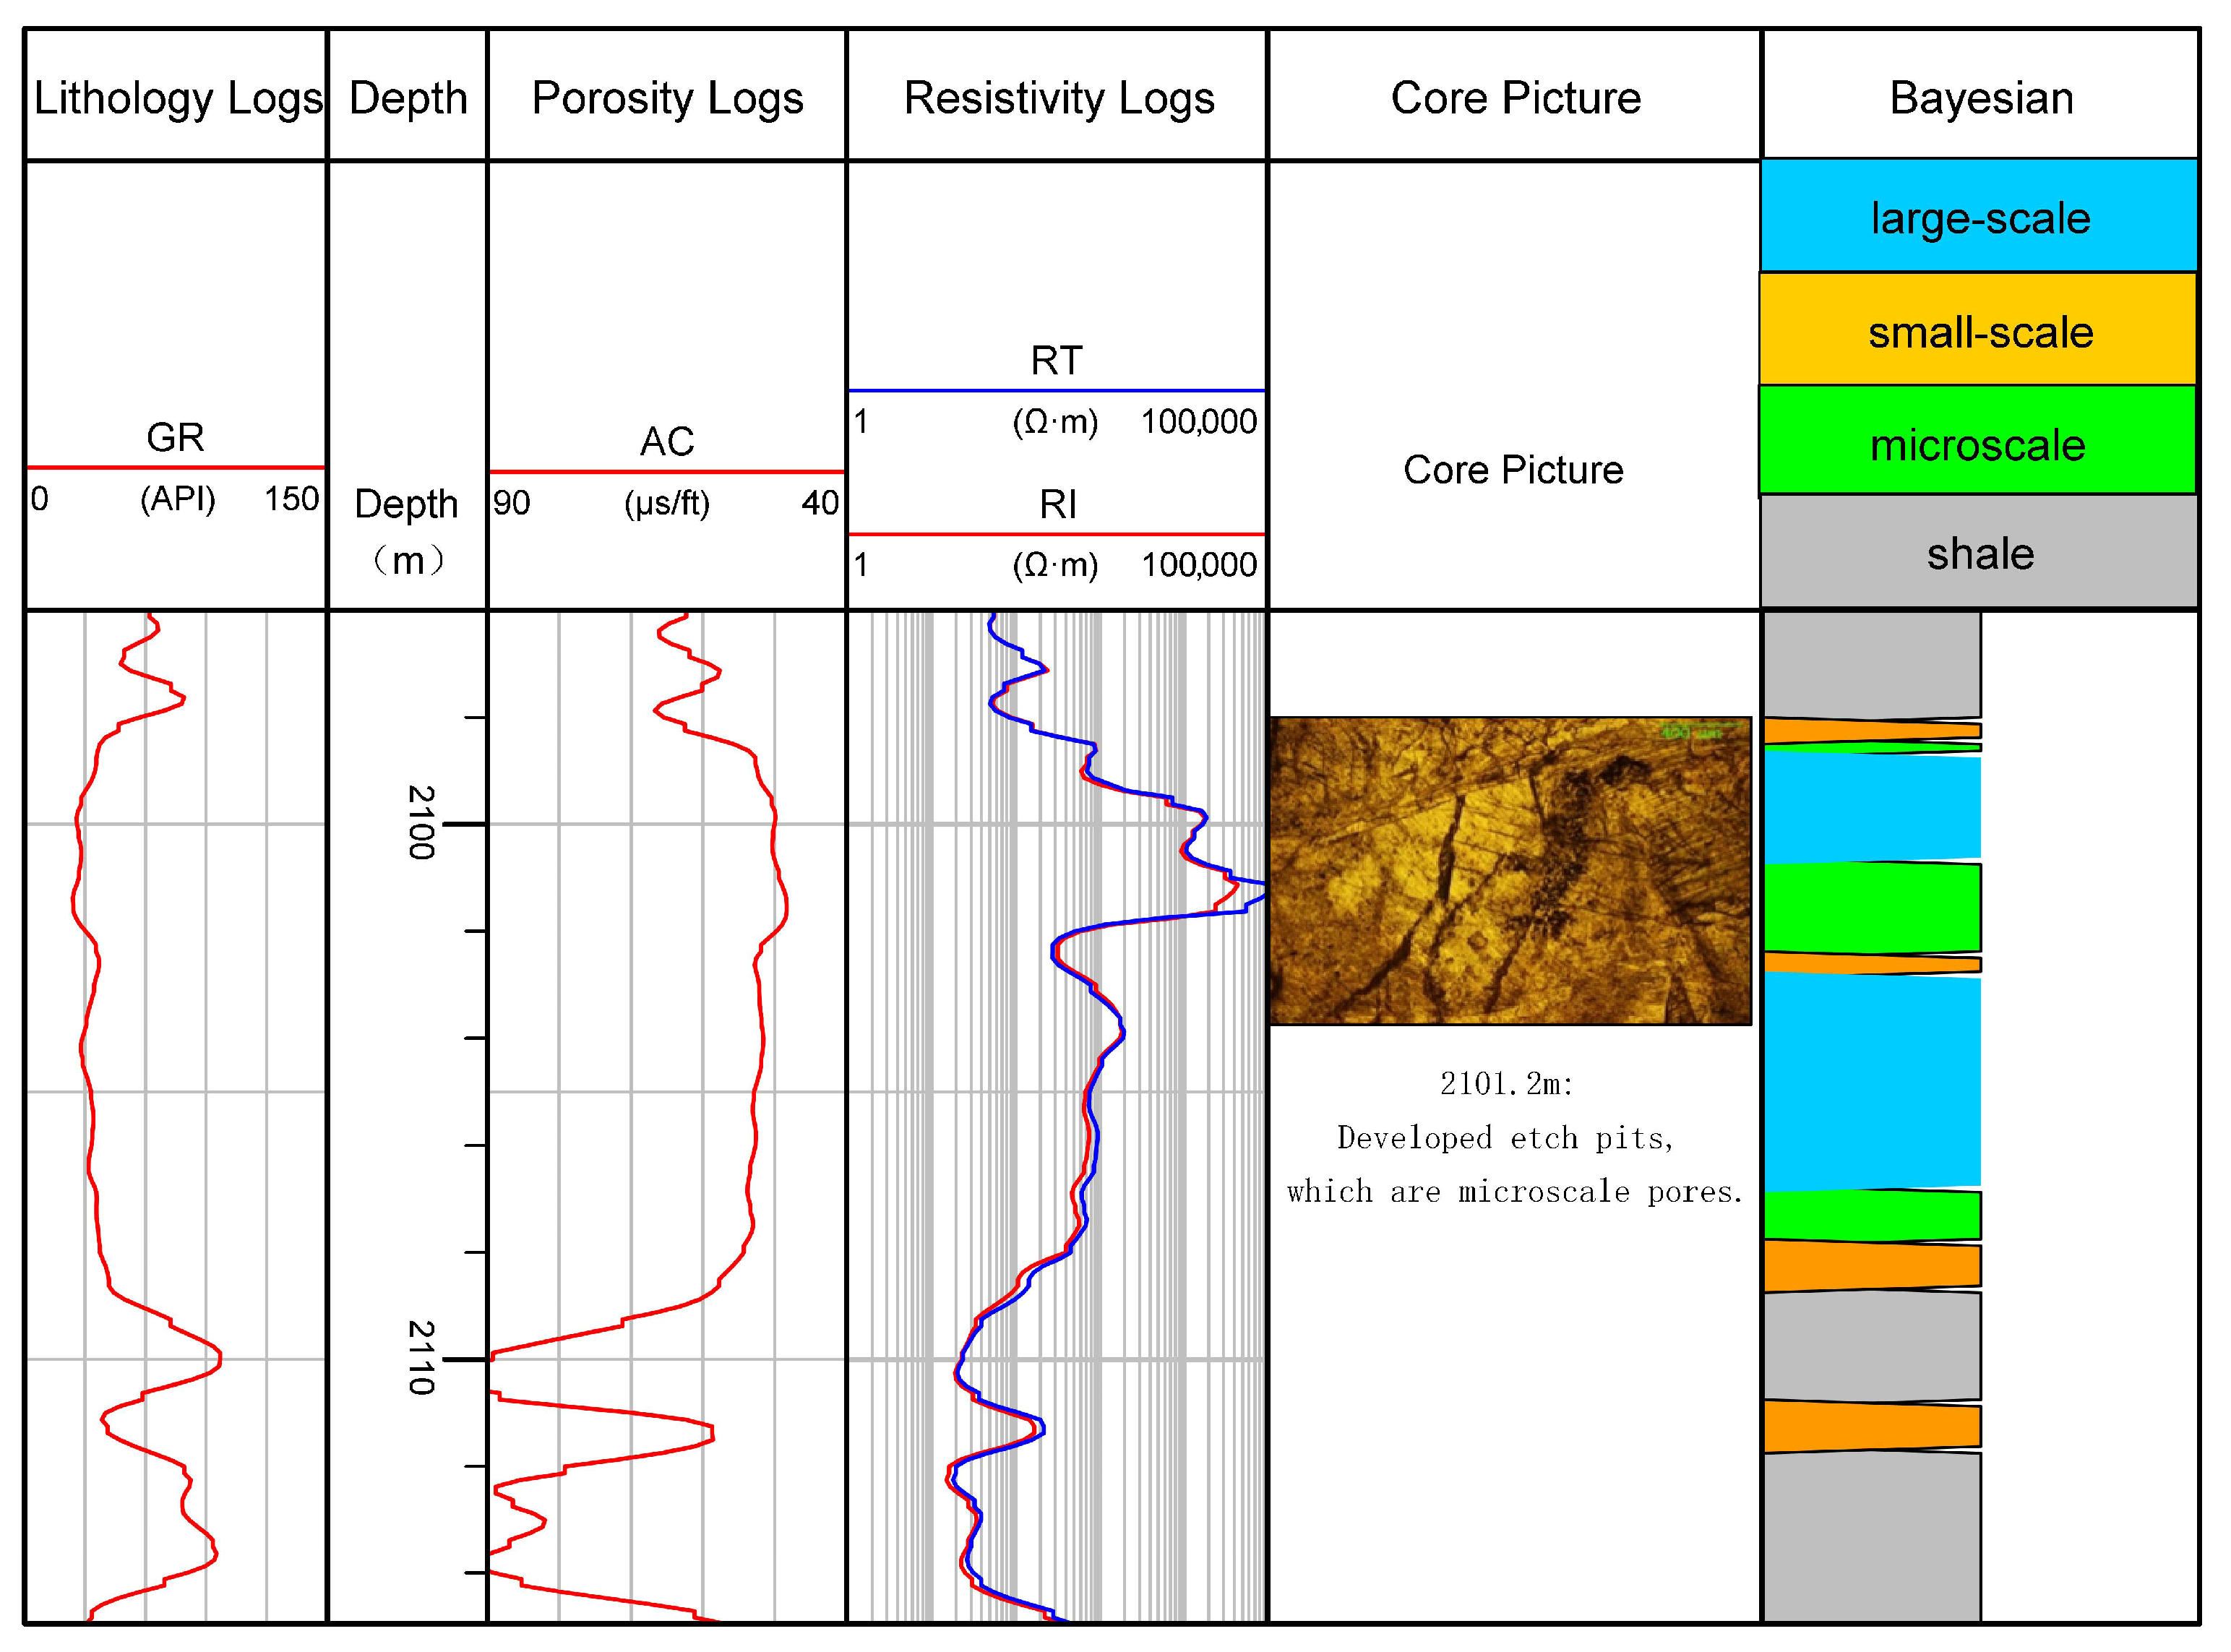
The analysis of 32 samples shows that the Bayesian method has a higher accuracy rate for single-scale pore identification than the conventional crossplot method, and the overall identification accuracy rate of the conventional crossplot is only 59.38%, far lower than 84.38% of the Bayesian method (Table 5). Therefore, the Bayesian identification method has a certain application effect after standardization processing, feature enhancement, nonlinear combination, and sample class balance processing. Through analysis of Well LQ2, thin section data (Figure 12) shows that dissolution micropores are developed at 2101.2 m, which are micro-scale pores. Logging curves show that in the stable limestone formation of the first member, the natural gamma ray is in the middle and low value box type, the curve is smooth, and the AC is in the low value box type. At 2101.2 m, the resistivity is in the high-amplitude finger type, which can reach more than 10,000 Ω∙m, meeting the logging response characteristics of micro-scale. The Bayesian identification results are consistent with thin-section data. The M value of this depth sample is 3.56, and the ratio value is 1.02. The crossplot identifies this micro-scale as large-scale, indicating that the application effect of the conventional crossplot method is insufficient.
Further analysis shows that AC is highly sensitive to pore structure, effectively reflecting the degree of development of reservoir pores and their connectivity characteristics. The natural gamma ray value is mainly influenced by shale (clay) content and variations in carbonate rock density, enabling it to characterize lithological differences. The ratio of AC to GR (AC/GR) constructed from these two parameters amplifies, to a certain extent, the combined response of pore structure and lithological differences, thereby enhancing the discrimination between pores of different scales and improving the identification accuracy of Bayesian classification. As shown in Figure 8, the two-dimensional distribution of the AC/GR ratio can distinguish large-scale pores more clearly than univariate crossplot analysis. This indicates that composite parameters generated through feature-enhanced nonlinear combinations not only increase the separability between samples but also provide a reliable basis for accurate identification of pores at different scales.

5. Conclusions

(1)
The reservoir space of a carbonate tight reservoir has obvious multi-scale characteristics, which can be divided into three types: large-scale, small-scale, and micro-scale. Micro-scale pores are mainly matrix pores and intercrystalline pores, with high resistivity and low AC.
(2)
The Bayesian discriminant method based on a multivariate Gaussian distribution can effectively identify the reservoir spatial scale. By introducing Z-score normalization, feature-enhanced nonlinear combination, and quasi-balanced augmentation based on Gaussian perturbation, the traditional Bayesian method is improved, which can avoid the problems of insufficient recognition ability of multidimensional feature nonlinear coupling and decision boundary deviation caused by sample imbalance.
(3)
Verification analysis shows that the comprehensive recognition accuracy of the improved Bayesian method for large-, small-, and micro-scale reservoir space is 84.38%, which is obviously higher than that of the conventional crossplot method (59.38%), indicating that the improved Bayesian recognition method can not only realize fine division of carbonate reservoir space but also effectively fuse multi-source logging information, and has a good application effect.

Author Contributions

Conceptualization, L.Z.; Methodology, B.W. and Y.H.; Formal analysis, X.L. and X.D.; Investigation, L.W.; Resources, L.W.; Data curation, R.Z.; Writing—original draft, B.W.; Writing—review & editing, J.T. All authors have read and agreed to the published version of the manuscript.

Funding

This research was funded by National Science and Technology Major Project “Exploration and Development Technology and Integrated Demonstration of Deep and Ultra-deep Carbonate Gas Reservoir in Sichuan Basin” grant number 2025ZD1402500.

Data Availability Statement

The original contributions presented in this study are included in the article. Further inquiries can be directed to the corresponding author.

Conflicts of Interest

Bei Wang, Xixiang Liu, Yong Hu, Lian-jin Zhang, Ruiduo Zhang, and Xin Dai were employed by the PetroChina Southwest Oil & Gas Field Company. The remaining authors declare that the research was conducted in the absence of any commercial or financial relationships that could be construed as a potential conflict of interest.

References

  1. Harris, N.B. The Toca carbonate, Congo Basin: Response to an evolving rift lake. In Petroleum Systems of South Atlantic Margins; AAPG: Tulsa, OK, USA, 2000; Volume 73, pp. 341–360. [Google Scholar]
  2. Hill, B.G.; Bereskin, S.R. Oil and Gas Fields of Utah; Utah Geological Association: Salt Lake City, UT, USA, 1993. [Google Scholar]
  3. Zou, C.N. Unconventional Petroleum Geology; Elsevier: Amsterdam, The Netherlands, 2017. [Google Scholar]
  4. Dong, G.; Liu, X.; Yin, L.; Fu, X.; Song, J.; Zhao, X.; Pei, W. Development characteristics and genetic analysis of dense limestone reservoirs in the Taiyuan Formation of the Ordos Basin, China. J. Nat. Gas Geosci. 2023, 8, 307–317. [Google Scholar] [CrossRef] [Scilit]
  5. Faramarzi, M.; Tabatabaei, S.M.; Sedaee, B.; Attari, N.; Panahi, S.A. Saturation-functions models in CO2-brine system: A comparative study. Capillarity 2025, 14, 35–52. [Google Scholar] [CrossRef] [Scilit]
  6. Hu, C.P.; Zhao, Z.Q.; Gao, S.; Liu, C.; Wu, K.; Pang, P. Characterization of pore systems in fine-grained carbonate rocks using digital core technology. Adv. Geo-Energy Res. 2024, 12, 77–80. [Google Scholar] [CrossRef] [Scilit]
  7. Huang, Z.Q.; Xing, H.C.; Zhou, X.; You, H. Numerical study of vug effects on acid-rock reactive flow in carbonate reservoirs. Adv. Geo-Energy Res. 2020, 4, 448–459. [Google Scholar] [CrossRef] [Scilit]
  8. Liang, J.; Zhou, J.P.; Cai, J.C. Applications of mercury intrusion capillary pressure for pore structures: A review. Capillarity 2020, 3, 62–74. [Google Scholar] [CrossRef] [Scilit]
  9. Lucia, F.J.; Kerans, C.; Jennings, J.W., Jr. Carbonate reservoir characterization. J. Pet. Technol. 2003, 55, 70–72. [Google Scholar] [CrossRef] [Scilit]
  10. Zhao, L.; Wang, S.Q.; Zhao, W.Q.; Luo, M.; Wang, C.-G.; Cao, H.-L.; He, L. Combination and distribution of reservoir space in complex carbonate rocks. Pet. Sci. 2016, 13, 450–462. [Google Scholar] [CrossRef] [Scilit]
  11. Shen, A.Q.; Liu, Y.K.; Farouq Ali, S.M. A model of spontaneous flow driven by capillary pressure in nanoporous media. Capillarity 2020, 3, 1–7. [Google Scholar] [CrossRef] [Scilit]
  12. Chen, Y.; Ma, G.; Jin, Y.; Wang, H.; Wang, Y. Productivity evaluation of unconventional reservoir development with three-dimensional fracture networks. Fuel 2019, 244, 304–313. [Google Scholar] [CrossRef] [Scilit]
  13. Zhou, C.N.; Zhang, G.Y.; Tao, S.Z.; Hu, S.; Li, X.; Li, J.; Dong, D.; Zhu, R.; Yuan, X.; Hou, L.; et al. Geological features, major discoveries and unconventional petroleum geology in the global petroleum exploration. Pet. Explor. Dev. 2010, 37, 129–145. [Google Scholar] [CrossRef] [Scilit]
  14. Cheng, Y.; Luo, X.; Zhuo, Q.; Gong, Y.; Liang, L. Description of pore structure of carbonate reservoirs based on fractal dimension. Processes 2024, 12, 825. [Google Scholar] [CrossRef] [Scilit]
  15. Kong, D.B.; Peng, Y.F.; Zhou, Z.Y.; Peng, H.; Chen, Z. Pore-scale mechanism of coupled pressure-driven flow and spontaneous imbibition in porous media during high-pressure water injection processes. Capillarity 2024, 13, 29–36. [Google Scholar] [CrossRef] [Scilit]
  16. Olson, J.E.; Laubach, S.E.; Lander, R.H. Natural fracture characterization in tight gas sandstones: Integrating mechanics and diagenesis. AAPG Bull. 2009, 93, 1535–1549. [Google Scholar] [CrossRef] [Scilit]
  17. Xiao, Y.H.; You, Z.J.; Wang, L.; Du, Z. A critical review of capillary pressure behavior and characterization in fractional-wet reservoirs. Capillarity 2024, 10, 12–21. [Google Scholar] [CrossRef] [Scilit]
  18. Shi, Y.J.; Wei, M. Data processing method of underwater wellhead magnetic detection. J. China Univ. Pet. (Ed. Nat. Sci.) 2024, 48, 59–67. [Google Scholar]
  19. Chen, X.L.; Cheng, F.; Han, W.; Tang, X. Theoretical and experimental study on flexural-wave dispersion characteristics in cased wells. J. China Univ. Pet. (Ed. Nat. Sci.) 2024, 48, 70–76. [Google Scholar]
  20. Wood, D.A. Expanding role of borehole image logs in reservoir fracture and heterogeneity characterization: A review. Adv. Geo-Energy Res. 2024, 12, 194–204. [Google Scholar] [CrossRef] [Scilit]
  21. Sun, L.D.; Fang, C.L.; Li, F.; Zhu, R.; Zhang, Y.; Yuan, X.; Jia, A.; Gao, X.; Su, L. Innovations and challenges of sedimentology in oil and gas exploration and development. Pet. Explor. Dev. 2015, 42, 143–151. [Google Scholar] [CrossRef] [Scilit]
  22. Wei, B.J.; Bian, X.; Liu, J. Simulating surface-to-borehole electromagnetic remote detection responses using dyadic Green’s functions. J. China Univ. Pet. (Ed. Nat. Sci.) 2024, 48, 48–58. [Google Scholar]
  23. Zhao, J.; Liu, Y.; Qin, F.F.; Fei, L. Pore-scale fluid flow simulation coupling lattice Boltzmann method and pore network model. Capillarity 2023, 7, 41–46. [Google Scholar] [CrossRef] [Scilit]
  24. Zhou, X.; Wei, J.; Zhao, J.; Zhang, X.; Fu, X.; Shamil, S.; Abdumalik, G.; Chen, Y.; Wang, J. Study on pore structure and permeability sensitivity of tight oil reservoirs. Energy 2024, 288, 129632. [Google Scholar] [CrossRef] [Scilit]
  25. Burke, J.A.; Campbell, R.L., Jr.; Schmidt, A.W. The Litho-Porosity Cross Plot: A new concept for determining porosity and lithology from logging methods. In Proceedings of the SPWLA 10th Annual Logging Symposium; Society of Petrophysicists and Well-Log Analysts: Houston, TX, USA, 1969. [Google Scholar]
  26. Liu, Y.W.; Liu, Y.Q.; Yu, Z.H.; Zhang, Z.G.; Wang, Z.H.; Zhang, Z.Q.; Liu, B.Y. Influence and correction method of electrode gap in multi frequency oil-based electrical imaging logging. J. China Univ. Pet. (Ed. Nat. Sci.) 2025, 49, 75–84. [Google Scholar]
  27. Lofts, J.; Evans, M.; Pavlovic, M.; Dymmock, S. A new micro-resistivity imaging device for use in oil-based mud. In Proceedings of the SPWLA Annual Logging Symposium, Oiso, Japan, 2–5 June 2002. [Google Scholar]
  28. Yu, Z.H.; Liu, B.Y.; Lu, T.; Liu, Y.W. Magnetic current excitation simulation and image enhancement methods for logging while drilling resistivity imaging tools. J. China Univ. Pet. (Ed. Nat. Sci.) 2024, 48, 92–100. [Google Scholar]
  29. Karpenko, O.; Myrontsov, M.; Anpilova, Y. Application of discriminant analysis in the interpretation of well-logging data. In Systems, Decision and Control in Energy III; Springer International Publishing: Cham, Switzerland, 2021; pp. 267–275. [Google Scholar]
  30. Wei, B.J.; Xia, K.; Liu, J.; Zhang, B.C.; Wang, R.Z. Processing method of LFM signals based on FRFT and adaptive filtering technique. J. China Univ. Pet. (Ed. Nat. Sci.) 2025, 49, 71–81. [Google Scholar]
  31. Zhang, F.; Zhang, C. Evaluating the potential of carbonate sub-facies classification using NMR longitudinal over transverse relaxation time ratio. Adv. Geo-Energy Res. 2021, 5, 87–103. [Google Scholar] [CrossRef] [Scilit]
  32. Zhang, T.T.; Li, Z.P.; Adenutsi, C.D.; Lai, F. A new model for calculating permeability of natural fractures in dual-porosity reservoir. Adv. Geo-Energy Res. 2017, 1, 86–92. [Google Scholar] [CrossRef] [Scilit]
  33. Aliouane, L.; Ouadfeul, S.A.; Boudella, A. Fractal analysis based on the continuous wavelet transform and lithofacies classification from well-logs data using the self-organizing map neural network. Arab. J. Geosci. 2013, 6, 1681–1691. [Google Scholar] [CrossRef] [Scilit]
  34. dos Santos, D.T.; Roisenberg, M.; dos Santos Nascimento, M. Deep recurrent neural networks approach to sedimentary facies classification using well logs. IEEE Geosci. Remote Sens. Lett. 2021, 19, 3001405. [Google Scholar] [CrossRef] [Scilit]
  35. Diaz-Acosta, A.; Bouchaala, F.; Kishida, T.; Jouini, M.S.; Ali, M.Y. Investigation of fractured carbonate reservoirs by applying shear-wave splitting concept. Adv. Geo-Energy Res. 2023, 7, 99–110. [Google Scholar] [CrossRef] [Scilit]
  36. Hou, X.; Lian, P.; Zhao, J.; Zai, Y.; Zhu, W.; Wang, F. Identification of carbonate sedimentary facies from well logs with machine learning. Pet. Res. 2024, 9, 165–175. [Google Scholar] [CrossRef] [Scilit]
  37. Wang, D.; Peng, J.; Yu, Q.; Chen, Y.; Yu, H. Support vector machine algorithm for automatically identifying depositional microfacies using well logs. Sustainability 2019, 11, 1919. [Google Scholar] [CrossRef] [Scilit]
  38. Zhang, Q.Y.; Li, N.C.; Zhang, F.J.; Nie, X.; Song, H.W.; Liu, G.B. Influence mechanism of drill collar in D-T porosity logging while drilling. J. China Univ. Pet. (Ed. Nat. Sci.) 2024, 48, 68–77. [Google Scholar]
  39. Fang, X.; Feng, H. Study on discriminant method of rock type for porous carbonate reservoirs based on Bayesian theory. Sci. Rep. 2021, 11, 18622. [Google Scholar] [CrossRef] [Scilit] [PubMed]
  40. Rogers, S.J.; Fang, J.H.; Karr, C.L.; Stanley, D. Determination of lithology from well logs using a neural network. AAPG Bull. 1992, 76, 731–739. [Google Scholar] [CrossRef] [Scilit]
Figure 1. Types of reservoir spaces at different scales. (a) Large-scale dissolution pores and vugs, Well HC12–7-H1, 1479.41–1479.77 m. (b) Large-scale dissolution pores and vugs, Well LG83, 2337.59–2337.85 m. (c) Large-scale dissolution pores and vugs, Well L13, 2188.56–2188.84 m. (d) Large-scale intergranular dissolution pores, Well X44, 2063.6 m. (e) Small-scale intragranular dissolution pores, Well W6, 2054.2 m. (f) Small-scale intragranular dissolution pores, Well X8, 1810.5 m. (g) Micro-scale intercrystalline micropores, Well G4, 2380.57 m. (h) Micro-scale, dissolution micropores, Well X20, 1837.85 m. (i). Micro-scale dissolution micropores, Well G4, 2400.47 m.
Processes 14 00955 g001
Figure 2. The curve of the single cavity type and a large cavity.
Processes 14 00955 g002
Figure 3. The curve of a large crack hole.
Processes 14 00955 g003
Figure 4. Shape of the small-scale pore curve of a single pore type.
Processes 14 00955 g004
Figure 5. Shape of the small-scale pore curve of pore type.
Processes 14 00955 g005
Figure 6. Micro-scale pore curve morphology.
Processes 14 00955 g006
Figure 7. AC and GR crossplot.
Processes 14 00955 g007
Figure 8. Crossplot of the log ratio of RT/RI and M (The dividing lines represent the threshold lines of different scales).
Processes 14 00955 g008
Figure 9. Characteristics of large-scale pore thin section and logging response (Well X28, 2025 m).
Processes 14 00955 g009
Figure 10. Core from well HC125-H1, 1479.41–1480.18 m.
Processes 14 00955 g010
Figure 11. Logging response characteristics (Well HC125-H1).
Processes 14 00955 g011
Figure 12. Micro-scale pore slice and logging response characteristics (Well LQ2, 2101.2 m).
Processes 14 00955 g012
Table 1. Classification of reservoir spatial scale in Da’anzhai Formation.
Pore ClassificationMacrovoidPores inSmall PoreMicroporesNanopore
pore diameter/µm>100100–4040–1010–1<1
main causesStrong dissolution and weak densification in the later stageLate dissolution, local weak densificationWeak dissolution in the later stage, moderate and strong densificationWeak dissolution and strong densification of the matrix in the late stagestrong densification
pore typeMold pores, (coarse) intergranular dissolved pores, (coarse) residual intergranular pores(partial) granular pores, (medium) intergranular dissolution, (medium) residual intergranular pores(fine) intergranular dissolution, intragranular dissolution pores, (fine) residual intergranular pores(Powder) Residual intergranular pores, matrix dissolved poresIntercrystalline and Intracrystalline Pore
pore numberlesslessmoreabundantmore
Table 2. Classification of Da’anzhai reservoir space.
Reservoir Spatial ScaleMacroporeSmall-Scale PoreMicro-Scale Pore
pore typeThe pores are mainly mold pores, shadow pores, intragranular dissolved pores, and intergranular dissolved pores.In the later stage, weak dissolution is dominant, mainly dissolution pores, intergranular pores, and intercrystalline dissolution pores.Main types include intercrystalline micropores, intergranular micropores, and matrix micropores formed by weak matrix dissolution in the late stage.
Table 3. Statistical table of model evaluation parameters.
Name of ParameterPrecision RateRecall RateF1 Value
Large-scale0.84610.917
Small-scale0.90.8180.857
Micro-scale0.7780.70.737
Table 4. Confusion matrix.
Predicted Sample SizeLarge-ScaleSmall-ScaleMicro-Scale
Large-scale1100
Small-scale092
Micro-scale217
Table 5. Statistical table of recognition accuracy.
Scale CategoryNumber of Validation SamplesBayes MethodCrossplot Method
Number of IdentificationsScale Accuracy(%)Total Accuracy(%)Number of IdentificationsScale Accuracy(%)Total Accuracy(%)
Large-scale111110084.38872.7359.38
Small-scale11981.82763.64
Micro-scale10770440
Disclaimer/Publisher’s Note: The statements, opinions and data contained in all publications are solely those of the individual author(s) and contributor(s) and not of MDPI and/or the editor(s). MDPI and/or the editor(s) disclaim responsibility for any injury to people or property resulting from any ideas, methods, instructions or products referred to in the content.