Article

Upcycling of Date Fruit By-Products from Bioethanol Production: Structural Characterization of Polysaccharides and Phenolic Compounds


1
Pharmaceutical and Nutraceutical Section, Department of NEUROFARBA (Department of Neuroscience, Psychology, Drug Research and Child Health), University of Florence, Via Ugo Schiff 6, Sesto Fiorentino, 50019 Florence, Italy
2
Phytolab (Pharmaceutical, Cosmetic, Food Supplement, Technology and Analysis) Research Unit, University of Florence, Via Ugo Schiff 6, Sesto Fiorentino, 50019 Florence, Italy
3
Department DAGRI (Agricultural, Food and Forestry Systems Management), University of Florence, Via Donizetti, 50141 Florence, Italy
4
Department DISIA (Department of Statistics, Computer Science, Applications “G. Parenti”), University of Florence, Via Ugo Schiff 6, Sesto Fiorentino, 50019 Florence, Italy
5
Istituto di Agronomico Mediterraneo, CIHEAM, Via Ceglie, 9, Valenzano, 70010 Bari, Italy
*
Author to whom correspondence should be addressed.
Processes 2026, 14(6), 948; https://doi.org/10.3390/pr14060948
Submission received: 30 January 2026 / Revised: 6 March 2026 / Accepted: 13 March 2026 / Published: 16 March 2026
(This article belongs to the Special Issue Biofuels Production Processes)

Abstract

Date palm (Phoenix dactylifera L.) by-products from bioethanol production represent an underutilized resource rich in bioactive molecules. This study aims to their valorization through characterization of polysaccharides and phenolic compounds from the Medjool variety, both before and after yeast fermentation for bioethanol production. Three sequential types of by-products were analyzed—Ext1 (post hot-extraction), Ext2 (post fermentation), and Ext3 (post distillation)—and compared with Dat-Me. High Performance Liquid Chromatograp-Diode Array Detector-Mass Spectrometry (HPLC-DAD-MS) analysis allowed identifying 22 phenolic compounds, primarily cinnamic acid derivatives and glycosylated flavones such as luteolin and chrysoeriol. Fermentation increased total phenolic content from dry weight, while leading to an improved polysaccharide recovery (i.e., from 14.2% to 42.1% dry weight). Two polysaccharide fractions (F1 and F2) were isolated and characterized by 1H-NMR and Dynamic Light Scattering (DLS). F1 is a pectic polysaccharide, with a galacturonic acid content ranging from 24.2% (Ext3) to 52.2% (Dat-Me), a degree of methylation (DM) between 34.4 and 50.6%, and a degree of acetylation (DA) of 23.6–42.2%. F2 consists of a non-pectic polysaccharide, characterized by a low galacturonic acid content (5.6–6.8%) and a DM of 12.6–47.1%, but it is highly acetylated, with a DA ranging from 90.1 to 93.3%. DLS analysis confirmed fermentation-induced depolymerization, with molecular weights ranging from 6.6 × 10⁴ to 8.5 × 10⁵ KDa for both the fractions. Overall, Medjool date by-products obtained after bioethanol production represent a sustainable source of high-value phenolic antioxidants and polysaccharides with different structures suitable for future applications in food, pharmaceutical, and cosmetic formulations.

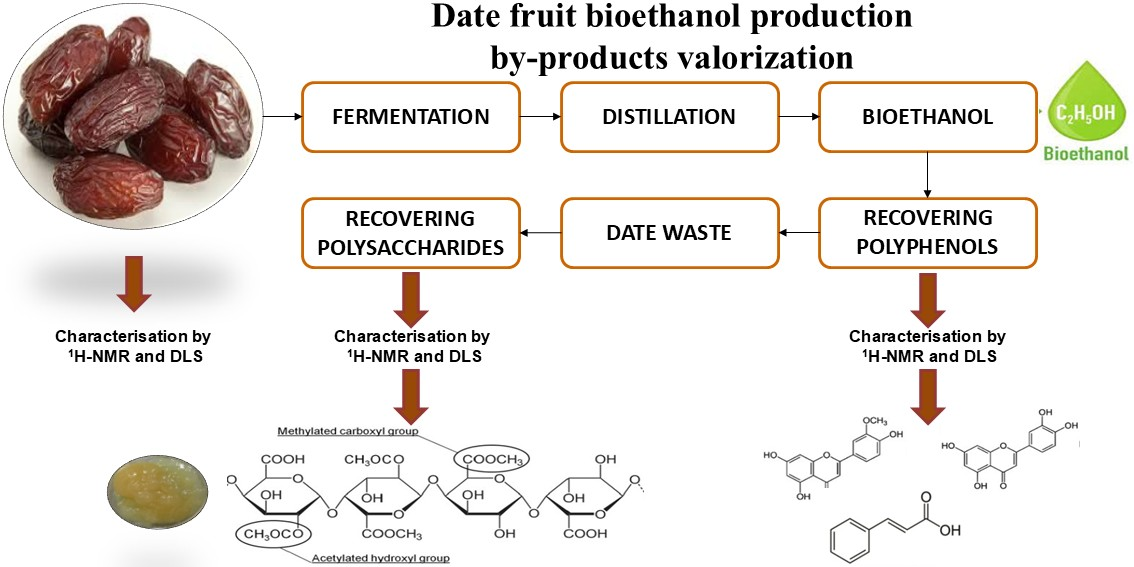
Graphical Abstract

1. Introduction

The date palm (Phoenix dactylifera L.) belongs to the Arecaceae family, which includes around 200 genera and more than 2500 species [1]. Date palm was domesticated in Mesopotamia between 3000 and 4500 B.C., and it is considered one of the oldest cultivated plants in human history [2,3]. Today, the Food and Agriculture Organization (FAO) recognizes date palm fruit as a staple food in Arab and Middle Eastern countries. Global production increased from 8.4 million metric tons in 2017 to 9.66 million metric tons in 2023, with Arab nations contributing approximately 75% of the total output [3,4]. Among the many different varieties, Medjool (Phoenix dactylifera L., cv. Medjool) is one of the most commercially valuable date cultivars worldwide, characterized by large fruit size, soft texture, and high sugar content. Native to Morocco’s Tafilalet region, Medjool is now cultivated in major arid production zones, including Egypt, California, and Mexico [5].
Today, the rising global demand for dates is driven not only by their taste but also by their well-documented health benefits. These include anti-hyperglycemic, anti-inflammatory, anti-hyperlipidemic, antioxidant, anti-angiogenic, antibacterial, and hepatoprotective properties [6]. The recent expansion of the date industry has led to the generation of significant volumes of by-products, such as off-grade fruits, seeds, leaves, and stems generated during cultivation and processing. Date fruit processing wastes can reach several tons/year, and it is estimated that up to 20% of the annual production of date fruits can be lost during the post-harvest process [7]. These materials represent valuable feedstock for animal feed and biorefinery applications. Date by-products are particularly rich in fermentable sugars (comprising 60–70% carbohydrates, mainly glucose, fructose, and sucrose), as well as dietary fibers (including pectin, hemicelluloses, and lignin). Bioethanol production is a key valorization pathway, efficiently utilizing the sugar content of date waste. Recent studies have demonstrated the multifunctional potential of date by-products beyond bioethanol production, including applications in food preservation, nutraceuticals, bio-based packaging, and functional food ingredients, highlighting their versatility in integrated biorefinery systems [8]. Specifically, date pomace serves as a functional ingredient for food fortification at optimal levels: 10–15% in bread, 2–4% in yogurt, and 10% in chocolate cake. These additions increase dietary fiber, antioxidant content, and texture while preserving sensory quality [3].
A wide range of bioactive compounds, including phenolic acids (e.g., gallic, protocatechuic, p-hydroxybenzoic, vanillic, syringic, ferulic, caffeic, p-coumaric acids) and flavonoids (e.g., quercetin, kaempferol glycosides, apigenin derivatives, catechin), with demonstrated potential in food preservation and bio-based packaging systems, were found in date by-products [3,8,9,10]. An amount of 7 to 10% of total polysaccharides was also found in date fruit [10,11]. However, these compounds have been scarcely investigated in date by-products, also considering their potential activities. Different natural polysaccharides have shown good stability, safety, biocompatibility, biodegradability, and several bioactivities, including immunomodulatory, antioxidant, prebiotic, anti-diabetic, and anti-inflammatory properties [12]. Despite growing interest in date by-product valorization, significant knowledge gaps persist, specifically, the structural characterization of polysaccharides and phenolic compounds in date by-products remains poorly understood. Co-extraction of polysaccharides and phenols from date by-products creates multiple value streams, improving both economic feasibility and sustainability. Characterization of their composition and functionality is essential for effective strategies to enhance the circular bioeconomy.
The aim of this research was to characterize the chemical composition of polysaccharides and phenolic compounds in date fruit by-products from the bioethanol production using discarded Medjool fruits, and to evaluate the effects of the hot extraction, fermentation and distillation. To this end, Medjool date flesh (Dat-Me) was used as a reference to evaluate compositional changes during the phases of bioethanol production. Three sequential by-products were analyzed: Ext1 (post-warm-up), Ext2 (post-fermentation), and Ext3 (post-distillation). The phenolic composition was determined using HPLC-DAD and HPLC-MS, and antioxidant capacity was determined by the Folin–Ciocalteu at different bioethanol production stages. For the polysaccharides, structural information was acquired using Dynamic Light Scattering (DLS) and 1H NMR spectroscopy, with both techniques applied both before and after chemical hydrolysis.

2. Results and Discussion

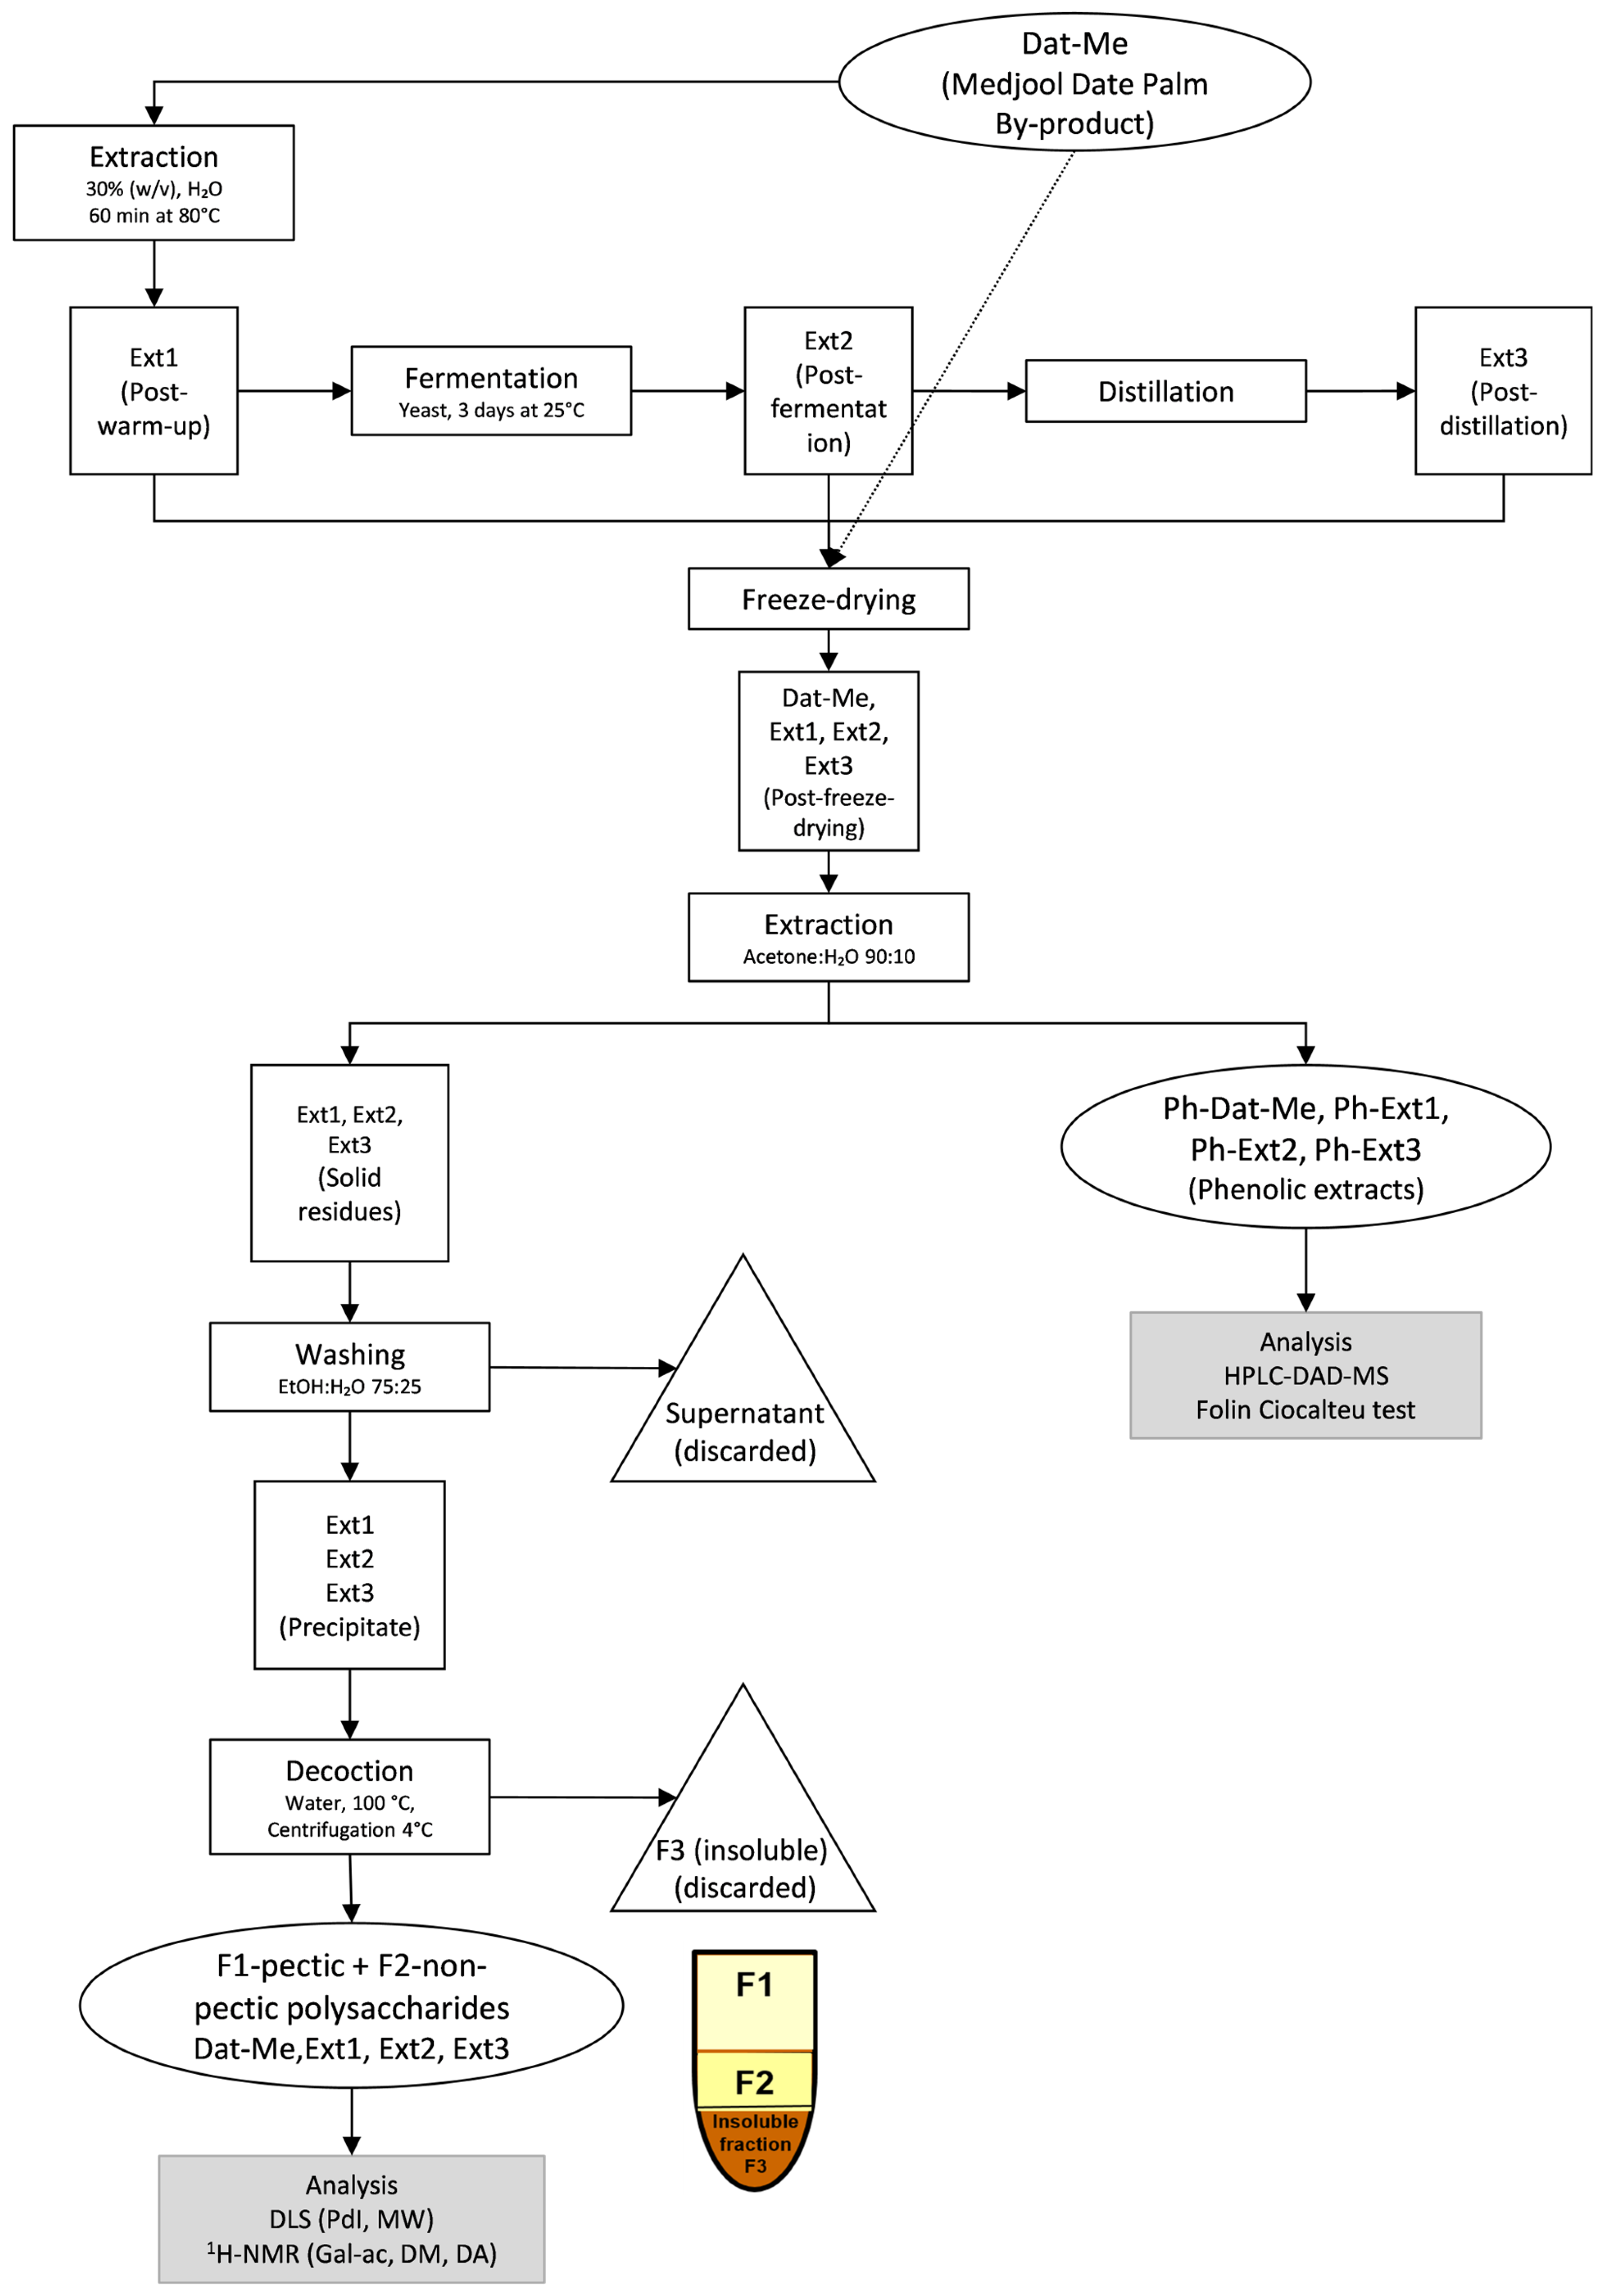
This study provides new insight into the compositional and structural evolution of bioactive compounds within an integrated biorefinery framework. The study aimed to valorize phenolic compounds and polysaccharides derived from Medjool date fruit by-products through bioethanol production and post-fermentation residue recovery. The combined recovery of bioethanol, phenols, and structurally characterized polysaccharides represents an innovative and sustainable valorization strategy aligned with circular bioeconomy principles. Previous research has explored the extraction of bioactive compounds from date fruit residues [3]; however, the combined effects of fermentation and distillation on both phenolic compounds (Ph) and polysaccharides (Ps) in date fruit remain largely unexplored. The experimental design included the Dat-Me (reference sample) and three sequential extracts (Ext1, Ext2, Ext3), representing key stages of industrial bioprocessing. To our knowledge, this is the first study to assess compositional changes in phenols and polysaccharides induced by fermentation and distillation. The overall scheme describing the steps applied to obtain the three extracts, as well as their phenolic and polysaccharide fractions, is shown in Figure 1.

2.1. Phenolic Compounds Characterization

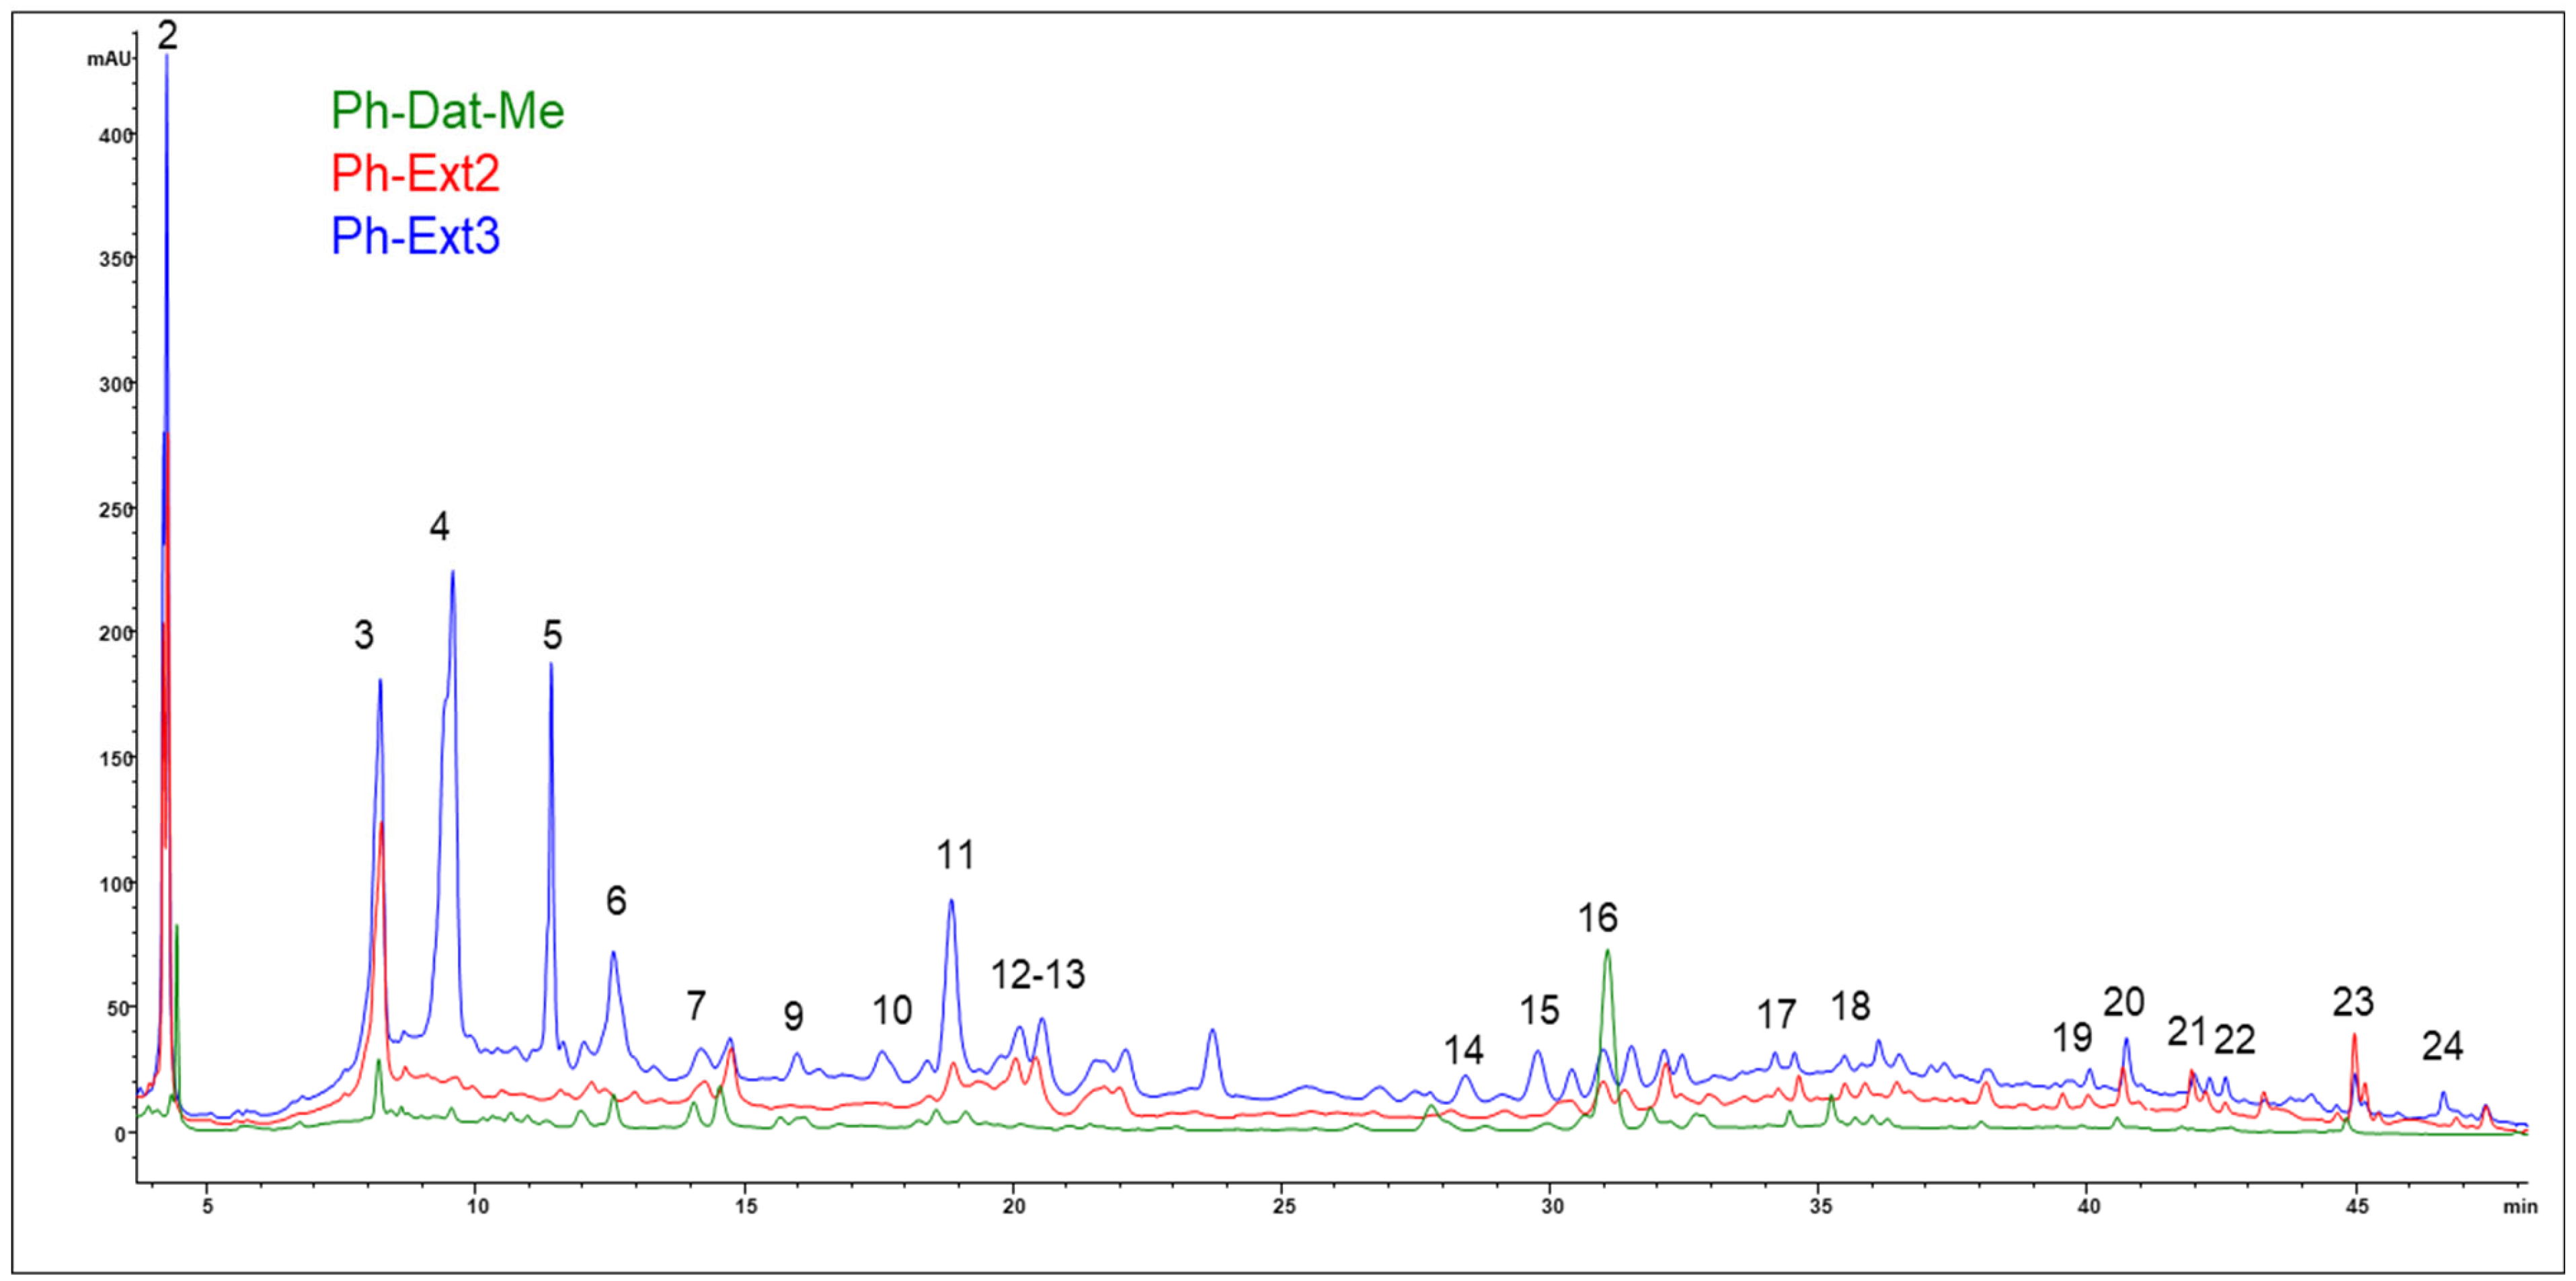
The Dat-Me sample presented a moisture content of 24.1%, consistent with typical values for semi-dried dates [10]. All extracts (Ext1, Ext2, Ext3) were freeze-dried for standardization before analysis. Phenolic compounds were extracted using 90% acetone, an optimized solvent system that maximizes phenolic recovery while minimizing sugar co-extraction [10,13]. HPLC-DAD-MS analysis allowed identifying 22 phenolic compounds in the fresh date fruit by-products, including cinnamic acid derivatives and glycosylated flavones such as luteolin and chrysoeriol (Table 1). The HPLC-DAD chromatograms of Ext1 and Dat-Me exhibited highly similar phenolic compositions, with all major compounds preserved after hot extraction (80 °C, 30 min), indicating the stability of principal phenolic constituents under mild processing conditions; therefore, Ph-Ext1 was not included in Figure 2 and Table 1 due to its similarity with Ph-Dat-Me. The chromatographic profiles at 330 nm for fresh date flesh and extracts (Ext2–Ext3) are shown in Figure 2. Fermentation induced significant compositional changes (Ph-Ext2), with several phenolic compounds (peaks 2–3 and 16) undergoing biotransformation or degradation. This compositional shift is evidence of microbial enzymatic activity, which favors the accumulation of free forms [14], such as catechin isomers (peaks 2). A clear example of bioconversion is the reduction in the abundance of ferulic acid (peak 16), which is consistent with the activity of yeast-derived phenolic acid decarboxylase. This enzyme converts hydroxycinnamic acids into less polar, volatile vinyl and ethyl derivatives [15,16]. The distillation process (Ext3) further modified the phenolic fingerprint, with several new peaks appearing in the final residue, suggesting formation of new phenolic derivatives (peaks 4–5). In contrast to the degradation observed for ferulic acid (peak 16), flavonoids (peaks 19–24) accumulated in the final residue, indicating differential stability or concentration effects during distillation. Due to the presence of some unidentified compounds (Table 1), total phenolic content (TPC) was determined using the Folin–Ciocalteu assay, expressing results as gallic acid equivalents (mg GAE/g dry extract, DE). This approach is widely used for complex biomasses and food processing by-products [17,18,19,20,21].

2.2. Total Phenolic Content by Folin–Ciocalteu Assay

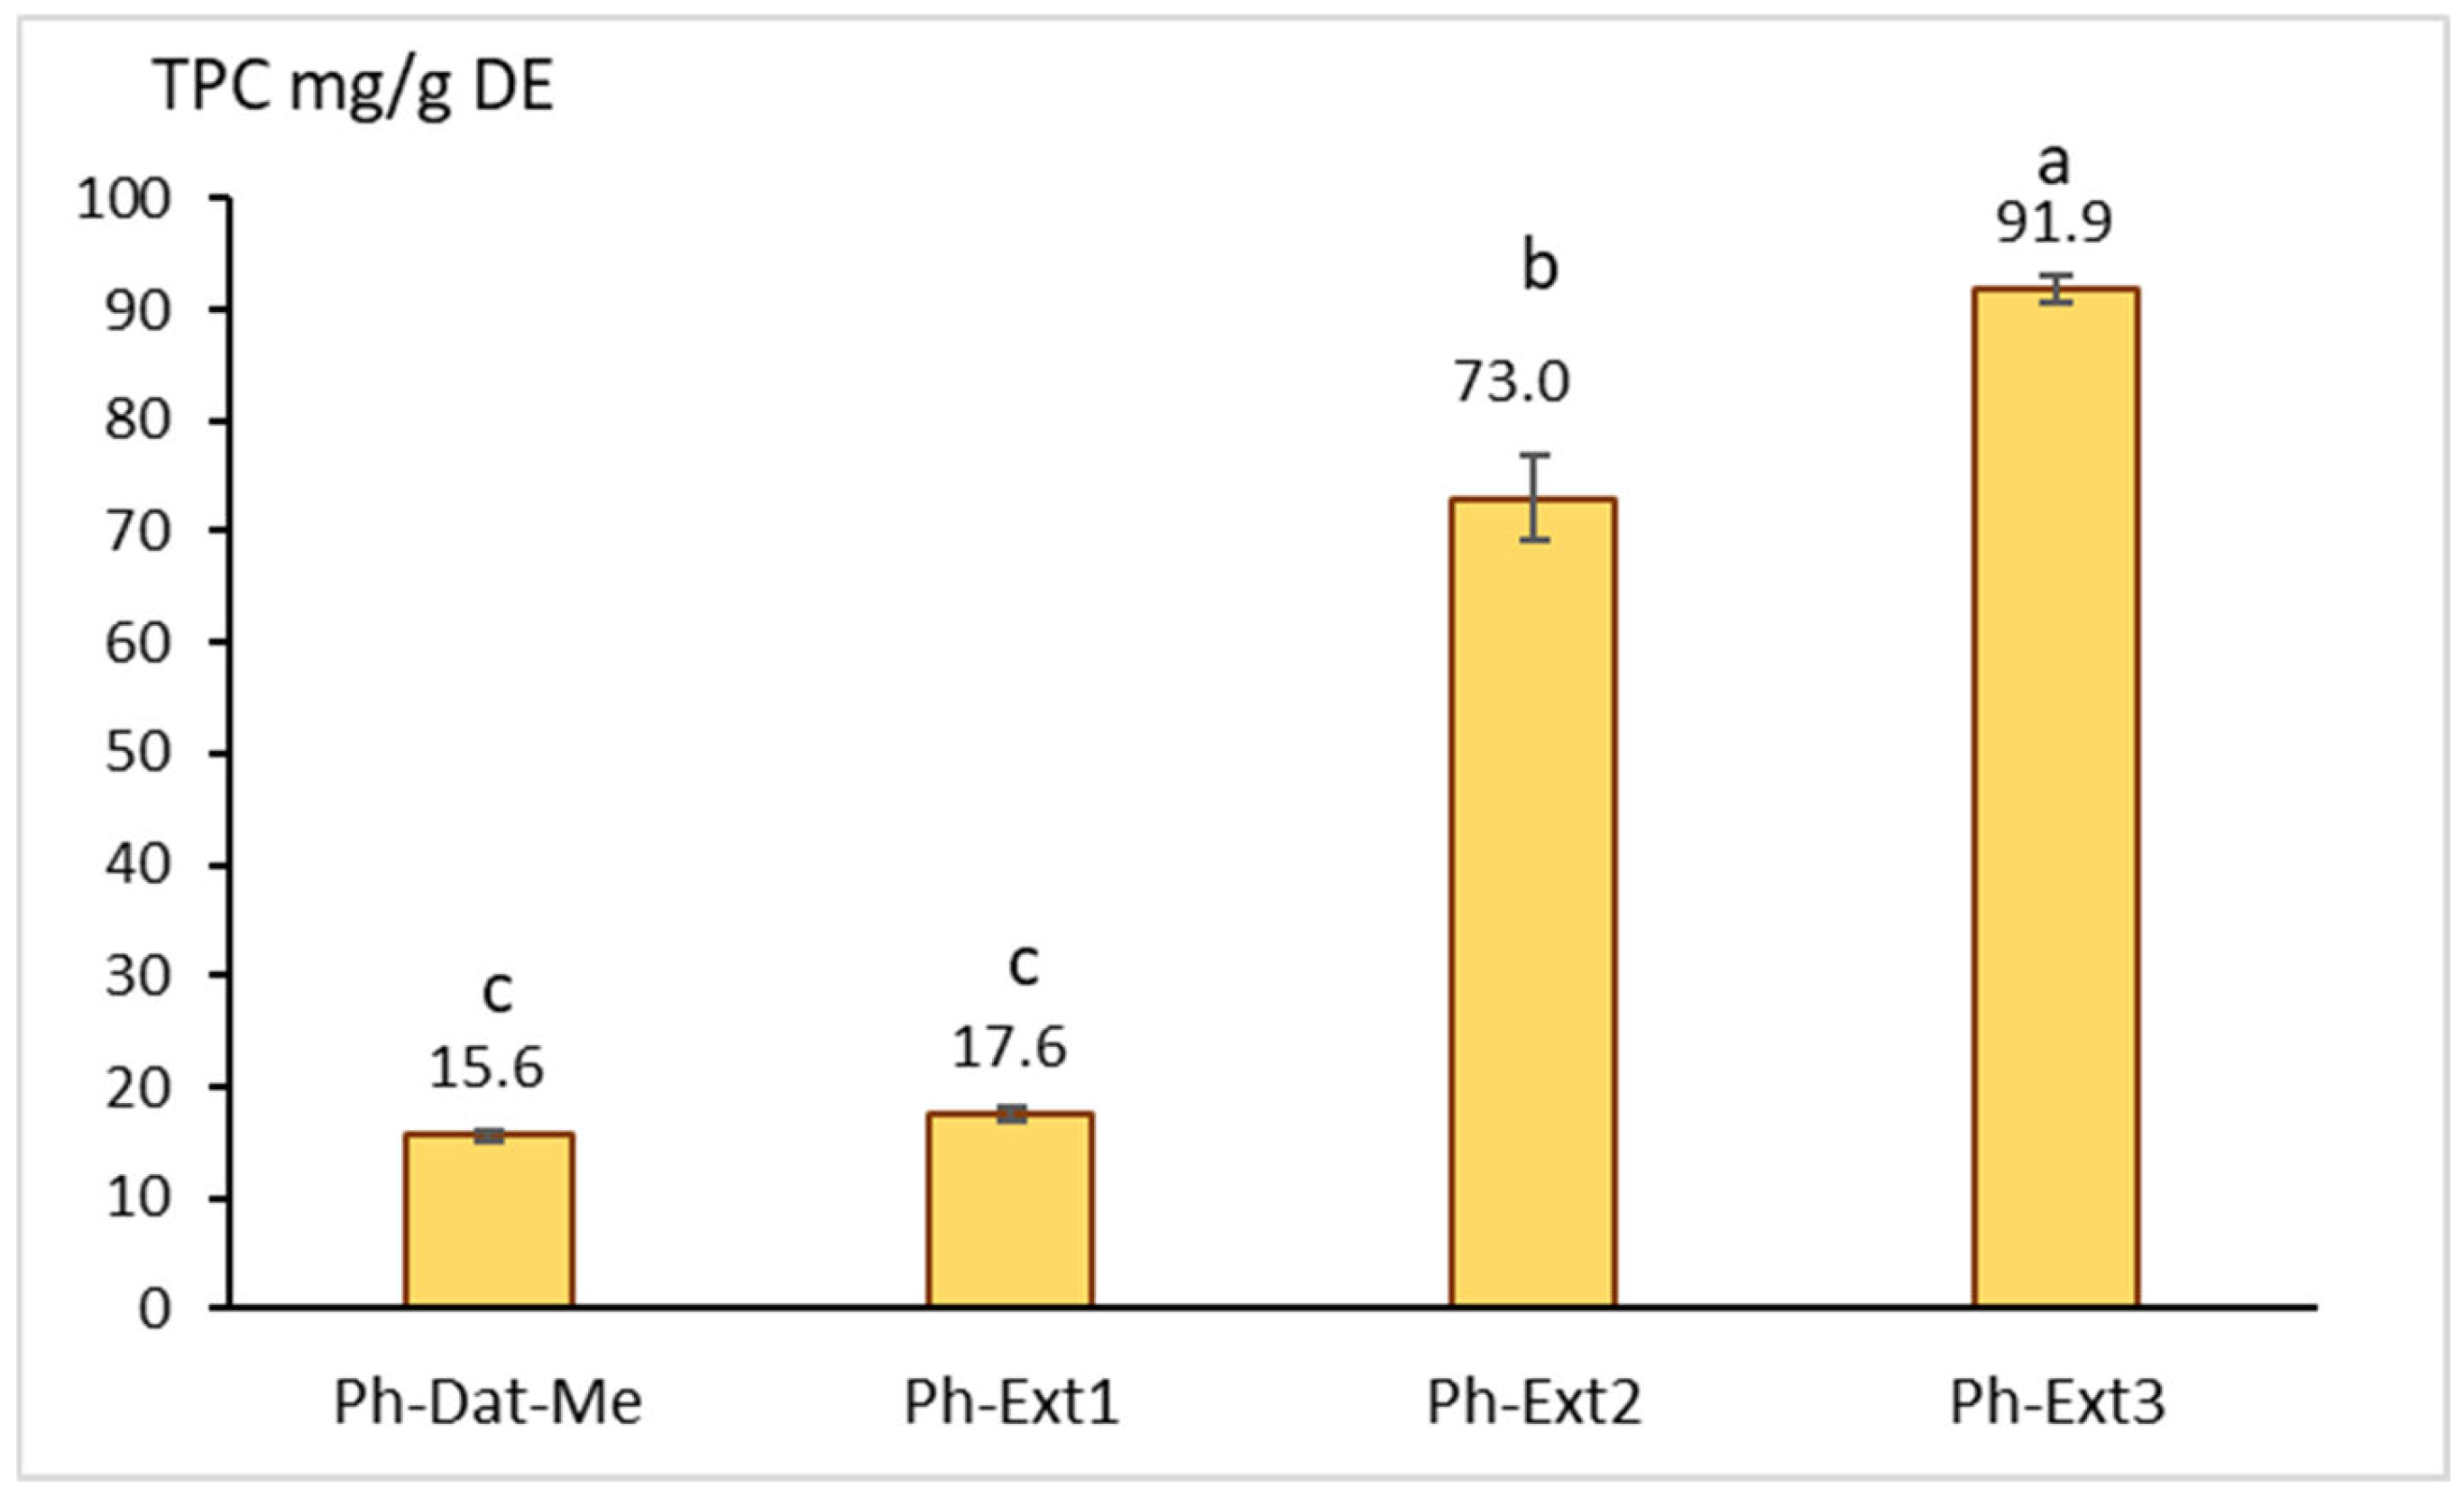
Total phenolic content (TPC), expressed as mg GAE/g dry extract (DE), showed marked differences across the various processing stages (Figure 3). The initial date by-products (Dat-Me) and Ph-Ext1 showed relatively low TPC, ranging from 15.6 to 17.6 mg GAE/g. This low TPC can be attributed to the higher complexity of the starting material, which may lead to the co-extraction of a greater amount of non-phenolic compounds, thereby increasing the overall dry weight of the extract. Consequently, these less processed/purified samples likely contain a higher proportion of these co-extracted substances, resulting in comparatively lower TPC values [17]. Following fermentation and distillation, TPC increased substantially in Ph-Ext2 and Ph-Ext3, reaching 73.0 (4.7-fold increase) and 91.9 (5.9-fold increase) mg GAE/g DE, respectively. Fermented extracts (Ph-Ext2 and Ph-Ext3) showed significantly higher TPC values compared with non-fermented samples (Ph-Dat-Me and Ph-Ext1), with no significant differences within each group. This increase can be attributed to multiple factors: (i) depletion of interfering compounds during fermentation; (ii) the release of bound phenolic compounds from glycosidic linkages and cell wall polysaccharides during fermentation, mediated by microbial β-glucosidases, cellulases, and esterases [14,22]; and (iii) relative increase in concentration of phenolic compounds following ethanol removal by distillation [23]. Individual phenolic compound profiling by HPLC-DAD provided complementary insights into specific compositional changes across processing stages (Table 1). The analysis confirmed a significant increase in free phenolic acids, especially protocatechuic acid and catechin isomers, in post-fermentation extracts (Ph-Ext2 and Ph-Ext3) compared to the initial sample (Ph-Dat-Me). This observed enhancement in TPC following fermentation and distillation aligns with previous findings reported by Adebo, Gabriela and Al-Habsi [3,23].
Table 1. Phenolic compounds (Ph) from Dat-Me, Ext2 and Ext3, tentatively identified by MS spectra in negative ionization mode and the literature. Relative abundance is based on HPLC-DAD peak area: +, ++ and +++ low, medium and high intensity, respectively. Ph-Ext1 is not included because it is very similar to Ph-Dat-Me.
NRt (min)Compound[M − H]Fragment IonsPh-Dat-MePh-Ext2Ph-Ext3References
13.94Syringic acid hexoside359197+++[24]
24.01Catechin isomer289245, 179, 137, 125++++++[3]
37.98Not identifiedndnd++++++-
49.09Not identifiedndnd+++++++-
511.12Protocatechuic acid153109+++++[3]
612.51Caffeic acid hexoside341179++++[24]
713.89Di-caffeoyl shikimic acid497341, 335, 179+--[24]
814.08p-Coumaroyl hexose325163 [25]
915.99Di-caffeoyl shikimic acid-der1497335, 179++++[24]
1017.7Sinapic acid hexoside385223, 179+++[26]
1118.89Apigenin dihexoside593431, 269++++++[26]
1220.59Caffeoylshikimic acid355255, 179+++++[24]
1320.98Caffeoylquinic acid lactone335179+++++
1428.5Apigenin dihexoside- der1593431, 269+++++[26]
1529.8p-coumaric acid163119 [3]
1631.02Ferulic acid193178, 134+++++[3]
1732.853-methyl-isorhamnetin-7-O-hexosyl(6-sulfate)477329+++++[27]
1834.89Rutin609301+++
1939.89Luteolin-7-O-hexosyl(6-sulfate)527285+++++[27]
2041.05Luteolin-7-O-hexosyl(6-sulfate)527285+++++[27]
2142.053-methyl-isorhamnetin-7-O-hexosyl (6-sulfate477329+++[27]
2242.92Isoquercetrin sulfate543301+++++[25,26]
2345.01Chrysoeriol hexoside sulfate541299+++++[27]
2447.523-methyl-isorhamnetin-7-O-hexosyl(6-sulfate) der1477329+++++[27]

2.3. Extraction and Yield of Polysaccharides

Date palm fruit is a rich source of polysaccharides. These polysaccharides exhibit antioxidant, anti-glycation, chemopreventive, prebiotic, and gelling properties, which make them attractive candidates for food, pharmaceutical, and cosmetic formulations [10,11]. A widely recognized method for isolation of polysaccharides from various matrices involves hot water extraction to solubilize the polymers, followed by subsequent precipitation using ethanol [28,29]. However, when applied to raw date fruit and its by-products, this approach encounters a significant technical barrier: the exceptionally high monosaccharide content (60–75% of dry weight) co-extracts with target polysaccharides, requiring extensive purification. Within a circular bioeconomy framework, bioethanol fermentation of dates offers an innovative solution to this challenge. The fermentation process selectively converts low-molecular-weight sugars into bioethanol for biofuel production, reducing the monosaccharide content from 60 to 75, resulting in solid residue traditionally considered a waste that emerges as a naturally pre-purified matrix enriched in complex polysaccharides and dietary fibers.
As shown in Figure 1, the solid residue remaining after phenolic compound extraction, comprising both soluble and insoluble dietary fibers, was subjected to hydroalcoholic treatment (EtOH:H2O 75:25 v/v) for 2 h to remove residual low molecular weight interfering substances, including monosaccharides and organic acids, following established protocols [10,30]. The solid residue obtained after centrifugation (5000 rpm, 8 min, 4 °C) was subjected to hot water extraction to extract the polysaccharides.
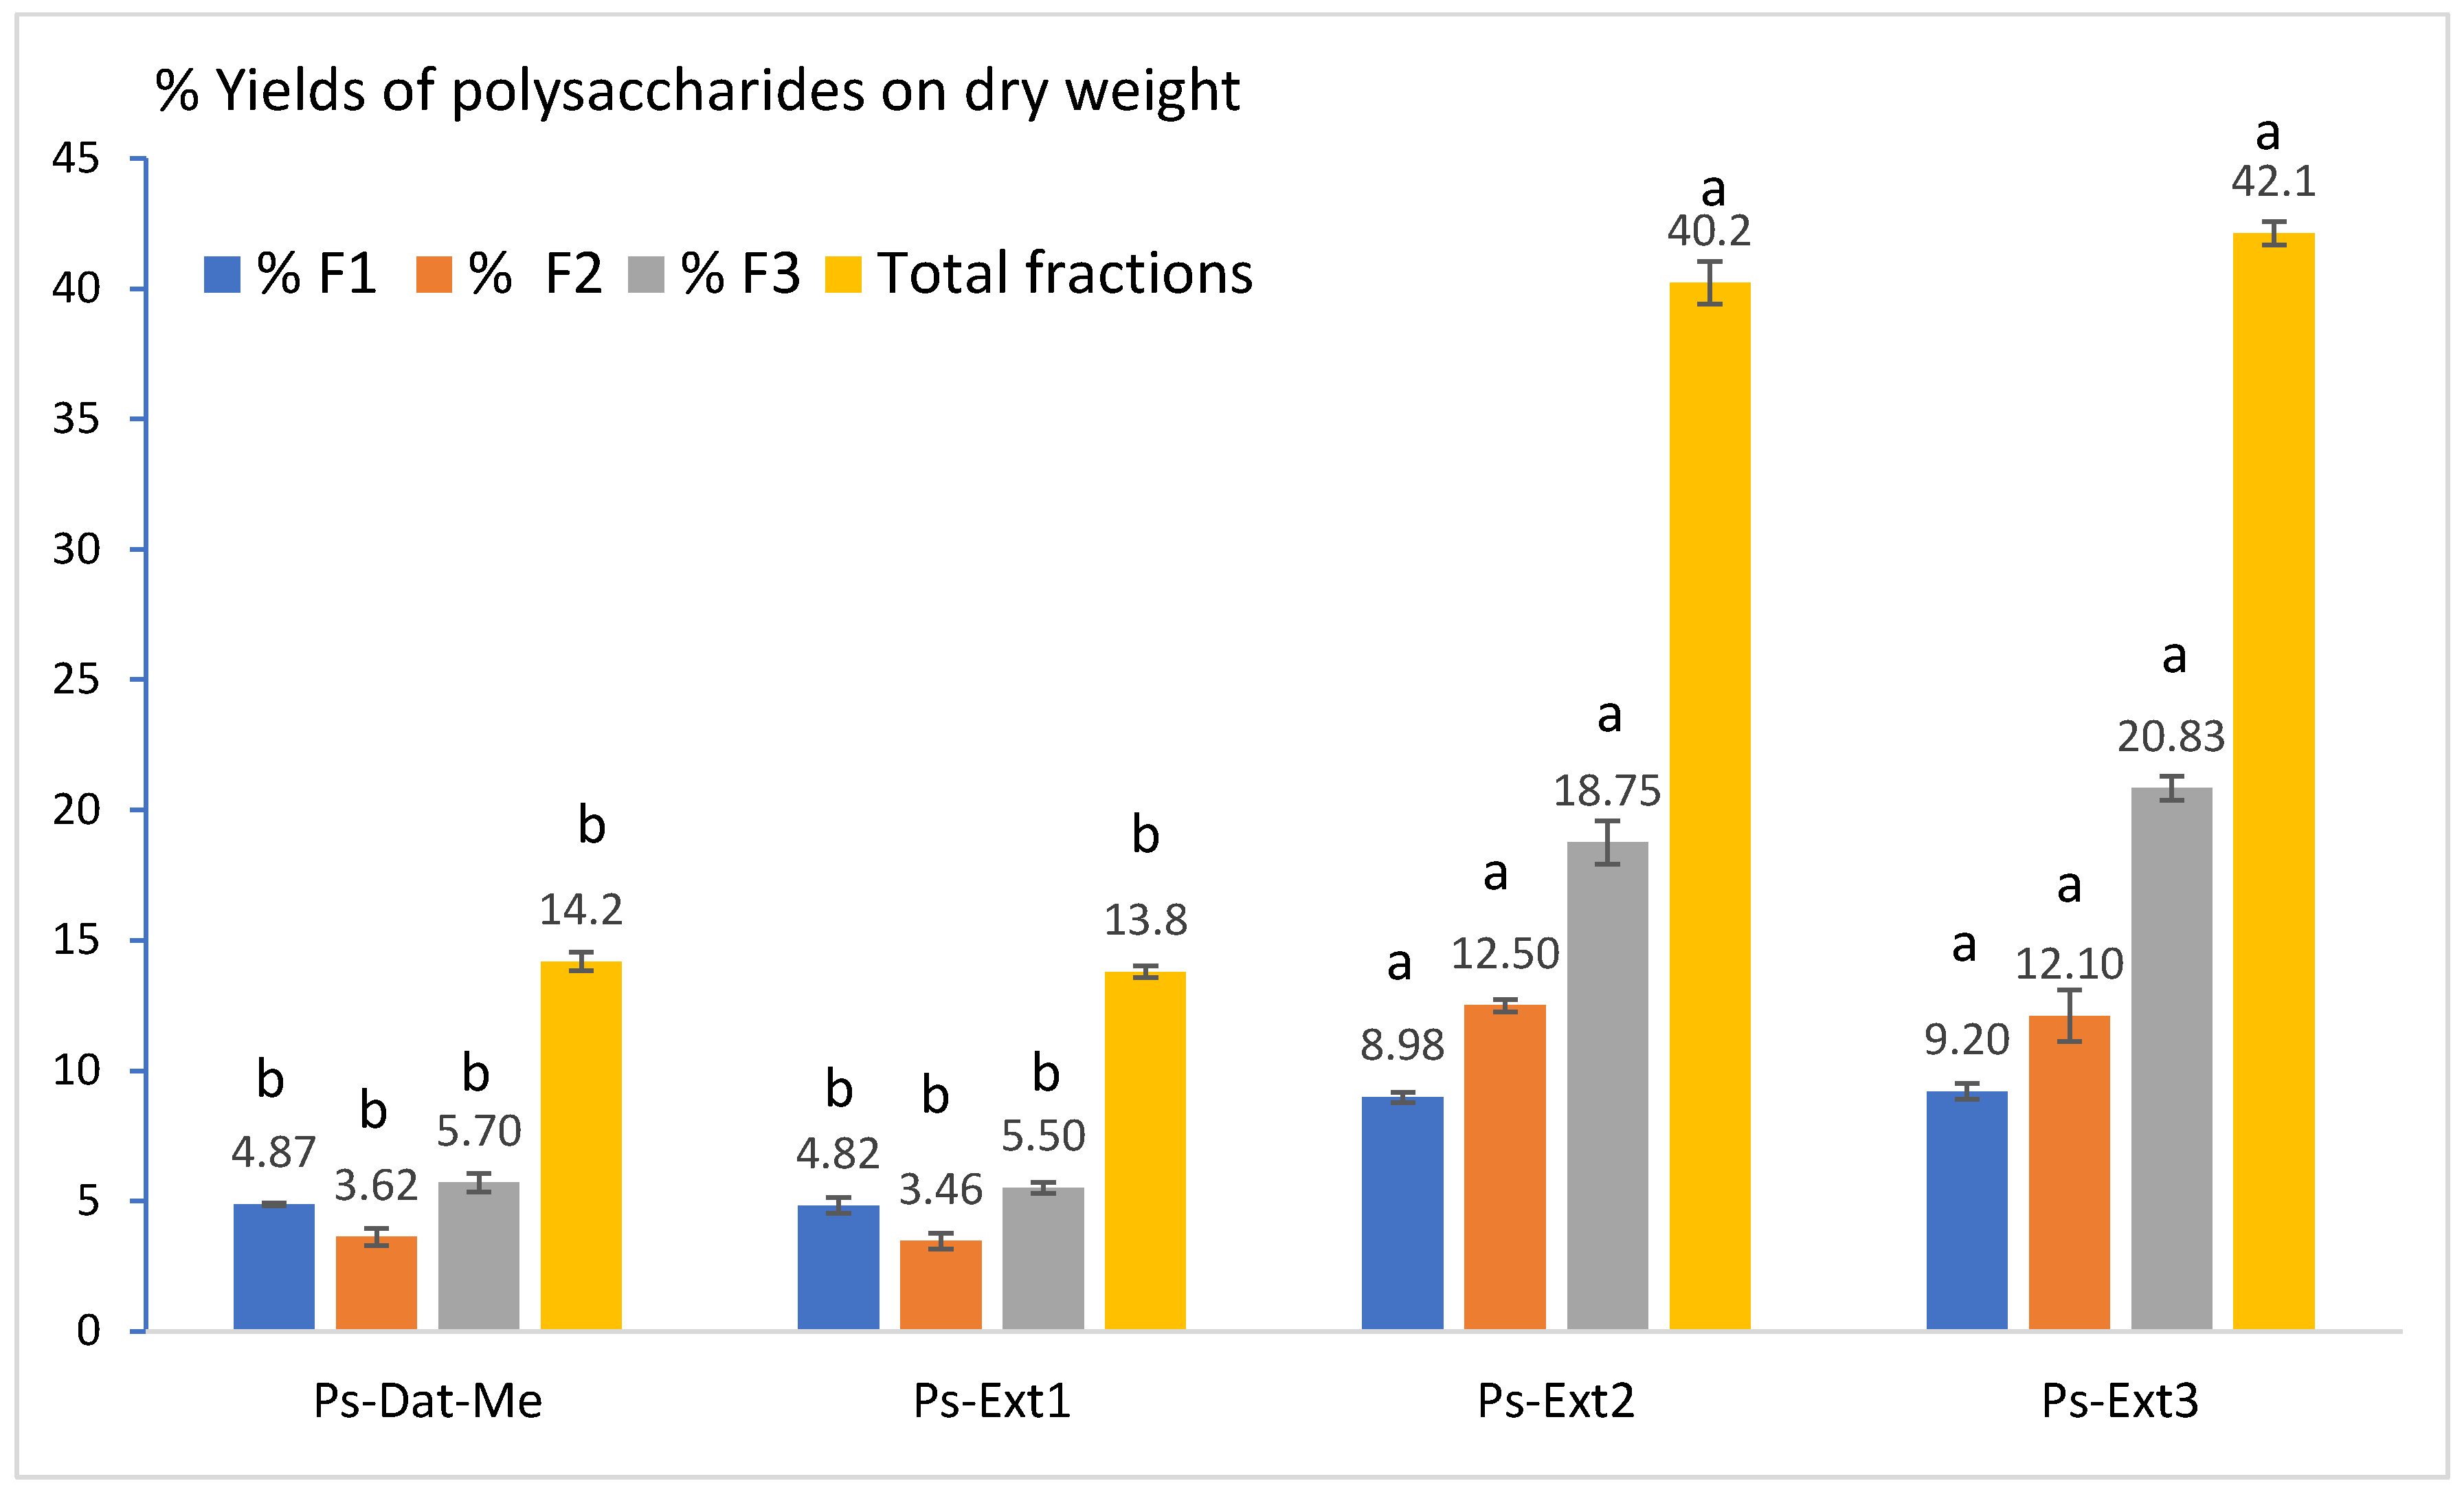
Polysaccharide fractions were recovered through sequential extraction and centrifugation steps. This approach allowed the direct recovery of two distinct polysaccharide fractions (F1 and F2) and one insoluble residue (F3), for each sample (without the need for ethanol-induced precipitation) [10]. According to the literature, F3 can be hypothesized to consist predominantly of cellulose and lignin as components of the insoluble fiber [10,31]; indeed, Shafiei et al. [31] reported 49.9% lignin and 20.9% insoluble polysaccharides in date fruit, confirming that F3 represents the recalcitrant lignocellulosic fraction resistant to hot-water extraction. All three fractions (F1–F3) were freeze-dried to determine their respective yields, with significant variation among samples, as summarized in Figure 4. Raw date fruit (Dat-Me) and its initial aqueous extract (Ext1) showed comparable total contents of 14.2% and 13.8% on dry weight, respectively, with fractions F1, F2, and F3 similarly distributed. In contrast, the fermentation residues (Ext2, Ext3) achieved substantially higher recovery: total polysaccharide fractions reached 40.5% and 42.1% (approx. 3-fold increase), with fractions F1, F2, and F3 similarly distributed between Ps-Ext2 and Ps-Ext3. Statistically, polysaccharides in fermented samples Ps-Ext2 and Ps-Ext3 showed significantly higher extraction efficiency than Ps-Dat-Me and Ps-Ext1 (p ≤ 0.05), with no significant difference within each group. This improvement has been attributed to a selective monosaccharide depletion during fermentation (60–75%), which concentrates the non-fermentable polysaccharides. Fractions F1 and F2 were further characterized using Dynamic Light Scattering (DLS) and nuclear magnetic resonance (NMR) spectroscopy.

2.4. Analysis of Polysaccharides by Dynamic Light Scattering

Dynamic Light Scattering (DLS) was employed to evaluate the hydrodynamic volume of the polysaccharide fractions extracted from the different samples to provide valuable information on molecular size, shape, and distribution in solution. The presence of one or multiple peaks in the DLS intensity distribution profiles reflects the degree of sample homogeneity or polydispersity in terms of molecular size distribution. Results are summarized in Table 2 for F1 and F2 fractions; the F3 fractions were not analyzed because of their water insolubility. Fraction F1 showed distinct behavior between the Dat-Me and fermented extracts, indicating fermentation-induced structural modifications in polysaccharides. The PdI values of the F1 fractions ranged from 0.23 to 0.39, indicating a relatively homogeneous molecular size across all samples. These values are comparable to those reported for date polysaccharide fractions from Saudi Arabian varieties, where F1 fractions exhibited PdI values of 0.17–0.28 [10]. Specifically, F1 of Ps-Dat-Me, Ps-Ext1, and Ps-Ext2 exhibited the lowest range of PdI values (0.23–0.28), indicating narrow size distributions. F1 of Ps-Ext3 showed relatively higher PdI (0.39), suggesting a less uniform molecular size distribution. This different homogeneity of fractions F1 was confirmed by the area percentage values of the main peak (Pk1): Dat-Me, Ps-Ext1, and Ps-Ext2 showed Pk1 area percentages close to 99%, while Ps-Ext3 exhibited a slightly lower value of 95.9%, indicating the presence of minor components. Ps-Dat-Me and Ps-Ext1 showed comparable Z-averages (270 ± 5.9 nm and 265.7 ± 6.9 nm), while Ps-Ext2 was smaller (229.7 ± 1.6 nm) and Ps-Ext3 was larger (311 ± 13 nm). In contrast, fermented samples exhibited different sizes: 229.7 ± 1.6 nm (Ps-Ext2) and 311 ± 13 nm (Ps-Ext3).
In contrast to F1, the F2 fractions exhibited greater heterogeneity in their composition, as evidenced by the high range values of PdI (0.73–0.8). This increased polydispersity was confirmed by the lower area percentage values of the main peak (Pk1). At the same time, Fractions 2 of Ps-Dat-Me and Ps-Ext1 maintained relatively high Pk1 area percentages (87% and 88%, respectively), while that of fermented samples Ps-Ext2 and Ps-Ext3 showed markedly reduced values (53.4% and 77%). Furthermore, the F2 fractions of Ps-Ext2 and Ps-Ext3 were notably less homogeneous and characterized by the presence of multiple polysaccharide populations. In Ps-Ext2, the secondary peaks (Pk2 and Pk3) accounted for 14.4% and 25% of the total area, respectively, and in Ps-Ext3, Pk2 and Pk3 represented 6.1% and 16.8%. The Z-average values for F2 fractions showed marked variability, ranging from 173 to 175 nm for Dat-Me and Ps-Ext1, to significantly higher values of 356–595 nm for Ps-Ext2 and Ps-Ext3, respectively. Similar Z-average values (237–484 nm) have previously been reported for date polysaccharide fractions [10].
These increases were accompanied by the emergence of additional polysaccharide populations: large aggregates in Pk2 (4603–5340 nm) detected in all F2 fractions, and smaller components in Pk3 (97.6–135 nm) present in Ps-Ext2 and Ps-Ext3. These changes suggest that fermentation induced both polysaccharide fragmentation (as evidenced by the reduced Pk1 area percentage) and aggregation phenomena in water solution (as indicated by the presence of Pk2 and Pk3 with larger hydrodynamic diameters).
The estimated MW values for Pk1 ranged from 6.6 × 10⁴ to 5.11 × 10⁵ kDa in F1 fractions. These values are comparable with the range reported by Yang et al. (2018) [32] for potato pectin characterized by DLS (2.43 × 10⁴ to 1.87 × 10⁶ g/mol). In F2, fermentation decreased for MW, from 8.5 × 10⁵ kDa for Dat-Me and Ps-Ext1 to 6.3–6.6 × 10⁴ kDa for Ps-Ext2 and Ps-Ext3, respectively, suggesting significant polysaccharide depolymerization during the fermentation process. Similar fermentation-induced molecular weight reductions have been widely documented for polysaccharides from various plant sources [33]. Overall, DLS analysis revealed that fermentation (Ps-Ext2) and distillation (Ps-Ext3) exerted distinct effects on polysaccharide structure compared to native polysaccharides in Dat-Me. Fermentation induced severe depolymerization in both F1 and F2 fractions, accompanied by the emergence of new polysaccharide populations. Distillation promoted aggregation, particularly in F2, where the Z-average increased substantially in both fractions, while maintaining the reduced molecular weights from fermentation.

2.5. 1H-NMR Analyses of Polysaccharides

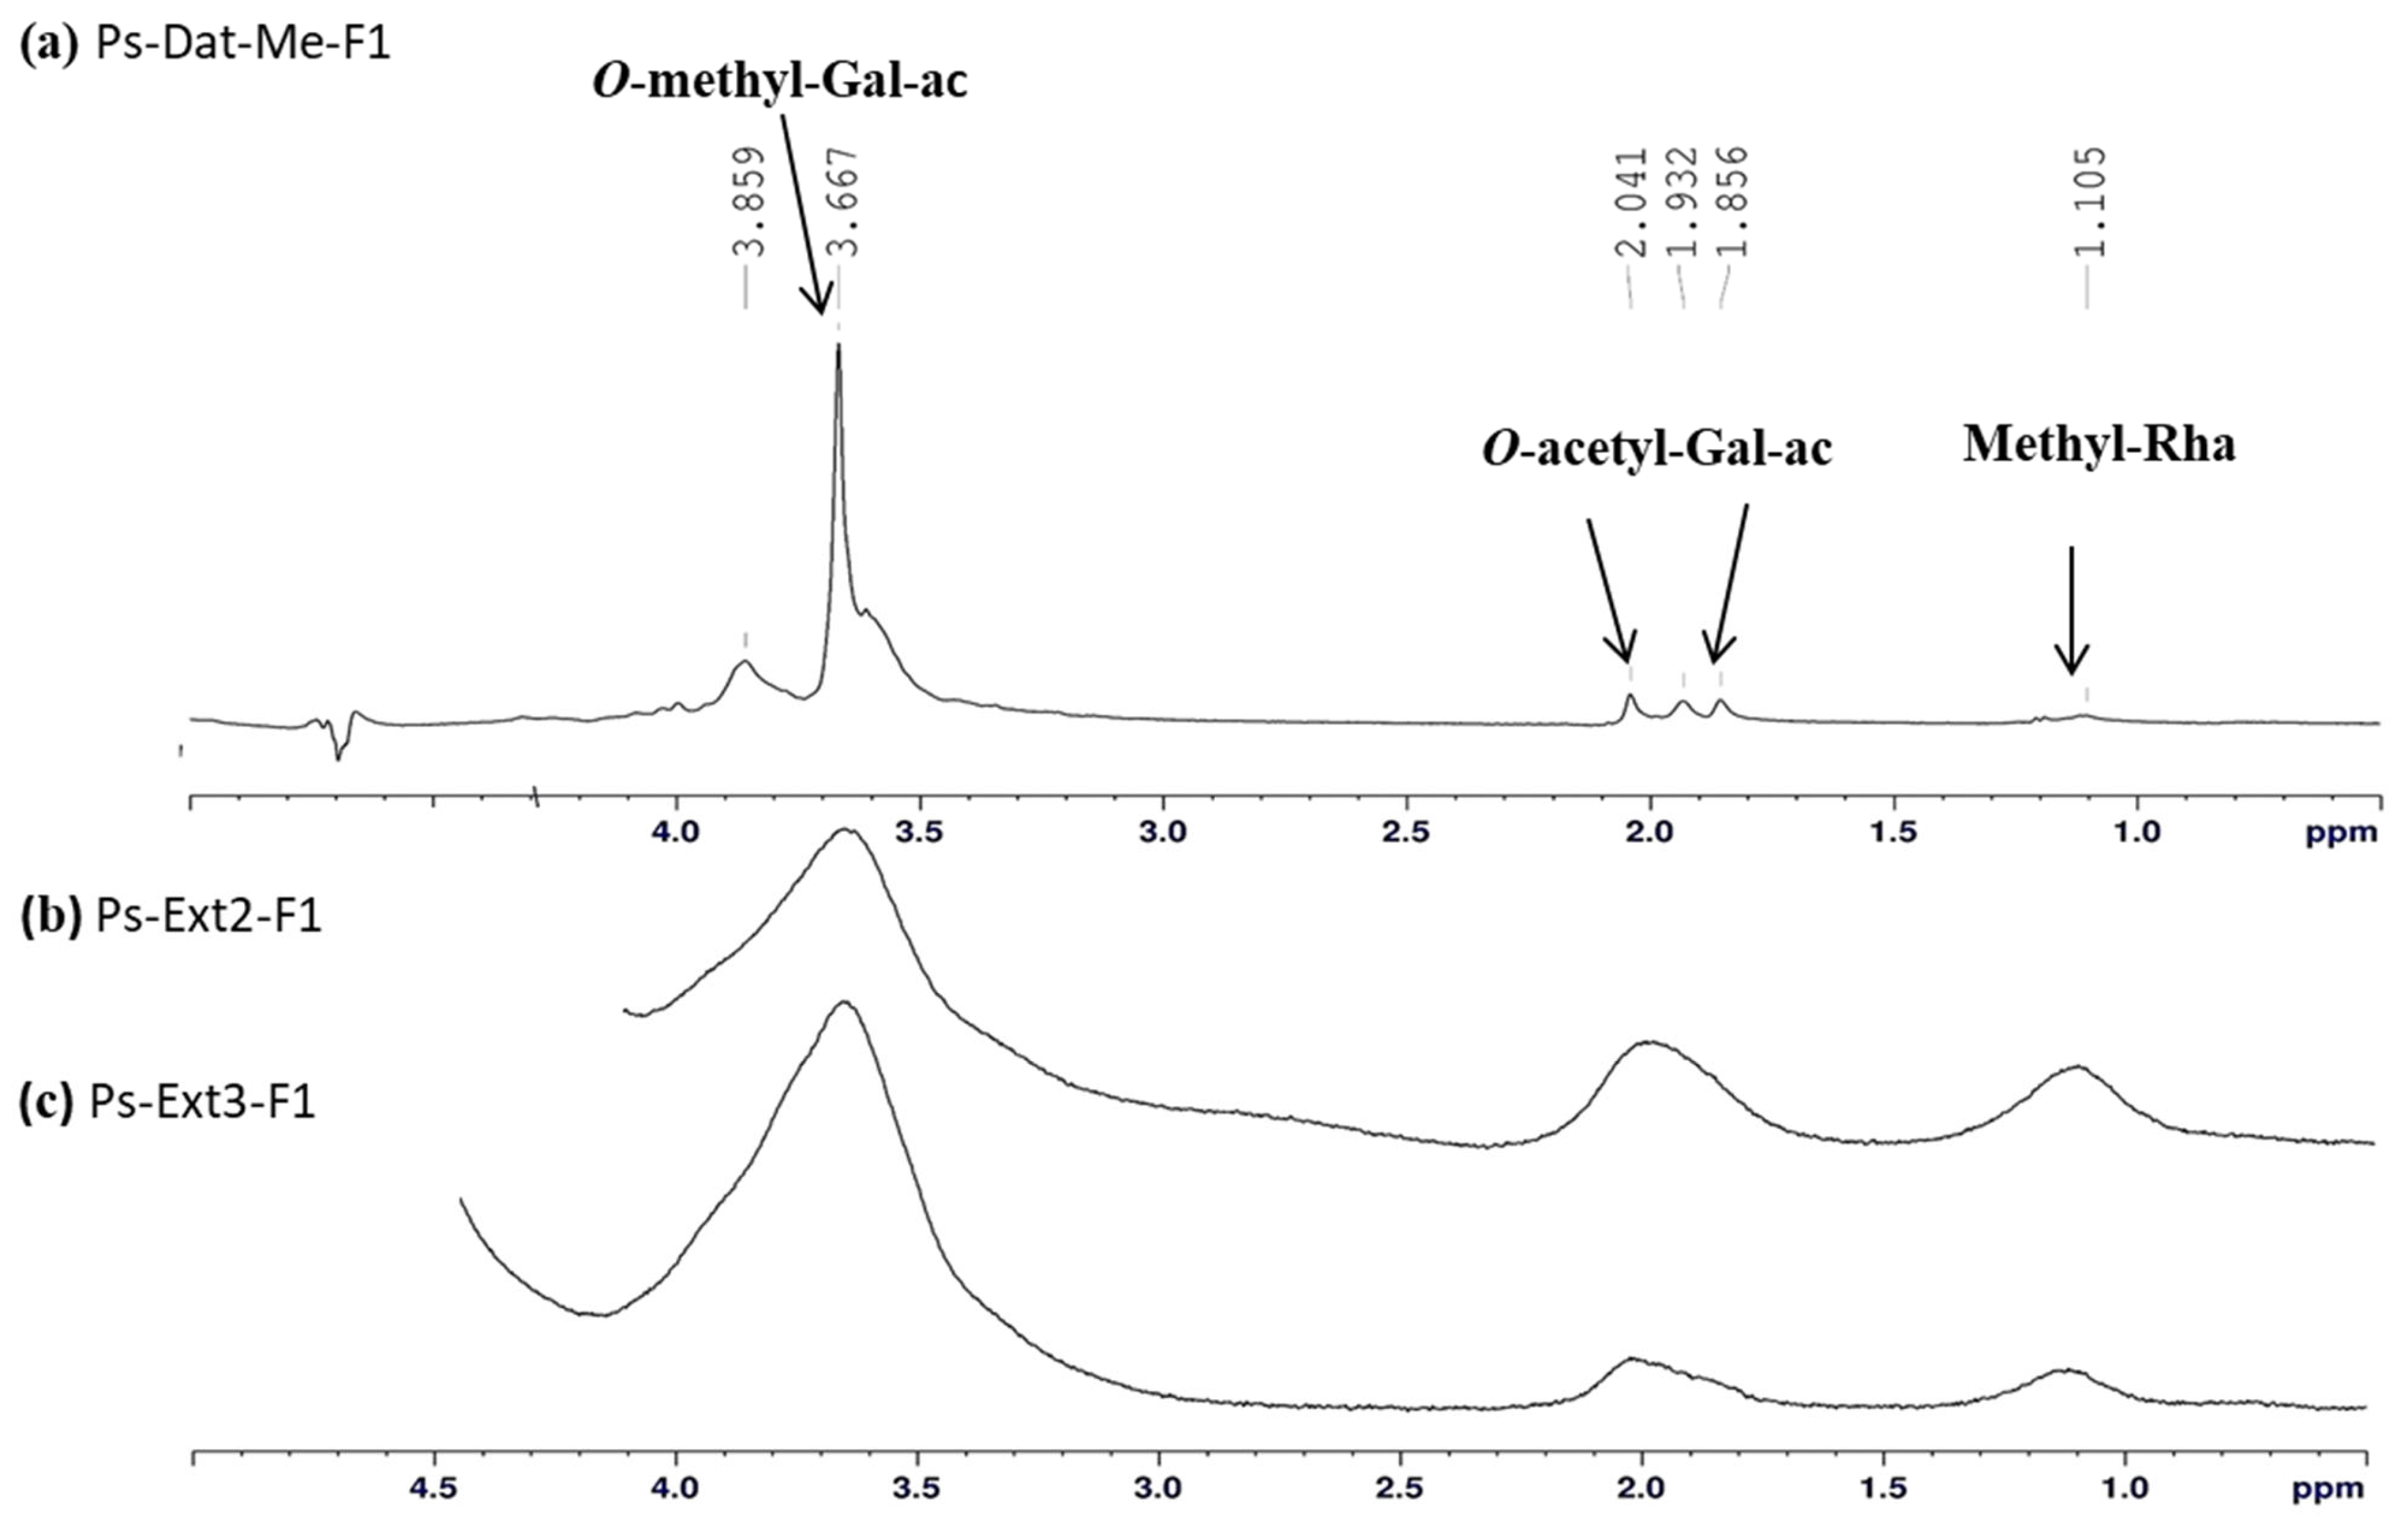
The few studies on date palm fruit available in the literature have reported the presence of methylated polysaccharides in other varieties of date fruit [10,34]. Notably, the exceptionally high degree of acetylation (DA) observed in the F2 fractions of our samples represents a novel structural feature not previously reported for date-derived polysaccharides, as further discussed in the discussion section. The structural composition of polysaccharides in F1 and F2 recovered through decoction and centrifugation, as shown in Figure 1, was studied by 1H-NMR spectroscopy (Figure S1, Supplementary File). 1H-NMR spectra confirmed structural modifications in polysaccharides following fermentation, with distinct changes in functional group composition compared to the reference sample (Ps-Dat-Me). The F1 fractions from Ps-Dat-Me and Ps-Ext1 exhibited an intense singlet at δ 3.68 ppm corresponding to O-methyl groups, and a singlet at δ 1.85–2.04 ppm was assigned to O-acetyl groups (CH3COO-), both with an intensity comparable to those observed in the proton spectra of commercial pectin from citrus fruit (Figure S2, Supplementary File). The signal at δ 3.68 ppm indicates the presence of methoxylated galacturonic acid (Gal-ac) units, a characteristic of naturally occurring pectic polysaccharide structures. The intensity of these signals is directly related to the degree of methylation (DM) and degree of acetylation (DA) of pectic polysaccharides [34], which are key structural parameters influencing the water solubility and gelling capacity of pectin. These signals confirm the presence of methylated and acetylated pectic polysaccharides in the date palm fruit fractions. Among the samples analyzed, the 1H-NMR spectra of F1 fractions from Ps-Ext2 and Ps-Ext3 showed lower signal intensities for the O-methyl group (δ 3.68 ppm) and the acetyl groups (δ 1.85–2.04 ppm) compared to F1 extracted from Ps-Dat-Me and Ps-Ext1 (Figure 5). This reduction can be attributed to the partial consumption of Gal-ac units during the yeast fermentation process, which likely caused modification of the pectic structure.
Proton spectra of the non-dialyzed polysaccharides before fermentation (Ps-Ext1) showed numerous signals corresponding to monosaccharides in the region from δ 3.00 to 4.00 ppm (Figure S1). In contrast, the intensity of these signals in Ps-Ext2 and Ps-Ext3 was strongly reduced, consistent with consumption of monosaccharides by yeast during fermentation (Figure 5).
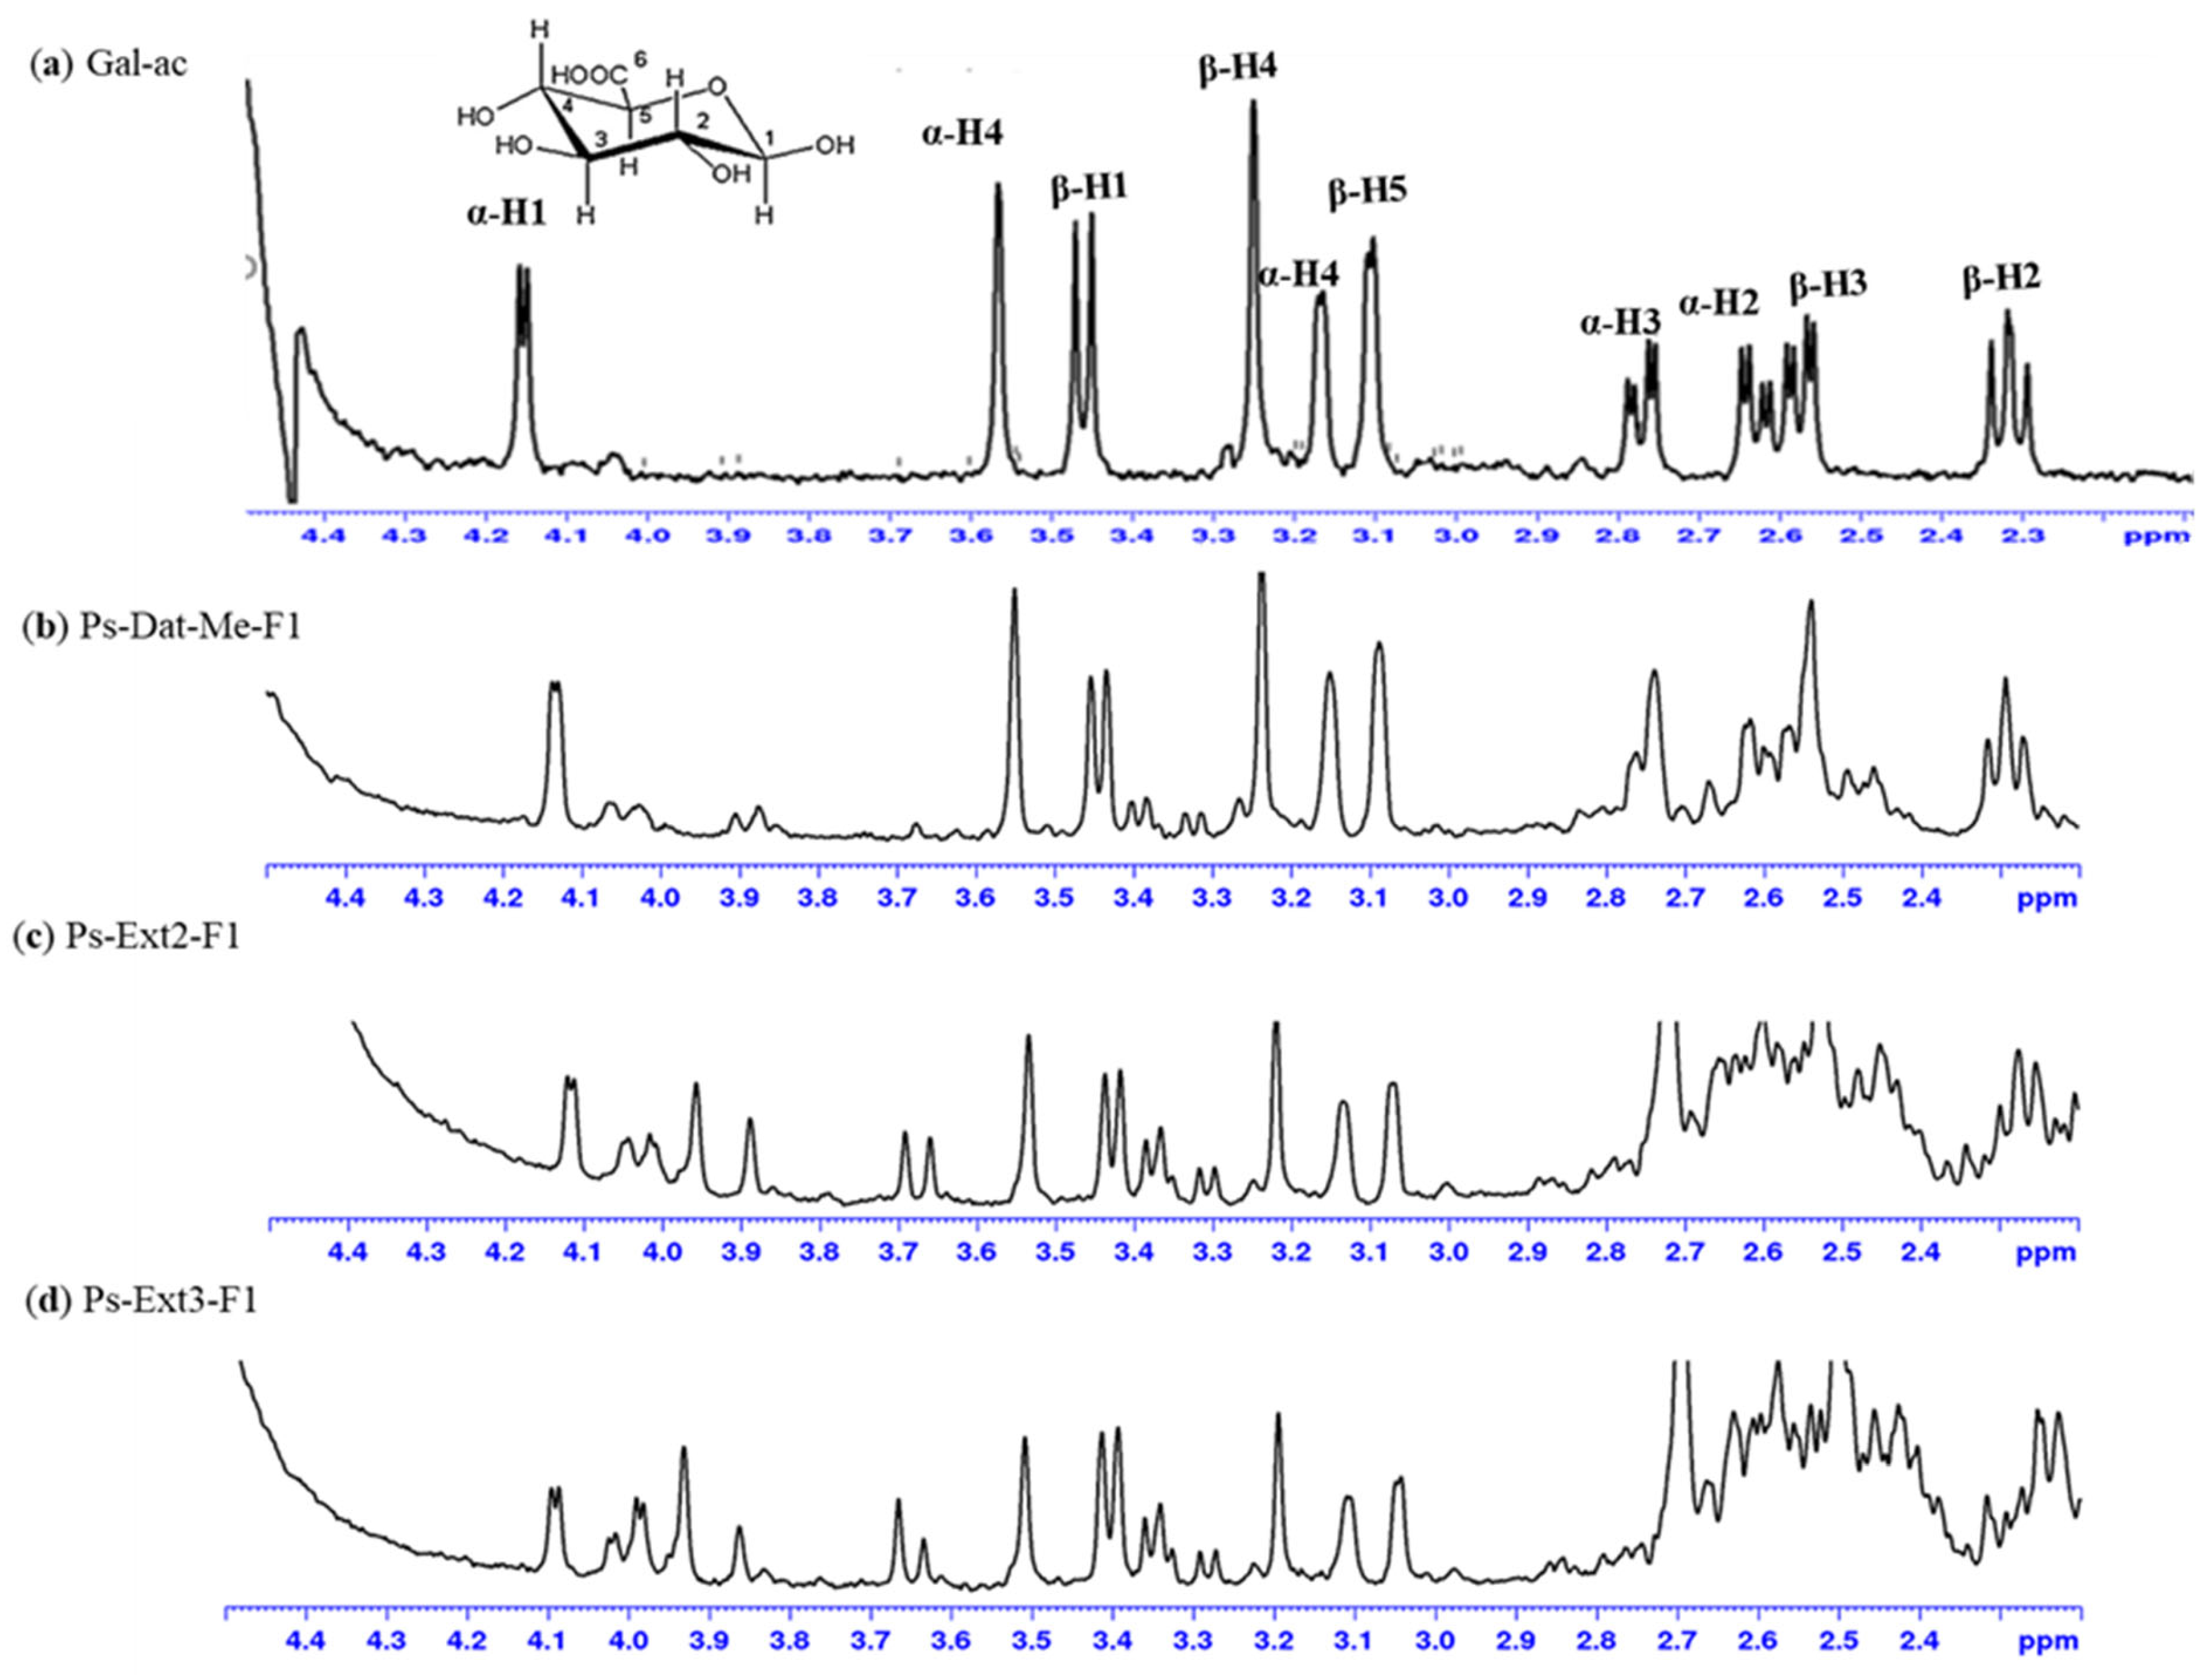
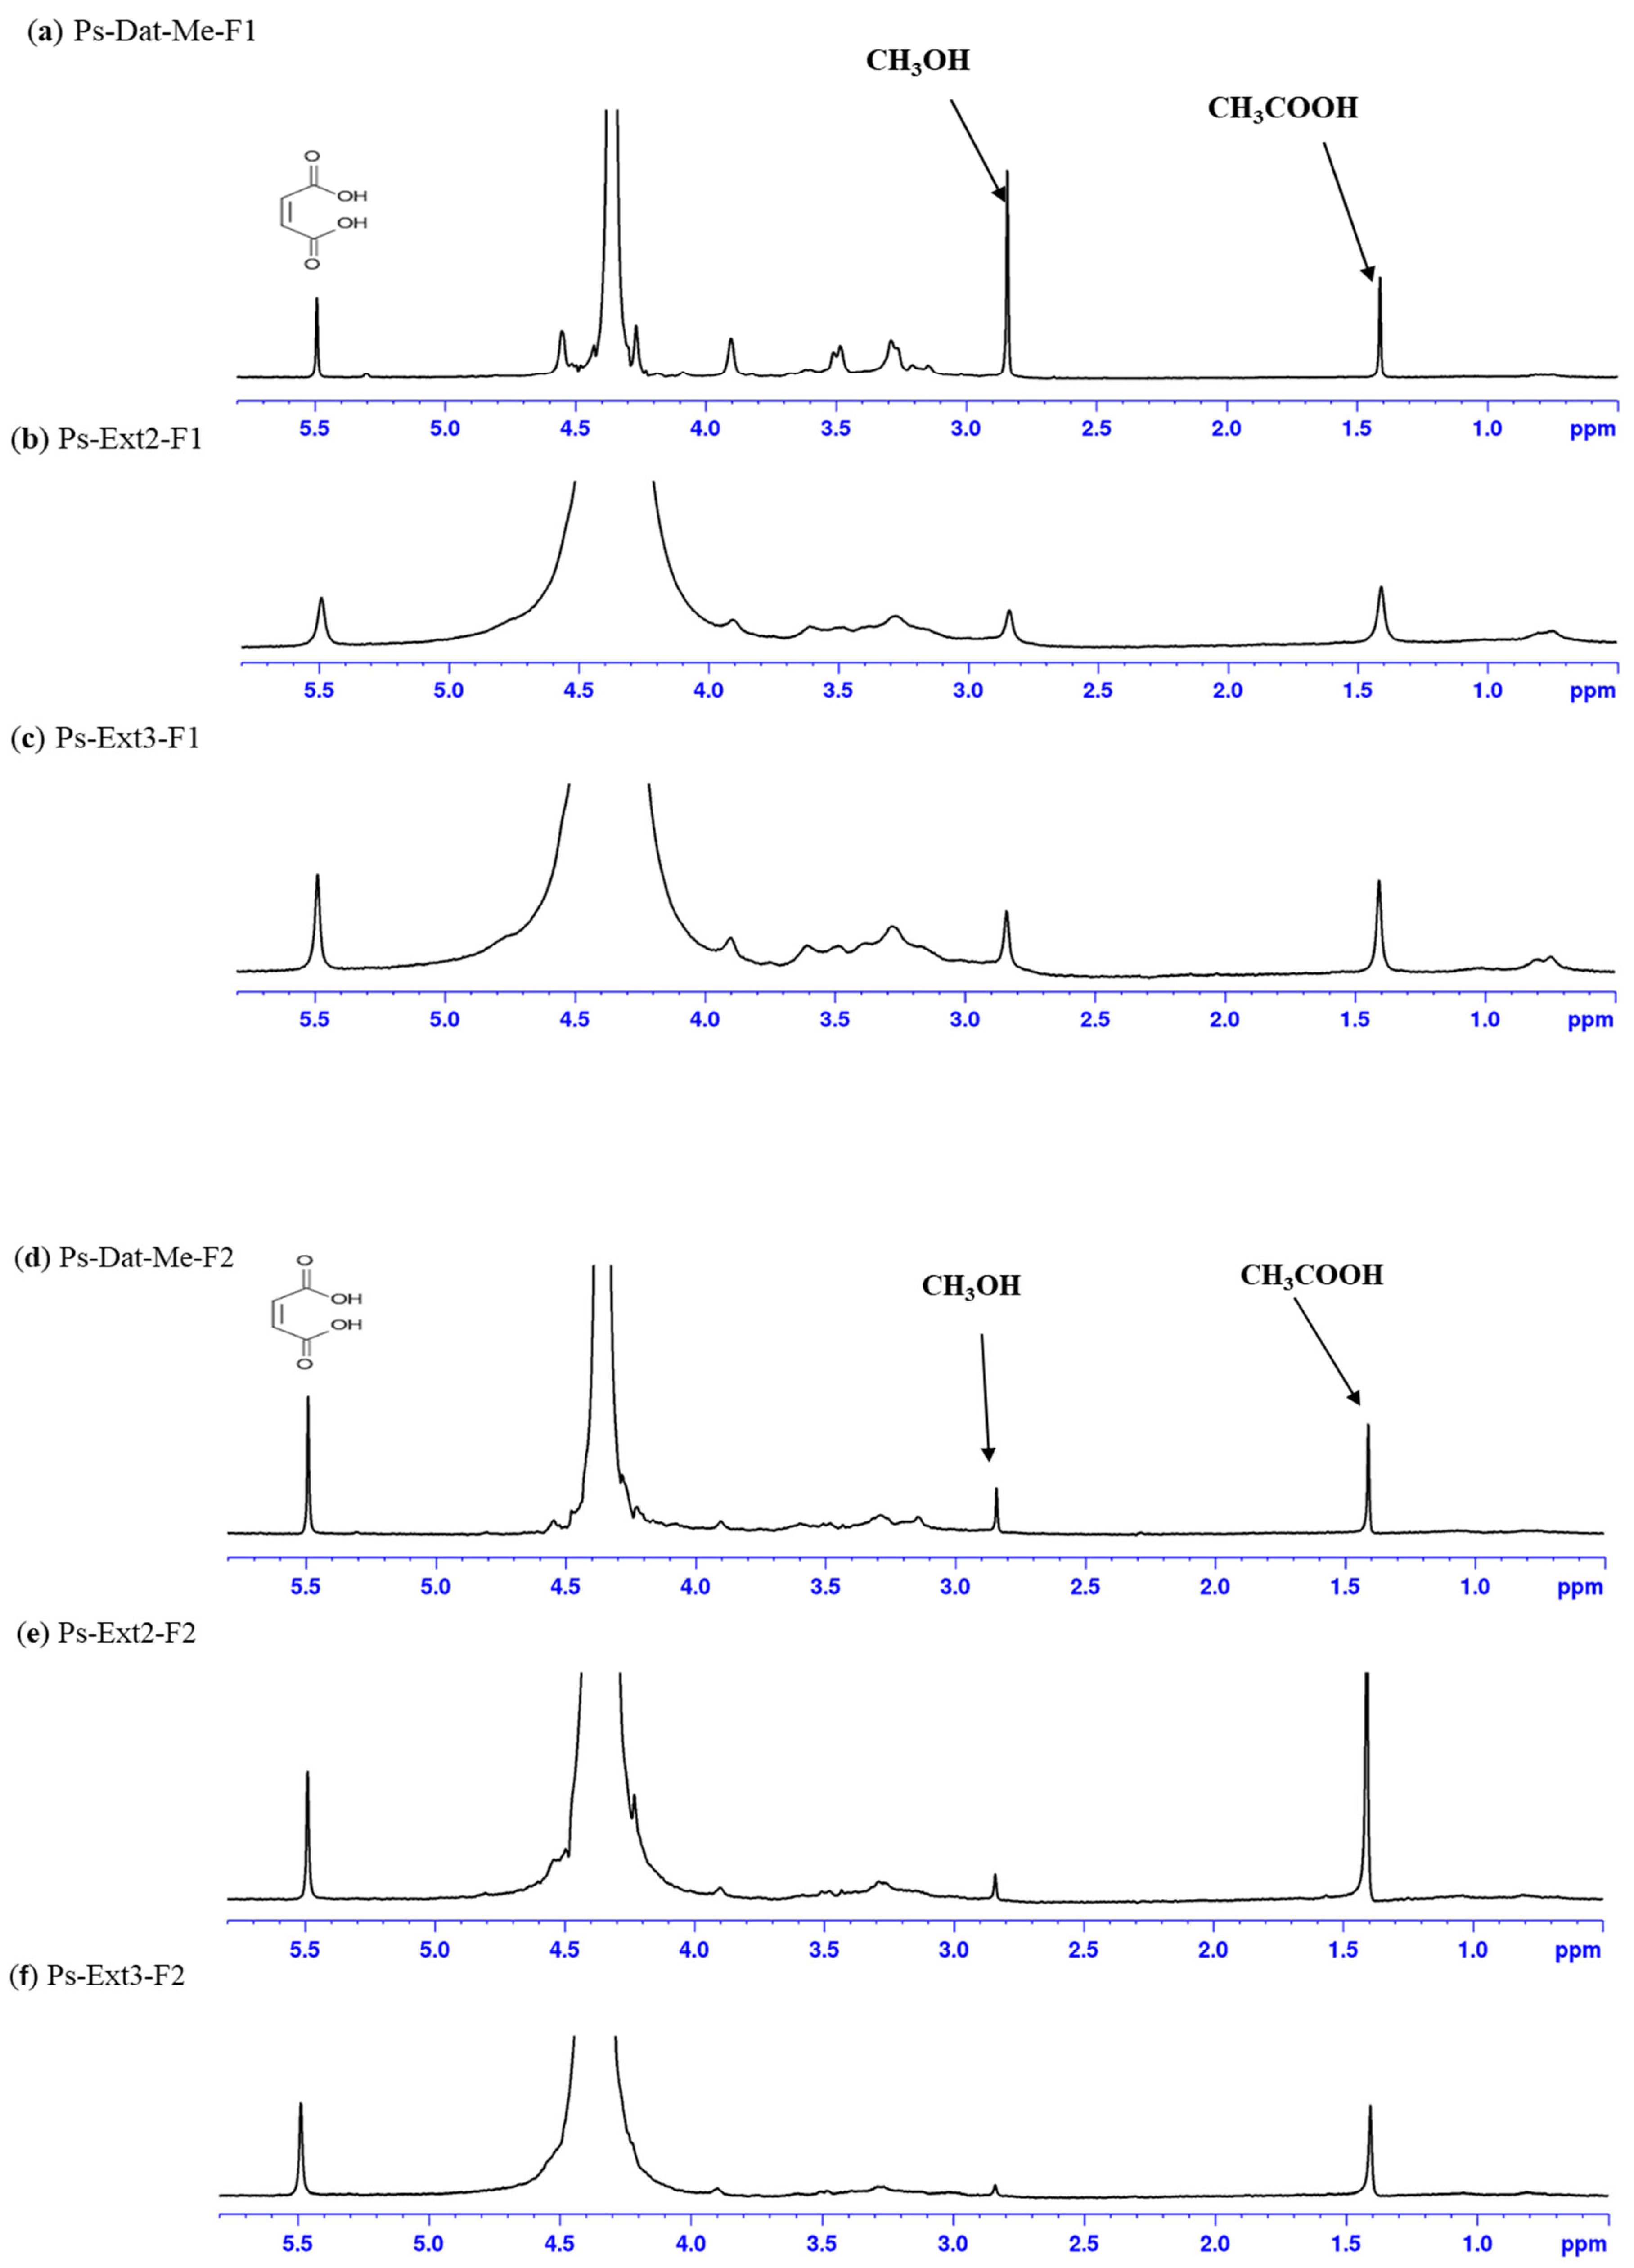
All dialyzed F1 and F2 polysaccharide fractions after acidic and alkaline hydrolyses were analyzed by 1H-qNMR spectroscopy to determine the Gal-ac content (Figure 6) and the DM and DA (Figure 7). All values were expressed as percentages on a dry sample basis (Table 3).
Alkaline hydrolysis was performed to determine the DM and DA by using 1H-qNMR as previously described by Müller-Maatsch et al. [35]. The concentrations of methanol and acetic acid released during hydrolysis were quantified by integrating the corresponding singlets in samples previously spiked with maleic acid as an internal standard (Figure 7). The 1H-NMR spectra obtained after alkaline hydrolysis showed the characteristic signals of methanol and acetic acid, enabling accurate quantification. Quantitative data confirmed the qualitative observations from the 1H-NMR profiles. The results in Table 3 revealed significant structural differences between the reference sample and fermented extracts. For F1 fractions, the Gal-ac content decreased progressively from 52.2 ± 0.7% (Ps-Dat-Me) to 32.1 ± 1.5% (Ps-Ext2) and 24.2 ± 0.4% (Ps-Ext3), indicating substantial loss of pectic content during fermentation and distillation. Similar trends were reported in previous research on palm date polysaccharides [10], where galacturonic acid content was in F1 (28–40%) and in F2 fractions (14–22%). Mrabet et al. [36] reported galacturonic acid values ranging from 10.7 to 16.7% in both soluble and insoluble dietary fiber of Deglet-Nour and Allig date flesh. DM values showed a similar trend, decreasing from 48.7% (Ps-Dat-Me) to 35.1% (Ps-Ext2) and 34.4% (Ps-Ext3). Conversely, DA values increased from 23.6% (Ps-Dat-Me) to 42.2% (Ps-Ext2) before decreasing to 28.7% (Ps-Ext3), suggesting selective enrichment of acetylated domains during fermentation followed by partial deacetylation during distillation.
Similar results were previously observed for DM values in F1 fractions from five Saudi Arabian date varieties, ranging from 56.3% (Ajwa) to 83.1% (Barrny), while F2 fractions exhibited more uniform DM values (43.1–52.3%), closely matching our F1 observations. The F2 samples showed high acetylation (up to 68.4%), whereas F1 fractions remained below 25.1% DA in the Khalas variety [10]. All F2 fractions exhibited different characteristics: Gal-ac content was considerably lower than in F1 samples, ranging from 5.6 ± 0.4% (Ps-Ext1) to 6.8 ± 0.2% (Ps-Ext2). Such a result suggests that these fractions contain predominantly non-pectic polysaccharides. DM values for F2 fractions were also notably lower than those of F1 fractions: for Ps-Dat-Me and Ps-Ext1 samples, the values ranged from 45.6 to 47.1%, respectively, while for Ps-Ext2 and Ps-Ext3, they reached only 19.8% and 12.6%, respectively. Conversely, F2 fractions in the unfermented samples showed the highest DA values (90.1–93.3%) across all samples, suggesting the presence of several acyl groups also in the polysaccharide backbone. Overall, analysis (Table 3) confirmed significant differences between fermented and non-fermented samples and between F1 and F2 fractions (Fisher’s LSD test, p ≤ 0.05). Fermentation significantly changed Gal-ac, MeOH, and DM in F1, with Ps-Ext3 showing the greatest changes.
DA increased in F1 during fermentation (42.2%), and decreased post-distillation (28.7%), while F2 fractions showed consistently high DA (90–93%) with no significant variation (p ≤ 0.05). Differences between F1 and F2 fractions likely reflect distinct functional properties of these polysaccharides and indirectly confirm that the fractionation method effectively separated structurally different polysaccharides. The compositional variations observed are consistent with previous studies on other plants. Variable contents of Gal-ac (43–63%), DM (17–25%), and DA (20–40%) have been reported for polysaccharides from different okra genotypes [37], demonstrating the natural variability in pectic structures across plant sources. However, the exceptionally high DA values in F2 fractions from date palm by-products represent a distinctive feature not previously reported for date palm polysaccharides. These structural differences affected solubility, with F1 showing good water solubility, whereas F2 showed reduced solubility due to high acetylation. 1H-qNMR analysis combined with simple chemical hydrolysis provided key structural information on these polysaccharides. The data showed that polysaccharides from fresh fruit and fermented by-products display different methylation and acetylation patterns, with implications for their functional properties and potential applications in the food, pharmaceutical, and cosmetic industries.

3. Materials and Methods

3.1. Chemicals

Commercial standards, including ferulic acid (purity ≥ 99%), luteolin-7-O-glucoside (purity ≥ 99%), and gallic acid (purity ≥ 99%), were purchased from Extrasynthese S.A. (Lyon, Nord-Genay, France). Maleic acid (purity grade 98%) and all other reagents and solvents, both HPLC-grade and analytical grade, were purchased from Merck (Darmstatt, Germany). Two commercial standards of citrus pectin with different degrees of esterification (i.e., 55–70% and >85%) were obtained from Merck (Darmstatt, Germany). The dialysis kit (12–14 kD cut-off, Spectra/Pro) was obtained from Spectrum Laboratories, Inc. (Breda, The Netherlands).

3.2. Plant Materials

Date palm fruit by-product and three sequential extracts during the stages of bioethanol production were obtained from National Dates LLC (Arar Farms brand, Zahran Amman, Jordan), Jordan Valley, in 2023. The date fruits belonged to the Medjool variety (Dat-Me). The three sequential extracts were produced by a company processing exclusively Medjool date fruit by-products (fruit discarded due to unsuitability for the market) to evaluate the impact of fermentation and distillation on the chemical composition of phenolic compounds and polysaccharides. Extract 1 (Ext1) was prepared by mixing the date palm fruit (separated from seeds) with water at a ratio of 30% (w/v). The mixture was then heated at 80 °C under stirring for 30 min and subsequently cooled to room temperature. The final solution exhibited a Brix degree of 17. Extract 2 (Ext2) was prepared by inoculating date flesh (Ext1) with baker’s yeast (Saccharomyces cerevisiae, 0.2% (w/v) g/L). Fermentation was conducted under static conditions at 25 °C for 72 h to collect the Ext2. Following fermentation, Ext2 was subjected to distillation to recover the produced ethanol, and the remaining aqueous phase was collected as Extract 3 (Ext3). The three extracts and reference date sample (Dat-Me) were freeze-dried and stored as dried samples until analysis. Sample descriptions and acronyms are summarized in Table 4.

3.3. Extractions of Phenolic Compounds

Phenolic compounds were extracted from whole date fruit (Dat-Me) and the three processed extracts (Ext1, Ext2, Ext3) to obtain the corresponding phenolic fractions Ph-Dat-Me, Ph-Ext1, Ph-Ext2, and Ph-Ext3, respectively, according to [10]. Dat-Me was cut into small pieces, freeze-dried, and 12 g aliquots were extracted with 480 mL of acetone/water (90:10, v/v; drug/solvent ratio 1:40, w/v) under magnetic stirring (400 rpm) at room temperature (25 ± 2 °C) for 12 h. The processed extracts (Ext1, Ext2, Ext3) were freeze-dried and subjected to the same acetone extraction procedure. The obtained solutions were filtered (Whatman No. 1), dried under vacuum, and dissolved in 50 mL EtOH/H2O (1:1 v/v) before HPLC-DAD-MS analysis. The extraction steps are summarized in Figure 1 and Table 4.

3.4. Extraction and Fractionation of Polysaccharides

The solid residues remaining after initial phenolic extraction with acetone from (Dat-Me) and the three extracts (Ext1, Ext2, Ext3) were subsequently treated with 75% ethanol (v/v) under magnetic stirring (400 rpm) for 4 h. The solid residues were freeze-dried and then used to prepare a decoction, applying the procedure previously described by Khatib et al. [10,29]. Briefly, 5 g of the dried residue from each sample was boiled in 200 mL of water under stirring for 60 min. The supernatant was collected after cooling in an ice bath for 30 min and then centrifuged at 4 °C and 5000 rpm for 8 min. Two polysaccharide fractions (F1, F2) and an insoluble residue (F3) were recovered from each sample (Table 4). F1 and F2 fractions from each sample were pooled and freeze-dried for yield quantification and subsequently dialyzed by a cut-off membrane of 9–12 kDa. The dialyzed polysaccharide fractions were freeze-dried again and stored until further characterization by Dynamic Light Scattering (DLS) and 1H-NMR spectroscopy. The complete extraction and fractionation procedure is shown in Figure 1. The extraction yield of the polysaccharide fractions was calculated according to the following equation:
Y i e l d   ( % ) = { W 1 } / { W 0 }   ×   100
W1 = weight of the recovered polysaccharide fraction (F1, F2, F3) after freeze-drying (g).
W0 = the initial dry weight of the samples (g).

3.5. Dynamic Light Scattering Analysis of Polysaccharides

The hydrodynamic diameters (nm) and size distributions of polysaccharide fractions F1 and F2 from all four samples (Table 4) were determined using Dynamic Light Scattering (DLS). Measurements were conducted with a Zetasizer Nano ZS90 instrument (Malvern Instruments, Worcestershire, UK), equipped with a 4 mW He-Ne laser operating at a wavelength of 632.8 nm, an optical fiber-based detector, and a digital LV/LSE-5003 correlator. Temperature was maintained at 25 °C by a Julabo water bath. The correlation functions were analyzed using the ALV-60X0 software package (Malvern- Alfatest SrL, Roma, Italy) version 7.2, in accordance with previously established protocols [38]. The hydrodynamic diameter and polydispersity index (PdI) were obtained from the autocorrelation function analysis by fitting a single exponential to the correlation function. All measurements were performed in aqueous solution at a concentration of 1.25 mg/mL, using a 4 mL optical quality cuvette. Each sample was measured in triplicate, and the reported values represent the mean of four independent readings per replicate.

3.6. 1H-NMR Analyses

1H-NMR spectra of the polysaccharide fractions F1 and F2 from all date extracts (Table 4) were acquired before and after dialysis at concentrations ranging from 4.5 to 6.0 mg/mL using an Advance 400 MHz Bruker instrument (Bruker, Bremen, Germany). The dialyzed fractions F1 and F2 from each extract were analyzed to determine the degree of methylation (DM) and degree of acetylation (DA) by following the method of Müller-Maatsch et al. and Khatib et al. [10,35], with slight modifications. Polysaccharide fractions (approx. 2.5–4.5 mg/mL, accurately weighed) were dissolved in 0.4 M NaOH prepared in D2O. Basic hydrolysis was performed at room temperature for 120 min in 1H-NMR tubes. After hydrolysis, 25 µL of maleic acid (Merck, Darmstatt, Germany) internal standard (ISTD, 5.25 mg/mL in D2O) was added to each sample.
Acetic acid and methanol contents were quantified by 1H-NMR through integration of C-methyl signals at 1.80 ppm (acetyl groups, CH3CO-) and 3.72 ppm (O-methyl, CH3O). The maleic acid proton signal at 6.24 ppm served as the reference for quantitative evaluation, as described by Khatib et al. 2016 and 2022 [10,39]. The content of acetic acid and methanol in fractions F1 and F2 was calculated as follows:
C ( % ) = I C H 3 I m a l × N m a l N x × M W x M W m a l × W m a l W x × P i s t d
  • C (%): content % of methanol or acetic acid.
  • Imal: integral of the two protons of the Internal Standard (ISTD), maleic acid.
  • ICH3: integral area of proton signal of CH3 groups of methanol or acetic acid.
  • Nx: number of protons for the CH3 groups for methanol or acetic acid.
  • Nmal: number of protons for ISTD.
  • MWx: molecular weight of methanol (32 g/moL) and acetic acid (60 g/moL).
  • MWmal: molecular weight of ISTD (116.1 g/moL).
  • Wx: weight (mg) of dry F1 or F2 fractions.
  • Wmal: weight of maleic acid.
  • Pmal: purity degree of maleic acid.
Galacturonic acid concentration was determined after acid hydrolysis of dialyzed fractions (F1 and F2) by incubating samples in Pyrex tubes with 2.0 M H2SO4 in D2O at 100 °C for 120 min [10,40]. Quantification was based on integration of anomeric proton signals at 4.15 ppm (α-GalA) and 3.45 ppm (β-GalA) using ISTD. In this case:
  • C%: content % of Gal-ac.
  • Nx: number of anomeric protons (1 for each anomeric form).
  • MWx: galacturonic acid molecular weight (194 g/mol).
The DM and DA were derived from the molar ratios of methanol, acetic acid, and galacturonic acid, according to established equations [35,41]:
DM (%) = (moles of methanol/moles of galacturonic acid) × 100
DA (%) = (moles of acetic acid/moles of galacturonic acid) × 100

3.7. HPLC-DAD-MS Analysis of Phenolic Compounds

HPLC analyses of phenolic extracts from four samples (Table 4) were conducted in accordance with Khatib et al. [10] with slight modifications by using an HP 1260L liquid chromatography equipped with a DAD detector (Agilent Technologies, Palo Alto, CA, USA) and Phenomenex, Luna C18 column C18, 5 µm 100 Å, 250 × 4.6 mm (from vers 7.2, Agilent, Milano, Italy). The mobile phase was (A) formic acid/water (pH 3.2) and (B) CH3CN. The following multistep linear solvent gradient was used: 0–1 min, 5% B; 1–4 min, 5–20% B; 4–30 min, 20–35% B; 30–32 min, 35–95% B; hold for 8 min; and re-equilibrate for 3 min. Total elution time 43 min, flow rate 0.8 mL min−1 and oven temperature 25 °C. The UV-Vis spectra ranged from 200 to 500 nm, and the chromatograms were acquired at 280, 330 and 350 nm. The MS experiments were carried out by the chromatographic system and an HP 1260 MSD (G6125B) mass spectrometer equipped with both DAD and MSD detectors, and with an API/electrospray interface (Agilent Technologies, Palo Alto, CA, USA). The analyses were conducted with the following ESI parameters: nitrogen flow rate 10.5 L/min, drying gas temperature 350° C; nebulizer pressure, 1811 Torr; and capillary voltage, 3500 V. Acquisition was performed with a full spectrum scan (range of 150–1500 Th). The experiments were performed in positive and negative ionization mode applying the following fragments: 120 V, 150 V and 200 V.

3.8. Antioxidant Activity with the Folin–Ciocalteu Assay

The total phenolic content and antioxidant capacity of all phenolic extracts (Table 4) were evaluated using the Folin–Ciocalteu spectrophotometric assay according to the procedure described by Campo et al. [42] with slight modifications. In particular, the absorbance at 725 nm was measured for a solution of the sample and the Folin–Ciocalteu reagent, after adding 20% Na2CO3 and incubating for 60 min, using a calibration curve built by measuring the absorbance of six reaction solutions containing gallic acid at different concentrations between (from 0.02 mg/mL to 0.51 mg/mL). The phenol content of the sample was expressed as GAEs (gallic acid equivalents), as mg/g of dried fruit and dried extracts.

3.9. Data Analysis

DLS data were obtained from triplicates and processed using the Malvern software package (7.2). Statistical analyses were performed using R-Studio software version 2025.05.1+513 with one-way ANOVA followed by Fisher’s Least Significant Difference (LSD) post hoc test (p ≤ 0.05) to determine significant differences between samples. Results are expressed as mean ± standard deviation. Different letters in figures and tables indicate statistically significant differences at p ≤ 0.05.

4. Conclusions

This study demonstrates a sustainable biorefinery approach for valorizing Medjool date palm by-products from bioethanol production. The samples investigated in the study were provided by an industrial company and are already part of an existing production process; thus, the process under investigation is considered already feasible at the industrial level. The strategy enables the efficient recovery of bioactive phenolic compounds and structurally diverse polysaccharides, contributing to circular bioeconomy principles. Three key findings emerged:
  • Phenolic Enhancement: Fermentation six-fold increased total phenolic (from 15.6 to 91.9 mg GAE/g) and allowed the identification of 22 compounds (predominantly cinnamic acid derivatives and glycosylated flavones) by HPLC-DAD-MS, and notable biotransformation during fermentation and distillation.
  • Polysaccharide Enrichment: Fermentation improved polysaccharide recovery 2.9-fold (from 13.8 to 14.2% to 40.5–42.1%), attributed to the selective removal of monosaccharides (60–75% of dry weight) by fermentation.
  • Structural Characterization: Two distinct fractions were isolated—F1, a pectic polysaccharide (Gal-ac 24–52%, DM 34–51%, DA 24–51%), and F2, a highly acetylated non-pectic polymer (Gal-ac 5.6–6.8%, DM 12–44%, DA 90–93%).
Future research should address biological activity validation and techno-economic feasibility assessment for industrial implementation. This integrated biorefinery approach maximizes resource utilization by co-producing bioethanol and high-value bioactive compounds, with potential applications across food, pharmaceutical, cosmetic, and biomaterial industries.

Supplementary Materials

The following supporting information can be downloaded at: https://www.mdpi.com/article/10.3390/pr14060948/s1, Figure S1: 1H-NMR spectra of (a) Ps-Dat-Me-F1; (b) Ps-Ext1, in 10% of D2O before dialysis. Figure S2: 1H-NMR spectra (D2O) of commercial pectin at different degrees of esterification: (a) 55–70%; (b) 85%. Maleic acid was used as internal standard (ISTD).

Author Contributions

M.K.: data curation, review and editing, writing—original manuscript, formal analyses, conceptualization, and methodology. L.C.: methodology, formal analysis, review and editing, and writing—original manuscript. M.C.: conceptualization and writing—original manuscript. P.V.: methodology and conceptualization. C.C.: methodology and formal analysis. P.F.: methodology and conceptualization. N.M.: conceptualization, funding acquisition, writing—original manuscript, and supervision. All authors have read and agreed to the published version of the manuscript.

Funding

This research received no external funding.

Data Availability Statement

The data presented in this study are available in the article.

Acknowledgments

This article is dedicated to the memory of our beloved and esteemed Prof. Annalisa Romani, who recently passed away.

Conflicts of Interest

The authors declare no conflicts of interest.

Abbreviations

The following abbreviations are used in this manuscript
DADegree of Acetylation
DLSDynamic Light Scattering
DMDegree of Methylation
FAOFood and Agriculture Organization
GAEGallic Acid Equivalent
GalAGalacturonic Acid
HPLC-DAD-MSHigh-Performance Liquid Chromatography–Diode Array Detector–Mass Spectrometry
1H-NMRProton Nuclear Magnetic Resonance
ISTDInternal Standard
PdIPolydispersity Index
TPCTotal Phenolic Content

References

  1. Hussain, M.I.; Farooq, M.; Syed, Q.A. Nutritional and Biological Characteristics of the Date Palm Fruit (Phoenix dactylifera L.)—A Review. Food Biosci. 2020, 34, 100509. [Google Scholar] [CrossRef]
  2. Fuller, D.Q.; Stevens, C.J. Between Domestication and Civilization: The Role of Agriculture and Arboriculture in the Emergence of the First Urban Societies. Veg. Hist. Archaeobot. 2019, 28, 263–282. [Google Scholar] [CrossRef] [PubMed]
  3. Al-Habsi, N. Date Palm (Phoenix dactylifera L.) Fruit: Strategic Crop for Food Security, Nutritional Benefits, Postharvest Quality, and Valorization into Emerging Functional Products. Sustainability 2025, 17, 7491. [Google Scholar] [CrossRef]
  4. Food and Agriculture Organization of the United Nations. FAOSTAT Statistical Database; Production, Crops; FAO: Rome, Italy, 2020. [Google Scholar]
  5. Hamed, K.E.; Alsaif, A.N.; Alhewairini, S.S.; Sayyed, R.Z. Comprehensive Analysis of Microbiome Biodiversity in Popular Date Palm (Phoenix dactylifera L.) Fruit Varieties. Sci. Rep. 2024, 14, 20658. [Google Scholar] [CrossRef]
  6. Ahmad Mohd Zain, M.R.; Abdul Kari, Z.; Dawood, M.A.O.; Nik Ahmad Ariff, N.S.; Salmuna, Z.N.; Ismail, N.; Ibrahim, A.H.; Thevan Krishnan, K.; Che Mat, N.F.; Edinur, H.A.; et al. Bioactivity and Pharmacological Potential of Date Palm (Phoenix dactylifera L.) Against Pandemic COVID-19: A Comprehensive Review. Appl. Biochem. Biotechnol. 2022, 194, 4587–4624. [Google Scholar] [CrossRef]
  7. Oladzad, S.; Fallah, N.; Mahboubi, A.; Afsham, N.; Taherzadeh, M.J. Date Fruit Processing Waste and Approaches to Its Valorization: A Review. Bioresour. Technol. 2021, 340, 125625. [Google Scholar] [CrossRef]
  8. Barathikannan, K.; Rambabu, K.; Ihtisham, M.; Sridhar, K.; Mazumder, J.A.; Chelliah, R.; Oh, D.H.; Banat, F. Sustainable Utilization of Date Palm Byproducts: Bioactive Potential and Multifunctional Applications in Food and Packaging. Food Chem. 2025, 482, 144216. [Google Scholar] [CrossRef] [PubMed]
  9. Al-Dashti, Y.A.; Holt, R.R.; Keen, C.L.; Hackman, R.M. Date Palm Fruit (Phoenix dactylifera): Effects on Vascular Health and Future Research Directions. Int. J. Mol. Sci. 2021, 22, 4665. [Google Scholar] [CrossRef]
  10. Khatib, M.; Al-Tamimi, A.; Cecchi, L.; Adessi, A.; Innocenti, M.; Balli, D.; Mulinacci, N. Phenolic Compounds and Polysaccharides in the Date Fruit (Phoenix dactylifera L.): Comparative Study on Five Widely Consumed Arabian Varieties. Food Chem. 2022, 395, 133591. [Google Scholar] [CrossRef]
  11. Noorbakhsh, H.; Khorasgani, M.R. Date (Phoenix dactylifera L.) Polysaccharides: A Review on Chemical Structure and Nutritional Properties. J. Food Meas. Charact. 2022, 16, 3240–3250. [Google Scholar] [CrossRef]
  12. Rashwan, A.K.; El-Shiekh, R.A.; Bassiony, A.; Abdelshafy, A.M.; Osman, A.I.; Younis, H.A.; Zhou, F.; Gherbawy, Y.A.; El-Seedi, H.R.; Shi, J.; et al. Recent Advances in Chemical Characterization, Emerging Applications, and Biological Activities of Tea Polysaccharides and Their Conjugates from Leaves and Flowers: A Review. Int. J. Biol. Macromol. 2025, 328, 147540. [Google Scholar] [CrossRef] [PubMed]
  13. AlFaris, N.A.; AlTamimi, J.Z.; AlGhamdi, F.A.; Albaridi, N.A.; Alzaheb, R.A.; Aljabryn, D.H.; Aljahani, A.H.; AlMousa, L.A. Total Phenolic Content in Ripe Date Fruits (Phoenix dactylifera L.): A Systematic Review and Meta-Analysis. Saudi J. Biol. Sci. 2021, 28, 3566–3577. [Google Scholar] [CrossRef] [PubMed]
  14. Kucharska, E.; Zagórska-Dziok, M.; Bilewicz, P.; Kowalczyk, S.; Pełech, R. Use of Syzygium aromaticum L. Fermented Plant Extract to Enhance Antioxidant Potential: Fermentation Kinetics. Appl. Sci. 2024, 14, 4900. [Google Scholar] [CrossRef]
  15. Huang, Z.; Dostal, L.; Rosazza, J.P.N. Microbial Transformations of Ferulic Acid by Saccharomyces cerevisiae and Pseudomonas Fluorescens. Appl. Environ. Microbiol. 1993, 59, 2244–2250. [Google Scholar] [CrossRef] [PubMed]
  16. Coghe, S.; Benoot, K.; Delvaux, F.; Vanderhaegen, B.; Delvaux, F.R. Ferulic Acid Release and 4-Vinylguaiacol Formation during Brewing and Fermentation: Indications for Feruloyl Esterase Activity in Saccharomyces cerevisiae. J. Agric. Food Chem. 2004, 52, 602–608. [Google Scholar] [CrossRef]
  17. Lawag, I.L.; Nolden, E.S.; Schaper, A.A.M.; Lim, L.Y.; Locher, C. A Modified Folin-Ciocalteu Assay for the Determination of Total Phenolics Content in Honey. Appl. Sci. 2023, 13, 2135. [Google Scholar] [CrossRef]
  18. Pérez, M.; Dominguez-López, I.; Lamuela-Raventós, R.M. The Chemistry Behind the Folin-Ciocalteu Method for the Estimation of (Poly)Phenol Content in Food: Total Phenolic Intake in a Mediterranean Dietary Pattern. J. Agric. Food Chem. 2023, 71, 17543–17553. [Google Scholar] [CrossRef]
  19. Dhaouadi, A.; Smirani, N.; Bouazizi, S.; Khayati, O.; Magdouli, S.; Hamdi, M. Sustainable Preservation of Opuntia ficus-indica Peel Waste for Resource Recovery Through Pretreatment and Convective-Drying Processes. Processes 2026, 14, 262. [Google Scholar] [CrossRef]
  20. Ordoñez-Cano, A.J.; Ramírez-Esparza, U.; Alvarado-González, M.; Baeza-Jiménez, R.; Espinoza-Hicks, J.C.; Prado-Barragán, L.A.; Buenrostro-Figueroa, J.J. Valorization of Pistachio Green Hull: Advances in Extraction and Characterization of Phenolic Compounds. Processes 2025, 13, 3761. [Google Scholar] [CrossRef]
  21. Ocaño-Higuera, V.M.; López-Avilés, G.; Almendariz-Tapia, F.J.; Del-Toro-Sánchez, C.L.; Tapia-Hernández, J.A.; Garzón-García, A.M.; Dublán-García, O.; Vergel-Alfonso, A.A.; González-Aguilar, G.A.; Valdez-Hurtado, S.; et al. The Effect of Fermentation with Saccharomyces cerevisiae on the Release of Bound Phenolic Compounds from Wheat Bran and Its Effect on Antioxidant Capacity. Processes 2025, 13, 3506. [Google Scholar] [CrossRef]
  22. Nazarni, R.; Purnama, D.; Umar, S.; Eni, H. The Effect of Fermentation on Total Phenolic, Flavonoid and Tannin Content and Its Relation to Antibacterial Activity in Jaruk Tigarun (Crataeva nurvala, Buch HAM). Int. Food Res. J. 2016, 23, 309. [Google Scholar]
  23. Adebo, O.A.; Medina-Meza, I.G. Impact of Fermentation on the Phenolic Compounds and Antioxidant Activity of Whole Cereal Grains: A Mini Review. Molecules 2020, 25, 927. [Google Scholar] [CrossRef] [PubMed]
  24. Hilary, S.; Tomás-Barberán, F.A.; Martinez-Blazquez, J.A.; Kizhakkayil, J.; Souka, U.; Al-Hammadi, S.; Habib, H.; Ibrahim, W.; Platat, C. Polyphenol Characterisation of Phoenix dactylifera L. (Date) Seeds Using HPLC-Mass Spectrometry and Its Bioaccessibility Using Simulated in-Vitro Digestion/Caco-2 Culture Model. Food Chem. 2020, 311, 125969. [Google Scholar] [CrossRef] [PubMed]
  25. Najm, O.A.; Addnan, F.H.; Mohd-Manzor, N.F.; Elkadi, M.A.; Abdullah, W.O.; Ismail, A.; Mansur, F.A.F. Identification of Phytochemicals of Phoenix dactylifera L. Cv Ajwa with UHPLC-ESI-QTOF-MS/MS. Int. J. Fruit Sci. 2021, 21, 848–867. [Google Scholar] [CrossRef]
  26. Farag, M.A.; Mohsen, M.; Heinke, R.; Wessjohann, L.A. Metabolomic Fingerprints of 21 Date Palm Fruit Varieties from Egypt Using UPLC/PDA/ESI-QTOF-MS and GC-MS Analyzed by Chemometrics. Food Res. Int. 2014, 64, 218–226. [Google Scholar] [CrossRef]
  27. Abu-Reidah, I.M.; Gil-Izquierdo, Á.; Medina, S.; Ferreres, F. Phenolic Composition Profiling of Different Edible Parts and By-Products of Date Palm (Phoenix dactylifera L.) by Using HPLC-DAD-ESI/MSn. Food Res. Int. 2017, 100, 494–500. [Google Scholar] [CrossRef]
  28. Balli, D.; Cecchi, L.; Khatib, M.; Bellumori, M.; Cairone, F.; Carradori, S.; Zengin, G.; Cesa, S.; Innocenti, M.; Mulinacci, N. Characterization of Arils Juice and Peel Decoction of Fifteen Varieties of Punica granatum L.: A Focus on Anthocyanins, Ellagitannins and Polysaccharides. Antioxidants 2020, 9, 238. [Google Scholar] [CrossRef]
  29. Khatib, M.; Giuliani, C.; Rossi, F.; Adessi, A.; Al-Tamimi, A.; Mazzola, G.; Di Gioia, D.; Innocenti, M.; Mulinacci, N. Polysaccharides from By-Products of the Wonderful and Laffan Pomegranate Varieties: New Insight into Extraction and Characterization. Food Chem. 2017, 235, 58–66. [Google Scholar] [CrossRef]
  30. Gribaa, A.; Dardelle, F.; Lehner, A.; Rihouey, C.; Burel, C.; Ferchichi, A.; Driouich, A.; Mollet, J.C. Effect of Water Deficit on the Cell Wall of the Date Palm (Phoenix dactylifera “Deglet Nour”, Arecales) Fruit during Development. Plant Cell Environ. 2013, 36, 1056–1070. [Google Scholar] [CrossRef]
  31. Shafiei, M.; Karimi, K.; Taherzadeh, M.J. Palm Date Fibers: Analysis and Enzymatic Hydrolysis. Int. J. Mol. Sci. 2010, 11, 4285–4296. [Google Scholar] [CrossRef]
  32. Yang, J.S.; Mu, T.H.; Ma, M.M. Extraction, Structure, and Emulsifying Properties of Pectin from Potato Pulp. Food Chem. 2018, 244, 197–205. [Google Scholar] [CrossRef] [PubMed]
  33. Liu, S.; Hu, J.; Zhong, Y.; Hu, X.; Yin, J.; Xiong, T.; Nie, S.; Xie, M. A Review: Effects of Microbial Fermentation on the Structure and Bioactivity of Polysaccharides in Plant-Based Foods. Food Chem. 2024, 440, 137453. [Google Scholar] [CrossRef] [PubMed]
  34. Heinze, T.; Liebert, T.; Koschella, A. Esterification of Polysaccharides; Scholars Portal; Springer: Berlin/Heidelberg, Germany, 2019; ISBN 3540321039. [Google Scholar]
  35. Müller-Maatsch, J.; Caligiani, A.; Tedeschi, T.; Elst, K.; Sforza, S. Simple and Validated Quantitative 1H NMR Method for the Determination of Methylation, Acetylation, and Feruloylation Degree of Pectin. J. Agric. Food Chem. 2014, 62, 9081–9087. [Google Scholar] [CrossRef] [PubMed]
  36. Mrabet, A.; Rodríguez-Arcos, R.; Guillén-Bejarano, R.; Chaira, N.; Ferchichi, A.; Jiménez-Araujo, A. Dietary Fiber from Tunisian Common Date Cultivars (Phoenix dactylifera L.): Chemical Composition, Functional Properties, and Antioxidant Capacity. J. Agric. Food Chem. 2012, 60, 3658–3664. [Google Scholar] [CrossRef]
  37. Kpodo, F.M.; Agbenorhevi, J.K.; Alba, K.; Bingham, R.J.; Oduro, I.N.; Morris, G.A.; Kontogiorgos, V. Pectin Isolation and Characterization from Six Okra Genotypes. Food Hydrocoll. 2017, 72, 323–330. [Google Scholar] [CrossRef]
  38. Cecchi, L.; Khatib, M.; Bellumori, M.; Civa, V.; Domizio, P.; Innocenti, M.; Balli, D.; Mulinacci, N. Industrial Drying for Agrifood By-Products Re-Use: Cases Studies on Pomegranate Peel (Punica granatum L.) and Stoned Olive Pomace (Pâtè, Olea europaea L.). Food Chem. 2023, 403, 134338. [Google Scholar] [CrossRef]
  39. Khatib, M.; Pieraccini, G.; Innocenti, M.; Melani, F.; Mulinacci, N. An Insight on the Alkaloid Content of Capparis spinosa L. Root by HPLC-DAD-MS, MS/MS and 1H QNMR. J. Pharm. Biomed. Anal. 2016, 123, 53–62. [Google Scholar] [CrossRef]
  40. Giner, J.L.; Feng, J.; Kiemle, D.J. NMR Tube Degradation Method for Sugar Analysis of Glycosides. J. Nat. Prod. 2016, 79, 2413–2417. [Google Scholar] [CrossRef]
  41. Khatib, M.; Cecchi, L.; Bellumori, M.; Zonfrillo, B.; Mulinacci, N. Polysaccharides and Phenolic Compounds Recovered from Red Bell Pepper, Tomato and Basil By-Products Using a Green Extraction by Extractor Timatic®. Int. J. Mol. Sci. 2023, 24, 16653. [Google Scholar] [CrossRef]
  42. Campo, M.; Pinelli, P.; Romani, A. Hydrolyzable Tannins from Sweet Chestnut Fractions Obtained by a Sustainable and Eco-Friendly Industrial Process. Nat. Prod. Commun. 2016, 11, 1934578X1601100323. [Google Scholar] [CrossRef]
Figure 1. Scheme of the extraction procedure applied to recover phenolic extracts and polysaccharide fractions (F1–F2) from Medjool date palm by-products. In color, images indicating analysis.
Processes 14 00948 g001
Figure 2. Chromatographic profiles of the acetone extract of Ph-Dat-Me (green), Ph-Ext2 (red) and Ph-Ext3 (blue) at 330 nm. Ph-Ext1 was not reported in the figure due to its similarity with Ph-Dat-Me. The numbers refer to the analytes of Table 1 and evaluated to determine the total phenol content in the extract.
Processes 14 00948 g002
Figure 3. Total phenolic content (TPC), determined using Folin–Ciocalteu assay and expressed as mg GAE/g DE. Different letters indicate significant differences at the 0.05 level (Fisher’s LSD test).
Processes 14 00948 g003
Figure 4. Polysaccharide content expressed as % on dry weight (w/w) of Dat-Me, Ext1, Ext2 and Ext3; total fractions are expressed as sum of F1–F3 fractions. Values followed by different letters in each series are significantly different (Fisher’s LSD test p ≤ 0.05).
Processes 14 00948 g004
Figure 5. 1H-NMR spectra of dialyzed F1 fractions in D2O, from (a) Ps-Dat-Me; (b) Ps-Ext2; (c) Ps-Ext3 (Ps, polysaccharide).
Processes 14 00948 g005
Figure 6. 1H-NMR spectra in D2O after acid hydrolysis by H2SO4 2M of (a) the standard of Gal-ac; the dialyzed F1 polysaccharide fractions of (b) Ps-Dat-Me; (c) Ps-Ext1; (d) Ps-Ext3.
Processes 14 00948 g006
Figure 7. 1H-NMR spectra of all the fractions F1 and F2 after alkaline hydrolysis by NaOH, in the presence of maleic acid as internal standard (Ps, polysaccharide).
Processes 14 00948 g007
Table 2. Summary of the results from the DLS analyses of F1 and F2 samples for Dat-Me, Ps-Ext1, Ps-Ext2, and Ps-Ext3. PdI, polydispersity index; D, diameter size; Z-Pk1, Z-average particle size of the main peak; Pk1, Pk2 and Pk3, the detected peaks in each sample; KDa, Kdalton; nd, for values below one unit; Est MW, Estimated Molecular Weight.
VarietyPdIZ-Pk1
D (nm)
Pk 1
D (nm)
Pk 2
D (nm)
Pk 3
D (nm)
Pk 1
Area %
Pk 2
Area %
Pk 3
Area %
Est MW
Pk 1 (KDa)
F1Ps-Dat-Me0.23 ± 0.03270.0 ± 5.9328 ± 184879 ± 169nd99.0 ± 1.50.9 ± 1.5nd2.33 × 105
Ps-Ext10.23 ± 0.04265.7 ± 6.9324 ± 194899 ± 105nd99.1 ± 1.20.9 ± 0.8nd2.34 × 105
Ps-Ext20.28 ± 0.03229.7 ± 1.6299 ± 165141 ± 93nd98.7 ± 1.11.3 ± 1.1nd6.6 × 104
Ps-Ext30.39 ± 0.05311.0 ± 13.1411 ± 124896 ± 170nd95.9 ± 3.73.8 ± 3.5nd5.1 × 105
F2Ps-Dat-Me0.76 ± 0.02173.1 ± 20.6327 ± 194603 ± 246nd87.1 ± 5.37.6 ± 2.24.7 ± 3.48.5 × 105
Ps-Ext10.75 ± 0.03175.4 ± 18.3333 ± 224615 ± 246nd88.4 ± 4.38.2 ± 2.23.8 ± 3.18.5 × 105
Ps-Ext20.73 ± 0.02355.8 ± 63.2352 ± 255340 ± 31198 ± 2853.4 ± 5.414.4 ± 5.425.0 ± 3.76.3 × 104
Ps-Ext30.80 ± 0.03594.7 ± 104.1498 ± 525212 ± 51135 ± 1376.8 ± 8.56.1 ± 4.116.8 ± 3.26.6 × 104
Table 3. Amount of galacturonic acid (Gal-ac), MeOH, acetic acid, degree of methylation (DM) and degree of acetylation (DA) expressed as % on dry sample. Gal-ac was evaluated after acid hydrolysis, while DM and DA were evaluated after alkaline hydrolysis; all values were determined by 1H-qNMR, and different letters indicate statistical significance at p ≤ 0.05 (Fisher’s LSD).
FractionsAcronymGal-acMeOHAcetic AcidDMDA
F1Ps-Dat-Me52.2 ± 0.7 a4.3 ± 0.2 a3.8 ± 0.2 b48.7 ± 2.7 a23.6 ± 1.5 c
Ps-Ext149.9 ± 0.2 a4.2 ± 0.2 a3.7 ± 0.2 b50.6 ± 1.9 a23.8 ± 0.9 c
Ps-Ext232.1 ± 1.5 b1.9 ± 0.03 b4.2 ± 0.1 a35.1 ± 2.2 b42.2 ± 0.7 a
Ps-Ext324.2 ± 0.4 c1.4 ± 0.1 c2.2 ± 0.1 c34.4 ± 2.9 b28.7 ± 0.43 b
F2Ps-Dat-Me5.8 ± 0.5 c0.5 ± 0.03 a1.7 ± 0.1 bc47.1 ± 2.1 a93.3 ± 1.7 a
Ps-Ext15.6 ± 0.1 c0.4 ± 0.04 a1.6 ± 0.1 c45.6 ± 2.7 a93.2 ± 1.8 a
Ps-Ext26.8 ± 0.2 a0.2 ± 0.04 b1.9 ± 0.3 a19.8 ± 2.8 b93.1 ± 3.2 a
Ps-Ext36.4 ± 0.1 b0.14 ± 0.02 c1.8 ± 0.1 a12.6 ± 2.8 c90.1 ± 4.93 a
Table 4. Medjool date samples subjected to treatments (boiling, fermentation, distillation) and the corresponding codes for the isolated phenolic and polysaccharide fractions. F1, Fraction 1; F2, Fraction 2; Ph, phenolic extract; Ps, polysaccharide extract.
Sample DescriptionAcronymAmountPhenolic ExtractsPolysaccharides Fractions
Whole fresh date of Medjool cv. (reference sample)Dat-Me1 kgPh-Dat-MePs-Dat-Me-F1Ps-Dat-Me-F2
Fresh date of Medjool cv. after heating at 80 °CExt11 LPh-Ext1Ps-Ext1-F1Ps-Ext1-F2
Boiled flesh date after fermentation with Saccharomyces cerevisiae (2 g/L., 25 °C, 72 h)Ext21 LPh-Ext2Ps-Ext2-F1Ps-Ext2-F2
Distilled sample after fermentationExt31 LPh-Ext3Ps-Ext3-F1Ps-Ext3-F2
Disclaimer/Publisher’s Note: The statements, opinions and data contained in all publications are solely those of the individual author(s) and contributor(s) and not of MDPI and/or the editor(s). MDPI and/or the editor(s) disclaim responsibility for any injury to people or property resulting from any ideas, methods, instructions or products referred to in the content.