Article

Quantitative Identification of Lithology and Gas-Bearing Properties of Carbonate Reservoirs in the Majiagou Formation, Central Shaanbei Slope, Ordos Basin
1
State Key Laboratory of Continental Evolution and Early Life, Northwest University, Xi’an 710069, China
2
Department of Geology, Northwest University, Xi’an 710069, China
3
China Southern Petroleum Exploration & Development Corporation, PetroChina, Haikou 570100, China
4
School of Petroleum Engineering and Environmental Engineering, Yan’an University, Yan’an 716000, China
*
Author to whom correspondence should be addressed.
Processes 2026, 14(5), 851; https://doi.org/10.3390/pr14050851
Submission received: 24 January 2026 / Revised: 21 February 2026 / Accepted: 3 March 2026 / Published: 6 March 2026

Abstract

The identification of lithology and fluids in reservoirs is the key to the quantitative characterization of gas reservoirs. However, the Ma541 Member of the Majiagou Formation in the Ordos Basin is characterized by strong reservoir heterogeneity, variable lithologic components and complex gas–water relationships. This leads to severe overlapping of conventional logging responses, posing significant challenges to detailed reservoir evaluation. Taking the Ma541 Member in the central Shaanbei Slope of the Ordos Basin as the research object, this study adopts the logging curve superposition and reconstruction method to quantitatively identify reservoir lithology and fluid properties, and establishes a set of identification standards for lithology-fluid logging curve superposition and reconstruction. The results show that the lithology identification plate constructed by introducing new parameters eliminates dimensional differences and effectively highlights the response characteristics of different lithologies. It can rapidly and effectively identify limestone, limy dolomite, dolomite, argillaceous dolomite, and mudstone with an identification accuracy exceeding 90% and an average accuracy of over 92%. In terms of fluid identification, the constructed ΔΦ3–ΔΦ4–ΔΦ5 3D plate successfully achieved the stereoscopic differentiation of gas layers, gas-bearing water layers, water layers, and dry layers. The gas layer identification accuracy reached 93.9%, which is significantly superior to the traditional 2D crossplot method. Applying this model to the plane prediction of lithology in the Ma541 Member of the study area, it was found that the lithology distribution features “pure in the east and mixed in the west.” The central-eastern and southeastern parts of the study area mainly develop high-quality dolomite and limy dolomite reservoirs, making them favorable areas for natural gas exploration. This study provides effective technical support for the quantitative identification of lithology and fluids in non-cored well sections and improves regional exploration and development efficiency.

1. Introduction

Carbonate reservoirs occupy an important position in global oil and gas exploration and development, characterized by large reserve scales and wide distribution [1,2,3,4,5]. Controlled by multi-stage sedimentary superposition and intense diagenetic transformation, carbonate reservoirs often exhibit frequent lithological changes, highly complex pore structures, and diverse fluid occurrence states, which bring significant challenges to logging lithology identification and fluid discrimination [6,7,8,9]. How to use conventional logging data to achieve effective identification of complex carbonate lithology and fluid types remains one of the key issues in current gas reservoir description and detailed evaluation [10,11,12].
Previous studies have found that the dolomite in the Ma541 Member of the Majiagou Formation possesses favorable physical properties and is rich in oil and gas [13,14]. This dolomite reservoir formed under gypsum-salt rocks and is interbedded between limestone and mudstone [13,15,16]. It is relatively thin in thickness, with a tight texture, complex pore shapes, diverse types, and significant heterogeneity. However, this dolomite reservoir often has significant overlap in conventional logging responses with transitional lithologies such as argillaceous dolomite and limy dolomite [11,17]. This makes it difficult for single parameters or simple 2D crossplots to form stable and reliable discrimination boundaries, further increasing the uncertainty of lithology identification [10,12,18].
In recent years, logging lithology identification methods have continuously developed. In addition to traditional logging curve crossplot methods [19], technologies such as machine learning, deep learning, imaging logging, and formation element logging have been gradually introduced into carbonate reservoir research [20,21,22,23]. Existing studies show that machine learning algorithms such as Support Vector Machines (SVM), Random Forest, and XGBoost can effectively mine the non-linear characteristic relationships in logging data and achieve high classification accuracy in complex carbonate lithology identification [24,25,26,27,28,29]. At the same time, deep learning methods further enhance lithology identification capabilities through multi-layer feature extraction, showing certain advantages in thin interbedded and strongly heterogeneous reservoirs [30,31,32,33,34]. In addition, imaging logging and formation element logging are widely used in detailed carbonate lithology identification due to their high resolution and ability to directly characterize rock structure and mineral composition [34,35,36,37]. However, data-driven models rely heavily on the quantity and quality of the training samples, and model-parameter-tuning methods are often overly complex. Limited by logging data, multiple rounds of parameter tuning and comparison are required, which is time-consuming and unfavorable for field application. Moreover, there is a problem of insufficient generalization ability in environments with significant geological heterogeneity [38,39,40,41]. Special logging methods have high costs and limited applicable well sections, making them difficult to promote in large-scale non-cored wells. In contrast, lithology identification based on conventional logging curves has significant advantages in terms of cost-efficiency ratio, especially having more practical value in the absence of cores or high-resolution logging data. Furthermore, regarding fluid identification, carbonate reservoirs also face problems such as complex logging responses, well-developed gas–water transition zones, and severe coupling between lithology and fluid responses [42]. Although parameters such as resistivity, acoustic velocity, and neutron porosity are sensitive to fluid properties to some extent, they are often strongly constrained by lithological background, shale content, and pore structure in practical applications, leading to massive overlap of different fluid types in 2D crossplots and difficulty in stable differentiation. Non-reservoirs, such as mudstone, generally contain irreducible water or adsorbed fluids, but their logging responses mainly reflect the lithological background rather than effective fluid characteristics. If not effectively distinguished during fluid identification, interpretation deviations can easily be introduced, limiting application in complex carbonate reservoirs [42]. Therefore, constructing a method that can achieve stable lithology and fluid identification under conventional logging conditions is of great significance for characterizing the gas enrichment laws of complex carbonate reservoirs.
Based on the above problems, this paper comprehensively applies a large amount of data from core descriptions, logging, core analysis and testing, mud logging, and gas testing. A normalized multi-curve superposition method is used to quantitatively identify the carbonate reservoirs of the Ma541 Member of the Majiagou Formation in the central Ordos Basin. Five types of lithology—limestone, limy dolomite, dolomite, argillaceous dolomite, and mudstone—are precisely divided to predict favorable areas. A 3D plate is constructed to identify reservoir fluid properties, identifying gas layers, gas-bearing water layers, water layers, and dry layers. Based on conventional logging data, this study establishes a set of identification standards for lithology-fluid curve superposition and reconstruction, which can quickly and accurately determine the lithology categories of carbonate rocks and identify fluid properties. This is of great significance for improving the accuracy of gas reservoir identification and predicting favorable areas in the study area.

2. Geological Background

The Ordos Basin is located in central-western China and is an important part of the North China Platform. It is a large-scale polycyclic composite cratonic basin with a total area of about 25   ×   10 4   km 2 . The interior of the basin can be divided into six major tectonic units: Yimeng Uplift, Western Thrust Belt, Tianhuan Depression, Yishan Slope, Jinxi Flexure Belt, and Weibei Uplift [43,44,45,46]. During the Ordovician period, the basin exhibited a significant “East–West differentiation” sedimentary pattern bounded by the Central Peak Uplift: the west side belonged to the Qilian Sea area, dominated by carbonate and shale deposition [1,19]; the east side belonged to the North China Sea area, developing the Lower Ordovician Yeli Formation, Liangjiashan Formation, and the Middle Ordovician Majiagou Formation, characterized by a symbiotic association of carbonate rocks and evaporites [13].
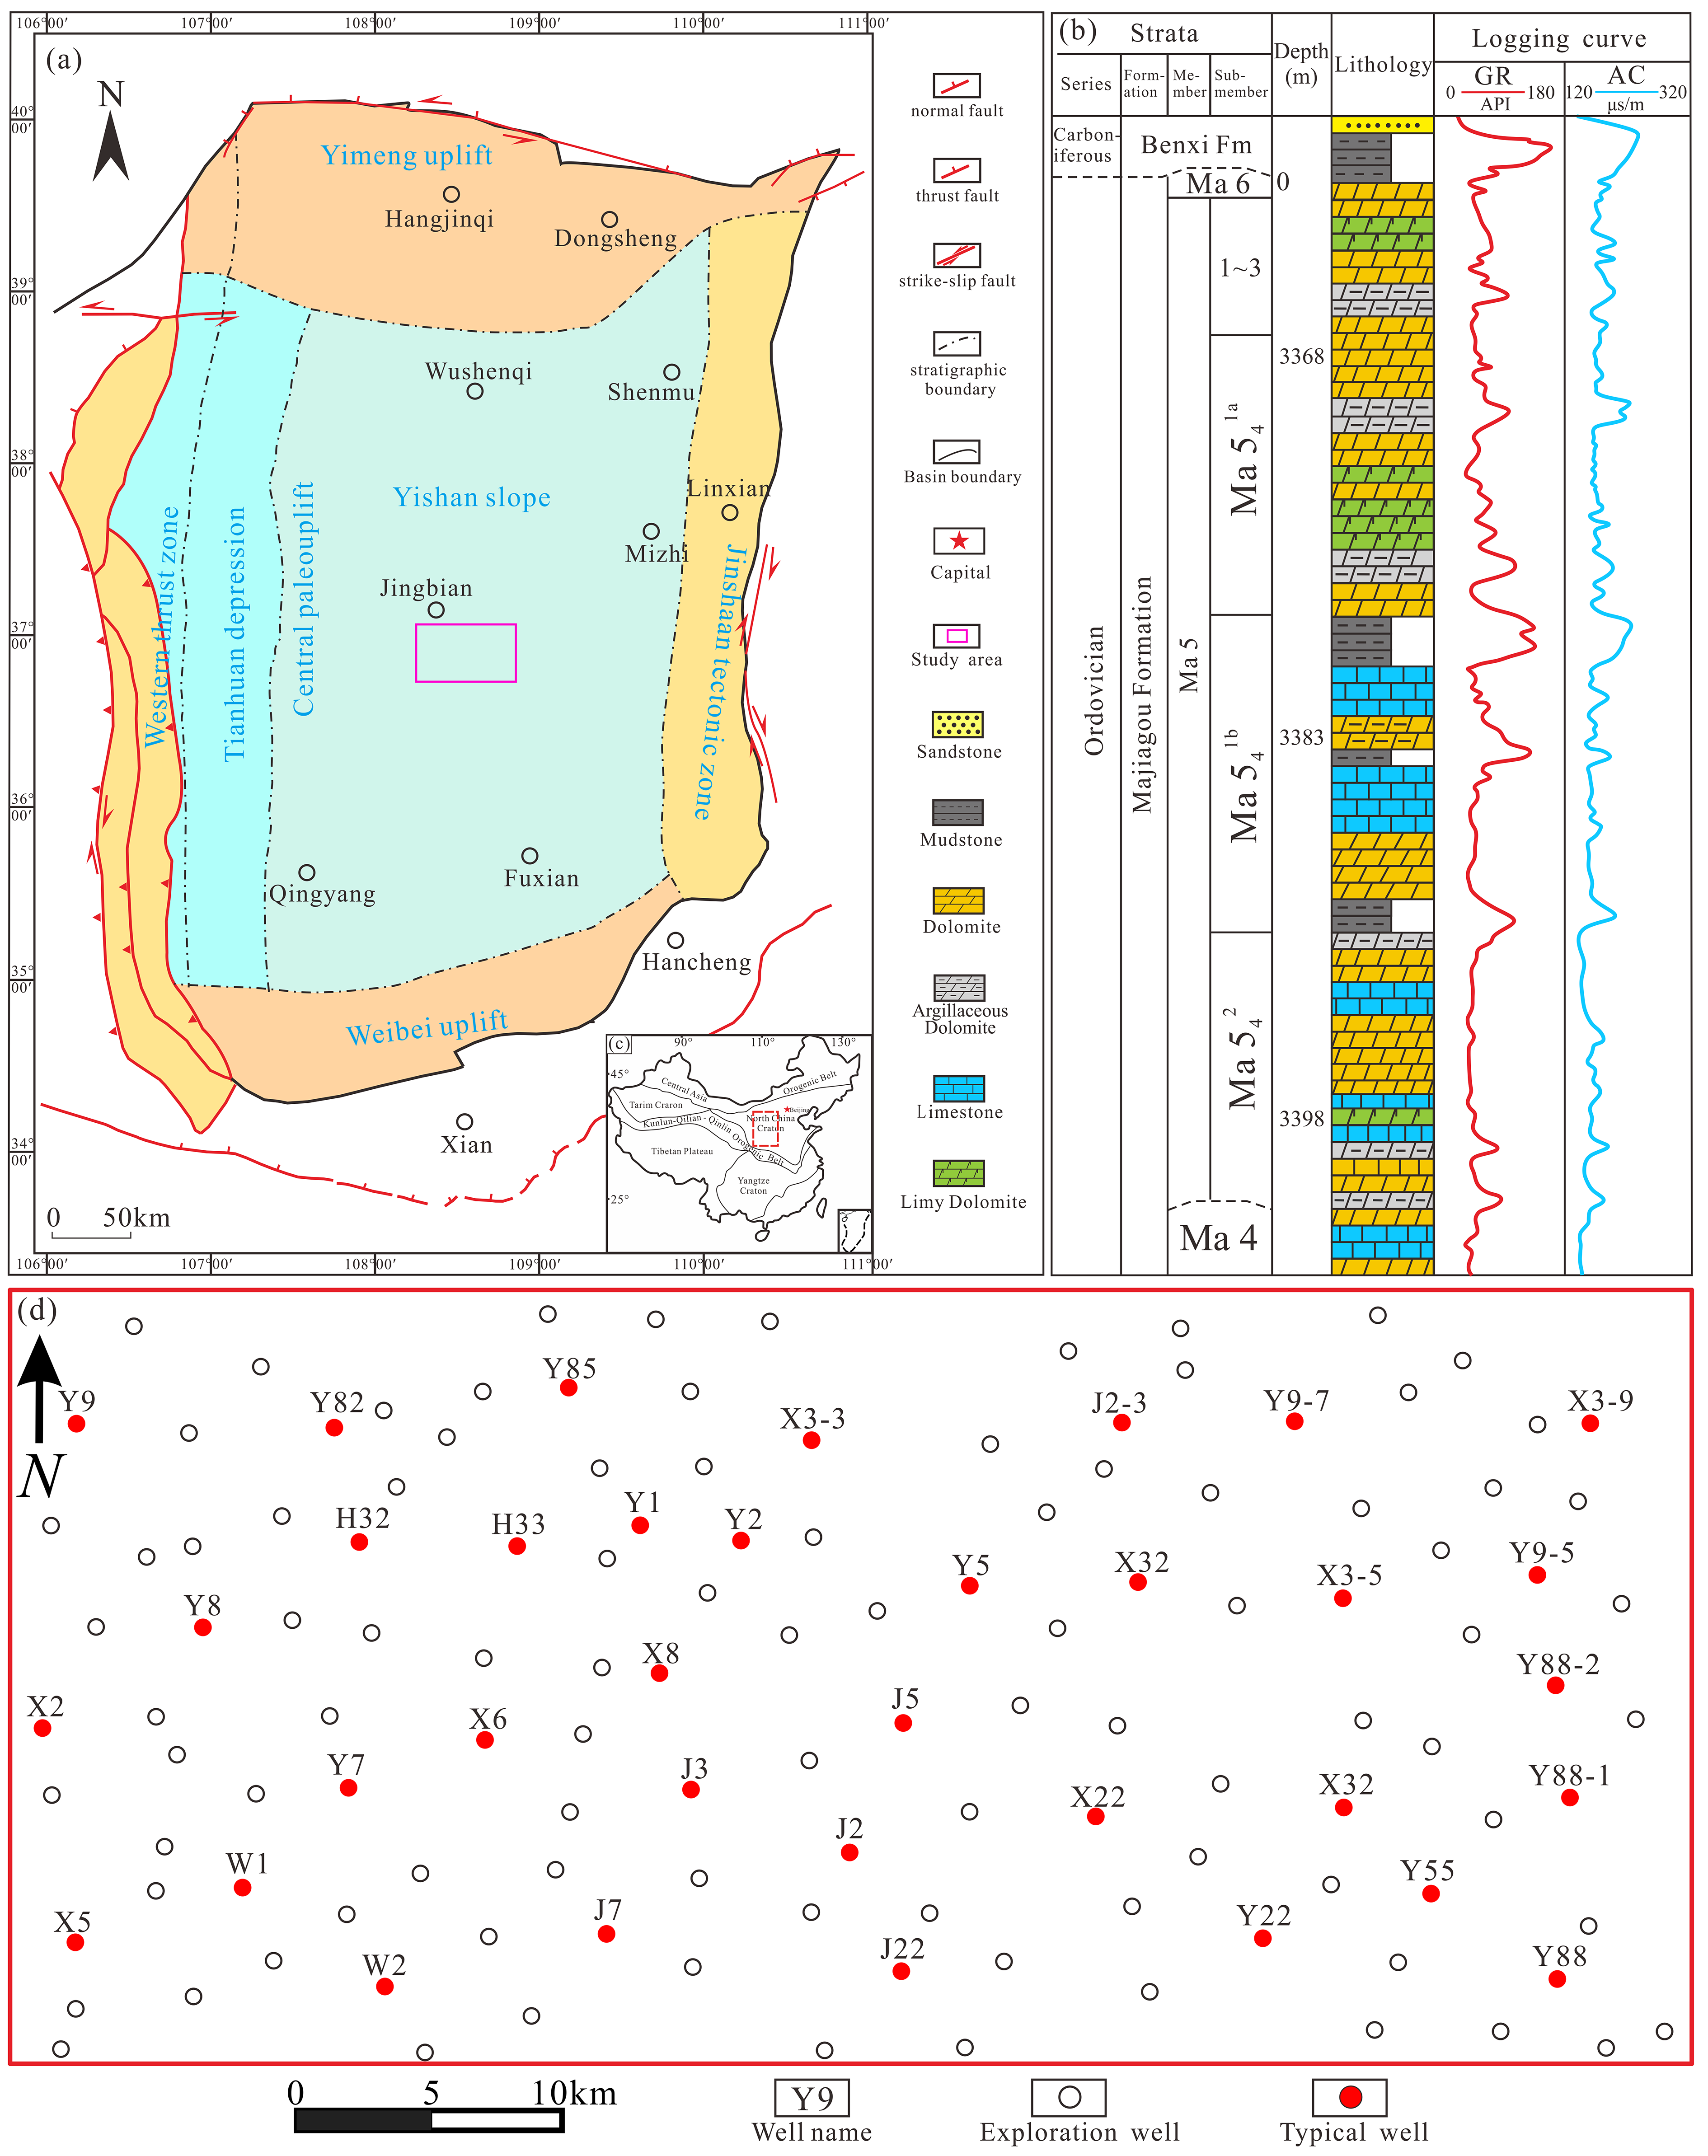
The study area is the X-well block in the central part of the Northern Shaanxi Slope, Ordos Basin [47,48]. The study area covers approximately 1060   km 2 and belongs structurally to the central-northern section of the Yishan Slope (Figure 1). During the Middle Ordovician Majiagou period, the sedimentary sequence consisted of six lithological members (Ma1–Ma6) from bottom to top [49]. The target layer is subzone 1 of the Ma54 submember of the Middle Ordovician, which is an important target layer series for natural gas exploration and development in the basin. The Ma541 Member is located within the Ma5 Member as a relatively stable subzone unit, but it still shows significant heterogeneity on a regional scale. This subzone is dominated by dolomite, limestone, and limy dolomite, locally interbedded with mudstone or argillaceous dolomite. The lithology changes rapidly laterally and overlaps frequently vertically [1,2].

3. Data and Methods

3.1. Data Setting

3.1.1. Data Preparation

This study collected data from 128 drilled wells, including 35 cored wells. The drilling and logging curves include Gamma Ray Logging (GR), Photoelectric Absorption Cross-section Index (PE), Density Logging (DEN), Compensated Neutron Log (CNL), Acoustic Travel Time (AC), and Resistivity logs (Deep Resistivity RD, Shallow Resistivity RS), etc. A total of 282 core samples were collected for gas-measured permeability and weight-method porosity measurements to obtain relevant physical property parameters. The porosity testing equipment was the Smart-Por porosity tester (Porous Materials, Inc., Ithaca, NY, USA), and the permeability testing equipment was the Smart-PermII Ultra Low Permeameter (Porous Materials, Inc., Ithaca, NY, USA). The above experimental steps were all based on the national standard GB/T29171-2012 [50], and the experimental equipment came from the State Key Laboratory of Continental Evolution and Early Life, Northwest University, Xi’an, China.

3.1.2. Correlation Analysis

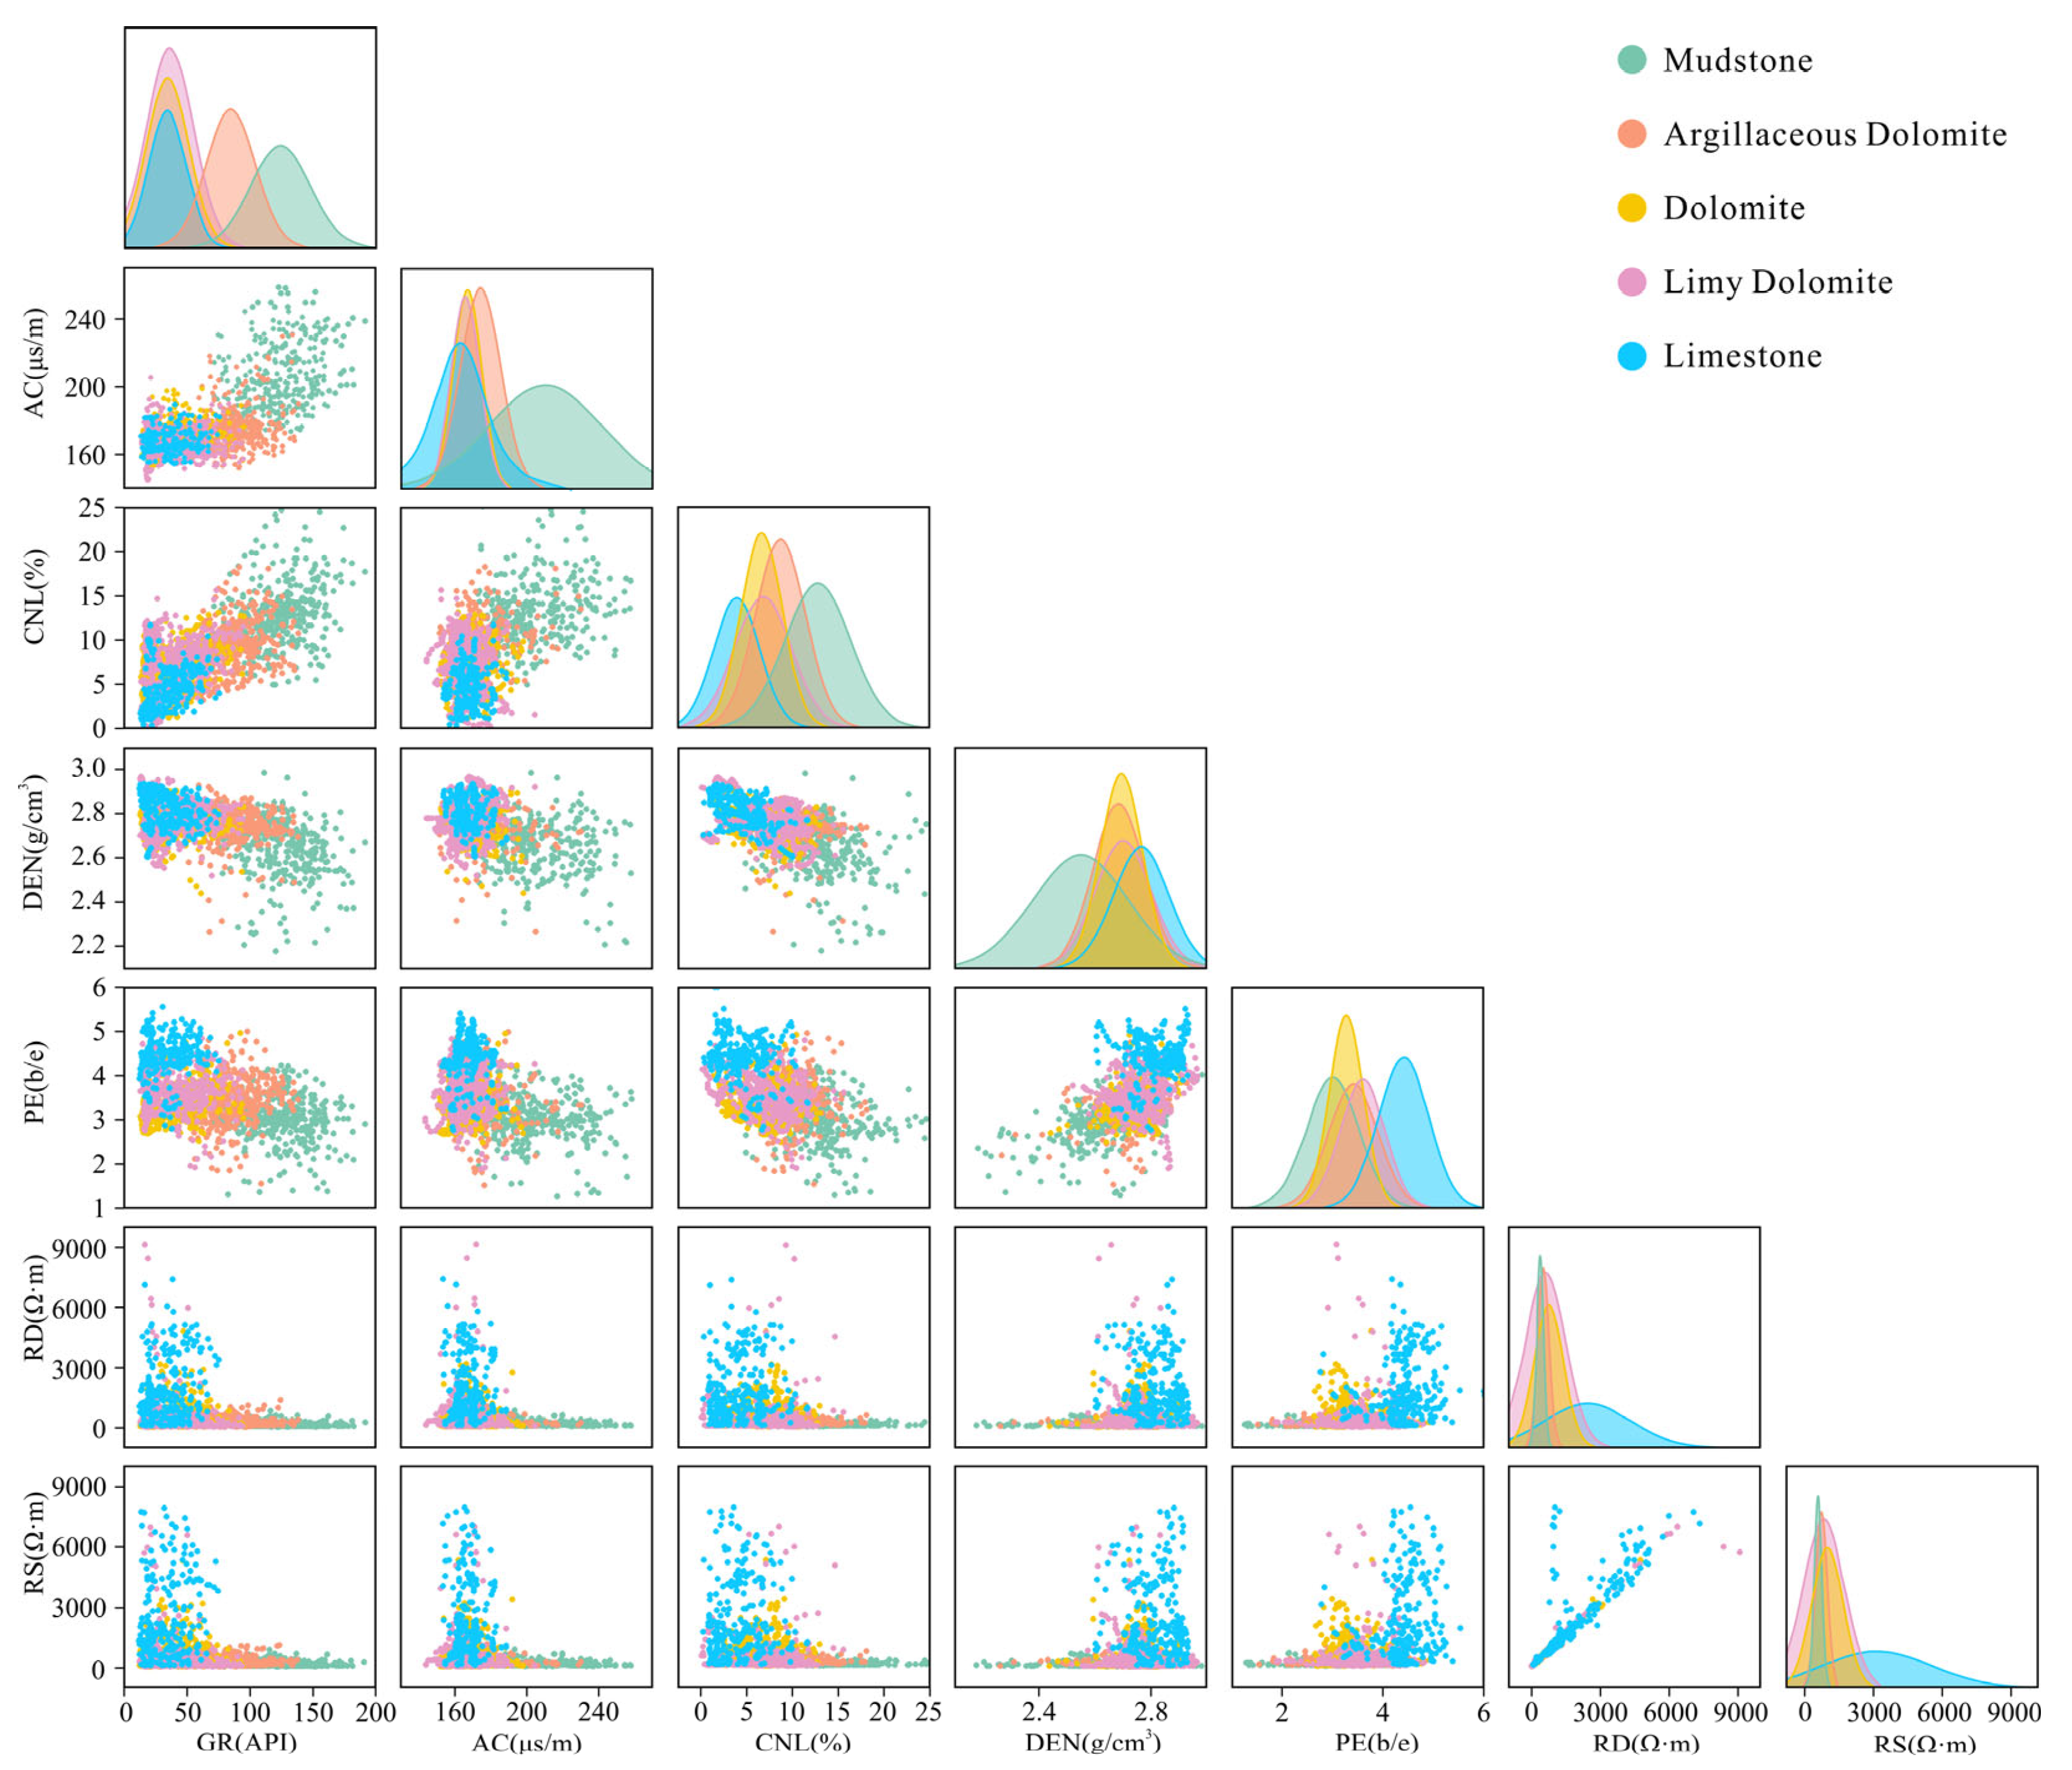
The 7 logging curves selected for the study show different sensitivities to different lithologies. Scatter crossplots reveal the coupling relationship among the variables: 1. Sample GR values range from 11.21 to 220 API. Mudstone samples are distributed in the higher radioactivity interval. The peaks of argillaceous dolomite and mudstone on the GR probability curve are clearly separated from other lithologies, so GR can be used to distinguish mudstone and argillaceous dolomite from other lithologies; 2. The sample AC values range is 136.32~292.33 µs/m. The AC values of mudstone are generally large. There are two separate peaks on the AC probability density curve, indicating it can distinguish mudstone from other lithologies very well; 3. The sample CNL values range is between 0.07~26.32%. The peaks on the CNL probability density curve overlap, with only slight differences for mudstone, showing no obvious division for lithology; 4. The sample DEN values range from 1.77 to 2.93 g/cm3. Similar to CNL, the density curve peaks of lithologies have no obvious separation, indicating that a single DEN parameter has limited ability to distinguish lithologies; 5. The sample PE values range from 1.1 to 7. Limestone samples have generally higher PE values, showing a distinct density peak compared to other lithologies, which suggests that PE has a significant ability to distinguish limestone from other lithologies; 6. Sample RD values range from 1.21~9211.3 Ω·m. There is no obvious distinction among the 5 lithologies on the density probability curve; 7. Sample RS values range is 0.11~9531.6 Ω·m. It shows strong overlap in the scatter plot and density distribution, resulting in poor reliability when RS is used alone for lithology discrimination (Figure 2).
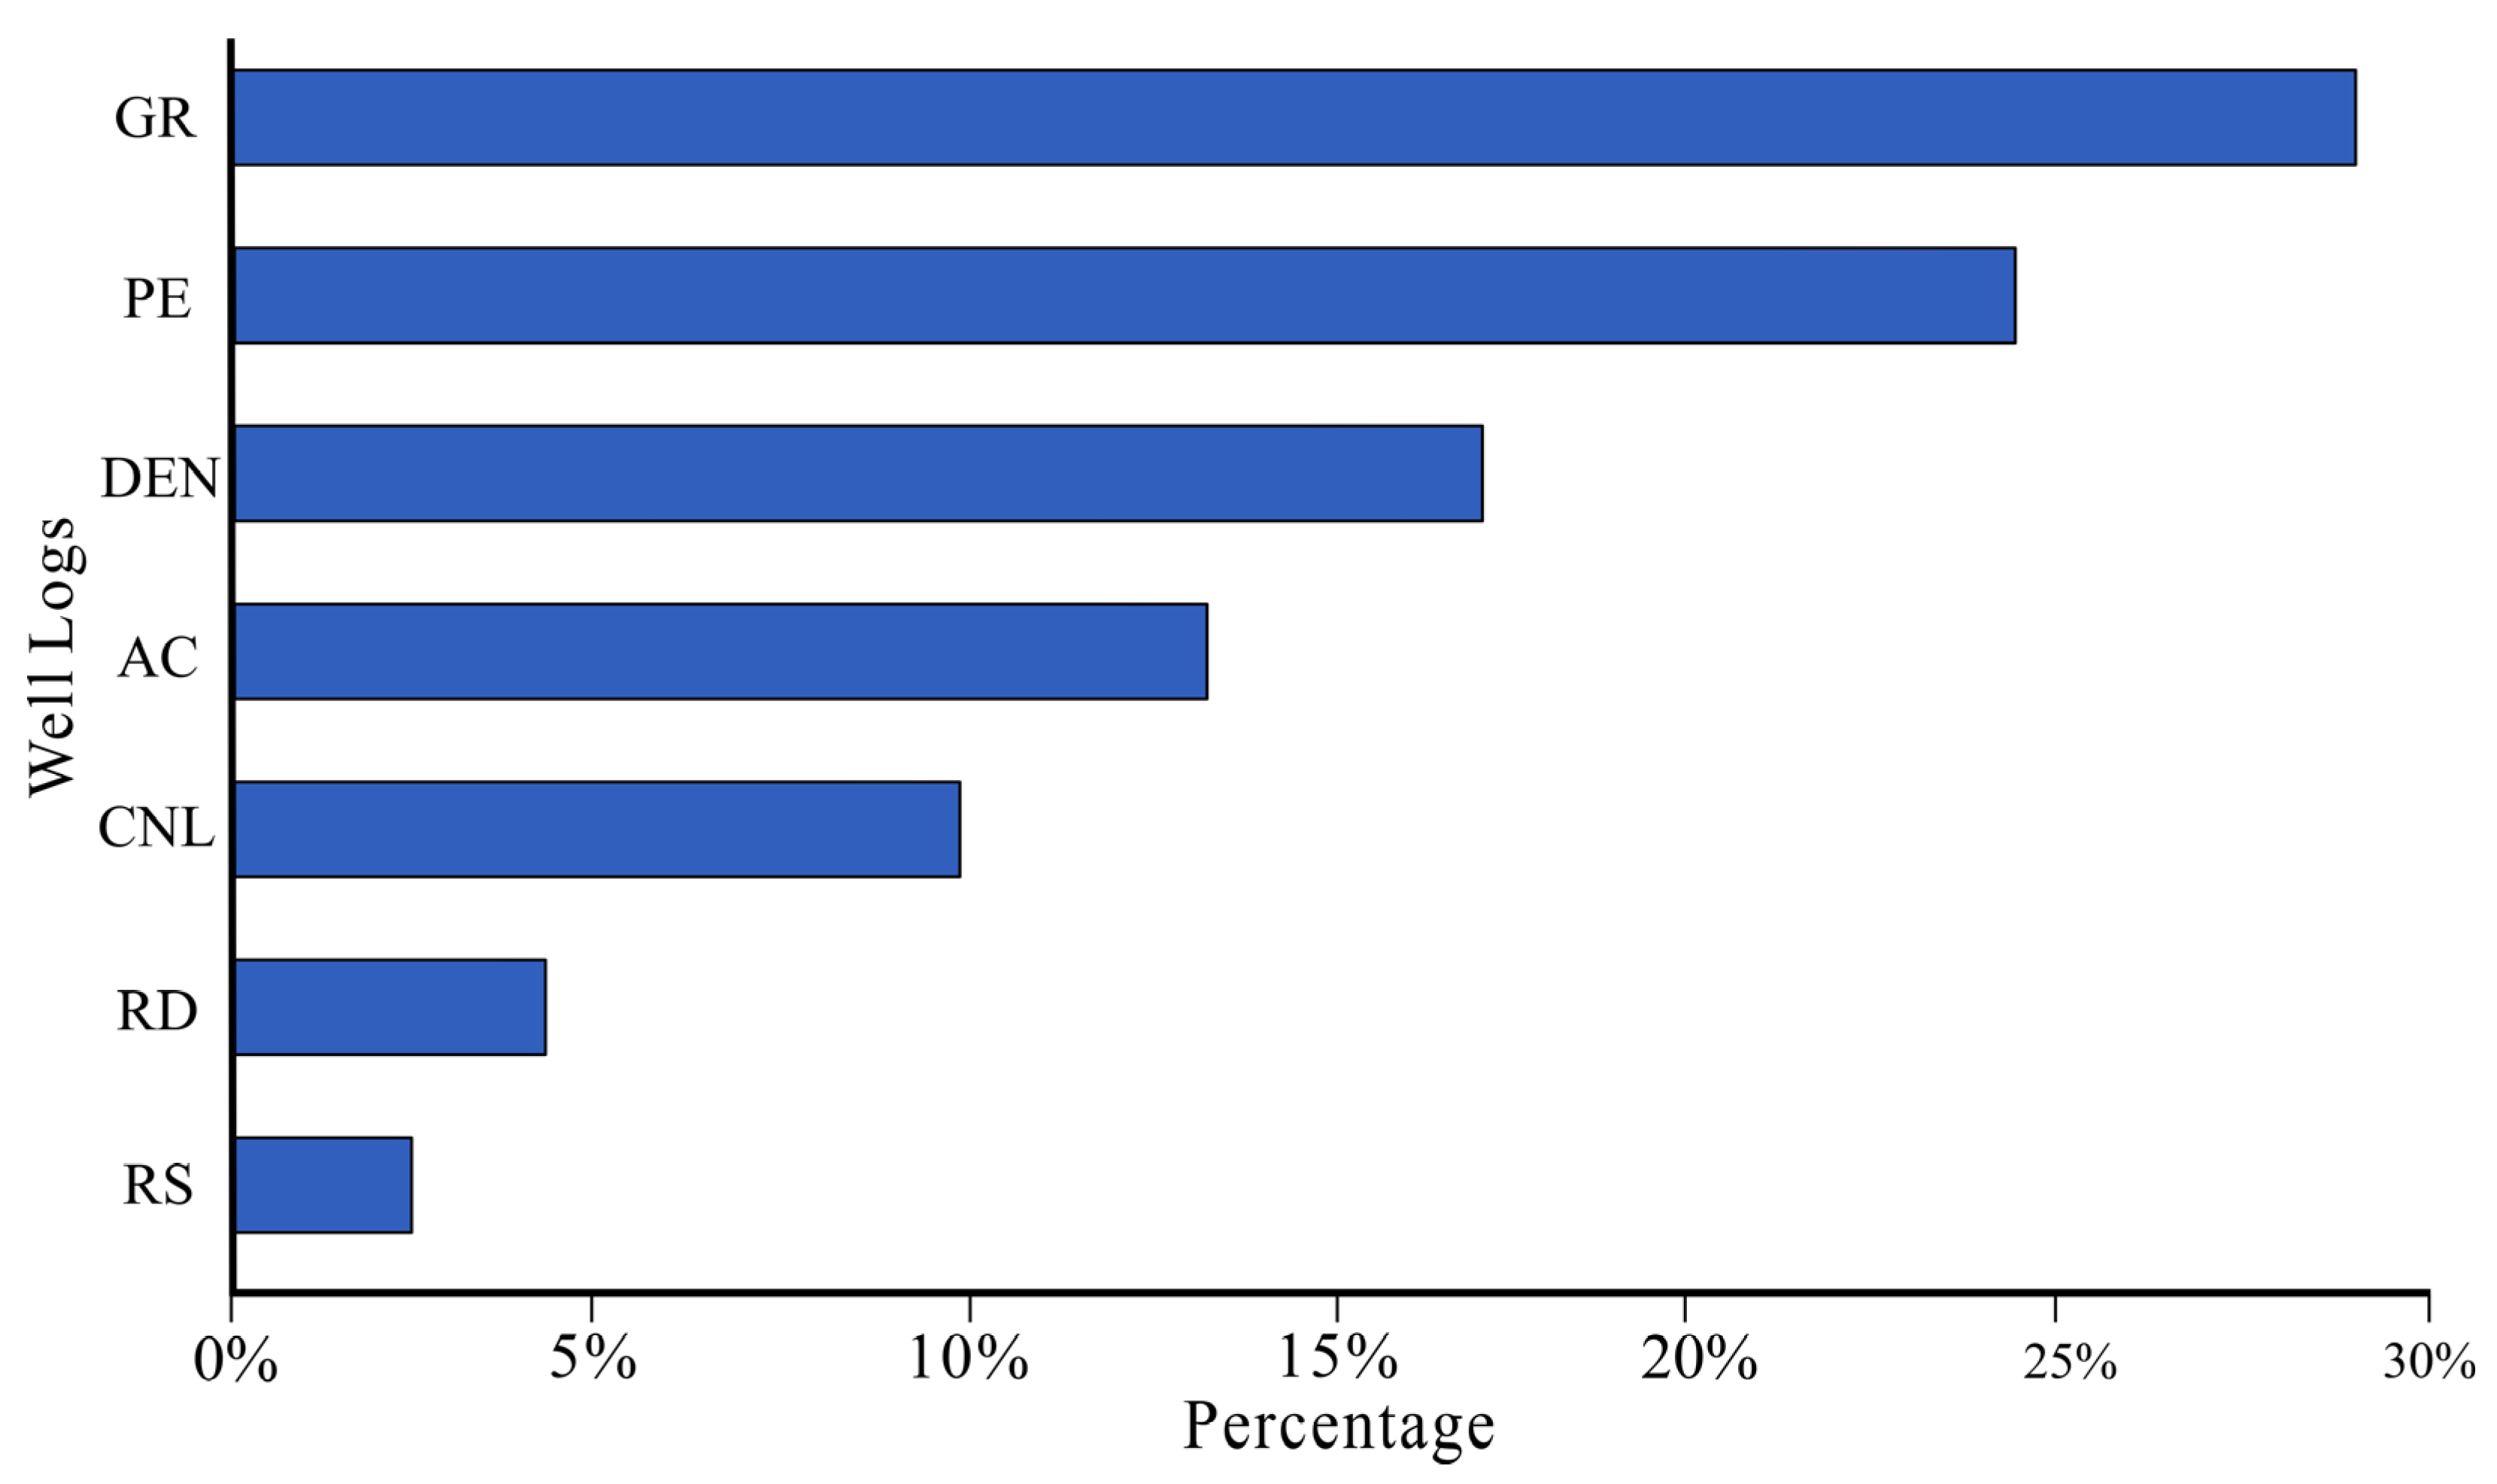
In summary, crossplots of lithologies and logging parameters generally show significant response overlap. The overlap between argillaceous dolomite, limy dolomite, and end-member lithologies is obvious, reflecting the continuity and complexity of carbonate lithology changes in the study area. This indicates that it is difficult to achieve accurate lithology differentiation based on single or a few 2D crossplots. In order to exclude other logging attributes considered unnecessary and redundant from the dataset and improve the accuracy of lithology prediction, feature importance analysis was a method adopted to evaluate the influence of different logging curve data on lithology. From the 7 logging curves (GR, PE, DEN, AC, CNL, RD, and RS), GR, PE, DEN, AC, CNL, and RD curves with high contribution rates to quantitative lithology identification were selected for superposition and reconstruction (Figure 3).

3.2. Curve Superposition Reconstruction Method

In this study, 128 wells were selected according to the selection principles of Petro China logging data (SY/T 6451-2000 [51]). Aiming at the thin and complex lithology of the Ma541 Member, and considering that the dimensions of GR, DEN, PE, CNL, AC, and RD logging curves are different and their magnitudes vary greatly, normalization processing is required for the logging data. The response values of each logging curve are unified into scalars scaled in the range of [0, 1]. The normalized logging curves are then superimposed and reconstructed based on marker layers. The specific operations are as follows:
(1) Normalize the GR, DEN, PE, CNL, AC, and RD curves of the selected wells. The normalization formula is:
X = X X min X max X min
(where X* is the normalized lithology logging characteristic value, Xmin is the minimum value of the lithology logging characteristic value, and Xmax is the maximum value of the lithology logging characteristic value). The normalized logging curves were thus obtained.
(2) Select the mudstone of the Ma541 Member in the study area as the marker layer. Based on the marker layer, combined with core analysis data and mud logging data, take the average values of GR (Natural Gamma Ray), DEN (Density Logging), and PE (Photoelectric Absorption Cross-section Index) corresponding to the same lithology at different depths. Values are taken at intervals of 0.5 m to reduce errors caused by random sampling. Establish crossplots using the difference values of the normalized curves for different lithologies: ΔΦ1 = GR* − DEN* and ΔΦ2 = PE* + DEN* − 1, to identify different lithologies.
(3) On the basis of accurate lithology identification, using the marker layer as a benchmark, establish new normalized curve superposition reconstruction formulas for the fluids in dolomite reservoirs: ΔΦ3 = RD* − AC*, ΔΦ4 = CNL* + AC*, and ΔΦ5 = GR* + DEN*.

4. Results

4.1. Characteristics of Carbonate Reservoirs

4.1.1. Lithology Types

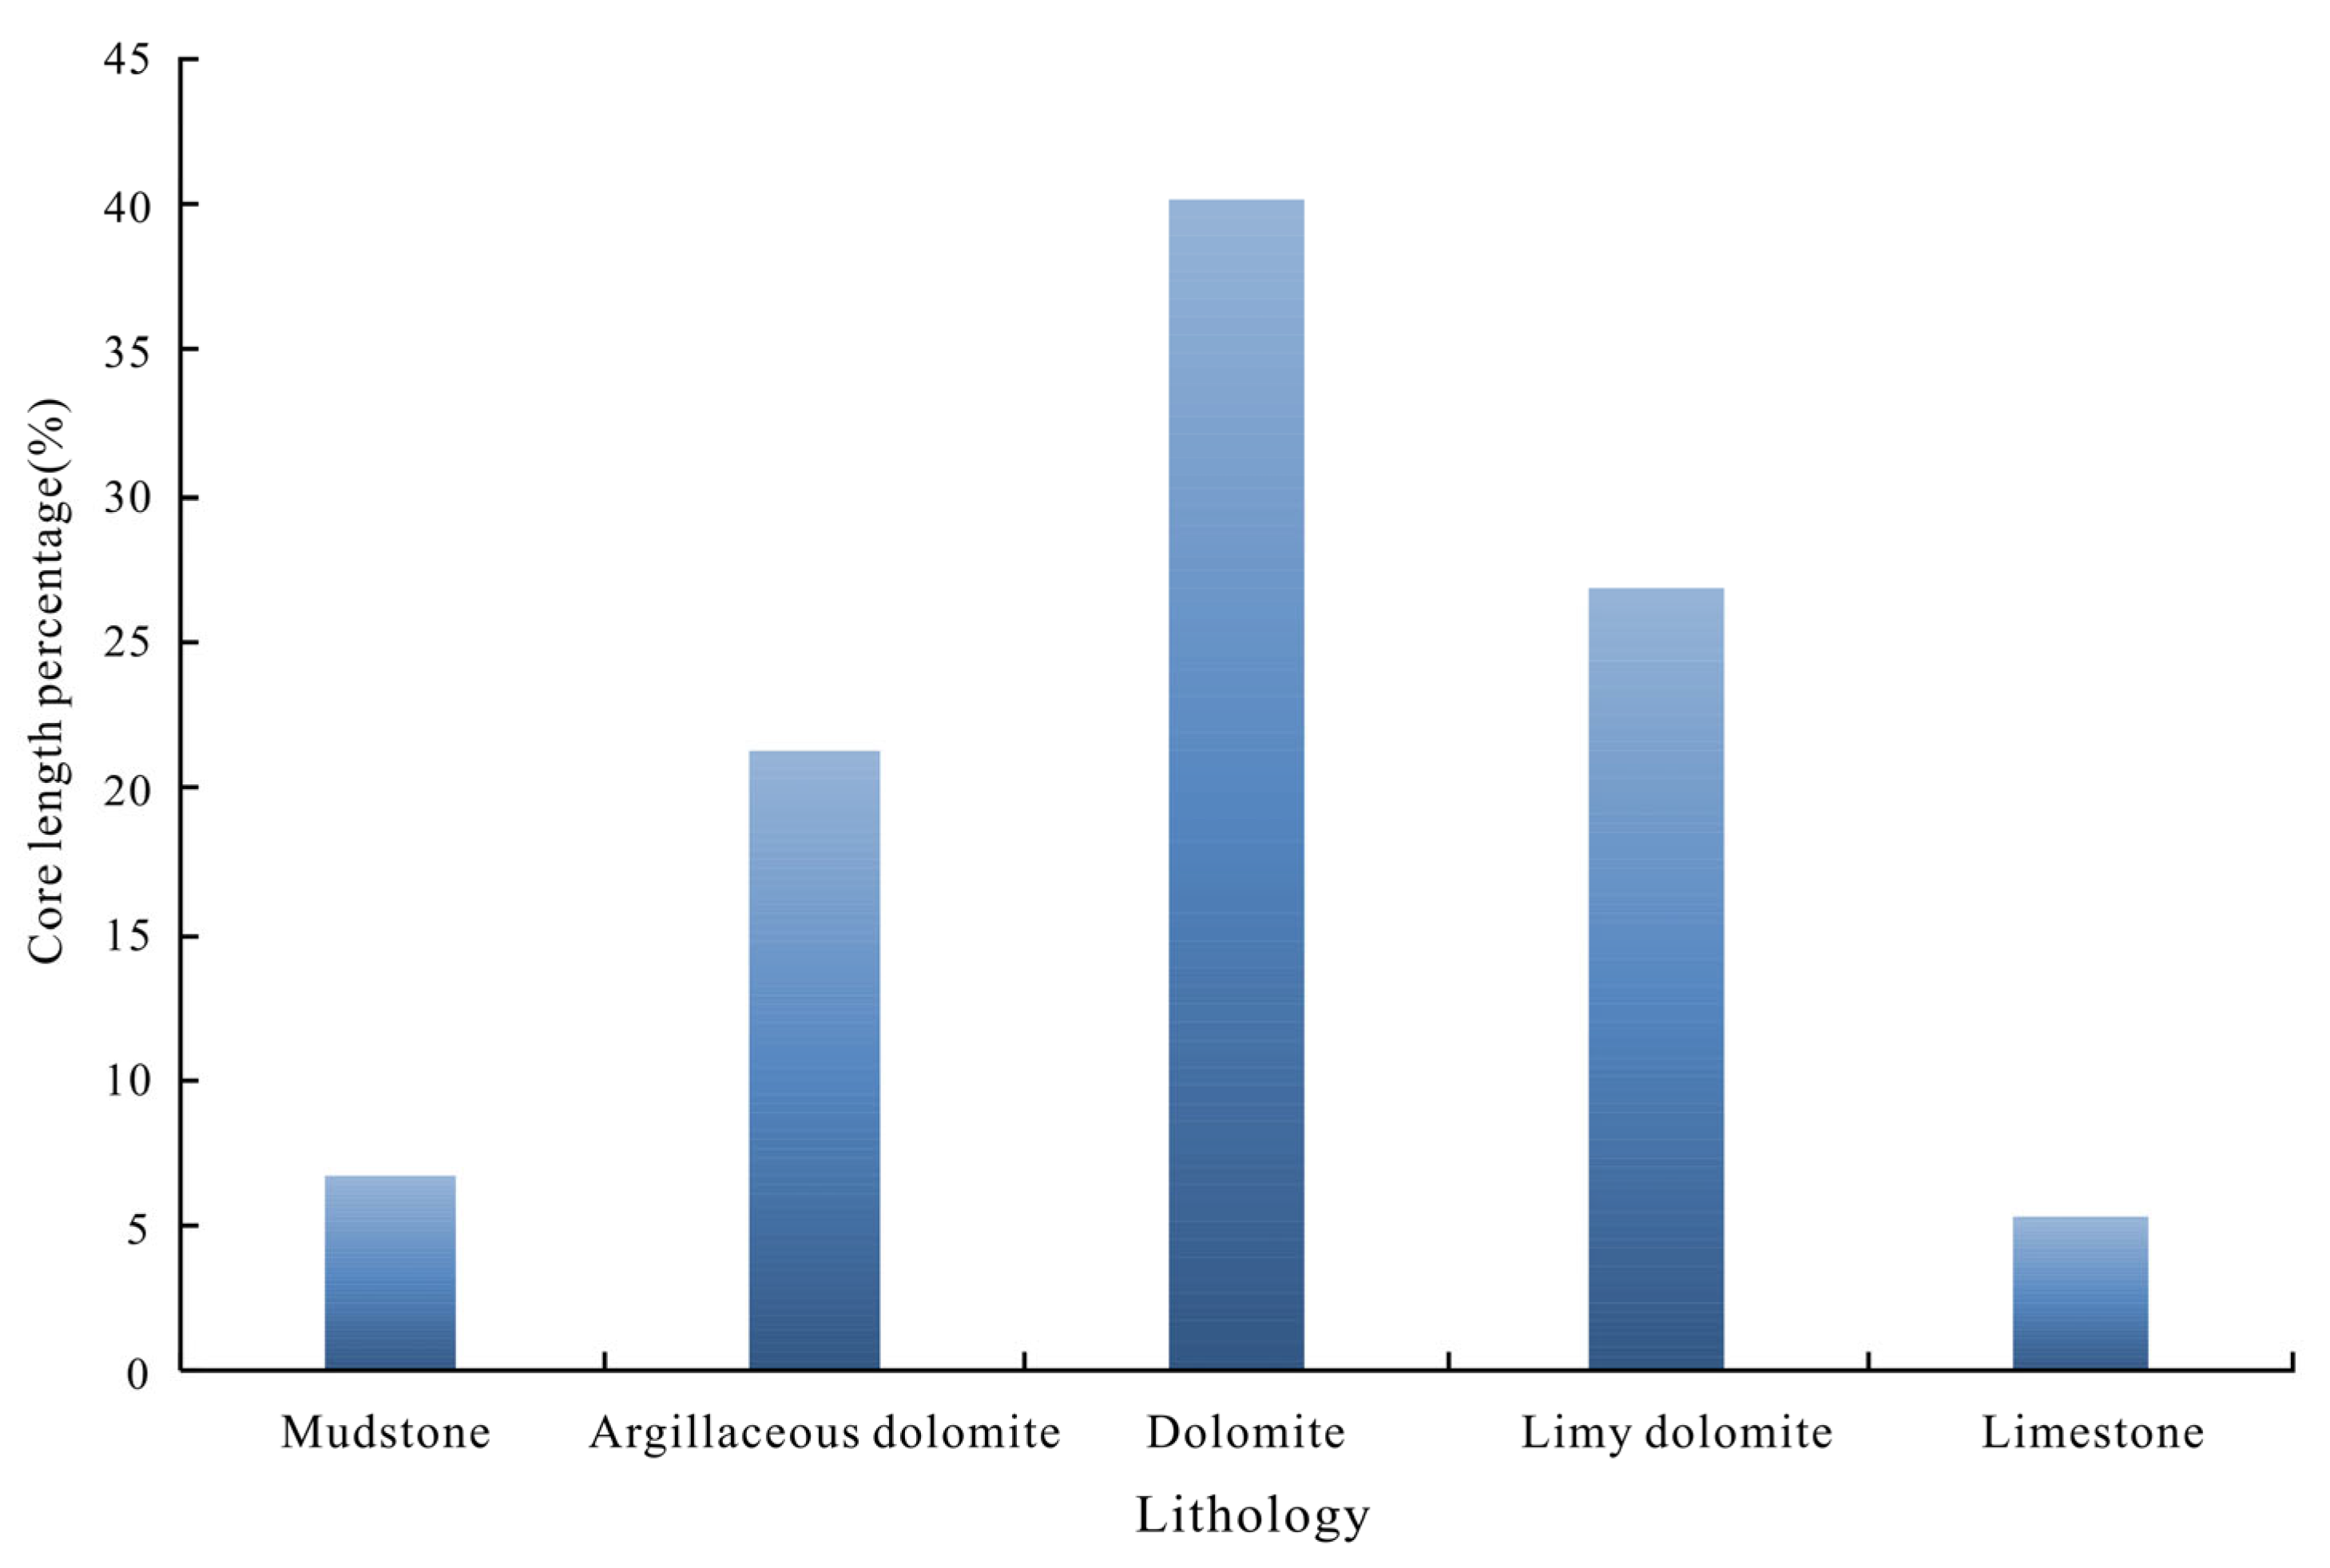
Based on statistical analysis of mud logging data from 35 wells in the Ma541 member of the study area, five lithologies have been identified (Figure 4): limestone, limy dolomite, dolomite, argillaceous dolomite, and mudstone. Among these, dolomite is the most abundant, accounting for 40.1% of the total mud logging data. Limy dolomite ranks second at 26.8%, followed by argillaceous dolomite at 21.2%. Limestone and mudstone have the least content, representing 6.7% and 5.2% of the total records, respectively.

4.1.2. Physical Properties

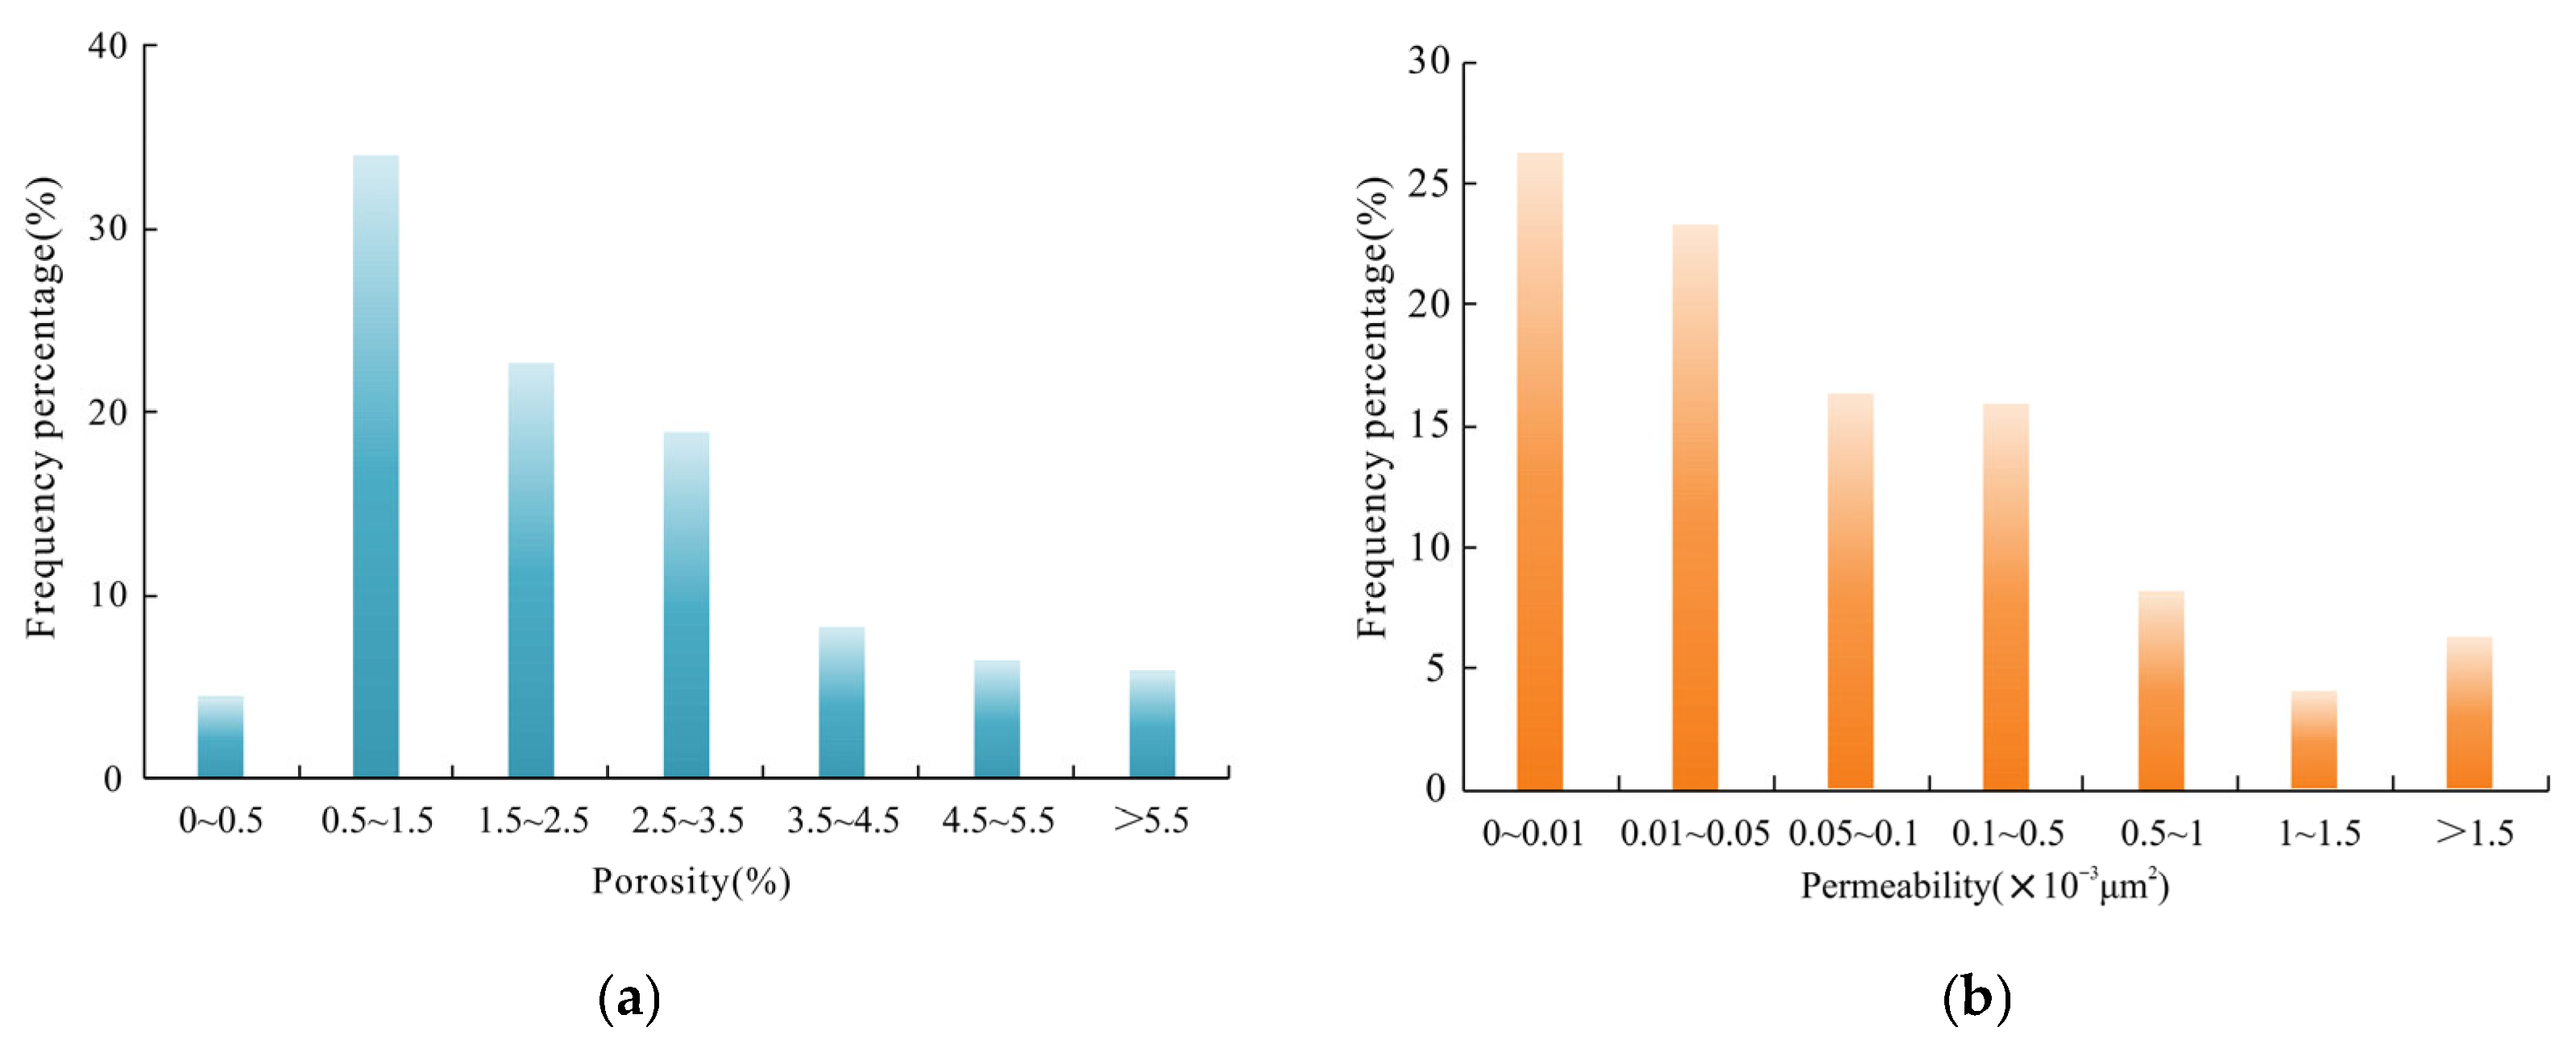
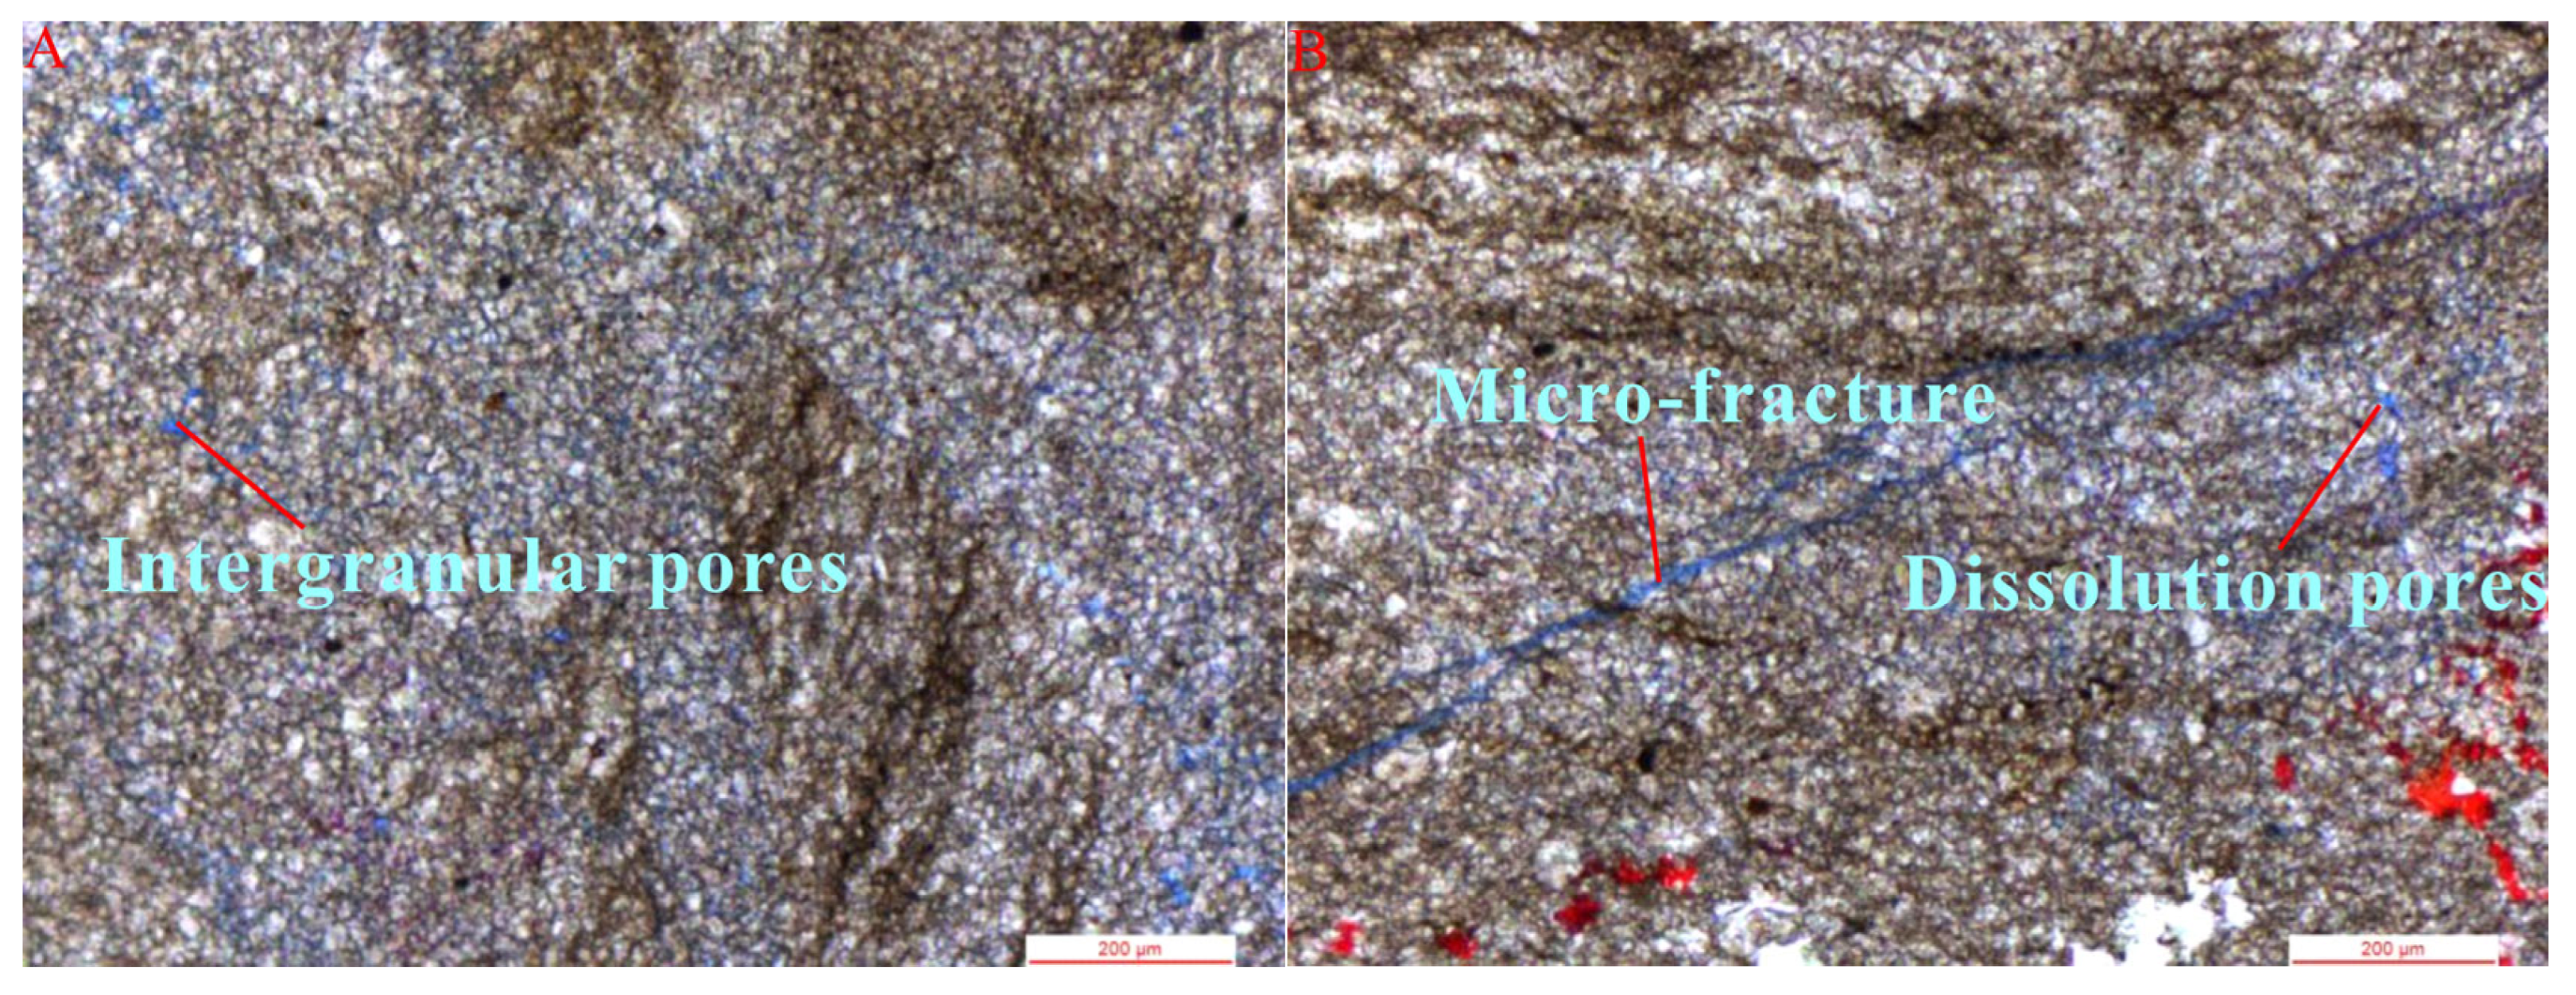
The results of physical property tests conducted on 282 core samples from the study area indicate that the carbonate rocks of the Ma541 Member have poor reservoir quality, with the reservoirs generally exhibiting low porosity and low permeability characteristics. The porosity of the reservoirs ranges from 0.15% to 10.21%, with an average value of 2.537%. Porosity values are mainly concentrated in the range of 2.5% to 4.5%, accounting for 75.1% of the total number of samples (Figure 5a). The permeability ranges from 0.00109 to 2.43 × 10⁻³ μm2, with an average of 0.152 × 10⁻³ μm2, and is primarily concentrated in the interval of 0.01 to 0.5 × 10⁻³ μm2, making up 81.2% of the total samples (Figure 5b). Statistical data indicate that the main types of reservoir spaces in the study area are intergranular pores, dissolution pores, and micro-fractures (Figure 6), which are predominantly distributed in dolomite.

4.1.3. Gas-Bearing Characteristics

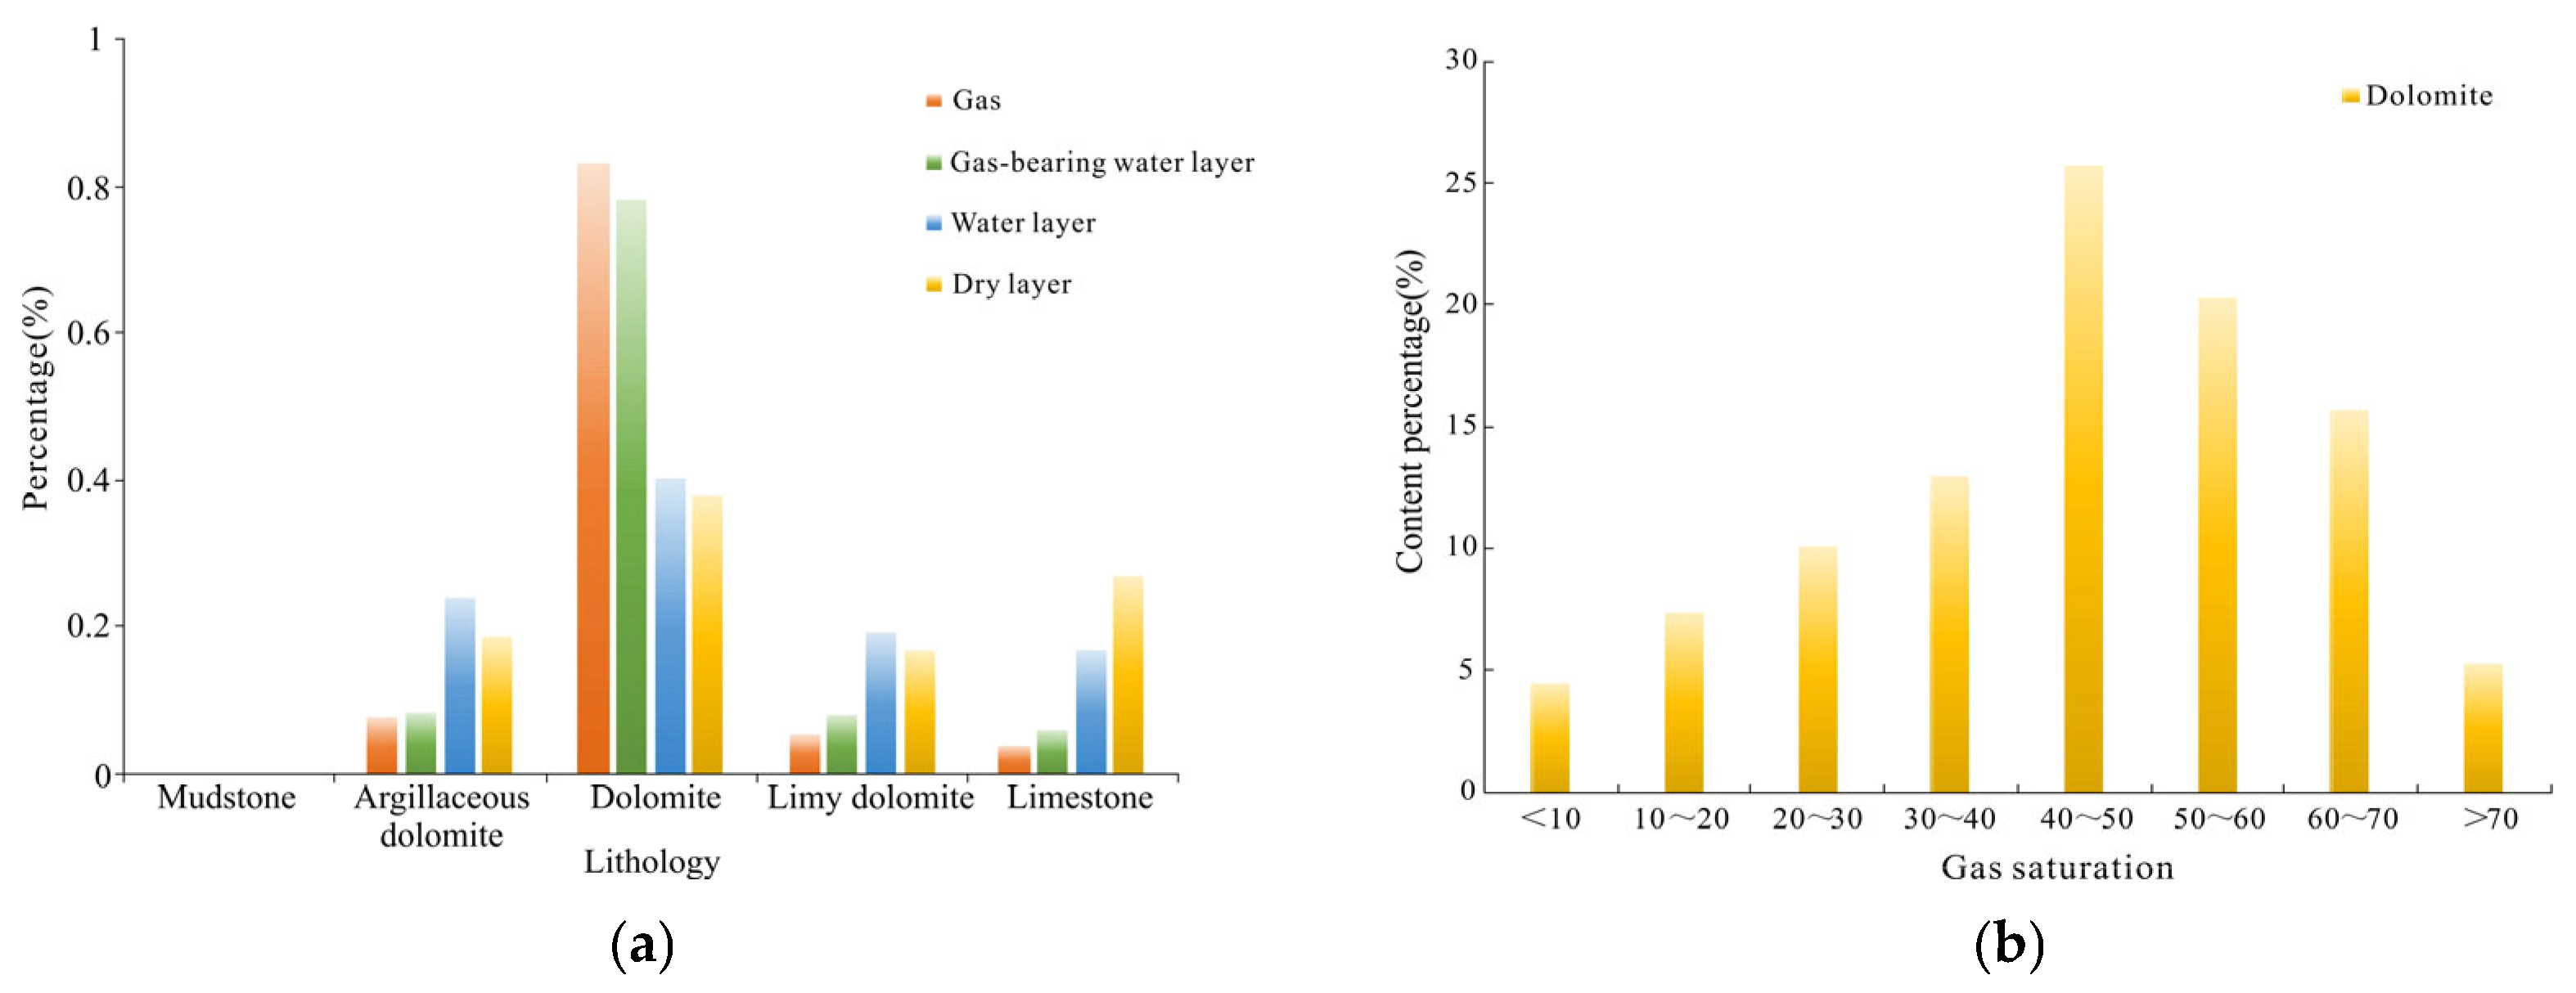
In the Ma541 interval of the study area, the distribution of different fluid types exhibits distinct lithological selectivity (Figure 7a). Gas layers are predominantly developed in dolomite, followed by a gas-bearing water layer. Although the water layer and dry layer are distributed across all lithologies, their occurrence frequency in dolomite is significantly lower than that in limestone and argillaceous dolomite. The dolomite intervals in the study area have generally undergone varying degrees of dolomitization, with well-developed intergranular pores and secondary dissolution pores. Compared with limestone, dolomite exhibits better pore connectivity and reservoir quality. In contrast, the pore structure in limestone and argillaceous dolomite is significantly affected by cementation and argillaceous filling, resulting in poor continuity of reservoir spaces. Even where gas is locally present in these lithologies, it typically manifests as a gas-bearing water layer or low-saturation gas layer, whose logging responses often overlap partially with those of a water layer or a dry layer.
The gas enrichment in the study area is significantly controlled by lithological conditions, with dolomite representing the most favorable gas-bearing lithology. Gas preferentially enriches in dolomite intervals characterized by well-developed pore structures and higher connectivity. To further characterize the degree of gas enrichment in dolomite intervals, a statistical analysis was conducted on the distribution characteristics of gas saturation in dolomite sections. The results show that the gas saturation in dolomite generally presents relatively high values, with distinct high gas saturation intervals observed in local layers. This indicates that dolomite is not only the primary lithology hosting gas zones but also the dominant reservoir for natural gas accumulation in the study area. The heterogeneous distribution of gas saturation within dolomite reflects the differences in the degree of dolomitization, dissolution modification, and microfracture development, which collectively control the formation of pore structures and effective reservoir spaces. From the perspective of gas saturation frequency distribution (Figure 7b), the samples are mainly concentrated in the range of 40% to 60%, suggesting that the dolomite reservoirs in the study area are generally characterized by moderately high gas-bearing properties, while high-abundance gas reservoirs are mostly confined to local favorable reservoir intervals. There are significant differences in gas-bearing properties among dolomite reservoirs of different lithologic types. Gas-bearing capacity is mainly controlled by lithology type and reservoir space structure. The combined development of intergranular pores, dissolution pores, and micro-fractures in tight-medium-fine crystalline dolomite provides favorable conditions for gas accumulation, making it a favorable target interval for carbonate gas reservoir exploration in the Ordos Basin.

4.2. Lithology Identification of Reservoirs

4.2.1. Logging Characteristics of Lithology

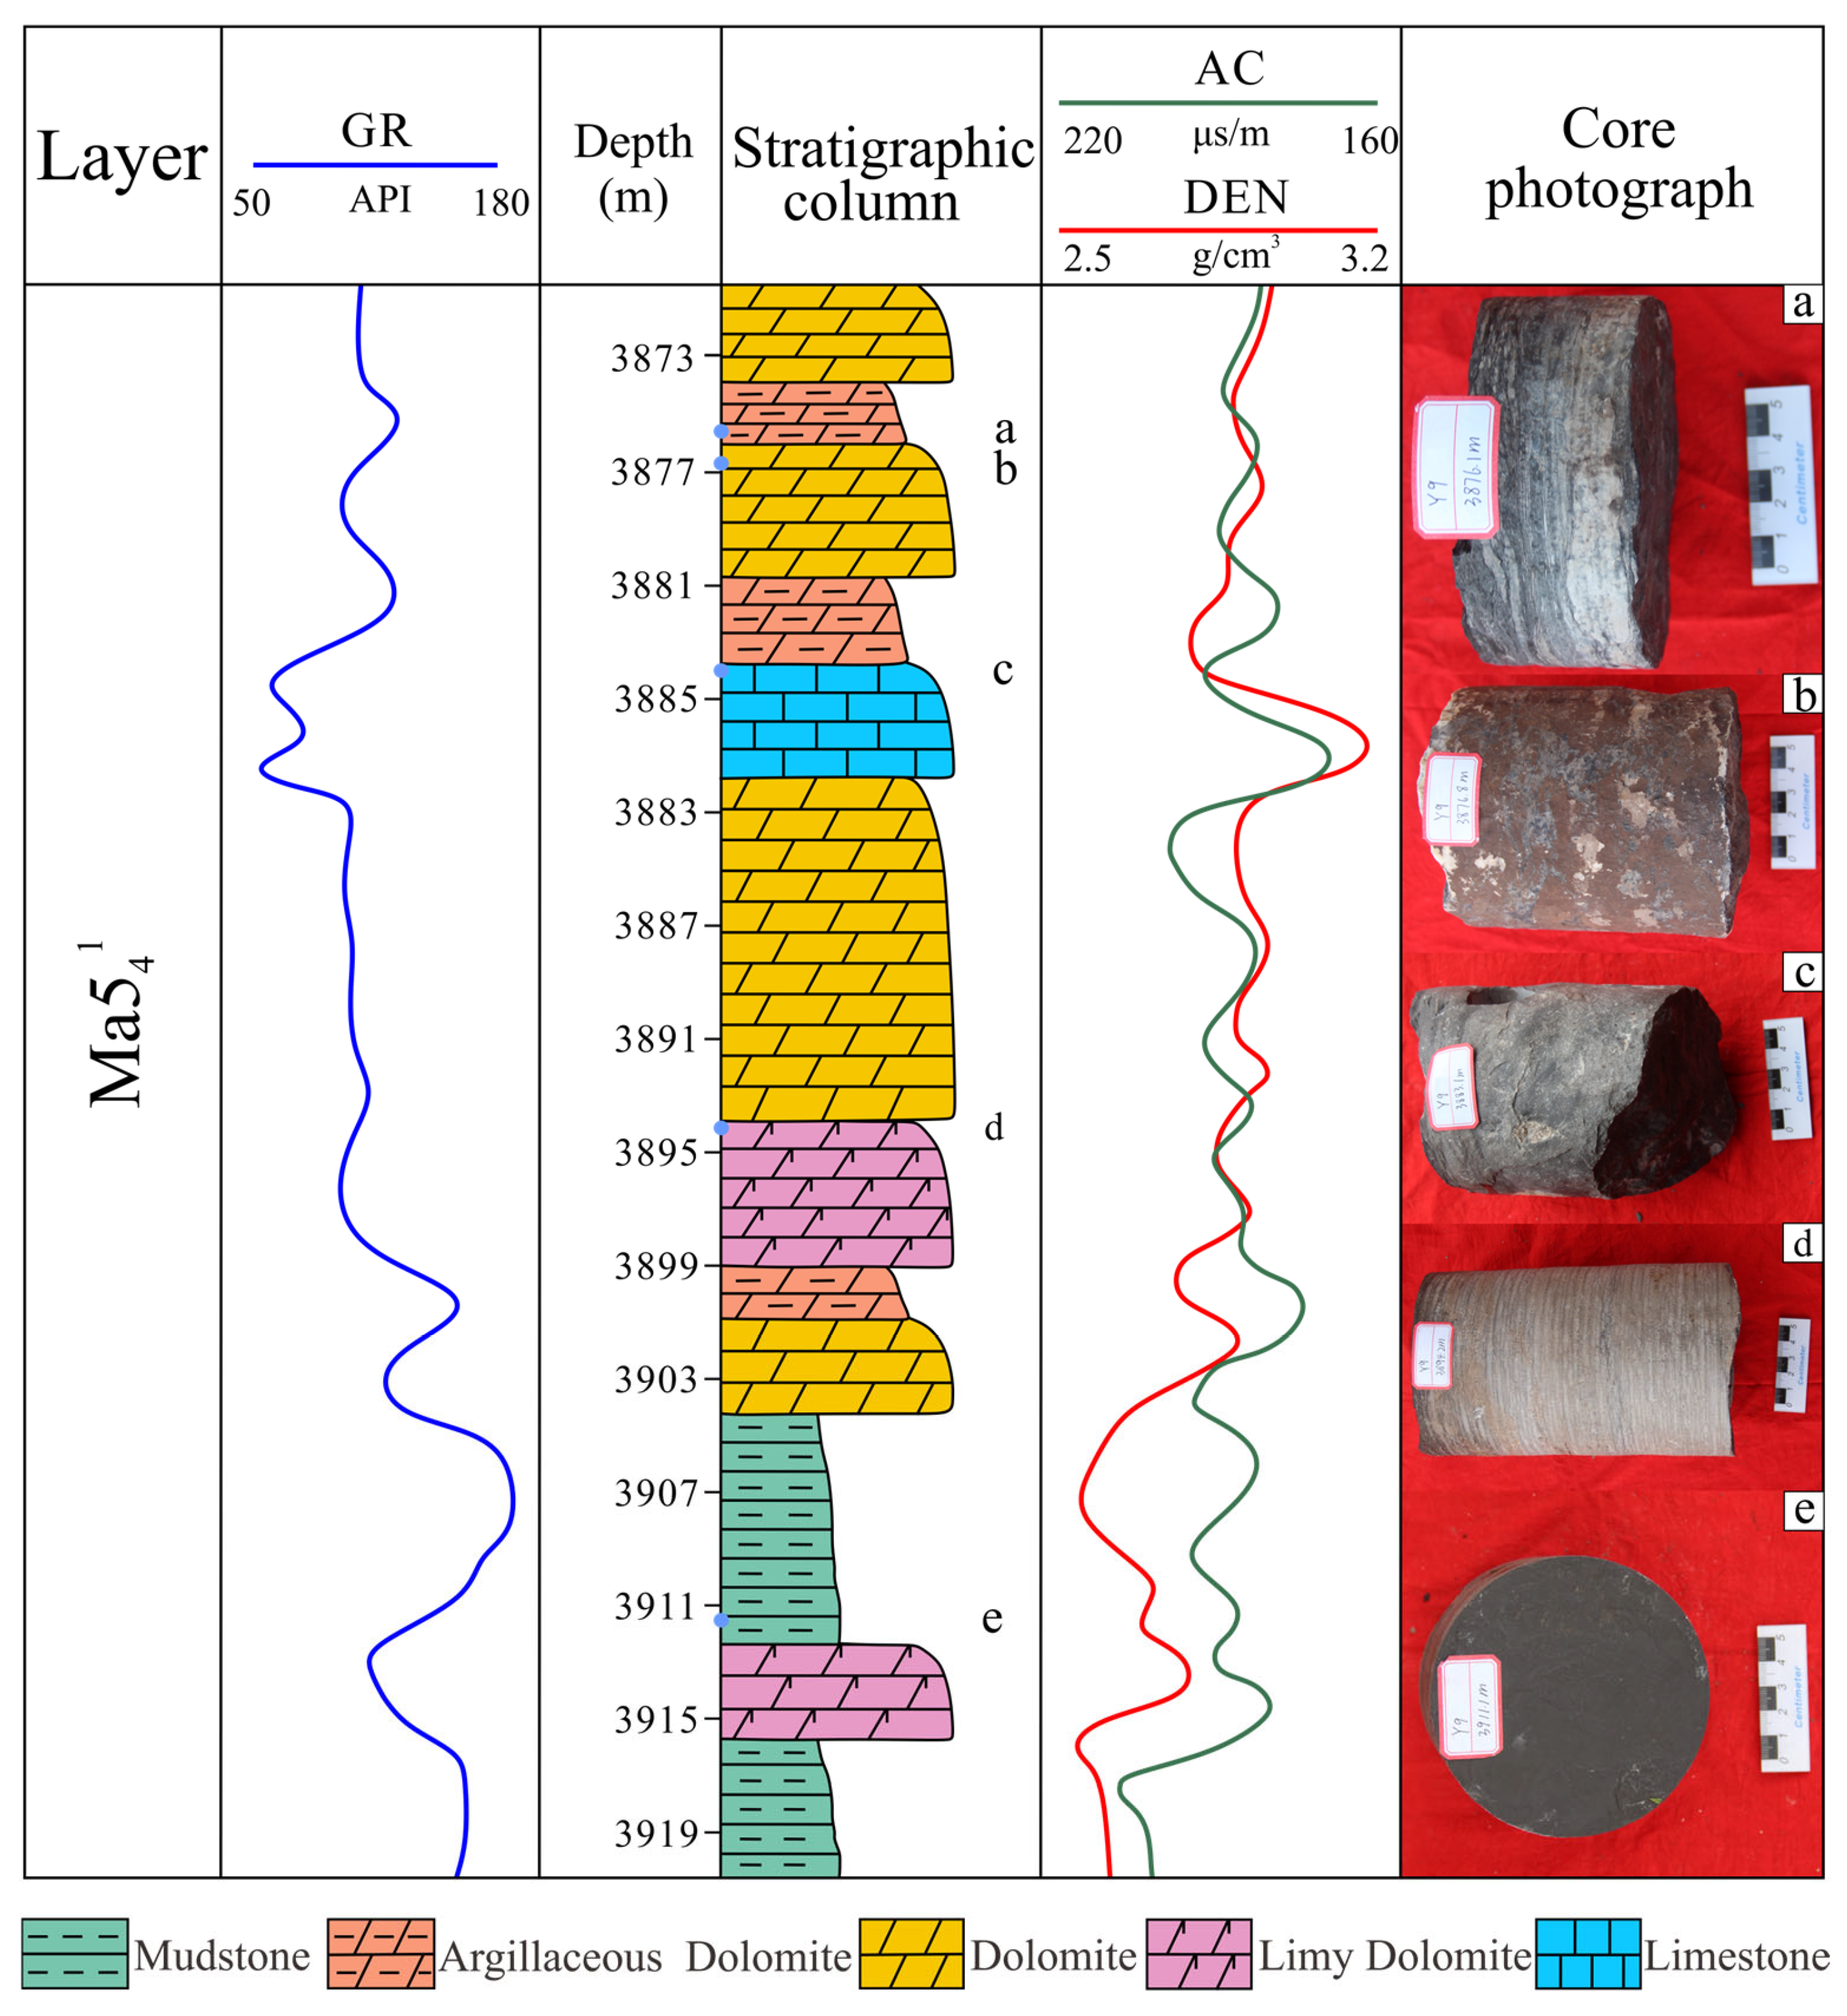
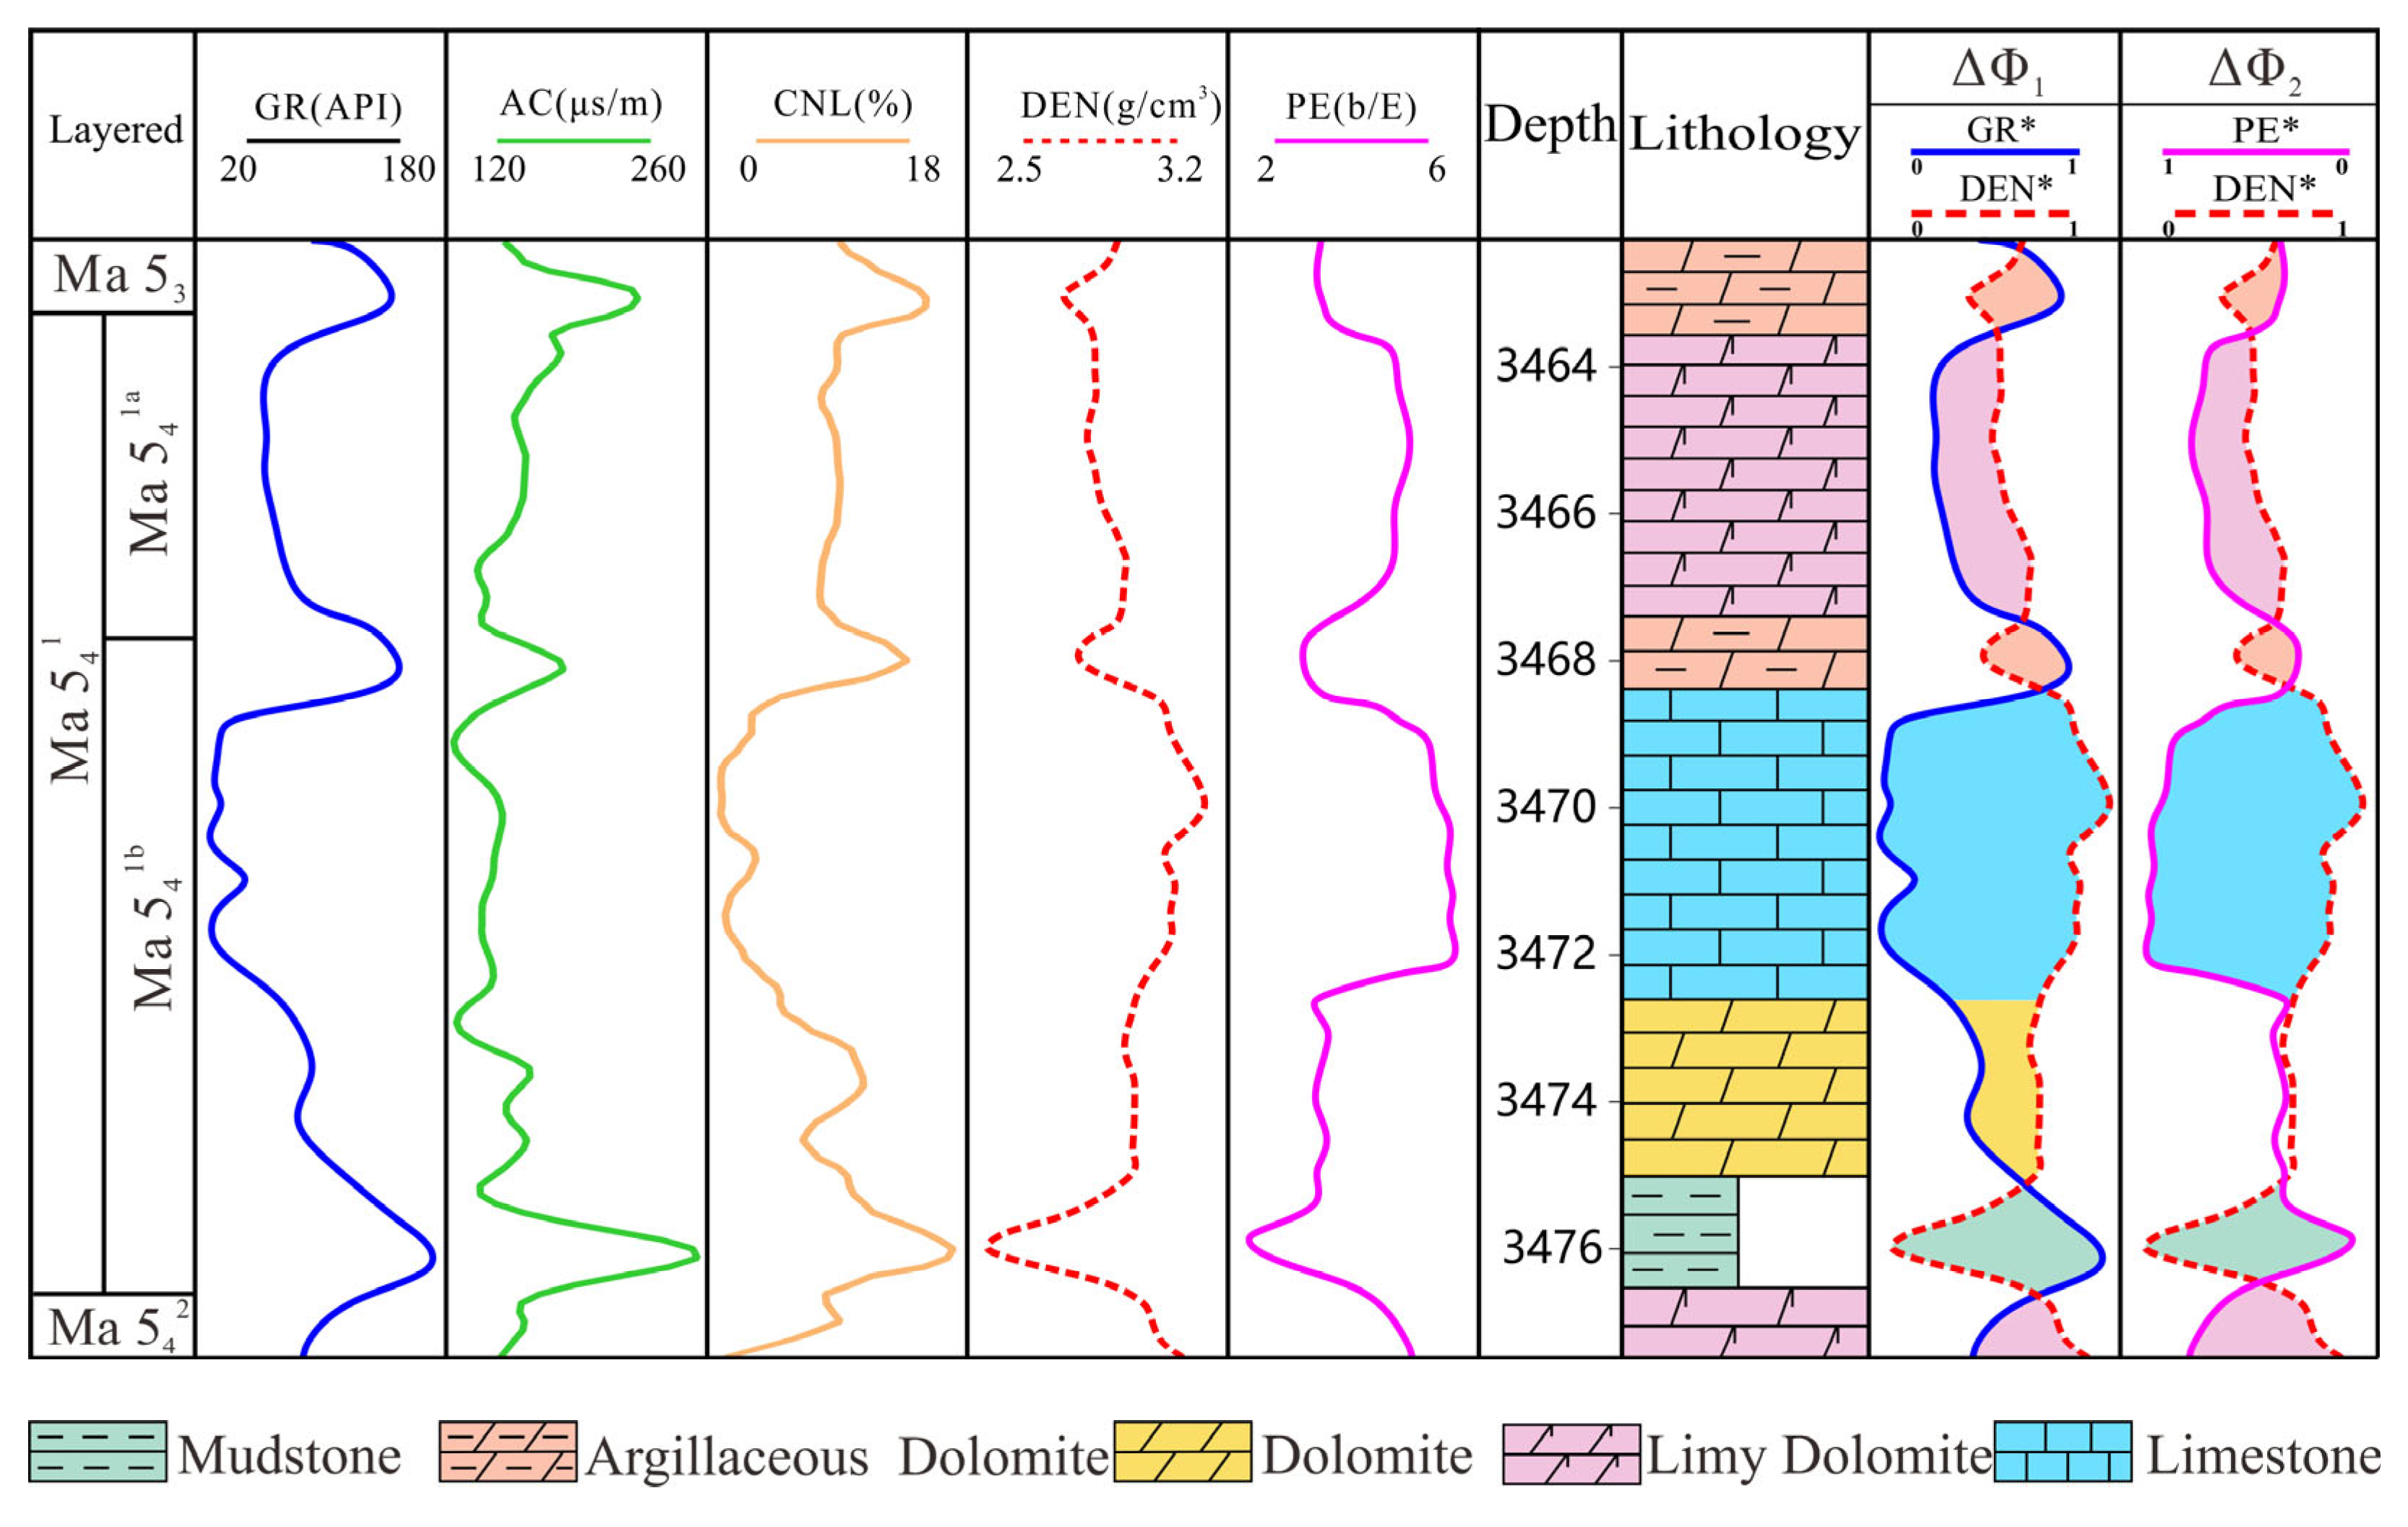
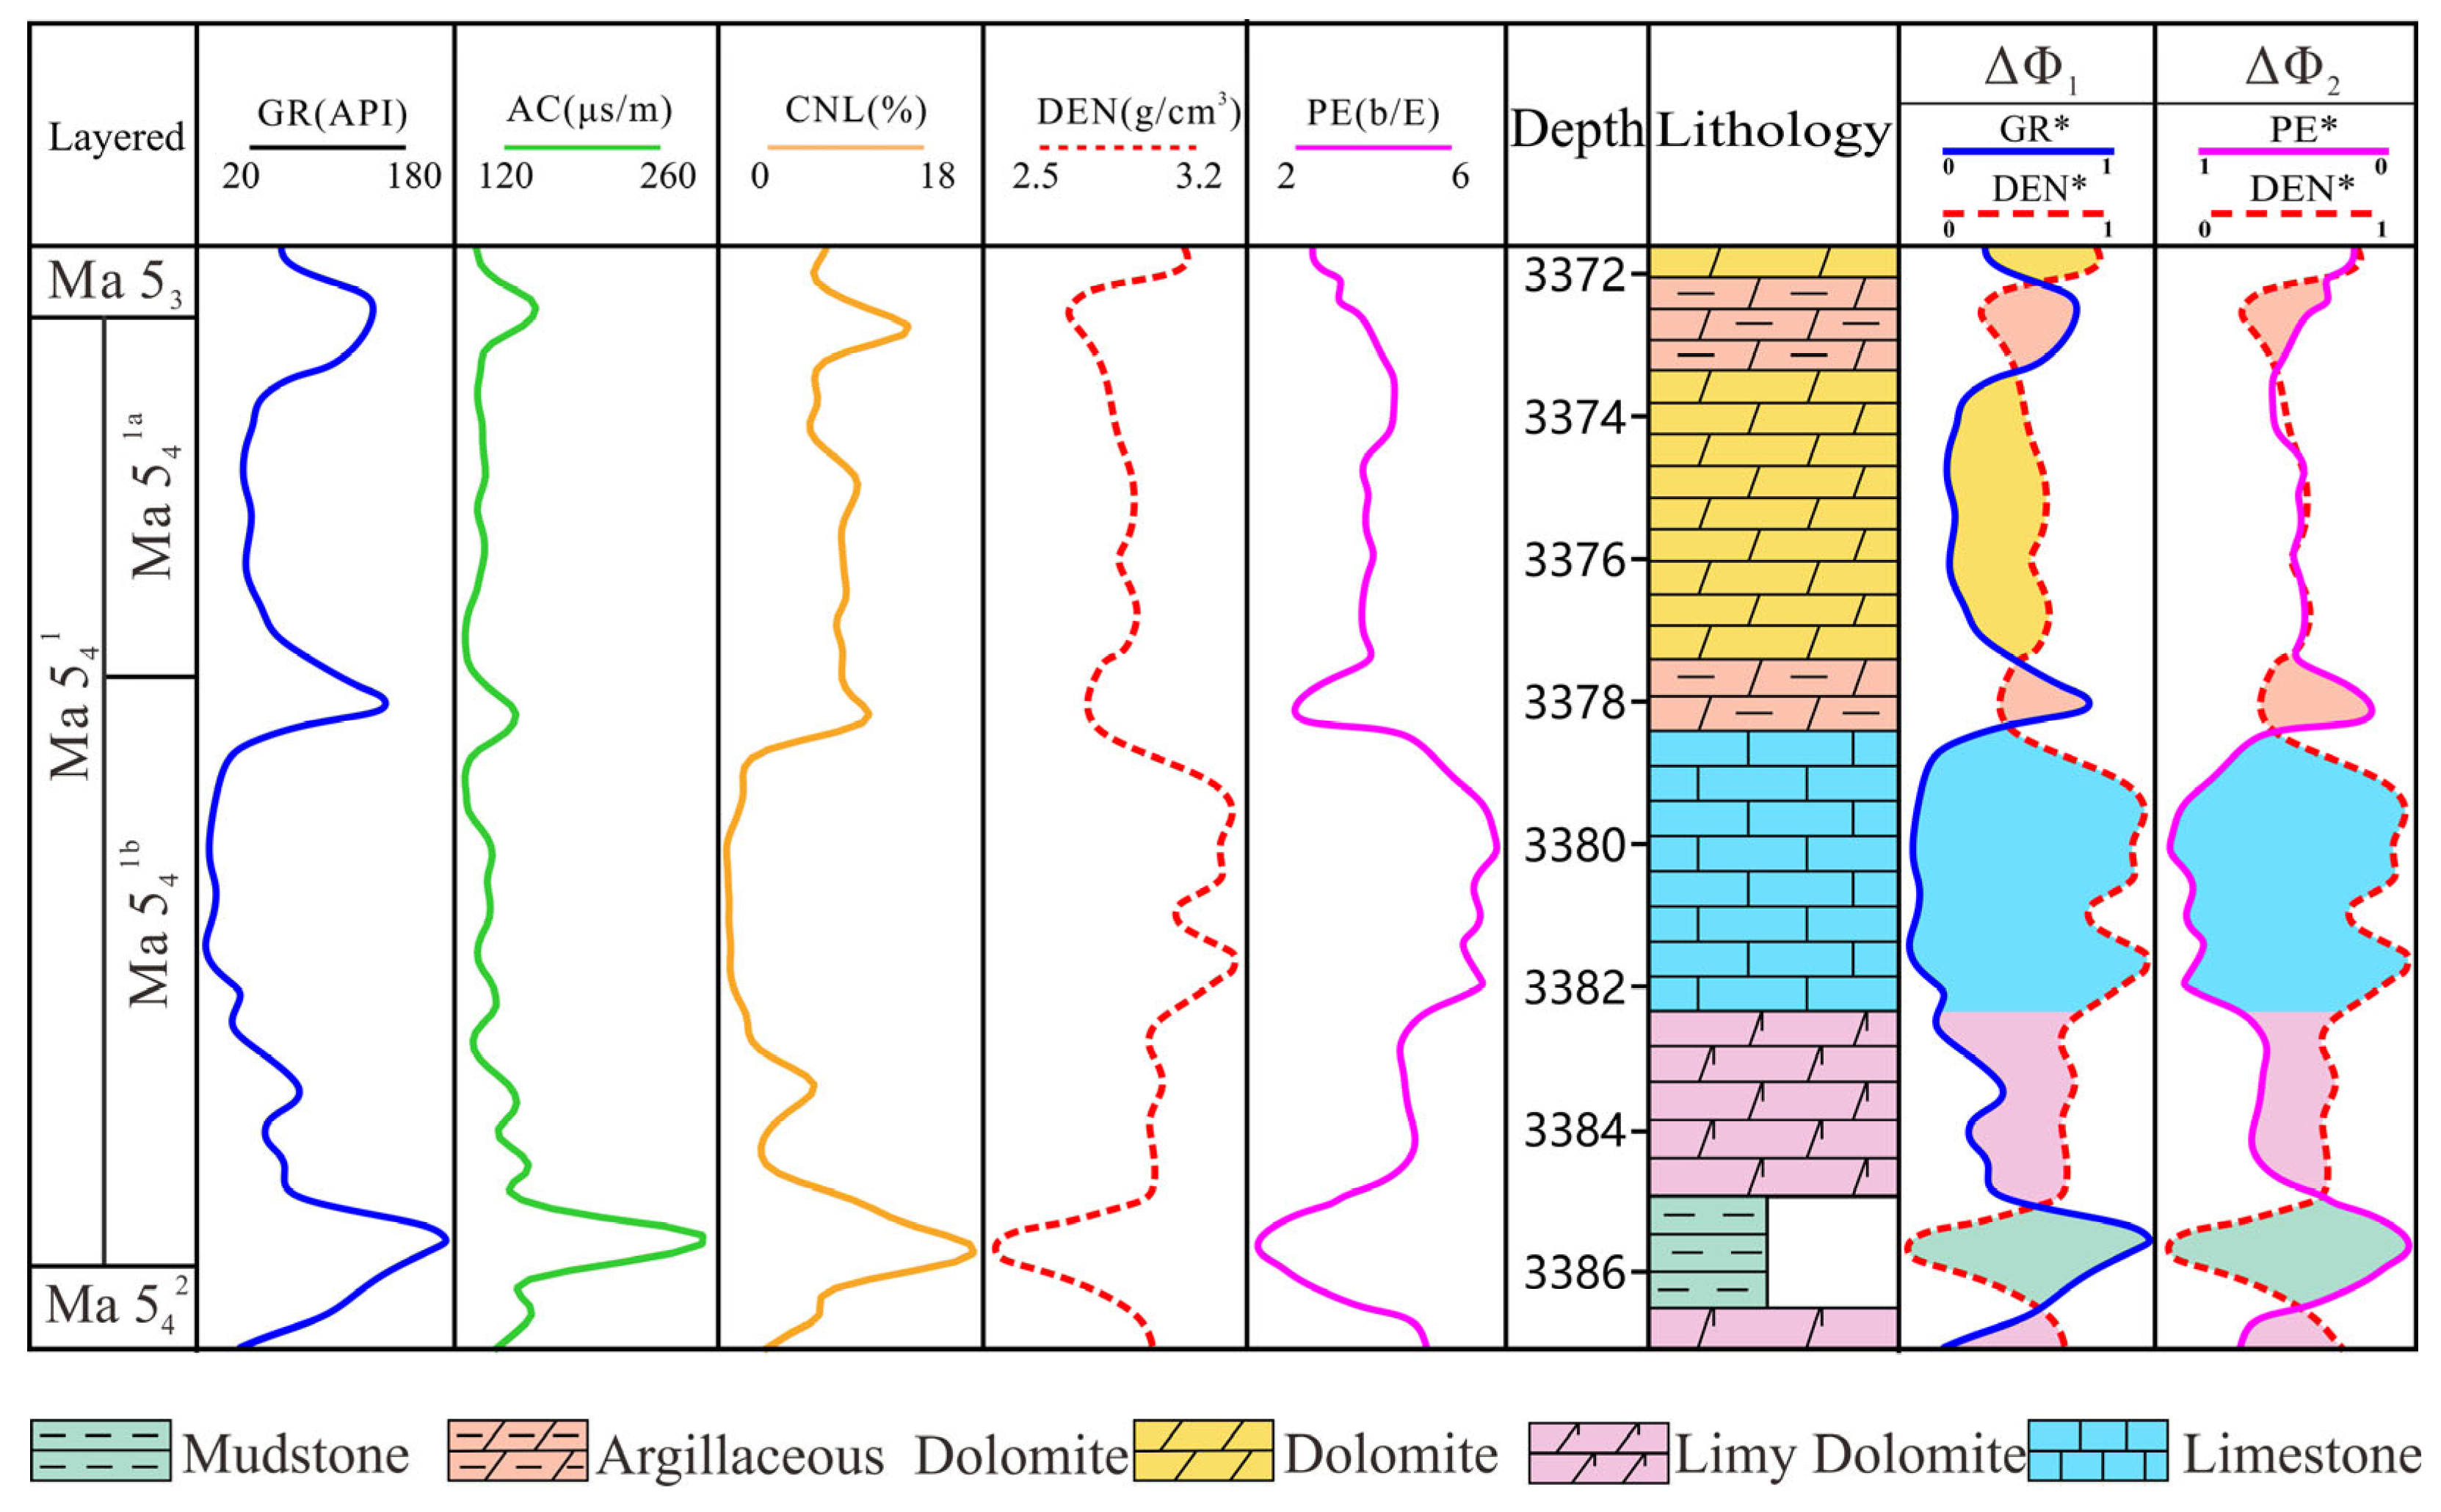
Core observation and description results indicate that the Ma541 Member in the study area consists of five lithologies, namely mudstone, argillaceous dolomite, dolomite, limy dolomite, and limestone. Mudstone is grayish-black or dark gray, characterized by well-developed horizontal bedding and distributed in clumps and bands. Well logging shows low photoelectric effect (PE), low density (DEN), and high gamma ray (GR). These features become more pronounced with the increase in argillaceous content (Figure 8e). Argillaceous dolomite is gray in color and also develops horizontal bedding. Its electrical properties are generally between those of pure dolomite and mudstone, and tend to be closer to the electrical characteristics of mudstone, showing relatively high GR, medium-low DEN, and medium-low PE values (Figure 8a). Dolomite is taupe in color and typically shows medium-low PE, low GR, and medium-high DEN on well log curves (Figure 8b). Limy dolomite is light gray, with logging responses generally between those of pure dolomite and limestone, showing low GR, medium-high PE, and medium DEN values (Figure 8d). With the increase in calcite content in this lithology, the characteristics displayed on the overlay reconstruction crossplot tend to be similar to those of limestone. Limestone is gray or dark gray, and its logging responses are typically characterized by high PE, low DEN, and low GR values (Figure 8c).

4.2.2. Lithology Identification Criteria

In the normalized composite well logs, different lithologies exhibit stable and distinguishable response characteristics in the overlays of ΔΦ1 and ΔΦ2 curves. Limestone intervals are typified by low GR, high DEN, and high PE. The GR* and DEN* curves show wide separation, while the PE* and DEN* curves are markedly divergent, with the PE curve positioned to the left of DEN and enclosing the largest area. In limy dolomite, the envelope areas of both the ΔΦ1 and ΔΦ2 curve overlays are significantly smaller than those of limestone, and their overall distribution falls between limestone and dolomite, reflecting transitional response characteristics. Dolomite is featured by medium-low GR and medium-high DEN values, with a small envelope area of the GR* and DEN* curve overlay. In addition, the PE curve shifts distinctly to the right and adheres to the DEN curve, forming a ΔΦ2 curve overlay characteristic that is different from that of limy dolomite. In argillaceous dolomite, the GR curve shifts to the right, and the envelope areas of the ΔΦ1 and ΔΦ2 curve overlays decrease further, with its distribution lying between the response zones of dolomite and mudstone. Mudstone intervals are prominently characterized by high GR and low DEN values; the envelope areas of the ΔΦ1 and ΔΦ2 curve overlays increase significantly, and the PE curve lies on the right of the DEN curve, forming a clear distinction from carbonate lithologies (Figure 9).
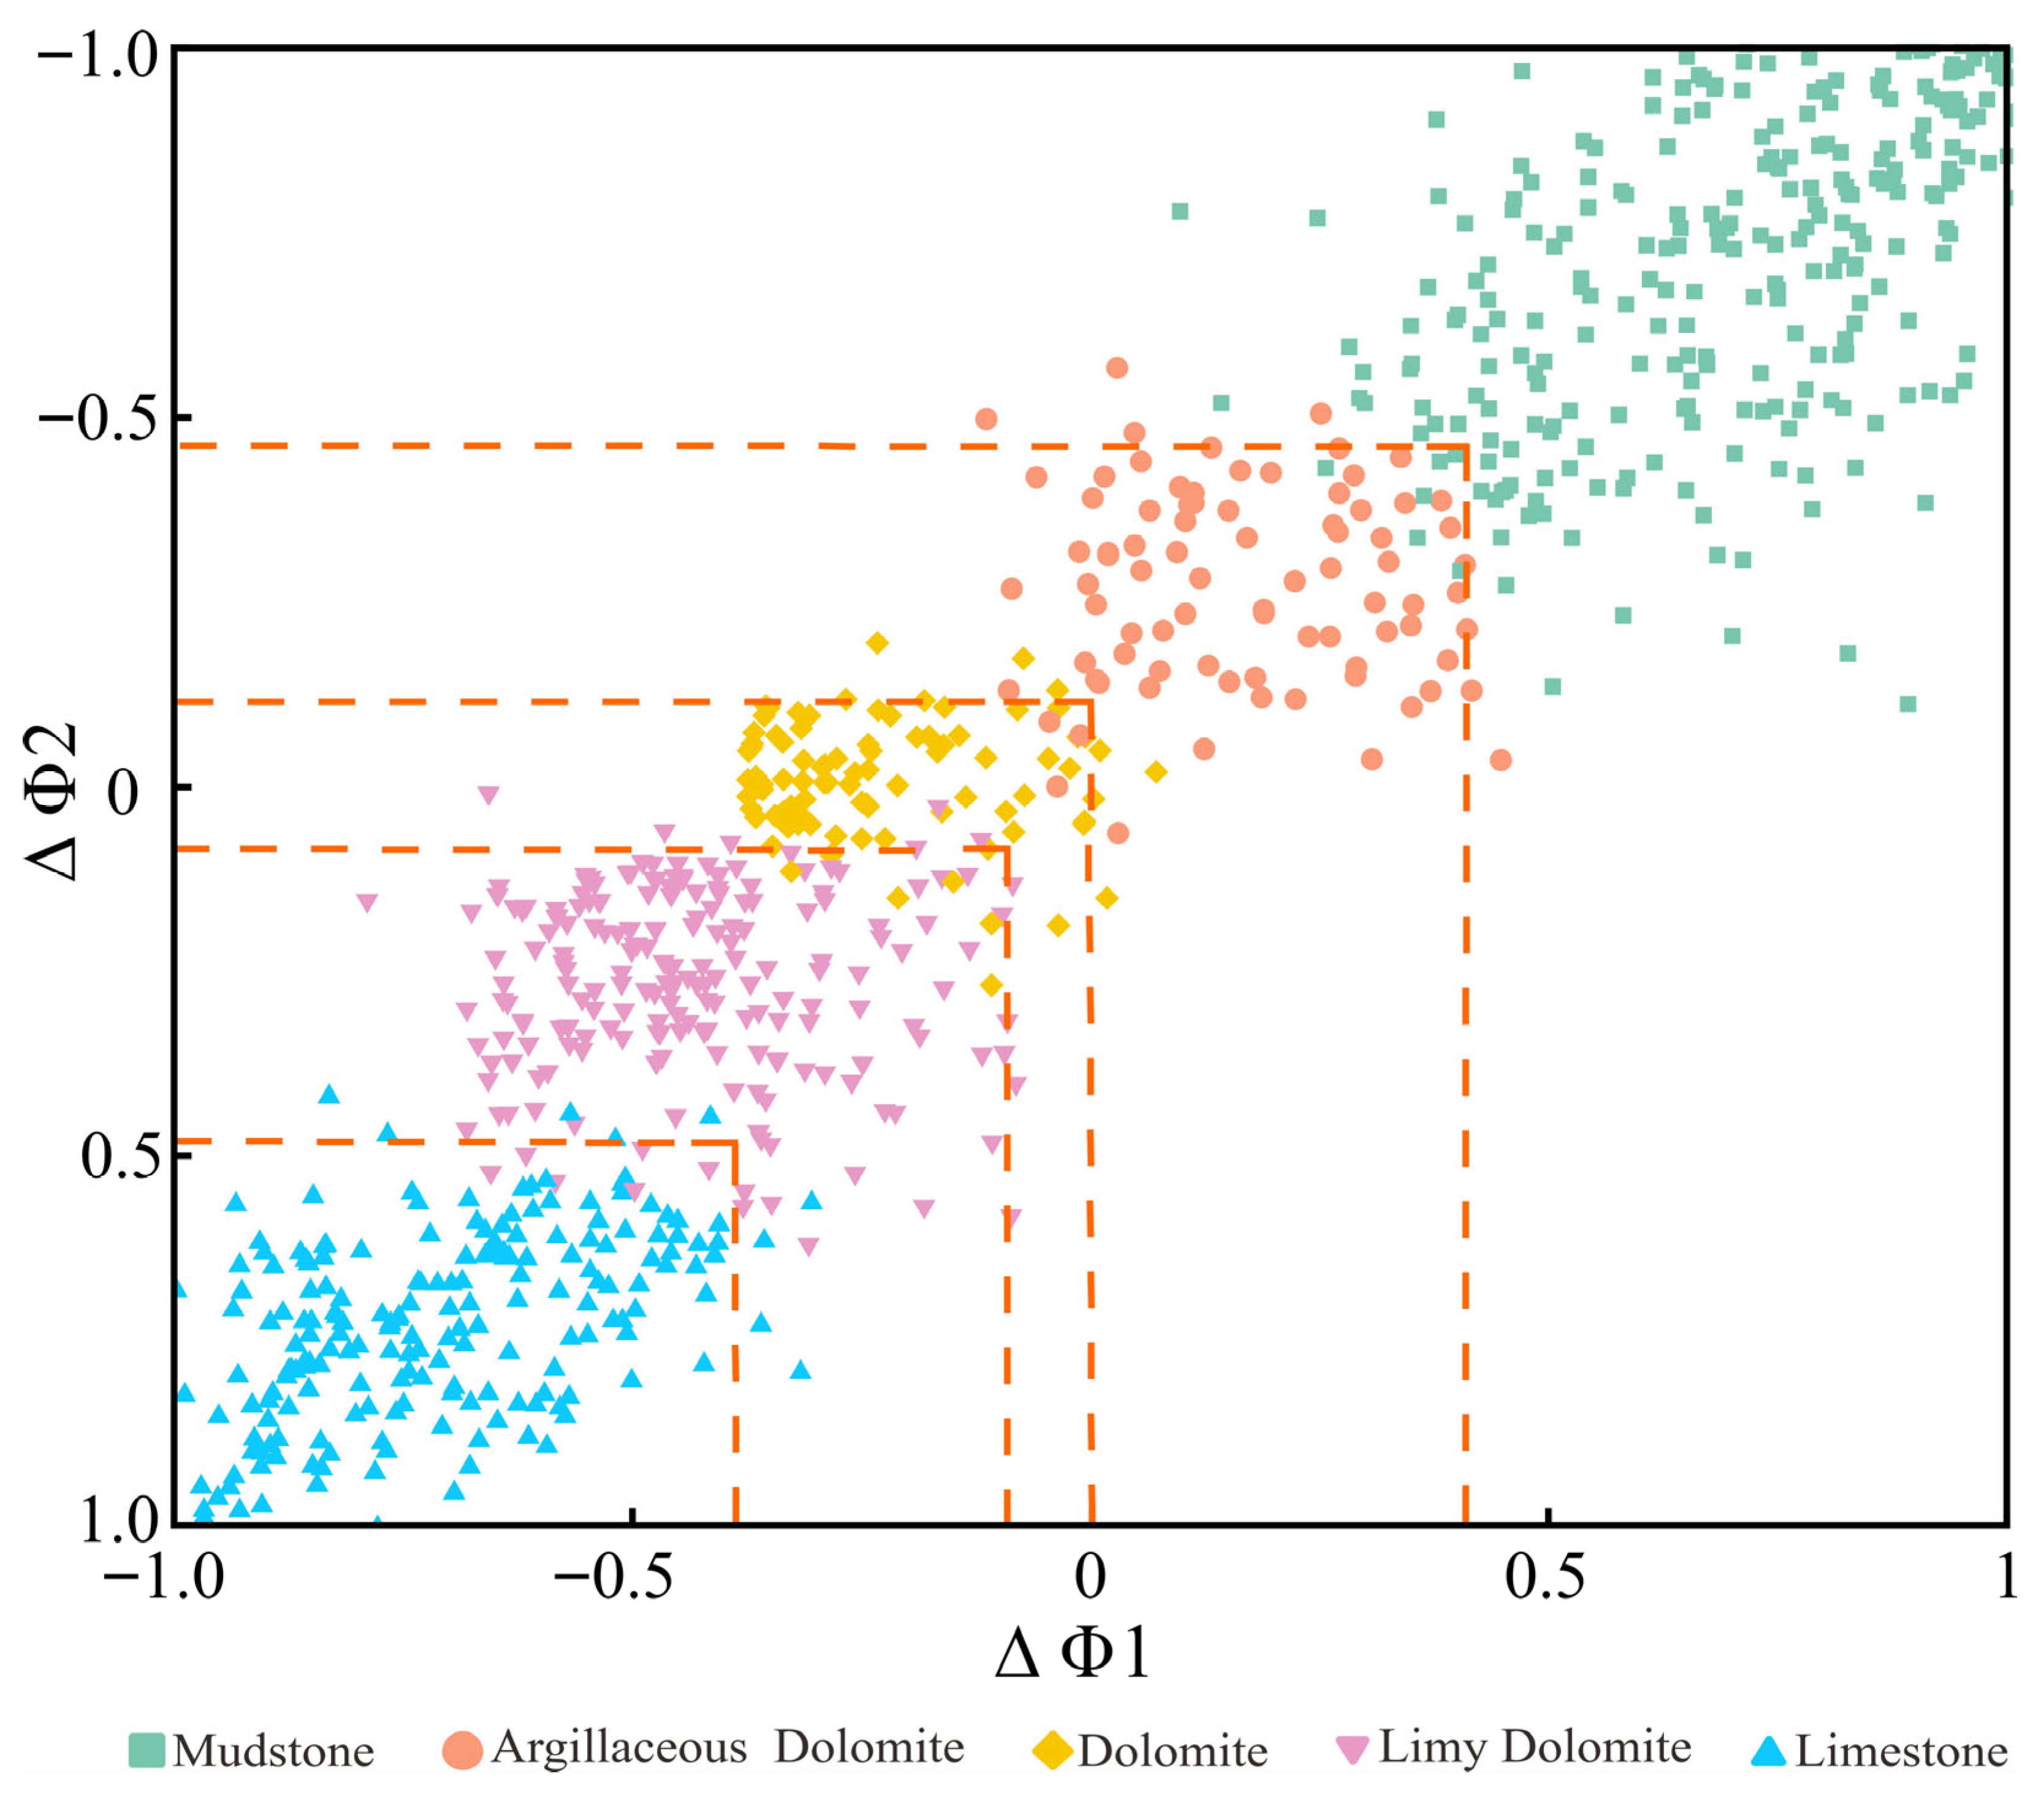
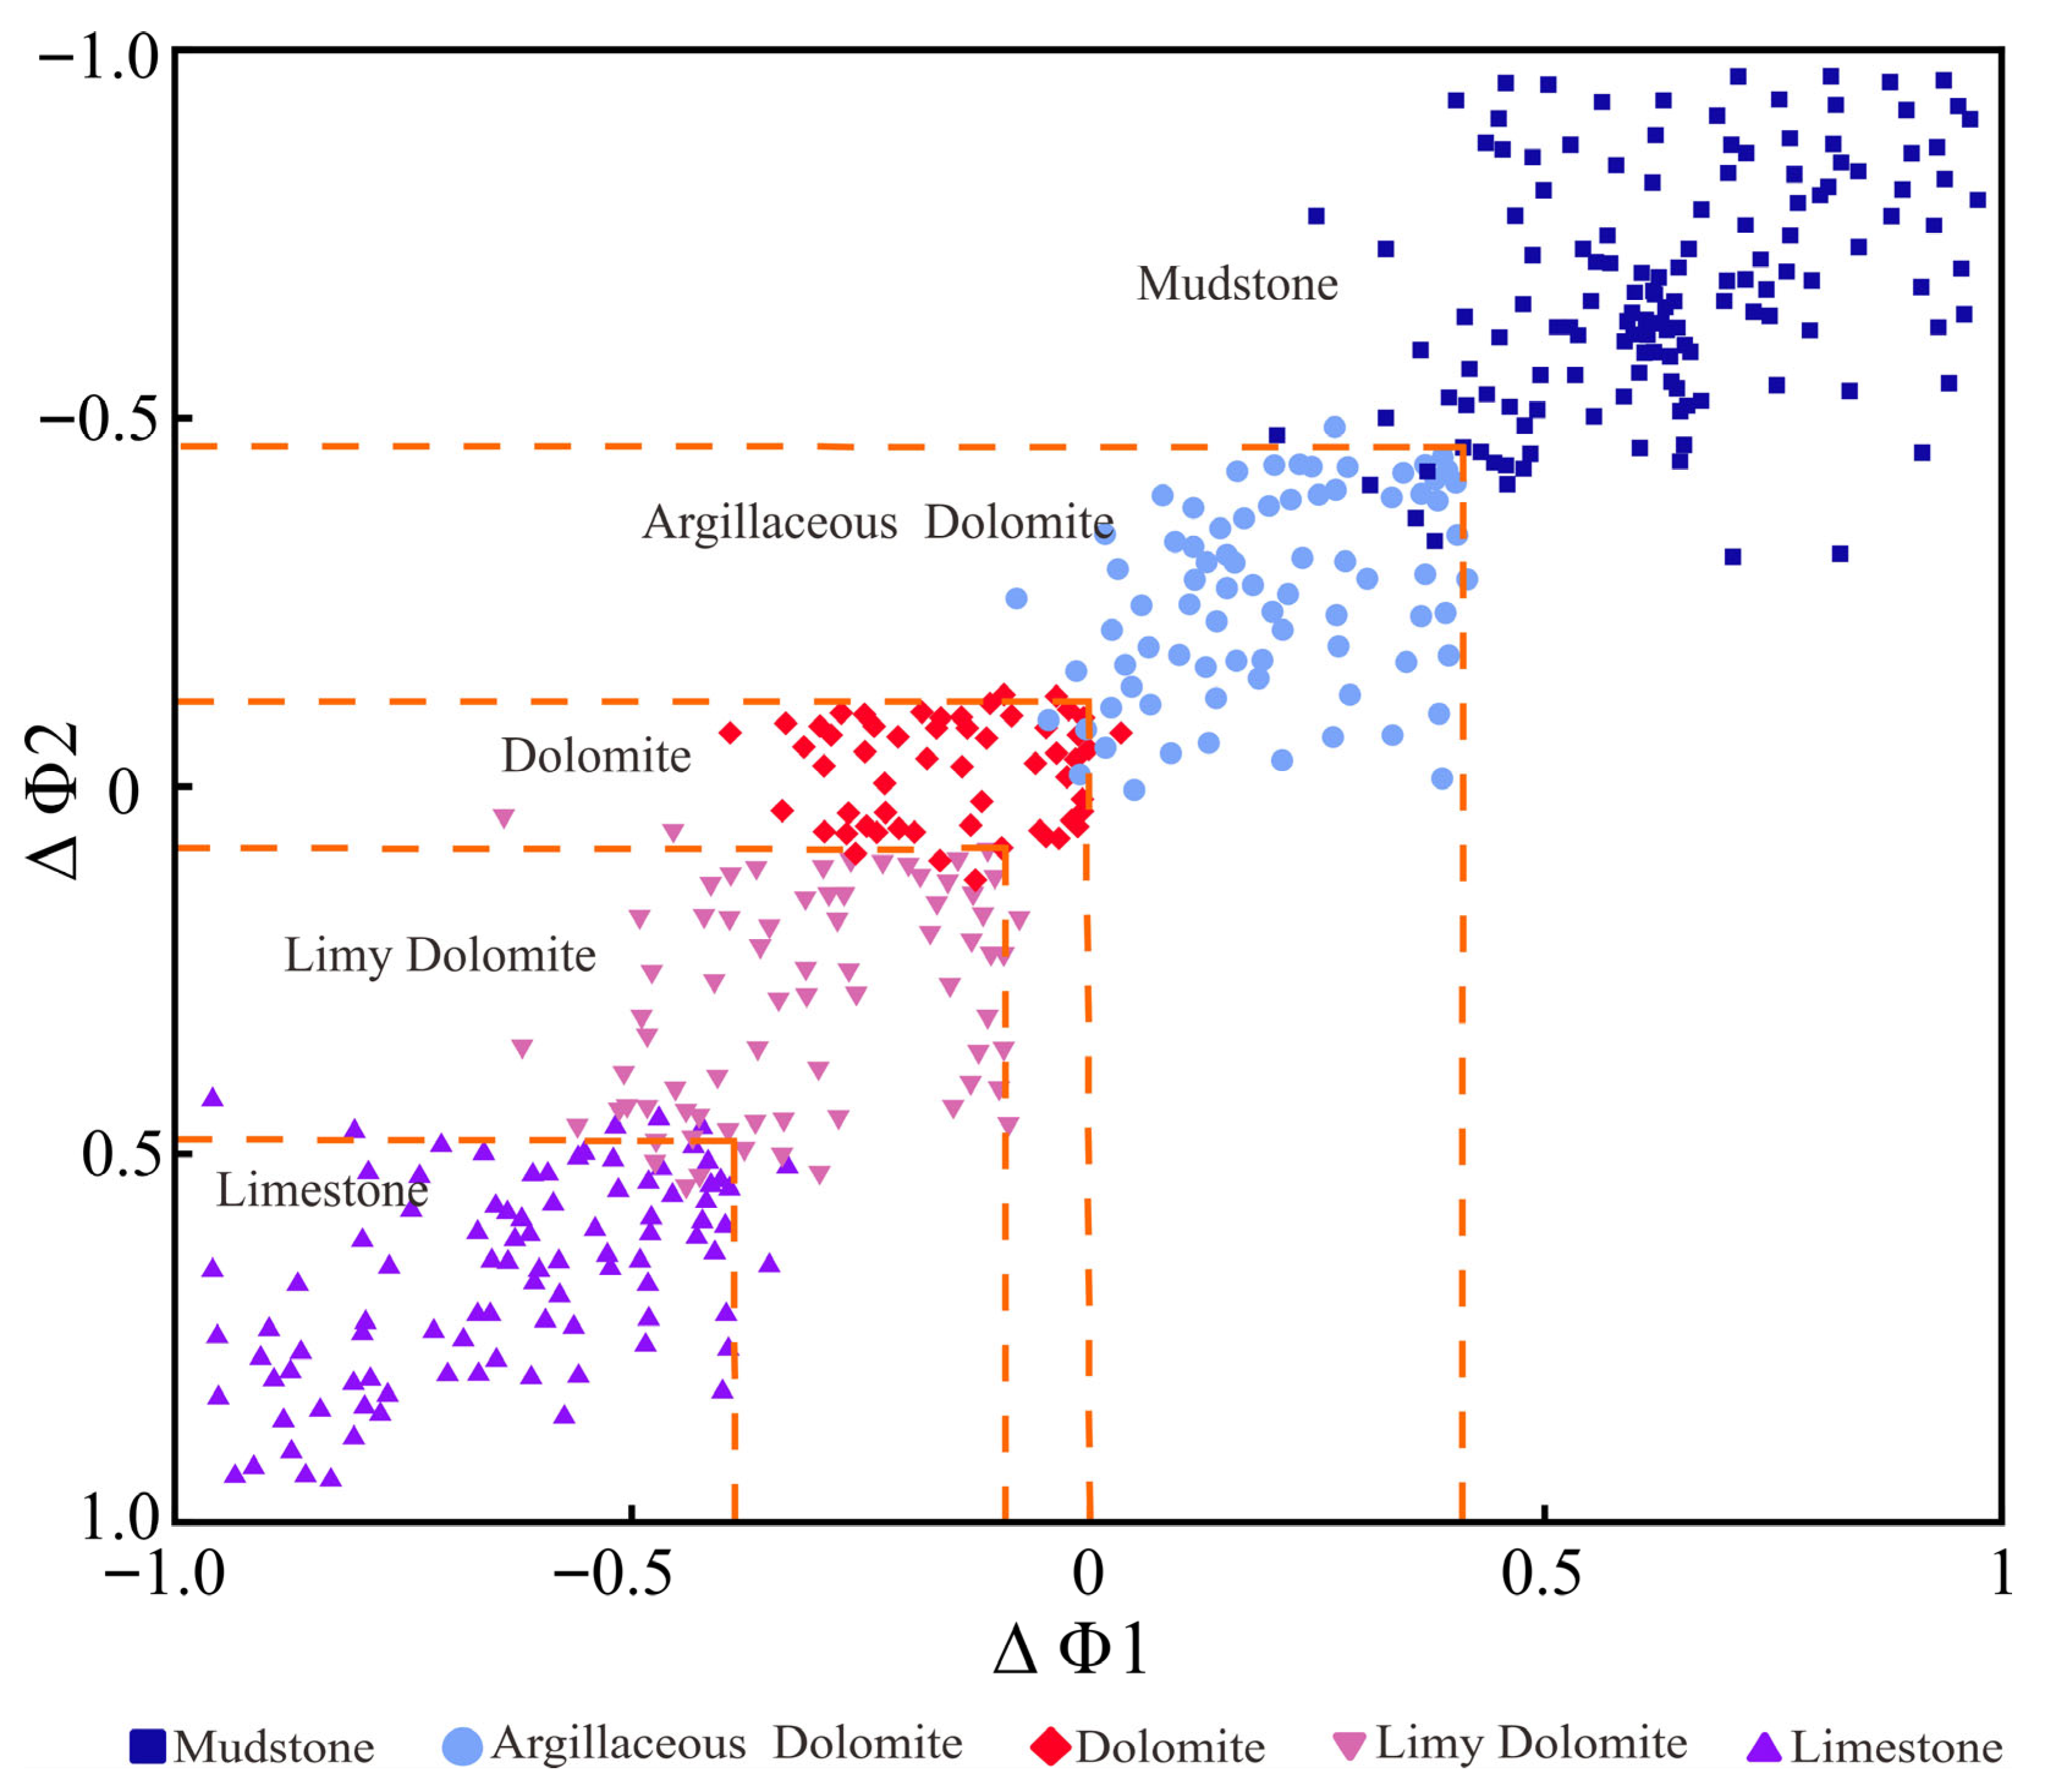
A two-dimensional crossplot template of the normalized difference curves ΔΦ1 and ΔΦ2 was established (Figure 10) for the quantitative identification of mudstone, argillaceous dolomite, dolomite, limy dolomite, and limestone, with the key objective of achieving the subclassification and discrimination of dolomitic lithologies. Lithology identification criteria for the five lithotypes of the Ma541 Member in the study area were formulated accordingly. Specifically, limestone is characterized by ΔΦ1 values ranging from −0.43 to −1 and ΔΦ2 values from 0.48 to 1; limy dolomite by ΔΦ1 values of −0.09 to −0.71 and ΔΦ2 values of 0.11 to 0.43; dolomite by ΔΦ1 values of −0.41 to 0 and ΔΦ2 values of 0.09 to −0.11; argillaceous dolomite by ΔΦ1 values of 0.11 to 0.44 and ΔΦ2 values of 0.11 to 0.47; and mudstone by ΔΦ1 values of 0.41 to 1 and ΔΦ2 values of 0.44 to 1 (Table 1).

4.3. Fluid Identification

The Ma541 member in the study area is a carbonate reservoir characterized by strong heterogeneity and anisotropy, complex interfering factors in fluid identification, limited gas testing data, and poor connectivity between wells. Based on the analysis of gas testing and production data from the Ma541 member, the gas–water relationships and distribution in dolomite reservoirs are extremely complex, affecting the accuracy of identification methods for gas layer, gas-bearing water layer, dry layer, and water layer.
Analysis of gas testing and production data from 43 wells in the Ma541 member reveals four types of reservoir fluids: gas layer, water layer, gas-bearing water layer, and dry layer. The resistivity distribution of these four fluid types in the Ma541 interval varies widely, with both low-resistivity and high-resistivity values observed. Consequently, relying solely on resistivity logs to distinguish between a gas layer, a water layer, a gas-bearing water layer, and a dry layer proves challenging.

4.3.1. Fluid Types and Characteristics

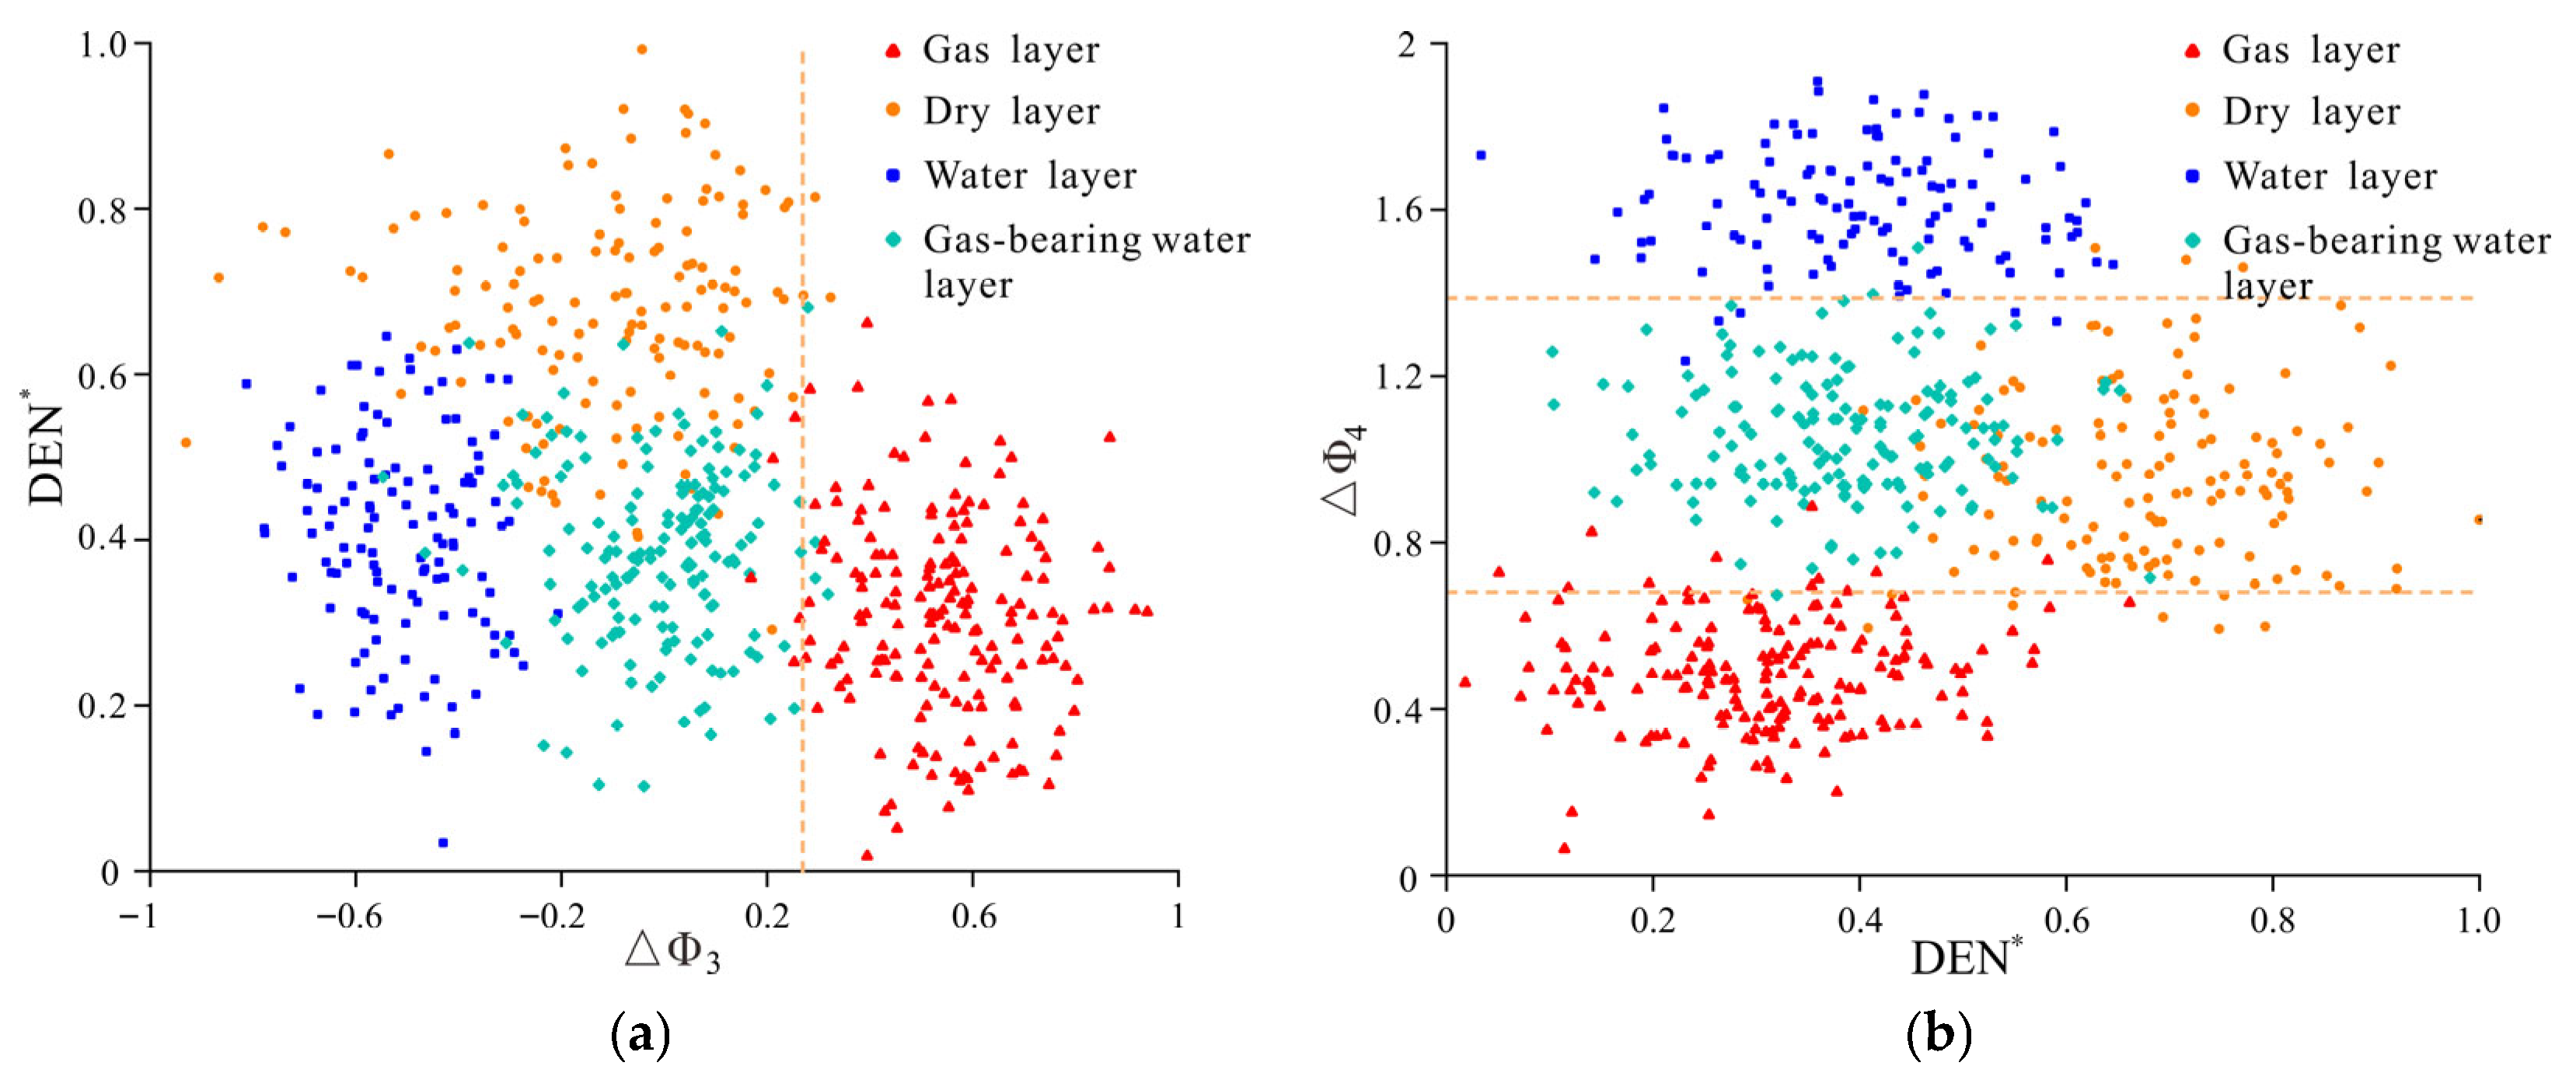
In the crossplot of ΔΦ3 versus DEN, the gas layer is distributed within the ΔΦ3 range of 0.22–0.97 (Figure 11a), while its distribution in the ΔΦ4 crossplot falls within 0.02–0.76. Water layer, on the other hand, occupies the ΔΦ4 range of 1.41–1.91 (Figure 11b). However, the distribution of different fluid types along the DEN* in both crossplots remains highly overlapping. Particularly, there is no clear boundary between a dry layer, a gas-bearing water layer, and a water layer, making it difficult to achieve distinct fluid type partitioning in these two-dimensional spaces.
From the two-dimensional crossplots, it can be observed that whether using the combination of ΔΦ3 and DEN* or ΔΦ4 and DEN*, differentiation among certain fluid types can only be achieved effectively along a single axis, while significant overlap persists along the other axis. This phenomenon indicates that in complex carbonate reservoirs, the well-logging responses of fluid types are jointly influenced by multiple factors. A two-dimensional crossplot based on a single ΔΦ parameter combined with a single conventional log parameter is insufficient to simultaneously capture the comprehensive differences in electrical properties, pore structure, and fluid characteristics. Therefore, the two-dimensional crossplot method exhibits clear limitations in identifying multiple fluid types, necessitating the introduction of additional independent parameters to construct a higher-dimensional discrimination space.

4.3.2. Fluid Identification Criteria

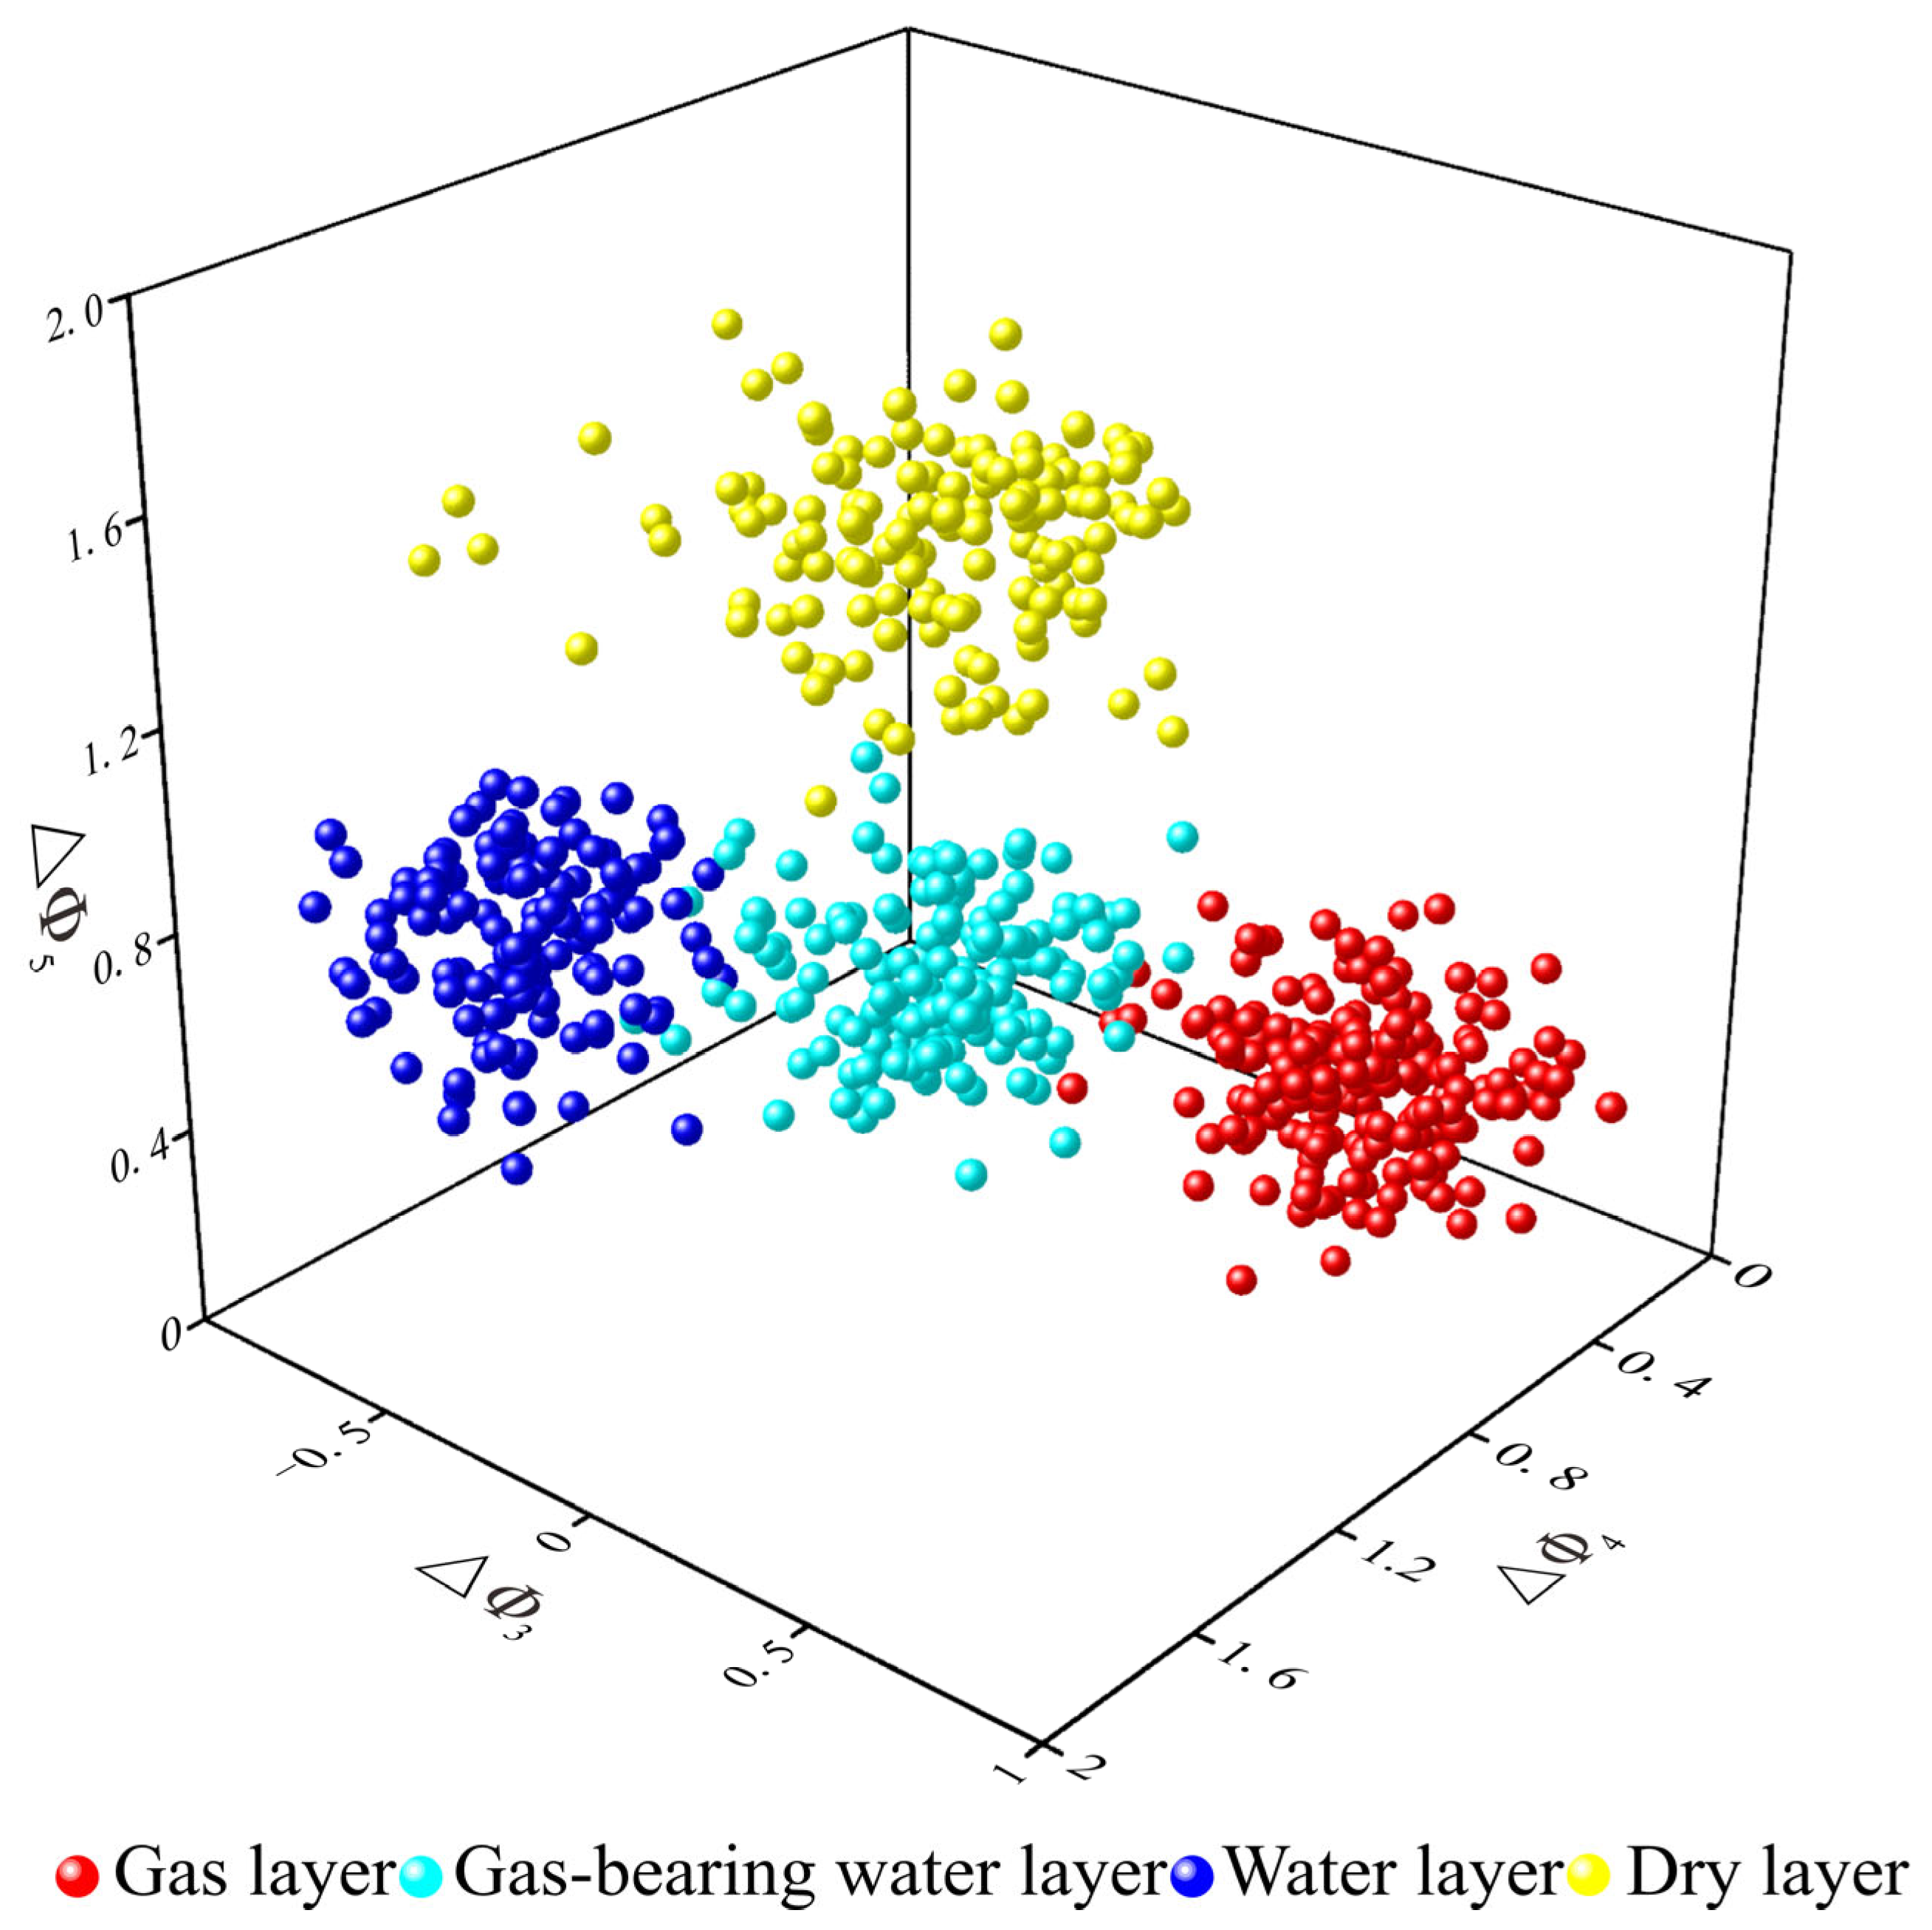
Based on the aforementioned research, normalized well-logging data were integrated to derive the parameters ΔΦ3, ΔΦ4, and ΔΦ5, and a three-dimensional crossplot was subsequently constructed. Within this three-dimensional plot, the distribution characteristics of different fluid types can be clearly observed, with distinct colors representing the four fluid types: dry layer, water layer, gas-bearing water layer, and gas layer.
In terms of overall distribution patterns, the four fluid types form relatively independent, concentrated, and well-defined point clusters within the ΔΦ3–ΔΦ4–ΔΦ5 three-dimensional plot, which represents a marked improvement over the overlapping distribution characteristics observed in two-dimensional crossplots. Each fluid type exhibits a distinct distribution trend along the three parameter axes, indicating that the three-dimensional plot offers a strong complementary discrimination capability for fluid properties in a multi-dimensional space.
Identification criteria for dry layer: ΔΦ3 ranges from −0.94 to 0.22, ΔΦ4 from 0.76 to 1.41, and ΔΦ5 from 1.31 to 1.97. Their distribution exhibits a certain degree of discreteness along each axis; the pronounced separation in the ΔΦ5 dimension enables effective differentiation from fluid-bearing intervals in the three-dimensional space. Identification criteria for water layer: ΔΦ3 ranges from −0.87 to −0.28, ΔΦ4 from 1.41 to 1.91, and ΔΦ5 from 0.73 to 1.32.
Identification criteria for gas-bearing water layer: ΔΦ3 ranges from −0.31 to 0.22, ΔΦ4 from 0.76 to 1.41, and ΔΦ5 from 0.65 to 1.26. These intervals exhibit clear transitional characteristics across all three dimensions. Identification criteria for gas layer: ΔΦ3 ranges from 0.22 to 0.97, ΔΦ4 from 0.02 to 0.76, and ΔΦ5 from 0.07 to 0.89 (Figure 12).
Comprehensive analysis demonstrates that the ΔΦ3–ΔΦ4–ΔΦ5 three-dimensional crossplot effectively reduces the uncertainty caused by overlapping fluid logging responses in single-parameter or two-dimensional analyses by incorporating electrical properties, pore-fluid characteristics, and lithological background information across different dimensions. This approach enables a three-dimensional differentiation of dry layer, water layer, gas-bearing water layer, and gas layer. The method exhibits strong discriminative capability and sound geological rationale for fluid identification in complex carbonate reservoirs, providing a reliable basis for subsequent quantitative fluid evaluation and reservoir classification. Compared to two-dimensional crossplot analysis, the ΔΦ3–ΔΦ4–ΔΦ5 three-dimensional crossplot significantly enhances the distinguishability among different fluid types through the coupling of multi-dimensional information, particularly in effectively separating the overlapping response regions between the gas layer, gas-bearing water layer, and dry layer.

5. Discussion

Carbonate rock gas reservoirs are an important type of gas reservoir in China’s oil and gas resources, and the Ordovician Ma541 sublayer is one of the key natural gas-producing layers in the Ordos Basin. Therefore, the efficient identification of carbonate rock gas reservoirs will contribute to the prediction and development of gas fields [52].

5.1. Verification of Lithology Identification Accuracy

To verify the accuracy of lithology identification using the aforementioned Hyperbolic Normalized Stacking Reconstruction Method, the established lithology identification crossplots were compared with coring description data from 35 wells in the study area (Figure 12). The comparison yielded the following results: for limestone, out of 95 test points, 88 were consistent, with an accuracy rate of 92.6%; for limy dolomite, out of 72 test points, 66 were consistent, with an accuracy rate of 91.7%; for dolomite, out of 52 test points, 47 were consistent, with an accuracy rate of 90.3%; for argillaceous dolomite, out of 75 test points, 70 were consistent, with an accuracy rate of 93.3%; for mudstone, out of 126 test points, 116 were consistent, with an accuracy rate of 92.1% (Figure 13). From this, it can be concluded that the results of lithology identification obtained by the Hyperbolic Normalized Superposition and Reconstruction Method are basically in good agreement with the actual results.

5.2. Application of the Lithology Identification Model

The results indicate that the lithology identification method based on the normalized superposition and reconstruction of well logging curves can effectively improve the interpretation accuracy of carbonate rock lithology. It provides a reliable technical means for the quantitative lithology identification in non-cored wells and well intervals without systematic mud logging data. Based on this method, lithology identification and statistical analysis were carried out on the target intervals of multiple wells in the study area, successfully distinguishing and identifying key lithology types, including mudstone, argillaceous dolomite, limestone, limy dolomite, and dolomite. On this basis, the thicknesses of argillaceous dolomite, limestone, limy dolomite, and dolomite in each well were further statistically analyzed, and the plane thickness isovalue map was drawn using Surfer 29 software.
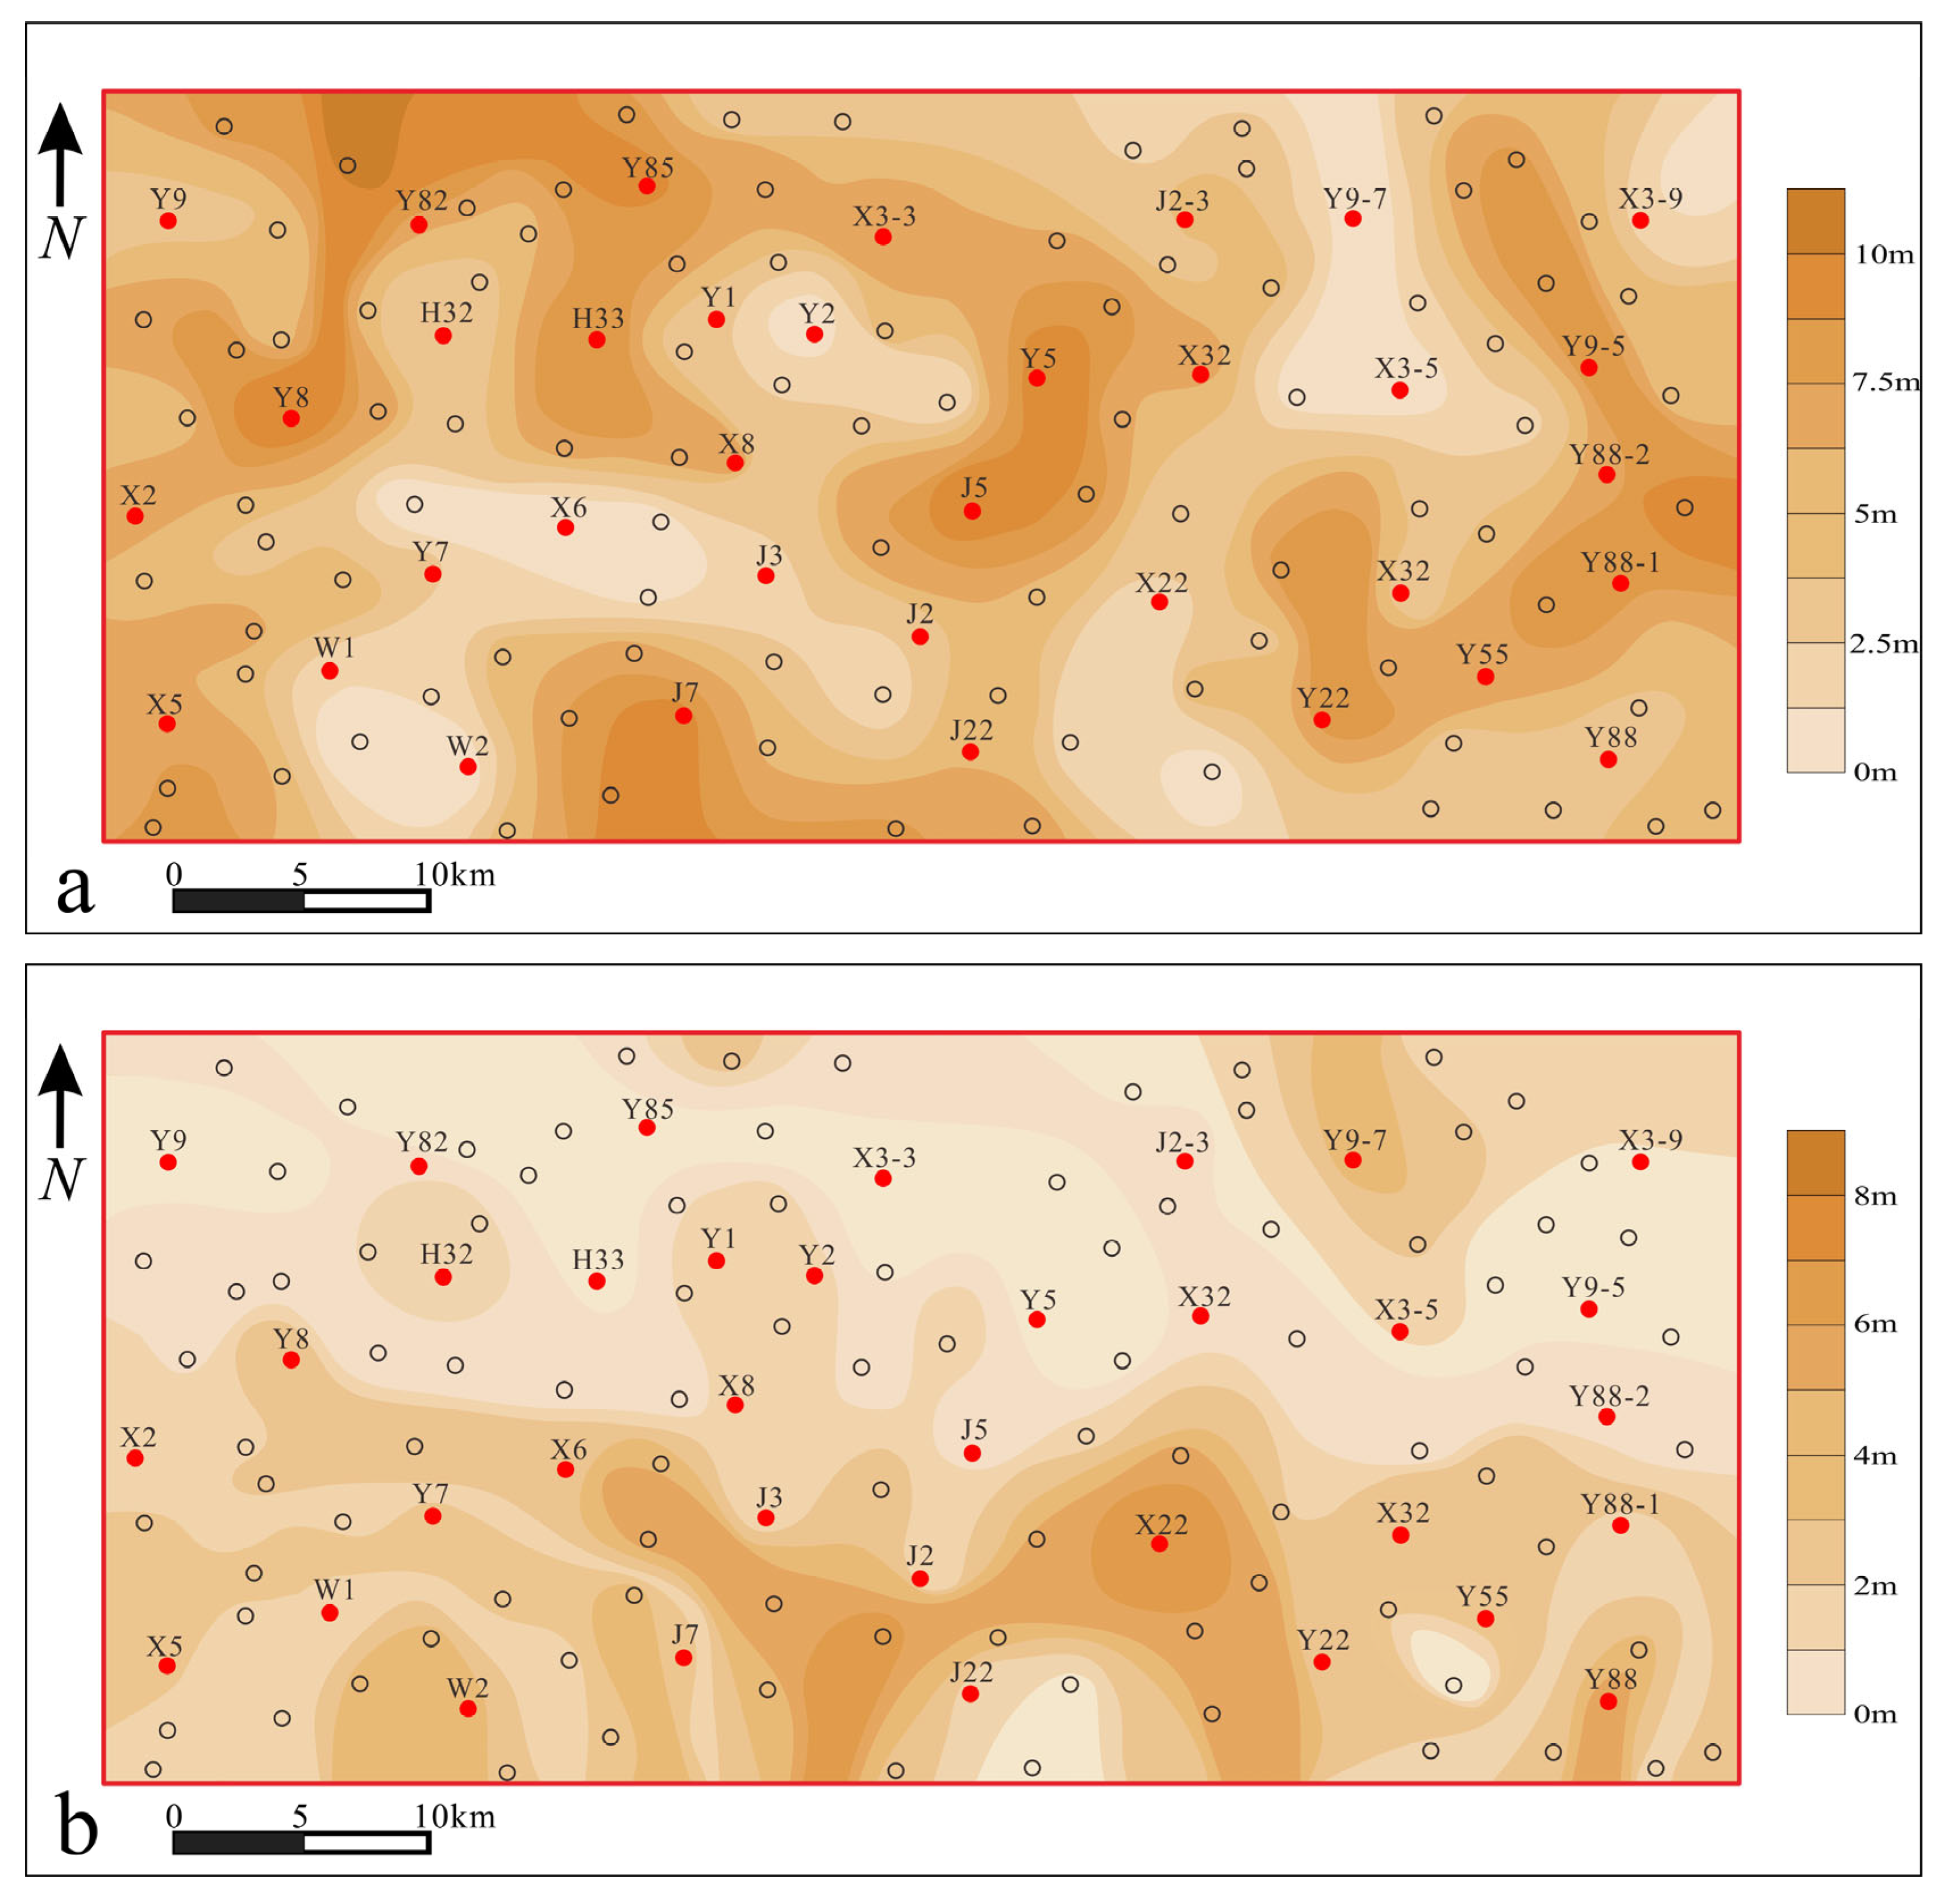
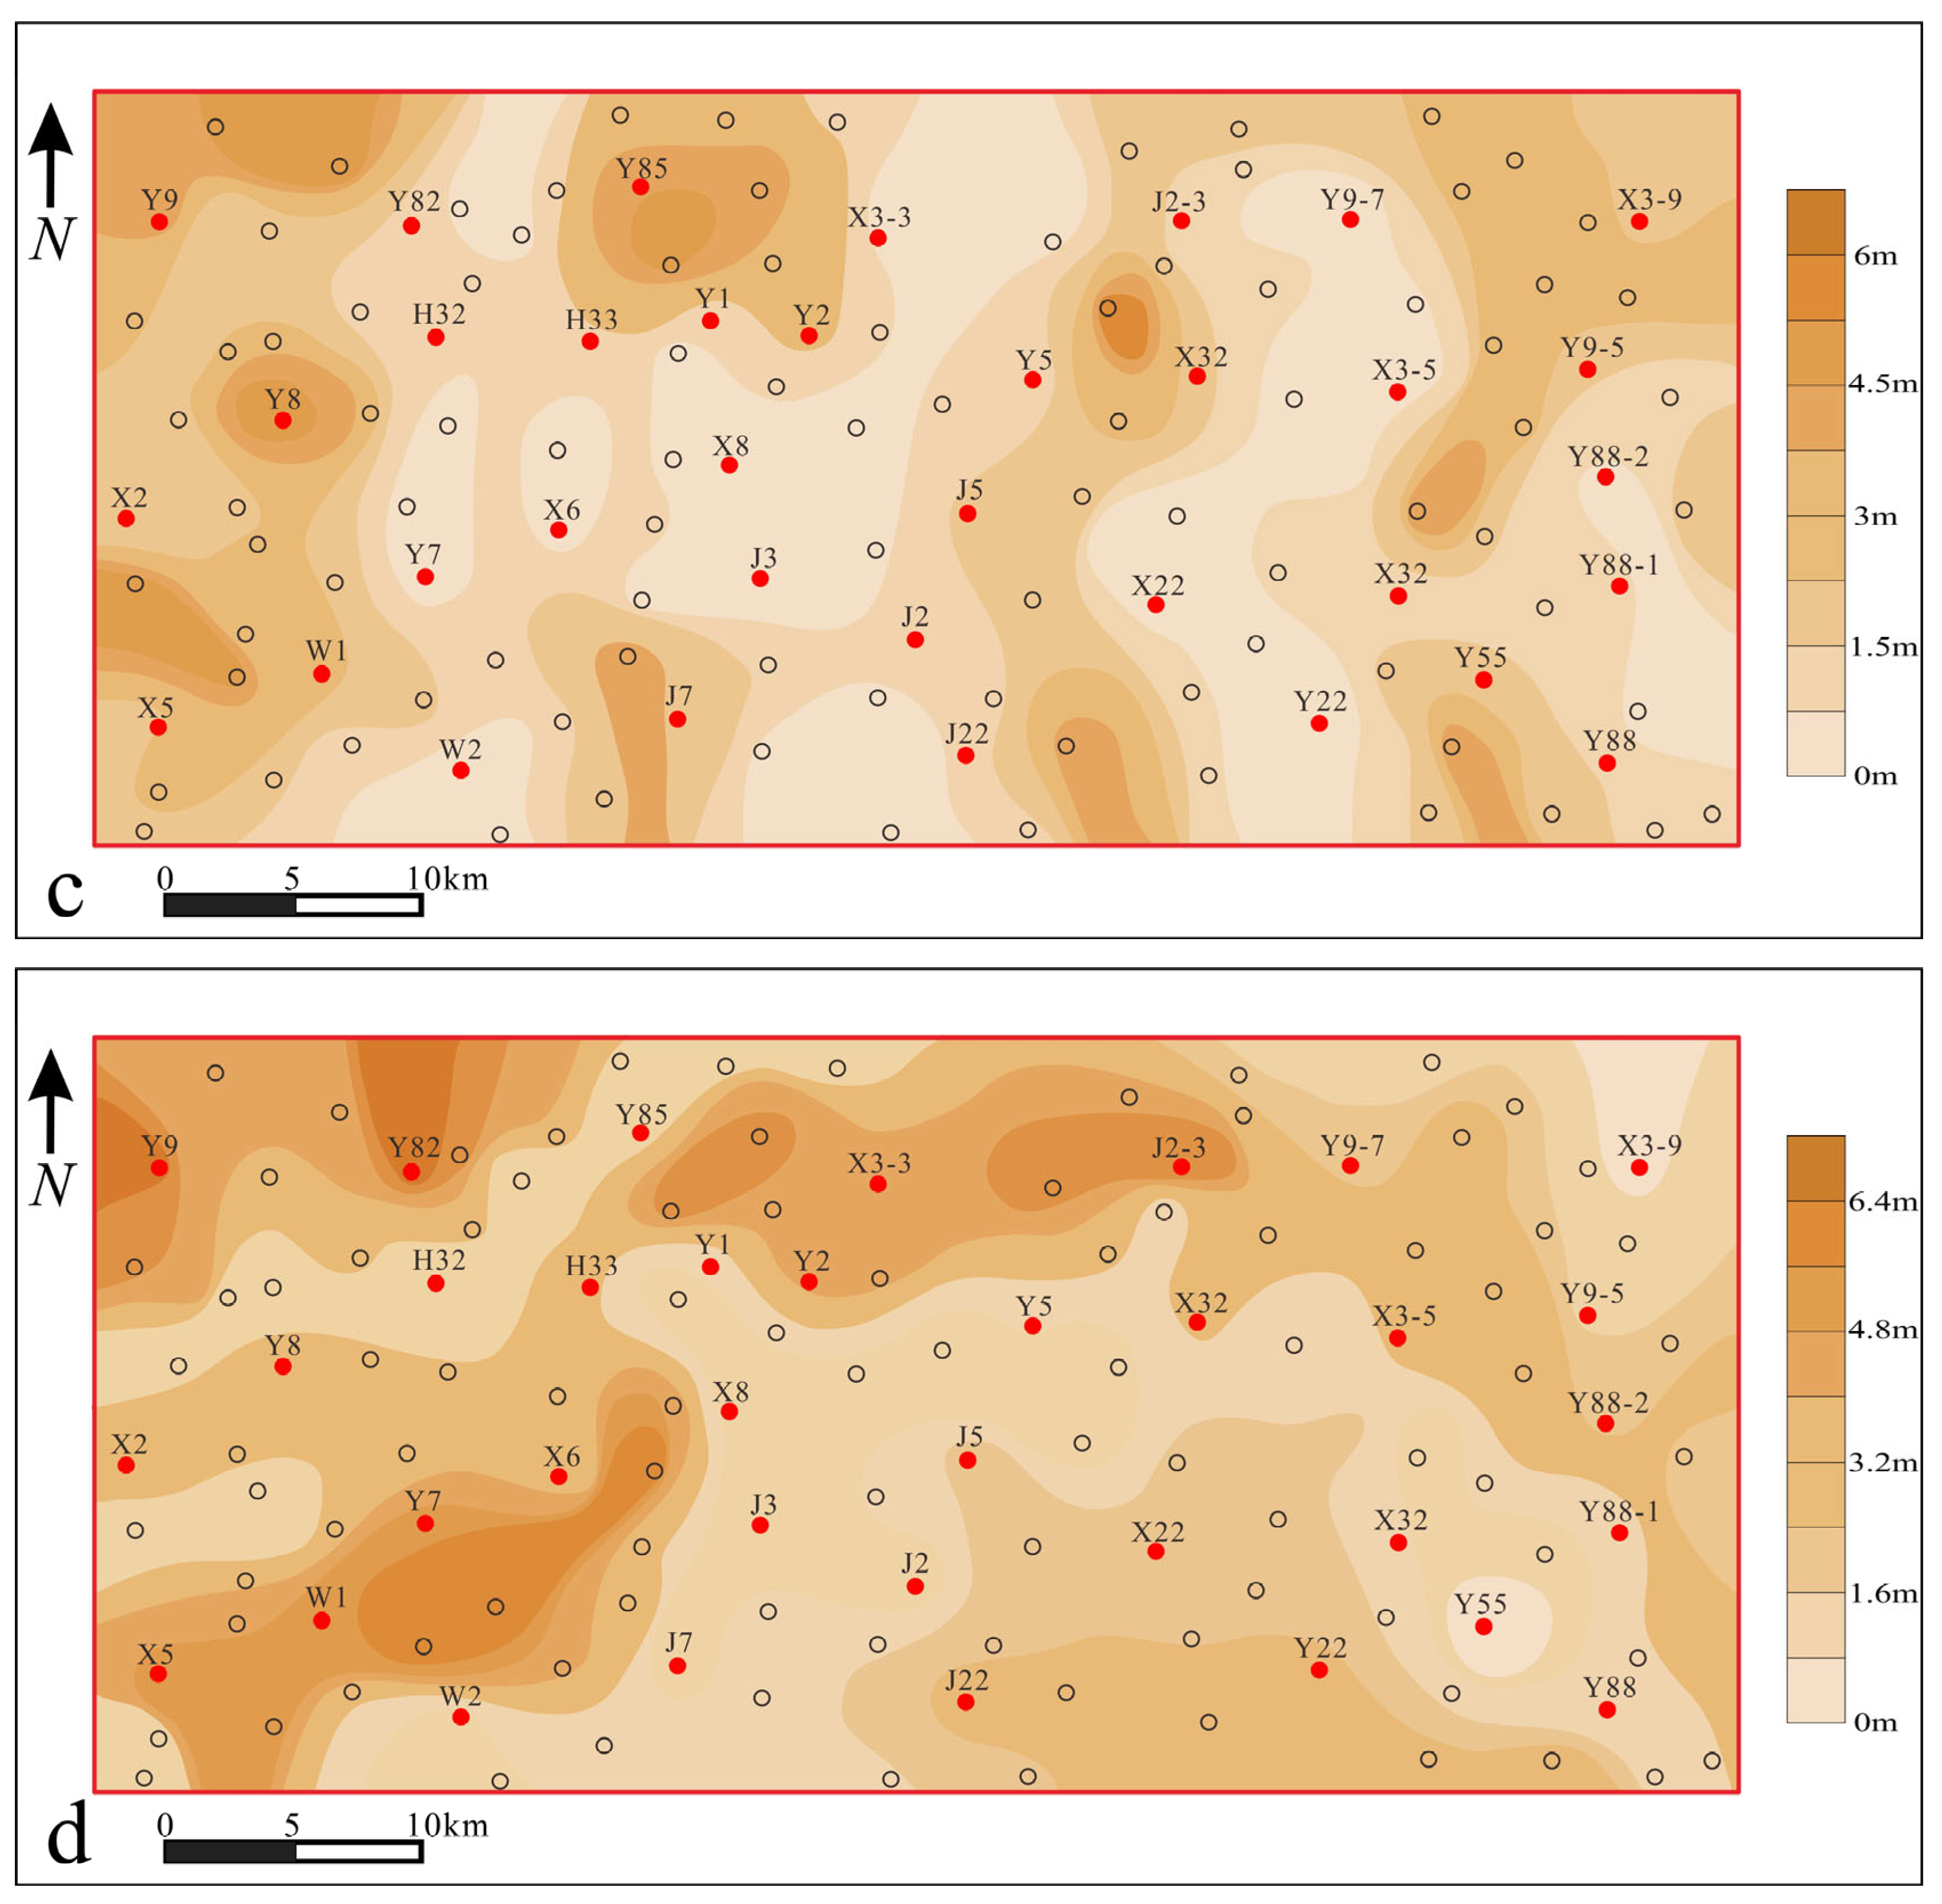
The analysis of the planar distribution characteristics of each lithology reveals that dolomite and limestone in the study area exhibit the feature of “dolomite being generally widespread overall, with limestone locally and sporadically developed” (Figure 14a,c). Specifically, dolomite (Figure 14a) has a relatively wide distribution across the entire area but exhibits strong heterogeneity. Its thickness mainly ranges from 1.6 m to 6.4 m, with localized thick centers in the northwestern and southwestern parts of the study area. Limestone (Figure 14c) shows a patchy and sporadic distribution, with an overall thin thickness (mostly less than 3 m). Limy dolomite (Figure 14b) is mainly developed in the eastern and southeastern parts of the study area, showing a general trend of thicker layers in the east and southeast, and thinner layers (less than 3.6 m) in the west and central areas. The distribution of argillaceous dolomite (Figure 14d) is relatively limited; apart from three distinct thickness centers in the west, this lithology is either absent or extremely thin in most other parts of the study area.
In summary, the study area is primarily dominated by carbonate rock (dolomite and limy dolomite) deposition, with an overall low argillaceous content. Although argillaceous dolomite is locally developed in the southwest, its distribution range is limited. In practical exploration and development, considering the relationship between reservoir physical properties and lithology, focus should be placed on the central-eastern and southeastern regions where dolomite and limy dolomite have greater thicknesses. Thick layers of dolomite and limy dolomite with low argillaceous content are the most favorable reservoir development facies belts in this area. A certain thickness of dolomite is also developed in the southwest of the study area (Figure 14a), but this region simultaneously overlaps with the thickest argillaceous dolomite in the entire area. In conclusion, this method achieves the fine division and interpretation of single lithofacies such as dolomite and limy dolomite, clarifies the planar distribution patterns of favorable reservoir lithofacies, and lays a solid foundation for the subsequent quantitative prediction of high-quality carbonate rock reservoirs.

5.3. Verification of Gas–Water Layer Identification

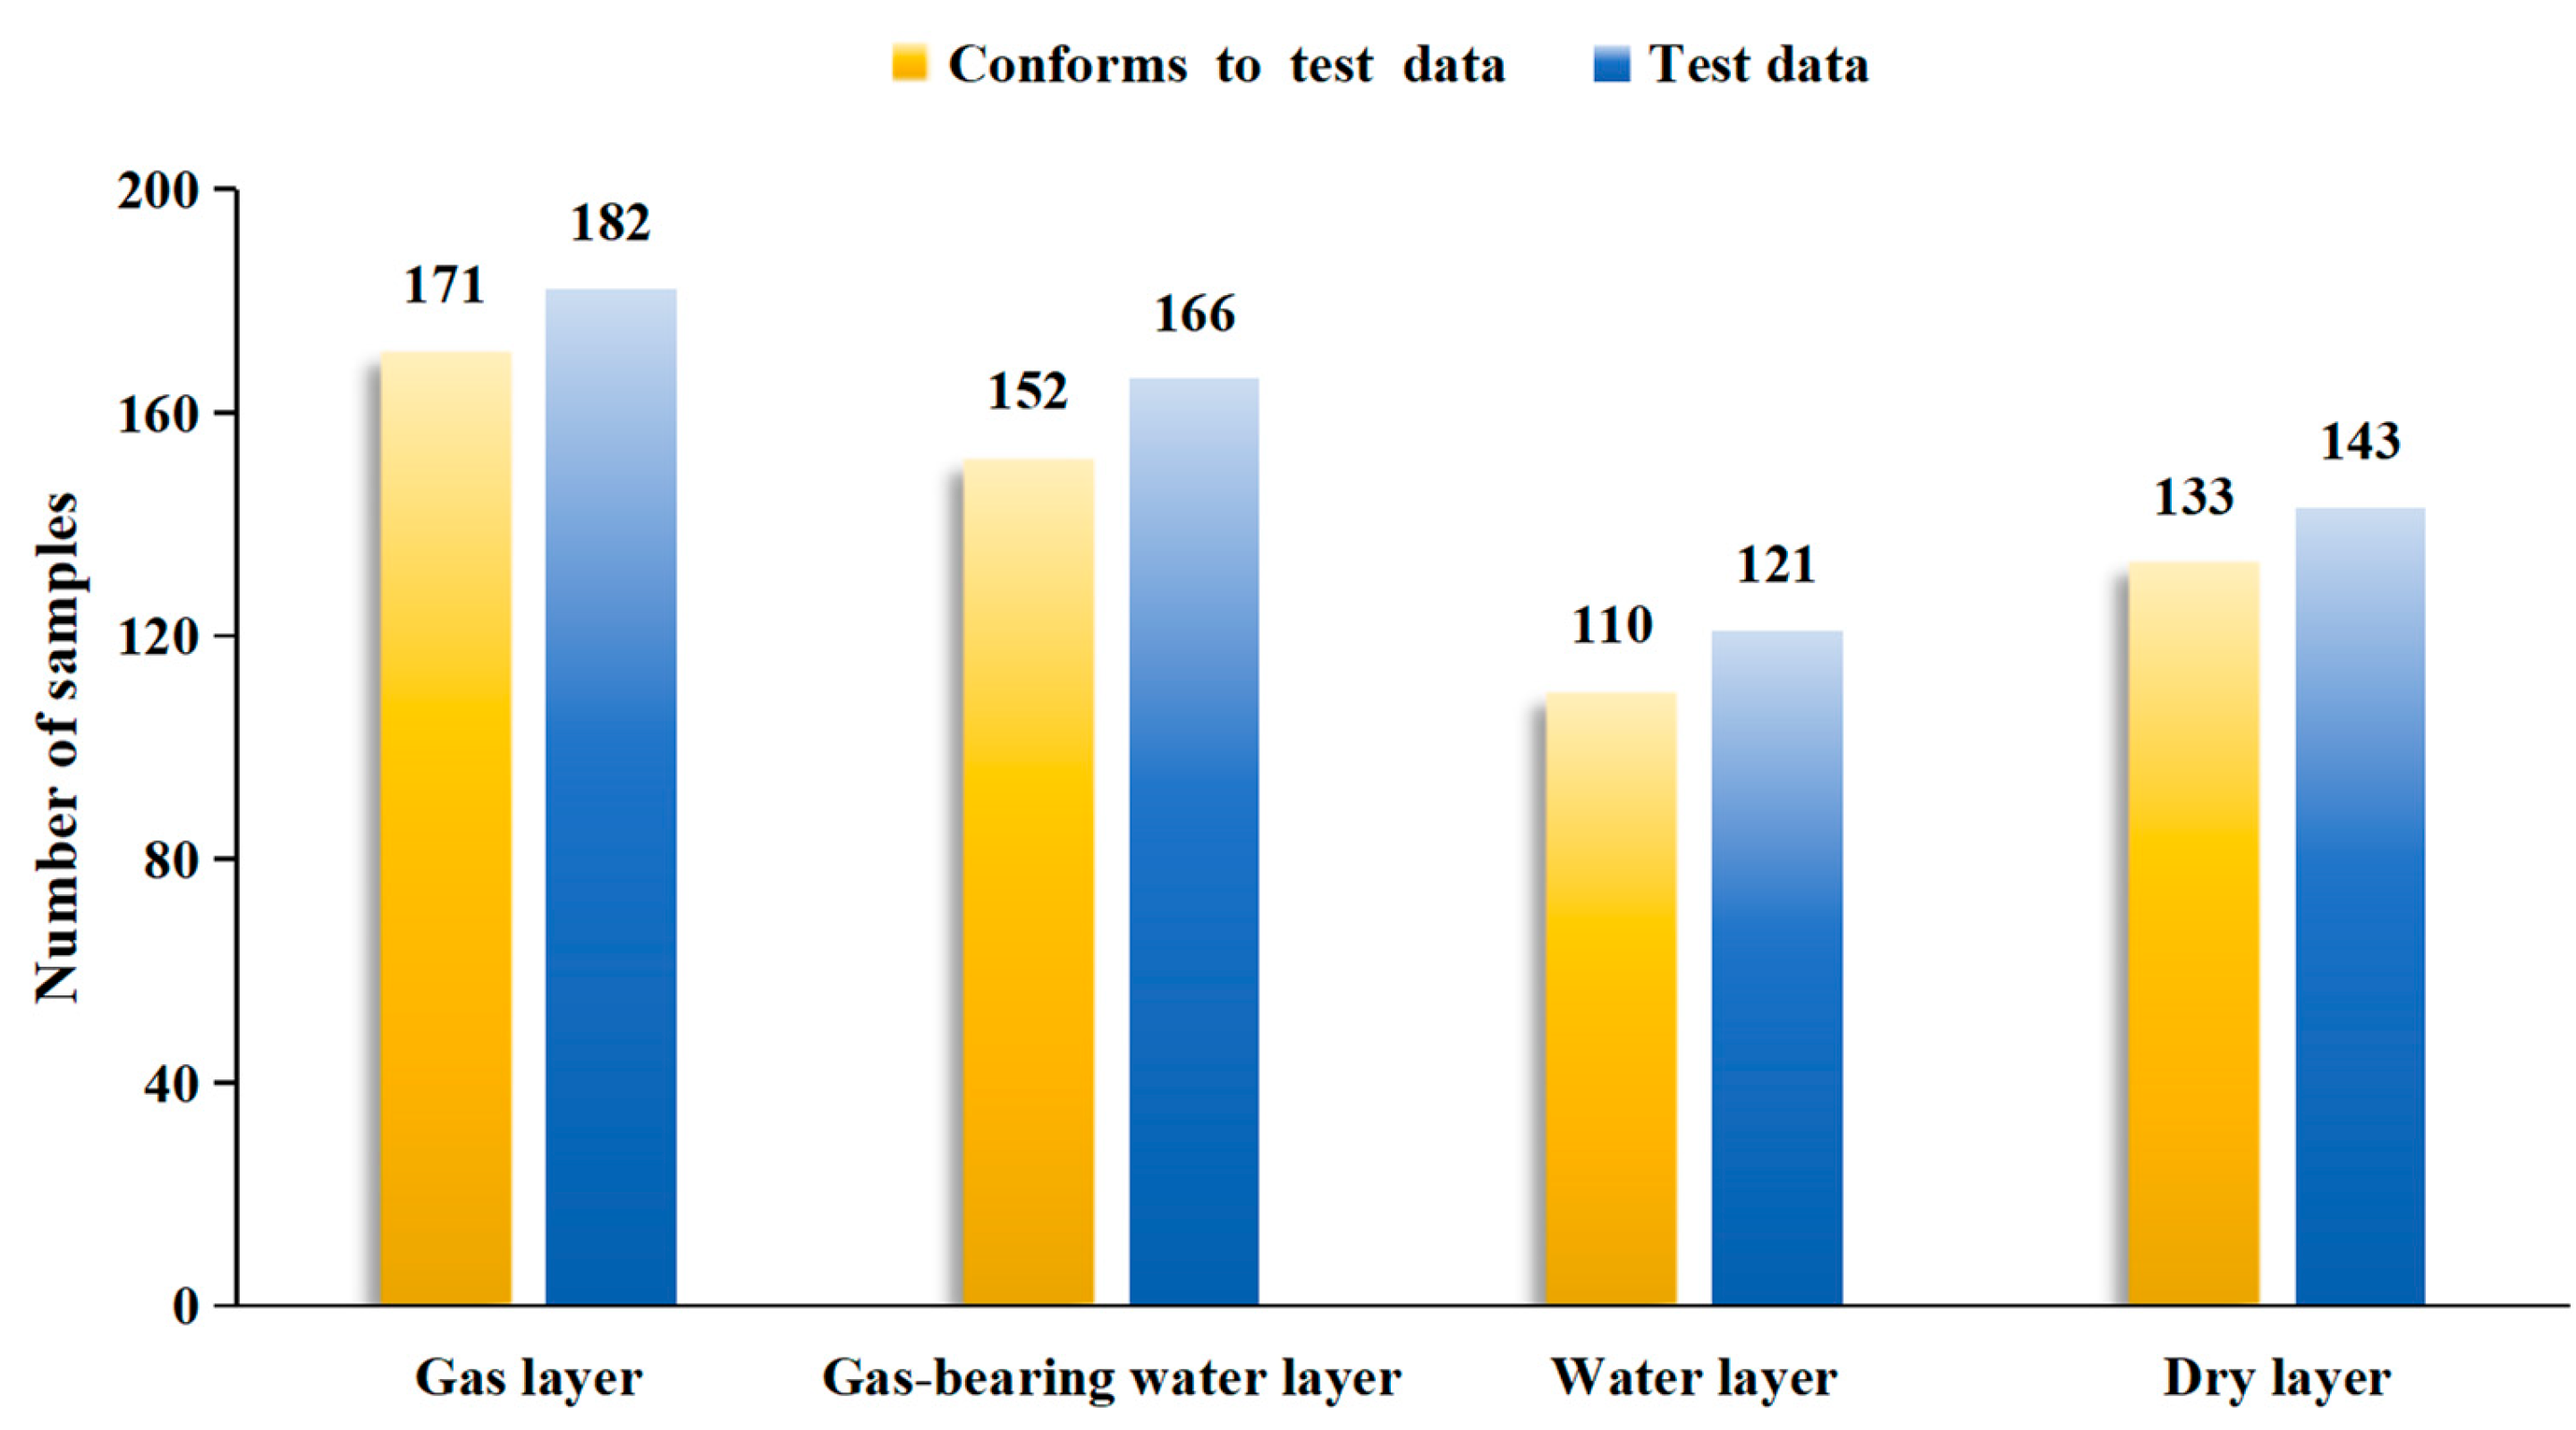
To verify the accuracy of gas–water layer identification using the ΔΦ3, ΔΦ4, and ΔΦ5 crossplot, the identification results of gas layers, water layers, dry layers, and gas-bearing water layers in the Ma541 member from 35 wells in the study area were compared with the actual gas testing results (Figure 13). Among them, for gas layers, out of 182 test points, 171 were consistent, with an accuracy rate of 93.9%; for gas-bearing water layers, out of 166 test points, 152 were consistent, with an accuracy rate of 91.6%; for water layers, out of 121 test points, 110 were consistent, with an accuracy rate of 90.9%; for dry layers, out of 143 test points, 133 were consistent, with an accuracy rate of 93.3% (Figure 15). Table 2 presents the verification results of partial identification data compared to the actual gas testing data. It can be concluded that the results of gas–water layer identification using the ΔΦ3–ΔΦ4–ΔΦ5 crossplot are basically consistent with the actual gas test results.

5.4. Advantages and Limitations of the Curve Superposition-Reconstruction Method

This study employed the curve superposition reconstruction method to accurately identify the lithology and fluids of the Ma541 carbonate gas reservoir in the study area. This technique is helpful for the quantitative interpretation of lithology and fluids for non-core wells and development wells with no logging data. This method only requires conventional logging curves (GR, DEN, PE, CNL, AC, and RD). For carbonate rock blocks with limited data, a composite parameter ΔΦ1–ΔΦ5 is constructed through a simple linear combination of normalized logging data, accurately identifying mudstone, Argillaceous dolomite, dolomite, limy dolomite, and Limestone, thereby obtaining a single lithological planar distribution, laying a foundation for the subsequent division of favorable areas in terms of lithological interpretation. Compared with other lithology identification models, this model is operationally simpler; it requires less data, is easy to obtain, has lower processing costs, high identification accuracy, and is stable, and has high practical value and application prospects. This method is essentially based on the low-order linear combination of conventional logging and fails to explicitly consider the complex, high-dimensional nonlinear relationships that machine learning models may capture when obtaining sufficient data. In the presence of sufficient data, the identification accuracy of this method is slightly lower than that of machine learning [53,54]. Therefore, the curve superposition reconstruction method is limited by various factors, but compared with machine learning methods, it still shows great potential for cost savings and subsequent promotion and application.

6. Conclusions

(1) The multi-curve (ΔΦ1–ΔΦ2) normalized superposition method can quickly and effectively identify limestone, limy dolomite, dolomite, argillaceous dolomite, and mudstone. Specifically, for limestone, the ΔΦ1 value ranges from −0.43 to −1, and the ΔΦ2 value ranges from 0.48 to 1; for limy dolomite, the ΔΦ1 value ranges from −0.09 to −0.71, and the ΔΦ2 value ranges from 0.11 to 0.43; for dolomite, the ΔΦ1 value ranges from −0.41 to 0, and the ΔΦ2 value ranges from 0.09 to −0.11; for argillaceous dolomite, the ΔΦ1 value ranges from 0.11 to 0.44, and the ΔΦ2 value ranges from 0.11 to 0.47; for mudstone, the ΔΦ1 value ranges from 0.41 to 1, and the ΔΦ2 value ranges from 0.44 to 1.
(2) The ΔΦ3–ΔΦ4–ΔΦ5 crossplot can effectively identify gas–water layers. For dry layers, ΔΦ3 ranges from −0.94 to 0.22, ΔΦ4 ranges from 0.76 to 1.41, and ΔΦ5 ranges from 1.31 to 1.97. For water layers, ΔΦ3 ranges from −0.87 to −0.28, ΔΦ4 ranges from 1.41 to 1.91, and ΔΦ5 ranges from 0.73 to 1.32. For gas-bearing water layers, ΔΦ3 ranges from −0.31 to 0.22, ΔΦ4 ranges from 0.76 to 1.41, and ΔΦ5 ranges from 0.65 to 1.26. For gas layers, ΔΦ3 ranges from 0.22 to 0.97, ΔΦ4 ranges from 0.02 to 0.76, and ΔΦ5 ranges from 0.07 to 0.89.
(3) Based on the lithology identification technology for complex carbonate rocks via logging curve superposition and reconstruction, the lithology of the Ma541 member in the study area was predicted. A series of findings were obtained as follows: limy dolomite is mainly developed in the eastern and southeastern parts of the study area; the distribution range of argillaceous dolomite is relatively limited, with obvious thickness centers only in the western part; dolomite is distributed throughout the entire study area, with localized thickness centers in the northwestern and southwestern parts; and limestone is generally thin, occurring as isolated lenses or patches, with thicknesses generally less than 3 m. By obtaining continuous lithology distribution information, this study provides a reliable basis for reservoir division and exploration deployment of carbonate rock gas reservoirs, offering stronger theoretical support for detailed reservoir description and gas field development planning.

Author Contributions

P.W.: Writing—original draft, Writing—review and editing. C.F.: Writing—Review and Editing, Conceptualization, Supervision, Project administration. X.D.: Software, Formal analysis, Supervision. X.S.: Software, Data curation, Supervision. T.L.: Formal analysis, Investigation, Data curation. M.S.: Investigation, Supervision. All authors have read and agreed to the published version of the manuscript.

Funding

This research received no external funding.

Data Availability Statement

The data that support the findings of this study are available from the corresponding author upon reasonable request.

Conflicts of Interest

Author Tongyang Lou was employed by the China Southern Petroleum Exploration & Development Corporation, PetroChina. The remaining authors declare that the research was conducted in the absence of any commercial or financial relationships that could be construed as a potential conflict of interest. The China Southern Petroleum Exploration & Development Corporation, PetroChina had no role in the design of the study; in the collection, analyses, or interpretation of data; in the writing of the manuscript, or in the decision to publish the results.

References

  1. Liu, Y.; Ren, Z.; Qi, K.; Yan, X.; Xiong, B.; Liu, J.; Ren, J.; Xing, G.; Jia, M.; Yao, J.; et al. Characteristics of Fluid Inclusions and Hydrocarbon Accumulation Stages of Carbonate Rock Reservoir: A Case Study from the Majiagou Formation Ordovician, Central and Eastern Ordos Basin. Minerals 2025, 15, 139. [Google Scholar] [CrossRef] [Scilit]
  2. Fu, S.; Zhang, C.; Chen, H.; Chen, A.; Zhao, J.; Su, Z.; Yang, S.; Wang, G.; Mi, W. Characteristics, formation and evolution of pre-salt dolomite reservoirs in the fifth member of the Ordovician Majiagou Formation, mid-east Ordos Basin, NW China. Pet. Explor. Dev. 2019, 46, 1153–1164. [Google Scholar] [CrossRef] [Scilit]
  3. Tian, K.; Zhou, J.; Yin, X.; Xue, C.; Cao, J.; Ma, L.; Zhao, W. Characteristics and the formation mechanism of the dolomite reservoirs for Lower Ordovician Majiagou Formation, central Ordos Basin, China. Front. Earth Sci. 2025, 13, 1497600. [Google Scholar] [CrossRef] [Scilit]
  4. Qi, G.; Liu, B. Production feature analysis of global onshore carbonate oil reservoirs based on XGBoost classier. Processes 2025, 12, 1137. [Google Scholar] [CrossRef] [Scilit]
  5. Tong, K.; He, J.; Chen, P.; Li, C.; Dai, W.; Sun, F.; Wang, J. Key technologies for the efficient development of thick and complex carbonate reservoirs in the Middle East. Energies 2024, 17, 4566. [Google Scholar] [CrossRef] [Scilit]
  6. Malki, M.L.; Saberi, M.R.; Kolawole, O.; Rasouli, V.; Sennaoui, B.; Ozotta, O. Underlying mechanisms and controlling factors of carbonate reservoir characterization from rock physics perspective: A comprehensive review. Geoenergy Sci. Eng. 2023, 226, 211793. [Google Scholar] [CrossRef] [Scilit]
  7. Gohari, M.S.J.; Emami Niri, M.; Ghiasi-Freez, J. Improving permeability estimation of carbonate rocks using extracted pore network parameters, a gas field case study. Acta Geophys. 2021, 69, 509–527. [Google Scholar] [CrossRef] [Scilit]
  8. Yarmohammadi, S.; Kadkhodaie, A.; Hosseinzadeh, S. An integrated approach for heterogeneity analysis of carbonate reservoirs by using image log based porosity distributions, NMR T2 curves, velocity deviation log and petrographic studies: A case study from the South Pars gas field, Persian Gulf Basin. J. Pet. Sci. Eng. 2020, 192, 107283. [Google Scholar] [CrossRef] [Scilit]
  9. Al Moqbel, A.; Wang, Y. Carbonate reservoir characterization with lithofacies clustering and porosity prediction. J. Geophys. Eng. 2021, 8, 592–598. [Google Scholar] [CrossRef] [Scilit]
  10. Carrasquilla, A. Lithofacies prediction from conventional well logs using geological information, wavelet transform, and decision tree approach in a carbonate reservoir in southeastern Brazil. J. S. Am. Earth Sci. 2023, 128, 104431. [Google Scholar] [CrossRef] [Scilit]
  11. Dong, S.; Zeng, L.; Du, X.; He, J.; Sun, F. Lithofacies identification in carbonate reservoirs by multiple kernel Fisher discriminant analysis using conventional well logs: A case study in A oilfield, Zagros Basin, Iraq. J. Pet. Sci. Eng. 2022, 210, 110081. [Google Scholar] [CrossRef] [Scilit]
  12. Song, Z.; Xiao, D.; Wei, Y.; Zhao, R.; Wang, X.; Tang, J. The research on complex lithology identification based on well logs: A case study of lower 1st member of the Shahejie formation in Raoyang Sag. Energies 2023, 16, 1748. [Google Scholar] [CrossRef] [Scilit]
  13. Xiong, Y.; Wang, L.C.; Tan, X.C.; Liu, Y.; Liu, M.J.; Qiao, Z.F. Dolomitization of the Ordovician subsalt Majiagou Formation in the central Ordos Basin, China: Fluid origins and dolomites evolution. Pet. Sci. 2021, 18, 362–379. [Google Scholar] [CrossRef] [Scilit]
  14. Ren, Q.; Sun, Z.; Wang, H.; Wan, C.; Li, T.; Li, Q.; Yan, Z. Characteristics and Genesis of Carbonate Weathering Crust Reservoirs: A Case from the Ma5Member of Ordovician in Gaoqiao Area, Ordos Basin, China. ACS Omega 2024, 9, 34329–34338. [Google Scholar] [CrossRef] [Scilit] [PubMed]
  15. Fu, S.; Zhang, C.; Liu, H.; Wei, L.; Bao, H.; Ye, X.; Lin, L. Dolomites in a carbonate-evaporite system: The fifth member of the Middle Ordovician Majiagou Formation, Eastern Ordos Basin, China. Front. Mar. Sci. 2025, 12, 1585055. [Google Scholar] [CrossRef] [Scilit]
  16. Chen, S.; Dai, R.; Luo, S. Pore Types and Dolomite Reservoir Genesis of the Fifth Member of the Ordovician Majiagou Formation in the Central and Eastern Ordos Basin. Appl. Sci. 2024, 14, 10976. [Google Scholar] [CrossRef] [Scilit]
  17. Guo, J.; Ling, Z.; Xu, X.; Zhao, Y.; Yang, C.; Wei, B.; Zhao, Q. Saturation determination and fluid identification in carbonate rocks based on well logging data: A middle eastern case study. Processes 2023, 11, 1282. [Google Scholar] [CrossRef] [Scilit]
  18. Molina Camargo, M.; Seyfang, B.; Basso, M.; Furlan Chinelatto, G.; Chandler, A.S.; Vidal, A.C. Challenges and suggestions for defining electrofacies models: The problem with well-log resolution and the resulting “shoulder bed effects” applied to a carbonate reservoir. Interpretation 2025, 13, T871–T886. [Google Scholar] [CrossRef] [Scilit]
  19. Fan, Z.; Hu, C.; Jiang, S.; Li, M.; Cai, Y.; Jiang, Y.; Tian, M. Logging-data-driven lithology identification in complex reservoirs: An example from the Niuxintuo block of the Liaohe oilfield. Front. Earth Sci. 2025, 13, 1491334. [Google Scholar] [CrossRef] [Scilit]
  20. Hou, X.; Lian, P.; Zhao, J.; Zai, Y.; Zhu, W.; Wang, F. Identification of carbonate sedimentary facies from well logs with machine learning. Pet. Res. 2024, 9, 165–175. [Google Scholar] [CrossRef] [Scilit]
  21. Chen, L.; Wang, X.; Liu, Z. Geological information-driven deep learning for lithology identification from well logs. Front. Earth Sci. 2025, 13, 1662760. [Google Scholar] [CrossRef] [Scilit]
  22. Shi, Y.; Liao, J.; Gan, L.; Tang, R. Lithofacies prediction from well log data based on deep learning: A case study from Southern Sichuan, China. Appl. Sci. 2024, 14, 8195. [Google Scholar] [CrossRef] [Scilit]
  23. Song, X.L.; Feng, C.; Li, T.; Zhang, Q.; Pan, X.; Sun, M.; Ge, Y. Quantitative classification evaluation model for tight sandstone reservoirs based on machine learning. Sci. Rep. 2024, 14, 20712. [Google Scholar] [CrossRef] [Scilit]
  24. Song, X.; Feng, C.; Li, T.; Zhang, Q.; Zhou, J.; Sun, M. Pore Structure Quantitative Characterization of Tight Sandstones Based on Deep Learning and Fractal Analysis. Fractal Fract. 2025, 9, 372. [Google Scholar] [CrossRef] [Scilit]
  25. Zhang, J.; He, Y.; Zhang, Y.; Li, W.; Zhang, J. Well-logging-based lithology classification using machine learning methods for high-quality reservoir identification: A case study of Baikouquan formation in Mahu Area of Junggar Basin, NW China. Energies 2022, 15, 3675. [Google Scholar] [CrossRef] [Scilit]
  26. Wang, F.; Hou, X. Machine learning-based prediction of physical parameters in heterogeneous carbonate reservoirs using well log data. Energy Geosci. 2025, 6, 100383. [Google Scholar] [CrossRef] [Scilit]
  27. Al-Anazi, A.; Gates, I.D. A support vector machine algorithm to classify lithofacies and model permeability in heterogeneous reservoirs. Eng. Geol. 2010, 114, 267–277. [Google Scholar] [CrossRef] [Scilit]
  28. Nanjo, T.; Tanaka, S. Carbonate lithology identification with machine learning. In Proceedings of the Abu Dhabi International Petroleum Exhibition & Conference, Abu Dhabi, United Arab Emirates, 11–14 November 2019; Volume 11. [Google Scholar] [CrossRef] [Scilit]
  29. Kassem, A.A.; Abdel Fattah, M.; Hassan, Z.; Radwan, A.E. Reservoir rock discrimination based on integrated image logs and petrographic analysis: A case study from the Early Miocene Nukhul Carbonate, Southern Gulf of Suez, Egypt. Arab. J. Sci. Eng. 2025, 50, 305–326. [Google Scholar] [CrossRef] [Scilit]
  30. Abdullah, M.A.; Mohammed, A.A.; Awad, S.R. RockDNet: Deep learning approach for lithology classification. Appl. Sci. 2024, 14, 5511. [Google Scholar] [CrossRef] [Scilit]
  31. Li, X.; Li, P.; Qi, H.; Wang, Y.; Zhan, T.; Li, Q. A combined approach to lithology identification using reinforcement learning and transformer algorithms. Front. Earth Sci. 2025, 13, 1595574. [Google Scholar] [CrossRef] [Scilit]
  32. Gong, A.; Zhang, L. Deep learning-based approach for reservoir fluid identification in low-porosity, low-permeability reservoirs. Phys. Fluids 2025, 37, 046611. [Google Scholar] [CrossRef] [Scilit]
  33. Song, X.; Gao, H.; Feng, C.; Yi, P.; Wang, C.; Li, T. Analysis of the influence of micro-pore structure on oil occurrence using nano-CT scanning and nuclear magnetic resonance technology: An example from Chang 8 tight sandstone reservoir, Jiyuan, Ordos Basin. Processes 2023, 11, 1127. [Google Scholar] [CrossRef] [Scilit]
  34. Alameedy, U. Accurate petrophysical interpretation of carbonate using the elemental capture spectroscopy (ECS). Iraqi J. Chem. Pet. Eng. 2023, 24, 125–131. [Google Scholar] [CrossRef] [Scilit]
  35. Basso, M.; Chinelatto, G.F.; Belila, A.M.P.; Mendes, L.C.; Souza, J.P.P.; Stefanelli, D.; Bueno, J.F. Characterization of silicification and dissolution zones by integrating borehole image logs and core samples: A case study of a well from the Brazilian pre-salt. Pet. Geosci. 2023, 29, petgeo2022-044. [Google Scholar] [CrossRef] [Scilit]
  36. Wood, D.A. Expanding role of borehole image logs in reservoir fracture and heterogeneity characterization: A review. Adv. Geo-Energy Res. 2024, 12, 194–204. [Google Scholar] [CrossRef] [Scilit]
  37. Hussein, H.S.; Mansurbeg, H.; Bábek, O. A new approach to predict carbonate lithology from well logs: A case study of the Kometan formation in northern Iraq. Heliyon 2024, 10, e25262. [Google Scholar] [CrossRef] [Scilit]
  38. Saleem, M.A.; Sohail, G.M.; Rehman, S.U.; Yasin, Q.; Radwan, A.E. Multiple machine learning algorithms for lithofacies prediction in the deltaic depositional system of the lower Goru Formation, Lower Indus Basin, Pakistan. Sci. Rep. 2025, 15, 34933. [Google Scholar] [CrossRef] [Scilit]
  39. Wang, Z.; Cai, Y.; Liu, D.; Lu, J.; Qiu, F.; Hu, J.; Gamage, R.P. A review of machine learning applications to geophysical logging inversion of unconventional gas reservoir parameters. Earth-Sci. Rev. 2024, 258, 104969. [Google Scholar] [CrossRef] [Scilit]
  40. Zhang, J.; Liu, G.; Wei, Z.; Li, S.; Zayier, Y.; Cheng, Y. Machine Learning-Based Prediction of Well Logs Guided by Rock Physics and Its Interpretation. Sensors 2025, 25, 836. [Google Scholar] [CrossRef] [Scilit]
  41. Al-Mudhafar, W.J.; Hasan, A.A.; Abbas, M.A.; Wood, D.A. Machine learning with hyperparameter optimization applied in facies-supported permeability modeling in carbonate oil reservoirs. Sci. Rep. 2025, 15, 12939. [Google Scholar] [CrossRef] [Scilit]
  42. Shi, J.X.; Zhao, X.Y.; Zeng, L.B.; Zhang, Y.Z.; Zhu, Z.P.; Dong, S.Q. Identification of reservoir types in deep carbonates based on mixed-kernel machine learning using geophysical logging data. Pet. Sci. 2024, 21, 1632–1648. [Google Scholar] [CrossRef] [Scilit]
  43. Ge, Y.; Zhao, K.; Niu, H.; Song, X.; Qiao, L.; Cheng, X.; Feng, C. Logging Identification Methods for Oil-Bearing Formations in the Chang 6 Tight Sandstone Reservoir in the Qingcheng Area, Ordos Basin. Energies 2024, 17, 3966. [Google Scholar] [CrossRef] [Scilit]
  44. Yang, Z.; Wang, A.; Fan, L.; Ma, Z.; Luo, X.; Ning, X.; Meng, K. Paragenesis and Formation Mechanism of the Dolomite-Mottled Limestone Reservoir of Ordovician Ma4 Member, Ordos Basin. Minerals 2023, 13, 1172. [Google Scholar] [CrossRef] [Scilit]
  45. Li, Y.; Xu, W.; Fu, M.; Deng, H.; Wu, D.; He, J.; Chen, P. Dolomitization Controlled by Paleogeomorphology in the Epicontinental Sea Environment: A Case Study of the 5th Sub-Member in 5 Member of the Ordovician Majiagou Formation in Daniudi Gas Field, Ordos Basin. Minerals 2021, 11, 827. [Google Scholar] [CrossRef] [Scilit]
  46. Chen, A.; Xu, S.; Yang, S.; Chen, H.; Su, Z.; Zhong, Y.; Hu, S. Ordovician deep dolomite reservoirs in the intracratonic Ordos Basin, China: Depositional model and Diagenetic evolution. Energy Explor. Exploit. 2018, 36, 850–871. [Google Scholar] [CrossRef] [Scilit]
  47. Sun, Z.; Cui, X.; Liu, X.; Liu, H.; Lu, X. Fe occupancy in zoned ferroan dolomite and its constraints on dolomite ordering process: A case study on micritic dolostone of Ordovician Majiagou formation in eastern Ordos Basin, China. J. Asian Earth Sci. 2025, 298, 106915. [Google Scholar] [CrossRef] [Scilit]
  48. Sun, Z.; Cui, X.; Liu, H.; Cao, J.; Lu, X. Dolomitization mechanism for thick bedded dolostones of the Ordovician Majiagou Formation (Member 5) in the eastern Ordos Basin, China. J. Asian Earth Sci. 2025, 297, 106889. [Google Scholar] [CrossRef] [Scilit]
  49. Gao, X.; Li, J.; Guan, B.; Niu, H.; Qiao, L.; Zhao, K.; Deng, H.; Feng, J. Lower Limit of Reservoir Properties of Carbonate Rock Tight Reservoir in North Ma541a Area, Middle Zone, Yanchang Gas Field, Ordos Basin. Nat. Gas Geosci. 2025, 36, 1839–1853. [Google Scholar] [CrossRef]
  50. GB/T 29171–2012; Method for Determination of Porosity and Permeability of Reservoir Rocks. Standards Press of China: Beijing, China, 2012.
  51. SY/T 6451–2000; Technical Specifications for Logging Data Quality Evaluation. Petroleum Industry Press: Beijing, China, 2000.
  52. Zhou, J.; Pu, H.; Lu, X.; Wang, L.; Zhang, P.; Wen, Y.; Wang, T.; Guan, W. Distribution Characteristics and Main Controlling Factors of Gypsum and Salt Rocks in the Mawu Formation of the Ordovician in the Central-Eastern Ordos Basin. Lithol. Oil Gas Reserv. 2025. Available online: https://link.cnki.net/urlid/62.1195.TE.20251208.1136.002 (accessed on 23 January 2026).
  53. Hui, G.; Chen, Z.; Wang, Y.; Zhang, D.; Gu, F. An integrated machine learning-based approach to identifying controlling factors of unconventional shale productivity. Energy 2023, 266, 126512. [Google Scholar] [CrossRef] [Scilit]
  54. Bashmagh, N.; Lin, W.; Ishitsuka, K. Application of supervised machine learning classification models to identify borehole breakouts in carbonate reservoirs based on conventional log data. Int. J. JSRM 2024, 20, 240101. [Google Scholar] [CrossRef]
Figure 1. Regional Geological Overview Map [1]. (a) Regional geological map; (b) Stratigraphic column chart; (c) Map of China; (d) Location map of the study area wells.
Processes 14 00851 g001
Figure 2. Crossplots of Lithologies and Logging Parameters.
Processes 14 00851 g002
Figure 3. Feature Importance Analysis Results.
Processes 14 00851 g003
Figure 4. Histogram of Lithology Distribution of Carbonate Reservoirs in the Ma 541 Member of the Study Area.
Processes 14 00851 g004
Figure 5. Histogram of Reservoir Physical Property Distribution of the Ma541 Member in the Study Area: (a) Porosity Histogram; (b) Permeability Histogram.
Processes 14 00851 g005
Figure 6. Cast Thin Sections of the Ma541 Member in the Study Area. (A) intergranular pores (B) micro-fracture and dissolution pores.
Processes 14 00851 g006
Figure 7. Histogram of Gas-bearing Property Distribution of the Ma541 Member Reservoir in the Study Area: (a) Fluid-Lithology Histogram; (b) Gas Saturation Histogram.
Processes 14 00851 g007
Figure 8. Core Photographs of the Ma541 Member Reservoir in the Study Area: (a) Argillaceous dolomite, (b) Dolomite, (c) Limestone, (d) Limy dolomite, (e) Mudstone.
Processes 14 00851 g008
Figure 9. Lithology Identification Bar chart of the Ma541 Member Reservoir in the Study Area.
Processes 14 00851 g009aProcesses 14 00851 g009b
Figure 10. Lithology Identification Crossplot for the Ma541 Member Reservoir in the Study Area.
Processes 14 00851 g010
Figure 11. Gas–Water Zone Identification Crossplot for the Ma541 Member Reservoir in the Study Area: (a) DEN vs. ΔΦ3 Crossplot, (b) DEN vs. ΔΦ4 Crossplot.
Processes 14 00851 g011
Figure 12. ΔΦ3–ΔΦ4–ΔΦ5 Crossplot for Fluid Identification of the Ma541 Member Reservoir in the Study Area.
Processes 14 00851 g012
Figure 13. Lithology Identification Verification Crossplot.
Processes 14 00851 g013
Figure 14. Thickness Map of Carbonate Reservoirs in the Study Area. (a) Dolomite Thickness map. (b) Limy Dolomite Thickness map. (c) Limestone Thickness map. (d) Argillaceous Dolomite Thickness map.
Processes 14 00851 g014aProcesses 14 00851 g014b
Figure 15. Verification Map of Gas and Water Layers in Section Ma541 of the Study Area.
Processes 14 00851 g015
Table 1. Lithology Identification of the Ma541 Member Reservoir in the Study Area.
LithologyGR
(API)
DEN
(g/cm3)
PE
(b/e)
ΔΦ1ΔΦ2
Mudstone71–2001.8–2.51.2–3.80.37~1−0.41~−1
Argillaceous Dolomite45–1402.4–2.61.8–3.80–0.43−0.08~−0.47
Dolomite18–752.5–2.82.6–4.3−0.43~0−0.15~0.15
Limy Dolomite13–632.6–2.83.4–5.1−0.48~−0.120.15~0.46
Limestone11–442.7–2.93.8–7−0.44~−10.46~1
Table 2. Verification Table of Gas and Water Layers in Section Ma541 of the Study Area.
Well
Number
ΔΦ3ΔΦ4ΔΦ5Identify Test ResultTest Result
X2−0.2610.8290.698Gas-bearing water layerGas-bearing water layer
X5−0.6331.8341.113Water layerWater layer
W10.3830.4360.553Gas layerGas layer
Y820.6960.5230.449Gas layerGas layer
H32−0.2971.3841.273Water layerGas-bearing water layer
J70.1160.8410.887Gas-bearing water layerGas-bearing water layer
Y5−0.6991.7790.913Water layerWater layer
Y880.7120.2910.613Gas layerGas layer
X220.2560.7390.733Gas layerGas-bearing water layer
X320.6640.3410.559Gas layerGas layer
Y88−0.7440.8551.652Dry layerDry layer
Y9-5−0.2931.4330.953Water layerGas-bearing water layer
X3-50.4660.5230.447Gas layerGas layer
Y88-10.8330.3550.129Gas layerGas layer
Disclaimer/Publisher’s Note: The statements, opinions and data contained in all publications are solely those of the individual author(s) and contributor(s) and not of MDPI and/or the editor(s). MDPI and/or the editor(s) disclaim responsibility for any injury to people or property resulting from any ideas, methods, instructions or products referred to in the content.