Article

Morphology and Crystal Phase-Dependent Photocatalytic Performance of ZnS QDs/rGO and ZnS NRs/rGO Nanocomposites for Methylene Blue Degradation Under UV Irradiation


1
College of Mathematics and Computer, Jilin Normal University, Siping 136000, China
2
College of Physics, Jilin Normal University, Changchun 130103, China
3
Science and Technology Innovation Center of Jilin Province for Targeted Identification and Photocatalytic Degradation Materials, College of Engineering, Jilin Normal University, Siping 136000, China
*
Authors to whom correspondence should be addressed.
Processes 2026, 14(5), 848; https://doi.org/10.3390/pr14050848
Submission received: 27 January 2026 / Revised: 27 February 2026 / Accepted: 3 March 2026 / Published: 6 March 2026
(This article belongs to the Special Issue Mechanisms, Devices and Applications of Photocatalytic Processes)

Abstract

In this work, hexagonal wurtzite ZnS nanorods (NRs) and cubic sphalerite ZnS quantum dots (QDs) were synthesized via different methods, and then ZnS NRs/rGO and ZnS QDs/rGO nanocomposites were fabricated by a hydrothermal composite strategy. The structural, morphological, optical and photocatalytic properties of the as-prepared samples were systematically characterized by XRD, TEM, HRTEM, XPS, FT-IR, UV-Vis absorption and PL spectroscopy. The photocatalytic performance of all samples was evaluated by the degradation of methylene blue (MB) under ultraviolet (UV) irradiation, and the cyclic stability of the catalysts was also investigated. The results showed that rGO effectively inhibited the agglomeration of ZnS nanostructures, promoted the separation of photogenerated electron–hole pairs and suppressed their recombination. ZnS QDs/rGO exhibited the optimal photocatalytic performance with an MB degradation efficiency of 98.08% and a first-order rate constant of 2.063 × 10⁻² min−1 after 180 min of UV irradiation, which was significantly higher than pristine ZnS NRs (74.49%, 7.58 × 10⁻³ min−1) and ZnS QDs (88.95%, 1.47 × 10⁻² min−1). Moreover, ZnS NRs/rGO showed superior cyclic stability due to the higher crystallinity of ZnS NRs. The enhanced photocatalytic activity and stability of ZnS/rGO nanocomposites were attributed to the synergistic effect between ZnS and rGO, which increased active sites, facilitated charge transfer and inhibited photocorrosion. This study provides a valuable structural design strategy for the development of high-efficiency ZnS-based photocatalysts for organic dye degradation in water treatment.

1. Introduction

Industrial wastewater-borne organic pollutants, especially methylene blue (MB) dye, have triggered severe aquatic environmental pollution and human health risks due to their poor biodegradability and biotoxicity. Conventional treatment methods including physical adsorption, chemical oxidation and biological degradation are limited by incomplete mineralization, high cost and low efficiency for high-concentration dye wastewater, driving the demand for green and efficient remediation technologies [1,2]. Semiconductor-based photocatalytic degradation has emerged as a research hotspot for its simplicity, low cost, environmental friendliness and complete pollutant mineralization, and has been widely validated for aquatic pollutant treatment [3,4]. As a typical II-VI group n-type semiconductor, zinc sulfide (ZnS) is an ideal photocatalytic material for MB degradation, with cubic sphalerite and hexagonal wurtzite crystal structures, appropriate band gap, excellent chemical stability and tunable photocatalytic activity via morphological regulation [5].
Researchers have prepared various ZnS nanostructures for photocatalysis: Dutta et al. synthesized ZnS hollow spheres hydrothermally [6], Ham et al. fabricated ZnS nanobelts via the wet chemical method [7], and Kashinath et al. produced ZnS nanoparticles by the sol–gel method [8]. Notably, zero-dimensional (0D) quantum dots exhibit superior photocatalytic performance to one-dimensional (1D) ZnS nanostructures (e.g., nanorods), due to the prominent quantum confinement effect that enlarges the light absorption area and enhances charge separation and transport. Furthermore, 1D nanostructures generally possess higher stability compared to 0D structures, as their anisotropic morphology mitigates the driving force for particle agglomeration, which is crucial for practical applications [9]. Regarding the crystal structure, 1D ZnS nanostructures are predominantly found in the hexagonal wurtzite phase, as its inherent anisotropy (e.g., polar c-axis) facilitates directional crystal growth along specific crystallographic directions [10]. In contrast, the isotropic cubic sphalerite structure is more typical for 0D quantum dots and nanoparticles [11].
However, pure ZnS suffers from a high photogenerated electron–hole recombination rate, which restricts its practical application [12]. Reduced graphene oxide (rGO), a 2D carbon material with high optical transparency in the visible light region, a large specific surface area and excellent conductivity, is an efficient modifier for ZnS: compounding rGO with ZnS can adsorb more MB molecules and transfer photogenerated electrons rapidly, thus inhibiting charge recombination [13,14]. Relevant studies have confirmed the enhanced performance of ZnS-rGO composites: Tang et al. prepared rGO-CdS/ZnS heterostructures with improved light conversion efficiency [15], and Feng et al. found ZnS-rGO composites outperformed pure ZnS in photocatalysis [16].
Despite advances in ZnS-rGO photocatalysts, critical research gaps remain: there is a lack of comparative studies on MB degradation by 0D and 1D ZnS-based rGO nanocomposites, and the structure–activity relationship and interfacial interaction mechanisms between ZnS of different dimensionalities and rGO are not yet elucidated. To fill these gaps, this study prepared 0D ZnS quantum dots (QDs) and 1D ZnS nanorods (NRs) via differentiated methods, and constructed ZnS QDs/rGO and ZnS NRs/rGO nanocomposites. We systematically investigated the effects of ZnS’s structural and morphological variations on photocatalytic performance for MB degradation, clarified the ZnS-rGO interfacial interaction mechanisms, and aimed to provide experimental fundamentals for the rational design and performance enhancement of ZnS-based photocatalysts for industrial dye wastewater treatment.

2. Experimental

2.1. Materials

Reagents and apparatus are described in detail in the Supplementary Materials (Texts S1 and S2). All reagents were of analytical grade (Shanghai Chemical Reagent) and did not require further purification.

2.2. Sample Preparation

2.2.1. Preparation of ZnS NRs, ZnS QDs and Graphene Oxide (GO)

The specific synthesis procedures for ZnS NRs, ZnS QDs, and GO are detailed in the Supplementary Materials (Texts S3–S5), and the corresponding synthesis flowcharts are provided in the Supporting Information (Figures S1–S3).

2.2.2. Preparation of ZnS NRs-rGO Nanocomposites

A total of 0.02 g of ZnS NRs was ultrasonically dispersed in 30 mL deionized water over a period of 1 h to yield Solution C. Simultaneously, 0.01 g of GO was ultrasonically dispersed in 10 mL deionized water for 1 h to prepare Solution B. Subsequently, Solution A was added dropwise into Solution B under continuous ultrasonication for 1 h. The resulting mixture was transferred to a 50 mL high-pressure autoclave and maintained at 140 °C for 12 h. Upon completion of the reaction, the autoclave was cooled to ambient temperature along with the furnace. The product was subjected to centrifugal washing with deionized water and ethanol, followed by drying at 80 °C for 2 h to afford ZnS NRs-rGO nanocomposites (Figure S4).

2.2.3. Synthesis of ZnS QDs-rGO Nanocomposites

A total of 0.02 g of ZnS QDs was ultrasonically dispersed in 30 mL deionized water to yield Solution D. In the meantime, 0.01 g of GO was ultrasonically dispersed in 10 mL deionized water for the preparation of Solution B. Solution A was then added dropwise into Solution B, with subsequent continuous ultrasonication for 1 h. The resulting mixture was transferred into a 50 mL high-pressure autoclave, which was then maintained at 140 °C for 12 h prior to being furnace-cooled to room temperature. The as-obtained product was subjected to centrifugal washing with deionized water and ethanol sequentially, and thereafter dried at 80 °C for 2 h to afford ZnS QDs-rGO nanocomposites (Figure S5).

2.3. Photocatalytic Degradation Measurement

Methylene blue (MB) was selected as the model organic pollutant for the photocatalytic experiments due to its widespread use as a benchmark dye in photocatalysis research, its environmental relevance as a common industrial effluent, and its analytical convenience (strong characteristic absorption peak at 664 nm for easy quantification). In each experiment, 10 mg of each sample (ZnS NRs, ZnS QDs, ZnS NRs-rGO, and ZnS QDs-rGO nanocomposites) was added to 50 mL of MB solution, each with an initial concentration of 20 mg·L−1. The mixtures were irradiated under ultraviolet light; at predetermined time intervals, 3 mL of the suspension was withdrawn and centrifuged immediately. The MB in the supernatant was analyzed using an ultraviolet-visible spectrophotometer (UV-5800 PC, Shanghai Metash Instruments Co., Ltd., Shanghai, China). For comparison, a separate adsorption experiment was conducted: 10 mg of rGO was dispersed in 50 mL of 20 mg·L−1 MB solution and tested under dark conditions.

3. Results and Discussion

3.1. Structural Characterization and Analysis

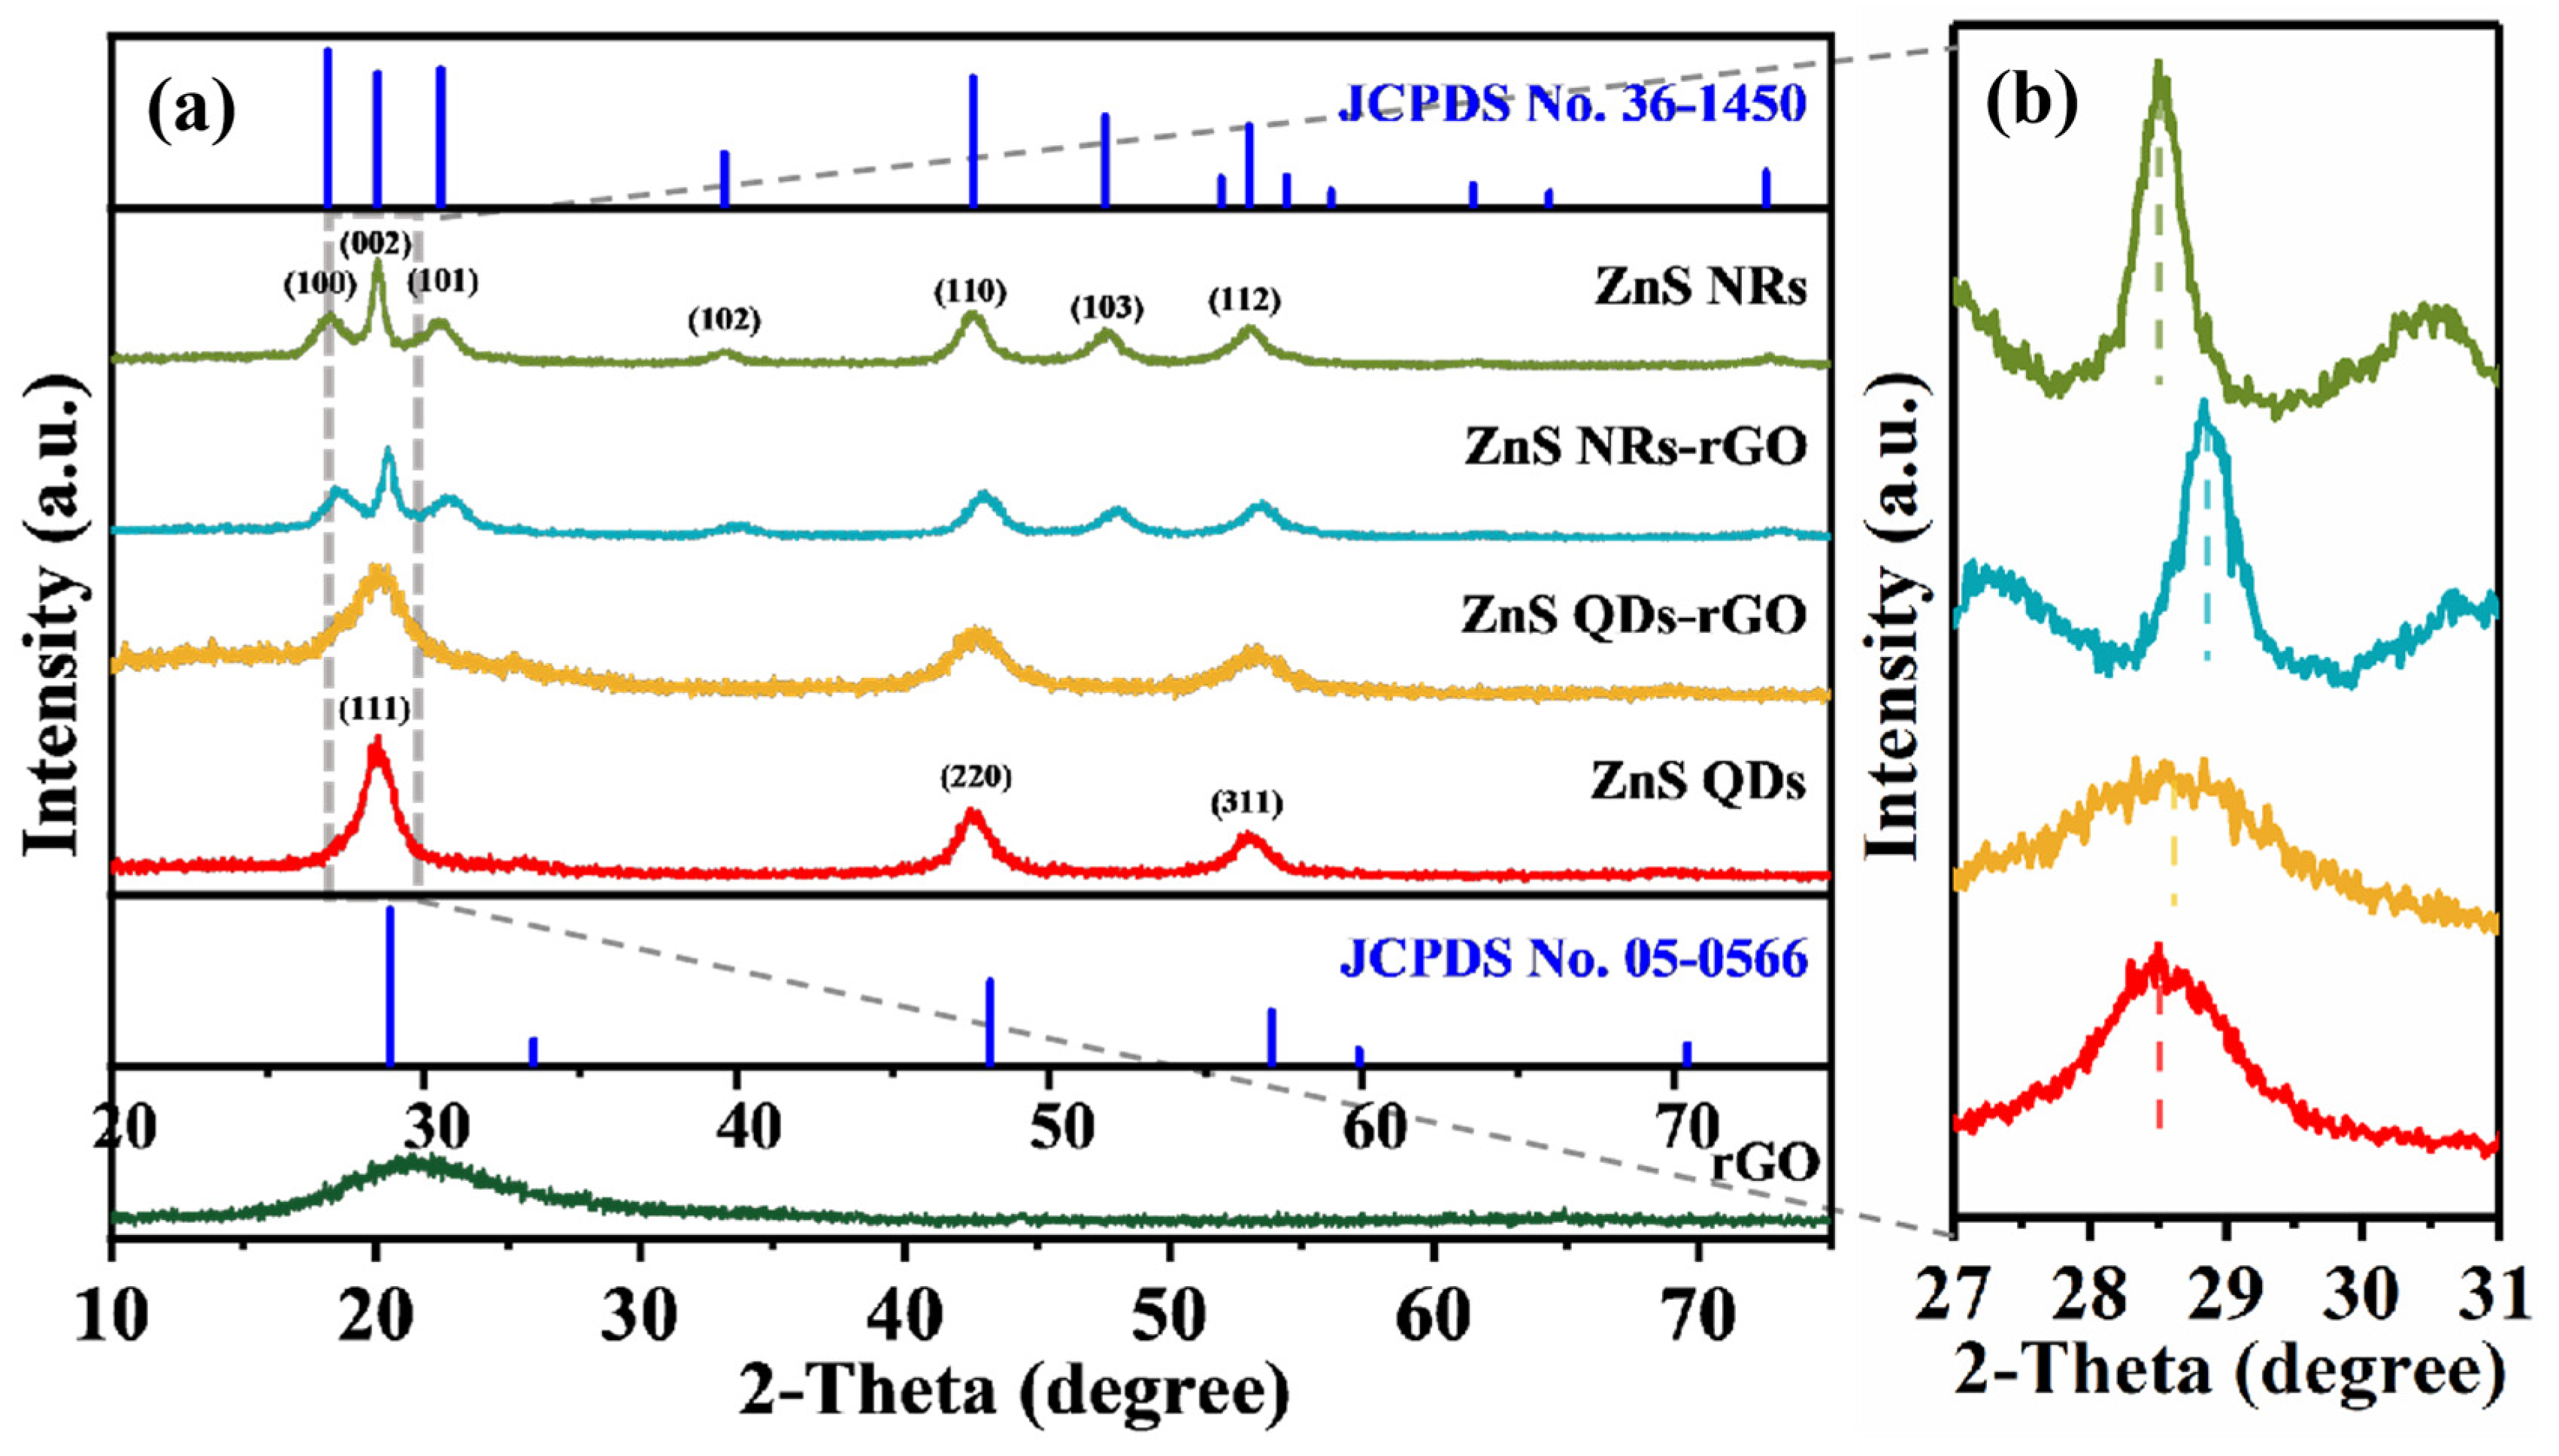
Figure 1a presents the XRD patterns of ZnS NRs, ZnS QDs, ZnS NRs-rGO, and ZnS QDs-rGO. The diffraction peaks of ZnS NRs and ZnS QDs are consistent with the standard cards JCPDS No. 36-1450 [17] and JCPDS No. 05-0566 [18], respectively, confirming that ZnS NRs possess a hexagonal wurtzite structure, whereas ZnS QDs exhibit a cubic sphalerite structure. As shown in Figure 1b, the main peaks of both ZnS NRs-rGO and ZnS QDs-rGO shift toward higher angles without any additional impurity peaks, indicating an interaction between ZnS NRs, ZnS QDs, and rGO rather than a mere physical mixture. Furthermore, no distinct characteristic peaks of rGO are detected in the patterns, possibly due to the low loading of GO in the composites.
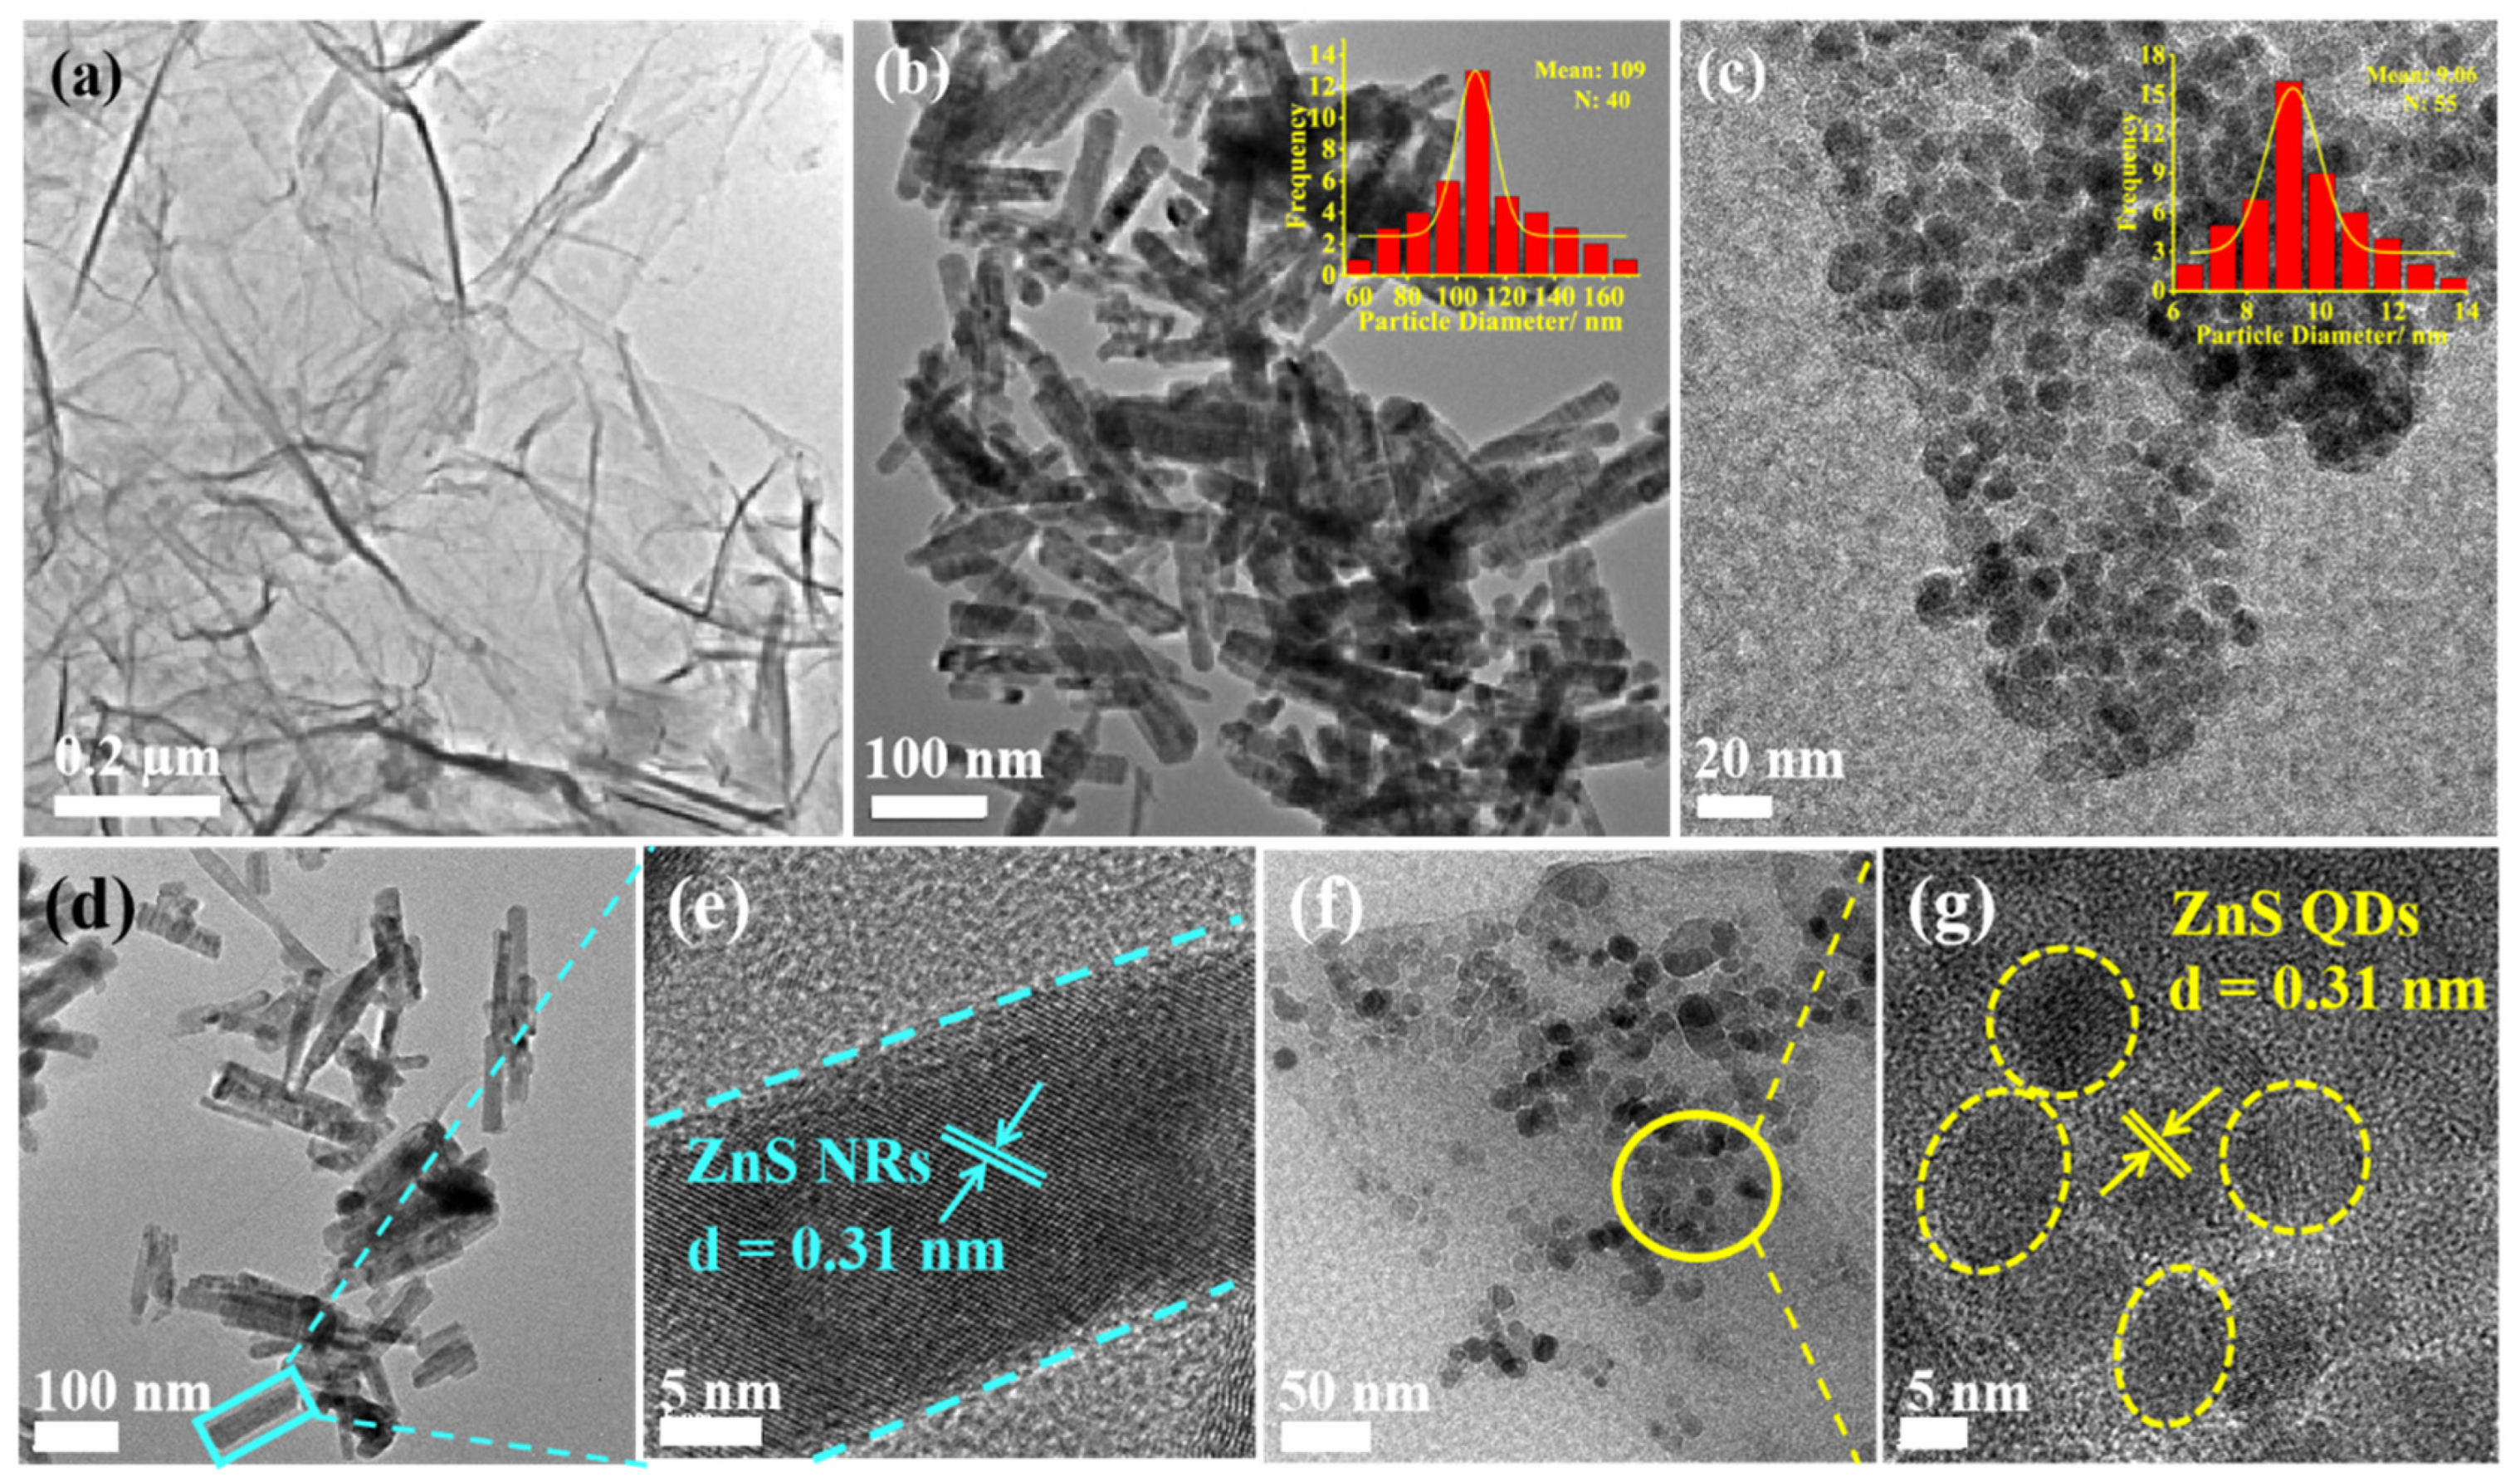
Figure 2a–c displays the TEM images of rGO, ZnS NRs, and ZnS QDs. As observed in Figure 2, rGO (Figure 2a) exhibits a two-dimensional wrinkled sheet-like thin layer morphology. ZnS NRs (Figure 2b) are uniform in size, with an average length of approximately 109 nm and a smooth surface. ZnS QDs (Figure 2c) also show size uniformity, with an average diameter of about 9.06 nm. Notably, both pristine ZnS NRs and ZnS QDs exhibit a certain degree of agglomeration, which is detrimental to the photocatalytic reaction.
Figure 2d–g presents the TEM and HRTEM images of ZnS NRs-rGO and ZnS QDs-rGO nanocomposites. As shown in Figure 2d,f, rGO features ultra-thin boundaries, with ZnS NRs and ZnS QDs uniformly dispersed on its surface. Compared to pristine ZnS NRs and ZnS QDs, the agglomeration in the composites is significantly alleviated. This confirms that rGO exerts a dispersing effect on ZnS. The improved dispersion not only increases the contact interfaces between the catalyst and pollutants but also facilitates their redox reactions, thereby enhancing the overall photocatalytic activity. Figure 2e shows the HRTEM image of ZnS NRs-rGO composites. Clear lattice fringes of ZnS NRs are observed, with an interplanar spacing of 0.31 nm corresponding to the (002) crystal plane, which confirms the excellent crystallinity of the ZnS NRs. Figure 2g displays the HRTEM image of ZnS QDs-rGO composites, revealing an average diameter of 9.07 nm for ZnS QDs and an interplanar spacing of 0.31 nm, which corresponds to the (111) plane of ZnS QDs [19].
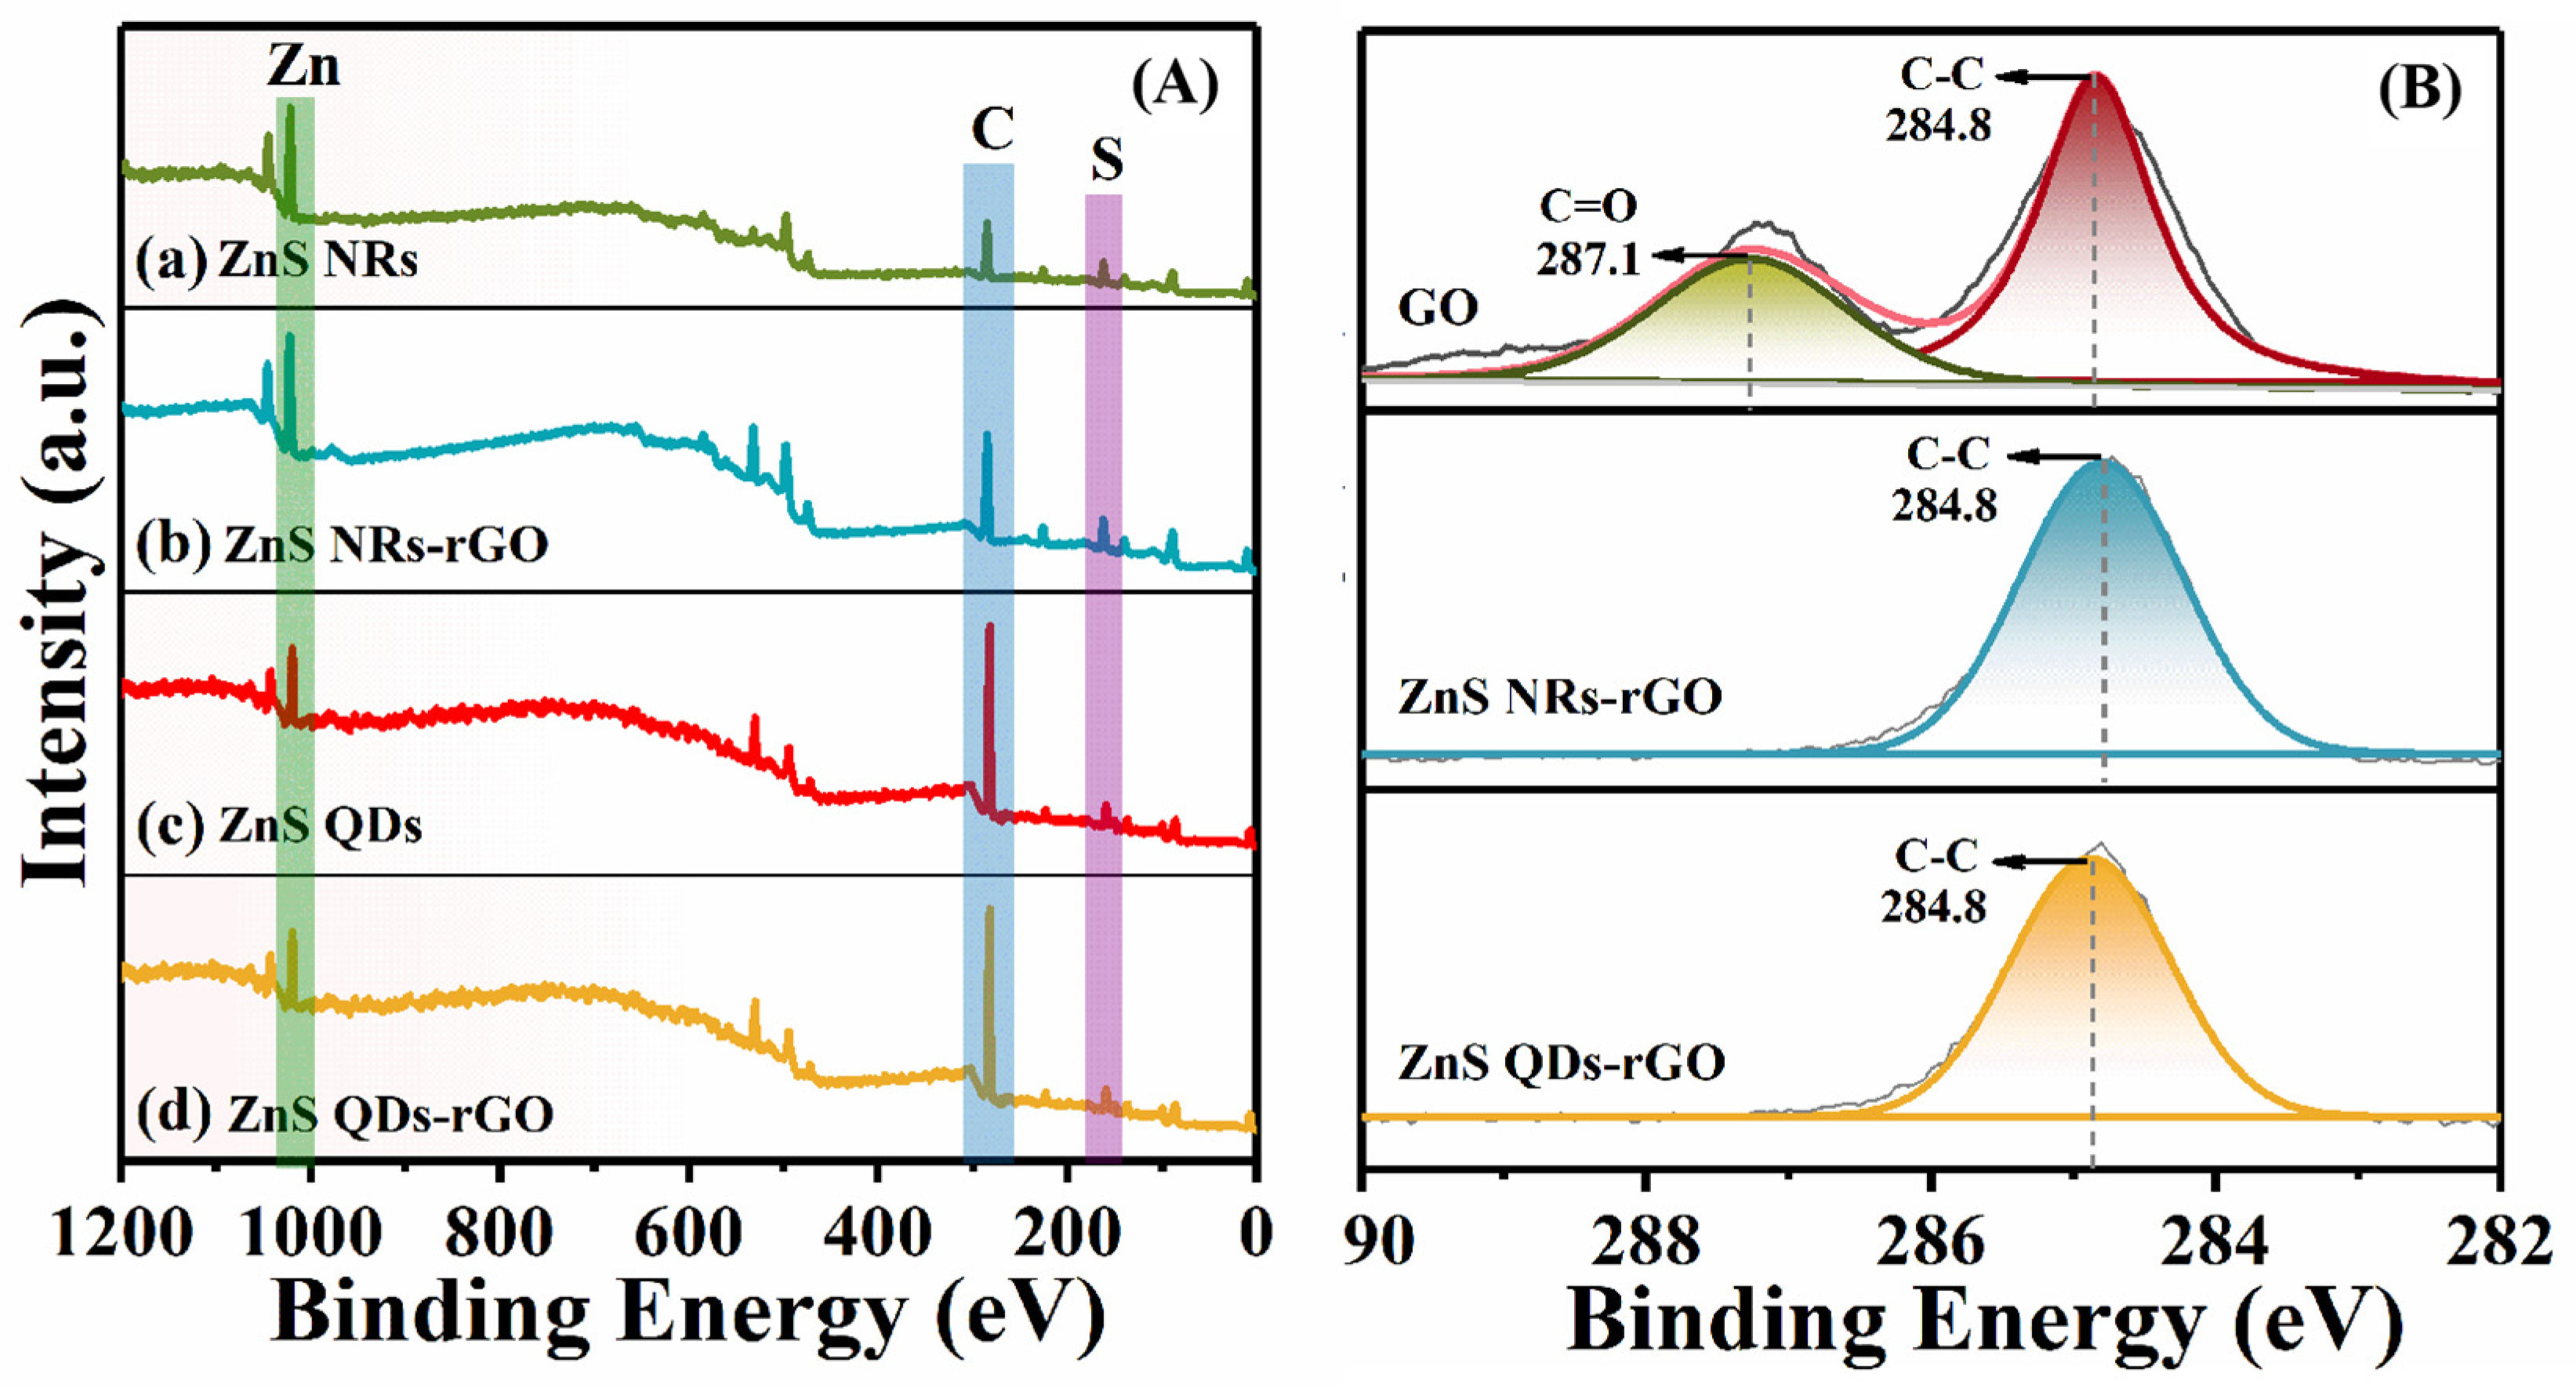
To analyze the surface chemical composition of the samples, XPS measurements are conducted on ZnS NRs, ZnS QDs, ZnS NRs-rGO, and ZnS QDs-rGO. Figure 3A shows the full XPS spectra of these materials. Notably, ZnS NRs-rGO and ZnS QDs-rGO exhibit characteristic peaks of Zn, S, and C, whereas the full spectra of ZnS NRs and ZnS QDs display low-intensity C peaks. These weak C signals may originate from atmospheric carbon-containing gases or unavoidable surface-adhered carbonaceous species such as CO2 and carbonates. Figure 3B is the high-resolution XPS spectrum of C 1s of GO, ZnS NRs-rGO, and ZnS QDs-rGO. The C 1s spectrum of GO can be Gaussian fitted into two peaks at 284.8 eV and 287.1 eV, corresponding to C-C and C=O bonds, respectively [20]. However, the C=O peak is almost not observed in ZnS NRs-rGO and ZnS QDs-rGO nanocomposites, and only the C-C peak is present. This result indicates that a large number of oxygen-containing functional groups in GO are effectively removed after compounding, and GO is reduced to rGO.
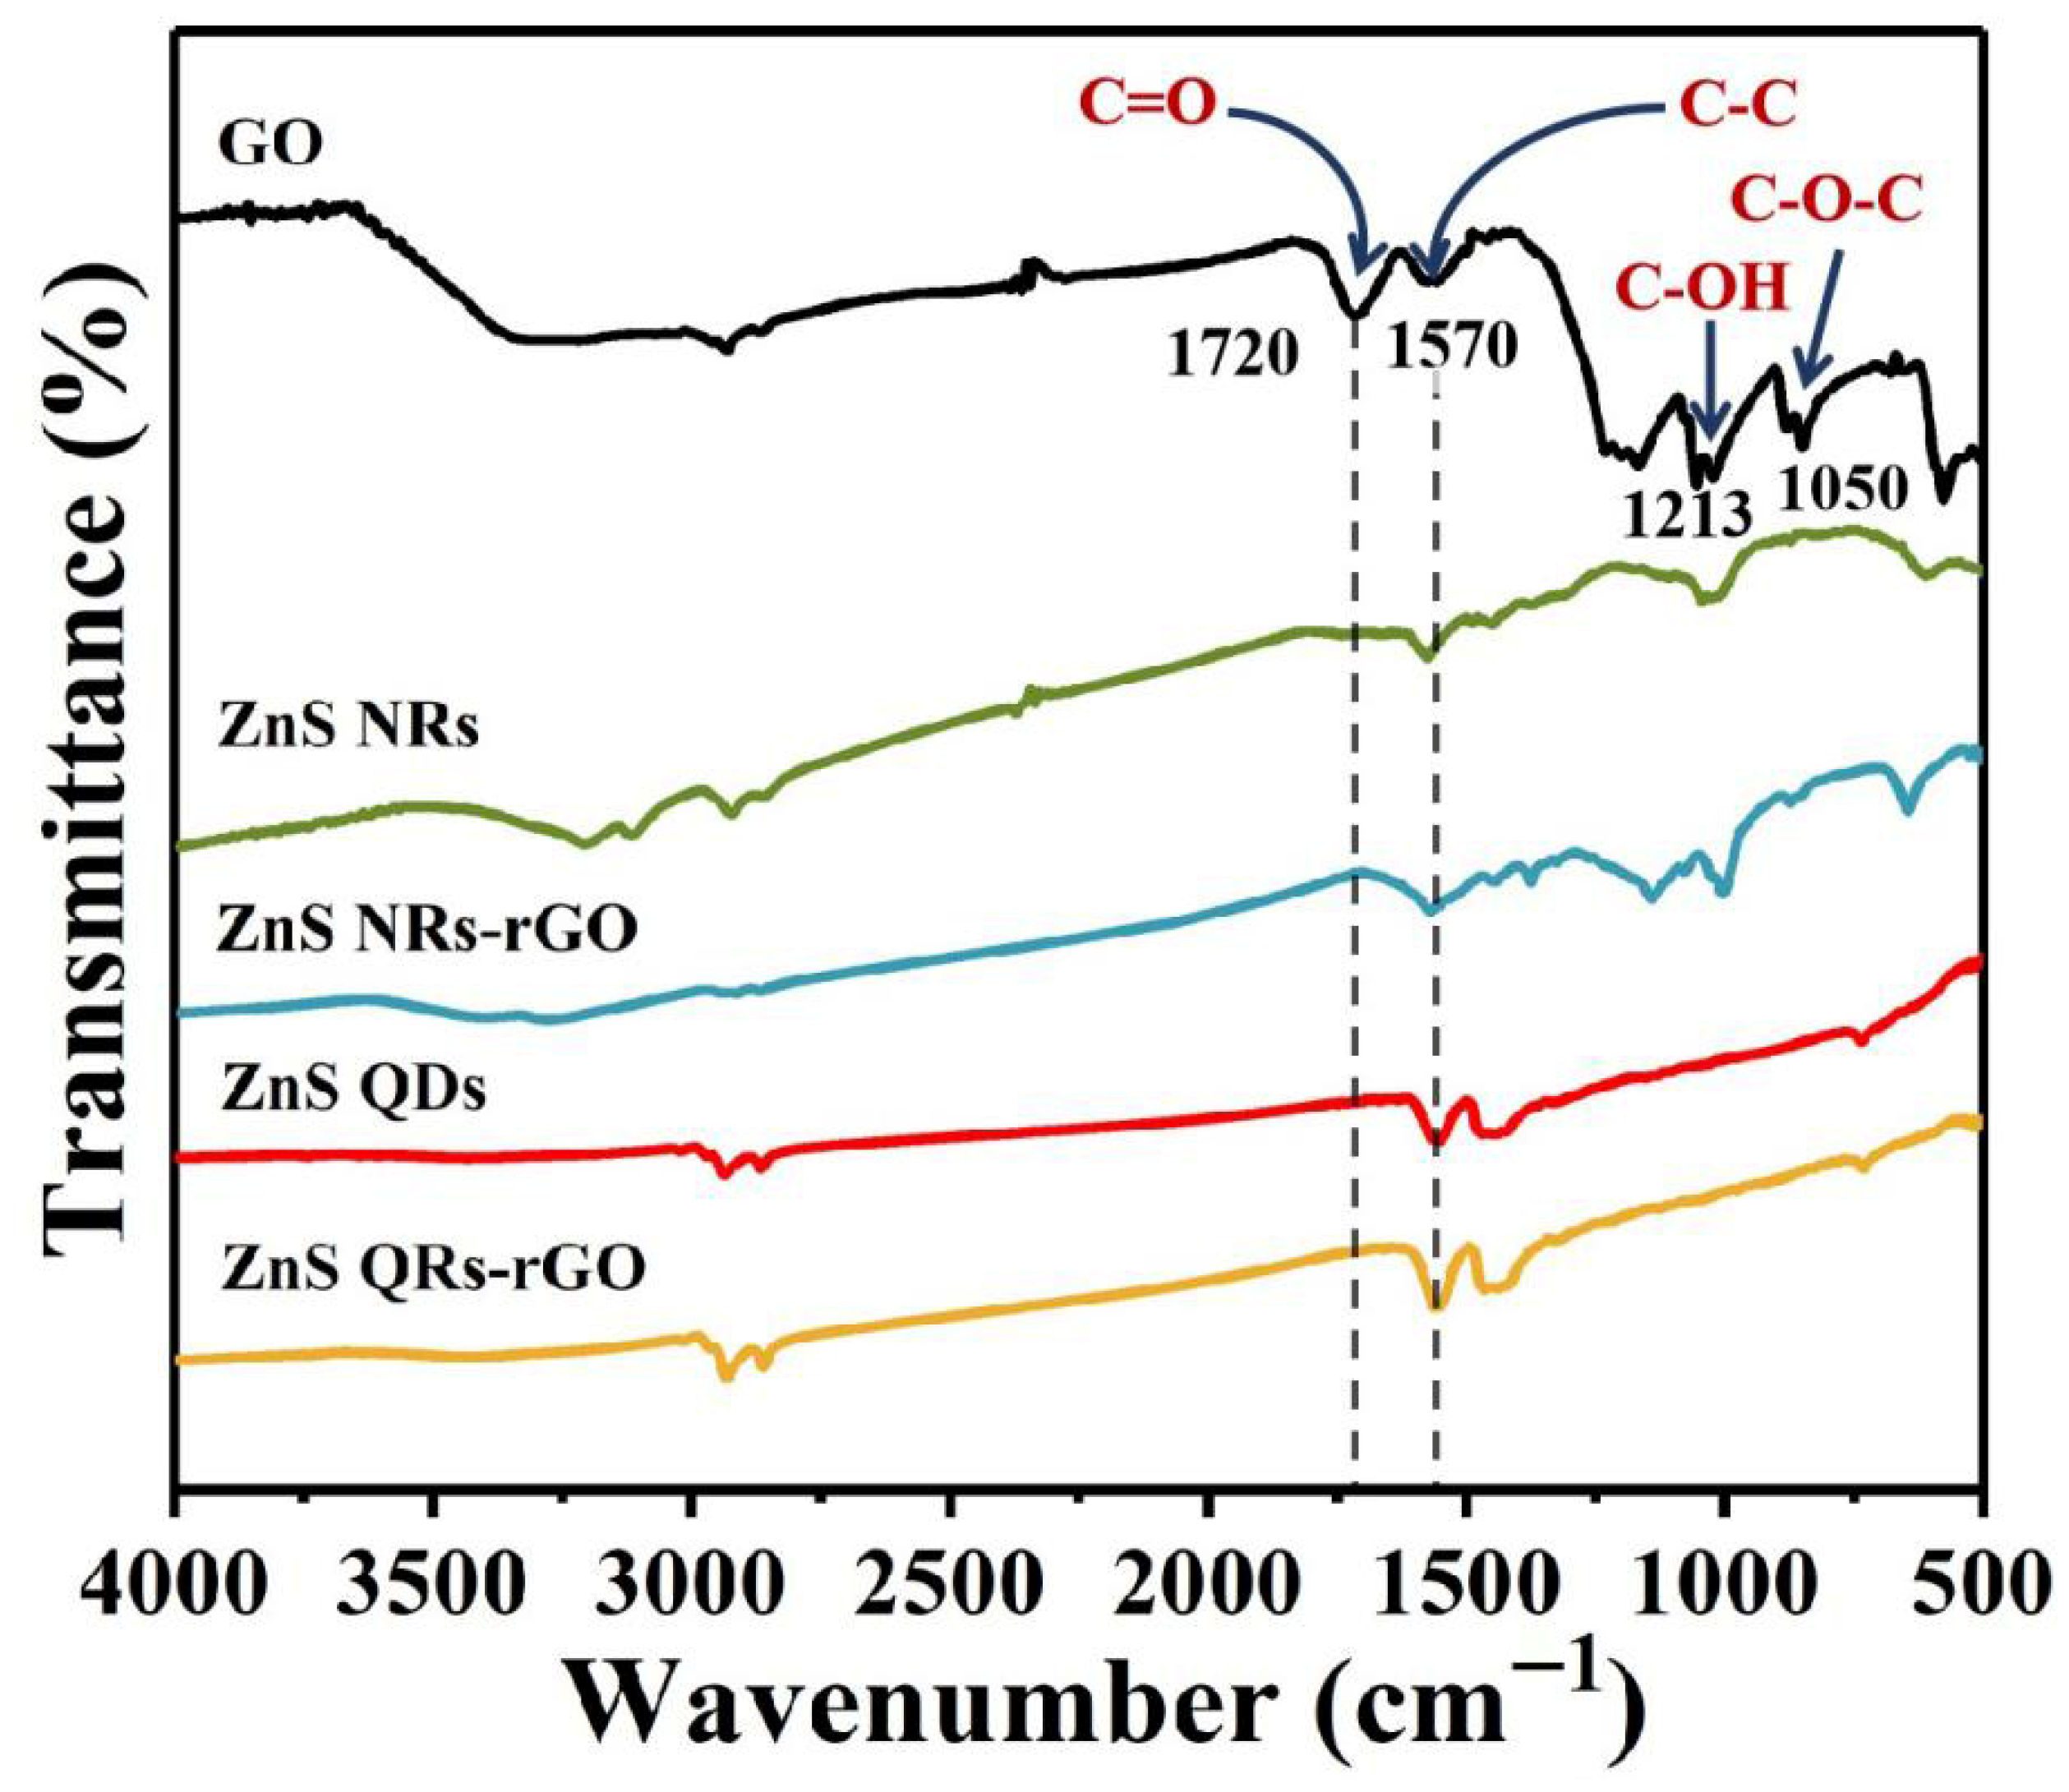
Figure 4 is the FT-IR spectrum of ZnS NRs, ZnS QDs, ZnS NRs-rGO, and ZnS QDs-rGO. Among them, the characteristic peaks at 1720, 1570, 1213, and 1050 cm−1 correspond to the C=O, C-C, C-OH, and C-O-C functional groups of GO respectively [9,21]. Regarding the origin of the C-C vibrational band observed around 1570 cm−1 in the pristine ZnS NRs and ZnS QD samples, this signal is attributed to surface-adsorbed carbonaceous species rather than an intrinsic component of the ZnS crystal lattice. The likely sources include: residual organic compounds from the synthesis precursors (e.g., zinc acetate, thiourea) and atmospheric contamination, as nanomaterials with a high surface energy can readily adsorb carbon-containing molecules such as CO2 or hydrocarbons from the ambient environment. For ZnS NRs, ZnS QDs, ZnS NRs-rGO, and ZnS QDs-rGO nanocomposites, it can be observed from the spectra that the C=O characteristic peak of GO disappears, while the C-C characteristic peak is retained, which is consistent with the XPS results.
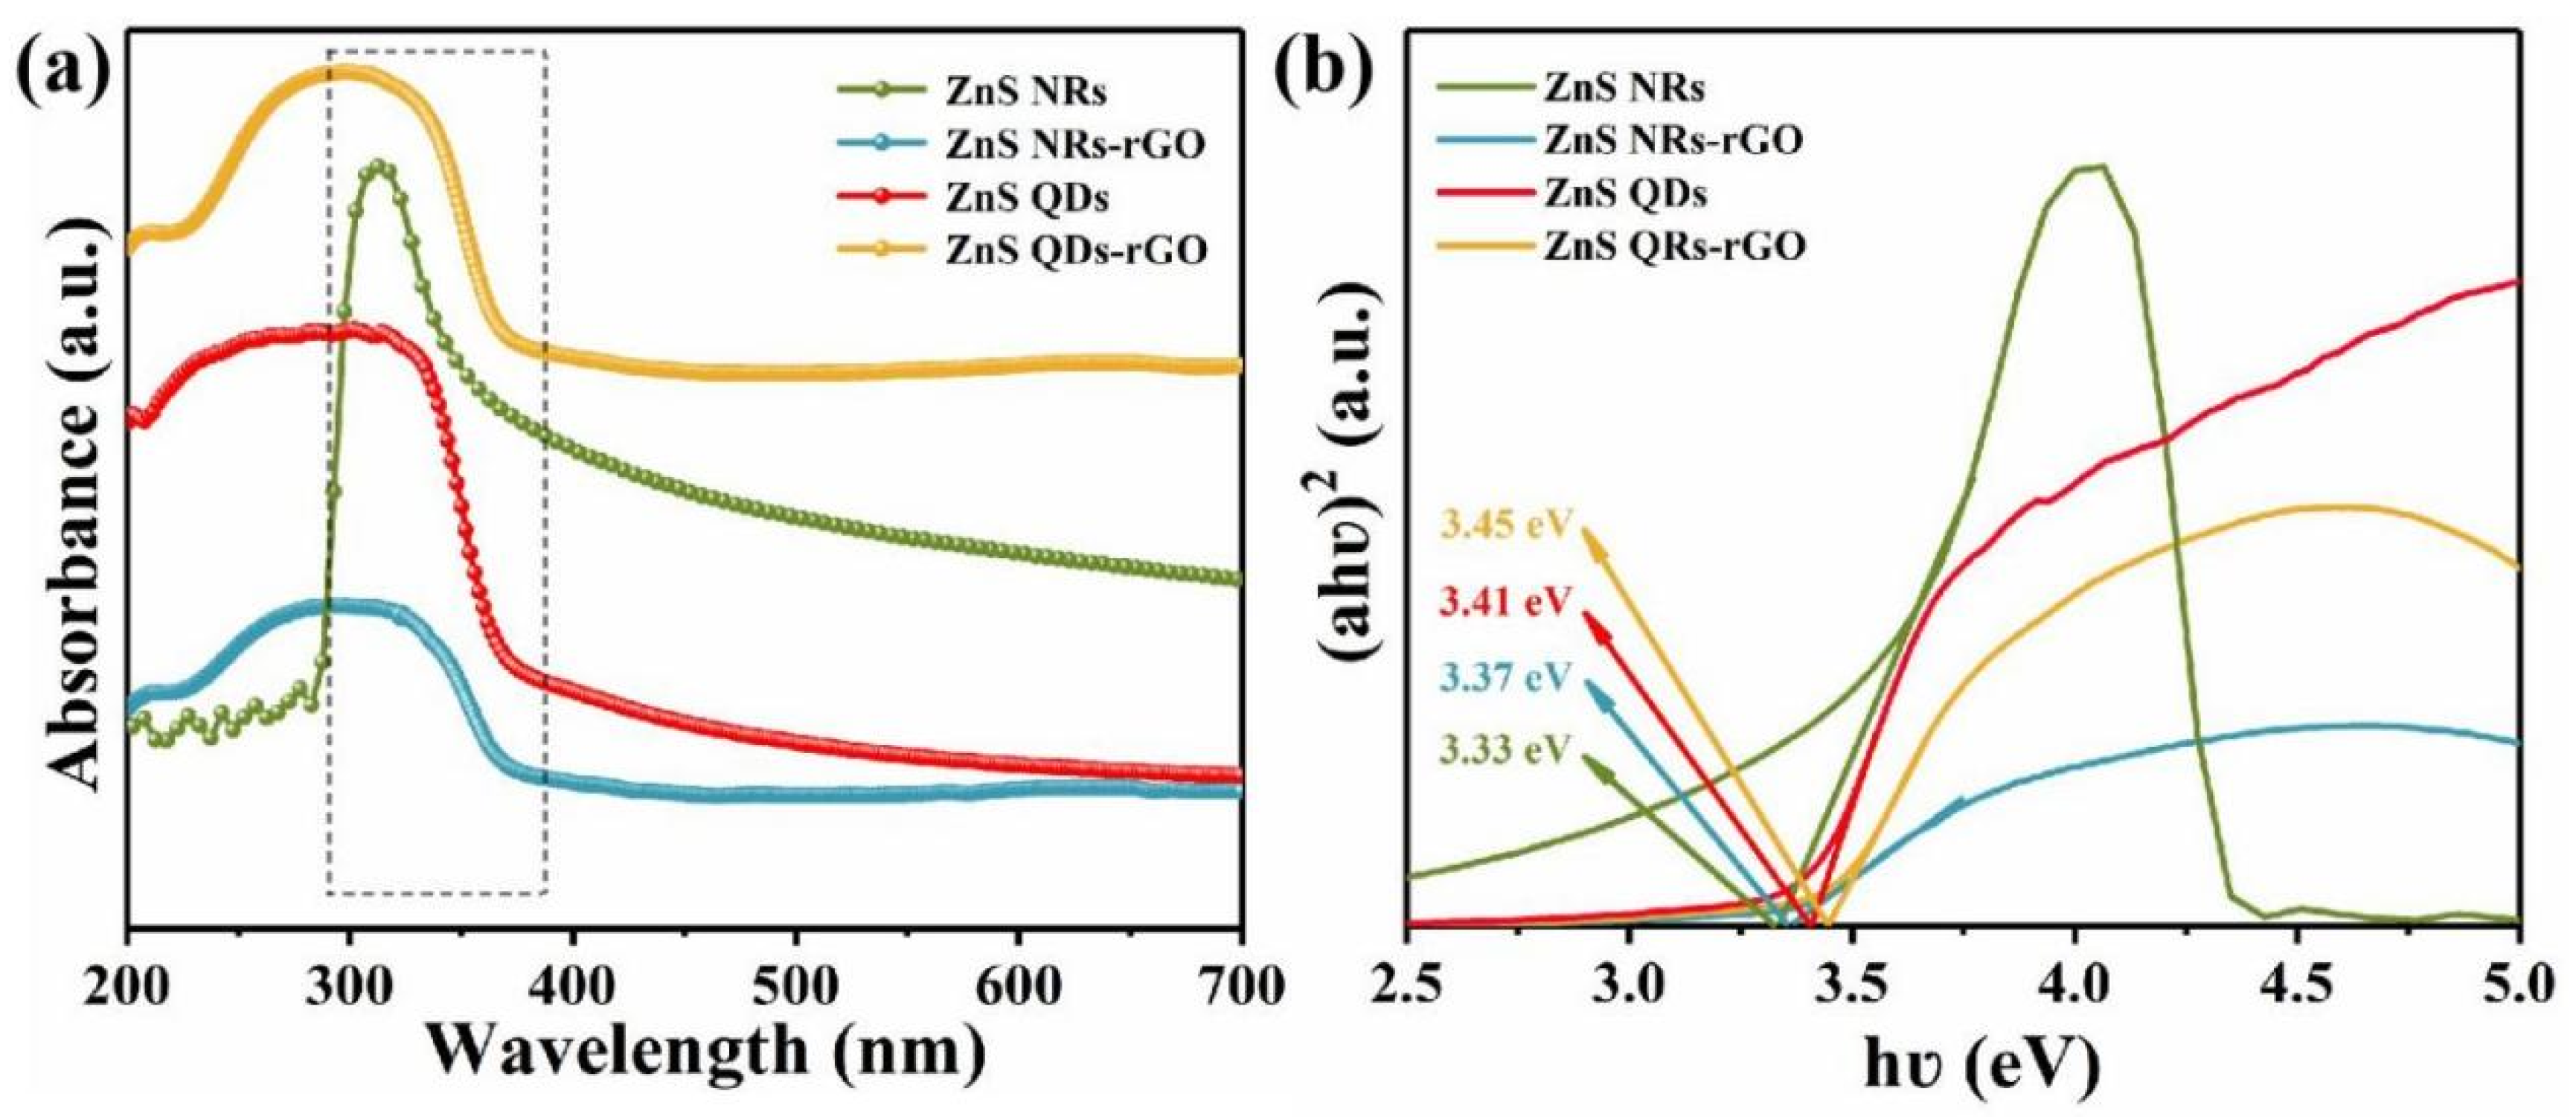
Figure 5a presents the UV-Vis absorption spectra of ZnS NRs, ZnS QDs, ZnS NRs-rGO, and ZnS QDs-rGO. All materials exhibit distinct absorption in the ultraviolet region. The optical band gap (Eg) was estimated from the absorption data using the Tauc plot method, which is standard for direct band gap semiconductors [22]. The absorption coefficient (α) was derived from the absorbance. The Tauc relation is given by:
hv)2 = B (hv − Eg)
where hv is the photon energy, B is a constant, and Eg is the optical band gap. The value of Eg for each sample was obtained by extrapolating the linear portion of the plot of (αhv)2 versus hv (Figure 5b) to the photon energy axis where (αhv)2 = 0. As shown in Figure 5b, the calculated band gap values are as follows: Eg (ZnS NRs) = 3.33 eV, Eg (ZnS NRs-rGO) = 3.37 eV, Eg (ZnS QDs) = 3.41 eV, and Eg (ZnS QDs-rGO) = 3.45 eV.
It is worth noting that after hybridization with rGO, both ZnS nanorods and quantum dots exhibit a slight band gap increase, mainly due to secondary-reaction-induced size variations. The functional groups on rGO anchor ZnS nanoparticles through strong chemical interactions, restricting Ostwald ripening and agglomeration. This leads to smaller and more monodisperse ZnS particles on rGO [23]. For pre-synthesized nanostructures, secondary reactions may also cause minor etching or size refinement. When the crystallite size approaches or falls below the Bohr exciton radius of ZnS (~2.5 nm), quantum confinement discretizes energy levels and widens the band gap. The observed Eg increase in both composites confirms this size reduction, with QD-based composites showing a more pronounced shift due to their greater sensitivity to size changes [24]. In addition, electronic interactions at the ZnS-rGO interface may contribute. The higher work function of rGO forms a Schottky junction, facilitating electron transfer from ZnS to rGO and slightly altering the density of states near the band edges. However, this effect is secondary compared to the dominant size effect [25].
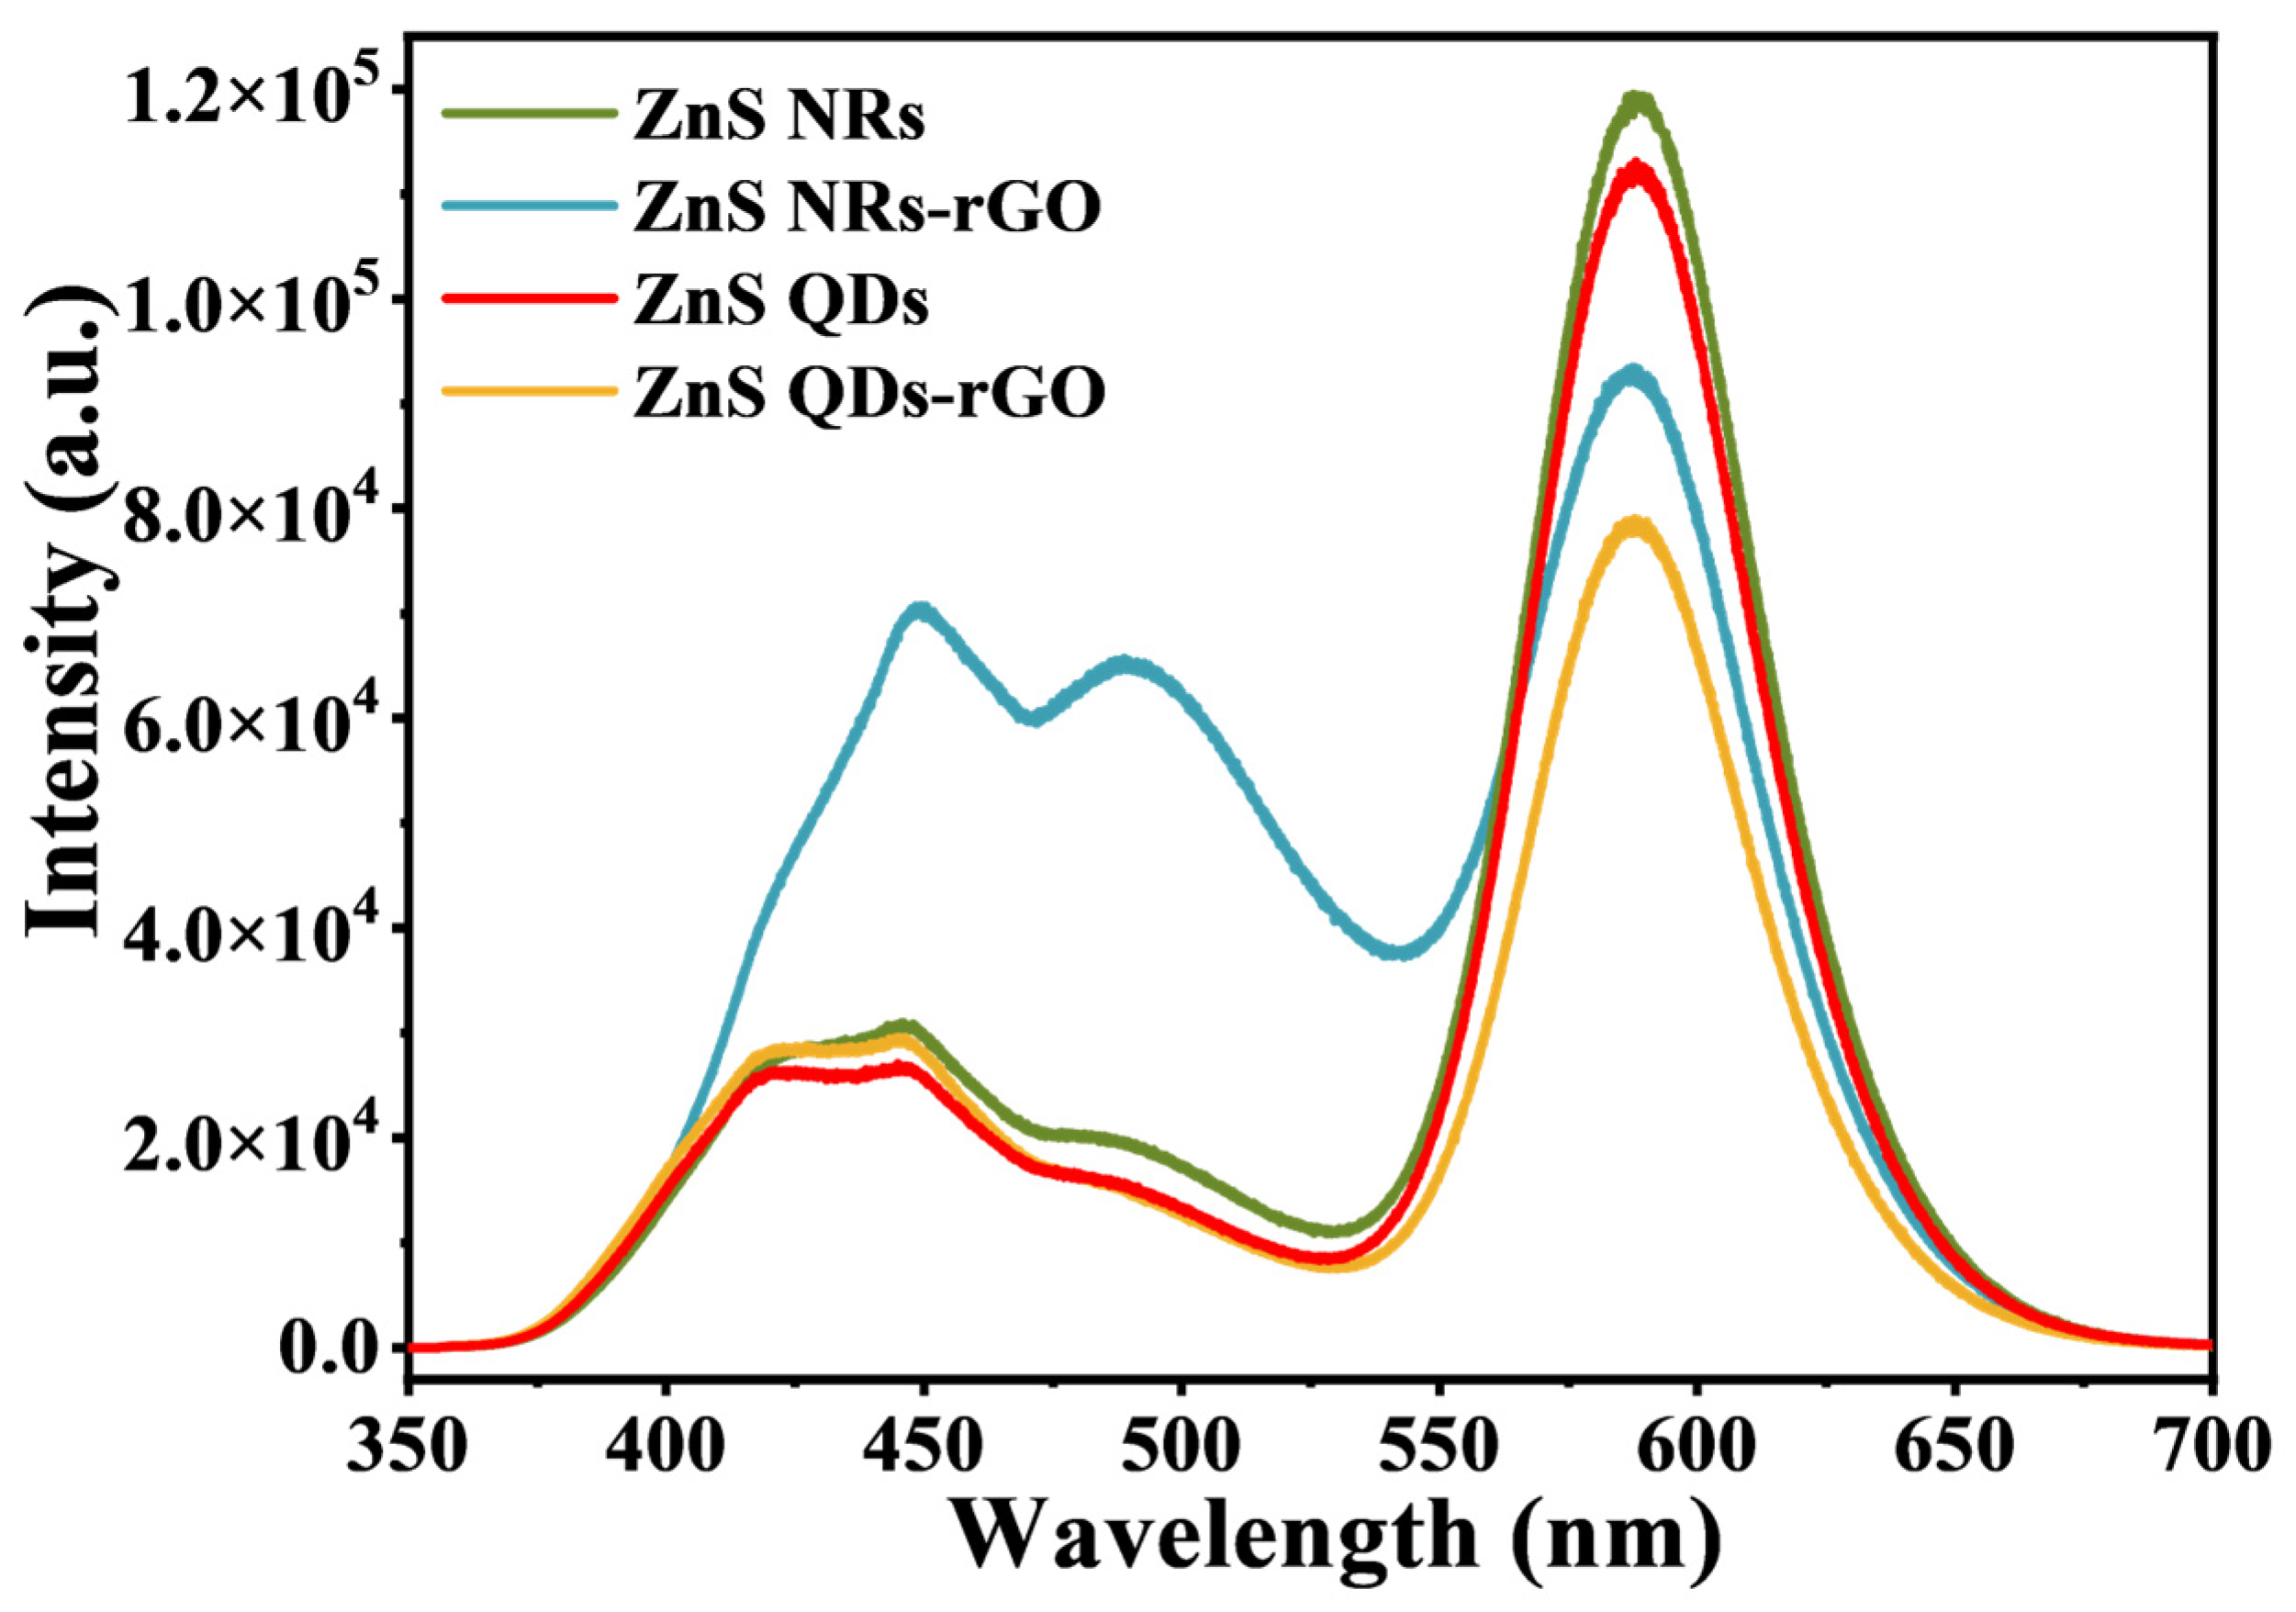
Figure 6 shows the PL spectra of ZnS NRs, ZnS QDs, ZnS NRs-rGO, and ZnS QDs-rGO under an excitation wavelength of 325 nm. The broad emission bands in the visible region can be deconvoluted into components corresponding to specific defects: sulfur vacancies (Vs) contributing to emissions around 420–450 nm (blue region), acting as shallow electron traps; zinc vacancies (VZn) associated with peaks in the 460–500 nm range (blue–green), acting as shallow hole traps; and surface states or interstitial defects responsible for broader features in the green–yellow region (520–580 nm) [26,27]. The PL intensity changes in the order ZnS NRs > ZnS QDs > ZnS NRs-rGO > ZnS QDs-rGO. The significant quenching in the composites indicates that rGO provides an efficient pathway for electron transfer, suppressing recombination at defect sites [28]. While shallow defects (e.g., Vs) can aid charge separation, the high PL intensity in pristine ZnS suggests excessive recombination limits its performance. The ZnS QDs-rGO nanocomposite exhibits the lowest PL intensity, correlating with its superior photocatalytic activity.

3.2. Photocatalytic Degradation Performance

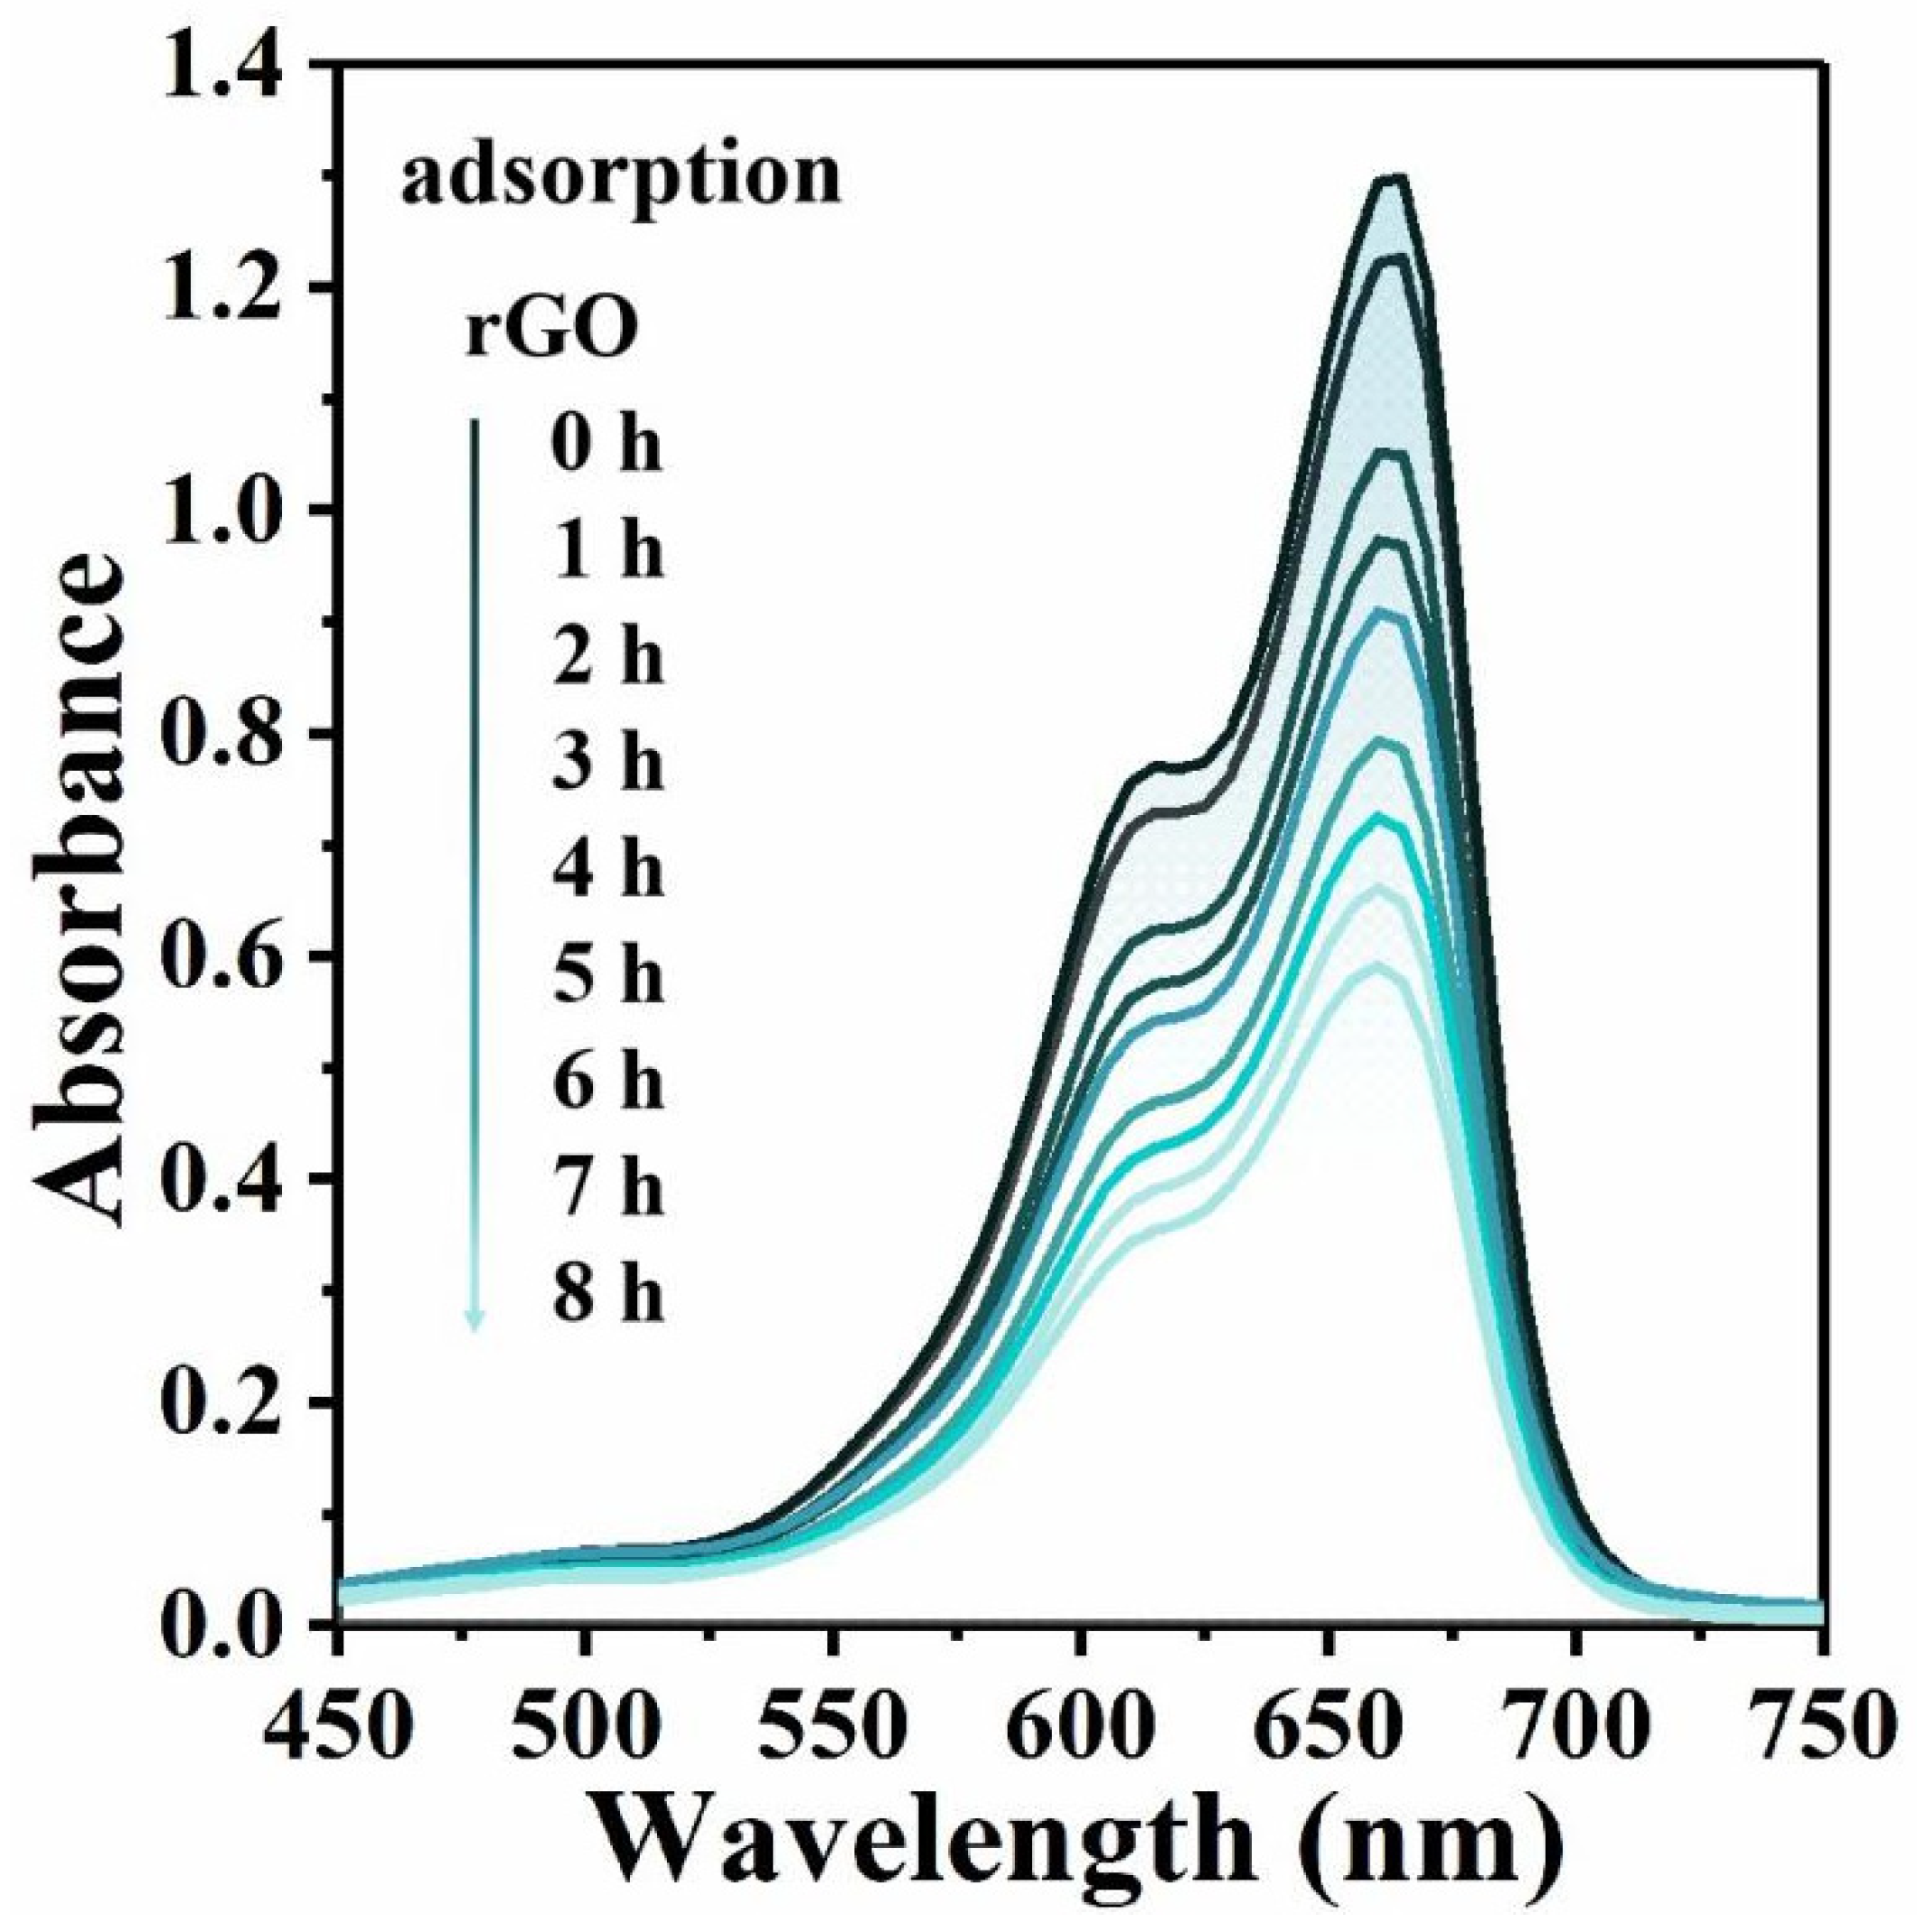
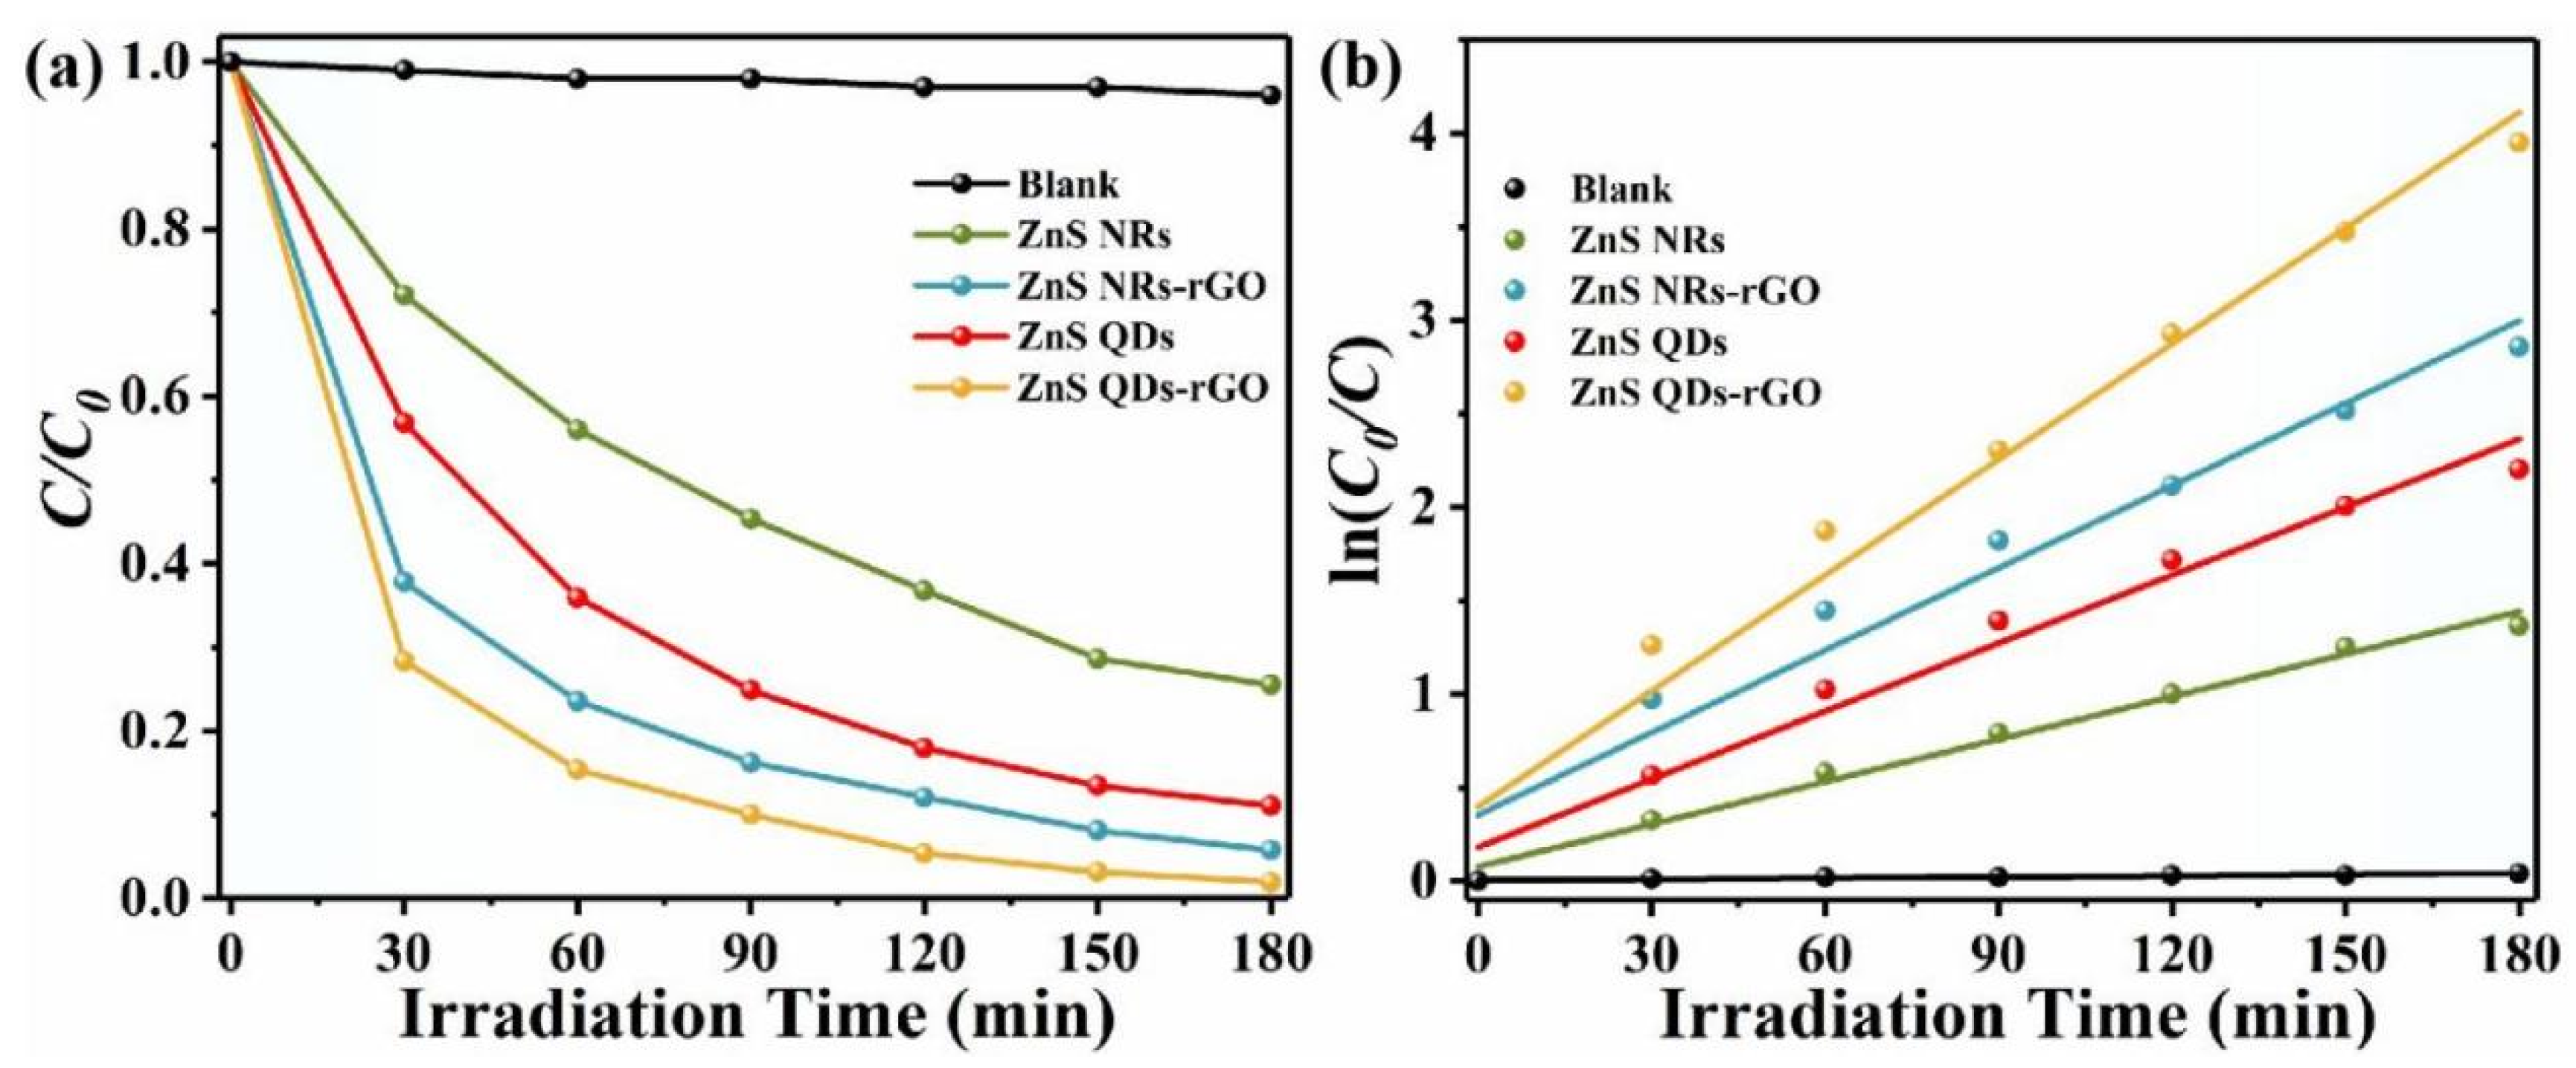
Figure 7 illustrates the adsorption curve of rGO under dark conditions. As shown, residual MB remains unadsorbed even after 8 h of adsorption, indicating the limited adsorption capacity of rGO for MB solutions. In the blank experiment without photocatalysts, photolysis of MB is negligible, as shown in Figure 8a, which also presents the time-dependent degradation efficiency (C/C0) of ZnS NRs, ZnS QDs, ZnS NRs-rGO, and ZnS QDs-rGO. After 180 min of ultraviolet irradiation, their catalytic degradation efficiencies reach 74.49%, 88.95%, 94.26%, and 98.08%, respectively. The fitting results in Figure 8b confirm that the photodegradation process follows first-order kinetics, described by the equation:
ln(C/C0) = kt
where the slope k is the degradation rate constant (min−1) [29]. Under ultraviolet irradiation, the k values are 7.58 × 10⁻¹ min−1 (ZnS NRs), 1.47 × 10⁻² min−1 (ZnS QDs), 1.21 × 10⁻² min−1 (ZnS NRs-rGO), and 2.063 × 10⁻² min−1 (ZnS QDs-rGO). These results demonstrate that the catalytic activities of ZnS NRs-rGO and ZnS QDs-rGO are significantly higher than those of pristine ZnS NRs and ZnS QDs. This enhancement is attributed to multiple roles of rGO: Firstly, it effectively inhibits ZnS agglomeration, promoting uniform dispersion of ZnS NRs/QDs on its surface to increase active sites for catalytic reactions [30]. Secondly, it also facilitates efficient electron transport, reducing the self-redox recombination of photogenerated electron–hole pairs in ZnS crystals [31]. Additionally, ZnS QDs and ZnS QDs-rGO exhibit superior photocatalytic performance compared to their NR-based counterparts. This is likely due to the significantly smaller size of the QDs (average diameter ~9.06 nm), which confers a larger specific surface area compared to the NRs (average length ~109 nm).

3.3. Photocatalytic Stability Performance

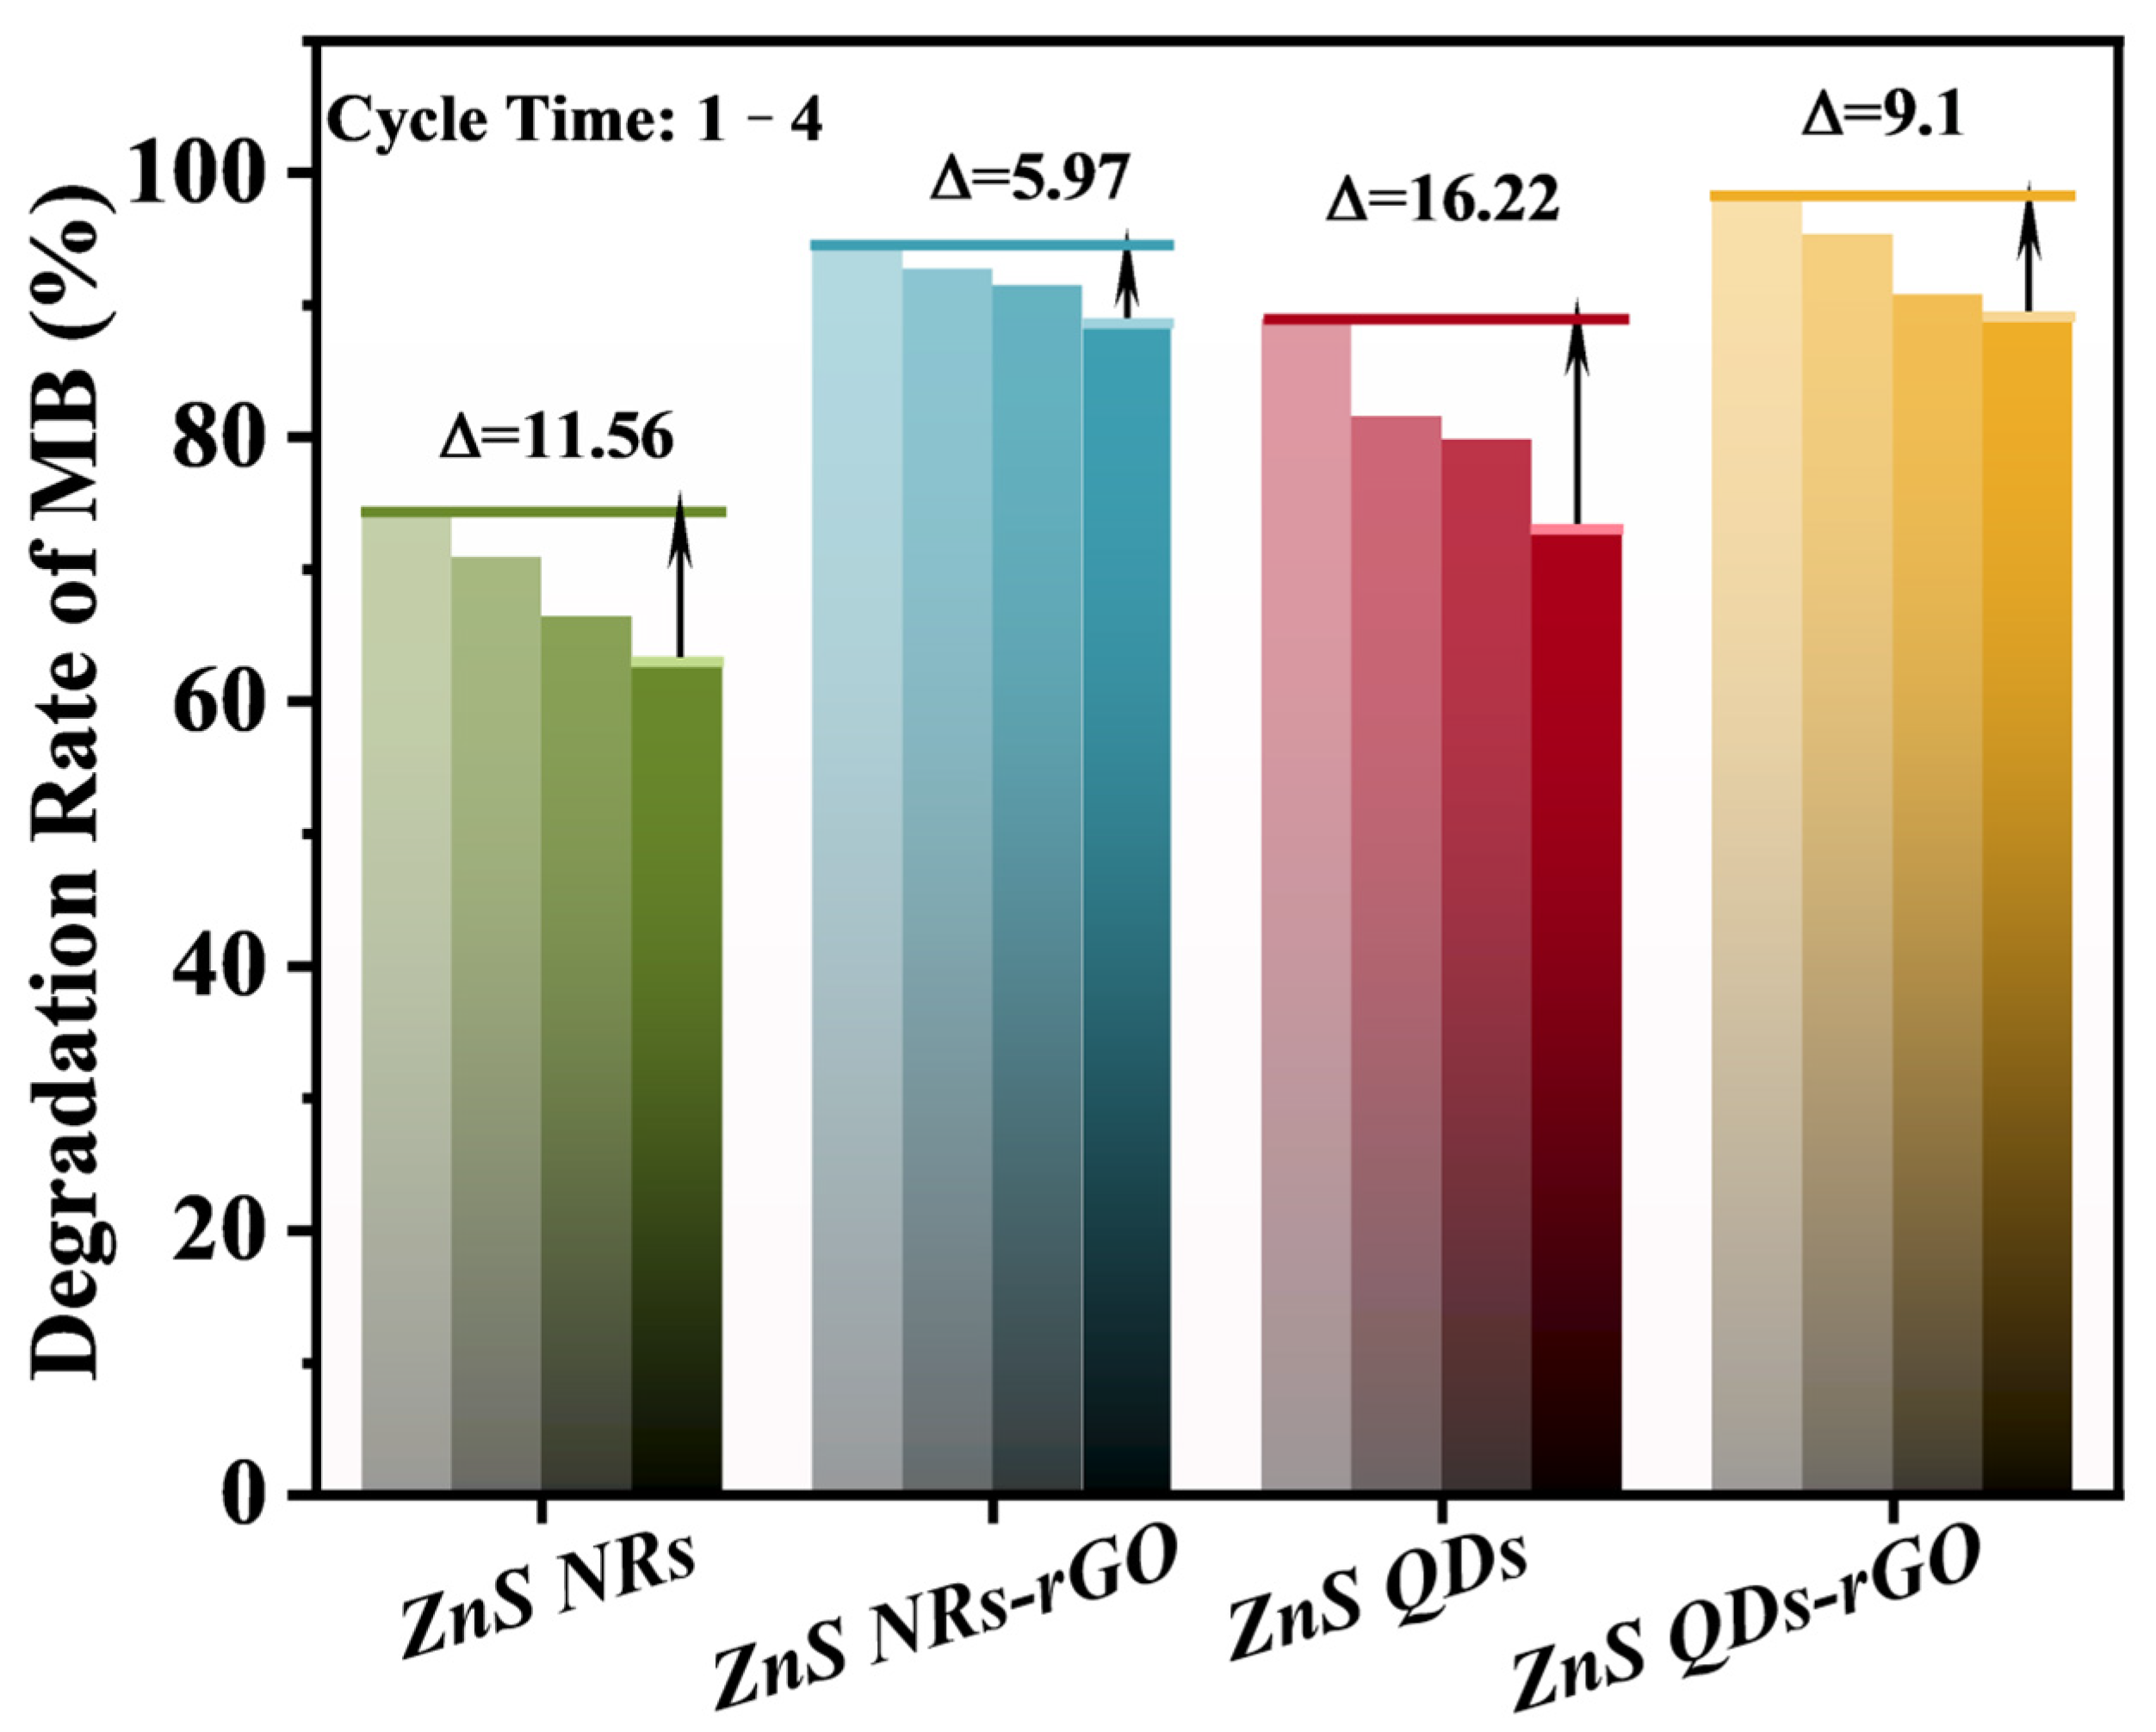
Figure 9 presents the cyclic stability test results of ZnS NRs, ZnS QDs, ZnS NRs-rGO, and ZnS QDs-rGO in photocatalytic reactions. As shown, the photocatalytic activity of all samples decreases to a certain extent with increasing cycle numbers; however, the stability of ZnS NRs-rGO and ZnS QDs-rGO is significantly superior to that of pristine ZnS NRs and ZnS QDs. This further confirms that rGO can inhibit the photocorrosion of ZnS nanocrystals. Notably, ZnS NRs and ZnS NRs-rGO exhibit higher photocatalytic stability than ZnS QDs and ZnS QDs-rGO, which is closely associated with the better crystallinity of ZnS NRs compared to ZnS QDs, as good crystallinity generally contributes to enhanced material stability.
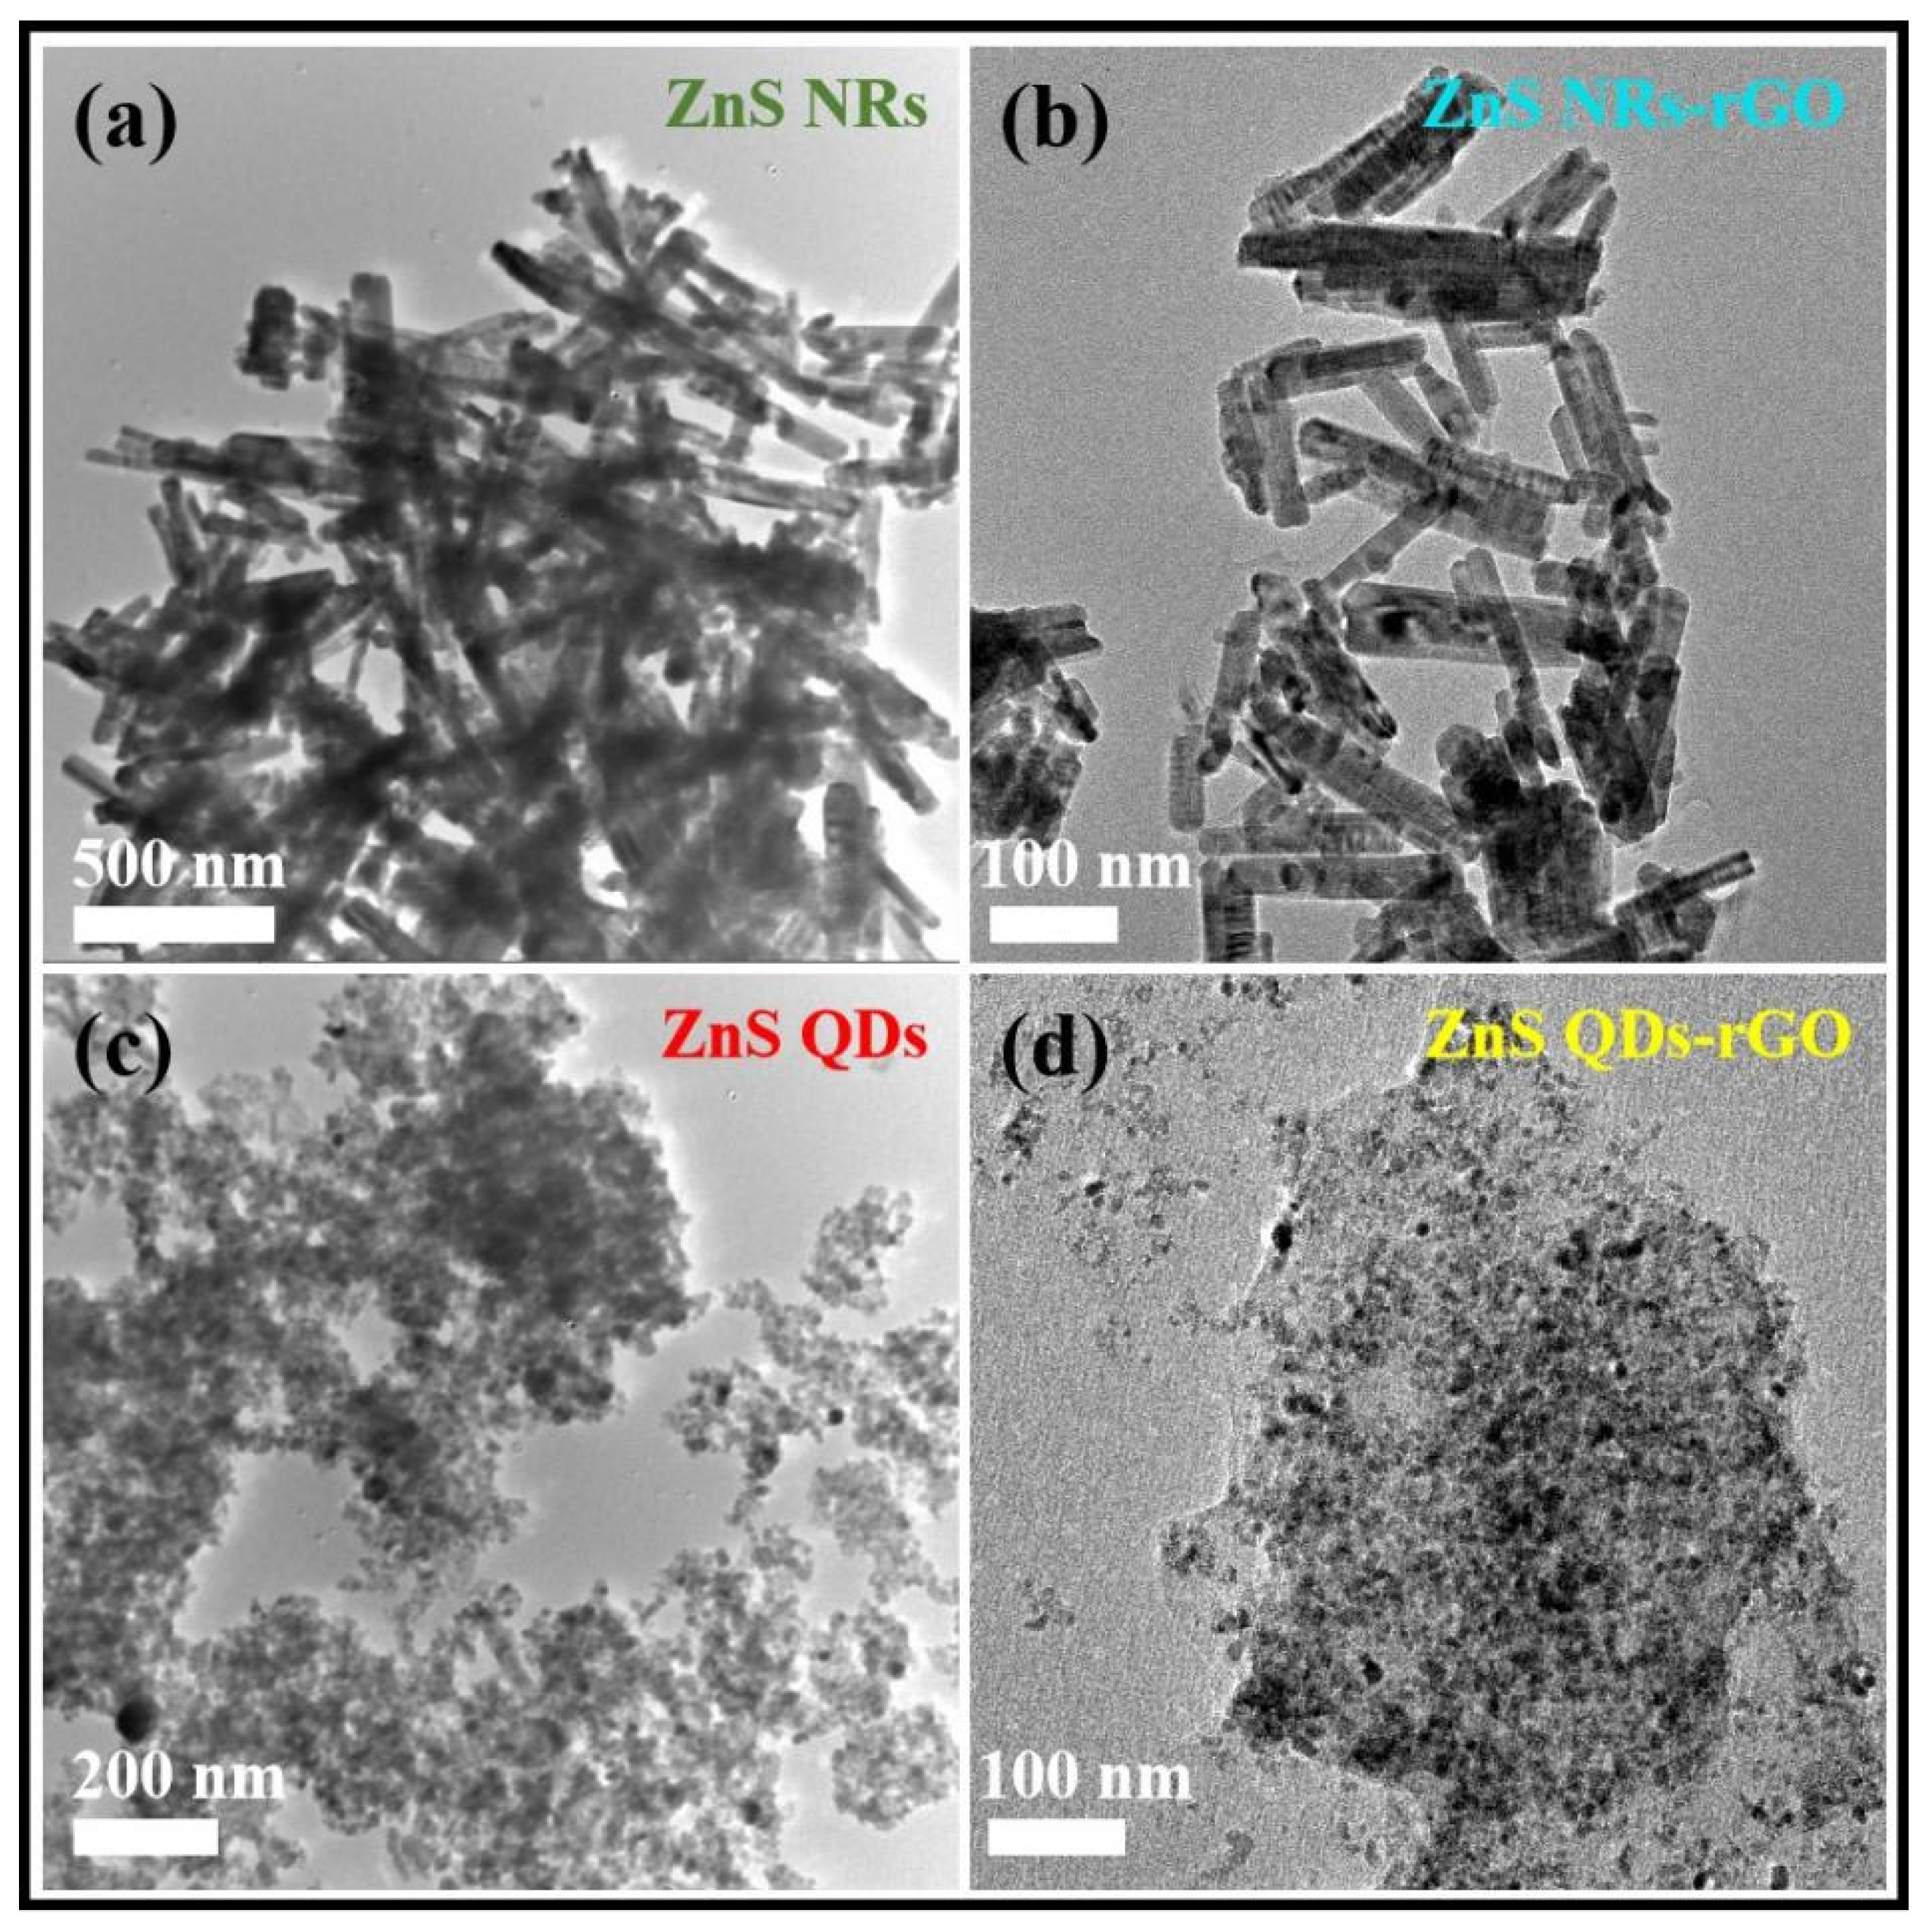
To verify the stability, TEM characterization is conducted on the samples after cyclic testing, with results presented in Figure 10. After 720 min of light irradiation, ZnS NRs retained preserved morphological integrity but exhibited significant agglomeration. In contrast, ZnS NRs-rGO showed negligible changes in both morphology and dispersibility. ZnS QDs displayed relatively severe photocorrosion, while ZnS QDs-rGO also suffered from a certain degree of agglomeration and photocorrosion, while the ZnS QDs-rGO composite also experienced a certain degree of agglomeration and photocorrosion, though to a lesser extent than the bare QDs. These morphological changes provide direct evidence that the observed decrease in photocatalytic activity over repeated cycles is primarily attributed to agglomeration and photocorrosion. Additionally, Zn2+ leaching from the ZnS lattice under prolonged UV irradiation may also contribute to the gradual loss of active sites, although the stabilizing effect of the rGO matrix likely mitigates this effect to some extent compared to pristine ZnS. Based on the above stability analysis together with the photocatalytic performance and structural properties investigated in this work, the comprehensive results of the photocatalytic degradation study and other key material characterizations are summarized in Table S2.

3.4. Mechanism of Photocatalytic Degradation of MB

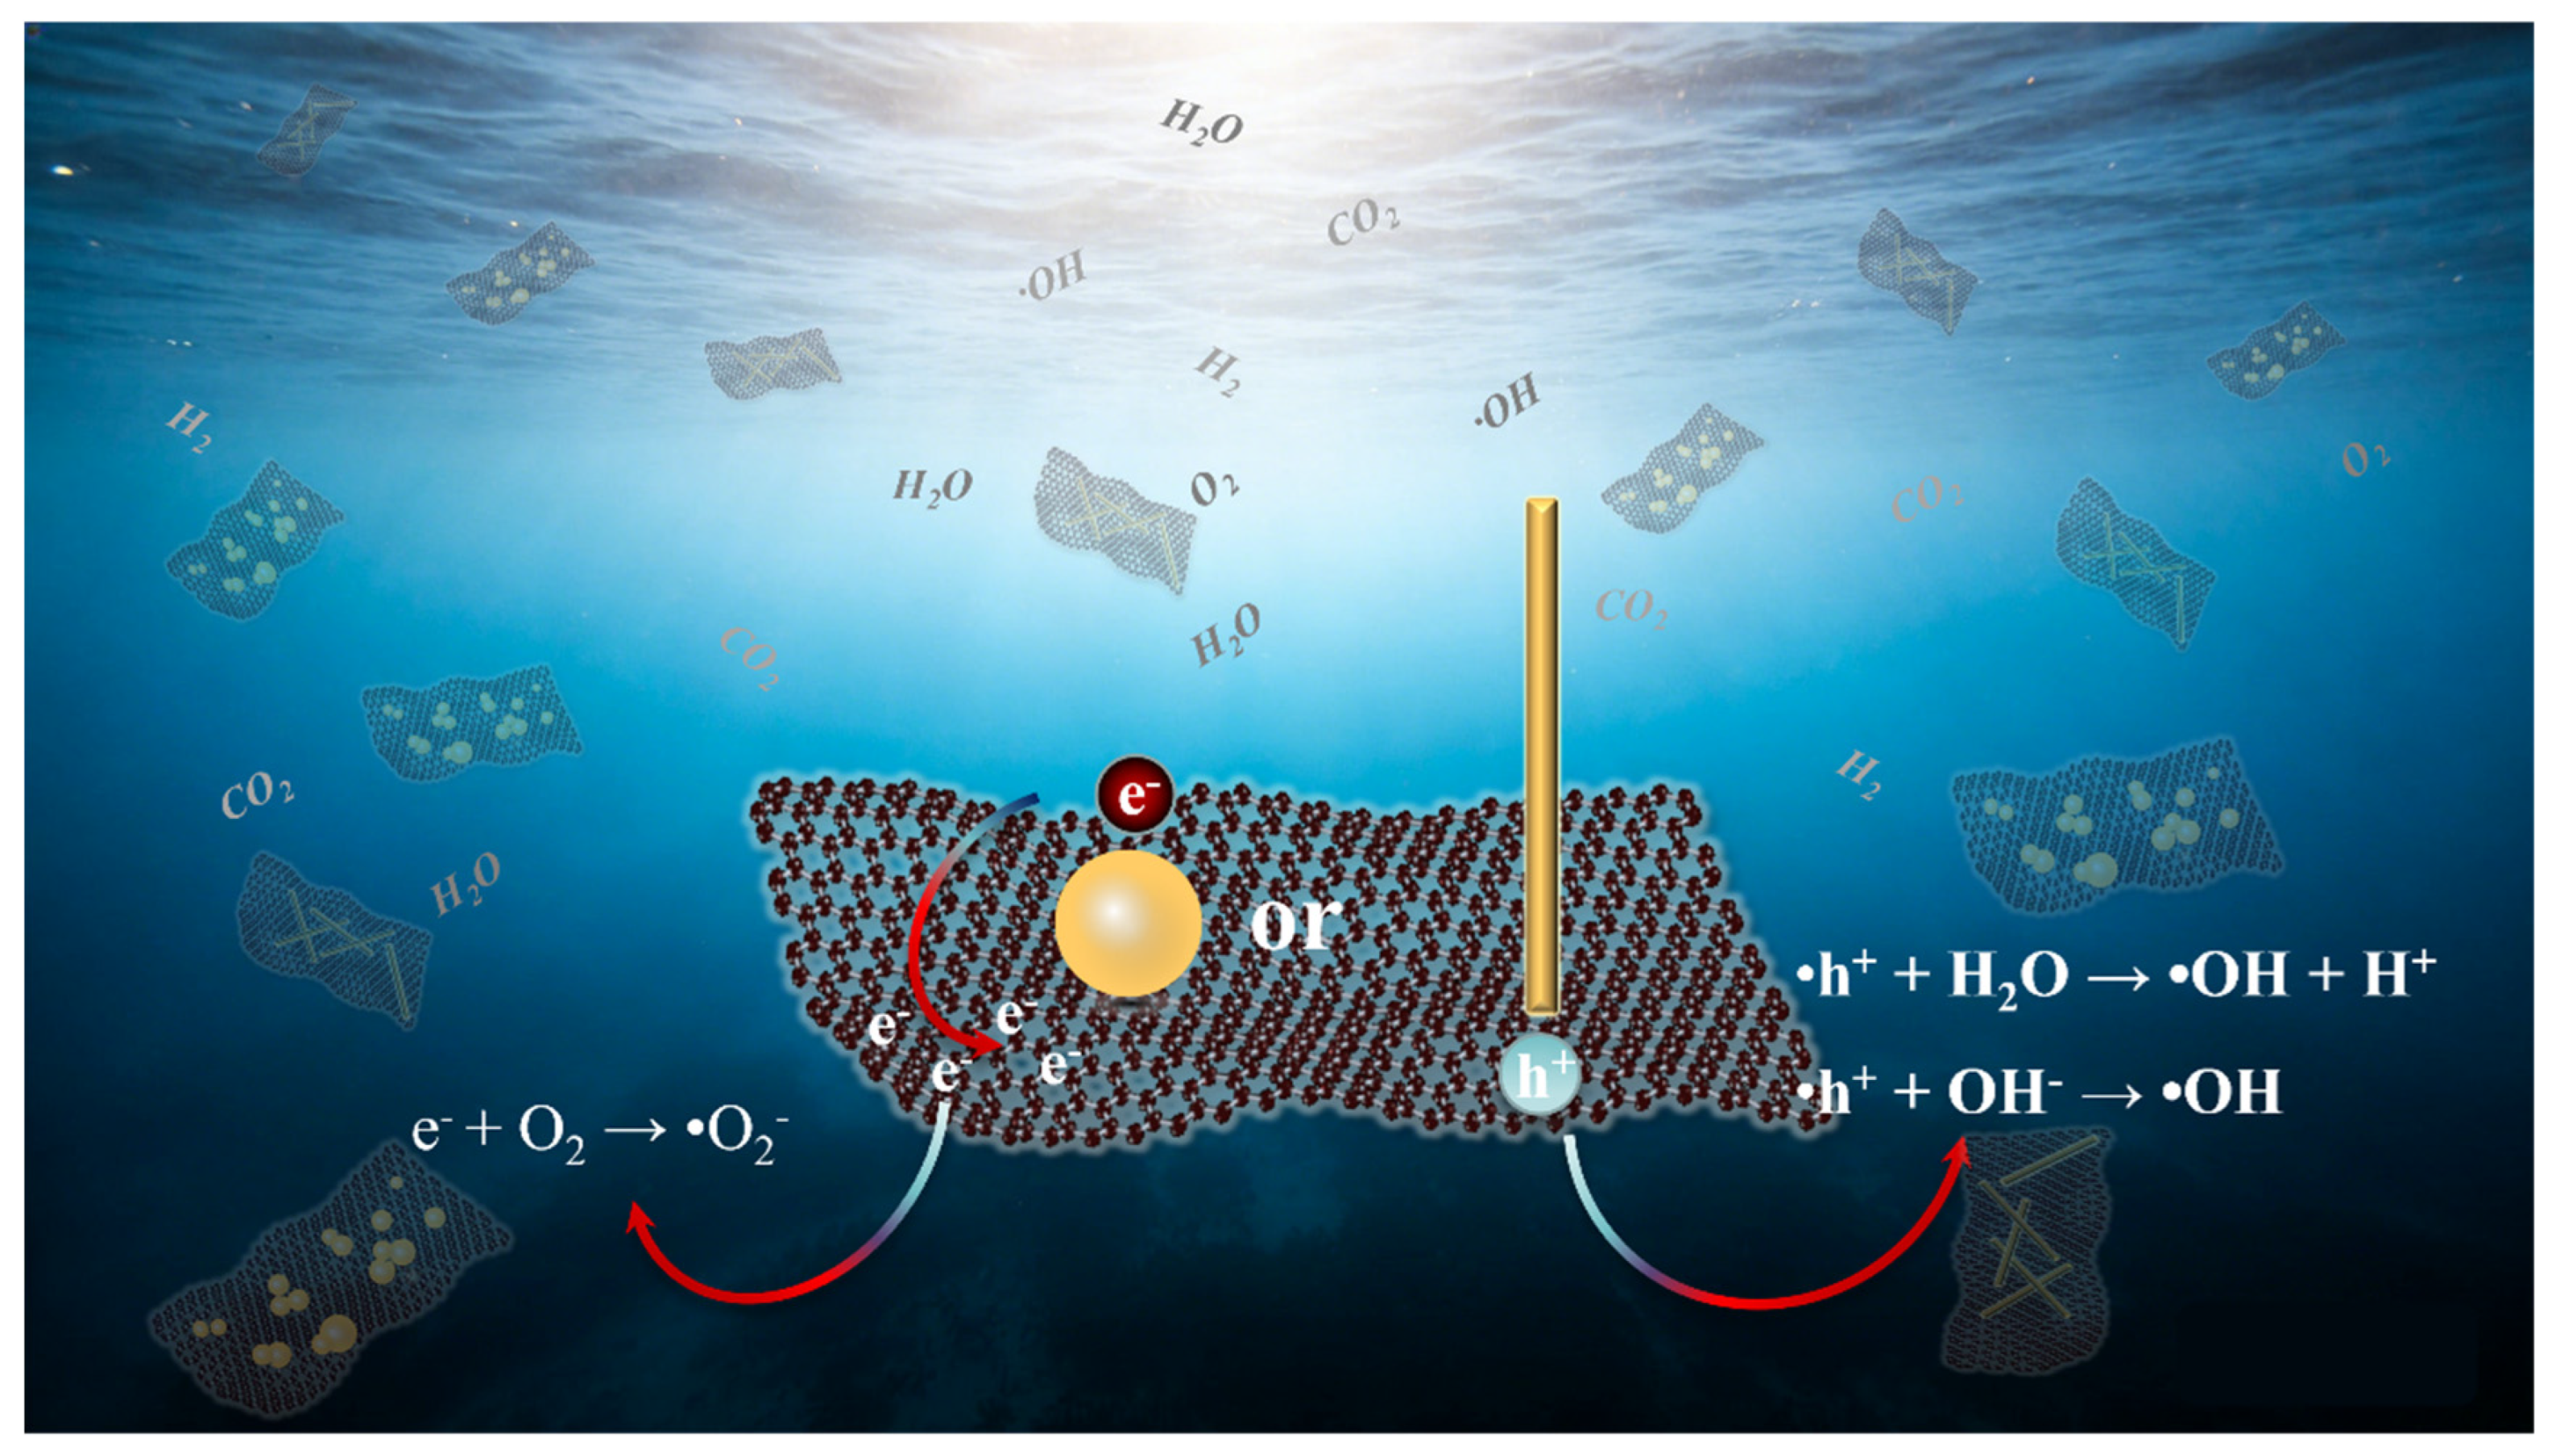
The enhanced photocatalytic degradation of MB by ZnS-rGO nanocomposites is driven by efficient charge separation and the subsequent generation of reactive oxygen species (ROS). Upon UV excitation, electrons in ZnS are excited to the conduction band and rapidly migrate to rGO, an excellent electron acceptance that effectively suppresses charge recombination. The accumulated electrons on rGO then reduce O2 to form superoxide radicals (•O2), while the holes remaining in ZnS oxidize H2O or OH to generate hydroxyl radicals (•OH). These ROS subsequently attack the chromophoric structure of MB, mineralizing it into CO2, H2O, and other byproducts. The superior performance of ZnS QDs-rGO stems from the large surface area of the QDs, the dispersion and active sites provided by rGO, and most critically the efficient electron transfer that minimizes recombination and maximizes ROS production, as schematically illustrated in Figure 11.
To further evaluate the performance of our ZnS-rGO nanocomposites, a comparative analysis with recently published studies on ZnS-based photocatalysts for MB degradation under UV irradiation is presented in Table S1 (Supplementary Materials). The comparison is based on key parameters including the catalyst dosage, initial MB concentration, light source, degradation efficiency, and reaction rate constant (k). As shown in Table S1, our ZnS QDs-rGO nanocomposite exhibits superior photocatalytic performance even under more challenging conditions, specifically a lower catalyst dosage and a higher initial MB concentration [32,33,34]. In contrast to a ZnS/g-C3N4 catalyst, which required a 40 mg dosage to achieve 92.5% degradation [32], our material achieved 98.08% degradation using only 10 mg. The resulting degradation efficiency and high-rate constant (2.063 × 10⁻² min−1) are highly competitive, even when compared to doped ZnS QDs [34]. This excellent activity can be attributed to the synergistic effects discussed above, particularly the efficient charge separation facilitated by rGO and the quantum confinement effect within the well-dispersed QDs.

3.5. Mechanism of Photocatalytic Degradation

The enhanced photocatalytic degradation of MB by ZnS-rGO nanocomposites stems from the synergistic effects of efficient charge separation and reactive oxygen species (ROS) generation, as depicted in Figure 11. Under UV light irradiation, ZnS absorbs photons with an energy greater than its band gap (Eg ≈ 3.3–3.45 eV). This excites electrons (e) from the valence band (VB) to the conduction band (CB), leaving behind holes (h+) in the VB. rGO serves as a critical electron acceptor and transporter due to its high conductivity. Driven by favorable energy level alignment, photogenerated electrons in the ZnS CB rapidly migrate to rGO sheets. This efficient transfer effectively suppresses electron–hole pair recombination. And then, the separated charge carriers further react with adsorbed water and oxygen to generate reactive radicals. On the rGO surface (electron sink), transferred electrons reduce O2 to superoxide anion radicals (•O2) (e + O2 → •O2). On the ZnS surface (hole reservoir), photogenerated holes oxidize H2O or OH to hydroxyl radicals (•OH) (h+ + H2O → •OH + H+; h+ + OH → •OH). These ROS (•O2 and •OH) are strong oxidants. They attack the chromophore of MB, disrupt its conjugated system, and ultimately mineralize the dye into harmless small molecules (e.g., CO2, H2O and H2).

4. Conclusions

In this study, ZnS NRs and ZnS QDs were synthesized via distinct methods, and their corresponding rGO nanocomposites were subsequently fabricated through a hydrothermal approach. Systematic investigations of photocatalytic activity and stability demonstrated that both ZnS NRs-rGO and ZnS QDs-rGO exhibited significantly improved performance relative to their pristine ZnS counterparts. This enhancement was attributed to the multifunctional roles of rGO, which effectively improved ZnS particle dispersion, facilitated electron transfer, suppressed photogenerated charge recombination and alleviated photocorrosion. Unlike most previous studies focusing on a single ZnS morphology, our parallel comparison revealed a distinct morphology-dependent performance trade-off: ZnS QDs-rGO achieved the highest photocatalytic activity by virtue of the quantum confinement effect, while ZnS NRs-rGO displayed superior long-term stability due to its well-crystallized hexagonal wurtzite structure. This performance contrast provides a valuable design principle for tailoring ZnS-based photocatalysts to specific application requirements. In summary, this work realizes a synergistic enhancement of ZnS’s photocatalytic activity and stability via rGO modification, and offers critical insights into morphology-dependent performance optimization for semiconductor photocatalyst research.

Supplementary Materials

The following supporting information can be downloaded at: https://www.mdpi.com/article/10.3390/pr14050848/s1, Text S1. Chemicals and Reagents, Text S2. Characterization of products, Text S3. Preparation of ZnS NRs, Text S4 Preparation of ZnS QDs, Text S5. Preparation of Graphene Oxide (GO); Figure S1. Preparation process of ZnS NRs, Figure S2. Preparation process of ZnS QDs, Figure S3. Preparation process of GO, Figure S4. Preparation process of ZnS NRs-rGO nanocomposite, Figure S5. Preparation process of ZnS QDs-rGO nanocomposite; Table S1. Comparison of photocatalytic degradation of MB using various ZnS-based catalysts. Table S2. Summary of key photocatalytic degradation results and material properties.

Author Contributions

S.L.: Investigation and formal analysis; N.W.: Data curation; Q.L.: Investigation, writing—original draft; Y.L.: Resources, C.L.: Writing—review, X.L.: Writing—review and editing. All authors have read and agreed to the published version of the manuscript.

Funding

This research was funded by Science Research Project of the Education Department of Jilin Province grant number [JJKH20261806KJ] And the APC was funded by [JJKH20261806KJ].

Data Availability Statement

The original contributions presented in the study are included in the article. Further inquiries can be directed to the corresponding authors.

Conflicts of Interest

The authors declare that they have no known competing financial interests or personal relationships that could have appeared to influence the work reported in this paper.

References

  1. Gul, M.M.; Ahmad, K.S. Review elucidating graphene derivatives (GO/rGO) supported metal sulfides based hybrid nanocomposites for efficient photocatalytic dye degradation. Rev. Inorg. Chem. 2022, 42, 337–354. [Google Scholar] [CrossRef] [Scilit]
  2. Xu, T.; Zhang, L.; Cheng, H.; Zhu, Y. Significantly enhanced photocatalytic performance of ZnO via graphene hybridization and the mechanism study. Appl. Catal. B 2011, 101, 382. [Google Scholar] [CrossRef] [Scilit]
  3. Fujishima, A.; Honda, K. Electrochemical photolysis of water at a semiconductor electrode. Nature 1972, 238, 37–38. [Google Scholar] [CrossRef] [Scilit]
  4. Chen, X.; Mao, S.S. Titanium dioxide nanomaterials: Synthesis, properties, modifications, and applications. Chem. Rev. 2007, 107, 2891–2959. [Google Scholar] [CrossRef] [Scilit] [PubMed]
  5. Ham, S.; Kim, Y.; Park, M.J.; Hong, B.H.; Jang, D.J. Graphene quantum dots-decorated ZnS nanobelts with highly efficient photocatalytic performances. RSC Adv. 2016, 6, 24115. [Google Scholar] [CrossRef] [Scilit]
  6. Zhang, Y.; Zhang, N.; Tang, Z.R.; Xu, Y.J. Graphene transforms wide band gap ZnS to a visible light photocatalyst: The new role of graphene as a macromolecular photosensitizer. ACS Nano 2012, 6, 9777. [Google Scholar] [CrossRef] [Scilit] [PubMed]
  7. Wang, P.; Jiang, T.; Zhu, C.; Zhai, Y.; Wang, D.; Dong, S. One-step solvothermal synthesis of graphene-CdS and graphene-ZnS quantum dot nanocomposites and their interesting photovoltaic propertie. Nano Res. 2010, 3, 794. [Google Scholar] [CrossRef] [Scilit]
  8. Tang, Y.; Liu, X.; Ma, C.; Zhou, M.; Huo, P.; Yu, L.; Pan, J.; Shi, W.; Yan, Y. Enhanced photocatalytic degradation of tetracycline antibiotics by reduced graphene oxide-CdS/ZnS heterostructure photocatalysts. New J. Chem. 2015, 39, 5150. [Google Scholar] [CrossRef] [Scilit]
  9. Fang, X.S.; Bando, Y. Ultrafine ZnS Nanobelts as Field Emitters. Adv. Mater. 2007, 19, 2593–2597. [Google Scholar] [CrossRef] [Scilit]
  10. Shen, L.M.; Bao, N.; Yanagisawa, K. Hydrothermal growth of wurtzite ZnS nanorods and their photocatalytic properties. Cryst. Growth Des. 2007, 7, 490–496. [Google Scholar]
  11. Alivisatos, A.P. Semiconductor clusters, nanocrystals, and quantum dots. Science 1996, 271, 933–937. [Google Scholar] [CrossRef] [Scilit]
  12. Gao, X.; Li, L.; Zhao, Z.; Dappe, Y.J.; Jiang, Z.J.; Song, P.; Wang, Y.; Zhu, J. Sulfur vacancy-rich ZnS on ordered microporous carbon frameworks for efficient photocatalytic CO2 reduction. Appl. Catal. B Environ. Energy 2025, 364, 124835. [Google Scholar] [CrossRef] [Scilit]
  13. Liu, X. Excellent photocatalytic performance under visible-light irradiation of ZnS/rGO nanocomposites synthesized by a green method. J. Solid State Chem. 2016, 241, 226–233. [Google Scholar]
  14. Song, X.; Wang, X. Solar light-responsive ZnS/reduced graphene oxide photocatalysts for enhanced hydrogen evolution. Catal. Lett. 2024, 154, 2527–2536. [Google Scholar] [CrossRef] [Scilit]
  15. Yu, H.; Zhang, K.; Rossi, C. Theoretical study on photocatalytic oxidation of VOCs using nano-TiO2 photocatalyst. J. Photochem. Photobiol. A Chem. 2007, 188, 65. [Google Scholar] [CrossRef] [Scilit]
  16. Feng, Y. One-pot hydrothermal synthesis of ZnS–reduced graphene oxide composites with enhanced photocatalytic properties. CrystEngComm 2014, 16, 214–222. [Google Scholar] [CrossRef] [Scilit]
  17. Kudo, A.; Miseki, Y. Heterogeneous photocatalyst materials for water splitting. Chem. Soc. Rev. 2009, 38, 253. [Google Scholar] [CrossRef] [Scilit]
  18. Reddy, D.A.; Choi, J.; Lee, S.; Ma, R.; Kim, T.K. Self-assembled macro porous ZnS graphene aerogels for photocatalytic degradation of contaminants in water. RSC Adv. 2015, 5, 18342. [Google Scholar] [CrossRef] [Scilit]
  19. Yan, J.; Fan, Y.; Lian, J.; Zhao, Y.; Xu, Y.; Gu, J.; Song, Y.; Xu, H.; Li, H. Kinetics and mechanism of enhanced photocatalytic activity employing ZnS nanospheres/graphene-like C3N4. Mol. Catal. 2017, 438, 103. [Google Scholar] [CrossRef] [Scilit]
  20. Huang, T.; Hua, Y.X.; Yao, J.C.; Luo, Y.T.; Liu, X.H. The synergetic effect of graphene and MoS2 on AgInZnS for visible-light driven photocatalytic H2 evolution. Mater. Chem. Phys. 2018, 210, 230–238. [Google Scholar] [CrossRef] [Scilit]
  21. Jiang, S.D.; Tang, G.; Ma, Y.F.; Hu, Y.; Song, L. Synthesis of nitrogen-doped graphene ZnS quantum dots composites with highly efficient visible light photodegradation. Mater. Chem. Phys. 2015, 151, 34. [Google Scholar] [CrossRef] [Scilit]
  22. Zhang, G.; Monllor-Satoca, D.; Choi, W. Band energy levels and compositions of CdS-based solid solution and their relation with photocatalytic activities. Catal. Sci. Technol. 2013, 3, 1790. [Google Scholar] [CrossRef] [Scilit]
  23. Fang, X.; Zhai, T.; Gautam, U.K. ZnS nanostructures: From synthesis to applications. Prog. Mater. Sci. 2011, 56, 175–287. [Google Scholar] [CrossRef] [Scilit]
  24. Jia, L.; Wang, D.-H. Highly Durable N-Doped Graphene/CdS Nanocomposites with Enhanced Photocatalytic Hydrogen Evolution from Water under Visible Light. J. Phys. Chem. C 2011, 115, 11466–11473. [Google Scholar] [CrossRef] [Scilit]
  25. Kumar, S.; Nishanthi, S.T. Band gap engineering in ZnS/rGO nanocomposites for enhanced photocatalytic activity. Mater. Lett. 2017, 206, 71–74. [Google Scholar]
  26. Lei, Y.; Yang, C. Strongly coupled CdS/graphene quantum dots nanohybrids for highly efficient photocatalytic hydrogen evolution: Unraveling the essential roles of graphene quantum dots. Appl. Catal. B 2017, 216, 59. [Google Scholar] [CrossRef] [Scilit]
  27. Kumar, S.; Reddy, N.L. Efficient electron transfer across a ZnO-MoS2 reduced graphene oxide heterojunction for enhanced sunlight driven photocatalytic hydrogen evolution. ChemSusChem 2017, 10, 3588. [Google Scholar] [CrossRef] [Scilit]
  28. Kiptarus, J.J.; Korir, K.K. Improved photocatalytic performance of cobalt doped ZnS decorated with graphene nanostructures under ultraviolet and visible light for efficient hydrogen production. Sci. Rep. 2024, 14, 21632. [Google Scholar] [CrossRef] [Scilit]
  29. Chen, J.; Chen, J.; Li, Y. Hollow ZnCdS dodecahedral cages for highly efficient visible light-driven hydrogen generation. J. Mater. Chem. A 2012, 5, 24116–24125. [Google Scholar] [CrossRef] [Scilit]
  30. Kumari, P.; Sharma, A.; Mishra, S.; Surolia, P.K.; Mukherjee, S.K.; Misra, K.P.; Samanta, S.; Kabi, S.; Chattopadhyay, S. Enhanced photocatalytic efficiency of sol-gel derived ZnS-rGO binary nanocomposite. Phys. Scr. 2024, 99, 055918. [Google Scholar] [CrossRef] [Scilit]
  31. Kumar, A.; Singh, P. Microwave treated sol–gel synthesis and characterization of hybrid ZnS–RGO composites for efficient photodegradation of dyes. New J. Chem. 2017, 4, 1727. [Google Scholar]
  32. Wang, L.C.; Zhang, D. Facile synthesis of ZnS/g-C3N4 nanocomposites with enhanced visible-light photocatalytic activity for methylene blue degradation. Mater. Res. Bull. 2024, 178, 112980. [Google Scholar]
  33. Li, Y.; Wang, H.; Zhang, L. Fabrication of MoS2/ZnS/rGO ternary heterojunction photocatalysts with enhanced charge separation for efficient UV-light-driven photodegradation of methylene blue. J. Alloys Compd. 2022, 918, 165897. [Google Scholar]
  34. Wang, C.F.; Liu, G. Green synthesis of ZnS quantum dots for photocatalytic degradation of organic pollutants. J. Environ. Chem. Eng. 2021, 5, 105998. [Google Scholar]
Figure 1. (a) XRD patterns of ZnS NRs, ZnS QDs, ZnS NRs- rGO and ZnS QDs-rGO nanocomposites. (b) Local magnification XRD patterns of ZnS NRs, ZnS QDs, ZnS NRs-rGO and ZnS QDs-rGO nanocomposites.
Processes 14 00848 g001
Figure 2. (ac) TEM images of rGO, ZnS NRs and ZnS QDs; (d,f) TEM images of ZnS NRs-rGO and ZnS QDs-rGO nanocomposites; (e,g) HRTEM images of ZnS NRs-rGO and ZnS QDs-rGO nanocomposites.
Processes 14 00848 g002
Figure 3. (A) XPS survey spectrum of ZnS NRs, ZnS QDs, ZnS NRs-rGO and ZnS QDs-rGO nanocomposites, respectively; (B) high-resolution binding energy spectrum of C 1s.
Processes 14 00848 g003
Figure 4. FT-IR spectra of GO, ZnS NRs, ZnS QDs, ZnS NRs-rGO, and ZnS QDs-rGO nanocomposites.
Processes 14 00848 g004
Figure 5. (a) UV-Vis absorption spectra of ZnS NRs, ZnS QDs, ZnS NRs-rGO and ZnS QDs-rGO nanocomposites; (b) the plots of the (αhν)1/2 vs. photon energy.
Processes 14 00848 g005
Figure 6. PL spectra of ZnS NRs, ZnS QDs, ZnS NRs-rGO and ZnS QDs-rGO nanocomposites.
Processes 14 00848 g006
Figure 7. Adsorption curve of MB solution concentration versus time using rGO as adsorbent under dark conditions.
Processes 14 00848 g007
Figure 8. (a) C/C0 plots for photocatalytic degradation of MB by ZnS NRs, ZnS QDs, ZnS NRs-rGO, and ZnS QDs-rGO nanocomposites under ultraviolet light irradiation; (b) ln(C0/C) plots for degradation of MB aqueous solution by ZnS NRs, ZnS QDs, ZnS NRs-rGO, and ZnS QDs-rGO nanocomposites under ultraviolet light.
Processes 14 00848 g008
Figure 9. Cyclic photocatalytic stability tests of ZnS NRs, ZnS QDs, ZnS NRs-rGO, and ZnS QDs-rGO nanocomposites.
Processes 14 00848 g009
Figure 10. TEM images of (a) ZnS NRs, (b)ZnS QDs, (c)ZnS NRs-rGO, and (d) ZnS QDs-rGO nanocomposites after four operational cycles.
Processes 14 00848 g010
Figure 11. Schematic diagram of the charge transfer path of ZnS-rGO nanocomposites under UV irradiation for photocatalytic degradation of organic dyes.
Processes 14 00848 g011
Disclaimer/Publisher’s Note: The statements, opinions and data contained in all publications are solely those of the individual author(s) and contributor(s) and not of MDPI and/or the editor(s). MDPI and/or the editor(s) disclaim responsibility for any injury to people or property resulting from any ideas, methods, instructions or products referred to in the content.