Article

Fracture Response Characteristics and Rockburst Pressure-Relief Control of Thick and Hard Roofs Under Multi-Parameter Coupled Staged Hydraulic Fracturing

School of Energy Engineering, Xi’an University of Science and Technology, Xi’an 710054, China
*
Author to whom correspondence should be addressed.
Processes 2026, 14(5), 843; https://doi.org/10.3390/pr14050843
Submission received: 16 January 2026 / Revised: 14 February 2026 / Accepted: 3 March 2026 / Published: 5 March 2026

Abstract

To address the problems of strong roof integrity, severe energy accumulation, and difficult caving in thick and hard roofs, a three-dimensional numerical study on fracture propagation and pressure-relief control durisng segmented hydraulic fracturing was carried out based on the engineering geological conditions of the 6125-1 working face at the Haishiwan Coal Mine, Shaanxi Province, China. using the ABAQUS finite element platform coupled with Ins-coh cohesive elements. A systematic analysis was conducted to elucidate the effects of elastic modulus, Poisson’s ratio, injection rate, and fluid viscosity on fracture initiation, stress evolution, and fractured volume. The results show that for every 10 GPa increase in elastic modulus, the average fractured volume decreases by 8%, and the fracture width exhibits a marked reduction; increasing Poisson’s ratio enhances the lateral deformation compatibility of the rock mass, raising the fracture width and volumetric growth rate by approximately 3% and 5%, respectively, although an excessively high Poisson’s ratio induces stress diffusion and reduces fracture stability. When the injection rate increases from 0.01 m3/s to 0.025 m3/s, the fractured volume increases by about 160%, and the maximum fracture width increases by 43%, whereas increasing fluid viscosity exerts a limited influence on volumetric growth but is conducive to stabilizing fracture morphology. Field observations via borehole imaging and seepage confirm full fracture connectivity within the roof and the formation of a continuous rupture zone, promoting timely roof breakage and caving along the dip direction and thereby creating favorable conditions for reducing rockburst hazards at the working face. This study clarifies the mechanical mechanisms and multi-parameter coupling laws governing hydraulic fracture propagation in thick and hard roofs, providing a theoretical basis and engineering reference for roof pressure-relief control and rockburst-resistant design under similar geological conditions.

1. Introduction

China’s coal resources exhibit substantial regional variability and mining is gradually extending into middle and deep levels, where rockburst accidents occur frequently. Hydraulic fracturing can effectively reduce the probability of such incidents by weakening or breaking the roof strata [1].
Under thick and hard roof conditions, the roof above the working face remains highly continuous after extraction. As the retreat distance increases, the hanging-roof area in the goaf expands, and large-scale hanging roofs commonly occur, creating numerous challenges for surrounding-rock control and safety. Therefore, to eliminate the adverse impacts of hard-to-cave thick roofs on safe production at the working face, extensive research has been carried out by many experts and scholars. In 1935, Grebe first observed that high-velocity, high-pressure fluids can induce fractures in rock, marking the birth of hydraulic fracturing technology [2]. Hubbert and Willis were the first to investigate the breakdown pressure of reservoir hydraulic fracturing and derived the H–W formula [3].The formula was subsequently revised multiple times; Haimson and Fairhurst proposed a rupture criterion for porous, permeable media, introducing poroelasticity into wellbore fracturing for the first time and thereby deriving the H–F breakdown-pressure equation [4]. Yew and Li applied three-dimensional elasticity theory to analyze the angle between the hydraulic fracture plane and the wellbore axis [5]. The earliest development of theoretical models for hydraulic fracture propagation can be traced to Carter, who established a two-dimensional fracture area calculation formula and a leak-off model. Based on this work, various hydraulic fracture propagation models were subsequently developed, among the classical analytical hydraulic fracture models, the Khristianovic–Geertsma–de Klerk (KGD) model and the Perkins–Kern–Nordgren (PKN) model have been widely used due to their relative computational simplicity. The KGD model assumes plane-strain conditions in the vertical direction and is typically applicable to fractures with limited height growth, whereas the PKN model assumes constant fracture height and is more suitable for vertically confined fracture propagation [6,7,8]. Heng et al. reported that fractures generated by hydraulic fracturing ultimately tend to reorient along the direction of the maximum horizontal principal stress, and the specific reorientation behavior is closely related to the degree of fracture development [9]. Chen et al. [10] established numerical models for the KGD problem and for hydraulic fracture–natural-fracture interaction based on zero-thickness Pore-Pressure Cohesive Zone (PPCZ) elements. Comparative analyses of different mesh types (triangular, quadrilateral, and distorted quadrilateral) and infinite boundary conditions were conducted. The results indicate that hydraulic fracturing simulations are better suited to coupling with the infinite boundary element method to enhance computational reliability [10]. Ran et al. established a multiple hydraulic fracture propagation model based on XFEM and quantitatively analyzed the effects of horizontal stress difference and cluster spacing on fracture propagation [11]. Liu et al. developed a three-dimensional coupled fluid–solid model using the finite element method to investigate multiple vertical fractures at different depths along a vertical wellbore [12]. Eekelen, V and Crockett, Adeveloped a pseudo-three-dimensional fracture propagation model, while Cleary established a fully three-dimensional fracture propagation model [13,14]. The propagation direction and morphology of hydraulic fractures are influenced by multiple factors, including coal–rock physical properties, injection rate, in situ stress, fracturing equipment, construction techniques, and natural fractures [15,16,17,18]. Manchanda and Bryant established a fully three-dimensional numerical model to investigate the competitive propagation behavior of multiple fractures in heterogeneous media [19]. Settgast et al. [20] developed a multi-fracture propagation model based on the finite element method. The simulation results demonstrated that increasing the cluster spacing can effectively overcome the stress shadowing imposed by adjacent fractures, thereby improving the effectiveness of all perforation clusters within a single fracturing stage [20]. Shibin et al. employed a geometric-model image pixel-level processing method to import hydraulic fracturing simulation results from PFC2D into COMSOL6.3, thereby integrating the two simulation platforms and enabling numerical simulations of gas extraction from coal seams after fracturing [21]. Zhao Kaikai et al. used Xsite2.0 software to analyze the effects of wellbore orientation and in situ stress on hydraulic fracture propagation [22]. Jia Jinzhang et al. employed the RFPA2D-flow v3.0 discrete element software to simulate single-hole and multi-hole hydraulic fracturing processes under different injection pressures [23]. Zhang Rusheng et al. [24] introduced a secondary normal-stress fracture initiation criterion and a critical energy-release-rate fracture propagation criterion. By prescribing fracture propagation directions using cohesive elements in ABAQUS2023 and performing secondary development with Python 3.11, they simulated the fracture morphology as well as the evolution of the surrounding stress field and seepage field during three-dimensional hydraulic fracturing [24]. Chen Shuliang et al. compared mainstream roof-control measures—such as explosive blasting, hydraulic fracturing, CO2 phase-change fracturing, and static expansive agent fracturing—from the perspectives of energy control, effective influence range, and economic efficiency [25]. Zhao Shankun conducted a systematic analysis of the applicability of deep-hole roof presplitting blasting technology and directional hydraulic fracturing technology for rockburst prevention under thick and hard roof conditions; the analysis results indicate that directional hydraulic fracturing technology exhibits distinct advantages in terms of roof-control effectiveness, on-site construction efficiency, required engineering workload, operational constraints, and construction safety [26]. Huang Bingxiang et al. [27] in response to surrounding-rock control and safety challenges caused by hard roofs, proposed a theoretical framework and a complete set of technologies for hydraulic fracturing control of hard roofs. They established the spatiotemporal relationships and determination methods for pressure-driven hydraulic fracturing in mining-disturbed rock masses and developed a complete set of high-pressure hydraulic fracturing equipment for underground coal mines. This set of technologies and equipment has been successfully applied in the Datong mining area and the Shendong mining area. The results demonstrate that hydraulic fracturing-based roof weakening is characterized by simple management, high safety, and a wide effective influence range, making it particularly advantageous for deep mining operations [27]. Cheng Peng et al. [28] addressed the problems of intense mining pressure, severe roadway deformation, and high difficulty in control caused by the delayed caving of thick and hard roofs during face retreat. They proposed an integrated hydraulic fracturing roof-cutting and pressure-relief technology, which was successfully applied in the 5209 auxiliary transportation roadway of the Madaotou Coal Mine, Shanxi Province, China [28]. He Bin et al. [1] applied segmented hydraulic fracturing technology in field trials at the Daliuta Coal Mine, Shaanxi Province, China, carrying out hydraulic fracturing preconditioning to intervene in the integrity of the coal seam roof and weaken its overall strength. Field observations indicate that the treatment achieved favorable results [1].
Although extensive studies have been conducted on hydraulic fracturing mechanisms in coal and rock masses, most existing research primarily focuses on single-parameter effects or simplified two-dimensional models. In particular, the coupled influence of multiple geological and operational parameters on fracture initiation, propagation morphology, and stress redistribution during segmented hydraulic fracturing in thick and hard roofs has not been systematically quantified. Moreover, the interactive effects between rock mechanical properties and fluid dynamic parameters on fracture stability and pressure-relief performance remain insufficiently clarified under three-dimensional conditions. To address these gaps, this study establishes a three-dimensional numerical model of segmented hydraulic fracturing in thick and hard roofs using the ABAQUS finite element platform coupled with the Ins-coh subroutine and cohesive elements. By systematically varying key geological parameters (elastic modulus and Poisson’s ratio) and operational parameters (injection rate and fluid viscosity), the study quantitatively investigates their individual and coupled effects on fracture initiation thresholds, propagation patterns, volumetric evolution, and stress redistribution characteristics. The objective is to clarify the multi-parameter coupling mechanisms governing hydraulic fracture development in thick and hard rock strata and to provide a mechanistic basis for optimizing pressure-relief and rockburst-prevention fracturing parameters in deep coal mines.

2. Engineering Background and Three-Dimensional Numerical Model and Analysis

2.1. Engineering Background

The Haishiwan Coal Mine is located in Haishiwan Town, Honggu District, Lanzhou City, Gansu Province, China. The mine field extends 1.9 km along strike and 3.4 km along dip, covering an area of approximately 6.45 km2, with a designed production capacity of 1.8 million tons per year. The mine has been developed using a combination of drift, vertical, and inclined shafts. The primary mining method is retreating longwall mining along strike, with roof management by the full caving method. The main seam currently mined is the No. 2 coal seam. The 6125-1 working face is situated in the first mining area of the Haishiwan Coal Mine, Gansu Province, China, showing an elongated geometry with an east–west strike. The strike length is 379.5 m, and the average dip width is 175.9 m. The burial depth of the working face ranges from 729 m to 958 m, with an average depth of 843.5 m. The immediate roof of the coal seam is primarily composed of siltstone with a thickness of approximately 18.5 m. The average compressive strength is 40.65 MPa, and the average tensile strength is 3 MPa. It is classified as moderately hard rock, characterized by an intact structure and considerable thickness. During longwall retreat, the pronounced thickness and hardness of the roof result in frequent lateral hanging-roof phenomena above the roadway, as well as end-face hanging roofs near the boundaries of the working face. Under sustained loading, these hanging-roof strata tend to accumulate considerable elastic energy, hindering timely fracturing and caving of the roof along the dip direction. To effectively weaken the integrity and energy-storage capacity of the roof strata, reduce the risk of energy accumulation in large rock masses, and ensure operational safety, segmented hydraulic fracturing is implemented in the roof prior to mining. This hydraulic fracturing preconditioning measure promotes sufficient caving of the goaf roof and achieves effective control of rockburst hazards.

2.2. Three-Dimensional Numerical Model and Analysis

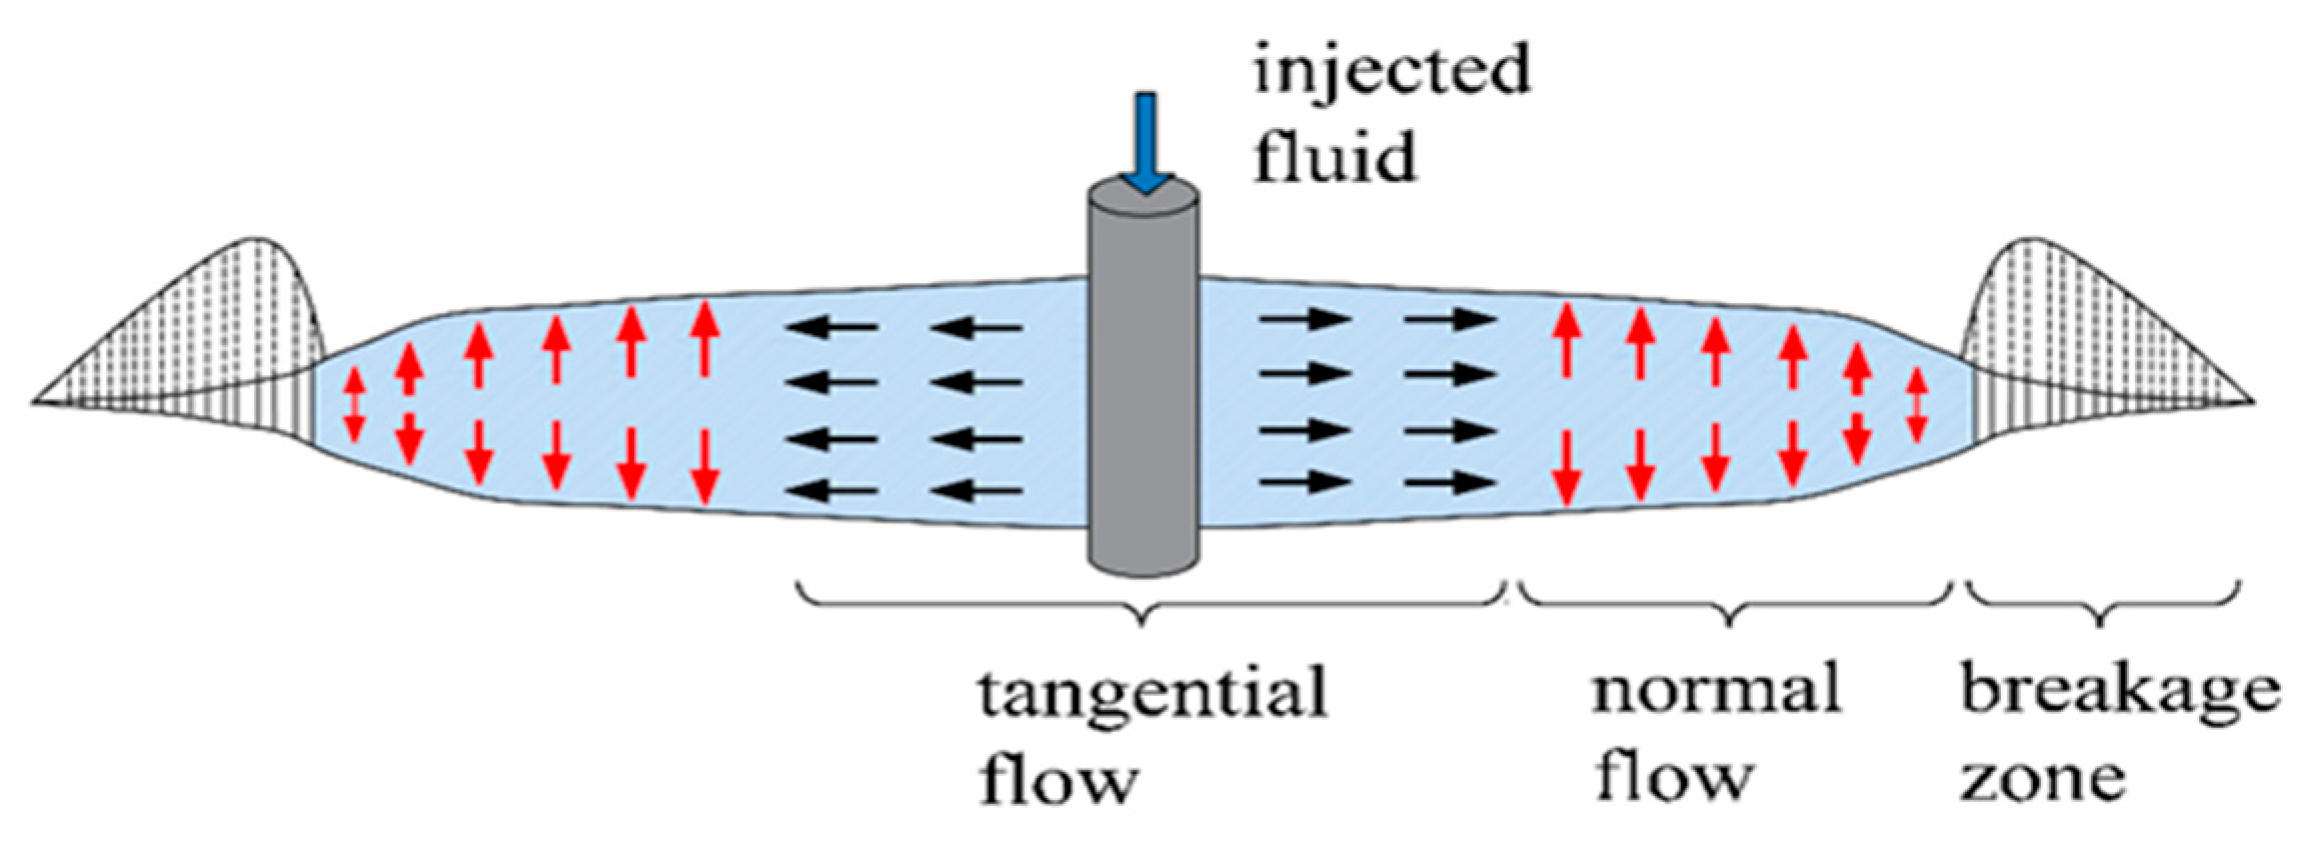
In the numerical simulation of hydraulic fracturing, cohesive elements are employed to describe the initiation and propagation of fractures under fluid pressure, as well as the fluid flow characteristics within the fracture. These elements are capable of modeling both the normal seepage across the fracture surfaces and the tangential flow along the fracture plane. The nodes of the interlayer elements represent the tangential fluid flow inside the fracture, thereby achieving coupling between the mechanical and hydraulic fields. During fracture initiation and propagation, the cohesive elements do not represent actual rock materials but serve as idealized interfaces to simulate the interaction forces between adjacent rock blocks during failure.
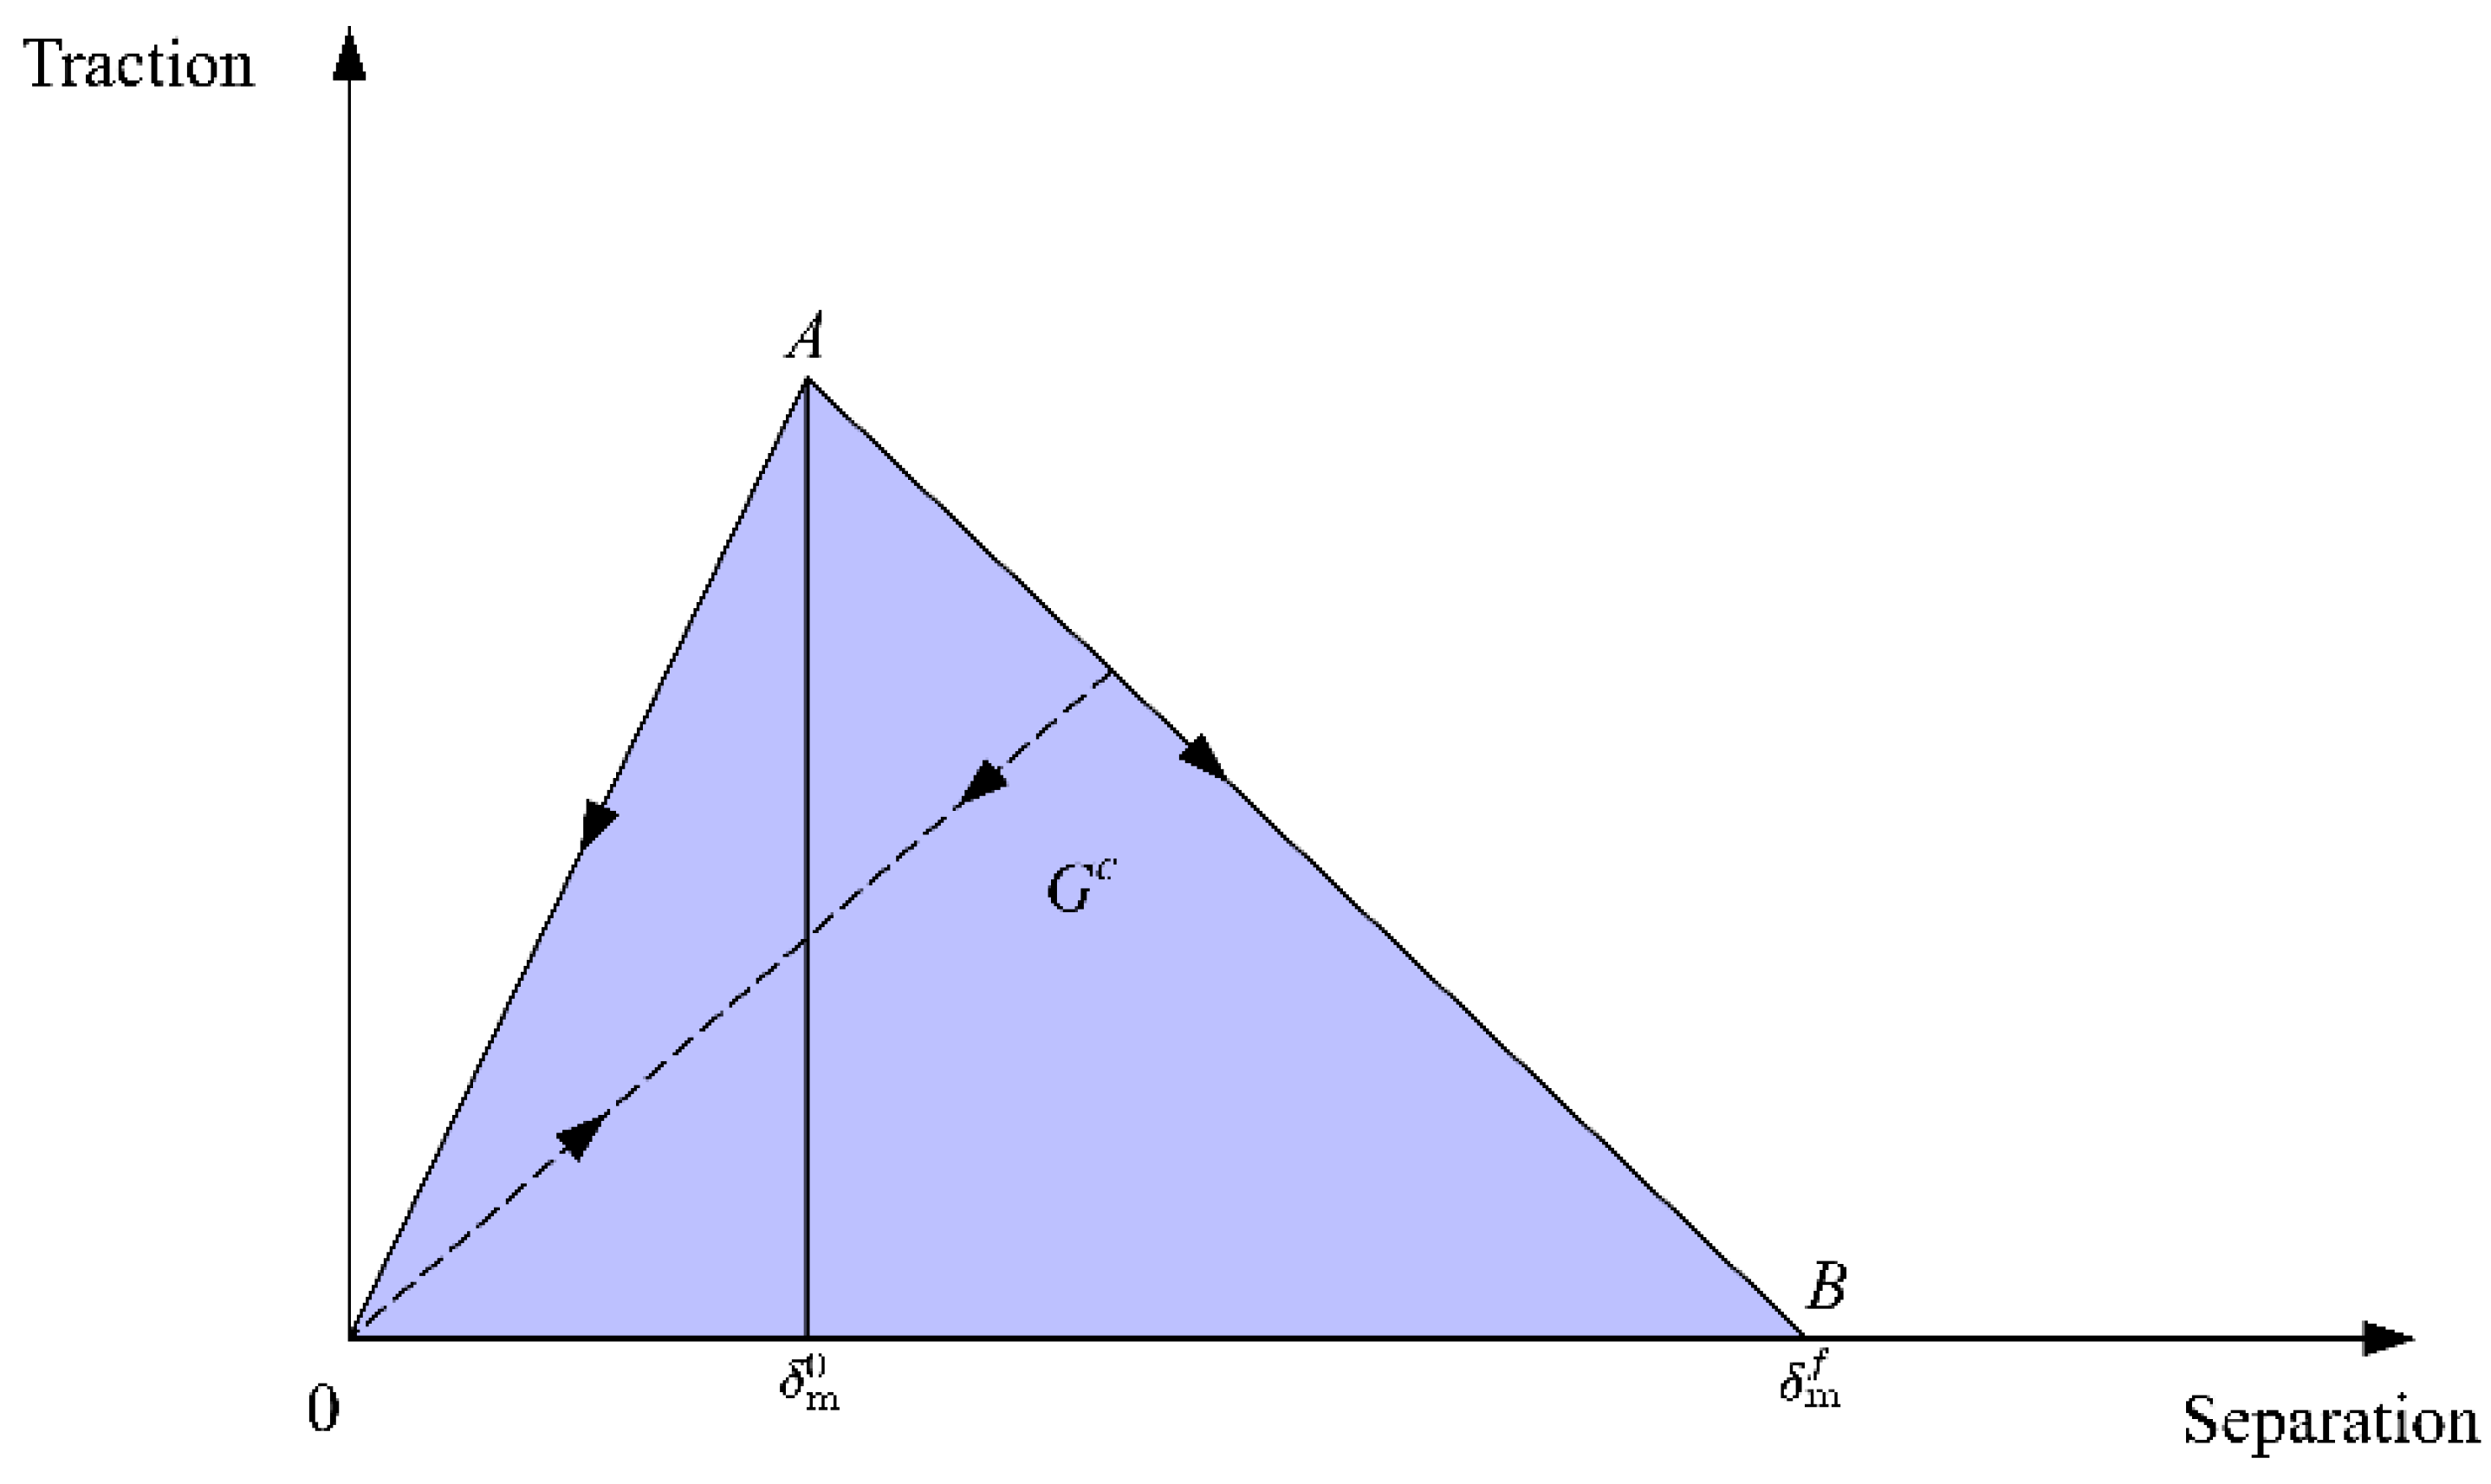
The traction–separation law of cohesive elements characterizes the linear-elastic response prior to fracture and the subsequent softening process during fracture initiation and propagation. This constitutive relationship mathematically defines the stress–strain behavior of rock during deformation. A schematic representation of the traction–separation criterion is shown in Figure 1. The abscissa denotes the damage displacement, while the ordinate represents the traction acting on the cohesive interface. When the displacement reaches δ m 0 damage initiation occurs; as it increases to δ m f , the element completely fails and traction decreases to zero. The critical energy release rate G c corresponds to the total area enclosed under the traction–separation curve (the shaded triangle), representing the fracture energy dissipated during complete separation of the element.
When the load reaches a certain point in the decompression section, if the external load decreases, the material will not return along the original softening path, but will be unloaded along the dotted line pointing to the origin, and the stiffness will be consistent with the initial loading stage.

2.2.1. Solid Governing Equations

δ n , δ s , and δ t represent the strain components of the cohesive element in the normal and the two tangential directions, respectively. The relationship between strain and displacement is defined as follows:
ε n = δ n T 0 ,   ε s = δ s T 0 , ε t = δ t T 0
In the equation, δ n , δ s , and δ t are the displacements of the cohesive element in the unit normal and the two tangential directions, respectively; T 0 denotes the default initial constitutive thickness of the cohesive element, which is 1.0.

2.2.2. Elastic Constitutive Matrix

Before damage occurs in the cohesive element, its stress–strain response is linear elastic and can be expressed as follows:
t = t n t s t t = K ε = K nn               K ns               K nt K ns               K ss                 K st K nt               K st                 K tt ε n ε s ε t
In the equation, t n , t s , and t t represent the stress components of the cohesive element in the normal and the two tangential directions, respectively, while K denotes the stiffness matrix of the cohesive element.

2.2.3. Damage Initiation Equation

The maximum stress criterion is adopted to determine the onset of damage initiation. According to this criterion, damage is assumed to occur when the maximum nominal stress in a specific direction reaches the corresponding material strength.
Maximum stress criterion:
max t n t n o , t s t s o , t t t t o = 1
In the equation, t n o is the critical normal tensile stress of the element, and t s o and t t o are the critical tensile stresses in the two tangential directions, respectively. The term t n indicates that compressive normal stress does not contribute to the damage of the cohesive element.

2.2.4. Damage Evolution Equation

The Benzeggagh–Kenane (BK) criterion is adopted to describe mixed-mode fracture behavior during damage evolution. This criterion defines the critical energy release rate as a function of the mode mixity ratio, allowing the coupling of normal and shear fracture modes.
Benzeggagh–Kenane criterion:
G n C + G s C G n C G s G t η = G C
In the equation, G t = G n + G s and η are dimensionless material parameters; G n and G n C denote the normal energy release rate and the normal critical energy release rate, respectively; G s and G s C represent the tangential energy release rate and the tangential critical energy release rate.

2.3. Fluid Governing Equation

Figure 2 illustrates a hydraulic fracture unit propagating in a rock medium. The fracture unit is filled with pressurized fluid (shown in blue), and different regions of the unit exhibit different responses under fluid pressure: blue areas indicate regions that have already fractured, black arrows represent tangential fluid, red arrows represent normal fluid, and the shaded area on the right side of the fracture tip indicates the impending failure process zone, which follows the traction-separation criterion shown in Figure 1.

2.3.1. Tangential Fluid Flow Equation

Considering the fracturing fluid as a Newtonian fluid with a discharge rate of q at any given time, the tangential flow along the fracture surface satisfies the following relation according to the pressure transmission formula of Newtonian flow:
q = k t p s
In the equation, q is the tangential flow rate, equal to the average tangential flow velocity multiplied by the fracture aperture, in m3/s; p s is the fluid pressure within the element, in Pa; and k t is the flow coefficient of the fluid.
According to the Reynolds number equation, the flow coefficient k t can be expressed as:
k t = w 3 / 12 μ
In the equation, w is the fracture aperture, in meters, and μ is the viscosity of the fracturing fluid, in Pa·s.

2.3.2. Normal Fluid Flow Equation

The normal fluid flow in the fracture element is defined as:
q t = c t ( p i p t ) q b = c b ( p i p b )
In the equation, q t and q b denote the fluid velocities entering the upper and lower surfaces of the rock, respectively; c b and c t are the leak-off coefficients at the top and bottom surfaces of the roof strata; and p t ,   p b and p i represent the fluid pressures on the two surfaces of the element and the pressure within the cohesive layer, respectively.

3. Model Establishment

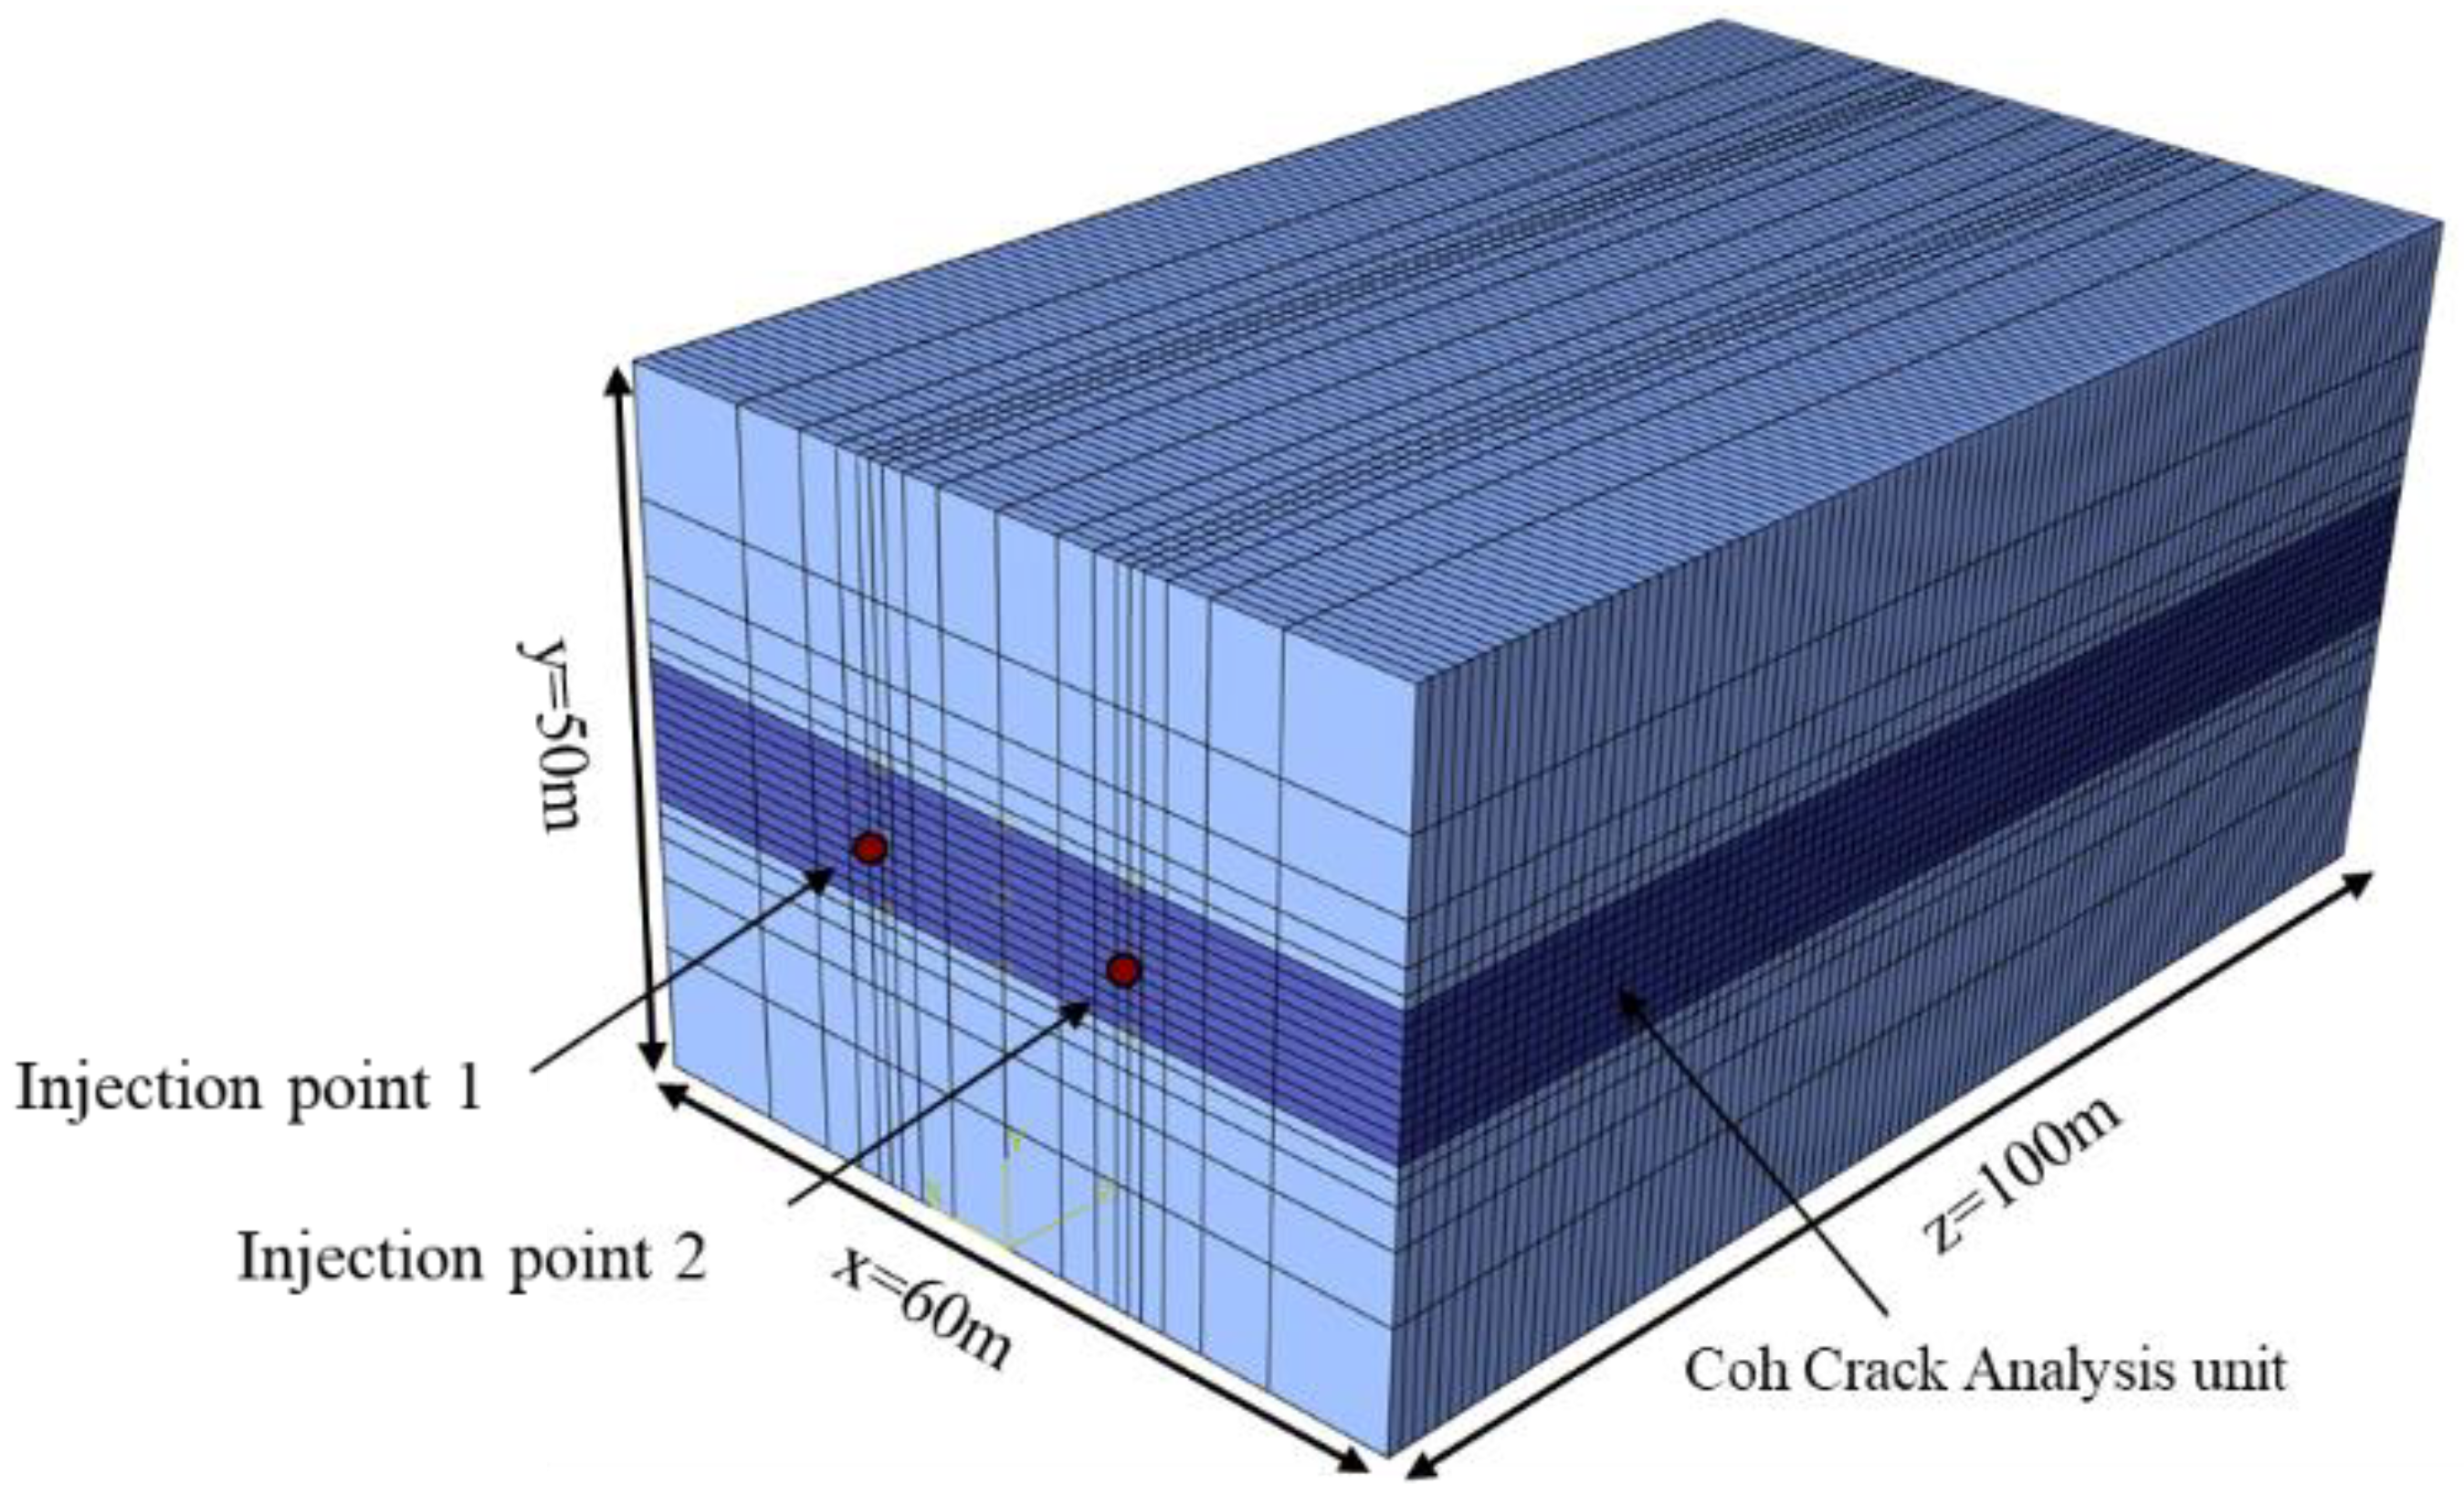
To investigate the fracture propagation behavior of the roof strata in the 6125-1 working face of the Haishiwan Coal Mine under hydraulic fracturing, the ABAQUS (2023) finite element software was employed, and predefined cohesive interfaces from the Ins-coh subroutine were introduced to simulate fracture initiation and propagation. Based on the geological and stress conditions of the working face, a three-dimensional finite element model was established as shown in Figure 3, with overall dimensions of 60 m × 50 m × 100 m.
In the coordinate system, the x-, z-, and y-directions correspond to the minimum principal stress, the maximum principal stress, and the vertical principal stress, respectively. Constant load boundary conditions are applied to the outer boundaries of the model to simulate a stable in situ stress environment, in which the boundary stresses remain unchanged throughout the analysis step and do not adjust with fracture propagation or surrounding-rock deformation. The model consists of two parts: the upper and lower interlayer rock strata with a thickness of 20 m, and the central reservoir section used to represent the fracturing layer of the roof in the field. Two fracturing stages are arranged in the upper and lower portions of this layer with a spacing of 20 m. Fracture initiation and propagation occur along the cohesive interfaces to reproduce the evolution process of hydraulic fractures.
To ensure the computational accuracy of the fracture propagation path, the model was systematically meshed, and mesh refinement was applied in the embedded cohesive-layer region. Two injection points were established in the model: Injection Point 1 corresponds to Fracturing Stage 1, and Injection Point 2 corresponds to Fracturing Stage 2. A sequential staged fracturing process was adopted, with an injection duration of 300 s for each stage. Considering practical factors such as equipment adjustment, push-rod removal, and personnel evacuation, the duration of the depressurization stage was set to 3600 s. The model parameters listed in Table 1 are derived from the results of rock mechanical and physical property tests conducted at the Haishiwan Coal Mine.
The rock mechanical and in situ stress parameters listed in Table 1 are obtained from the rock mechanics testing and in situ stress measurement reports of the Haishiwan Coal Mine. These parameters ensure that the numerical model reflects the actual geological and stress conditions of the study site.
The primary control parameters of the model include the elastic modulus (E), Poisson’s ratio ( ν ), injection rate ( q ), and fluid viscosity (μ), as shown in Table 2 below. Four simulation schemes (A–D) were designed using a single-factor variation method, ensuring that all parameters other than the target variable remain consistent across groups, thereby enabling quantitative analysis of the influence of each individual physical parameter on the fracture volume, fracture propagation rate, and fracture aperture distribution.

4. Numerical Simulations

4.1. Stress Distribution Characteristics of Thick and Hard Roofs Under Different Fracturing Parameters

4.1.1. Stress Distribution Characteristics of Segmented Hydraulic Fracturing in Rocks with Different Elastic Moduli

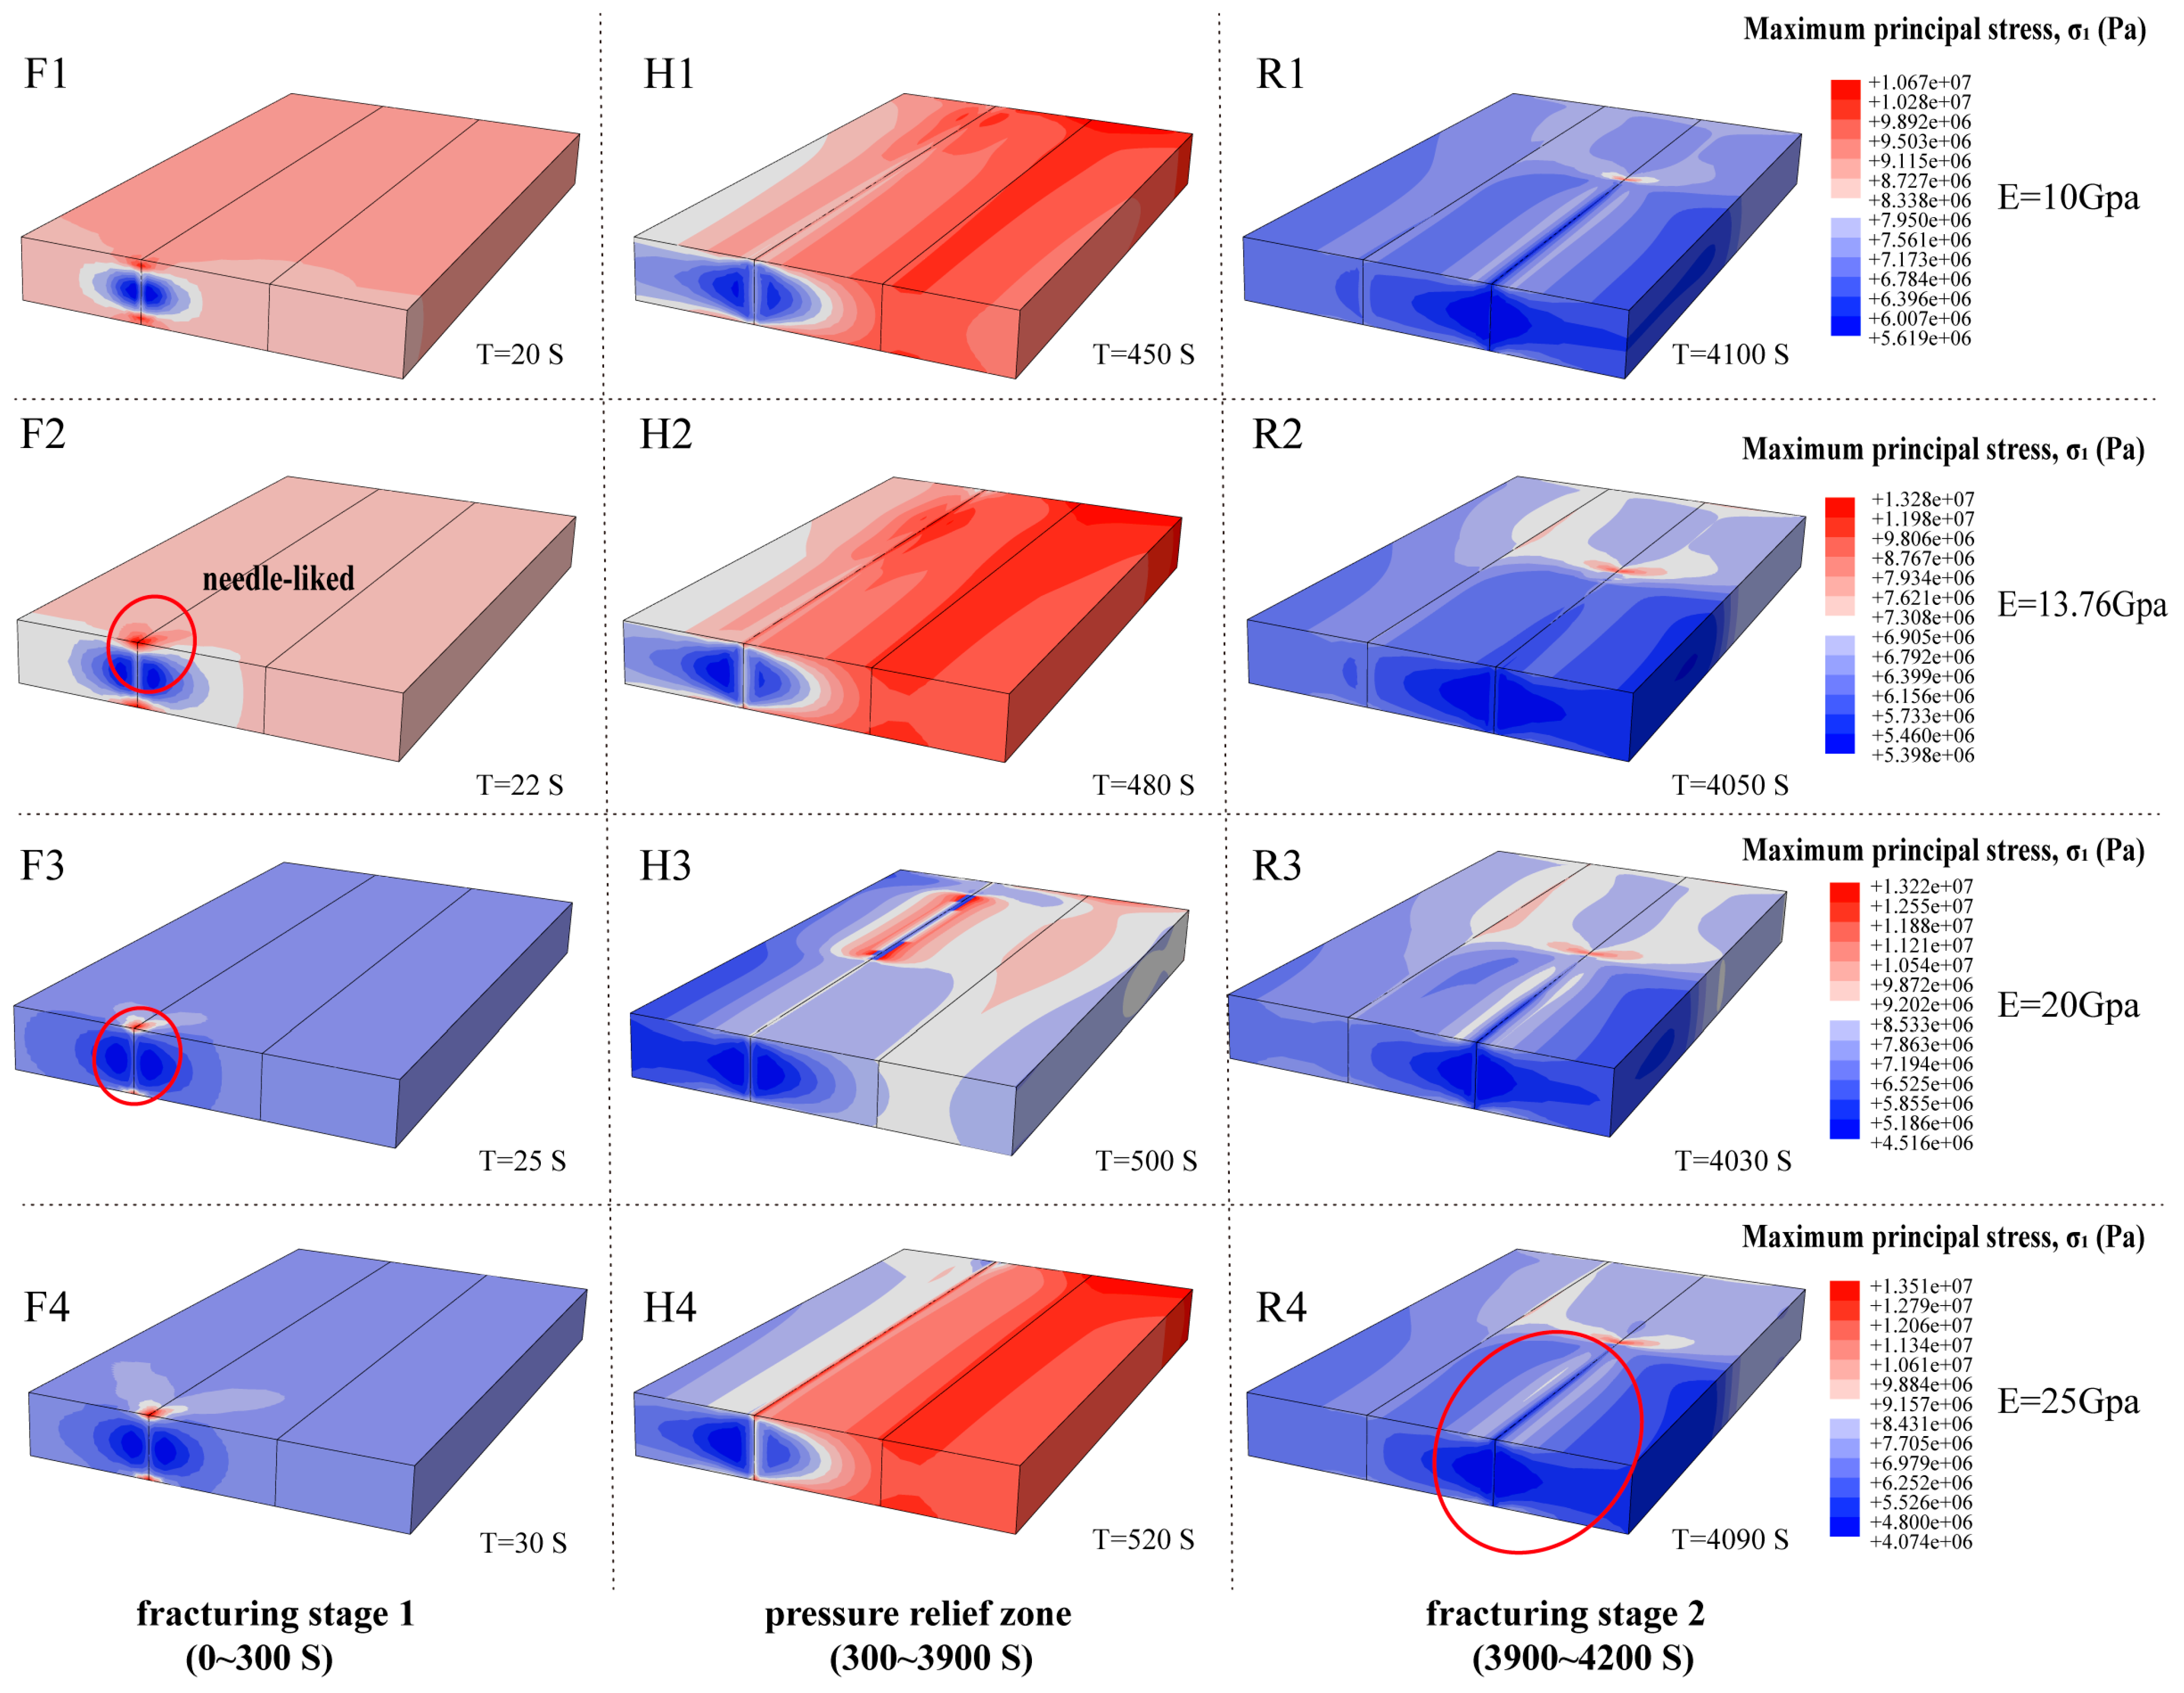
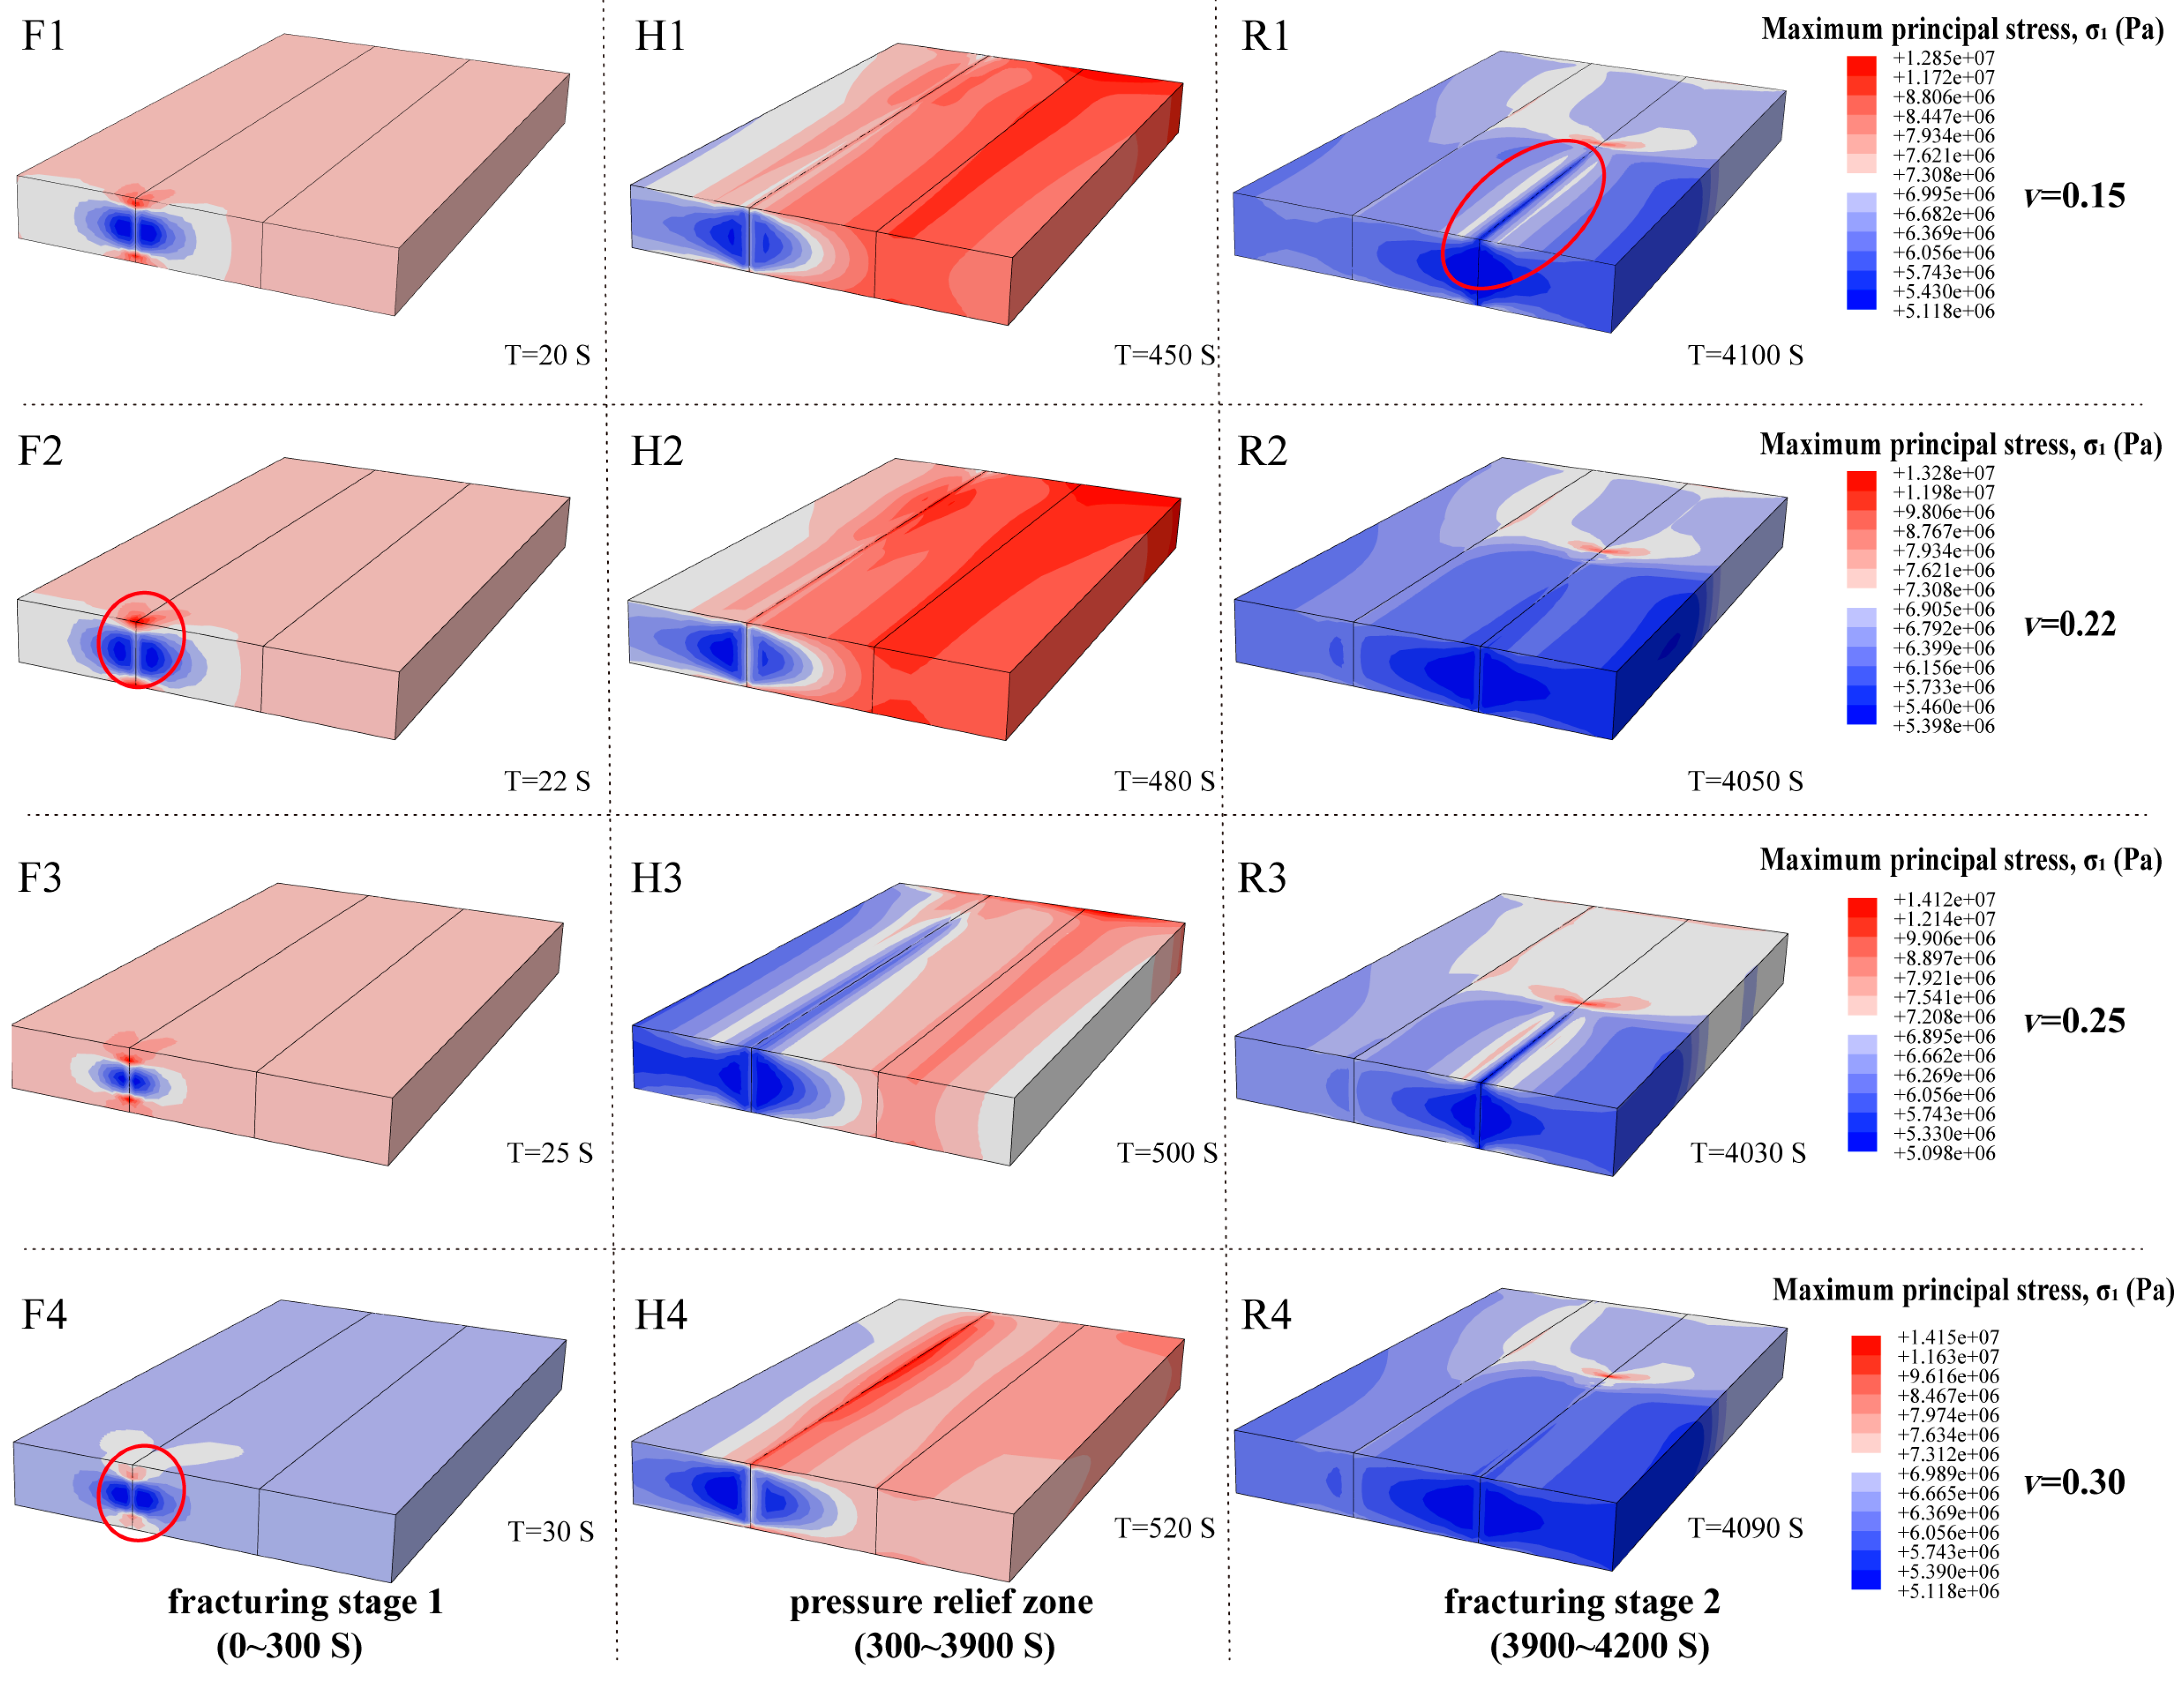
As shown in Figure 4, the equivalent stress distributions during hydraulic fracturing under different elastic moduli in Group A are simulated. In the figure, the F-series plots represent Fracturing Stage 1, the H-series plots correspond to the depressurization stage, and the R-series plots represent Fracturing Stage 2.
Figure 4, Figure 5, Figure 6 and Figure 7 present the stress contour plots corresponding to the middle reservoir unit of the three-dimensional model illustrated in Figure 3. The coordinate system adopted in these figures is consistent with that defined in Figure 3. The stress fields shown in each figure represent the distribution of maximum principal stress (σ1) at different fracturing times during the hydraulic fracturing process, thereby reflecting the temporal evolution of stress redistribution under varying fracturing parameters.
In Fracturing Stage 1, a distinct stress concentration develops at the fracture tip, and the peak stress increases with increasing elastic modulus. Following depressurization, the stress level decreases rapidly; low-modulus strata exhibit a relatively larger stress-release zone, whereas high-modulus strata show faster attenuation but within a comparatively narrower affected region. During Fracturing Stage 2, the stress field progressively expands outward as the fracture propagates, with the high-stress region advancing toward the distal end of the fracture. Continued fluid injection promotes a gradual stabilization of internal fracture pressure, facilitating stable fracture growth and further enlargement of the stress-redistribution zone.
Under higher elastic modulus conditions, stress concentration becomes more pronounced at the fracture tip, while the spatial influence range of the high-stress zone progressively contracts. The stress gradient at the fracture tip becomes steeper, and the spacing of the isosurfaces in the interlayer transition zone decreases, exhibiting typical characteristics of localized energy accumulation. This demonstrates that as the elastic modulus increases, the overall stiffness of the rock mass rises and its deformation capacity diminishes, making it difficult for external loads to be effectively released through plastic or elastic deformation. Consequently, more pronounced stress concentration occurs at the fracture tip and interlayer interfaces.

4.1.2. Stress Distribution Characteristics of Segmented Hydraulic Fracturing in Rocks with Different Poisson’s Ratios

Figure 5 illustrates the equivalent stress distributions during hydraulic fracturing under different Poisson’s ratios in Group B.
As shown in Figure 5, the high-stress region (maximum principal stress, σ1) exhibits a gradual change in its spatial distribution within the x–z plane as the Poisson’s ratio increases. When the Poisson’s ratio is relatively small, the rock mass is subjected to stronger lateral confinement under fluid loading, and the elevated stress remains highly localized near the fracture tip along the propagation direction. The stress gradient at the fracture front is steep, indicating pronounced tip-dominated stress concentration.
With increasing Poisson’s ratio, the lateral deformation capacity of the rock mass is enhanced. Part of the accumulated elastic energy is redistributed through transverse deformation, leading to a broader spatial distribution of the stress field around the fracture tip. Consequently, the stress gradient decreases and the stress-affected region expands within the x–z plane, reflecting a more diffused stress redistribution pattern rather than a strictly localized concentration.
Consequently, the stress isosurfaces become progressively more dispersed, and the high-stress zone exhibits cloud-like or ring-shaped diffusion features, reflecting the transition of the stress-field distribution from concentration to dispersion. This indicates that as the Poisson’s ratio increases from 0.15 to 0.30, the lateral deformation capacity of the rock mass is markedly enhanced and the degree of stress concentration gradually weakens.
Figure 5. Equivalent stress contour plots after segmented hydraulic fracturing under different Poisson’s ratios.
Processes 14 00843 g005

4.1.3. Equivalent Stress Contour Plots After Segmented Hydraulic Fracturing Under Different Injection Rates

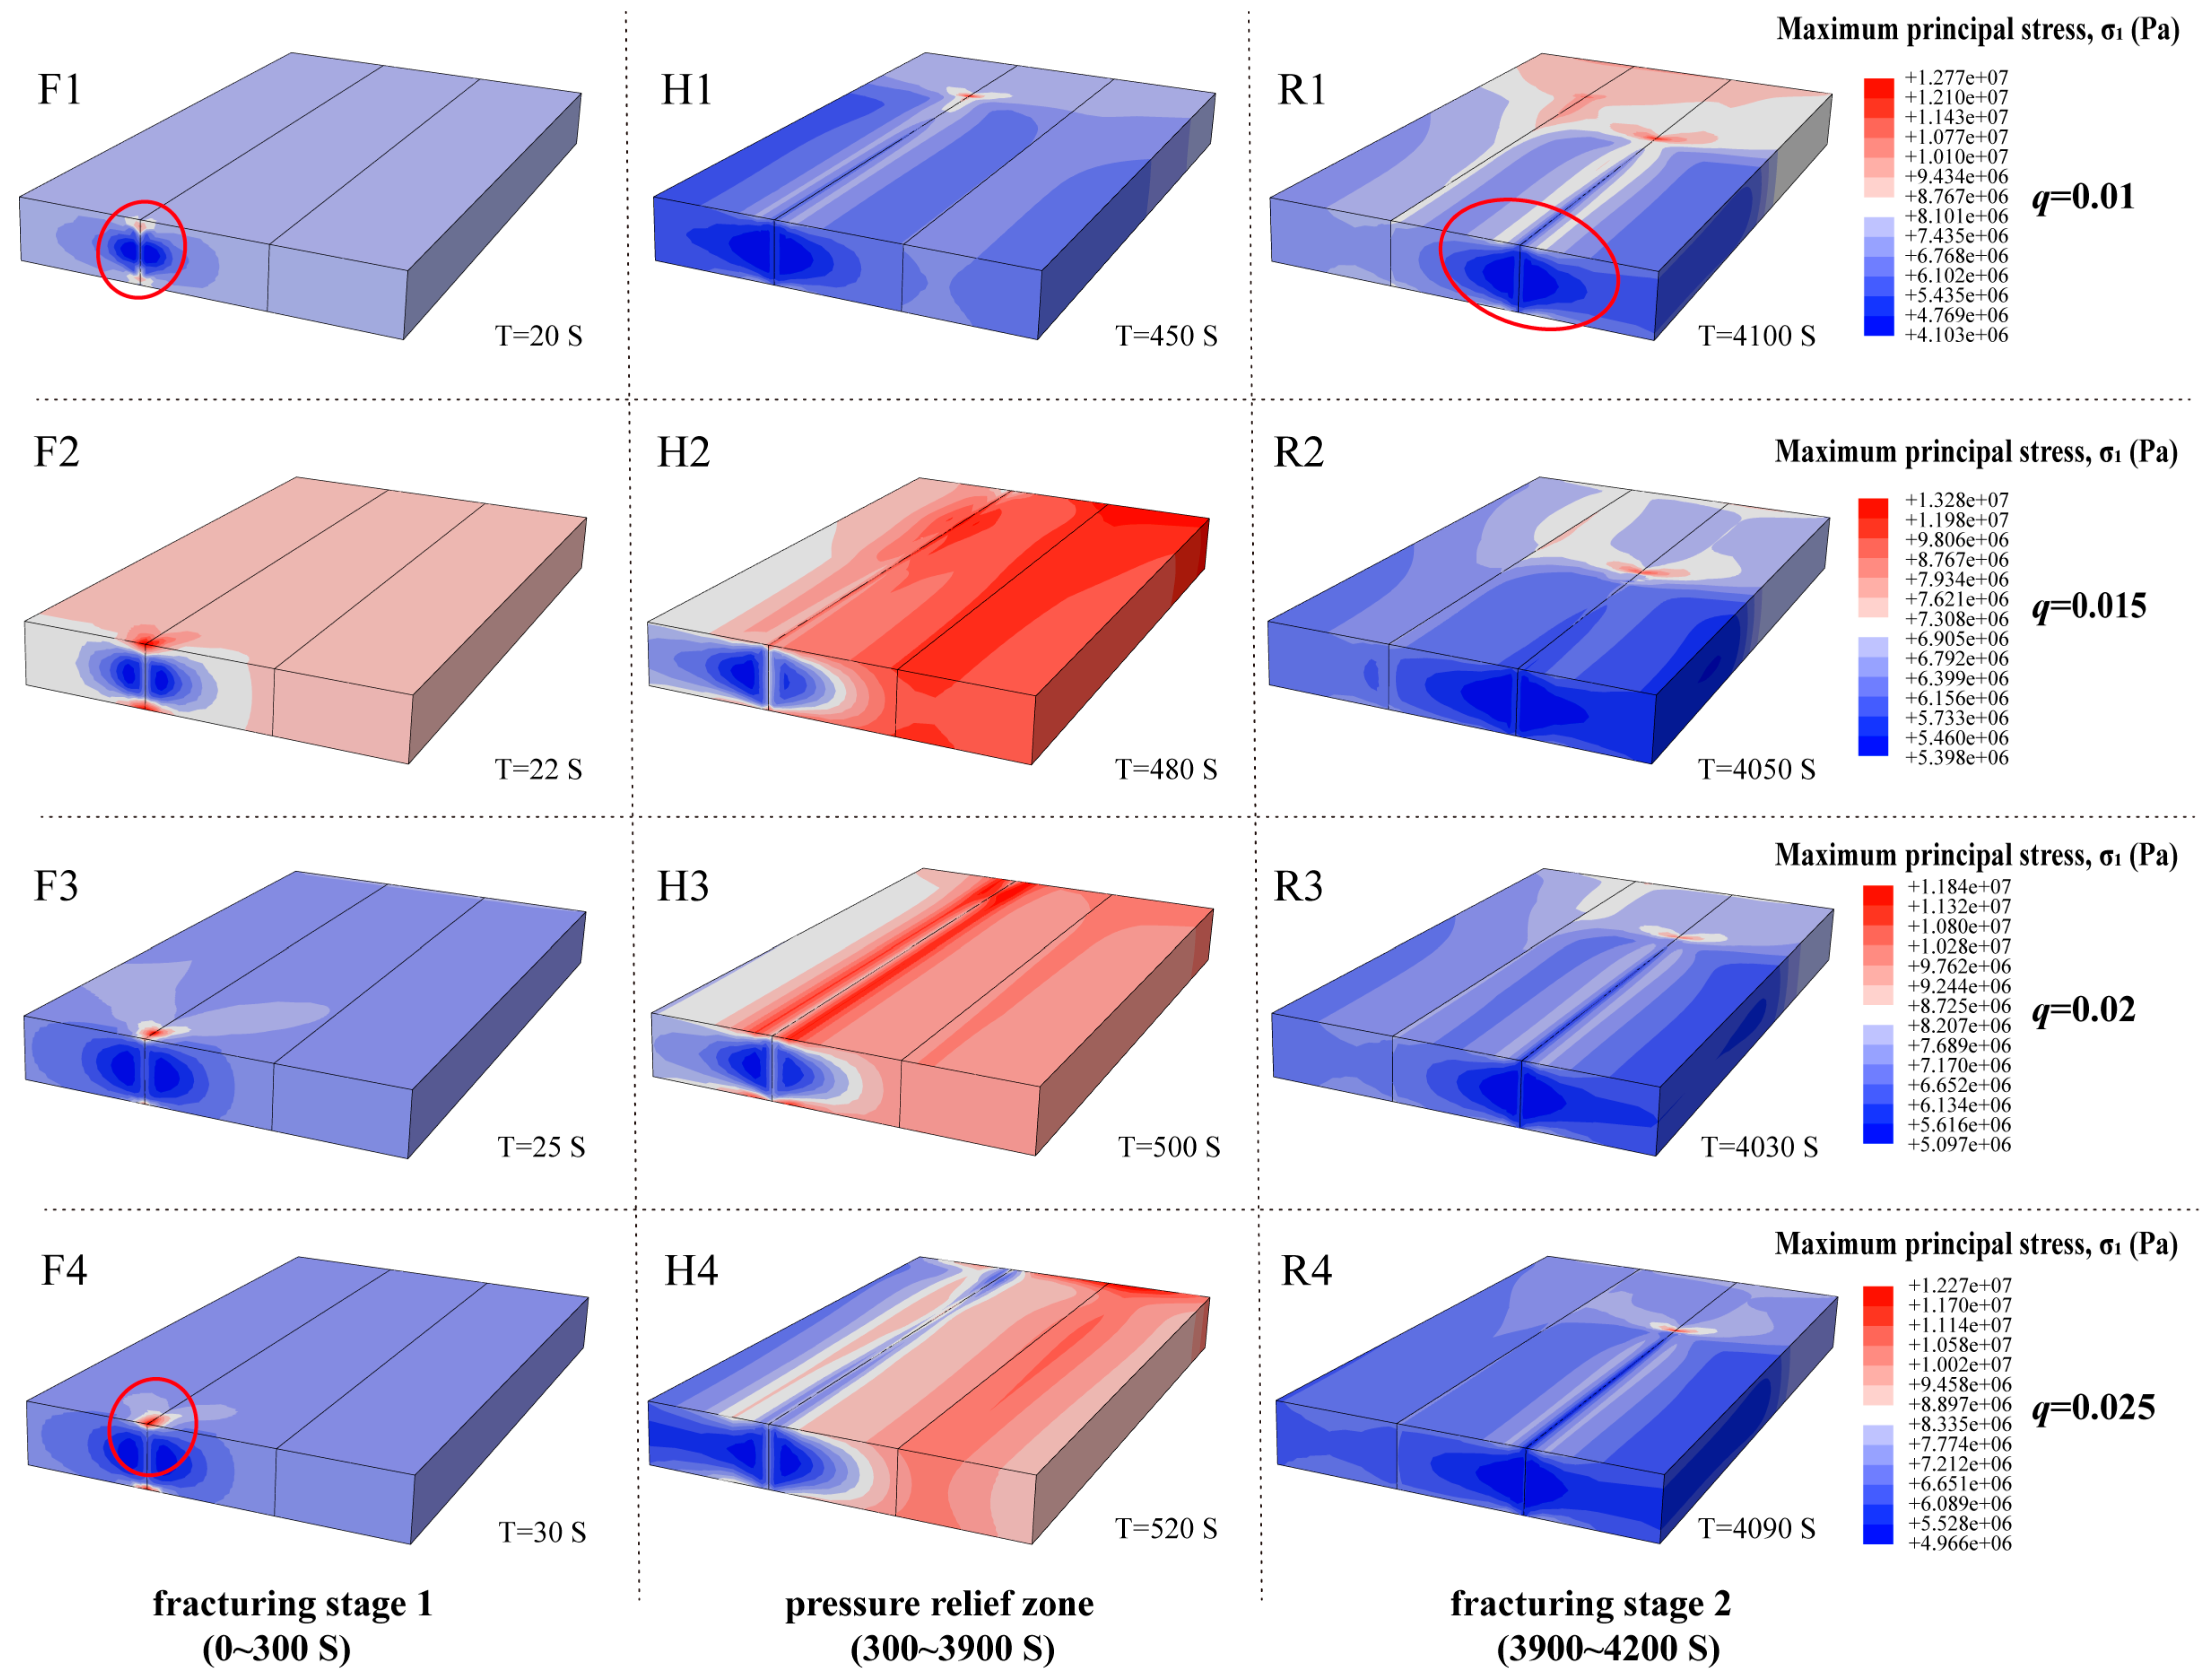
Figure 6 presents the equivalent stress distributions during hydraulic fracturing under different injection rates in Group C.
In Fracturing Stage 1, under relatively low injection rates, pore pressure increases gradually, and the stress perturbation remains confined to the near-wellbore region. The fracture length is limited, and the overall energy accumulation is relatively small. As the injection rate increases, pore pressure rises more rapidly, leading to a more pronounced stress concentration near the fracture tip. The peak stress level shows a generally positive correlation with the injection rate, while both the spatial extent and persistence of the depressurized zone increase accordingly. Under higher injection rates, relatively elevated residual fluid pressure is maintained within the fracture, resulting in a sustained stress-affected zone that does not fully dissipate after depressurization. In Fracturing Stage 2, the second-stage injection induces renewed stress concentration at the advancing fracture tip. The peak stress remains at a moderate level but persists over a longer duration, and fracture propagation becomes more symmetric and stable. This behavior reflects a more balanced stress redistribution and controlled energy release during continued injection.
Figure 6. Equivalent stress contour plots after segmented hydraulic fracturing under different injection rates.
Processes 14 00843 g006
Overall, these results indicate that at low injection rates, stress concentration is point-like and fractures are short; at moderate injection rates, the high-stress zone elongates along the fracture direction into a spindle shape; and at high injection rates, the stress field becomes diffusive, fractures widen and develop lateral branches, and stress transitions from concentration to dispersion, promoting the formation of more complex fracture networks.

4.1.4. Equivalent Stress Contour Plots After Segmented Hydraulic Fracturing Under Different Fluid Viscosities

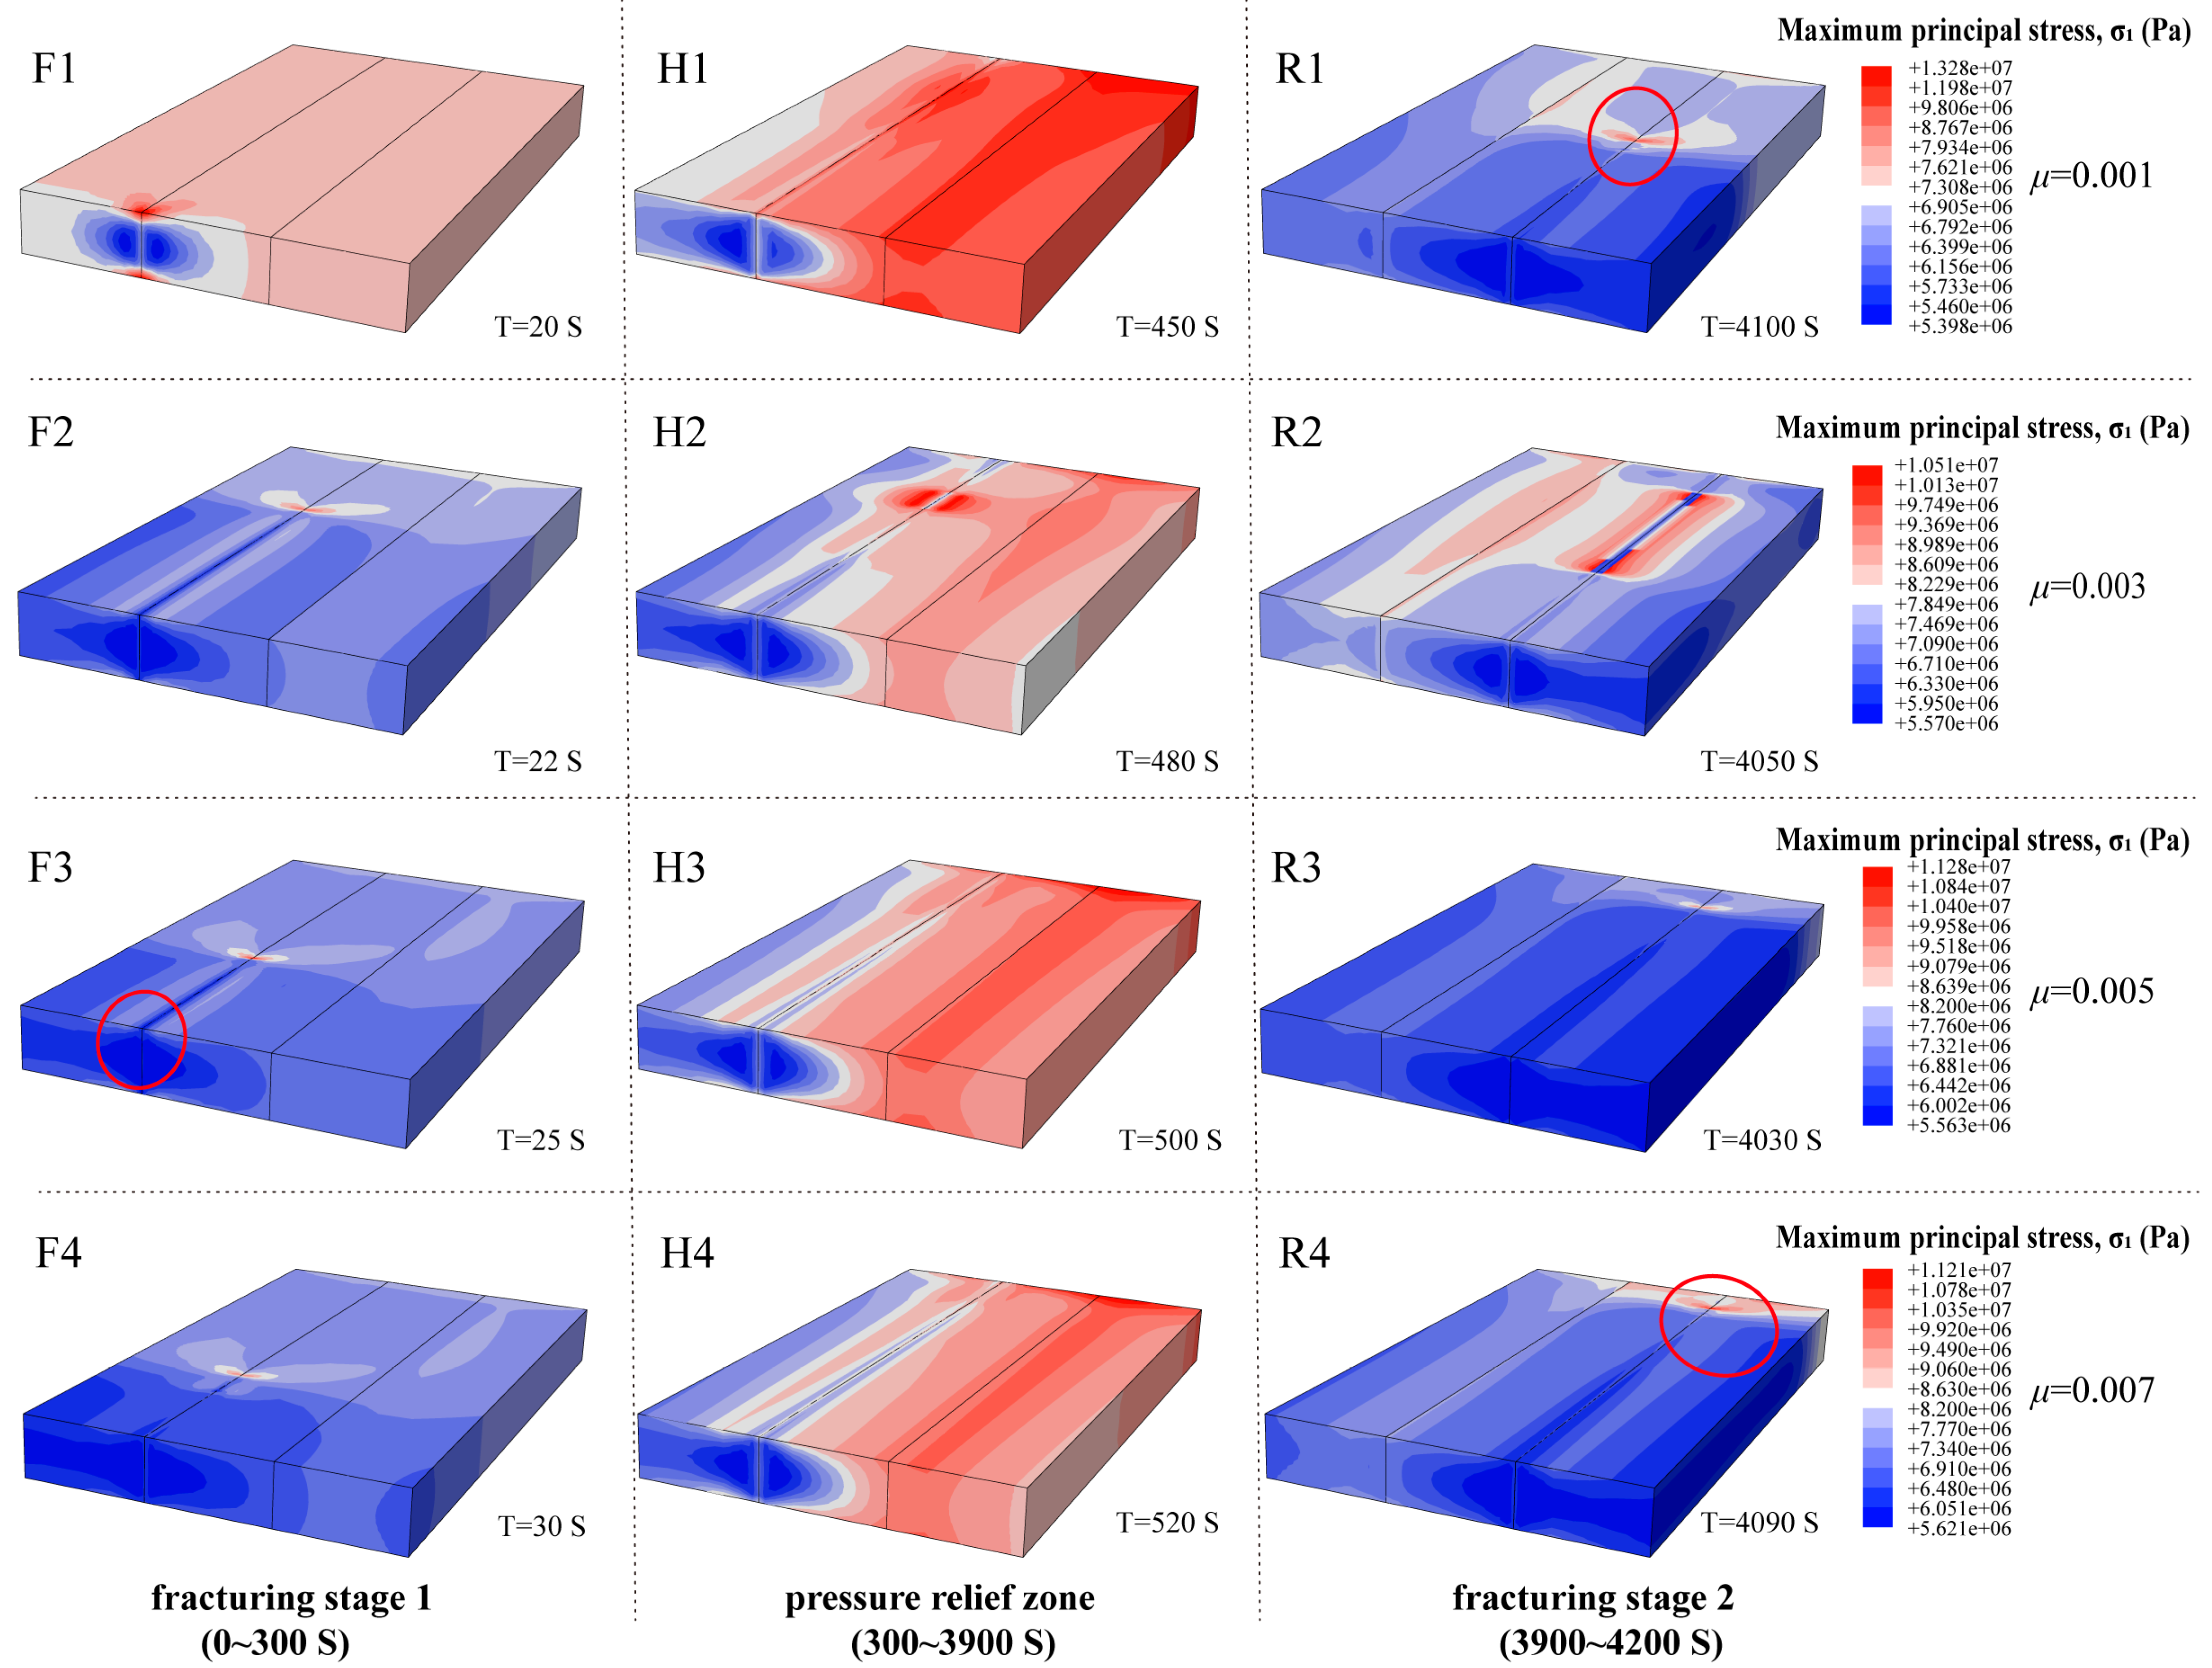
Figure 7 illustrates the equivalent stress distributions during hydraulic fracturing under different fluid viscosities in Group D.
In Fracturing Stage 1, under low-viscosity conditions, a slender and steep high-stress band develops at the fracture tip, exhibiting a pronounced stress concentration characteristic of early-stage crack initiation. The optimized and condensed paragraph in formal manuscript style is as follows: As fluid viscosity increases, the stress concentration zone at the fracture front advances forward, and its spatial distribution transitions from a relatively narrow banded pattern to a more uniformly distributed elliptical shape. After depressurization, the stress gradient decreases rapidly, and the stress field diffuses laterally, gradually approaching a more symmetric distribution. In Fracturing Stage 2, stress concentration is re-established at the fracture tip; however, the stability of the fracture front decreases, leading to an increased tendency for local deviation or branching. Overall, the high-stress region extends predominantly along the fracture propagation direction, while the fracture maintains relatively stable growth.
Figure 7. Equivalent stress distributions during hydraulic fracturing under different viscosities in Group D.
Processes 14 00843 g007
These results indicate that increasing fluid viscosity weakens stress concentration at the fracture tip and enlarges the range of stress transmission, causing the high-stress zone to transition from a slender and sharp form to a cloud-like diffusive pattern. In contrast, under low-viscosity conditions, stress concentration is sharper with higher peak values, and fractures propagate in a needle-like penetrating manner, reflecting the effects of strong fluid impact and rapid energy release.

4.2. Figures, Tables, and Schemes

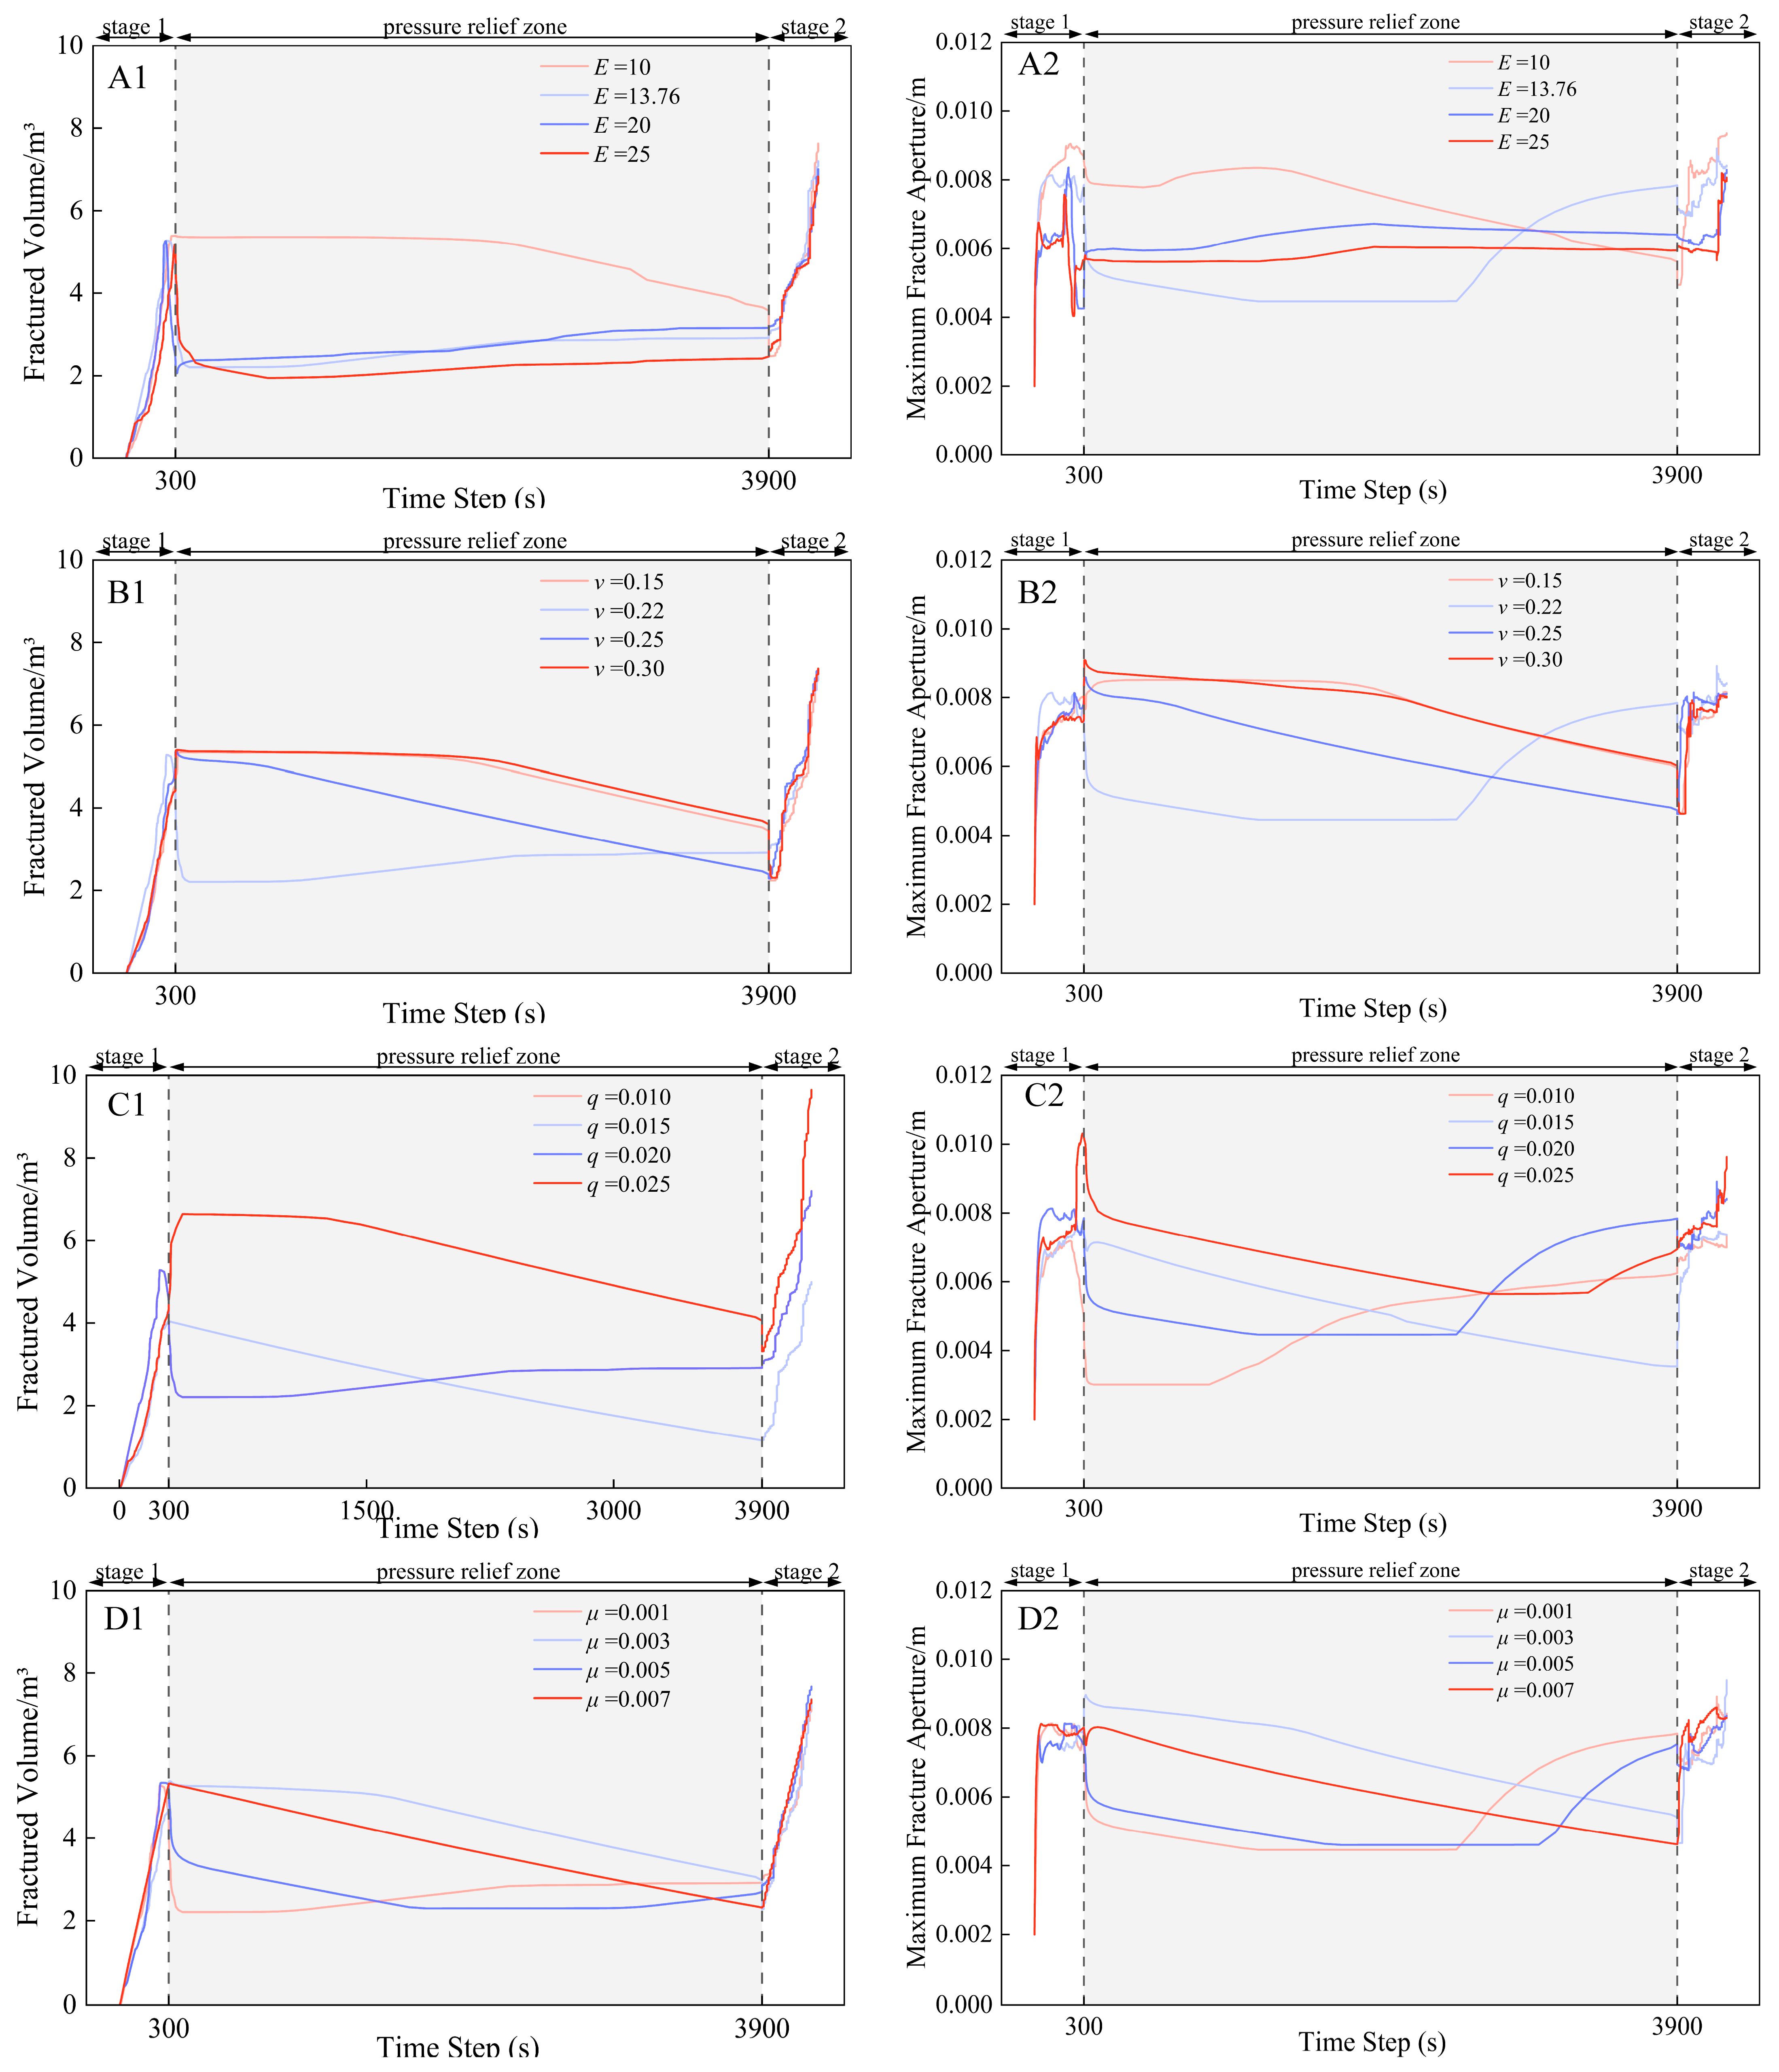
Figure 8 shows the temporal variations of fractured volume and maximum fracture width during segmented hydraulic fracturing under different parameter conditions. Detailed quantitative analyses are presented in the subsequent subsections.

4.2.1. Effect of Elastic Modulus on Fracture Morphology and Volumetric Evolution

As shown in Figure 8(A1,A2), low elastic modulus promotes rapid fracture opening and volumetric growth during Fracturing Stage 1, with a greater tendency for branching. In contrast, high-modulus rock constrains fracture aperture and slows volumetric expansion. During depressurization, fractures in high-modulus rock close rapidly due to elastic recovery, leading to a marked reduction in fractured volume, whereas low-modulus rock retains a larger volume because of delayed closure. In Fracturing Stage 2, fracture propagation remains more active in low-modulus rock but is strongly restricted under high-modulus conditions. Overall, increasing elastic modulus suppresses fracture opening and volumetric growth.
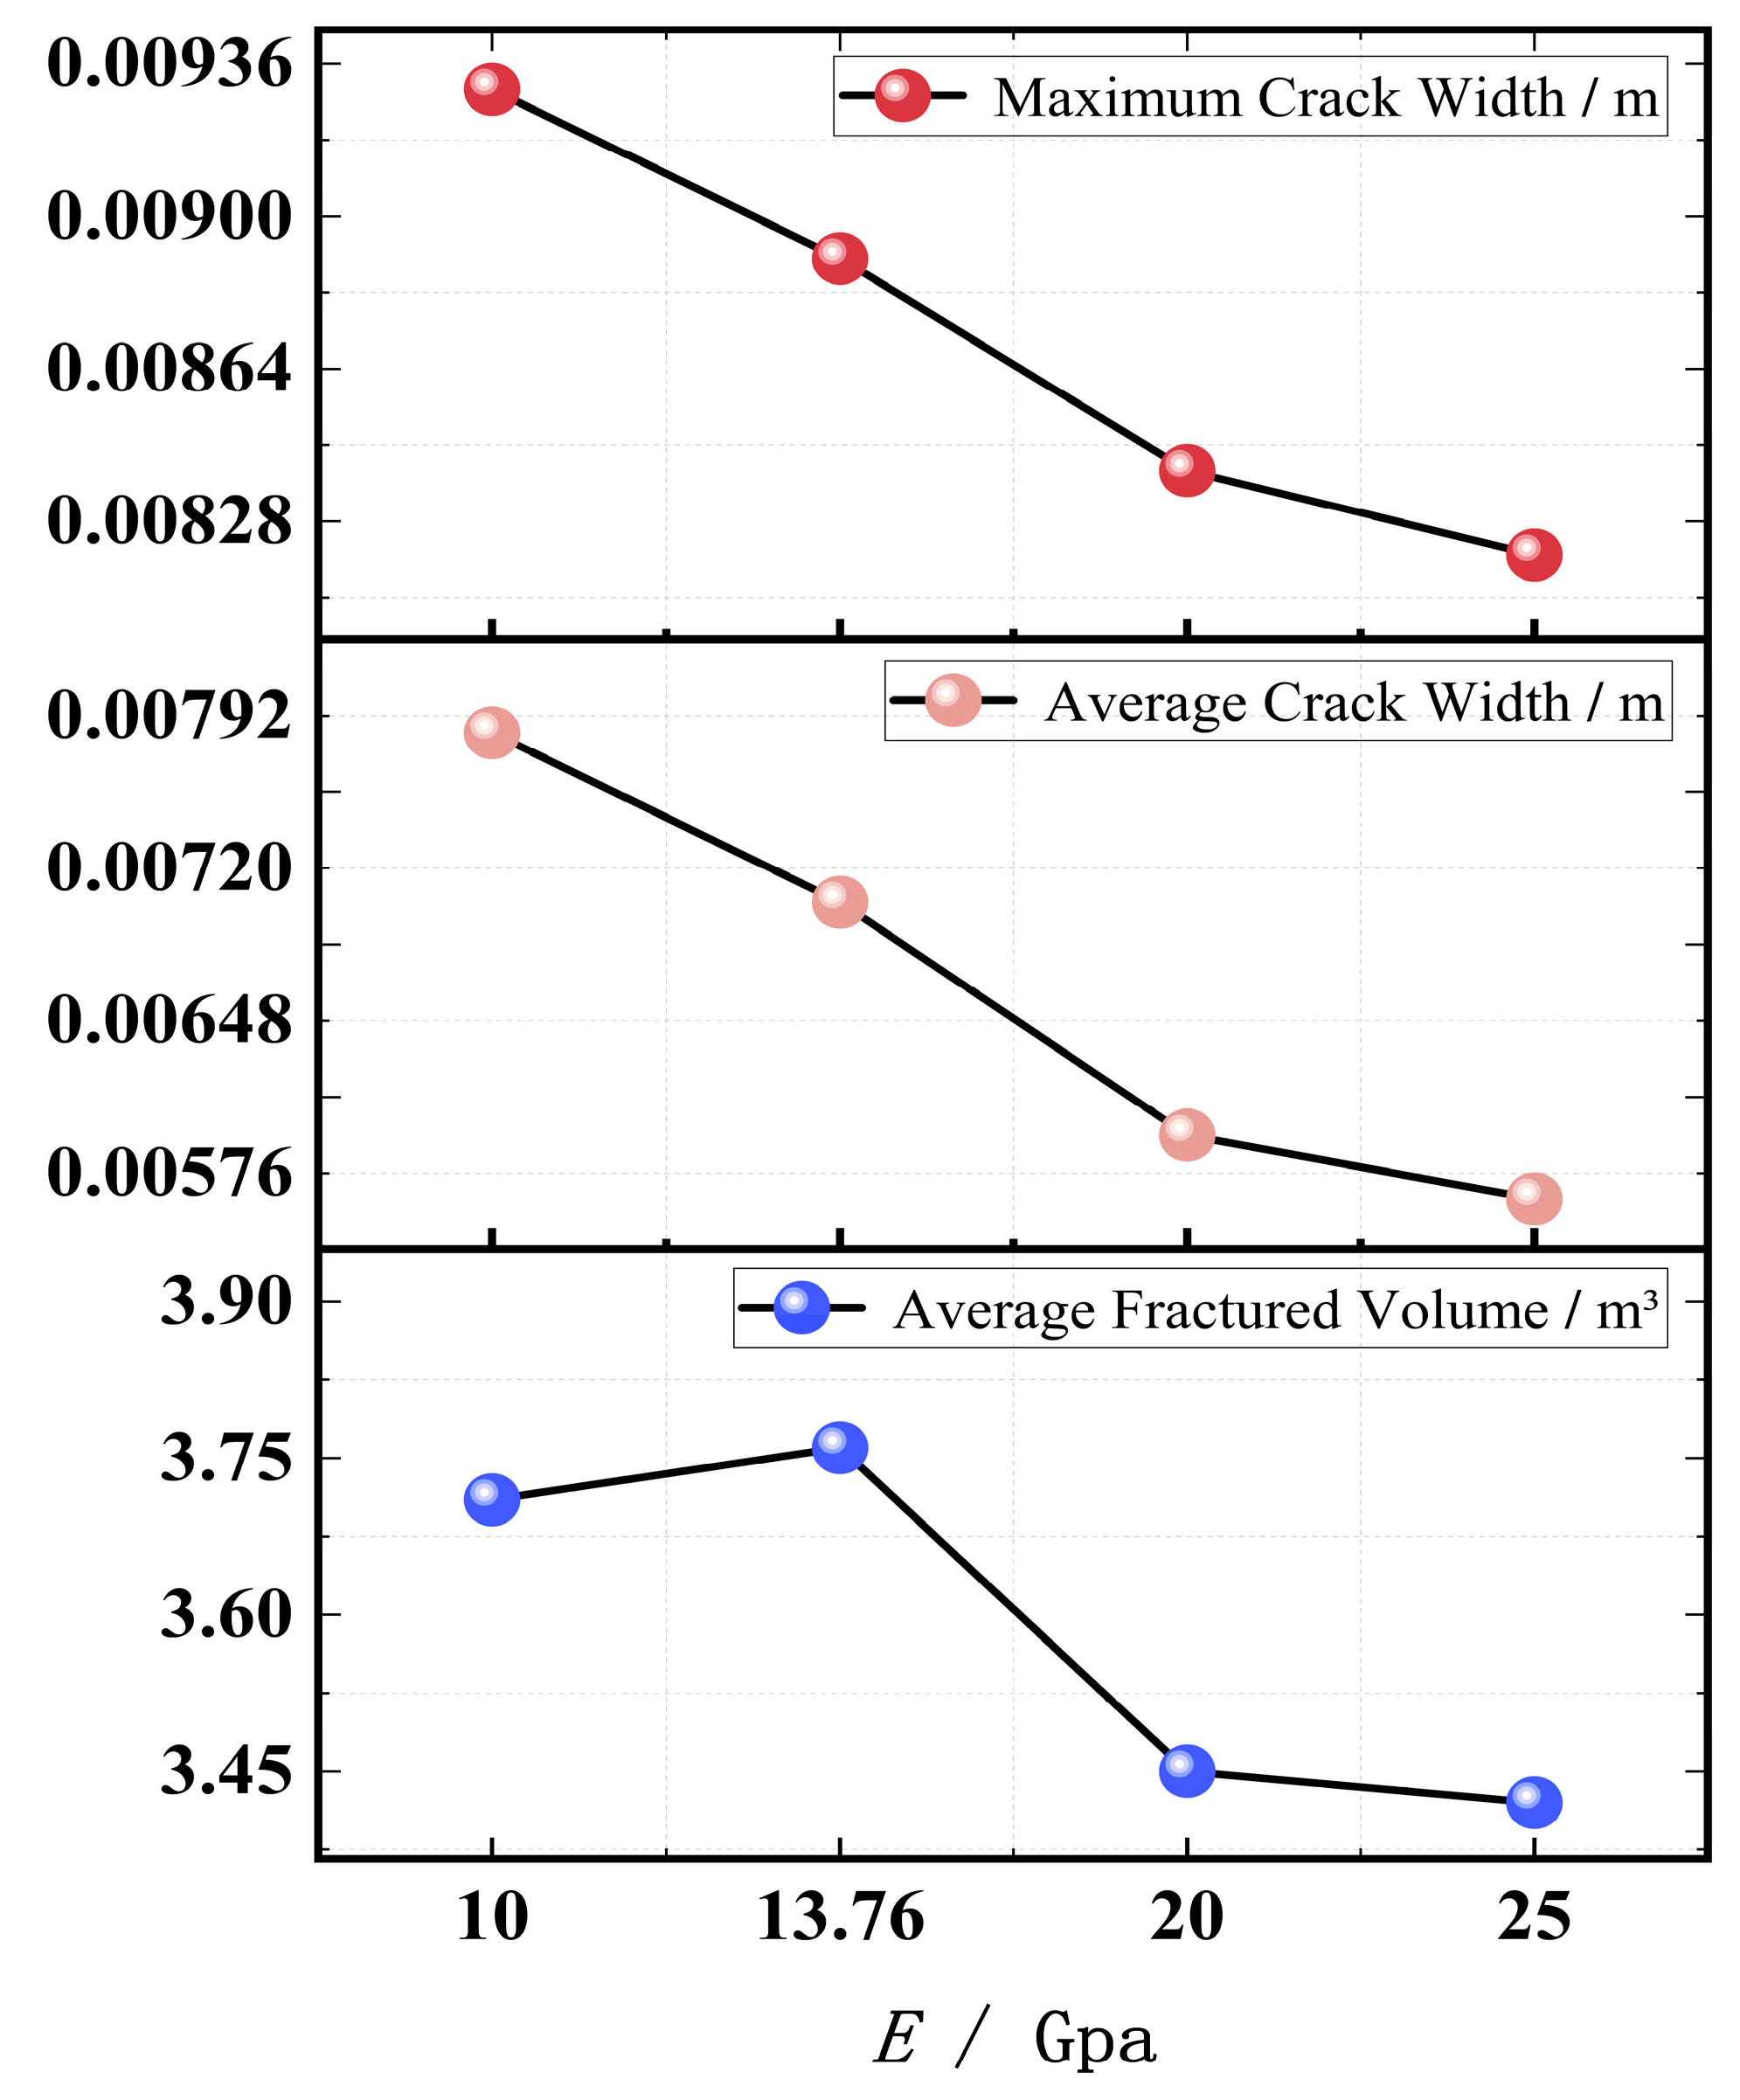
As shown in Figure 9, when the elastic modulus increases from 10 GPa to 25 GPa, the average fractured volume decreases from 3.71 to 3.42, and the average fracture width decreases from 0.0082 m to 0.0060 m (a reduction of approximately 26.8%). The maximum fracture width also declines from 0.0093 m to 0.0082 m (about 12%).
Within the investigated parameter range, increasing elastic modulus corresponds to reduced fracture opening and lower fractured volume, indicating a negative correlation between rock stiffness and fracture development capacity. When E ≤ 13.76 GPa, fractured volume shows a slight increase, whereas for E ≥ 20 GPa, both fracture width and fractured volume decrease, reflecting more constrained fracture propagation.
It should be noted that within the low elastic modulus range, increased rock compliance allows the same injected energy to more readily produce effective fracture opening and damage accumulation along fracture surfaces, resulting in more developed fracture propagation. As the elastic modulus increases further, elastic constraint is rapidly enhanced, suppressing fracture aperture and process-zone growth and thereby limiting the increase in fractured volume. Overall, rocks with low to medium elastic modulus combine favorable deformability with structural stability, representing the optimal range for sufficient fracture propagation and efficient volumetric accumulation.

4.2.2. Effect of Poisson’s Ratio on Fracture Morphology and Volumetric Evolution

As shown in Figure 8(B1,B2), increasing Poisson’s ratio promotes lateral deformation, leading to wider fracture openings, faster volumetric growth, and higher volume retention after depressurization. In contrast, a low Poisson’s ratio results in narrower fractures and rapid closure. A moderate Poisson’s ratio provides the most stable propagation and volumetric expansion, whereas excessively high values may induce stress diffusion and reduce fracture stability.
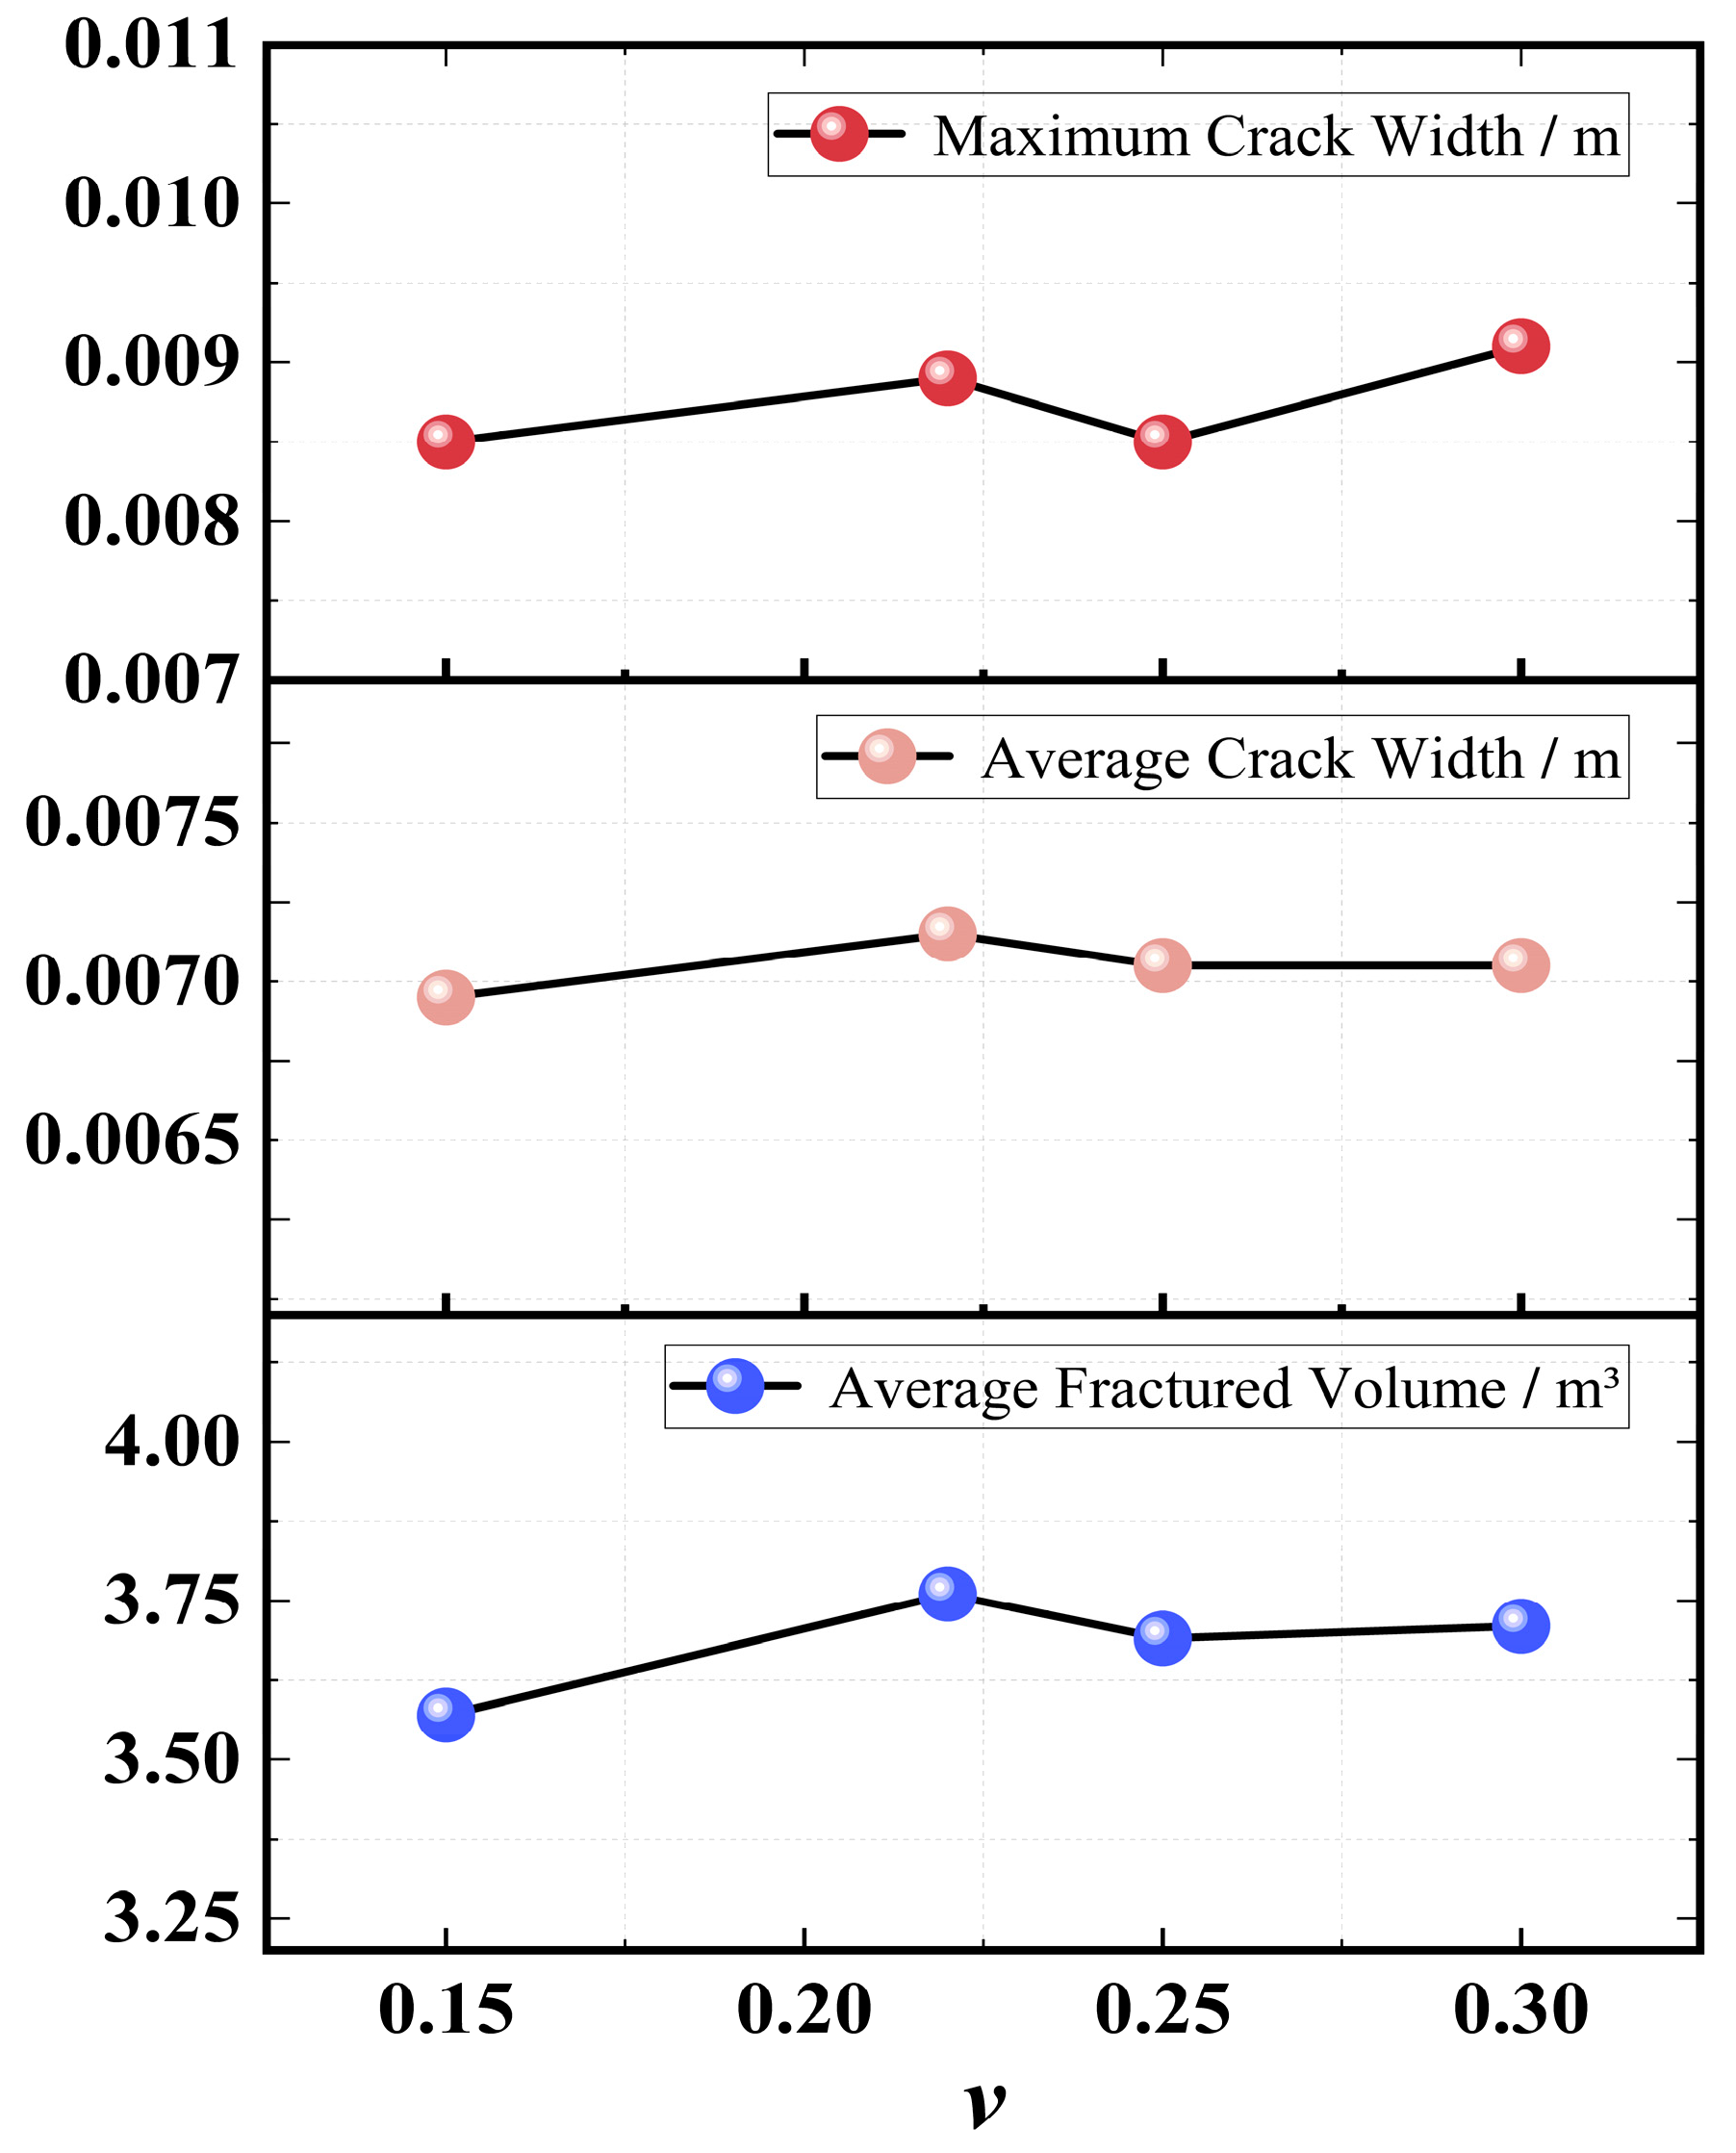
As shown in Figure 10, when Poisson’s ratio increases from 0.15 to 0.30, the average fractured volume first increases and then stabilizes (3.57 → 3.76 → 3.69 → 3.71). Both the average and maximum fracture widths show slight increases, remaining within 0.0073–0.0074 m and 0.0085–0.0091 m, respectively.
Within the investigated range, a moderate Poisson’s ratio (ν ≈ 0.22–0.25) corresponds to relatively higher fractured volume and stable fracture opening, whereas further increases in ν do not produce additional volumetric growth, indicating a tendency toward stabilization rather than continuous enhancement of fracture development.
An increase in Poisson’s ratio enhances the coupling between axial and lateral deformation of the rock mass, leading to a more pronounced lateral strain response of the surrounding rock during fracture opening. Consequently, fracture opening transitions from localized concentration to coordinated regional expansion, forming a wider fracture opening zone and accelerating the growth of fractured volume. Meanwhile, enhanced lateral deformation induces a broader extent of damage and irreversible structural adjustment around the fractures, allowing relatively high residual fracture aperture and fractured volume to be retained after depressurization.

4.2.3. Effect of Injection Rate on Fracture Width and Fractured Volume

As shown in Figure 8(C1,C2), both fracture width and fractured volume increase significantly with injection rate. Under low injection rates, fracture opening is slow and volumetric growth is limited, whereas injection rates in the range of 0.020–0.025 m3·s−1 enable rapid fracture propagation within a short time and promote branching, resulting in a sharp increase in fractured volume. During the depressurization stage, fractures close rapidly under low injection rates, whereas under high injection rates the fractured volume decreases more slowly due to the supporting effect of retained fluid within the fractures. In Fracturing Stage 2, fracture width and fractured volume under high injection rates increase rapidly and then gradually stabilize, suggesting that the system approaches a near-saturation state of energy utilization.
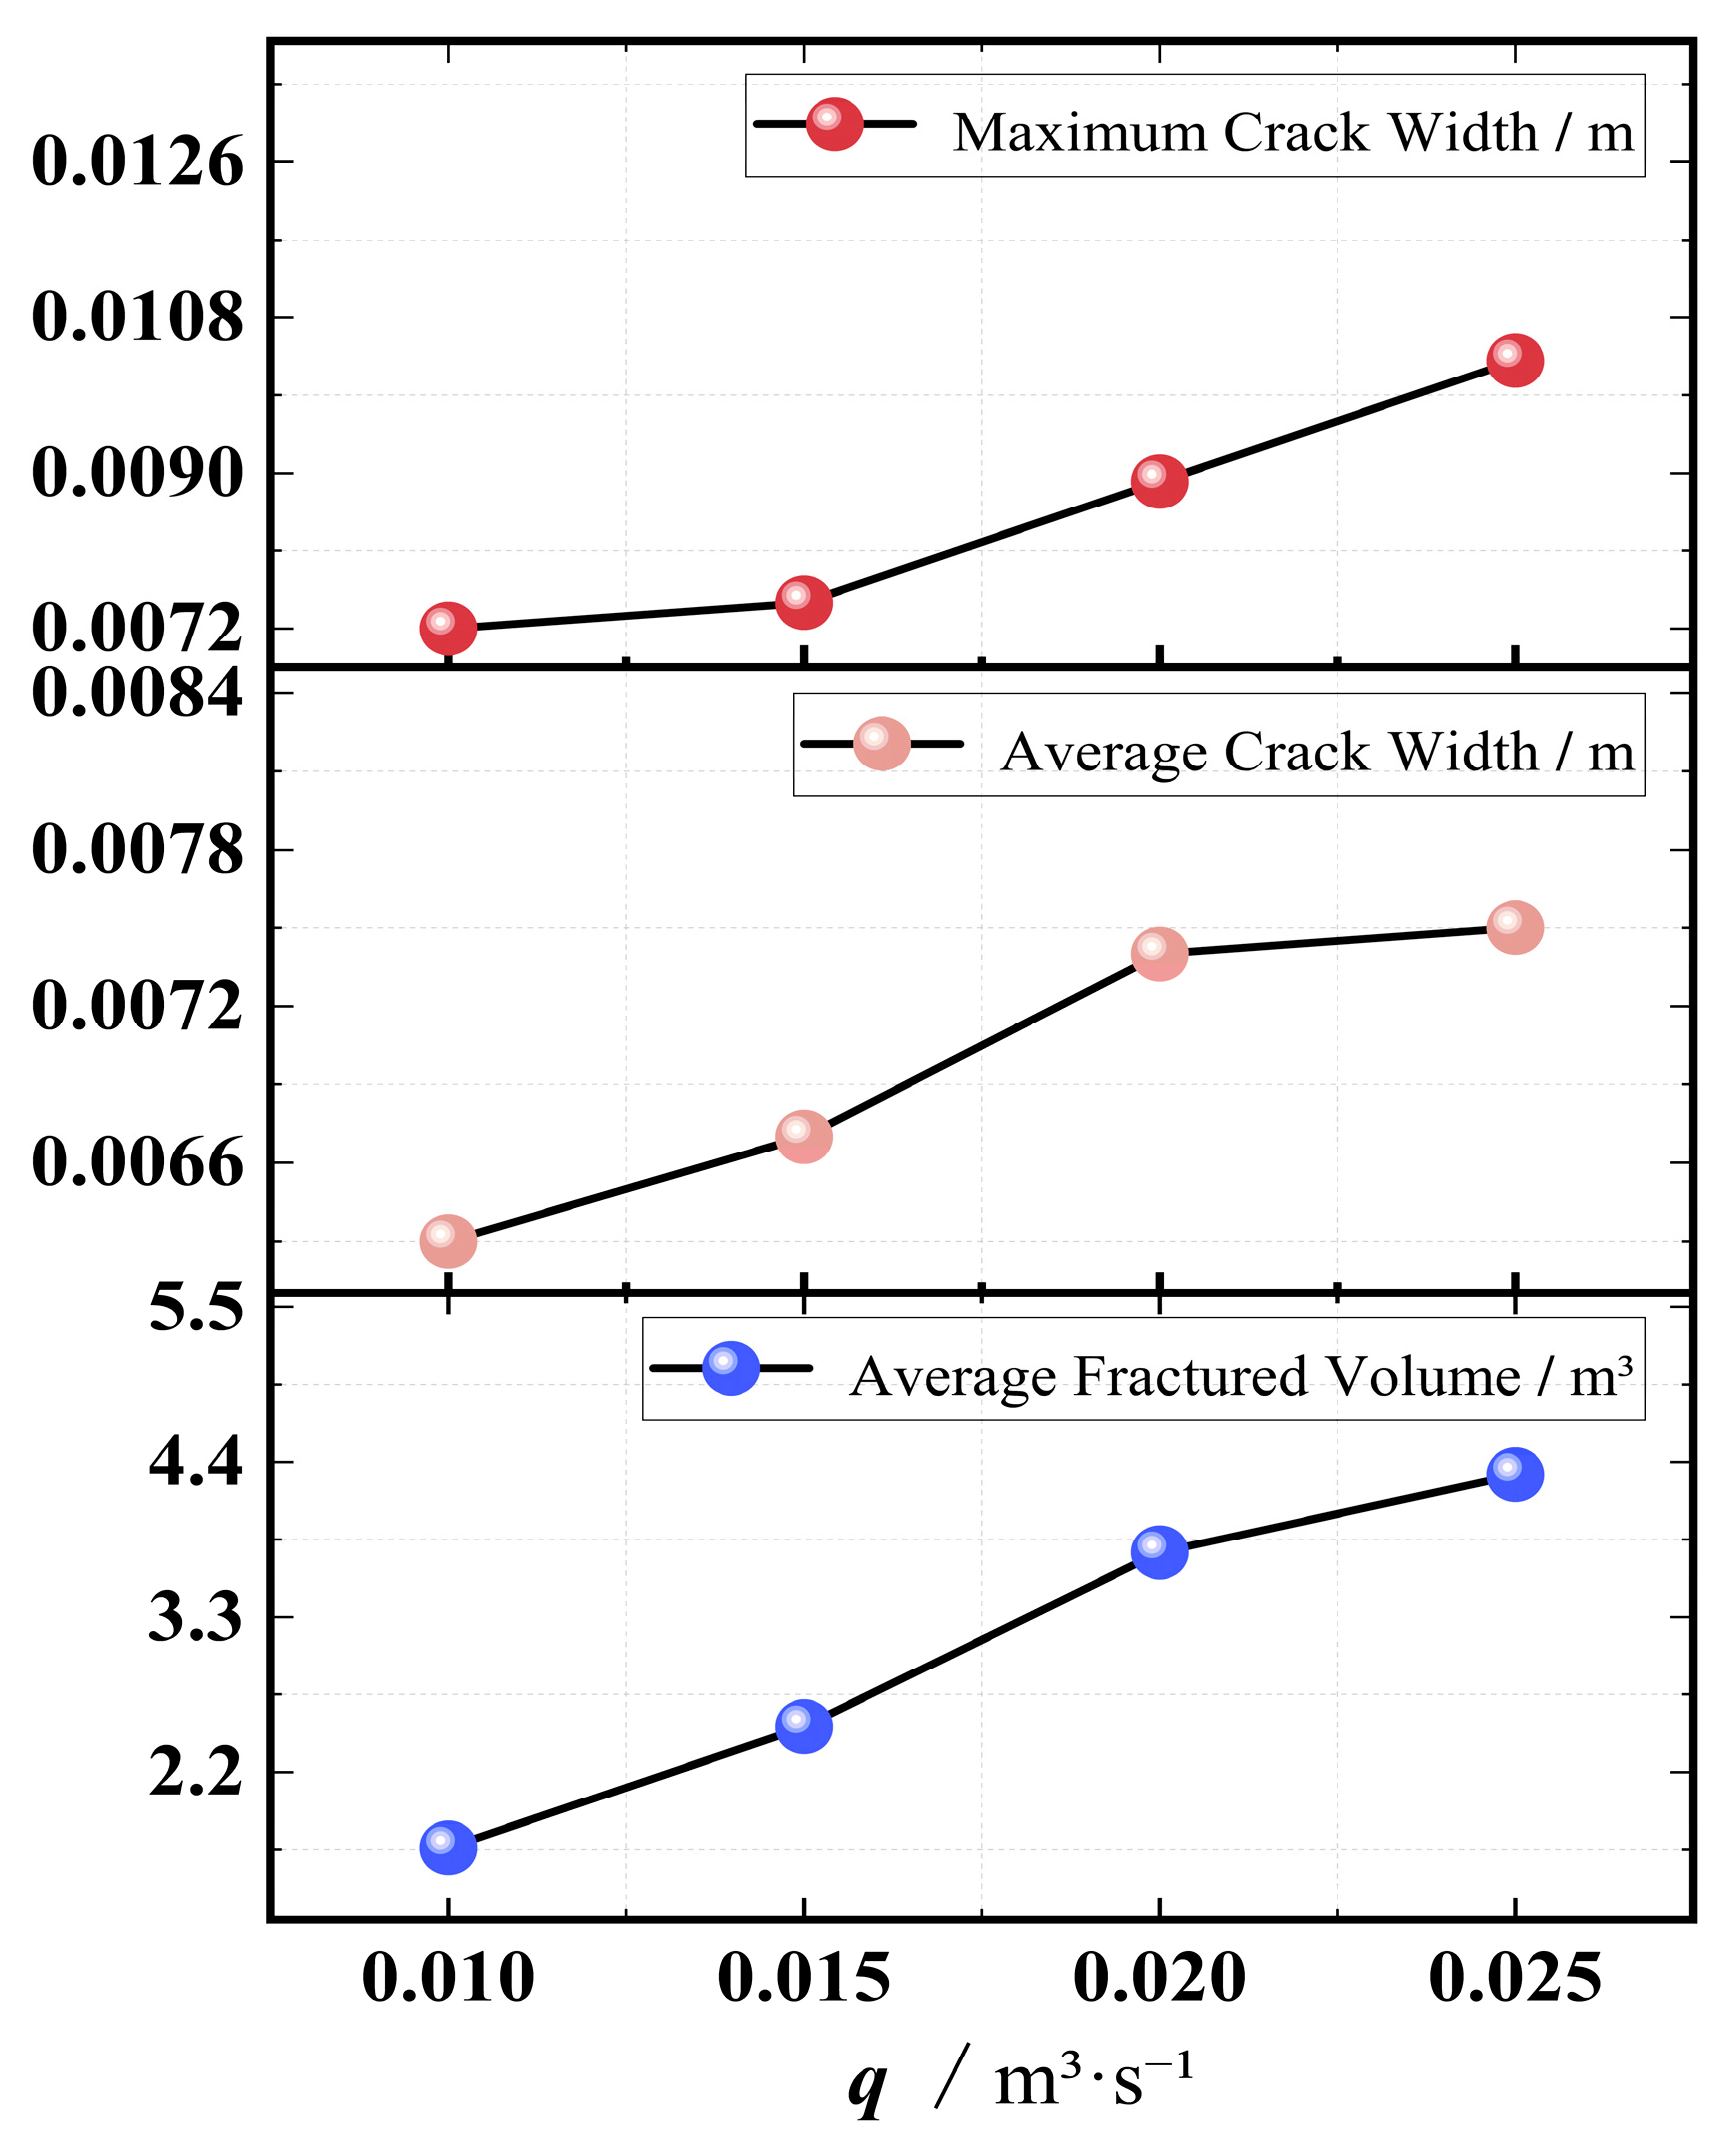
As shown in Figure 11, when the injection rate increases from 0.01 m3/s to 0.025 m3/s, the average fractured volume increases from 1.66 to 4.31 (approximately 160%). The average fracture width increases from 0.0063 m to 0.0075 m (about 19%). Within the investigated range, fractured volume increases markedly with injection rate, while fracture width exhibits an increasing–stabilizing trend. The most notable growth in fracture width occurs between 0.015 and 0.02 m3/s, beyond which further increases in injection rate result in limited additional widening.
The maximum fracture width increases from 0.0072 m to 0.0103 m, corresponding to a growth of approximately 43.06%. It exhibits an approximately linear relationship with injection rate and shows a larger variation amplitude than the average width, indicating that the fracture-tip opening is particularly sensitive to injection rate.
As the injection rate increases, fluid pressure builds up more rapidly at the fracture front, enhancing the driving force for crack propagation and promoting localized aperture enlargement at the tip. Consequently, higher injection rates not only increase overall fractured volume but also intensify tip-dominated opening behavior.
Together with the growth in average fracture width and fractured volume, these results indicate a consistent upward trend of all three indicators within the investigated range, reflecting enhanced fracture propagation capacity under higher injection rates.

4.2.4. Effect of Fluid Viscosity on the Stability of Fracture Propagation

As shown in Figure 8(D1,D2), low-viscosity fluids cause fractures to open rapidly during Fracturing Stage 1 and lead to a relatively fast increase in fractured volume; however, the propagation process exhibits large fluctuations and insufficient stability.
With increasing fluid viscosity, although the fracture opening rate decreases, the fracture morphology becomes more uniform, the growth of fractured volume is smoother, and a higher volume retention is achieved during the depressurization stage. After entering Fracturing Stage 2, high-viscosity fluids promote more stable re-propagation of fractures, exhibiting stronger energy dissipation and fracture stabilization effects.
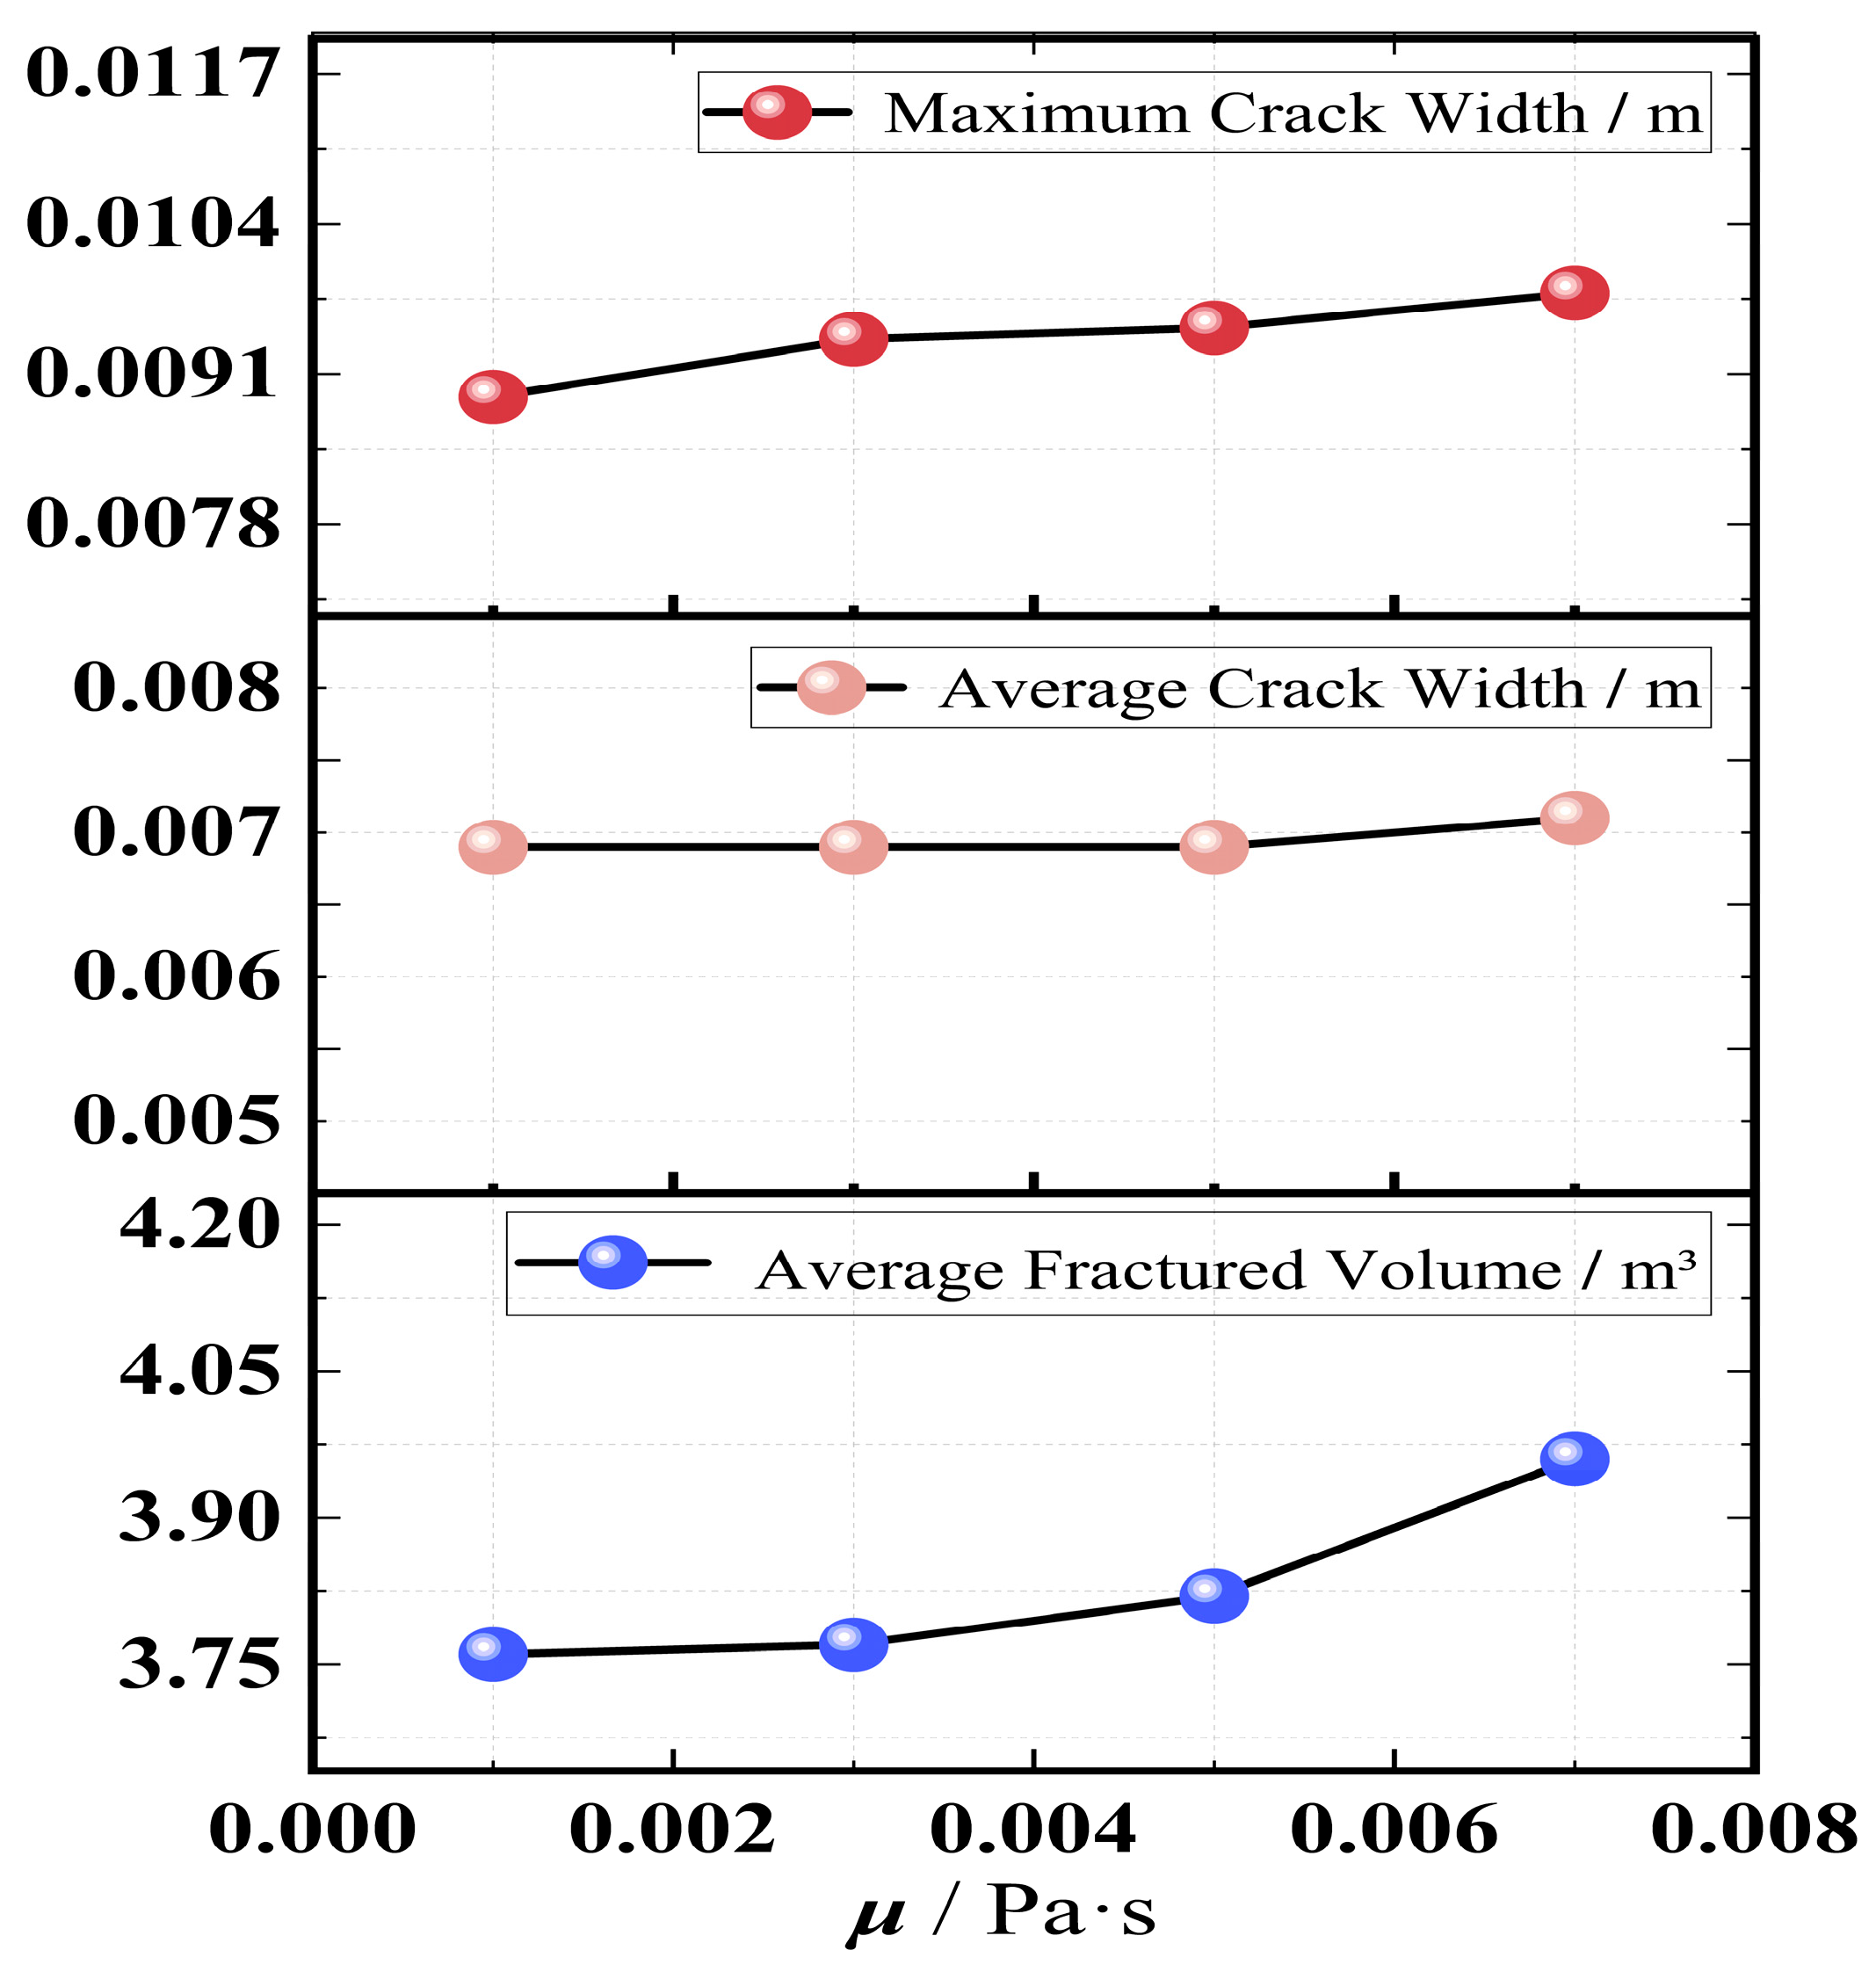
As shown in Figure 12, when the fluid viscosity varies within the range of 0.001–0.007 Pa·s, the average fractured volume increases from 3.76 to 3.96, while the average fracture width increases slightly from 0.0074 m to 0.0076 m. The limited variation in average fracture width indicates that the overall fracture aperture remains relatively stable. In contrast, the maximum fracture width increases from 0.0089 m to 0.0098 m, with a relatively notable increase of approximately 10%, suggesting that high-viscosity fluids enhance pressure support at the fracture tip. Overall, all indicators exhibit a gradual upward trend with increasing viscosity.
In summary, the mechanical properties of the rock mass and the fluid parameters jointly govern fracture initiation, propagation, and the evolution of fractured volume. Low elastic modulus and moderately higher Poisson’s ratio enhance rock deformability, allowing more sufficient fracture opening, rapid volumetric growth, and higher volume retention. In contrast, a high elastic modulus or an excessively high Poisson’s ratio may reduce fracture stability due to increased stiffness or stress diffusion. Regarding fluid parameters, increasing the injection rate below a critical threshold strengthens fracture-tip pressure and stress concentration, thereby promoting fracture connectivity, whereas exceeding this threshold causes the stress field to transition toward diffusion. Increasing fluid viscosity, on the other hand, weakens stress concentration but improves propagation stability, resulting in a more continuous and stable growth of fractured volume.
Within the investigated parameter ranges, the combination of low to medium elastic modulus (E ≈ 13–18 GPa) and moderate Poisson’s ratio (ν ≈ 0.22–0.25), together with medium to high injection rates and medium- to high-viscosity fracturing fluids (q ≈ 0.02–0.025 m3·s−1, μ ≈ 0.007–0.009 Pa·s), tends to promote sufficient fracture opening and relatively high fractured-volume retention. These trends suggest a balanced interaction between fracture propagation efficiency and stability under the examined conditions. It should be noted that these observations are limited to the parameter combinations investigated in this study, and fracture behavior under other parameter configurations requires further analysis.

5. Segmented Hydraulic Fracturing Pressure-Relief and Rockburst-Control Technology for Thick and Hard Roofs

Based on the numerical simulation results obtained in this study, rock masses characterized by low to medium elastic modulus and moderate Poisson’s ratio (E ≈ 13–18 GPa, ν ≈ 0.22–0.25) exhibit relatively favorable deformation compatibility and stress redistribution capacity within the investigated parameter ranges. When combined with medium to high injection rates and medium- to high-viscosity fracturing fluids (q ≈ 0.02–0.025 m3·s−1, μ ≈ 0.007–0.009 Pa·s), the simulations indicate that fractures tend to achieve sufficient opening and maintain comparatively stable propagation behavior under the modeled conditions.
According to the roof and floor lithological report of the Haishiwan Coal Mine, the elastic modulus and Poisson’s ratio of the 6125-1 working face fall within the parameter ranges examined in this study. This correspondence suggests that the geological conditions at the site are generally consistent with the mechanical conditions considered in the simulations. Therefore, the numerical results may provide a mechanistic reference for parameter optimization in the field application. However, it should be noted that the field validation presented herein focuses primarily on observable fracturing effectiveness rather than direct three-dimensional measurement of fracture morphology.

5.1. Hydraulic Fracturing Scheme

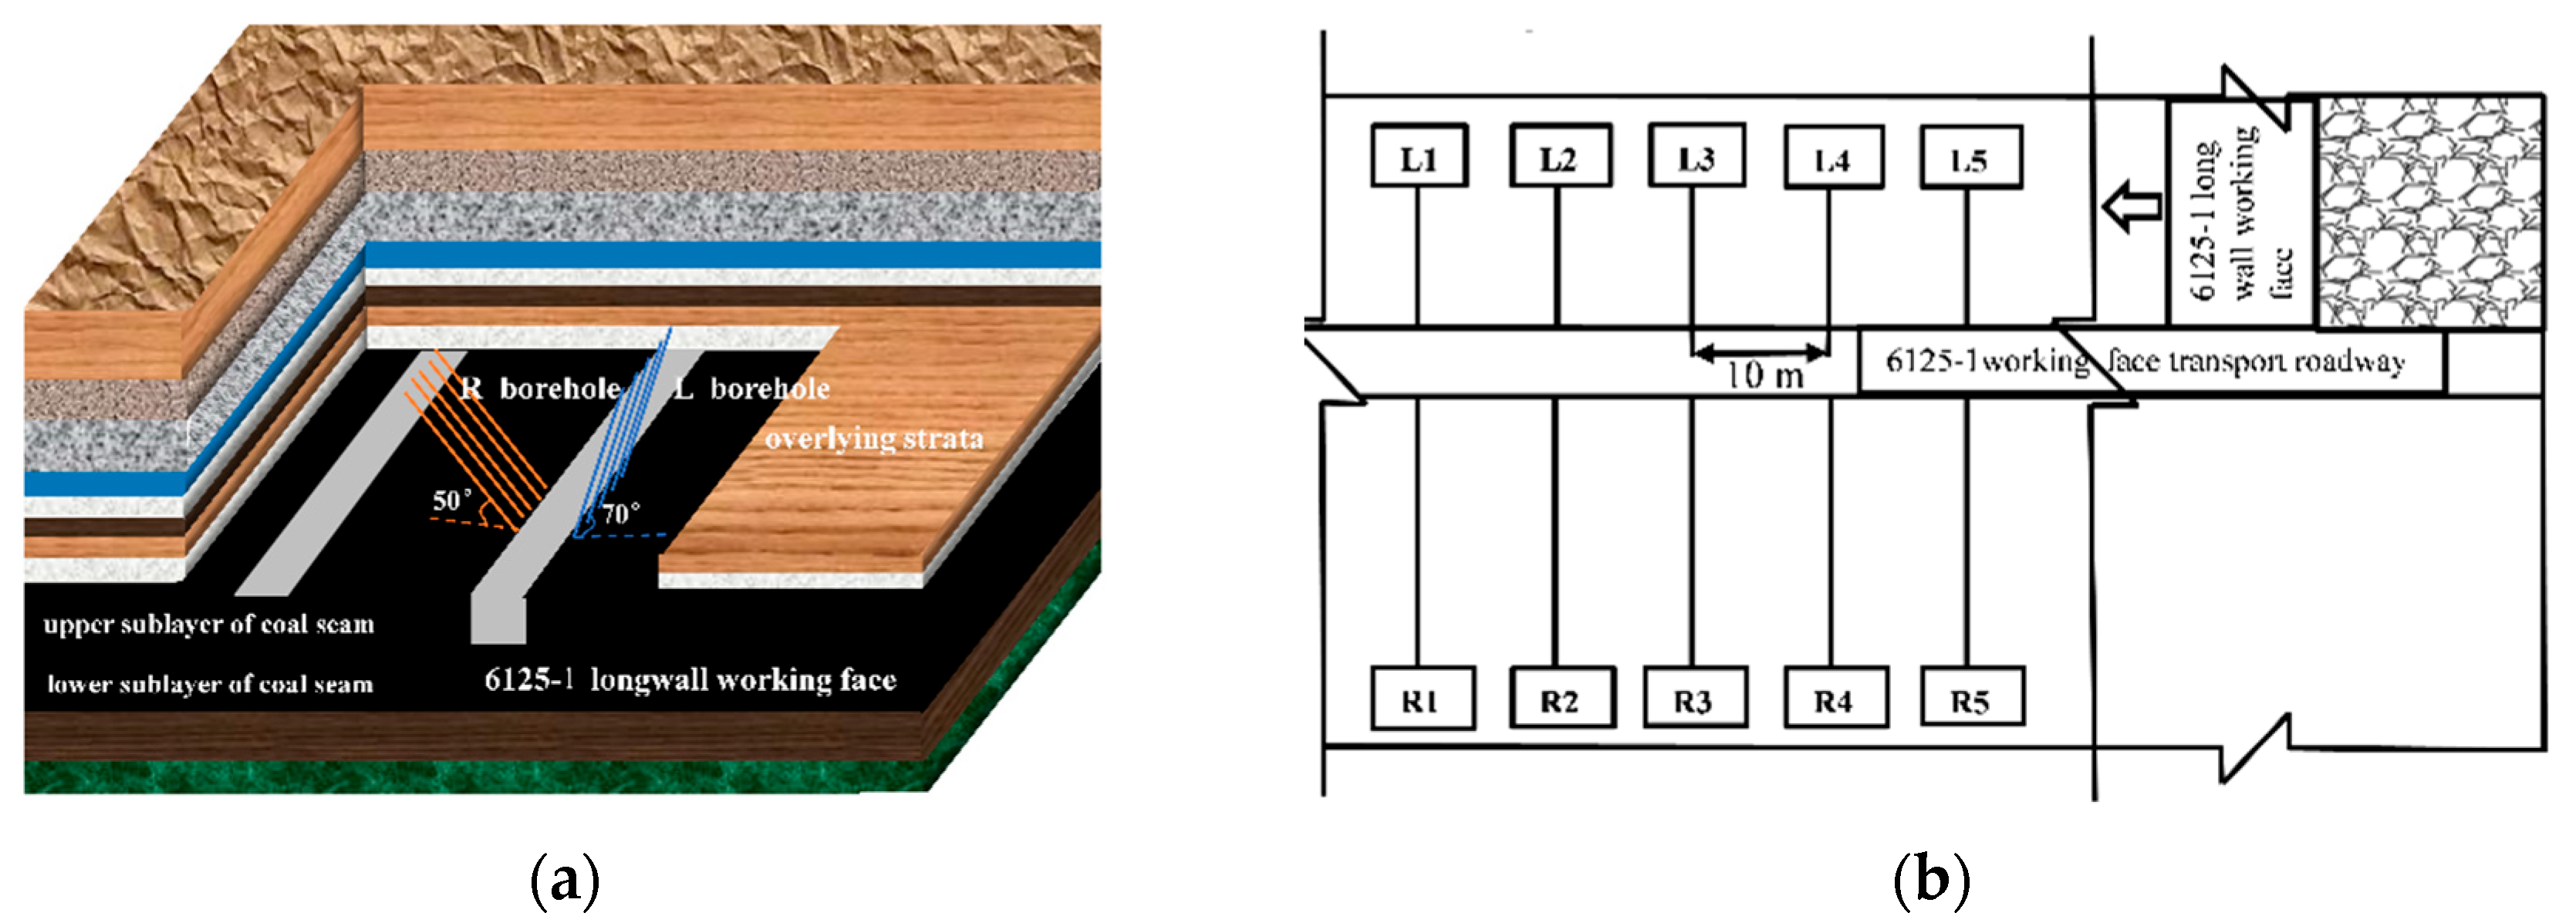
Pre-fracturing was carried out on the thick and hard roof above the working area along the transportation roadway of the 6125-1 working face. According to the occurrence position of the thick hard roof, the fracturing height was required to exceed 19.2 m. In this test, two types of boreholes, namely L-holes and R-holes, were arranged, as shown in Figure 13. The L-holes were drilled toward the working face at an upward inclination of 70°, while the R-holes were drilled toward the coal pillar side at an upward inclination of 50°. Both types of boreholes had a drilling depth of 30 m. The vertical height of the L-holes was 28.19 m, and that of the R-holes was 22.98 m. All boreholes had a uniform diameter of 70 mm. The three-dimensional spatial distribution of the boreholes is shown in Figure 13a.
The borehole spacing was required to ensure hydraulic fractures could interconnect between adjacent fracturing holes. Based on site-specific geological conditions and field experience, water outflow from neighboring boreholes could be observed when the spacing was approximately 10 m. Therefore, to ensure effective roof cutting and pressure relief, a borehole spacing of 10 m was adopted in this test. Segmented hydraulic fracturing was conducted sequentially from the borehole bottom toward the borehole mouth. The planar layout of the boreholes is shown in Figure 13b.
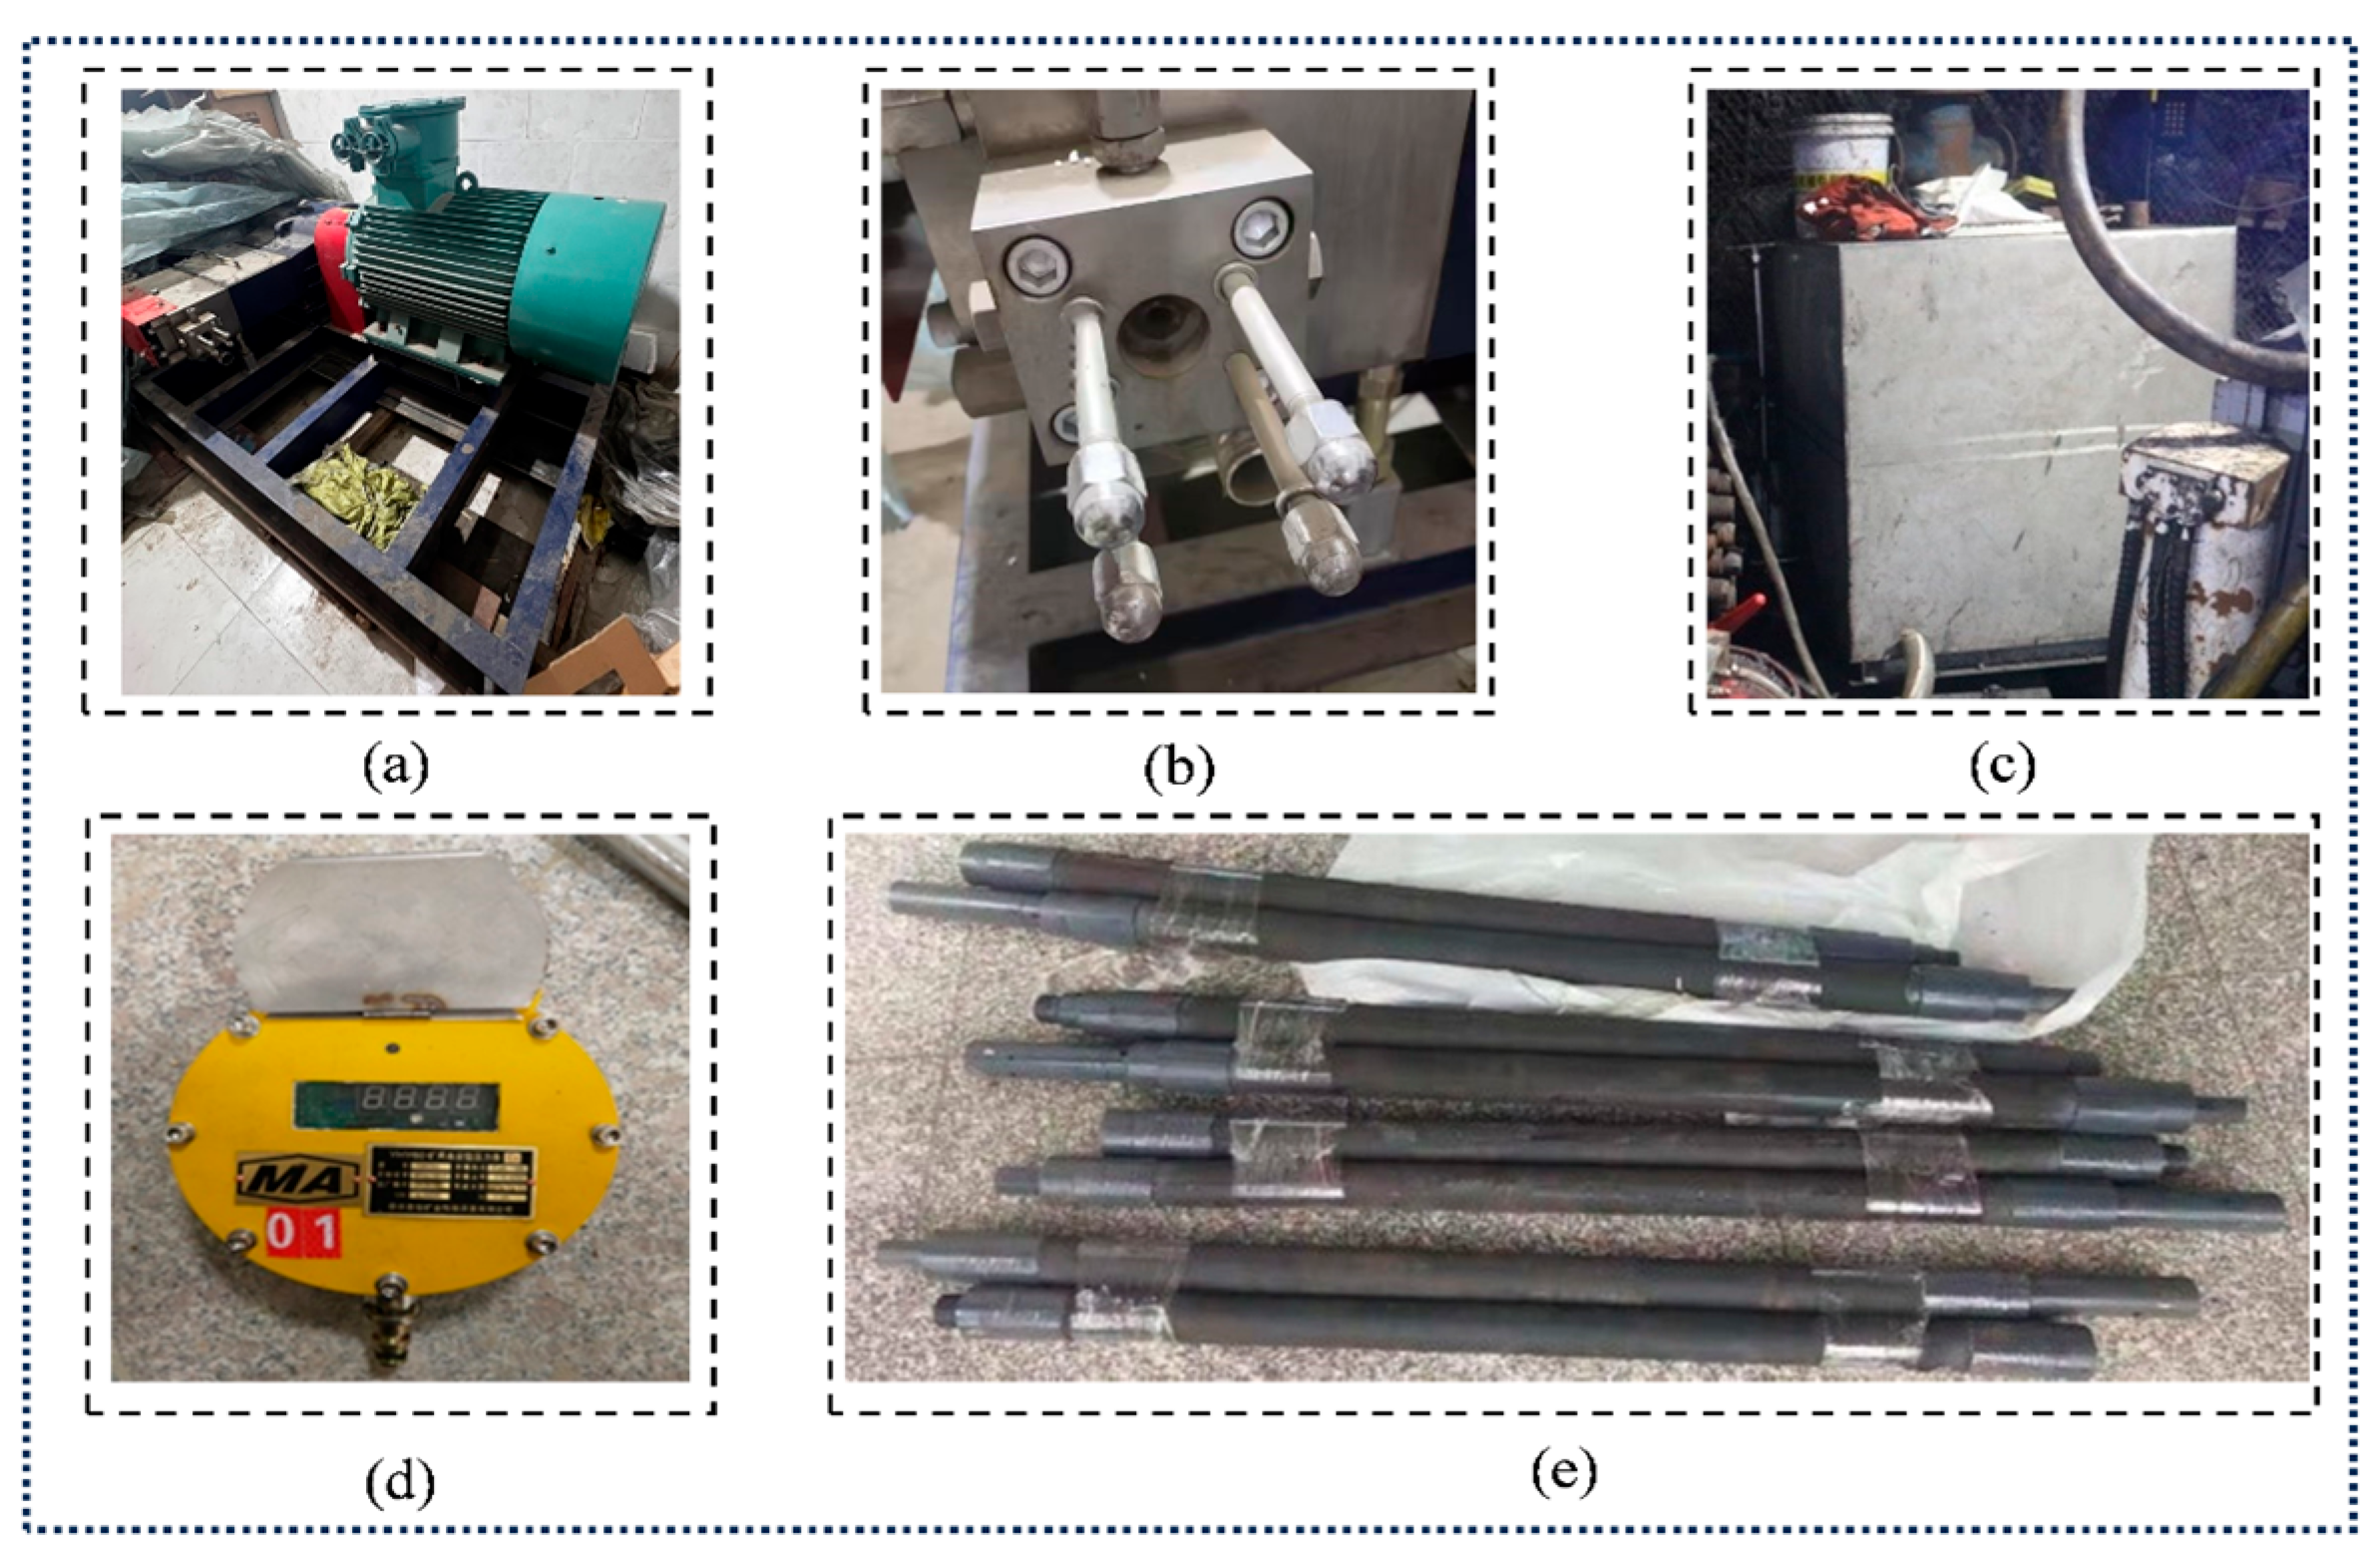
Considering roadway dimensions, construction environment, transportation conditions, and the target fracturing horizon, the main equipment used in this test included (a), (b), (c), (d), and (e), as shown in Figure 14.
A BZW40/50 high-pressure water injection pump was employed to conduct continuous hydraulic fracturing, with a 1500 L water tank providing a sustained water supply. The fracturing pressure was recorded and analyzed in real time using a YHY60 intrinsically safe water pressure monitoring instrument. The fracturing section of the borehole was effectively isolated by a 2.4 m straddle packer, allowing the pressure within the section to increase steadily. This system ensured continuity, high pressure, and controllability throughout the hydraulic fracturing process.

5.2. Fracturing Effect Analysis

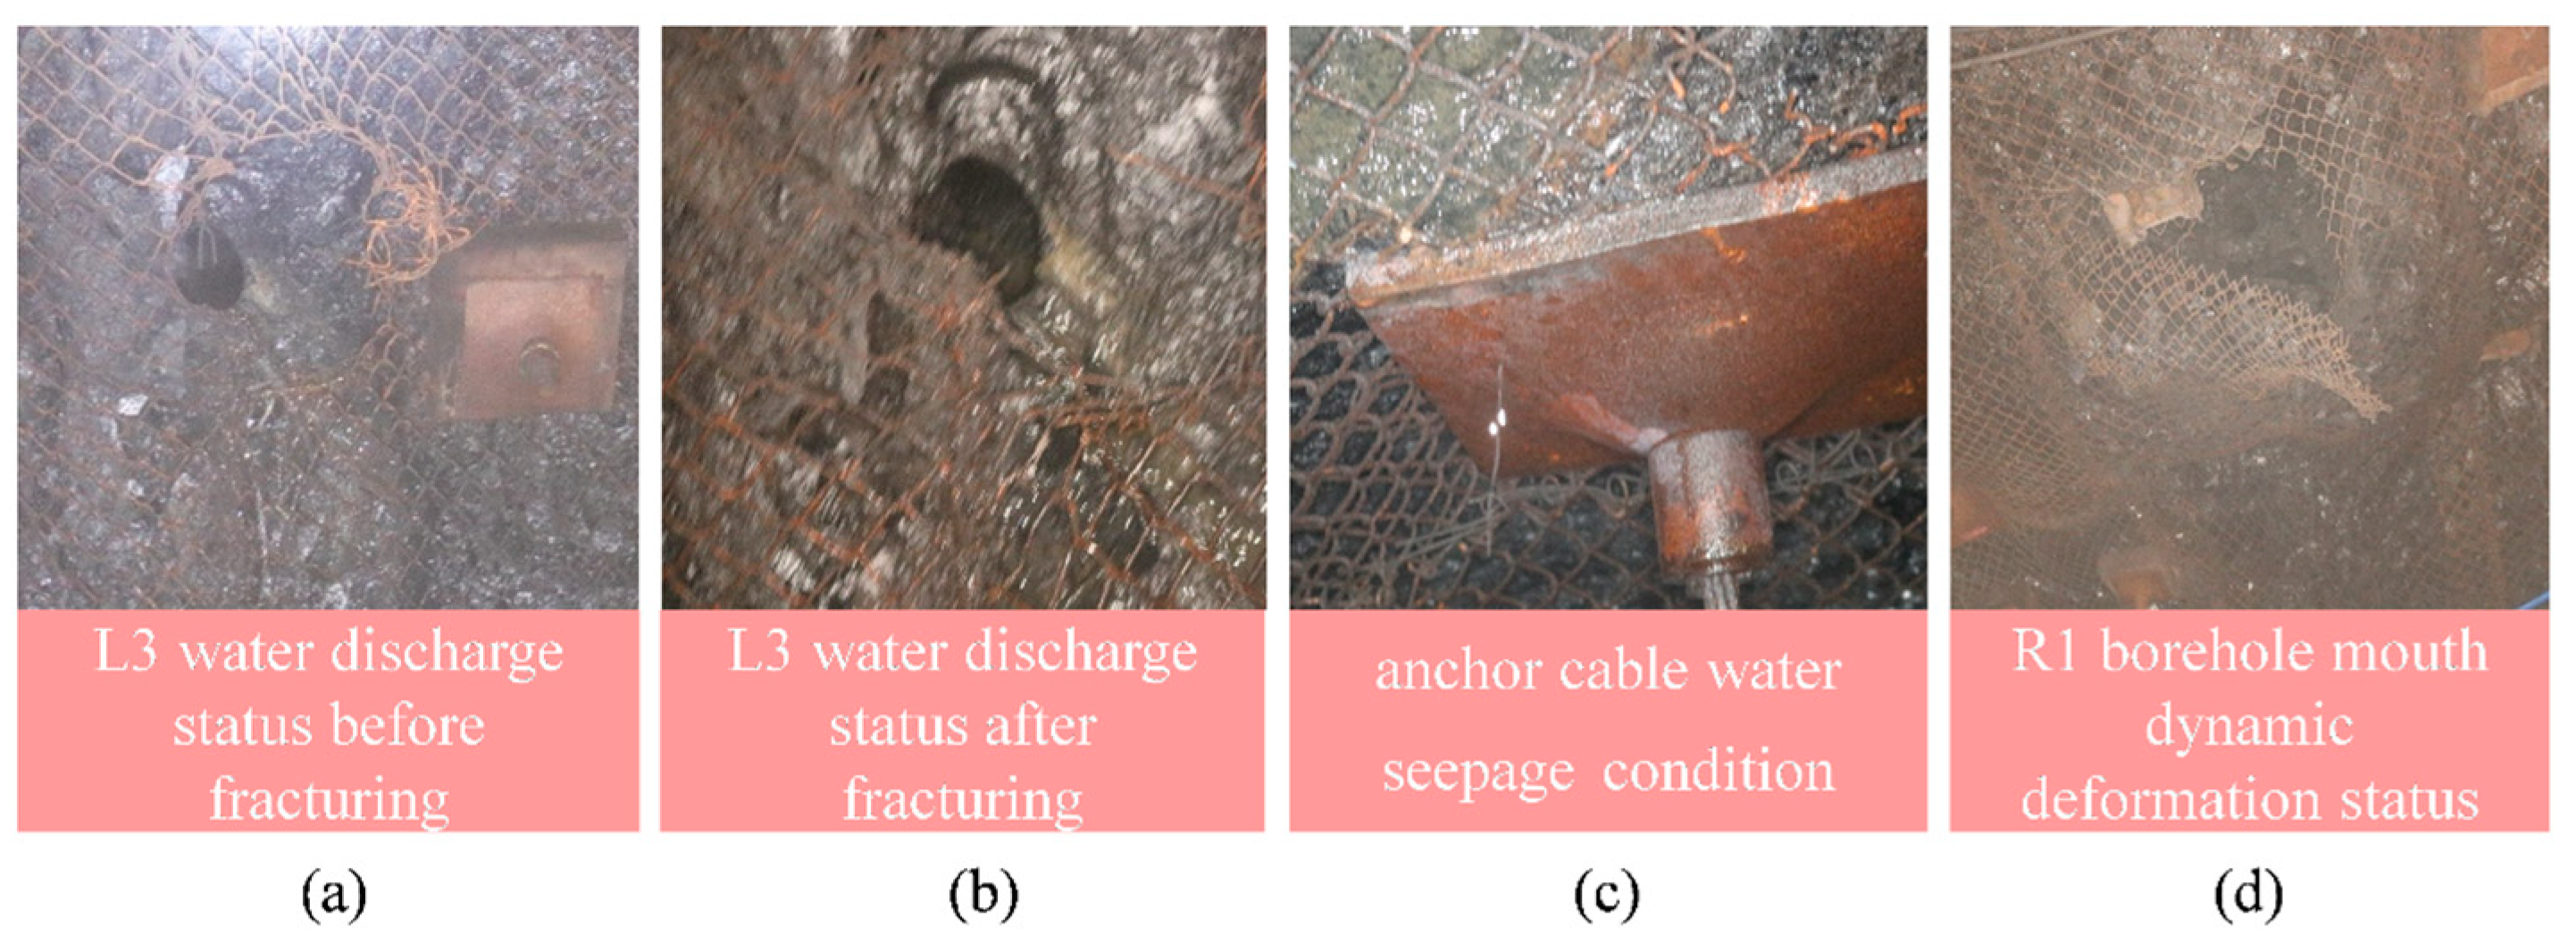
As shown in Figure 15, taking borehole L3 as an example, the surrounding area of L3 was confirmed to remain dry prior to hydraulic fracturing. As fracturing progressed, water outflow began to appear in borehole L3, and after a period of time, water dripping was also observed from the roof anchor cable holes near this borehole. During the fracturing of L3, a distinct muffled sound was generated from the roof, and dynamic deformation occurred at the collar of borehole R1. Similar water outflow phenomena were observed in adjacent boreholes during the fracturing of other holes. These observations indicate that the borehole spacing was appropriately designed, that hydraulic fractures mainly propagated radially from the boreholes with relatively large propagation distances, and that the integrity of the roof was effectively disrupted, thereby enhancing its caving capability.
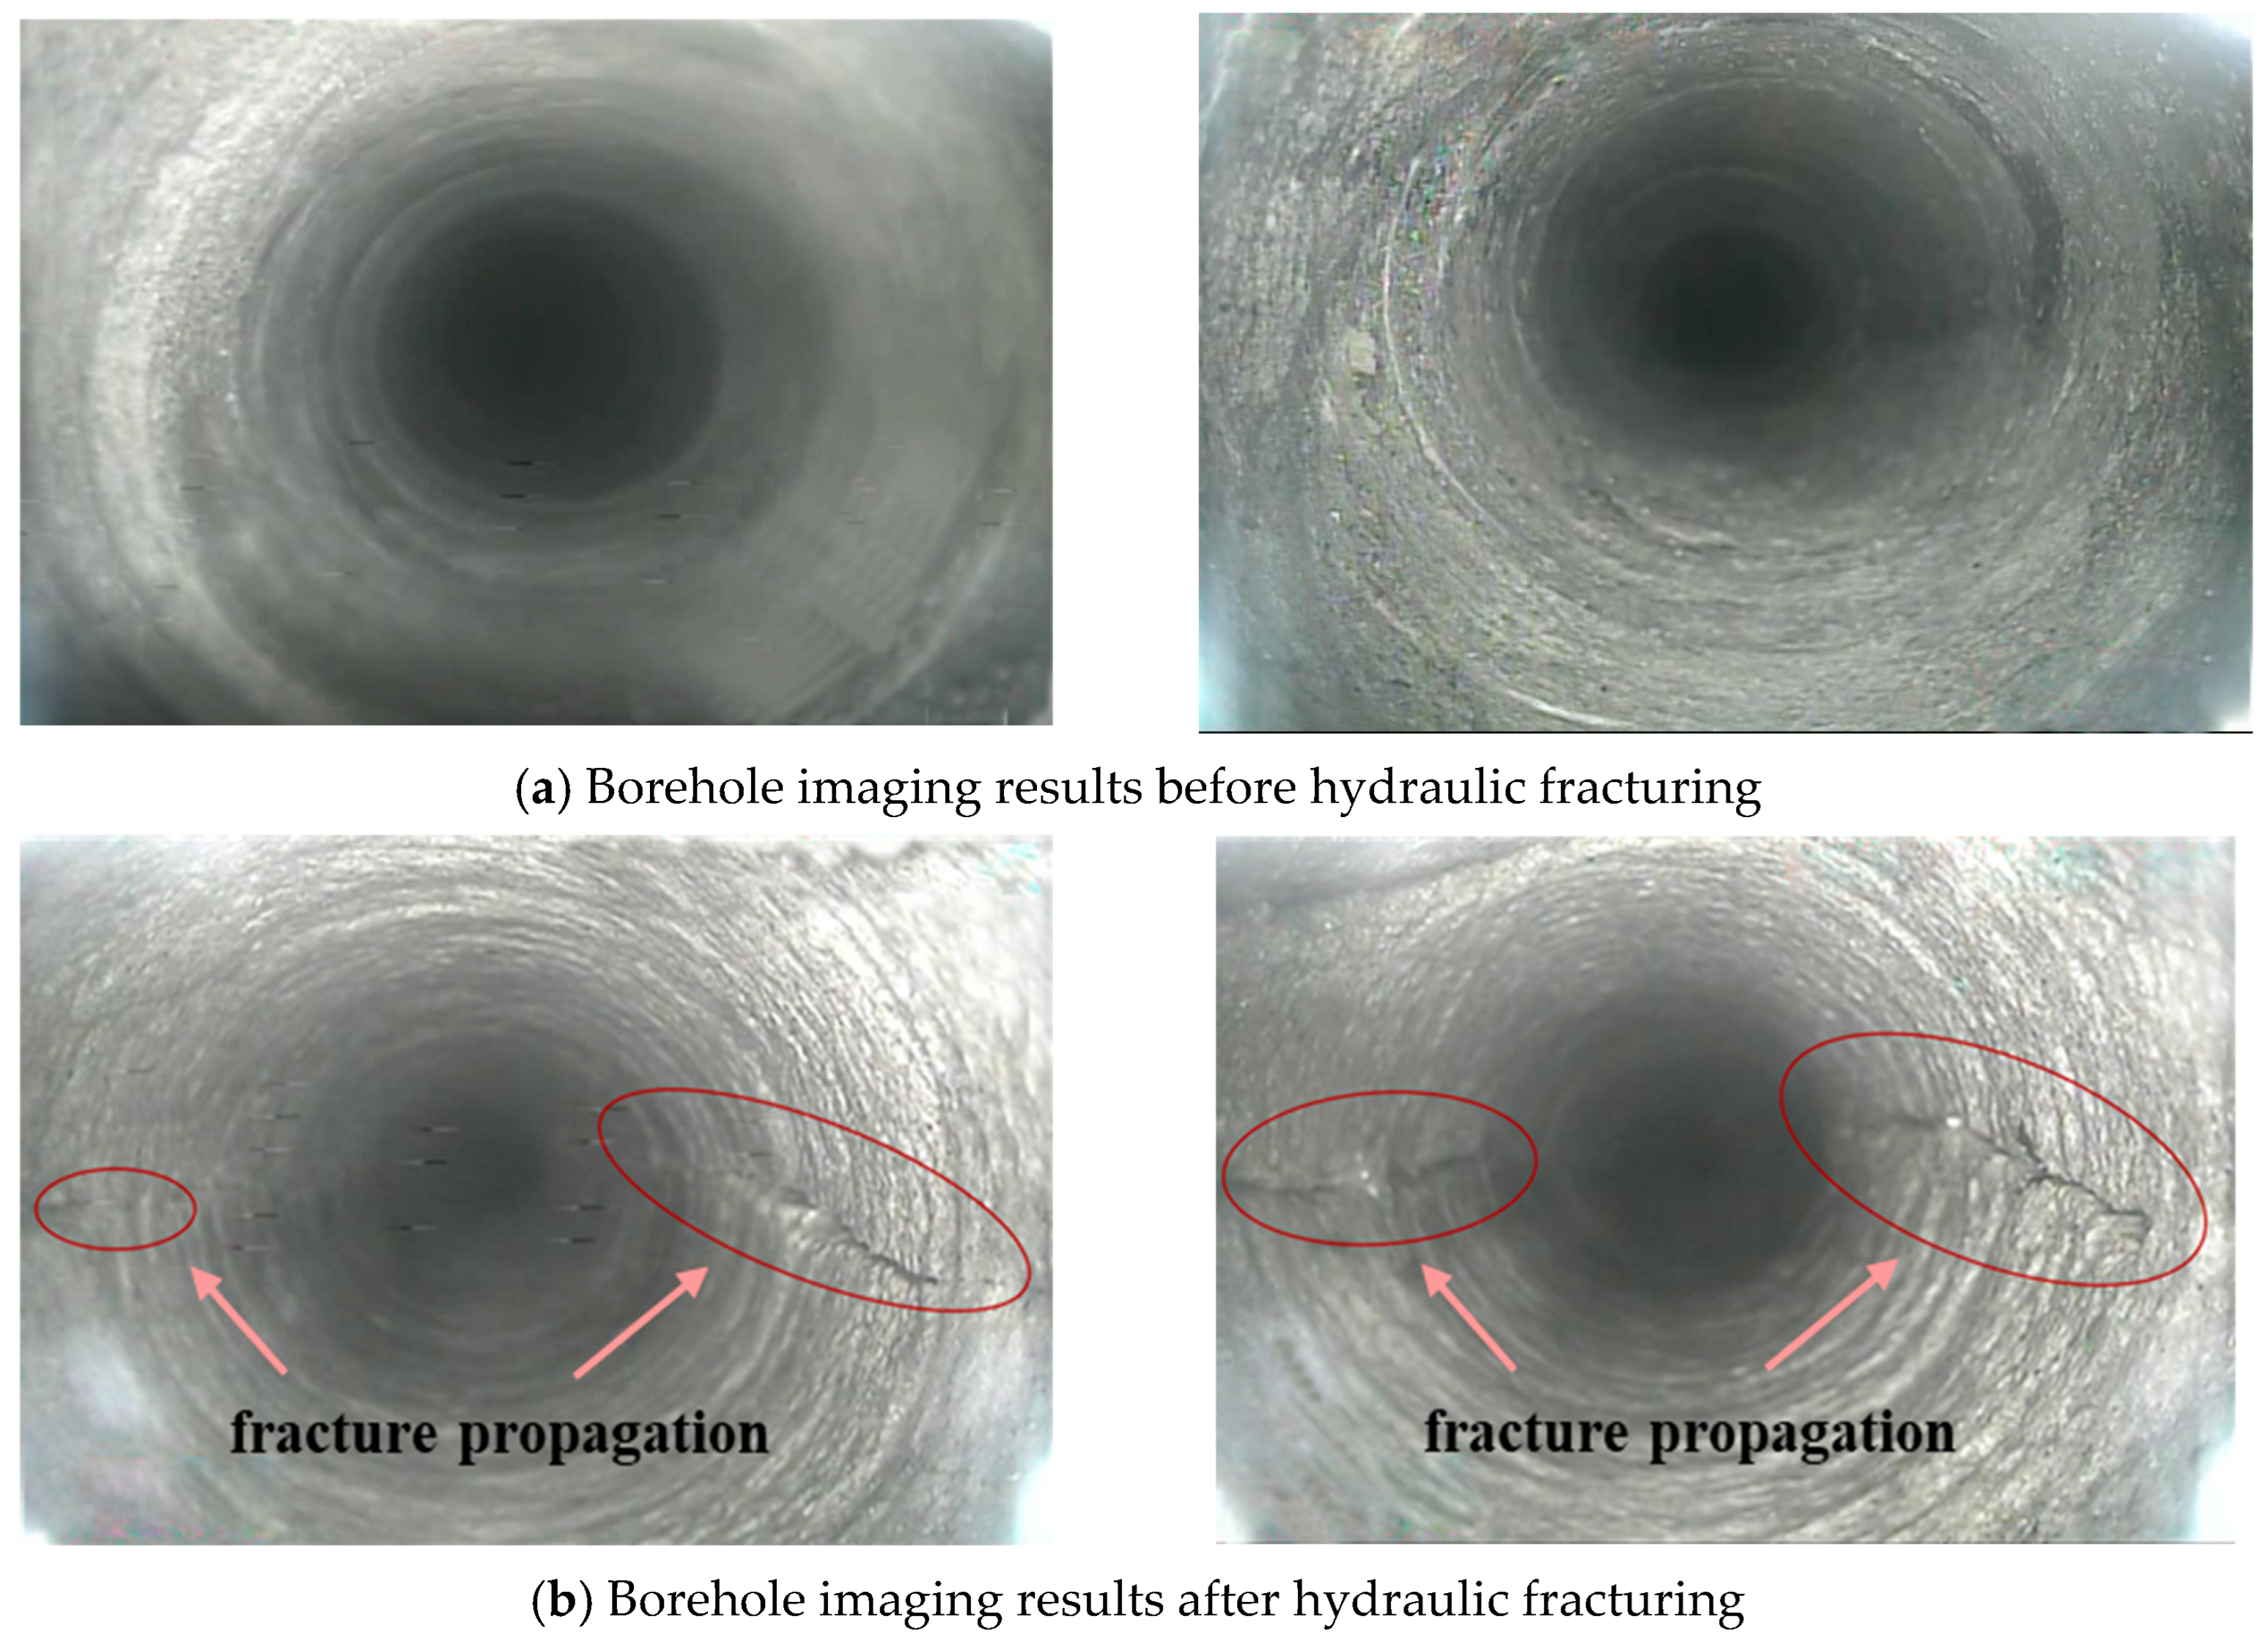
Borehole imaging technology uses optical imaging methods to observe the interior of rock strata, allowing direct acquisition of information on rock mass deformation and fracture development. Borehole imaging of the roof strata before and after hydraulic fracturing is helpful for analyzing fracture development characteristics and revealing the evolution of subsurface structures. In this test, borehole imaging conducted before and after fracturing revealed that distinct hydraulic fractures were generated near the fracturing sections, and the initiation locations and morphologies of fractures in different fracturing stages were similar. Taking borehole L3 as an example, the borehole imaging results are shown in Figure 16. Figure 16a,b corresponds to the same spatial location at borehole L3. Figure 16a shows the condition before hydraulic fracturing, while Figure 16b presents the state after the completion of the fracturing process.
Before hydraulic fracturing, the roof strata exhibited relatively intact structural characteristics, with only minor elongated pits observed on the borehole wall surfaces and no apparent large-scale natural fractures. After hydraulic fracturing, newly formed fractures were observed to initiate from both sides of the borehole wall. Combined with water seepage observed from adjacent boreholes, these findings suggest that tensile fracture initiation occurred within the rock mass, with propagation approximately perpendicular to the borehole axis and partial bedding-parallel extension within the roof strata.
These field observations demonstrate that the advanced hydraulic fracturing technique effectively induced fracture development and reduced roof integrity. While the field evidence does not provide direct geometric validation of the simulated fracture morphology, the observed fracture initiation mode and propagation tendency are qualitatively consistent with the trends predicted by the numerical simulations. Under appropriate engineering conditions, such controlled roof weakening and stress redistribution may contribute to mitigating energy accumulation and reducing rockburst susceptibility.

6. Conclusions

  • The elastic modulus determines the stiffness of the rock mass and the intensity of local stress concentration, Poisson’s ratio governs stress diffusion and energy redistribution characteristics, the injection rate regulates the evolution rate of fracture-tip stress and the mode of energy release, and fluid viscosity affects the balance of stress transmission and fracture stability. These four factors are strongly coupled and jointly control the dynamic evolution of the stress field during hydraulic fracturing from “concentration–diffusion–reconcentration,” playing a decisive role in fracture propagation paths and the formation of multiscale fracture networks.
  • Through a systematic analysis of the coupled effects of rock mechanical parameters and fluid dynamic parameters, the controlling mechanisms of elastic modulus, Poisson’s ratio, injection rate, and fluid viscosity on fracture opening, volumetric evolution, and stability were clarified. The results indicate that the combination of low to medium elastic modulus and moderate Poisson’s ratio ( E ≈ 13–18 GPa, ν ≈ 0.22–0.25) with medium to high injection rates and medium- to high-viscosity fracturing fluids ( q ≈ 0.02–0.025 m3·s−1, μ ≈ 0.007–0.009 Pa·s) enables sufficient fracture opening and high fractured-volume retention, thereby balancing fracture propagation efficiency and stability. The parameter-matching strategy proposed in this study facilitates directional fracture propagation and efficient volumetric accumulation, providing a theoretical basis for optimizing hydraulic fracturing parameters in thick and hard roofs.
  • By integrating the numerical simulation results with site-specific geological conditions and optimizing fracturing fluid parameters, the fracture propagation patterns were verified and the integrity of the thick and hard roof was effectively weakened. This promoted timely roof breakage and caving along the dip direction, creating favorable conditions for reducing rock burst hazards at the coal mining face and validating the fracture propagation laws and parameter-matching effects obtained from the simulations. The research outcomes not only elucidate the fracture evolution characteristics of segmented hydraulic fracturing in thick and hard roofs, but also provide transferable engineering references and theoretical support for pressure relief control and rock burst prevention in high-stress coal mine roofs.
  • Although the present study provides mechanistic insights based on a deterministic numerical framework, future work should further enhance model realism and validation depth. In particular, incorporating geological heterogeneity and stochastic variability into the numerical model would allow a more accurate representation of in situ rock mass behavior. Meanwhile, the application of advanced field monitoring technologies—such as microseismic monitoring and distributed fiber-optic sensing—may enable quantitative characterization of fracture morphology and propagation paths. Such developments would facilitate more rigorous calibration and validation between simulation predictions and field observations.

Author Contributions

Conceptualization, G.D. and W.G.; methodology, X.R.; software, D.L.; data curation, D.L.; writing—original draft preparation, D.L.; writing—review and editing, D.L.; visualization, G.D. All authors have read and agreed to the published version of the manuscript.

Funding

This research was funded by the General Program of the National Natural Science Foundation of China (Research on the mechanical activation model of compound coal–rock dynamic disasters and quantitative indicators corresponding to gas internal energy, Grant No. 52274095).

Data Availability Statement

The authors confirm that the data supporting the findings of this study are available within the article.

Conflicts of Interest

The authors declare no conflicts of interest.

References

  1. Bin, H.; Pengxiang, L.; Zhongbiao, G. Application of hydraulic fracturing technology in the 52502 working face of the Daliuta coal mine. Coal Sci. Technol. 2021, 49, 78–84. [Google Scholar] [CrossRef]
  2. Grebe, J.J.; Stoesser, M. Increasing crude production 20,000,000 bbl. from established fields. World Pet. J. 1935, 47, 473–482. [Google Scholar]
  3. Hubbert, M.K.; Willis, D.G. Mechanics of hydraulic fracturing. Trans. Soc. Pet. Eng. AIME 1957, 210, 153–168. [Google Scholar] [CrossRef]
  4. Haimson, B.; Fairhurst, C. Initiation and extension of hydraulic fractures in rocks. Soc. Pet. Eng. J. 1967, 7, 310–318. [Google Scholar] [CrossRef]
  5. Yew, C.H.; Li, Y. Fracturing of a deviated well. Prod. Eng. 1988, 4, 429–437. [Google Scholar] [CrossRef]
  6. Carter, R.D. Derivation of the general equation for estimating the extent of the fractured area. Drill. Prod. 1957, 261–270. [Google Scholar]
  7. Geertsma, J.; De Klerk, F. A rapid method of predicting width and extent of hydraulically induced fractures. J. Pet. Technol. 1969, 21, 1571–1581. [Google Scholar] [CrossRef]
  8. Perkins, T.; Kern, L. Widths of hydraulic fractures. J. Pet. Technol. 1961, 13, 937–949. [Google Scholar] [CrossRef]
  9. Heng, S.; Liu, X.; Li, X.D. Experimental and numerical study on the non-planar propagation of hydraulic fractures in shale. J. Pet. Sci. Eng. 2019, 179, 410–426. [Google Scholar] [CrossRef]
  10. Chen, M.; Li, M.; Wu, Y.; Kang, B. Simulation of hydraulic fracturing using different mesh types based on zero thickness cohesive element. Processes 2020, 8, 189. [Google Scholar] [CrossRef]
  11. Ran, Q.; Zhou, X.; Dong, J.; Xu, M.; Ren, D.; Li, R. Numerical simulation of multi-fracture propagation based on the extended finite element method. Processes 2023, 11, 2032. [Google Scholar] [CrossRef]
  12. Liu, H.; Ji, W.; Huang, Y.; Zhang, W.; Yang, J.; Xu, J.; Mei, M. Numerical simulation of hydraulic fracture propagation on multilayered formation using limited entry fracturing technique. Processes 2024, 12, 1099. [Google Scholar] [CrossRef]
  13. Eekelen, V. Hydraulic fracture geometry: Fracture containment in layered formations. Soc. Pet. Eng. J. 1982, 22, 341–349. [Google Scholar] [CrossRef]
  14. Crockett, A.; Okusu, N.; Clealy, M. A complete integrated model for design and real-time analysis of hydraulic fracturing operations. In SPE Western Regional Meeting; SPE: Oakland, CA, USA, 1986; p. 15069. [Google Scholar]
  15. Wan, C.; Guosheng, J.; Zhidong, Z. Fracture competition mechanism during simultaneous propagation of multiple fractures in horizontal wells. Rock Soil Mech. 2018, 39, 4448–4456. [Google Scholar]
  16. Xiaodong, Z.; Peng, Z.; Hao, L. Study on fracture propagation model of hydraulic fracturing in high-rank coal reservoirs. J. China Univ. Min. Technol. 2013, 42, 573–579. [Google Scholar]
  17. Yuanfang, C.; Bailie, W.; Na, L. Analysis of hydraulic fracture propagation and influencing factors in coal seams. Spec. Oil Gas Reserv. 2013, 20, 126–129. [Google Scholar] [CrossRef]
  18. Qianting, H.; Jichuan, L.; Quangui, L. Numerical simulation of seepage-induced stress field during staged hydraulic fracturing in coal seams. J. Min. Saf. Eng. 2022, 39, 761–769. [Google Scholar] [CrossRef]
  19. Manchanda, R.; Bryant, S. Strategies for effective stimulation of multiple perforation clusters in horizontal wells. SPE Prod. Oper. 2016, 33, 539–556. [Google Scholar]
  20. Settgast, R.R.; Izadi, G.; Hurt, R.S. Optimized cluster design in hydraulic fracture stimulation. In Proceedings of the Unconventional Resources Technology Conference, San Antonio, TX, USA, 20–22 July 2015. [Google Scholar]
  21. Shibin, W.; Gang, W.; Xuechang, C. Numerical simulation study on permeability enhancement and gas drainage by coal seam hydraulic fracturing based on PFC2D–COMSOL. Coal Mine Saf. 2022, 53, 132–140. [Google Scholar] [CrossRef]
  22. Kaikai, Z.; Zhen, Z.; Wenzhou, L. Three-dimensional propagation of borehole-initiated hydraulic fractures based on XSite. Chin. J. Geotech. Eng. 2021, 43, 1483–1491. [Google Scholar] [CrossRef]
  23. Jinzhuang, J.; Jiaqi, G.; Wenhao, Z. Research on hydraulic fracturing permeability enhancement technology and its applications. China Saf. Sci. J. 2020, 30, 63–68. [Google Scholar] [CrossRef]
  24. Rusheng, Z.; Qiang, W.; Zuguo, Z. Three-dimensional propagation of hydraulic fractures: Numerical simulation using ABAQUS. Petrol. Drill. Prod. Technol. 2012, 34, 69–72. [Google Scholar]
  25. Shuliang, C.; Bingxiang, H. Techno-economic analysis of control methods for hard top coal roof in underground mines. China Min. 2021, 30, 130–135. [Google Scholar]
  26. Shankun, Z. Comparative analysis of the applicability of deep-hole roof presplitting blasting and directional hydraulic fracturing for rockburst prevention. J. Min. Saf. Eng. 2021, 38, 706–719. [Google Scholar] [CrossRef]
  27. Bingxiang, H.; Xinglong, Z.; Shuliang, C. Control theory and integrated technology of hydraulic fracturing for hard roof. Chin. J. Rock Mech. Eng. 2017, 36, 2954–2970. [Google Scholar]
  28. Peng, C. Study on hydraulic fracturing pressure-relief and roadway protection technology for dynamic pressure roadways in extra-thick coal seams. Coal Sci. Technol. 2019, 47, 50–55. [Google Scholar] [CrossRef]
Figure 1. Schematic of the traction–separation criterion.
Processes 14 00843 g001
Figure 2. A hydraulic fracture element propagating within a rock medium.
Processes 14 00843 g002
Figure 3. Schematic of the 3D hydraulic fracturing model with embedded cohesive interfaces.
Processes 14 00843 g003
Figure 4. Equivalent stress contour plots after segmented hydraulic fracturing under different elastic moduli.
Processes 14 00843 g004
Figure 8. Variations in fractured volume and maximum fracture width of the model. (A1,A2) represent the changes in volume and fracture width during the fracturing process under different E; (B1,B2) represent the changes in volume and fracture width during the fracturing process under different v; (C1,C2) represent the changes in volume and fracture width during the fracturing process under different q; (D1,D2) represent the changes in volume and fracture width during the fracturing process under different μ.
Processes 14 00843 g008
Figure 9. Fracture width and fracture volume results for Group A.
Processes 14 00843 g009
Figure 10. Fracture width and fracture volume results for Group B.
Processes 14 00843 g010
Figure 11. Fracture width and fracture volume results for Group C.
Processes 14 00843 g011
Figure 12. Fracture width and fracture volume results for Group D.
Processes 14 00843 g012
Figure 13. Borehole layout diagram: (a) spatial relationship diagram of the 6125-1 working face; (b) plan view of borehole layout.
Processes 14 00843 g013
Figure 14. Hydraulic fracturing equipment: (a) a high-pressure water pump; (b) inlet and outlet pipes; (c) a water tank; (d) a water pressure monitoring gauge; (e) a packer.
Processes 14 00843 g014
Figure 15. Observed water seepage and deformation at monitoring boreholes.(a) L3 water discharge status before fracturing; (b) L3 water discharge status after fracturing; (c) anchor cable water seepage condition; (d) R1 borehole mouth dynamic deformation status.
Processes 14 00843 g015
Figure 16. Borehole imaging results for L3: (a) borehole imaging results before hydraulic fracturing; (b) borehole imaging results after hydraulic fracturing.
Processes 14 00843 g016
Table 1. Model calculation parameters.
ParameterValue
fluid loss coefficient/ m min 0.5 1 × 10⁻¹³
damage displacement/ m 0.0001
permeability coefficient/ m s 1 1 × 10⁻⁷
void ratio/%0.11
minimum horizontal principal stress/MPa11.5
vertical principal stress/MPa20.7
tensile strength/MPa3.0
maximum horizontal principal stress/MPa21.4
Table 2. Main control parameters of the model.
GroupNameElastic Modulus E /GPa Poisson s   Ratio   ν Injection Rate q /(m3·s−1)Fluid Viscosity μ /(Pa·s)
AA-1~A-410/13.76/20/250.220.020.001
BB-1~B-413.760.15/0.22/0.25/0.300.020.001
CC-1~C-413.760.220.01/0.015/0.02/0.0250.001
DD-1~D-413.760.220.020.001/0.003/0.005/0.007
Disclaimer/Publisher’s Note: The statements, opinions and data contained in all publications are solely those of the individual author(s) and contributor(s) and not of MDPI and/or the editor(s). MDPI and/or the editor(s) disclaim responsibility for any injury to people or property resulting from any ideas, methods, instructions or products referred to in the content.