Article

Organic Geochemical Characteristics and Quantitative Evaluation of Hydrocarbon Generation Potential of Source Rocks in the First Member of the Qingshankou Formation, Songliao Basin


1
Exploration and Development Research Institute, CNPC Daqing Oilfield Company Limited, Daqing 163712, China
2
National Key Laboratory of Deep Oil and Gas, School of Geosciences, China University of Petroleum (East China), Qingdao 266580, China
3
Sanya Offshore Oil & Gas Research Institute of Northeast Petroleum University, Sanya 572025, China
4
Key Laboratory of the Ministry of Education for Terrestrial Shale Oil and Gas Reservoir Formation and Efficient Development, Northeast Petroleum University, Daqing 163318, China
*
Authors to whom correspondence should be addressed.
Processes 2026, 14(5), 814; https://doi.org/10.3390/pr14050814
Submission received: 5 February 2026 / Revised: 22 February 2026 / Accepted: 24 February 2026 / Published: 2 March 2026

Abstract

Hydrocarbon resource potential evaluation represents the primary and core component of whole petroleum system studies. However, compared with the substantial progress achieved in understanding hydrocarbon generation mechanisms, quantitative assessments of hydrocarbon generation amounts from source rocks in the Songliao Basin remain relatively limited. Given that the genetic method is capable of comprehensively reflecting both the intrinsic hydrocarbon generation potential and conversion efficiency of source rocks and is supported by robust geological principles, this study was conducted within a genetic framework. Stratigraphic data and lithological descriptions from more than 2000 wells in the northern Songliao Basin, logging data from 387 wells, and measured basic geochemical data from 201 wells were integrated. Combined with the ΔlogR method, original hydrocarbon generation potential restoration techniques, and results from thermal simulation experiments, the planar distributions of key geochemical parameters of the first member of the Qingshankou Formation were systematically characterized. On this basis, the hydrocarbon generation potential and total hydrocarbon generation amounts of different structural units within the Songliao Basin were quantitatively evaluated. The results indicate that the cumulative hydrocarbon generation of the first member of the Qingshankou Formation reached approximately 506.55 × 10⁸ t. Among the structural units, the Qijia–Gulong Sag contributed 266.13 × 10⁸ t, the Sanzhao Sag 132.71 × 10⁸ t, the Longhupao Terrace 66.81 × 10⁸ t, and the Daqing Placanticline 40.90 × 10⁸ t. These results demonstrate significant heterogeneity in hydrocarbon generation capacity among different structural units, with the Qijia–Gulong Sag identified as the most important hydrocarbon generation center in the study area. This study provides a critical quantitative foundation for whole petroleum system research in the northern Songliao Basin. It not only supplies essential data support for subsequent resource apportionment of conventional and shale hydrocarbons but also offers important constraints for analyses of reservoir-type distribution and hydrocarbon accumulation mechanisms.

1. Introduction

With global petroleum exploration increasingly shifting toward deeper targets, unconventional resources, and multi-type resource integration, full petroleum system studies at the super-basin scale have been regarded as a key theoretical approach for improving the understanding of hydrocarbon accumulation mechanisms and enhancing resource discovery efficiency [1,2,3,4]. Within this research framework, hydrocarbon resource potential assessment is regarded as the primary and core component of whole petroleum system studies. Hydrocarbon generation potential, as a fundamental parameter of resource assessment, directly controls the total amount of hydrocarbons available for migration, accumulation, and preservation within a petroleum system. Therefore, systematic evaluation of hydrocarbon generation potential is considered a necessary prerequisite for whole petroleum system analysis and resource assessment at the super-basin scale [5,6,7,8].
The Songliao Basin is recognized as a typical oil-rich super basin in China, in which two major oil-prone source rock systems, namely, the Qingshankou Formation and the Nenjiang Formation, are developed. Among them, the Nenjiang Formation was deposited relatively later and is characterized by an overall low thermal maturity [9]. The Fuyu tight oil reservoir, Gulong shale oil reservoir, Gaotaizi reservoir, Putaohua reservoir, Saertu reservoir, and Heidimiao reservoir, developed successively from bottom to top in the Songliao Basin, are all predominantly sourced from the Qingshankou Formation source rocks. Therefore, systematic investigation of the development characteristics and hydrocarbon generation potential of the Qingshankou Formation source rocks is of great significance for improving the understanding of hydrocarbon accumulation and guiding petroleum exploration and development [10,11,12,13].
Currently, considerable understanding has been achieved regarding the hydrocarbon generation mechanisms of the Qingshankou Formation. Recent studies have primarily focused on the following aspects: (1) based on the time–temperature complementarity principle of organic matter maturation, closed- or open-system pyrolysis experiments under high-temperature–short-duration conditions, combined with kinetic modeling, have been conducted to simulate the low-temperature, long-duration maturation processes underlying geological conditions, with particular attention to the evolution of hydrocarbon fractions, gas–oil ratios, and phase characteristics [14,15,16,17]. (2) Based on molecular structure analysis and experimental simulation, the molecular structural evolution mechanisms of Type I kerogen in the Qingshankou Formation during hydrocarbon generation have been investigated [18]. (3) Under conditions of high clay mineral content, the influence of clay minerals on the hydrocarbon generation process of the Qingshankou Formation has been systematically investigated [19,20]. However, in comparison with studies on hydrocarbon generation mechanisms, the quantitative and systematic evaluation of source rock hydrocarbon yields remains evidently insufficient [7,8]. In recent years, with the continued exploration and development of the Daqing Oilfield and advances in analytical techniques, a large amount of new geochemical data has been accumulated. Therefore, these new data need to be fully utilized, in combination with previous understanding of the shallow source rocks in the Qijia–Gulong Sag, to conduct a more systematic, in-depth, and comprehensive quantitative study.
The genetic method is one of the most widely applied approaches for evaluating hydrocarbon resource potential. Based on the material balance principle of hydrocarbon generation, geological and mathematical models are constructed, and the hydrocarbon generation of source rocks is quantitatively calculated, thereby enabling the prediction of hydrocarbon resource potential [21,22,23,24]. Since the chemical kinetic model of kerogen pyrolysis was proposed by Tissot and Welte, the genetic method has been gradually developed into a comprehensive technical framework, including chemical kinetics, basin modeling, and thermal simulation experiments, and has been widely applied in the evaluation of both conventional and unconventional hydrocarbon resources in China [25,26].
Based on the above understanding, to achieve a precise quantitative evaluation of the hydrocarbon generation potential of the Qingshankou Formation, Member 1 (Qing 1 Member) in the Songliao Basin, the genetic method was adopted as the theoretical framework. Stratigraphic and lithologic classification data from over 2000 wells, logging data from 387 wells, and measured basic geochemical data from 201 wells in the northern Daqing Oilfield were comprehensively utilized. Using the ΔlogR method, the thickness, TOC, and S2 distribution of source rocks were systematically mapped under full-well constraints. On this basis, the original hydrocarbon generation potential was restored, and the spatial distributions of original TOC and hydrogen index (HI) were characterized. Finally, combined with closed-system gold-tube hydrocarbon generation simulation experiments on source rock samples, the hydrocarbon generation evolution and the spatial distribution of transformation ratios were systematically evaluated, thereby enabling the quantitative assessment of hydrocarbon generation potential and total hydrocarbon yields across different structural units in the Songliao Basin.

2. Geological Background

The Songliao Basin, located in Northeast China, is a NE-SW trending basin. It measures approximately 820 km in length and 350 km in width, covering a total area of 26 × 104 km2 [12,27]. According to the tectonic features, the Songliao Basin is subdivided into six primary tectonic units: the Northern Tilting Belt, Northeastern Uplift Belt, Central Depression Belt, Southwestern Uplift Belt, Southeastern Uplift Belt and Western Slope Belt (Figure 1a) [28,29]. As a dominant, subsidence-driven negative tectonic unit throughout the evolution of the Songliao Basin, the Central Depression Belt has long functioned as the basin’s primary depocenter (Figure 1b) [30,31].
The depositional period of the Cretaceous Qingshankou Formation in the Songliao Basin was characterized by a large-scale lacustrine transgression. The first and second members (K2qn1 and K2qn2) are typified by the extensive development of semi-deep to deep lacustrine facies, forming a suite of dark mudstones and shales during a regressive sequence [16]. During the depositional period of K2qn1, the lake level underwent rapid expansion, with the lacustrine coverage reaching approximately. With a thickness ranging from 60 to 100 m, this unit constitutes one of the most critical source rock intervals in the Songliao Basin.

3. Sample and Methods

3.1. Sample

Sample CY6801, retrieved from the Chaoyanggou terrace in the Songliao Basin, was selected for hydrocarbon generation simulation. The sample is classified as immature, as indicated by a vitrinite reflectance of 0.55% and a Tmax of 445 °C, making it ideal for thermal maturation studies. Geochemical analysis reveals a total organic carbon (TOC) content of 7.79% and a hydrogen index (HI) of 825.03 mg/g TOC, identifying the organic matter as Type I kerogen. Comprehensive geochemical data are summarized in Table 1.

3.2. Gold-Tube Pyrolysis Experiment

Closed-system gold-tube experiments were conducted at the Guangzhou Institute of Geochemistry, Chinese Academy of Sciences, to simulate hydrocarbon generation from immature shale samples. One end of each tube was welded shut prior to sample loading, and the sample mass was adjusted according to the temperature interval: larger sample loads were used at lower temperatures because oil and gas yields are small and a greater mass ensures measurable products for quantification; at higher temperatures, gas production increases substantially, and excessive loading can cause tube rupture due to abundant gaseous hydrocarbons, so sample masses were reduced accordingly. The sample mass per tube ranged from 10 to 30 mg. The tubes were subsequently placed in a series of high-pressure vessels, which were programmatically heated in a furnace at rates of 2 °C/h and 20 °C/h. Twelve temperature points were set from 300 °C to 600 °C at 24 °C intervals. At each temperature point, the corresponding vessel was removed, cooled, and prepared for subsequent analysis. Detailed experimental procedures are provided in the literature [16,33,34].

3.3. Composition Analysis

The gold tube sample was placed in a glass vacuum device and evacuated to zero pressure, after which the tube was punctured. Once the pressure stabilized, the valve connecting the device to an Agilent 6890N GC (Agilent manufacturer, Santa Clara, CA, USA) was opened. The gases released from the tube entered the GC system due to the pressure differential and were subsequently detected and quantified online using FID and TCD detectors for C1–C5 hydrocarbons and inorganic gases.
An ethanol solution was used to clean any residue from the surface of the retrieved gold tube and the tube was placed in a liquid-nitrogen-filled container for 90 s to cryogenically condense the light hydrocarbon components. The tube was removed from the container, quickly cut into three segments with scissors, and placed into an 8 mL vial containing 4 mL of carbon disulfide (CS2). Then the vial was sealed. The sealed vial was placed in an ultrasonic bath and sonicated for 10 min to ensure that the light hydrocarbons were completely dissolved in the n-pentane solvent. Deuterated C24 (n-C24D50) standard was added to each sample. Quantitative analysis of light hydrocarbons was performed on an Agilent 7890A gas chromatograph, using a 60 m × 0.32 mm × 0.25 μm Varian fused-silica capillary column. The oven program was: initial temperature 30 °C, hold 5 min, ramp at 3 °C/min to 150 °C, ramp at 5 °C/min to 290 °C, hold 15 min [16,35,36].

3.4. Hydrocarbon Generation Kinetic Model

The hydrocarbon generation process can be assumed to be a series of (NO) parallel first-order reactions, including the activation energy of reaction (EOi), pre-exponential factor of reaction (AOi), and initial generation potential (XOi0). Then, based on the Arrhenius equation, the total mass of hydrocarbons generated from NO parallel reactions can be derived using the following formula [37,38,39,40]:
X O = i = 1 N O ( X O i 0 ( 1 exp ( T 0 T A O i D exp ( E O i R T ) d T ) ) )
where D is the heating rate, K/min; T is the absolute temperature, K; and R is the gas constant, 8.31447 kJ/(mol K).

3.5. The Improved ΔlogR Method

Well-log data can be used to rapidly identify and quantify the continuously distributed total organic carbon (TOC) in shale, even in the absence of measured TOC data. The improved ΔlogR technique allows for accurate prediction of TOC based on well-log curves, with methodological details provided in the relevant literature [41,42]. The improvements are as follows: (1) the fixed superposition coefficient (0.02) was replaced with a variable parameter, whose value was determined based on actual geological data (TOC and well-log curves); (2) the maturity parameter (LOM) was removed; (3) the baseline value was determined from the ΔlogRV curve instead of the sonic–resistivity curve.

4. Results and Discussion

4.1. Source Rock Evaluation

4.1.1. Abundance and Type of Organic Matter

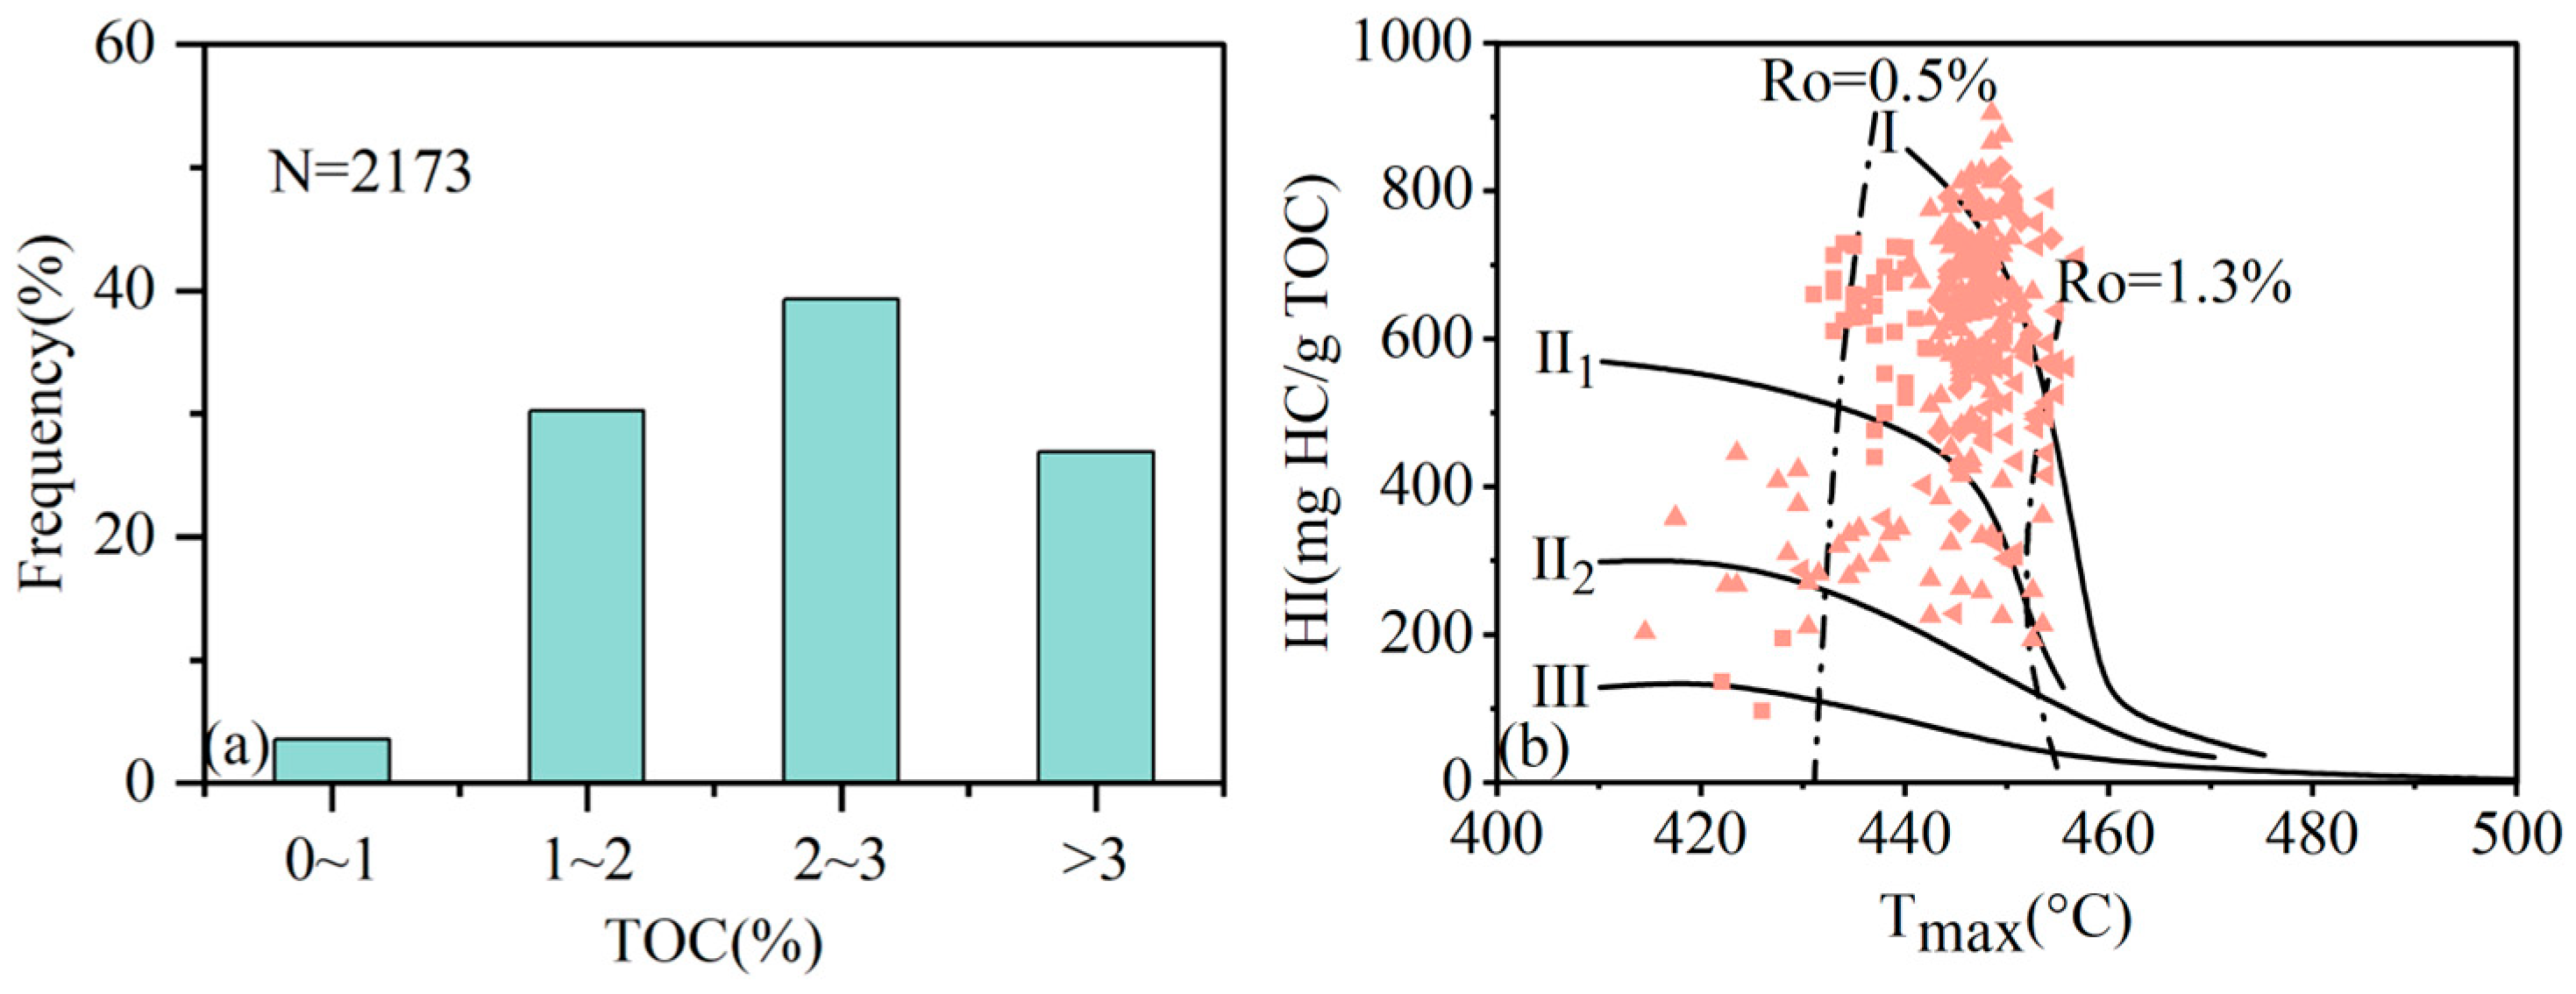
Based on 2173 measured TOC data points from 201 wells of Member 1 of the Qingshankou Formation in the Songliao Basin, the basic geochemical characteristics of the source rocks were systematically evaluated. The results indicate that TOC is primarily distributed between 2% and 3%, with an average of 2.6%, classifying the K2qn1 as high-quality source rock according to the latest Chinese petroleum industry standards (Figure 2a). Analysis of the HI–Tmax cross plot shows that the organic matter in the K2qn1 shale is predominantly Type I and II1 kerogen (Figure 2b). Notably, some samples exhibit lower Tmax values and kerogen types of II2–III, which is attributed to the adsorption of soluble hydrocarbons by the rock matrix. This adsorption likely interacts with S2 during pyrolysis, resulting in significantly reduced S2 and HI in extracted shale samples, indicating that the decomposition of residual hydrocarbons contributes substantially to S2 [12].

4.1.2. Organic Maturity

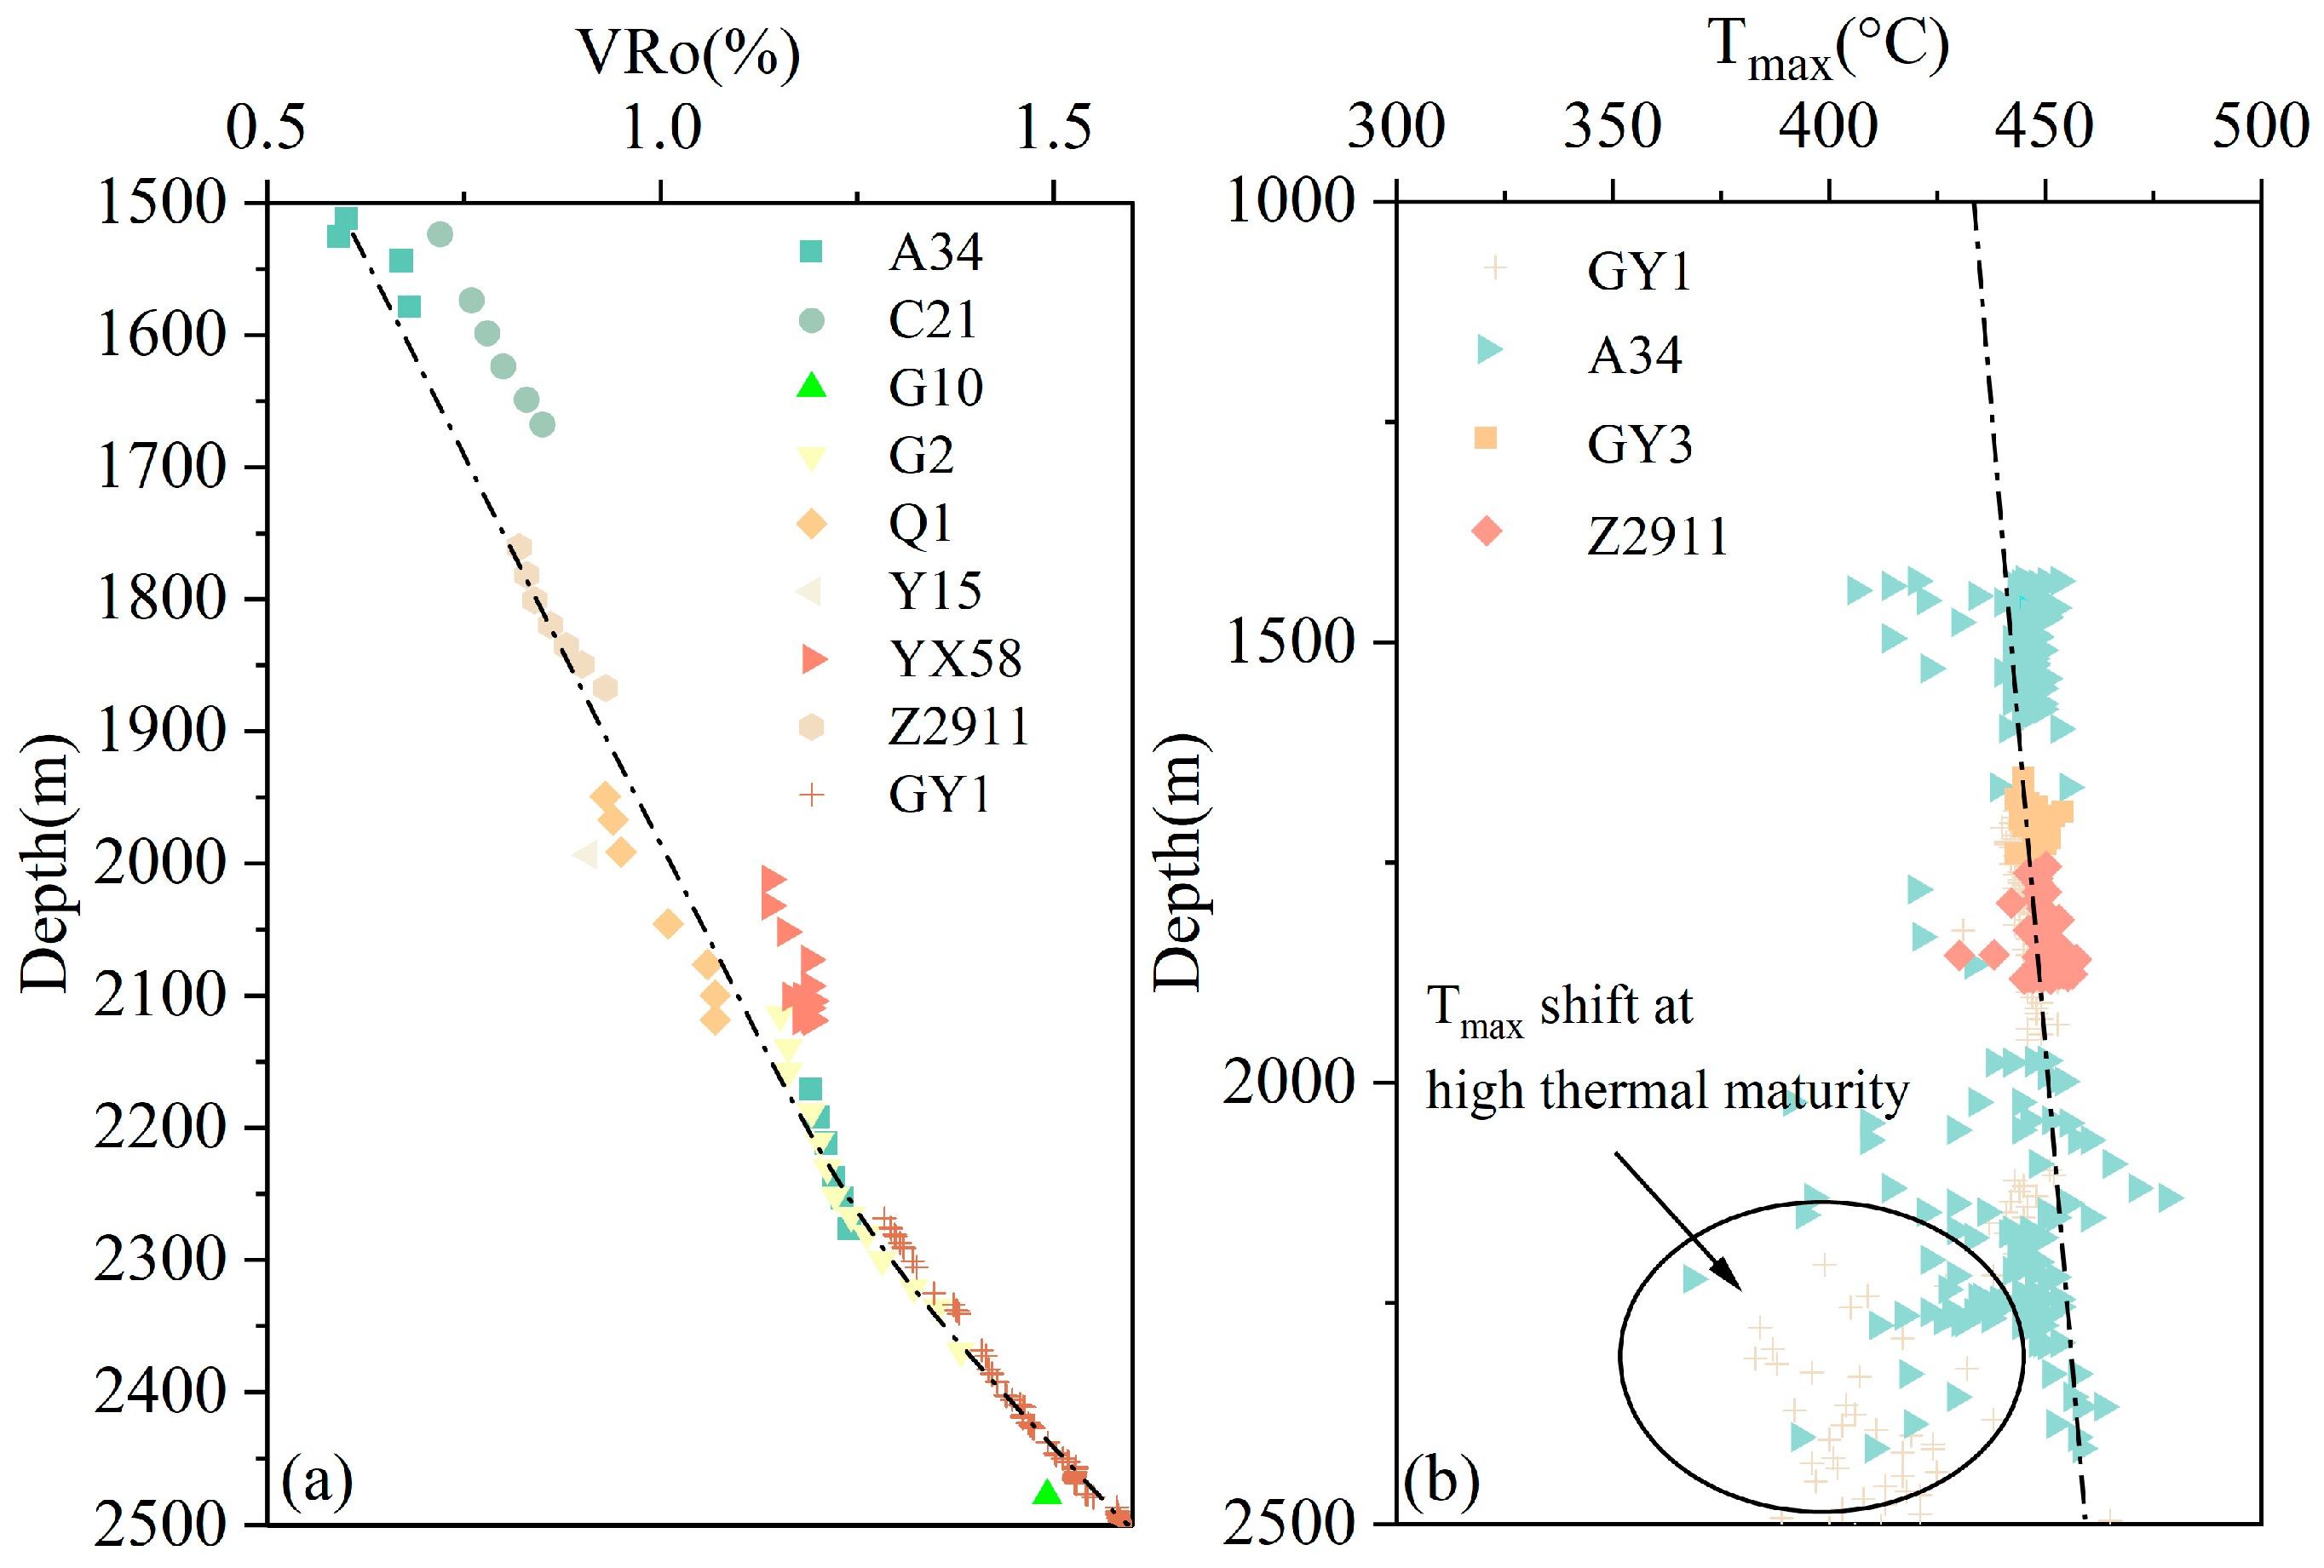
Methods for characterizing organic matter maturity primarily include vitrinite reflectance, Tmax determination, and Raman spectroscopy, among which VRo has been widely applied as a key indicator of thermal maturity in coal, petroleum, and shale [12,43,44]. Measured organic matter maturity (VRo) and rock pyrolysis parameters (Tmax) were collected from key wells in the study area. The results indicate that vitrinite reflectance in the Gulong Sag ranges from 0.5 to 1.6%, showing a good positive correlation with depth, with VRo increasing as burial depth increases (Figure 3a). In several key wells, depths exceed 2000 m, corresponding to maturity values above 1.25. Tmax values range from 380 to 480 °C. Compared to immature to low-maturity samples, Tmax is not a fully reliable indicator of maturity at high thermal evolution stages (Figure 3b), primarily due to the advance of Tmax caused by the influence of soluble hydrocarbons at high maturity [12,45]. In contrast, VRo data and the VRo–depth relationship remain effective references for predicting in situ thermal maturity.

4.2. Spatial Distribution of Thickness and Key Geochemical Parameters of the Source Rock

4.2.1. Source Rock Depth

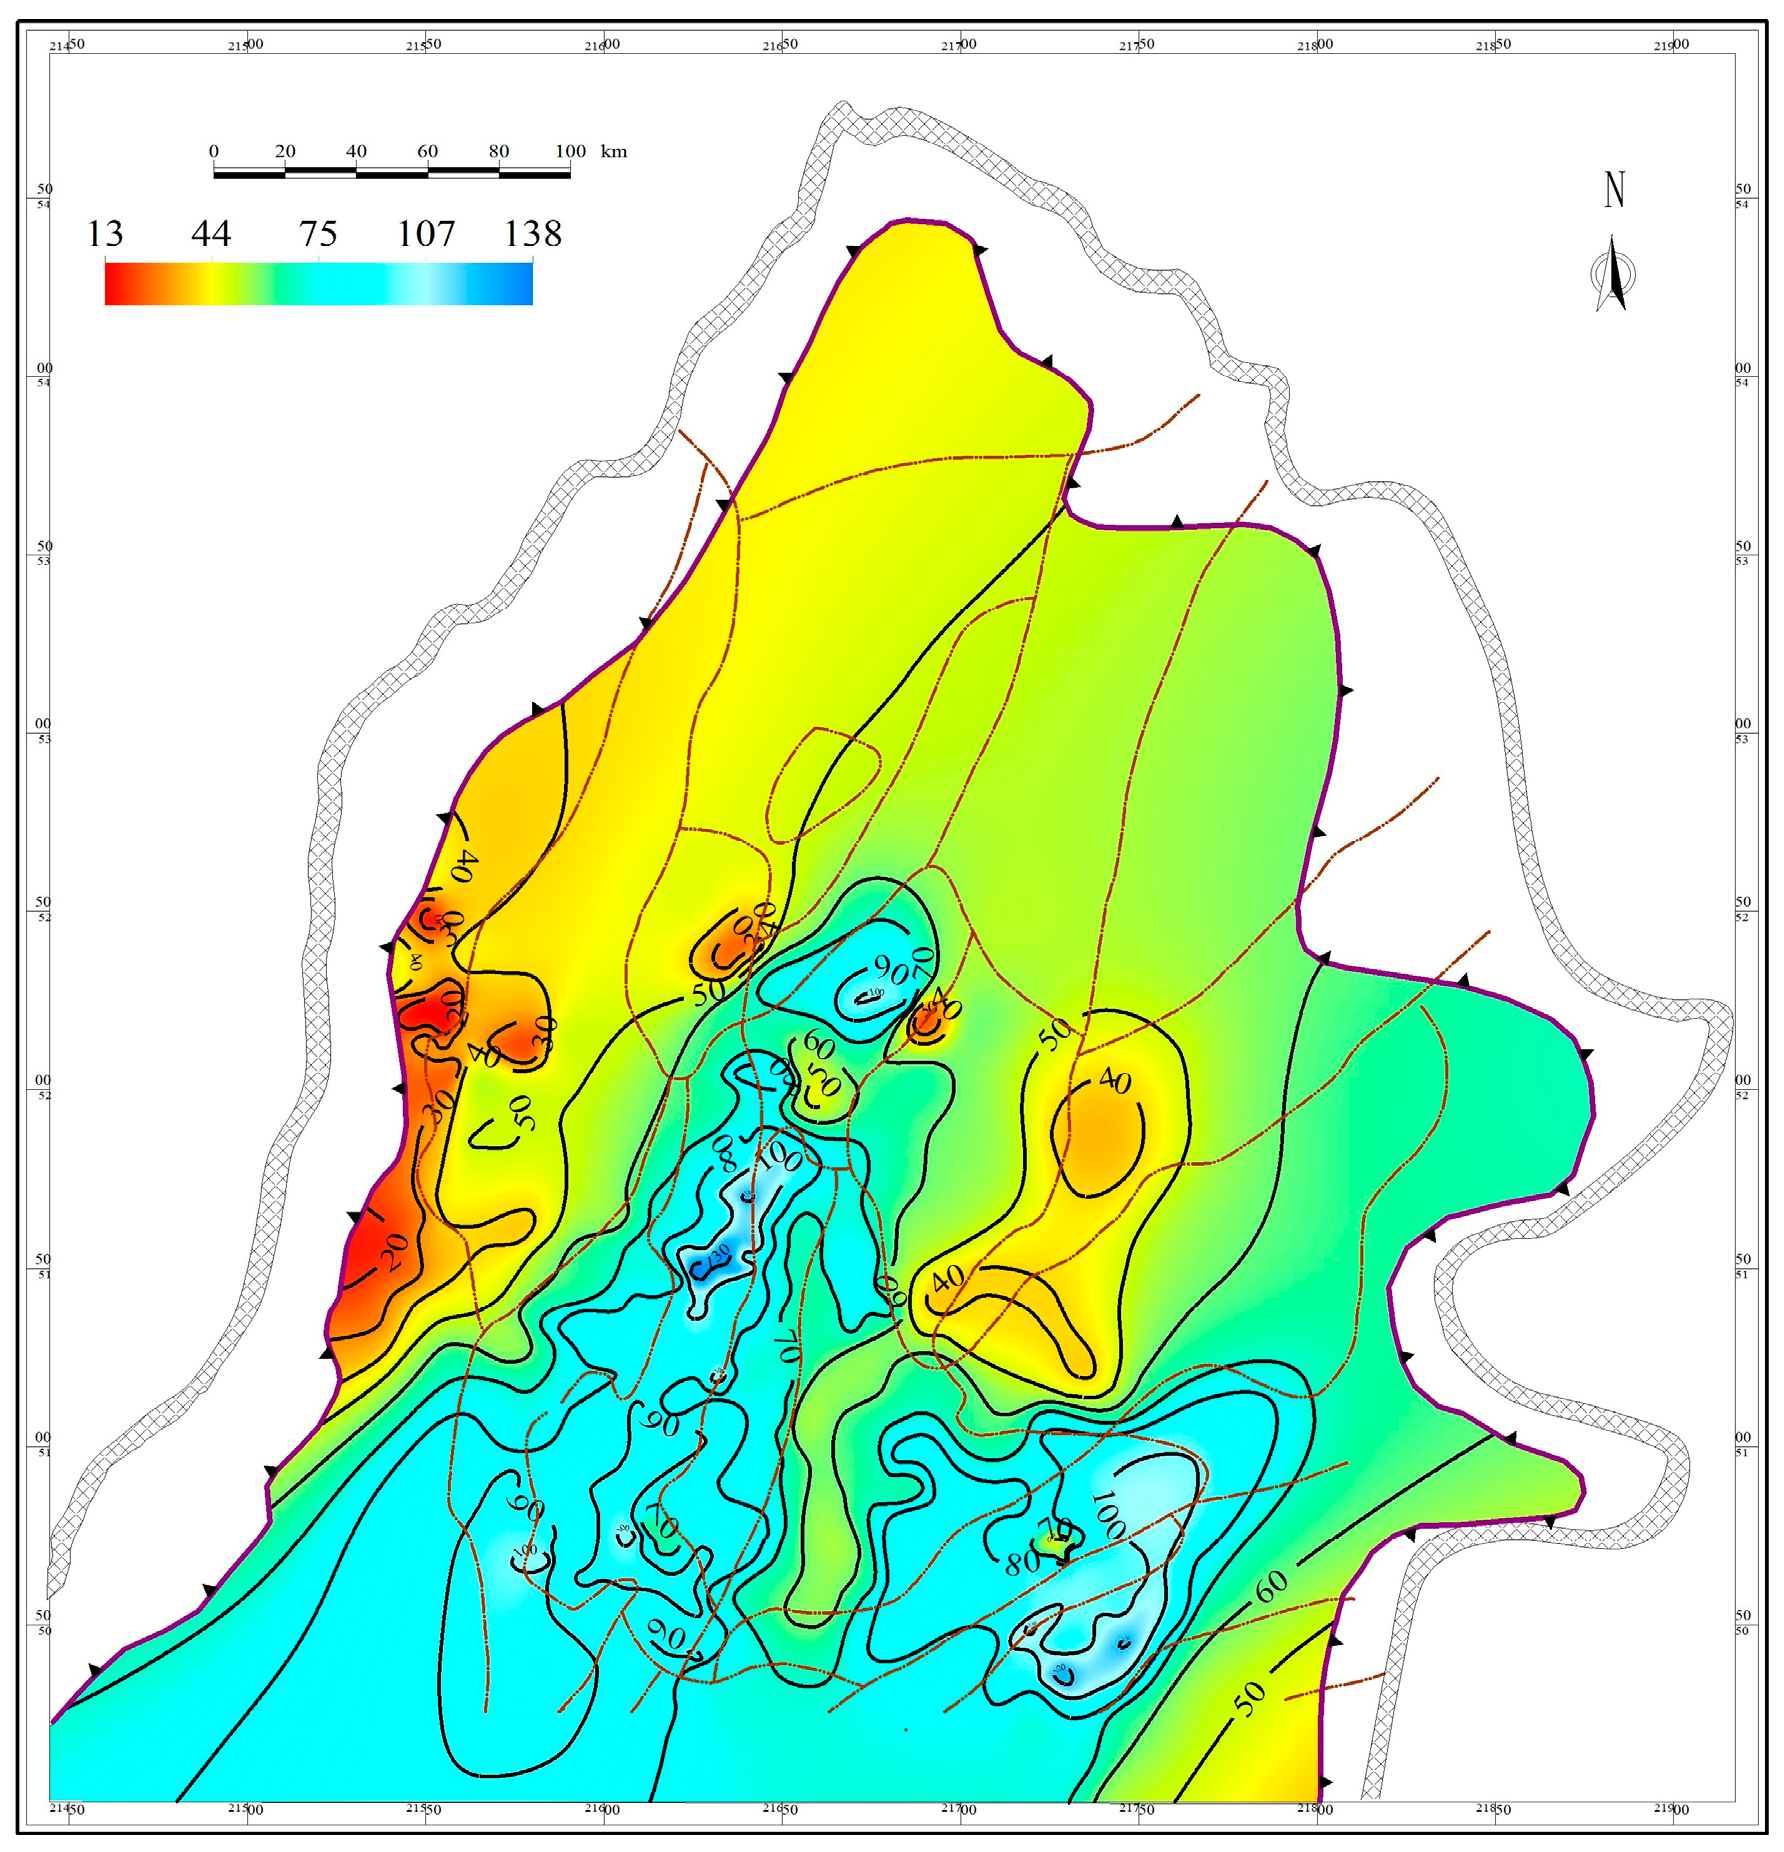
Source rock thickness directly reflects the degree of organic matter enrichment and the hydrocarbon-generating potential of shale. Thicker source rock intervals generally exhibit higher total organic carbon content and more favorable conditions for hydrocarbon generation. Based on the stratigraphic data and well-log lithology classification from over 2000 wells in the northern part of the Songliao Basin, the thickness distribution of the K2qn1 was characterized (Figure 4). Iso-thickness maps indicate that the source rock thickness ranges from 13 to 138 m, with an average thickness of 71.3 m. Source rocks are mainly distributed in the Qijia–Gulong Sag, Longhupao Terrace, Daqing Changyuan, and Sanzhao Sag. Among these, the Qijia–Gulong Sag, as a stable depositional center during the Qingshankou period, exhibits the greatest thickness with an average of 100 m. The Sanzhao Depression follows, with some wells reaching 120 m, whereas source rocks in the eastern part of the Sanzhao Sag are relatively thin, generally less than 60 m.

4.2.2. Evaluation of TOC and S2

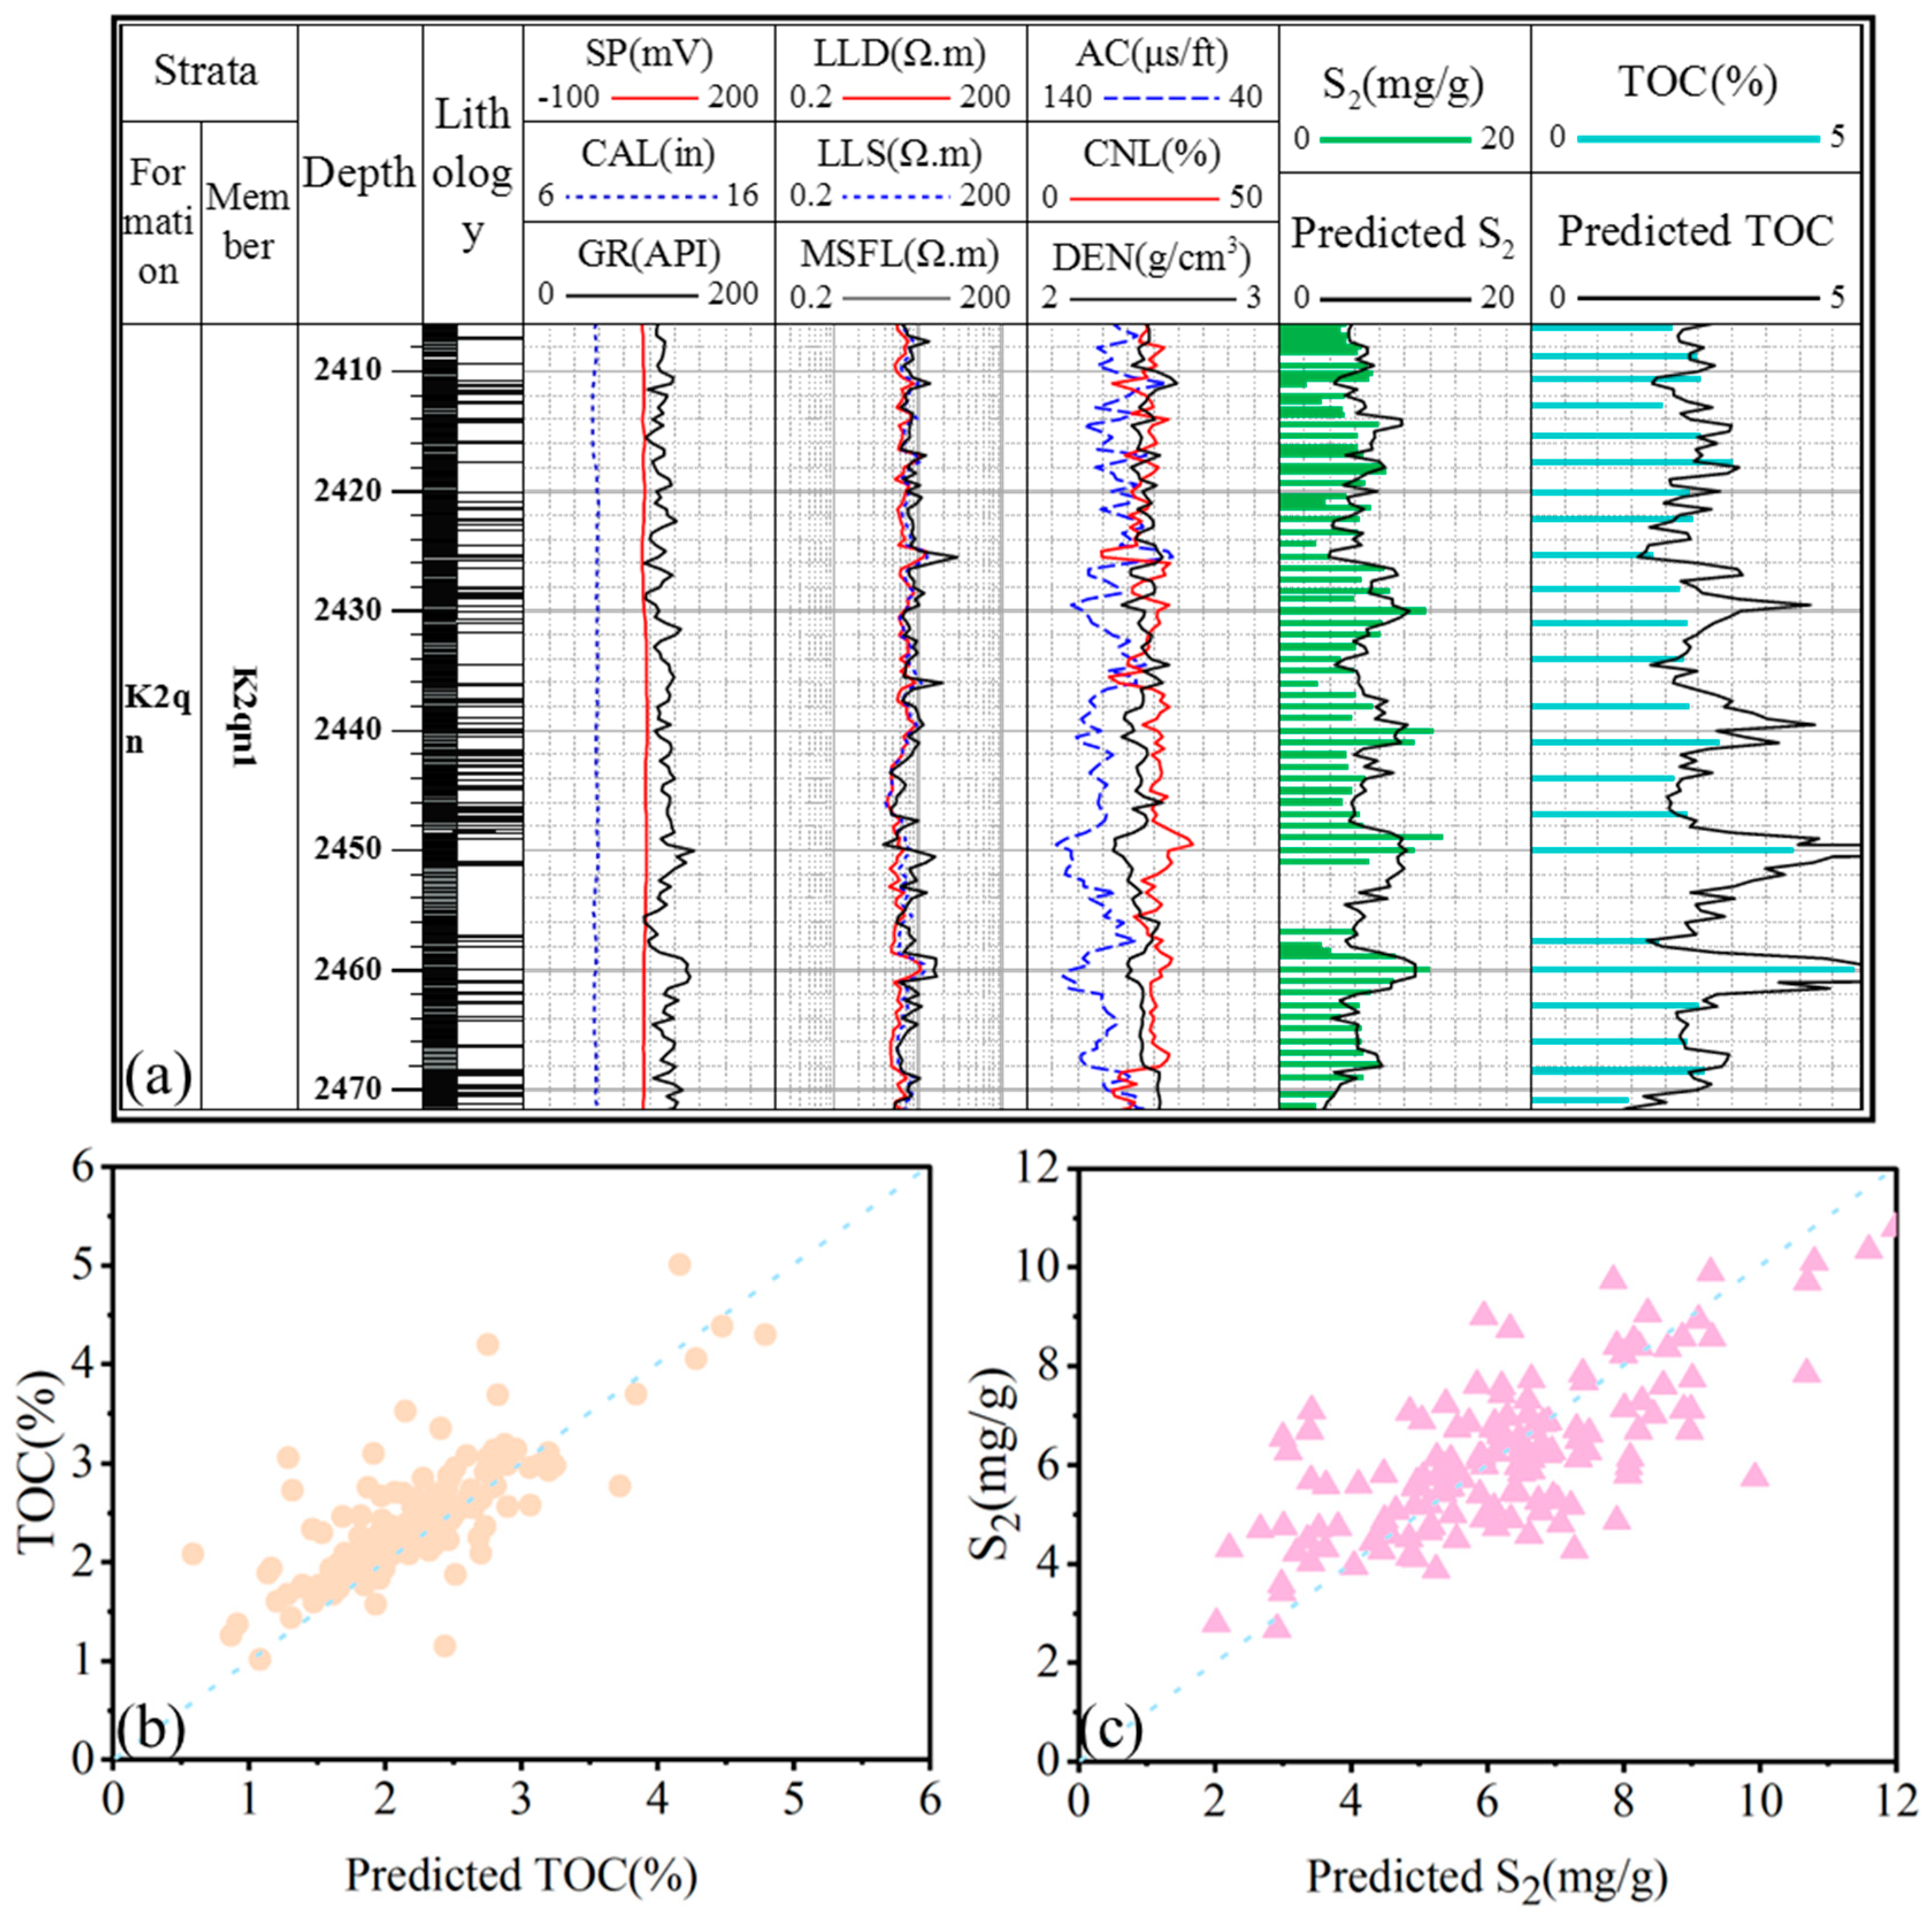
In principle, the measured TOC and S2 data from 201 wells can provide fundamental constraints for evaluating the planar distributions of TOC and S2 in the first member of the Qingshankou Formation in the Songliao Basin. However, to further achieve a refined and accurate quantitative characterization of the spatial distribution of geochemical parameters in K2qn1, well-logging data with broader spatial coverage were required. The ΔlogR method, an empirical model that integrates logging responses with maturity indicators, has been widely applied for TOC prediction due to its operational simplicity and strong adaptability. Accordingly, an improved ΔlogR method was employed in this study to characterize the vertical distributions of TOC and S2 in Well GY18 of K2qn1, providing a reliable basis for the subsequent construction of planar geochemical parameter distributions [41,42]. The good agreement between the predicted and measured results indicates that the ΔlogR method is applicable in the study area (Figure 5). Based on this model, TOC and S2 predictions were extended to 387 wells in K2qn1, and planar contour maps of TOC and S2 for the northern Songliao Basin were subsequently constructed.
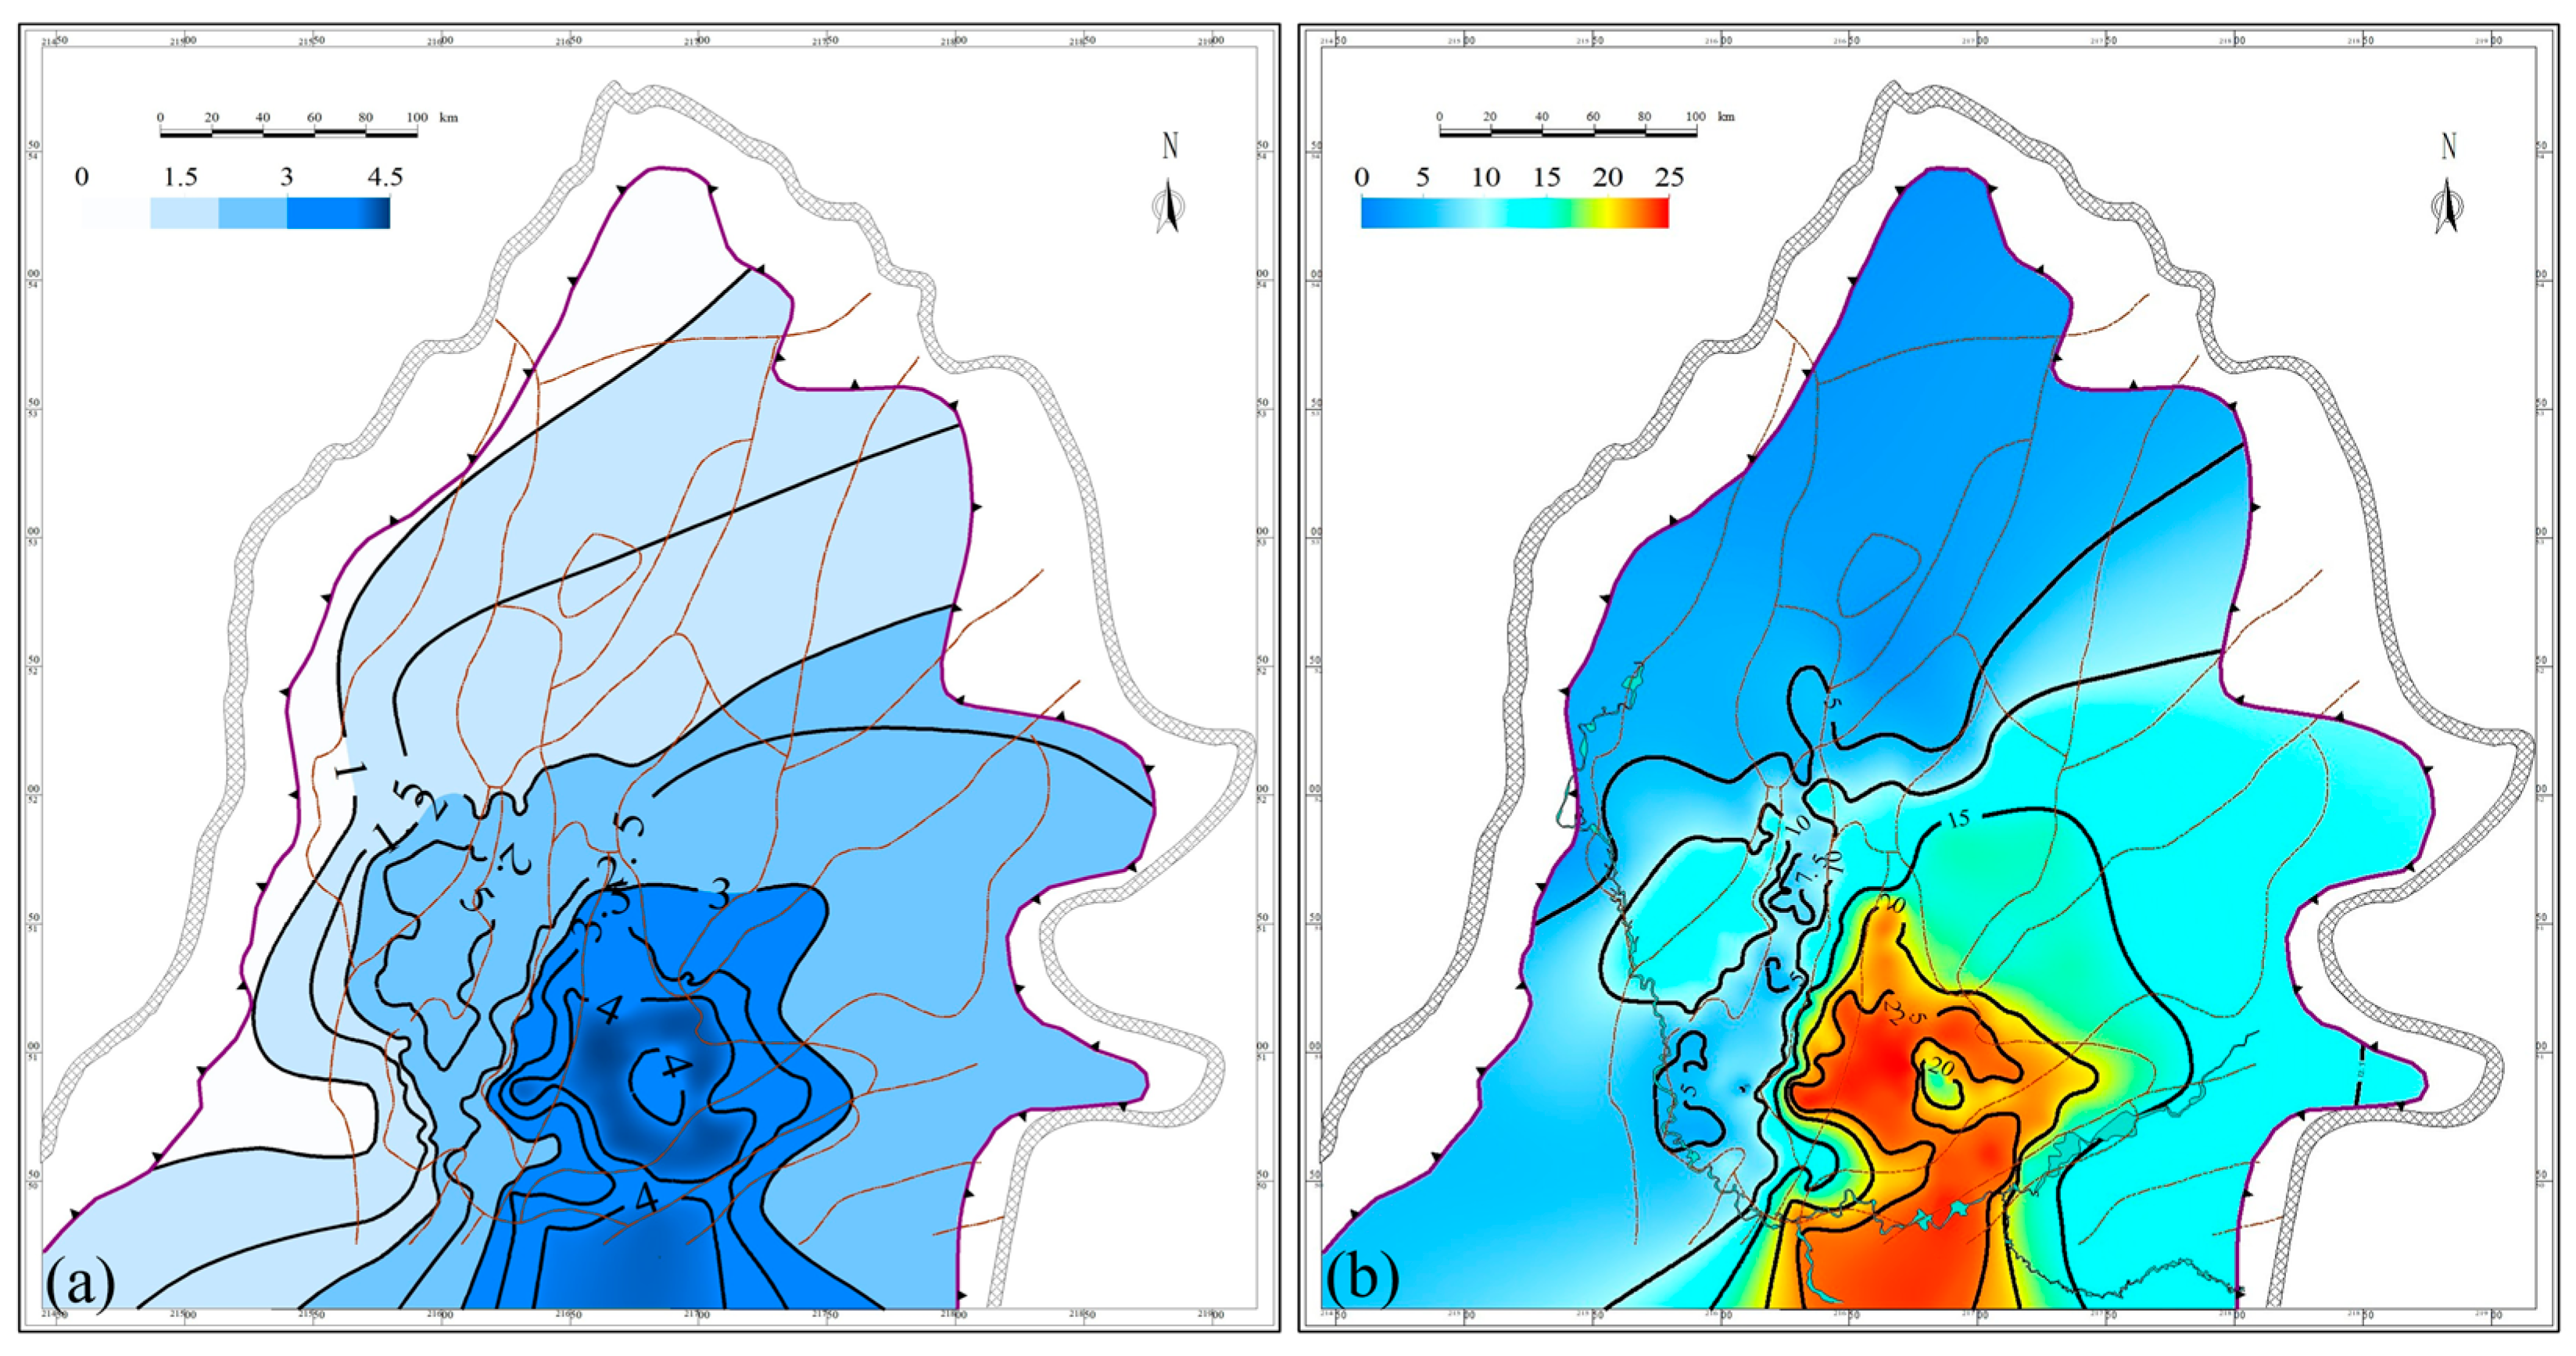
The distribution of TOC in K2qn1 exhibits an overall west-to-east decreasing trend, which may indicate the direction of lake transgression during the Qingshankou depositional period. Distinct differences are observed among the secondary structural units. The Sanzhao Sag shows the highest TOC values in the central and marginal areas, with maximum values approaching 4.3%, followed by a gradual decrease toward the periphery. Slightly lower TOC values in the central area are likely attributable to increased thermal maturity (Figure 6a). TOC values in the Daqing placanticline and Qijia–Gulong Sag are mainly concentrated in the range of 2.0–2.5%, suggesting that the central depression area was the principal depocenter during the Qingshankou period, with the Qijia–Gulong Sag and the Sanzhao Sag representing the lake-basin centers. Constrained by the relatively high thermal maturity in the Qijia–Gulong area, partial organic matter transformation has occurred, resulting in lower present-day TOC values compared with those in the Sanzhao Sag. Consistent with the TOC contour pattern, the S2 contour map also highlights high values in the Sanzhao Sag, where S2 reaches nearly 25 mg/g and decreases progressively outward from the sag center, whereas the Gulong Sag is strongly affected by maturity and exhibits relatively low present-day S2 values (Figure 6b).

4.2.3. TOC0 and HI0 Evalution

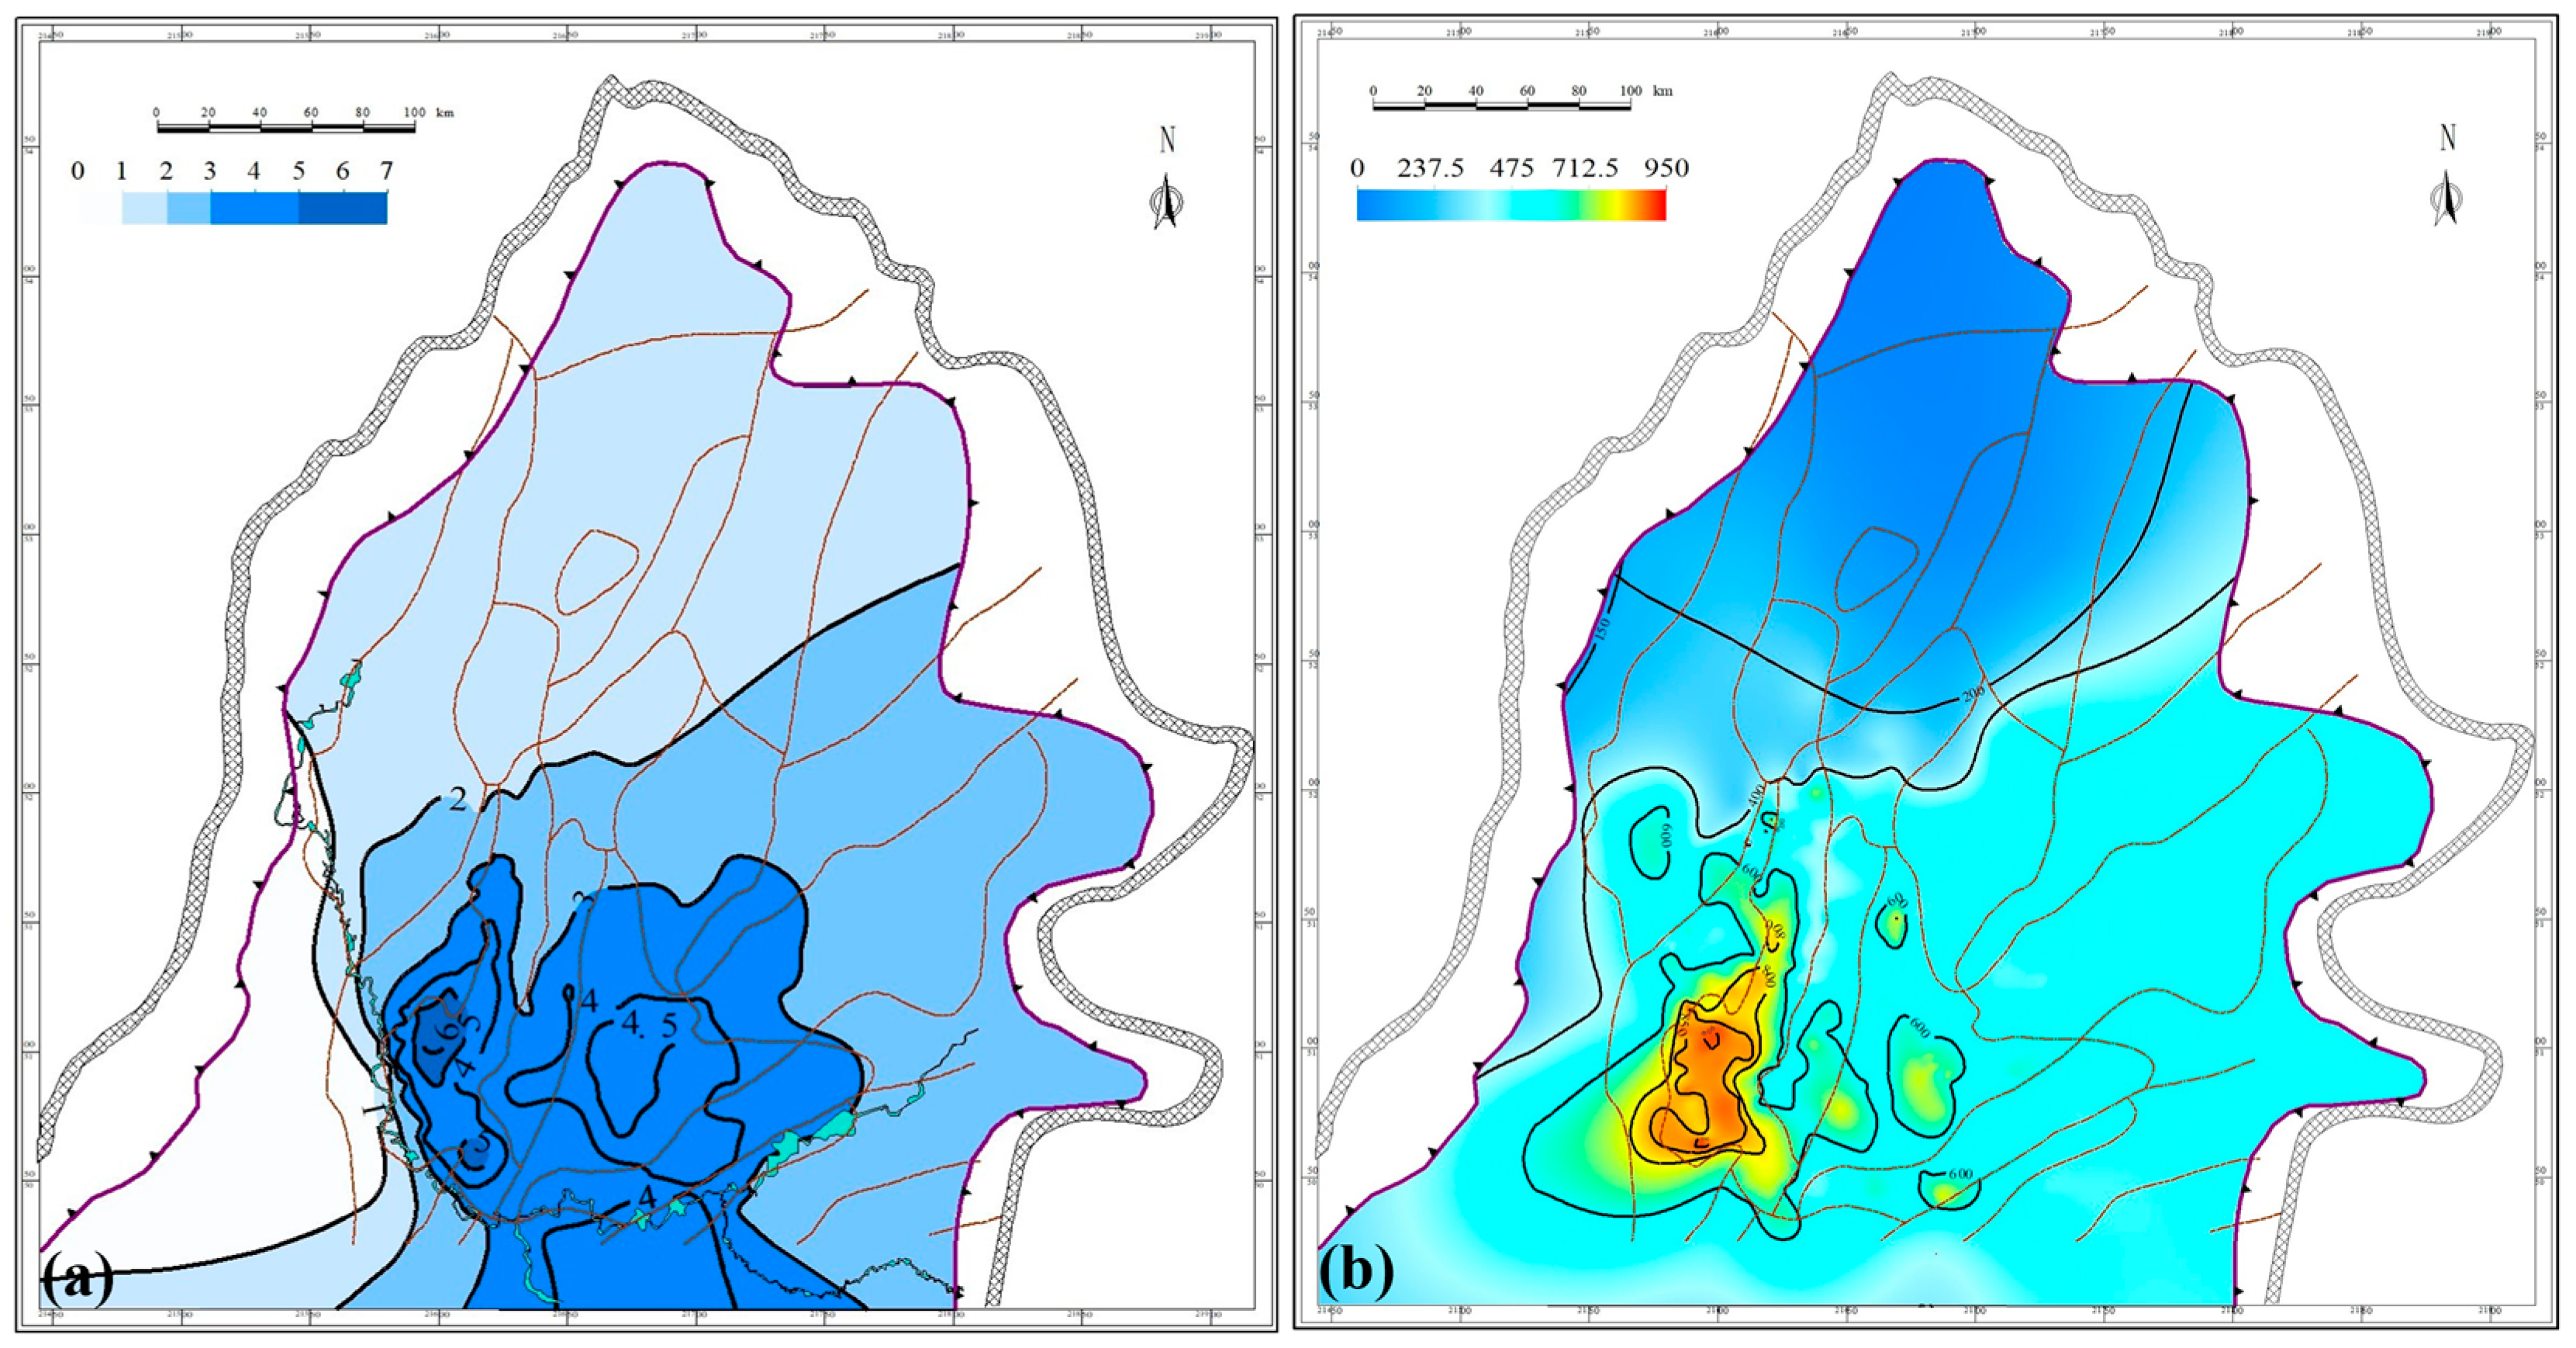
Given that the genetic method for hydrocarbon generation evaluation involves TOC0 and HI0, this study further applied an improved kerogen original hydrocarbon potential restoration model to reconstruct TOC0 and HI0 [46]. The results indicate that the Qijia-Gulong Sag exhibits the highest TOC0, ranging from 3% to 6%, followed by the Sanzhao Sag with 3–4.5%, while the DaQing Placanticline area shows slightly lower values (Figure 7a). This suggests that the Qijia-Gulong Sag and Sanzhao Sag were stable subsiding centers during the deposition of the Qingshankou Formation, a feature further supported by the greater thickness of source rock accumulation. Similarly, the HI0 of the Qingshankou Formation shows the highest values in the Qijia-Gulong Sag, ranging from 600 to 900 mg HC/g TOC, with the Sanzhao Sag slightly lower at 500–800 mg HC/g TOC (Figure 7b). The high original hydrocarbon potential in the Qijia-Gulong Sag and Sanzhao Sag aligns closely with the present-day shale oil development areas. The planar distribution of TOC0 and HI0 partially reveals the paleo-depositional environment and organic matter enrichment patterns of that period. From the perspective of TOC0, during the first member of the Qingshankou Formation, lake transgression occurred from the west, and the central depression served as the depositional center. During this period, secondary structural units in the central depression had not yet clearly formed, and, thus, the overall organic matter enrichment characteristics were largely consistent. This is also largely consistent with the sedimentary environment characteristics described in the relevant literature [32], indicating that during the first member of the Qingshankou Formation, the western and northern parts were partially influenced by sediment sources, while the eastern part experienced lacustrine transgression.

4.3. Hydrocarbon Generation Thermal Simulation and Kinetic Model

4.3.1. Hydrocarbon Generation Thermal Simulation Experiment

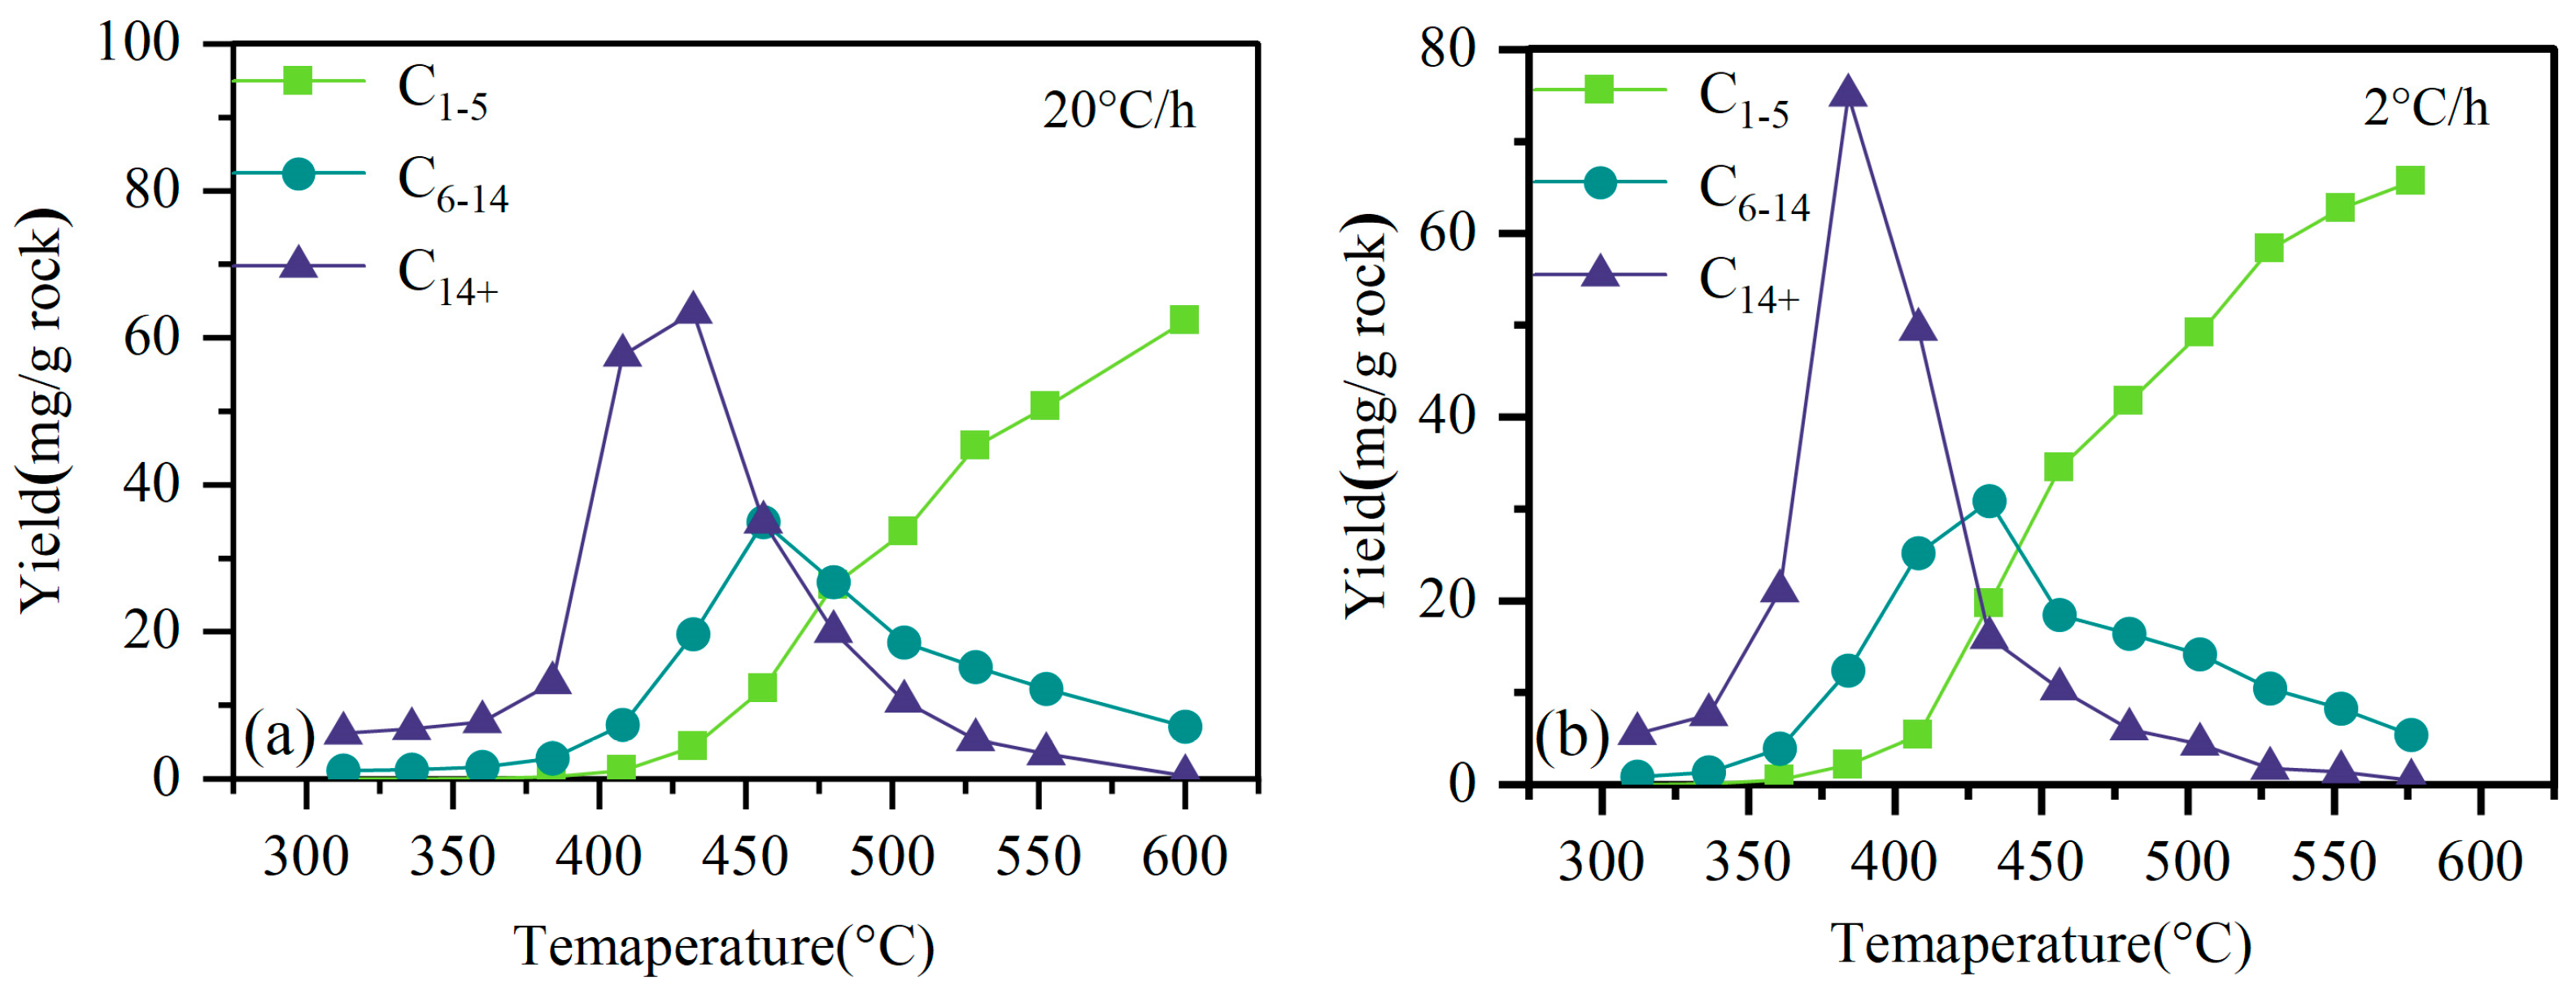
Figure 8 illustrates the evolution characteristics of different hydrocarbon components generated by the thermal pyrolysis of CY6801 source rock under two heating rates in a closed system. During the pyrolysis process, the yield of C1–5 increases with rising temperature or maturity, while the yields of C6–14 and C14+ components initially increase and then decrease with the increase in temperature or maturity. For instance, at a heating rate of 20 °C/h, as the temperature rises from 312.6 °C to 600 °C, the yield of C1–5 increases from 0 mg/g of rock to 62.28 mg/g of rock. At a heating rate of 2 °C/h, as the temperature rises from 312 °C to 576 °C, the yield of C1–5 increases from 0.02 mg/g of rock to 65.59 mg/g of rock.

4.3.2. Kinetic Model

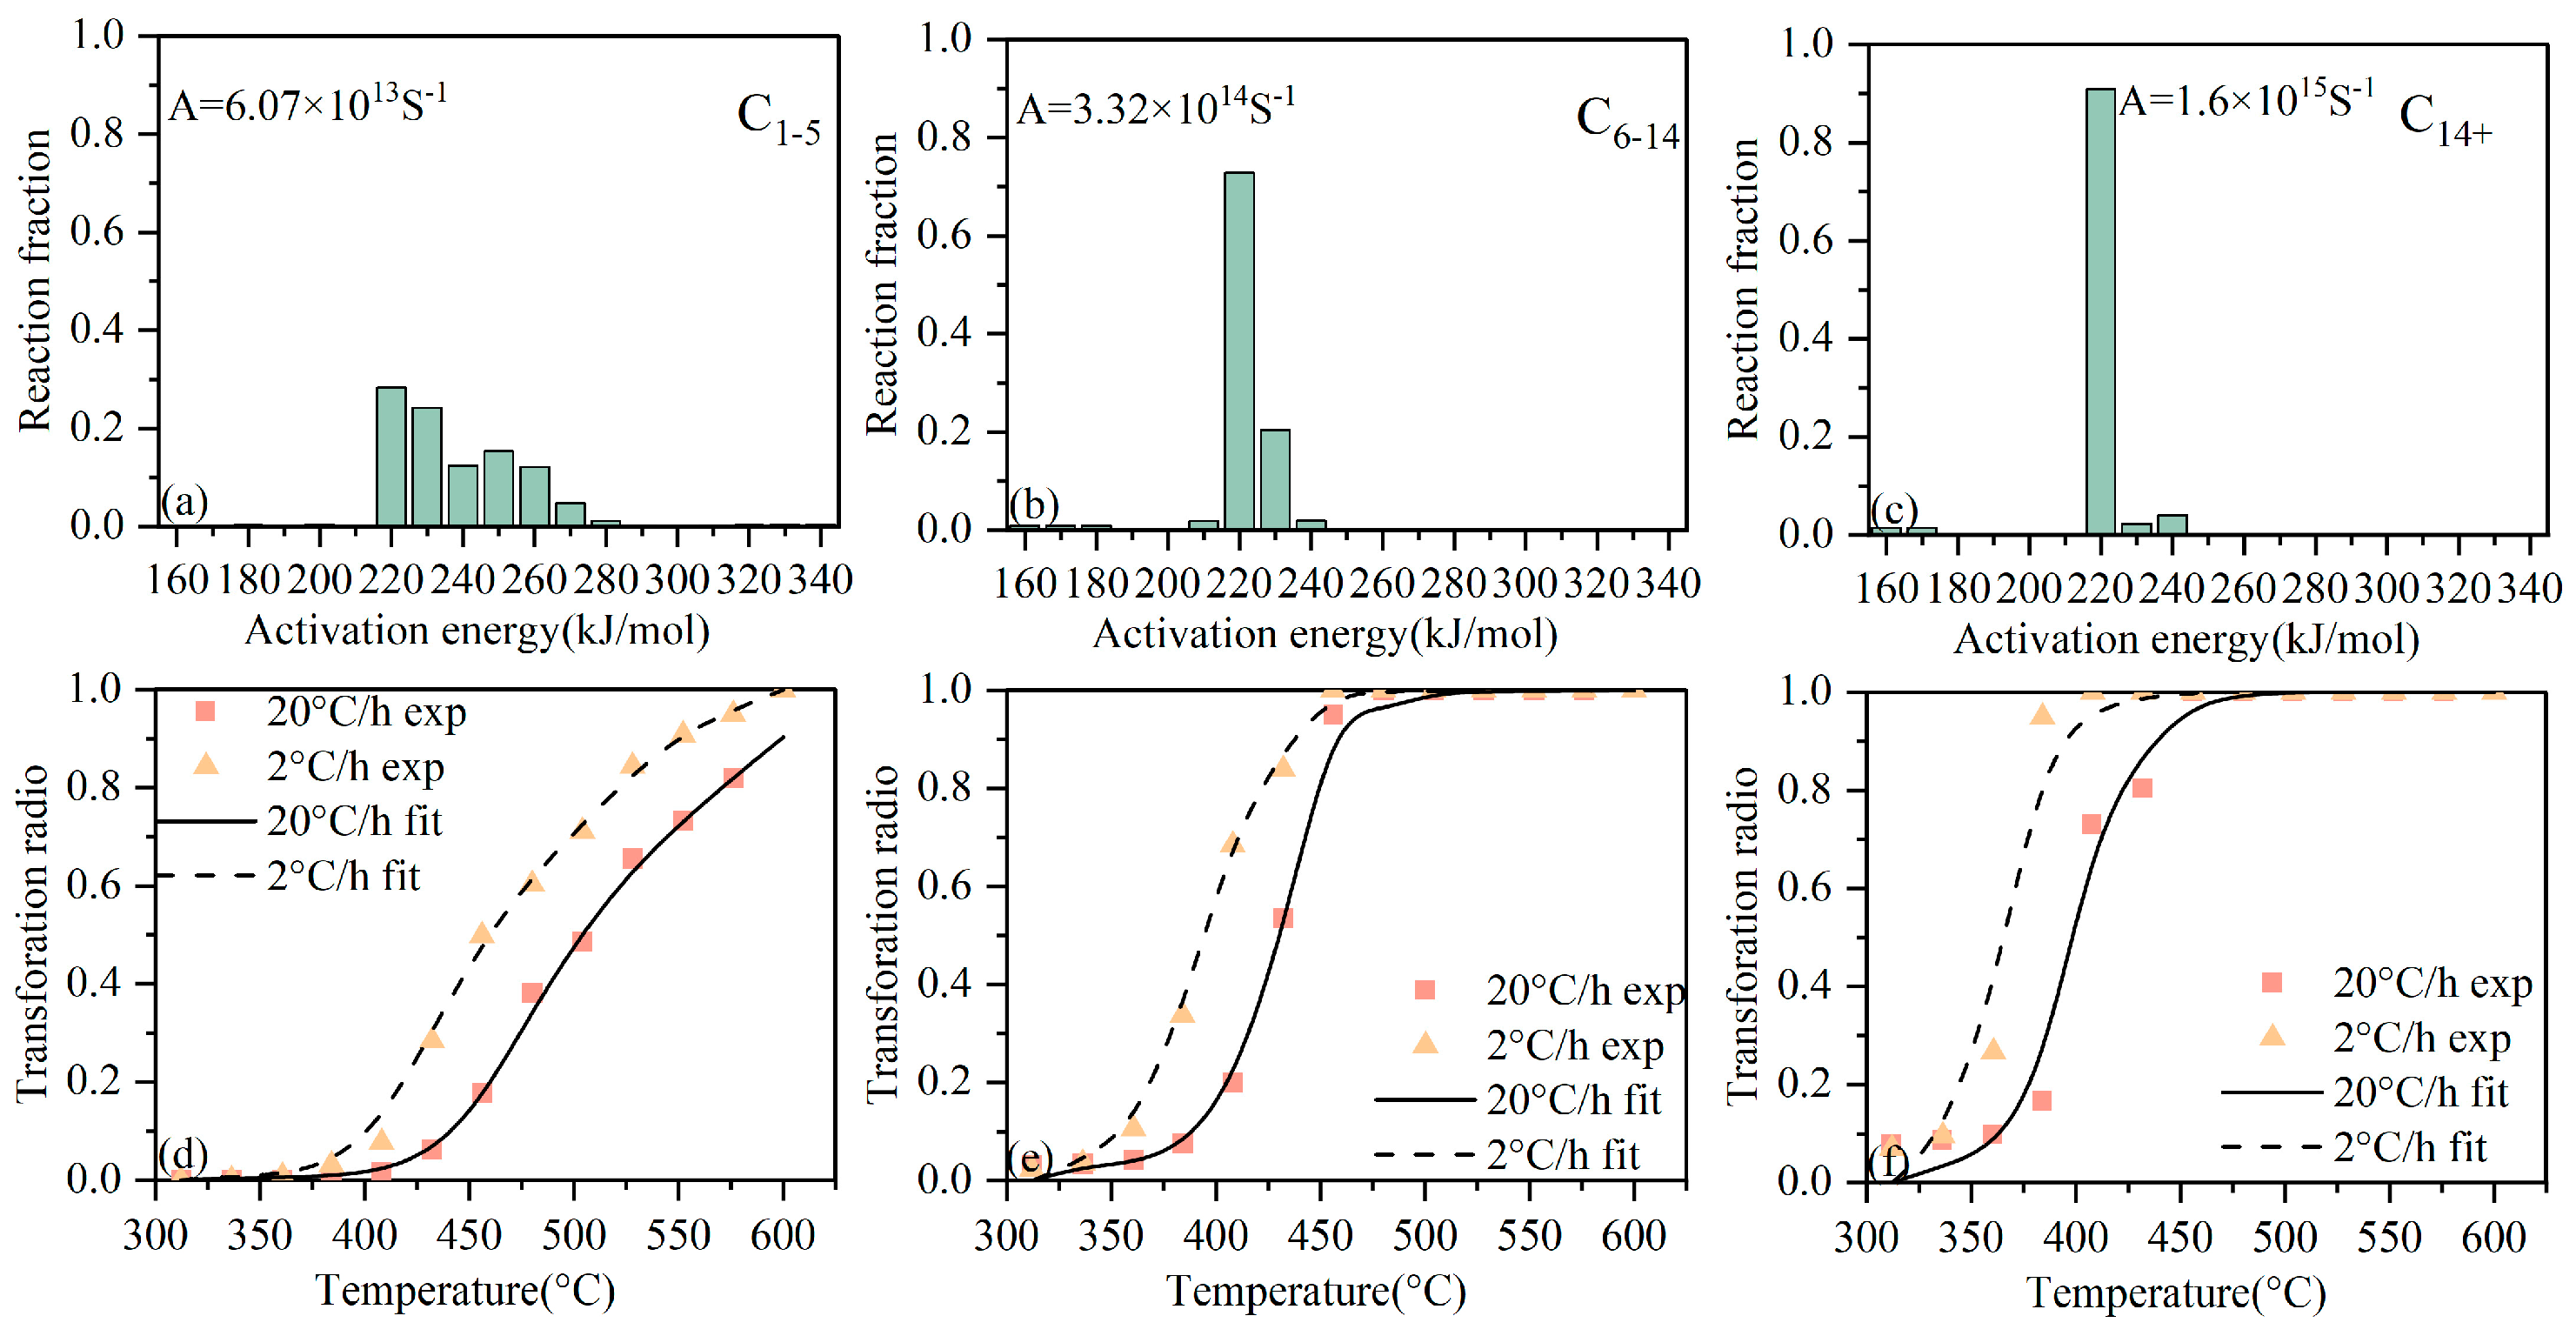
The kinetic parameters of K2qn1 were calibrated based on a parallel first-order reaction model (Figure 9). The pre-exponential factor for gas generation was 6.07 × 10¹⁴ s−1, with a peak activation energy of 238.3 kJ/mol. For light hydrocarbons, the pre-exponential factor was 3.32 × 10¹⁴ s−1, with an average activation energy of 221.03 kJ/mol. Heavy hydrocarbons exhibited a pre-exponential factor of 1.60 × 10¹⁵ s−1 and a peak activation energy of 219.56 kJ/mol. The activation energy distribution indicates that gas generation is more dispersed with a gradually decreasing average, consistent with the principle that lower-molecular-weight components have a broader range of sources under closed-system conditions. Meanwhile, the overall concentrated activation energy reflects the characteristics of Type I kerogen in the Qingshankou Formation [16,17].

4.4. Hydrocarbon Generation History and Potential

4.4.1. Hydrocarbon Generation History

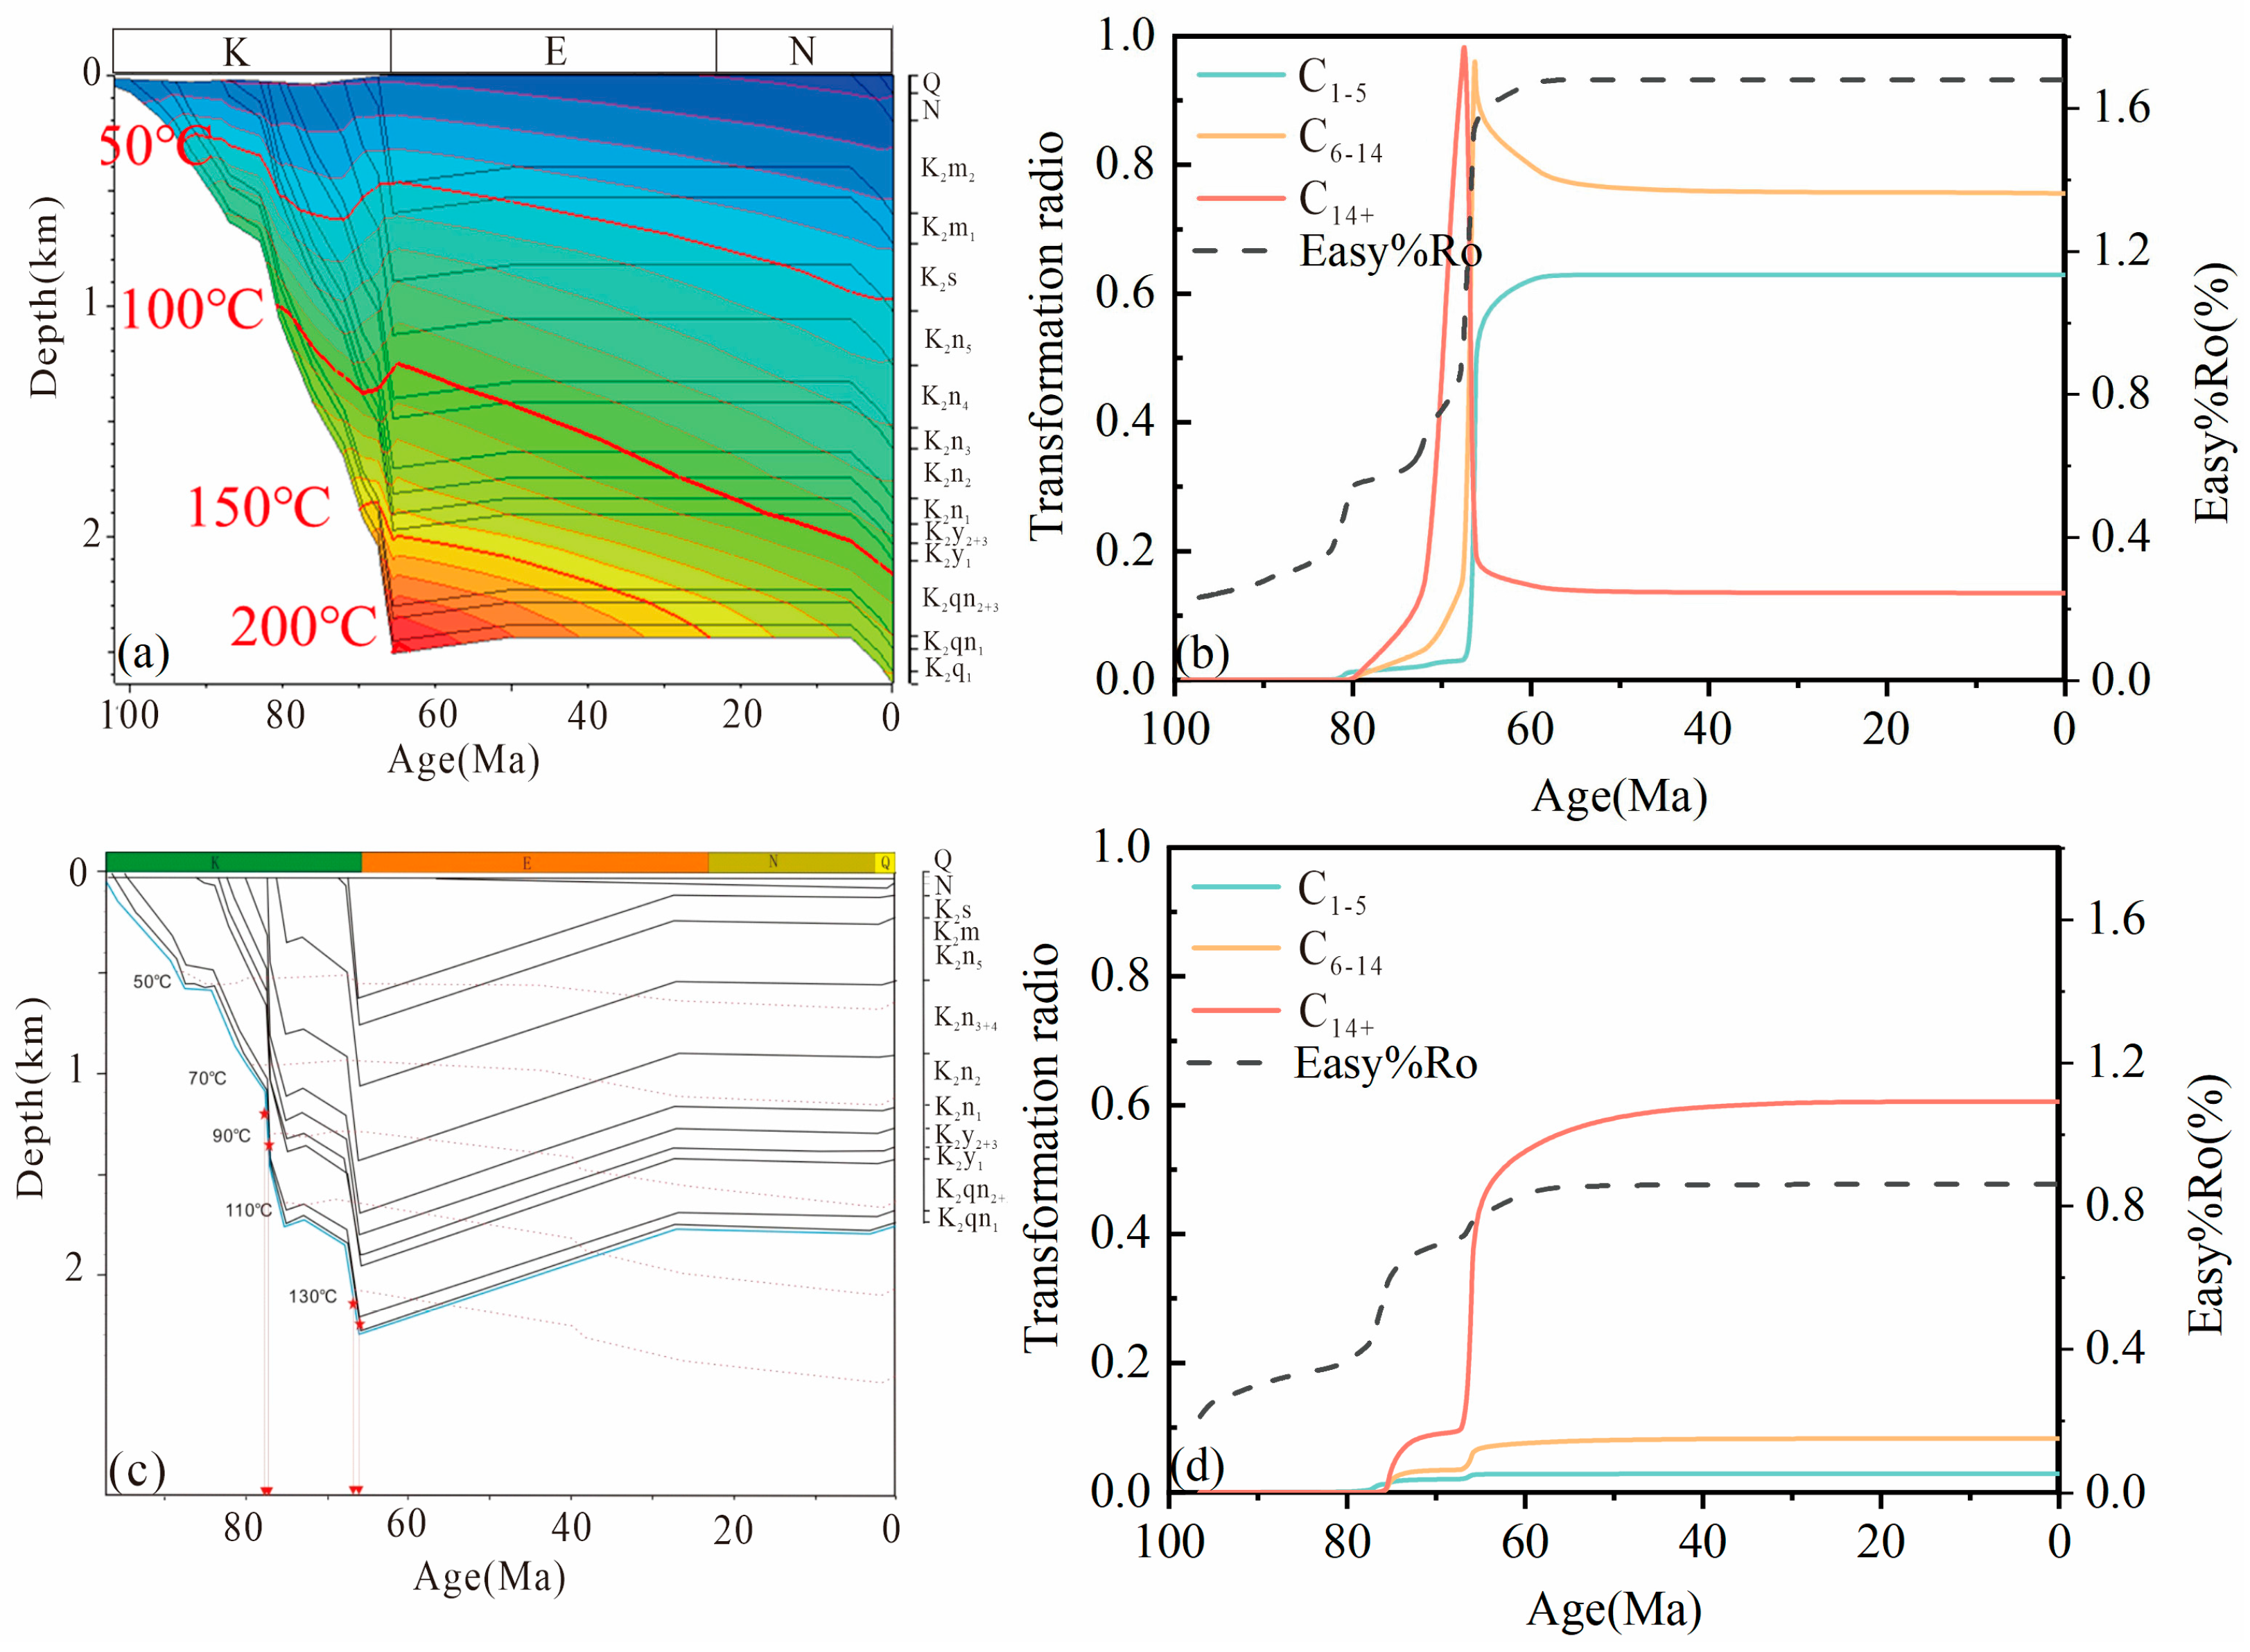
Based on the kinetic parameters of gas (C1–5), light oil (C6–14), and heavy oil (C14+) components, and combined with the geothermal history of the well GY1 (Figure 10a,c) and F23, the hydrocarbon generation history of each component was reconstructed (Figure 10b,d). The results indicate that shale oil in the Qijia-Gulong Sag underwent a brief and rapid hydrocarbon generation period under high geothermal gradient conditions, with heavy oil generated earlier than light oil, which, in turn, generated earlier than gas. Prior to erosion, the oil components reached peak generation and began partial cracking; after erosion, hydrocarbon generation essentially ceased. Specifically, in the Gulong Sag, the Qingshankou Formation underwent rapid burial during the early Late Cretaceous and reached the hydrocarbon generation threshold at 80 Ma (Ro = 0.55%), with a paleo geothermal gradient of 6–8 °C/100 m. Between 80 and 66 Ma (late Late Cretaceous), accelerated burial rates drove temperatures to a peak of 193 °C, triggering the primary hydrocarbon generation phase. Heavy oil reached its peak at 67.8 Ma and began to crack, while light oil (C6–14) peaked at 66.5 Ma. In the early Paleogene (66–60 Ma), erosion-related hydrocarbon generation occurred; despite erosion, temperature decreased only slightly, allowing continued generation of light and heavy oil. After 60 Ma, hydrocarbon generation largely ceased, with gas achieving a final conversion of approximately 60%. Considering the generation history and conversion rates of all components, the well GY1 is currently in the stage of light oil generation, with relatively light oil components. Compared to the Qijia-Gulong Sag, Well F23 in the Sanzhao Sag has a shallower burial depth and lower maturity. Specifically, Well F23 entered the hydrocarbon generation threshold at 67 Ma, after which it began to generate a large amount of oil, and currently primarily produces heavy oil (C14+).

4.4.2. Hydrocarbon Generation Transformation Ratio

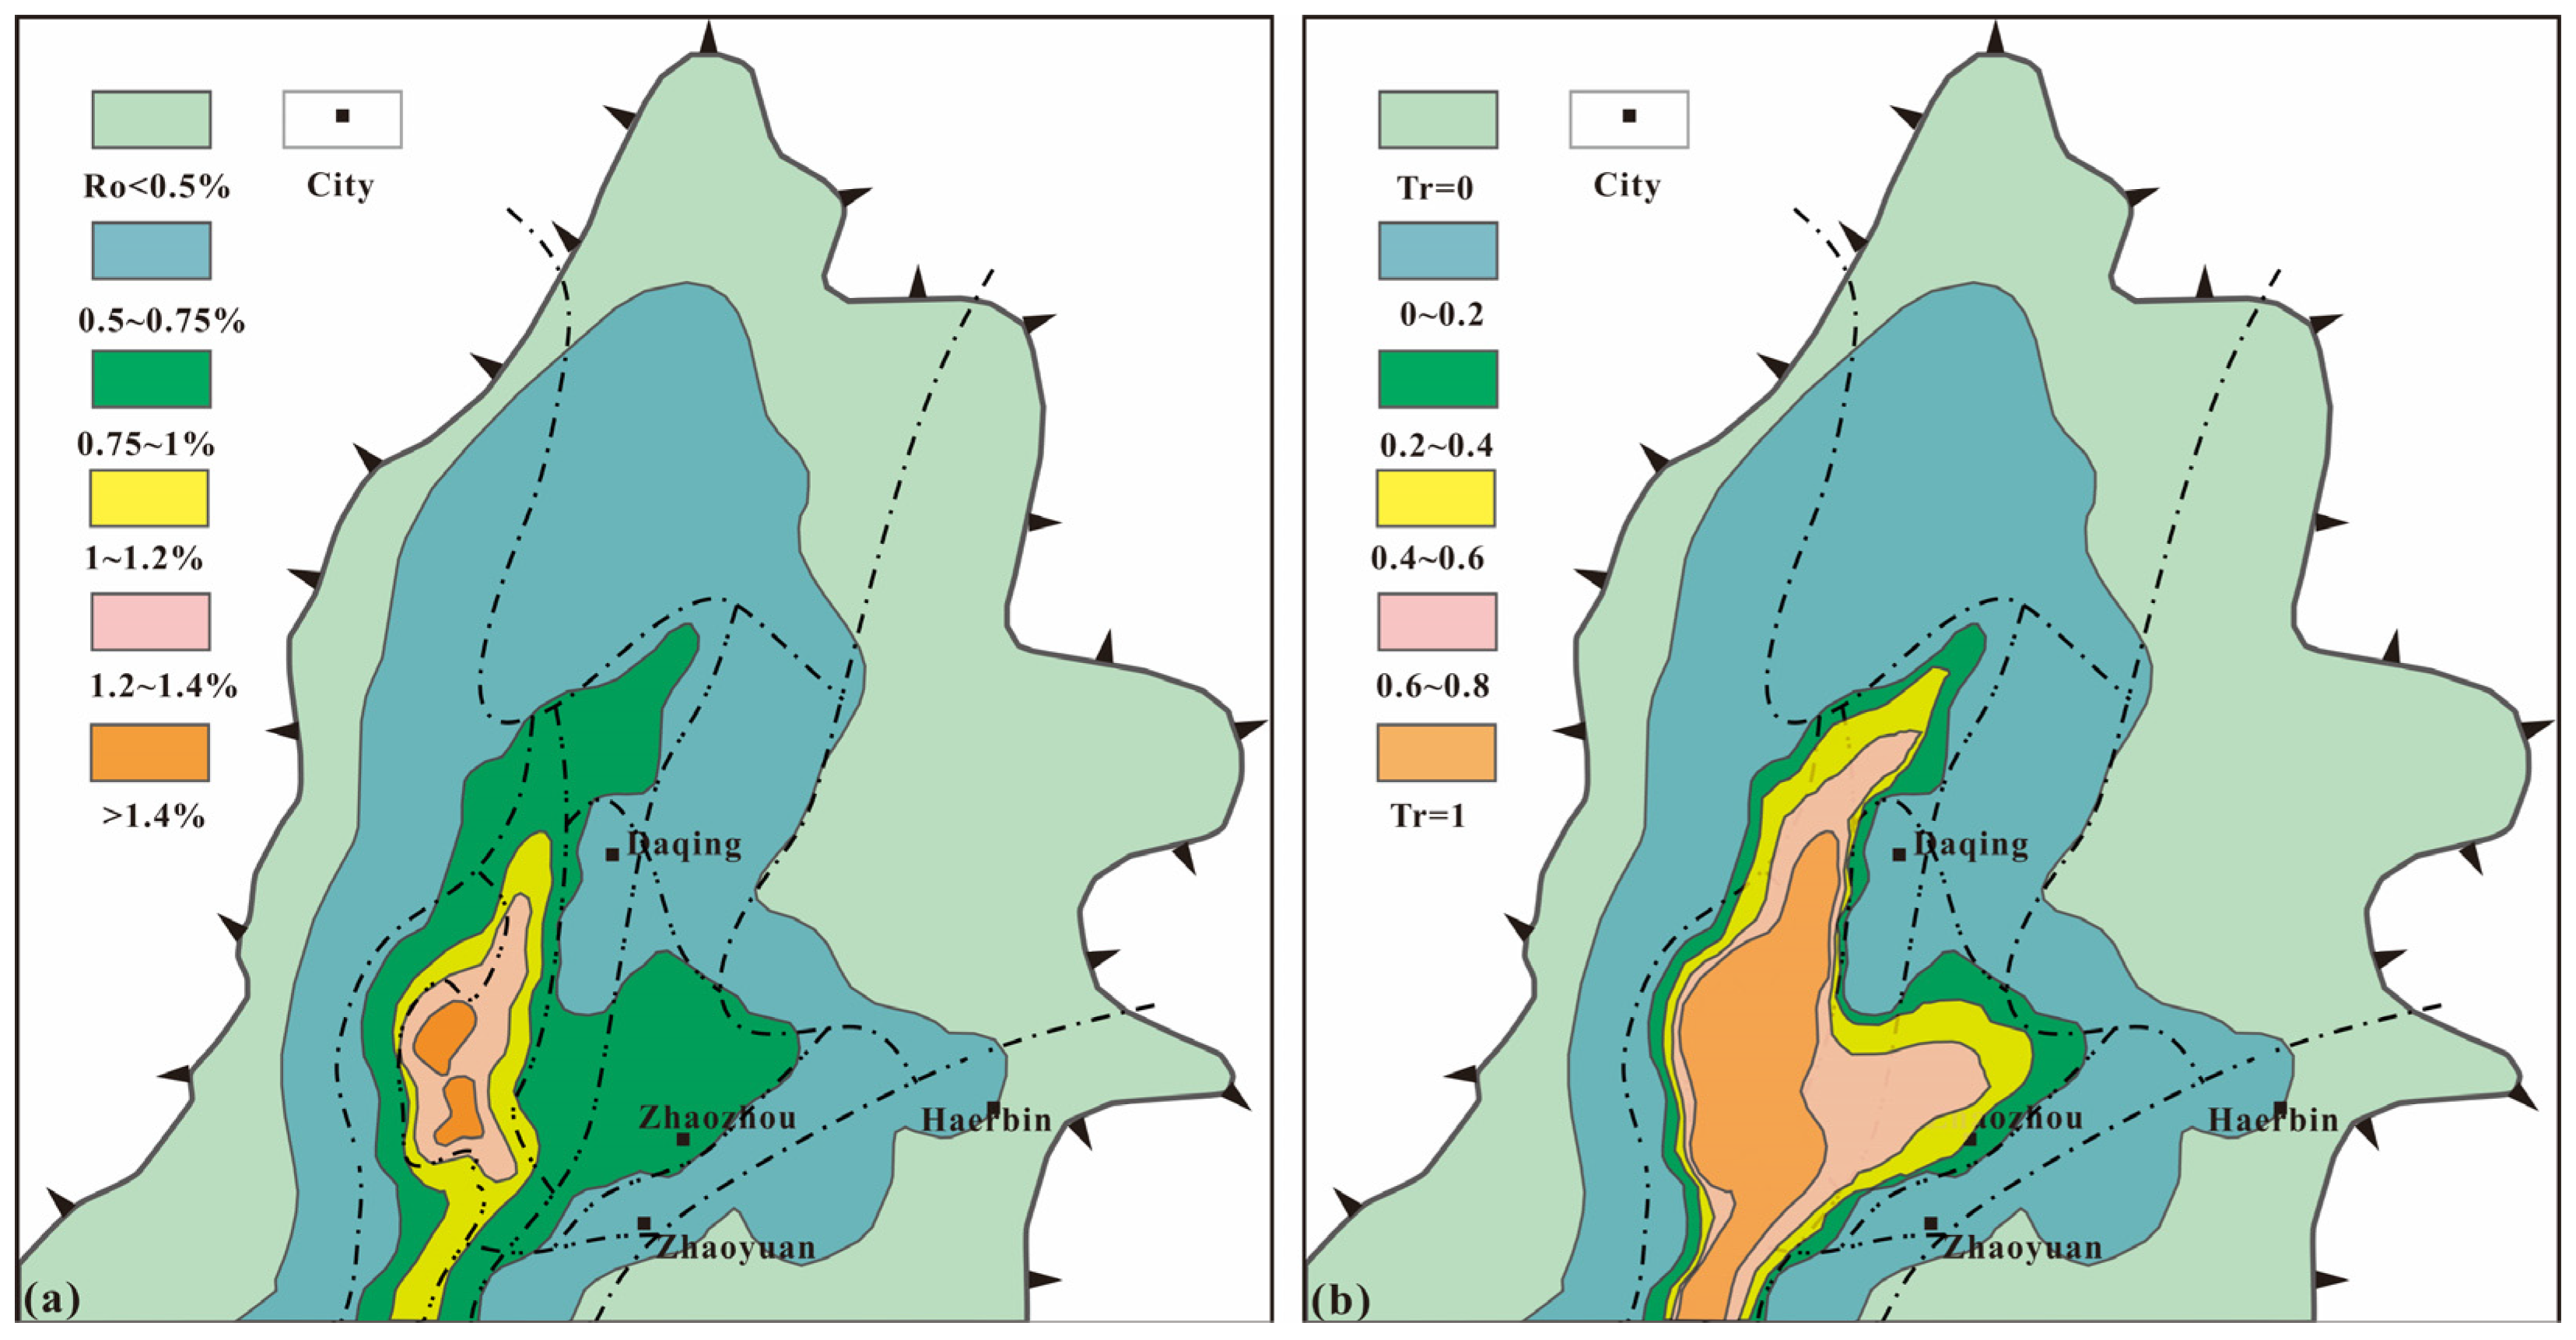
Based on the hydrocarbon generation history of each composition, the hydrocarbon transformation ratio of the K2qn1 in the Songliao Basin was mapped using the maturity spatial distribution. The results indicate significant differences in maturity among the secondary structural units of the central depression. The Gulong Sag exhibits a maturity range of 0.75–1.6%, corresponding to the mature to overmature stage, while the Sanzao Sag is slightly lower, with maturity between 0.75% and 1% in the mature stage (Figure 11a). The overall mature to overmature conditions of the basin provide geological support for the mobility of the Gulong shale oil. Under high maturity conditions, substantial kerogen cracking generates hydrocarbons; according to the hydrocarbon generation history, type I kerogen is nearly fully converted when Ro exceeds 1.0%, indicating that the kerogen in the Gulong Sag has undergone extensive hydrocarbon generation and that the Sanzao Sag is at its hydrocarbon peak (Figure 11b). Given the high hydrocarbon potential of type I kerogen, the Gulong and Sanzao sags are the primary accumulation zones for shale oil, as well as key source areas for conventional and tight oil reservoirs [29,31,47,48].

4.4.3. Resource Evaluation

Given that the genetic method effectively reflects the hydrocarbon generation potential and transformation efficiency of source rocks and is strongly supported by geological mechanisms, this study employs the genetic method to evaluate the hydrocarbon generation intensity of the Qingshankou Formation source rocks in the Songliao Basin. According to modern petroleum genesis theory, the volume of hydrocarbons generated per unit volume of source rock primarily depends on the abundance, type, and maturity of organic matter, where the type reflects the hydrocarbon generation capacity per unit mass of organic matter and maturity indicates the degree of organic matter conversion into hydrocarbons [21,22,23,24]. Therefore, the hydrocarbon generation volume can be calculated using the following formula:
Q = S i H i ρ i T O C 0 H I 0 X 0
where Q is the hydrocarbon generation volume, t; Si is the source rock area, km2; Hi is the source rock thickness, m; ρi is the source rock density, kg/m3; TOC0 is the original total organic carbon content; HI0 is the original hydrocarbon potential per unit mass of organic matter, mg HC/g TOC; and X0 is the transformation ratio of organic matter to hydrocarbons.
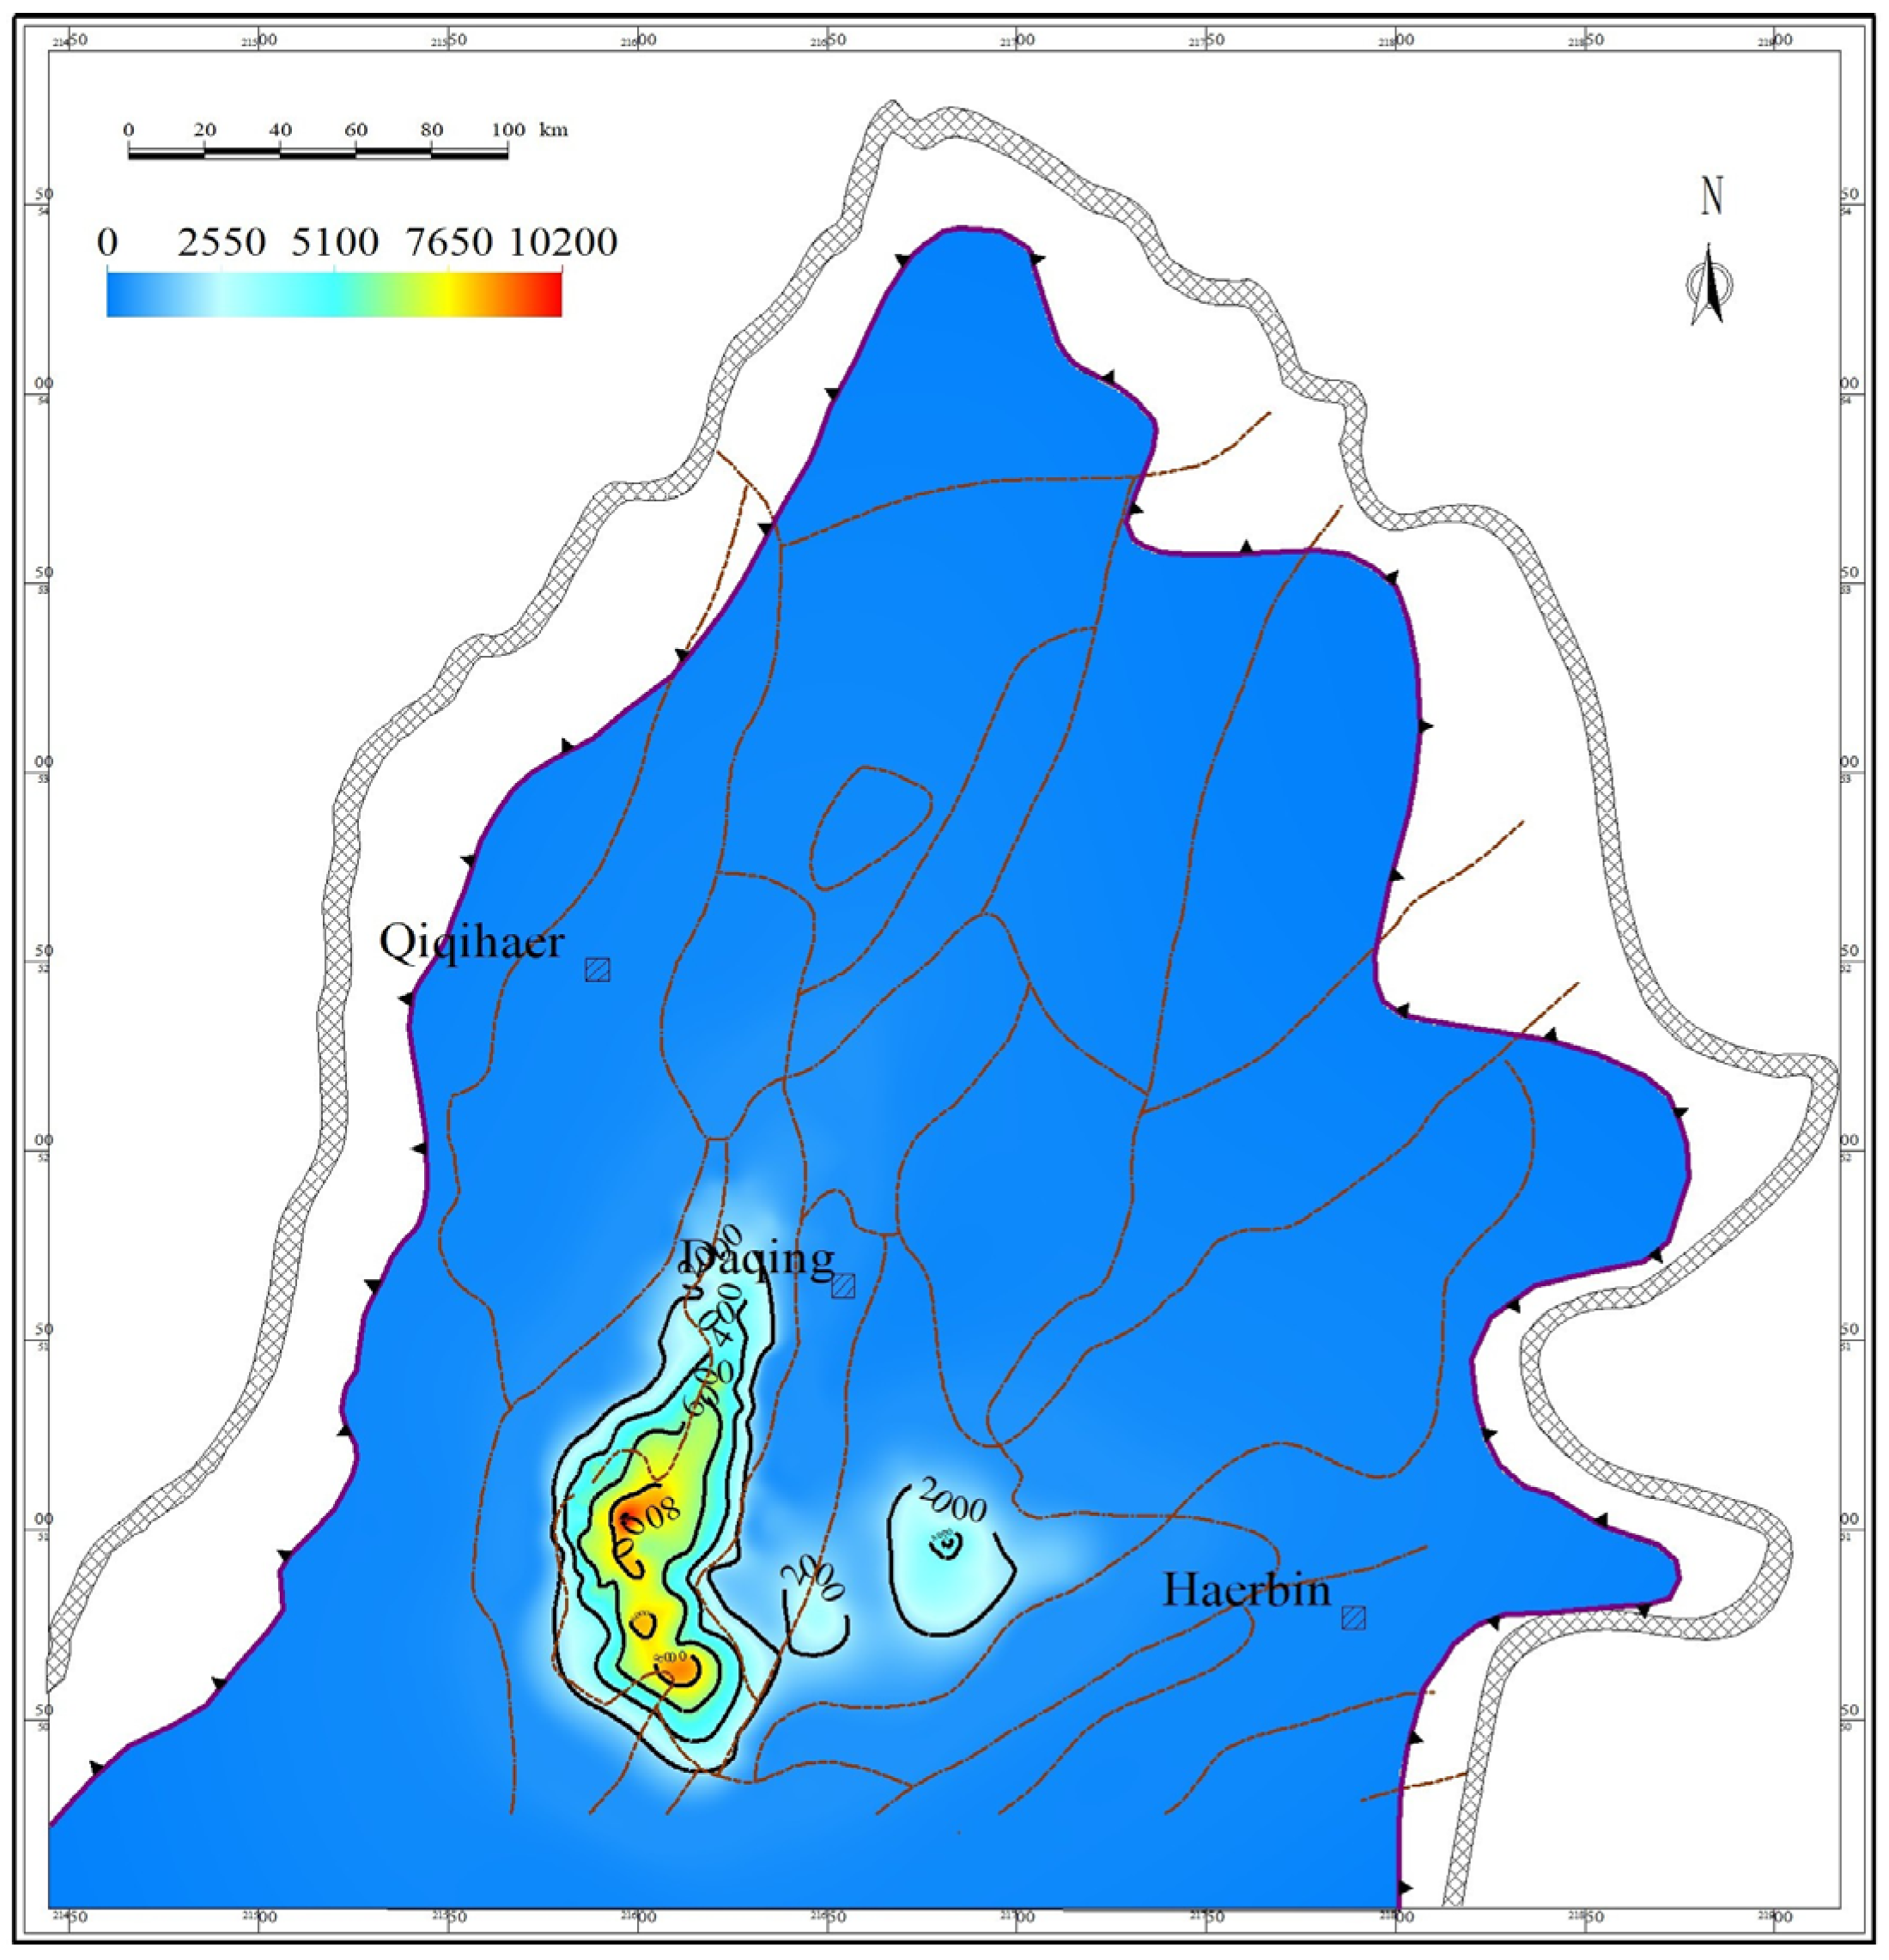
The source rock thickness was obtained from Figure 4 and the rock density was determined to be 2.40 × 10³ kg/m3 based on measured samples from Well GY1. The TOC0 and HI0 were taken from Figure 7, while the X0 was derived from Figure 11b. By integrating these parameters, the planar distribution of hydrocarbon generation intensity for the first member of the Qingshankou Formation in the Songliao Basin was delineated (Table 2, Figure 12). The contour map of hydrocarbon generation intensity indicates that the northern Songliao Basin is strongly controlled by thermal maturity. The Gulong Sag exhibits the highest generation intensity, generally exceeding 7000 kt/km2, with two major high-value centers located within the sag and a progressive decrease outward from these centers. The Sanzhao Sag is currently at the oil-generation stage (0.75% < Ro < 1.0%), with generation intensities mainly ranging from 3000 to 6000 kt/km2 and reaching approximately 6000 kt/km2 in the sag center. Owing to relatively higher maturity, the eastern wing of the Longhupao Terrace shows considerable hydrocarbon generation potential, and the southern part of the Daqing Anticline also exhibits moderate generation capacity. Based on the established contour map of hydrocarbon generation intensity for the first member of the Qingshankou Formation in the northern Songliao Basin, the cumulative hydrocarbon generation volumes of different secondary structural units were quantitatively calculated.
The cumulative hydrocarbon generation of the first member of the Qingshankou Formation is estimated at 506.55 × 10⁸ t. Among this total, the Qijia–Gulong Sag contributes 266.13 × 10⁸ t, followed by the Sanzhao Sag with 132.71 × 10⁸ t, the Longhupao Terrace with 66.81 × 10⁸ t, and the Daqing Placanticline with 40.90 × 10⁸ t. Previous genetic-method-based evaluations indicated that the hydrocarbon source rocks of the Qingshankou Formation in the Qijia–Gulong Sag generated approximately 195.95 × 10⁸ t of oil and 36.89 × 10¹¹ m3 of gas, which corresponds to a total hydrocarbon generation of about 232.84 × 10⁸ t in oil-equivalent terms [8]. Recent studies suggested hydrocarbon generation of up to 124 × 108 t in the Sanzhao Sag and 266 × 108 t in the Qijia–Gulong Sag [7]. The close agreement between these estimates and the results of this study demonstrates the robustness and reliability of the present hydrocarbon generation assessment. Furthermore, when combined with the shale oil resource potential of approximately 107.73 × 10⁸ t recovered from the Qijia–Gulong Sag based on pressure-retained coring techniques [6], the calculated expulsion efficiency of about 60% is consistent with previous understandings.

5. Conclusions

(1) The first member of the Qingshankou Formation in the Songliao Basin is characterized by high organic matter abundance, favorable kerogen type, and relatively high thermal maturity. Measured TOC values are mainly distributed between 2% and 3%, with hydrogen index values predominantly ranging from 600 to 800 mg/g TOC. Type I kerogen is dominant, and vitrinite reflectance values are mainly within 0.9–1.6%. Spatially, the source rock thickness of the first member is generally between 60 and 100 m. Results derived from the ΔlogR method and original hydrocarbon potential restoration indicate that the original TOC ranges from 3% to 6%, while the original HI varies between 600 and 900 mg HC/g TOC, collectively demonstrating a strong hydrocarbon generation potential.
(2) Hydrocarbon generation simulation experiments conducted on source rock samples indicate that oil generation dominates in the first member, whereas gas generation is relatively limited. The main activation energy distributions are consistent with the kinetic characteristics of Type I kerogen in the Qingshankou Formation. Integrated with burial and thermal history modeling of the well GY1, the hydrocarbon generation history suggests that the Qijia–Gulong Sag is currently within the light oil generation stage, characterized by lighter hydrocarbon compositions, lower density and viscosity, and favorable fluid mobility.
(3) Based on genetic method calculations, the cumulative hydrocarbon generation of the first member of the Qingshankou Formation is estimated to be 506.55 × 10⁸ t. Among different structural units, the Qijia–Gulong Sag contributes 266.13 × 10⁸ t, the Sanzhao Sag 132.71 × 10⁸ t, the Longhupao Terrace 66.81 × 10⁸ t, and the Daqing Anticline 40.90 × 10⁸ t, indicating that the Qijia–Gulong Sag represents the primary hydrocarbon generation center in the study area.

Author Contributions

Conceptualization, J.L. and F.C.; methodology, B.S.; software, G.Y.; validation, Q.Z.; formal analysis, J.L.; investigation, X.F.; resources, S.L.; data curation, Q.Z.; writing—original draft preparation, J.L.; writing—review and editing, J.L.; visualization, X.F.; supervision, B.S.; project administration, S.L.; funding acquisition, S.L. All authors have read and agreed to the published version of the manuscript.

Funding

This research was funded by the National Natural Science Foundation of China (No. 42272156).

Institutional Review Board Statement

Not applicable.

Informed Consent Statement

Informed consent was obtained from all subjects involved in this study.

Data Availability Statement

Data supporting the results can be found in the manuscript text, tables, and figures.

Conflicts of Interest

Authors Junhui Li, Fangju Chen, Xiuli Fu and Qiang Zhen were employed by the CNPC Daqing Oilfield Company Limited. The remaining authors declare that the research was conducted in the absence of any commercial or financial relationships that could be construed as a potential conflict of interest.

References

  1. Zhang, H.; Wang, X.; Jia, C.; Li, J.; Meng, Q.; Jiang, L.; Wang, Y.; Bai, X.; Zheng, Q. Whole Petroleum System and Hydrocarbon Accumulation Model in Shallow and Medium Strata in Northern Songliao Basin, NE China. Pet. Explor. Dev. 2023, 50, 784–797. [Google Scholar] [CrossRef]
  2. Wang, F.; Feng, W.; Pang, X.; Guo, Q.; Jia, C. Key problems and solutions in quantitative analysis of hydrocarbon generation, expulsion, migration and accumulation in whole petroleum system. Acta Pet. Sin. 2023, 44, 1434. [Google Scholar]
  3. Bai, X.; Lu, J.; Li, J.; Yang, L.; Sun, L.; Fu, X.; Li, X.; Zheng, Q. Hydrocarbon accumulation patterns and exploration potential of whole petroleum systems in northern Songliao Basin. Pet. Geol. Oilfield Dev. Daqing 2024, 43, 49–61. [Google Scholar]
  4. Jia, C.; Pang, X.; Song, Y. Basic Principles of the Whole Petroleum System. Pet. Explor. Dev. 2024, 51, 780–794. [Google Scholar] [CrossRef]
  5. Li, C.; Pang, X.; Huo, Z.; Wang, E.; Xue, N. A Revised Method for Reconstructing the Hydrocarbon Generation and Expulsion History and Evaluating the Hydrocarbon Resource Potential: Example from the First Member of the Qingshankou Formation in the Northern Songliao Basin, Northeast China. Mar. Pet. Geol. 2020, 121, 104577. [Google Scholar] [CrossRef]
  6. Sun, L.; Jia, C.; Zhang, J.; Cui, B.; Bai, J.; Huo, Q.; Xu, X.; Liu, W.; Zeng, H.; Liu, W. Resource potential of Gulong shale oil in the key areas of Songliao Basin. Acta Pet. Sin. 2024, 45, 1699–1714. [Google Scholar]
  7. Wang, X.; Bai, X.; Li, J.; Jin, Z.; Wang, G.; Chen, F.; Zheng, Q.; Hou, Y.; Yang, Q.; Li, J.; et al. Enrichment Model and Major Controlling Factors of Below-Source Tight Oil in Lower Cretaceous Fuyu Reservoirs in Northern Songliao Basin, NE China. Pet. Explor. Dev. 2024, 51, 279–291. [Google Scholar] [CrossRef]
  8. Chen, F.; Lu, S.; Ding, X. Evaluation on Hydrocarbon-generation Amount of Middle-shallow Source Rocks of Qijia-Gulong Depression in Songliao Basin. Acta Sedimentol. Sin. 2014, 32, 1181–1187. [Google Scholar] [CrossRef]
  9. Zhang, D.; Cao, H.; Lei, Y.; Wu, H.; Wang, X.; Guo, X.; Yan, J.; Wang, S.; Shi, T.; Li, H.; et al. A Study on Molecular Structural Evolution of Type II Kerogen in a Gold Tube Thermal System: Insights from Solid-State 13C NMR. Fuel 2023, 331, 125898. [Google Scholar] [CrossRef]
  10. Liu, C.; Wang, Z.; Guo, Z.; Hong, W.; Dun, C.; Zhang, X.; Li, B.; Wu, L. Enrichment and Distribution of Shale Oil in the Cretaceous Qingshankou Formation, Songliao Basin, Northeast China. Mar. Pet. Geol. 2017, 86, 751–770. [Google Scholar] [CrossRef]
  11. Sun, L.; He, L.; He, W.; Li, G.; Zhang, S.; Zhu, R.; Jin, X.; Meng, S.; Jiang, H. An analysis of major scientific problems and research paths of Gulong shale oil in Daqing Oilfield, NE China. Pet. Explor. Dev. 2021, 48, 527–540. [Google Scholar] [CrossRef]
  12. Wang, X.; He, K.; Zhang, S.; Feng, Z.; Meng, S.; Yang, C.; Wu, M. Vertical Heterogeneity of Gulong Shale Oil Governed by the OM Precursors and Oil Accumulation: Implications for Shale Oil Exploration in the Songliao Basin, Northeastern China. Mar. Pet. Geol. 2024, 163, 106803. [Google Scholar] [CrossRef]
  13. Feng, D.; Liu, C.; Yang, X.; Su, J.; Yang, H.; Han, Y. Pyrolysis Product Characteristics and Hydrocarbon Generation-Retention-Expulsion Model of Alkaline Lacustrine Organic-Rich Shale. Fuel 2025, 395, 135239. [Google Scholar] [CrossRef]
  14. Wang, M.; Lu, S.; Xue, H. Kinetic Simulation of Hydrocarbon Generation from Lacustrine Type I Kerogen from the Songliao Basin: Model Comparison and Geological Application. Mar. Pet. Geol. 2011, 28, 1714–1726. [Google Scholar] [CrossRef]
  15. Wang, M.; Li, Z.; Huang, W.; Yang, J.; Xue, H. Coal Pyrolysis Characteristics by TG–MS and Its Late Gas Generation Potential. Fuel 2015, 156, 243–253. [Google Scholar] [CrossRef]
  16. Song, B.; Xue, H.; Lu, S.; Wang, M.; Chen, F.; Li, J.; Zhou, N. Simulation Experiment Evaluation and Chemical Kinetics Prediction of the Composition of N-Alkanes Components. Fuel 2025, 399, 135620. [Google Scholar] [CrossRef]
  17. Song, B.; Chen, F.; Lu, S.; Wang, M.; Li, M.; Li, J.; Zhou, N.; Li, W. Phase Behavior Prediction of Medium to High Maturity Shale Oil in the Songliao Basin: Insights from Compositional Generation Kinetics. J. Anal. Appl. Pyrolysis 2026, 194, 107547. [Google Scholar] [CrossRef]
  18. Cao, H.; Lei, Y.; Wang, X.; Zou, Y.-R.; Peng, P. Molecular Structure Evolution of Type I Kerogen during Pyrolysis: Case Study from the Songliao Basin, NE China. Mar. Pet. Geol. 2021, 134, 105338. [Google Scholar] [CrossRef]
  19. Yan, Y.; Wang, M.; Misch, D.; Sachsenhofer, R.F.; Wu, Y.; Li, J. Mineral Diagenesis in Lacustrine Organic-Rich Shales: Evolution Pathways and Implications for Reservoir Characteristics. J. Asian Earth Sci. 2024, 263, 106026. [Google Scholar] [CrossRef]
  20. Wang, X.; Cui, B.; Feng, Z.; Shao, H.; Huo, Q.; Zhang, B.; Gao, B.; Zeng, H. In-Situ Hydrocarbon Formation and Accumulation Mechanisms of Micro- and Nano-Scale Pore-Fracture in Gulong Shale, Songliao Basin, NE China. Pet. Explor. Dev. 2023, 50, 1269–1281. [Google Scholar] [CrossRef]
  21. Jia, C.; Pang, X.; Guo, Q.; Chen, Z.; Wang, F.; Liu, G.; Gao, Y.; Shi, K.; Jiang, F.; Jiang, L. Assessment of oil-gas resources based on genetic method: Whole petroleum system theory and new generation basin modeling technology. Acta Pet. Sin. 2023, 44, 1399–1416. [Google Scholar]
  22. Liu, C.; Che, C.; Zhu, J.; Yang, H.; Liu, W.; Zhao, W. Comparison of Petroleum Resource Assessments of China by the U.S. Geological Survey and the China National Petroleum Assessment Team. Bulletin 2012, 96, 1415–1427. [Google Scholar] [CrossRef]
  23. Niu, D.; Li, T.; Bai, Y.; Sun, P.; Dang, H.; Li, Y.; Tao, L.; Lei, X.; Li, S.; Gui, L.; et al. Restoring the Original Hydrocarbon-Generating Potential of Deep Source Rocks: A Critical Review and a Novel Method Using the Songliao Basin, China, as a Case Study. Int. J. Coal Geol. 2025, 303, 104741. [Google Scholar] [CrossRef]
  24. Wei, Y.; Liu, Q.; Zhu, D.; Meng, Q.; Xu, H.; Zhang, W.; Wu, X.; Li, P.; Huang, X.; Mou, Y.; et al. Helium and Natural Hydrogen in the Bohai Bay Basin, China: Occurrence, Resources, and Exploration Prospects. Appl. Energy 2025, 383, 125398. [Google Scholar] [CrossRef]
  25. Guo, Z.; Zhao, W.; Liu, W.; Jiang, H.; Gu, Z.; Xie, Z. A Comprehensive Review of the Characteristics, Formation, Evolution, Resource Potential, and Ultradeep Exploration Fields of Oil-Cracking Gas in the Ediacaran–Cambrian Formations of the Sichuan Super Gas Basin. Mar. Pet. Geol. 2025, 173, 107271. [Google Scholar] [CrossRef]
  26. Gao, Y.; Zhu, W.; Peng, G.; Long, Z.; Wang, X.; Shi, C.; Chen, C.; Huang, Y.; Zhang, B. Evaluation of Source Rocks and Prediction of Oil and Gas Resources Distribution in Baiyun Sag, Pearl River Mouth Basin, China. Pet. Explor. Dev. 2024, 51, 1138–1150. [Google Scholar] [CrossRef]
  27. Li, Z.-Q.; Chen, J.-L.; Zou, H.; Wang, C.-S.; Meng, Q.-A.; Liu, H.-L.; Wang, S.-Z. Mesozoic–Cenozoic Tectonic Evolution and Dynamics of the Songliao Basin, NE Asia: Implications for the Closure of the Paleo-Asian Ocean and Mongol-Okhotsk Ocean and Subduction of the Paleo-Pacific Ocean. Earth-Sci. Rev. 2021, 218, 103471. [Google Scholar] [CrossRef]
  28. Li, C.; Yan, W.; Wu, H.; Tian, H.; Zheng, J.; Yu, J.; Feng, Z.; Xu, H. Calculation of Oil Saturation in Clay-Rich Shale Reservoirs: A Case Study of Qing 1 Member of Cretaceous Qingshankou Formation in Gulong Sag, Songliao Basin, NE China. Pet. Explor. Dev. 2022, 49, 1351–1363. [Google Scholar] [CrossRef]
  29. Wang, Y.; Li, P.; Feng, Z.; Shao, H.; Jia, Z.; Xia, Y.; Li, J.; Wang, Z. Geochemical Characteristics of Shales from the First Member of Qingshankou Formation in Gulong Sag, Songliao Basin, China: Implication for Mechanism of Organic Matter Enrichment. Mar. Pet. Geol. 2023, 150, 106142. [Google Scholar] [CrossRef]
  30. Liu, B.; Wang, H.; Fu, X.; Bai, Y.; Bai, L.; Jia, M.; He, B. Lithofacies and Depositional Setting of a Highly Prospective Lacustrine Shale Oil Succession from the Upper Cretaceous Qingshankou Formation in the Gulong Sag, Northern Songliao Basin, Northeast China. Bulletin 2019, 103, 405–432. [Google Scholar] [CrossRef]
  31. He, W.; Zhu, R.; Cui, B.; Zhang, S.; Meng, Q.; Bai, B.; Feng, Z.; Lei, Z.; Wu, S.; He, K.; et al. The Geoscience Frontier of Gulong Shale Oil: Revealing the Role of Continental Shale from Oil Generation to Production. Engineering 2023, 28, 79–92. [Google Scholar] [CrossRef]
  32. Li, M.; Wang, M.; Zhao, C.; Zhang, J.; Liu, Z.; Zhao, X.; Li, J.; Chen, J. Compositional Differences of Near-Critical Petroleum from Closed Pores to Wellhead in Gulong Shale Oil Play, Songliao Basin, NE China. Mar. Pet. Geol. 2024, 167, 106968. [Google Scholar] [CrossRef]
  33. Lu, S.; Li, J.; Xue, H.; Chen, F.; Xu, Q.; Wang, M.; Li, W.; Pang, X. Pyrolytic Gaseous Hydrocarbon Generation and the Kinetics of Carbon Isotope Fractionation in Representative Model Compounds with Different Chemical Structures. Geochem. Geophys. Geosyst. 2019, 20, 1773–1793. [Google Scholar] [CrossRef]
  34. Lu, S.-F.; Feng, G.-Q.; Shao, M.-L.; Li, J.-J.; Xue, H.-T.; Wang, M.; Chen, F.-W.; Li, W.-B.; Pang, X.-T. Kinetics and Fractionation of Hydrogen Isotopes during Gas Formation from Representative Functional Groups. Pet. Sci. 2021, 18, 1021–1032. [Google Scholar] [CrossRef]
  35. Huang, Y.; Liao, Y.; Pan, Y.; Hsu, C.S.; Wang, Y.; Peng, P. Improved Light Hydrocarbons Collection Method for the Pyrolysis of Crude Oil in Gold Tube Closed System Experiments. Org. Geochem. 2022, 168, 104432. [Google Scholar] [CrossRef]
  36. Huang, Y.; Liao, Y.; Xu, T.; Wang, Y.; Peng, P. Characteristics of Light Hydrocarbons under the Superimposed Influence of Biodegradation and Subsequent Thermal Maturation. Org. Geochem. 2023, 177, 104557. [Google Scholar] [CrossRef]
  37. Ungerer, P. State of the Art of Research in Kinetic Modelling of Oil Formation and Expulsion. Org. Geochem. 1990, 16, 1–25. [Google Scholar] [CrossRef]
  38. Pepper, A.S.; Dodd, T.A. Simple Kinetic Models of Petroleum Formation. Part II: Oil-Gas Cracking. Mar. Pet. Geol. 1995, 12, 321–340. [Google Scholar] [CrossRef]
  39. Dieckmann, V.; Keym, M. A New Approach to Bridge the Effect of Organofacies Variations on Kinetic Modelling and Geological Extrapolations. Org. Geochem. 2006, 37, 728–739. [Google Scholar] [CrossRef]
  40. Behar, F.; Roy, S.; Jarvie, D. Artificial Maturation of a Type I Kerogen in Closed System: Mass Balance and Kinetic Modelling. Org. Geochem. 2010, 41, 1235–1247. [Google Scholar] [CrossRef]
  41. Liu, C.; Zhao, W.; Sun, L.; Zhang, Y.; Chen, X.; Li, J. An Improved ΔlogR Model for Evaluating Organic Matter Abundance. J. Pet. Sci. Eng. 2021, 206, 109016. [Google Scholar] [CrossRef]
  42. Xue, H.; Dong, Z.; Tian, S.; Lu, S.; Greenwell, H.C.; Luo, P.; Zhang, W.; Lu, S.; Wang, M.; Ma, W.; et al. Calculation and Controlled Factors of Hydrocarbon Expulsion Efficiency Using Corrected Pyrolysis Parameters: A Songliao Case Study. J. Pet. Sci. Eng. 2022, 208, 109026. [Google Scholar] [CrossRef]
  43. Chen, Z.; Qiao, R.; Li, C.; Wang, D.; Gao, Y. Hydrocarbon Generation Potential and Model of the Deep Lacustrine Source Rocks in the Dongying Depression, Bohai Bay Basin. Mar. Pet. Geol. 2022, 140, 105656. [Google Scholar] [CrossRef]
  44. Xu, H.; Xie, Q.; Wang, S.; Yu, S. Organic Geochemical Characteristics and Gas Prospectivity of Permian Source Rocks in Western Margin of Songliao Basin, Northeastern China. J. Pet. Sci. Eng. 2021, 205, 108863. [Google Scholar] [CrossRef]
  45. Zhang, S.; Zhang, B.; Wang, X.; Feng, Z.; He, K.; Wang, H.; Fu, X.; Liu, Y.; Yang, C. Gulong Shale Oil Enrichment Mechanism and Orderly Distribution of Conventional– Unconventional Oils in the Cretaceous Qingshankou Formation, Songliao Basin, NE China. Pet. Explor. Dev. 2023, 50, 1045–1059. [Google Scholar] [CrossRef]
  46. Guo, Q.; Mi, J.; Wang, J.; Li, J.; Li, Y.; Yang, Z. An improved hydrocarbon generation model of source rocks and key parameter templates. China Pet. Explor. 2019, 24, 661–669. [Google Scholar]
  47. Liu, B.; Wang, Y.; Tian, S.; Guo, Y.; Wang, L.; Yasin, Q.; Yang, J. Impact of Thermal Maturity on the Diagenesis and Porosity of Lacustrine Oil-Prone Shales: Insights from Natural Shale Samples with Thermal Maturation in the Oil Generation Window. Int. J. Coal Geol. 2022, 261, 104079. [Google Scholar] [CrossRef]
  48. Sun, L.; Cui, B.; Zhu, R.; Wang, R.; Feng, Z.; Li, B.; Zhang, J.; Gao, B.; Wang, Q.; Zeng, H.; et al. Shale oil enrichment evaluation and production law in Gulong Sag, Songliao Basin, NE China. Pet. Explor. Dev. 2023, 50, 505–519. [Google Scholar] [CrossRef]
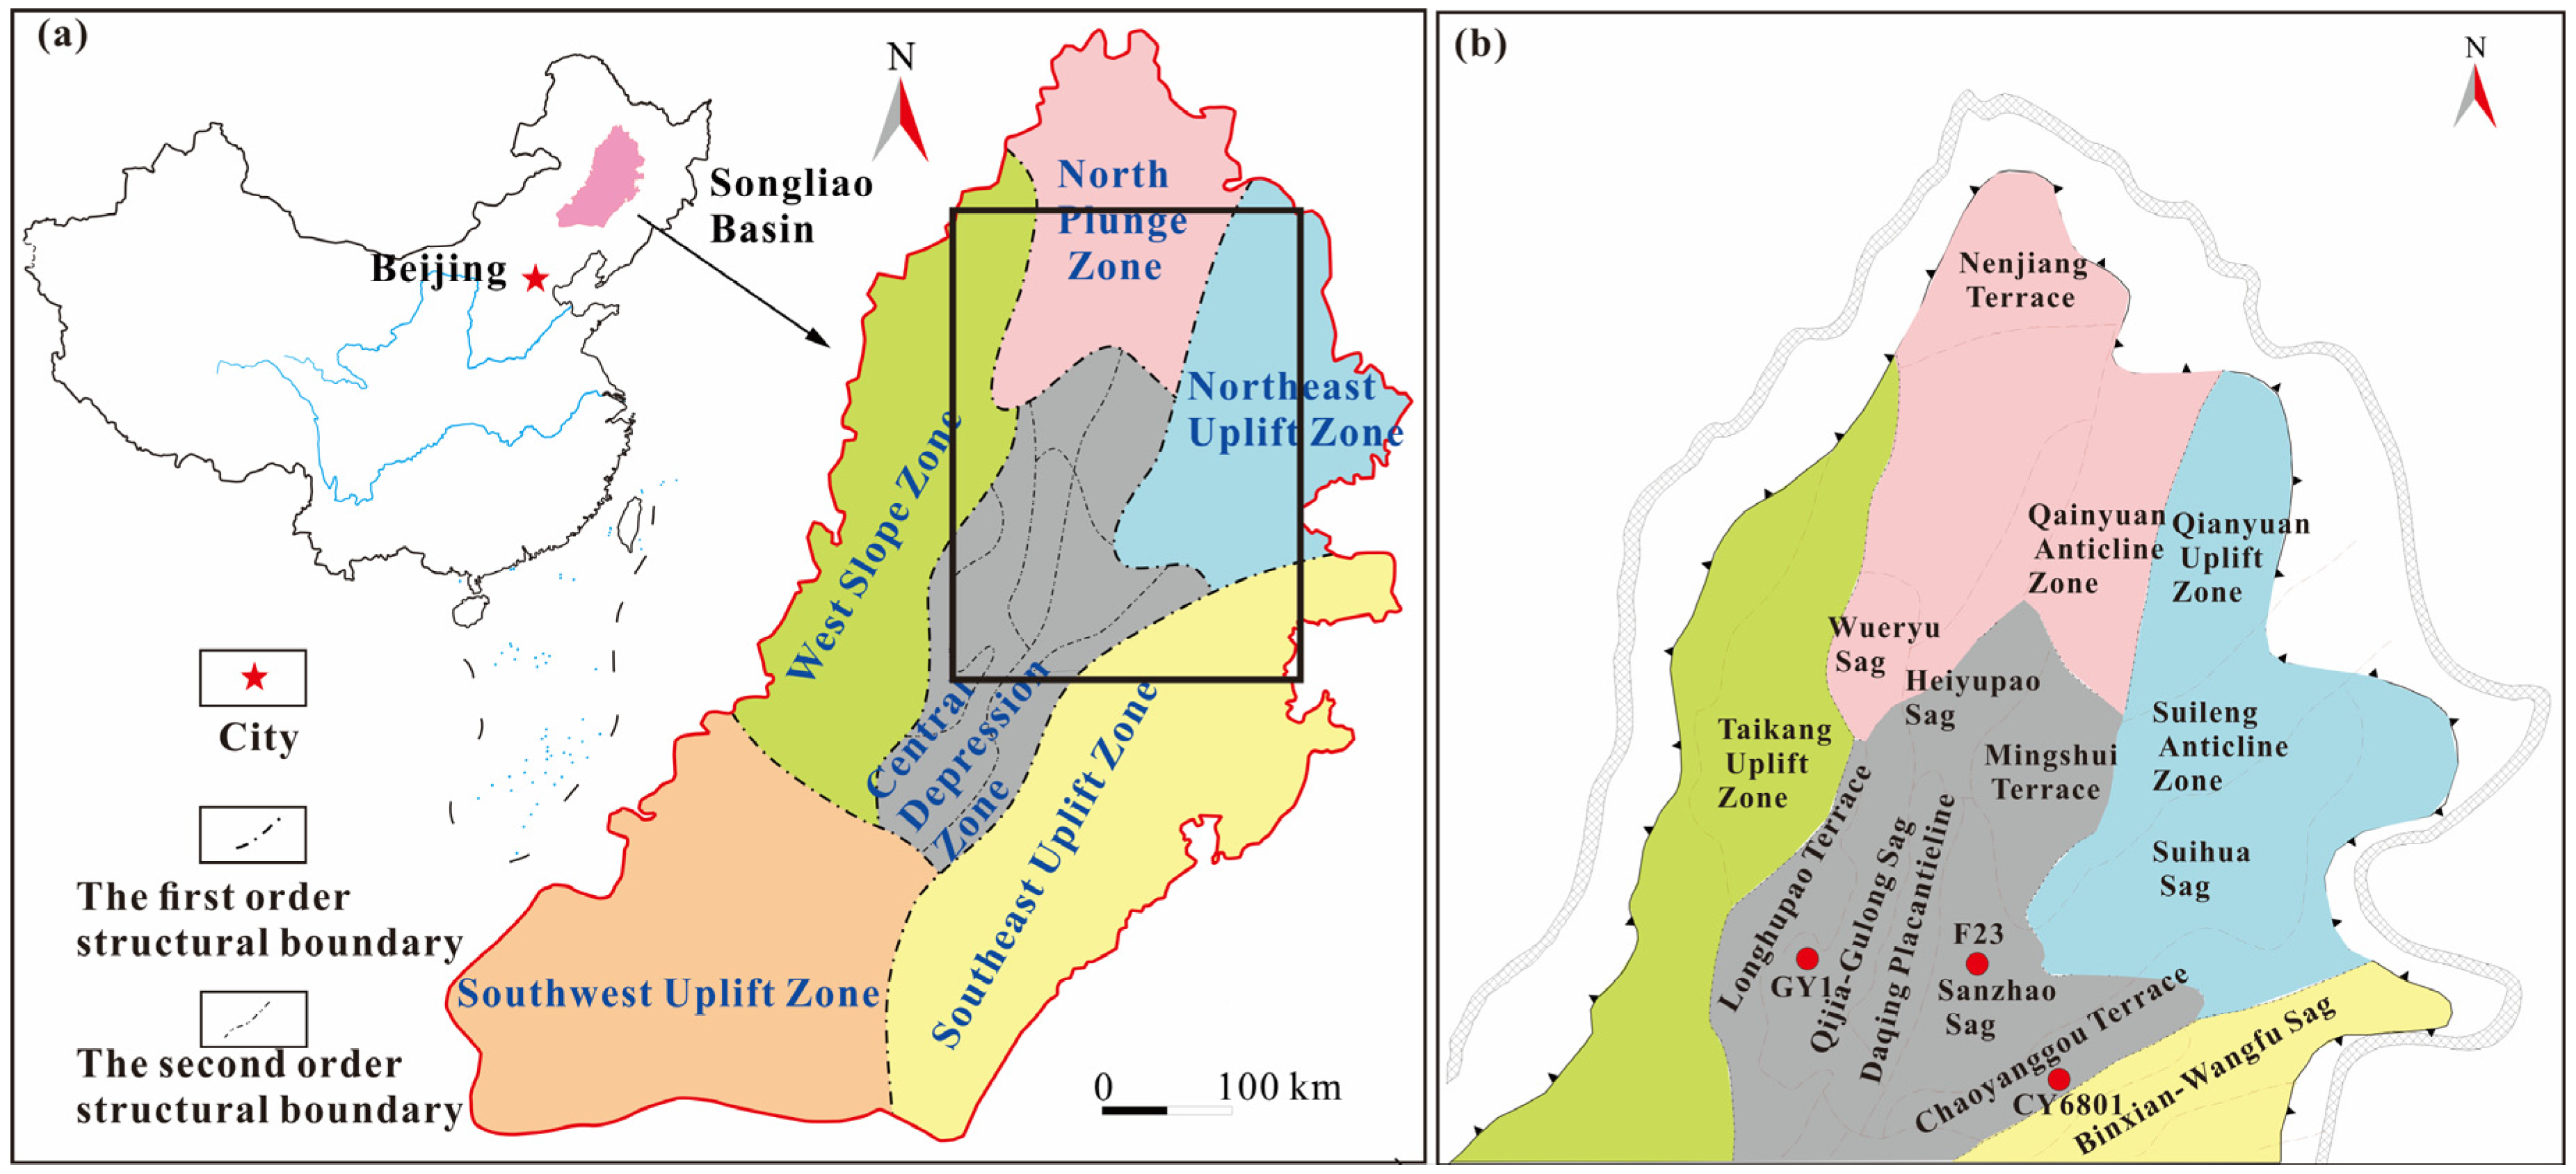
Figure 1. (a) Location of the Songliao Basin and subdivision of its primary structural units [32]. (b) Subdivision of secondary structural units within the Central Depression of the Songliao Basin.
Processes 14 00814 g001
Figure 2. (a) TOC frequency distribution of Member 1 of the Qingshankou Formation in the Songliao Basin; (b) kerogen type classification of the Qingshankou Formation in the Songliao Basin.
Processes 14 00814 g002
Figure 3. Vertical distribution of VRo and Tmax with depth in the Qingshankou Formation of the Songliao Basin. (a) Relationship between VRo and depth. (b) Relationship between Tmax and depth.
Processes 14 00814 g003
Figure 4. Thickness contour map of the Qingshankou Formation Member 1 source rocks in the northern Songliao Basin.
Processes 14 00814 g004
Figure 5. (a) ΔlogR-predicted and measured TOC and S2 values for Member 1 of the Qingshankou Formation in the Songliao Basin; (b) Comparison between ΔlogR-predicted and measured TOC for Member 1 of the Qingshankou Formation in the Songliao Basin; (c) Comparison between ΔlogR-predicted and measured S2 for Member 1 of the Qingshankou Formation in the Songliao Basin.
Processes 14 00814 g005
Figure 6. (a) TOC contour map of Member 1 of the Qingshankou Formation in the Songliao Basin; (b) S2 contour map of Member 1 of the Qingshankou Formation in the Songliao Basin.
Processes 14 00814 g006
Figure 7. (a) Contour map of TOC0 for the Qingshankou Formation, Northern Songliao Basin. (b) Contour map of HI0 for the K2qn1.
Processes 14 00814 g007
Figure 8. Evolution of hydrocarbon fractions generated from immature source rock samples of K2qn1, Songliao Basin, under two heating rates. (a) 20°C/h; (b) 2°C/h.
Processes 14 00814 g008
Figure 9. Kinetic model for the generation of gaseous, light, and heavy hydrocarbon fractions from source rock samples of the Qingshankou Formation. (ac) C1–5, C6–14 and C14+ kinetic parameters; (df) Comparison of calculated conversion rates and actual conversion rates for C1–5, C6–14 and C14+.
Processes 14 00814 g009
Figure 10. (a) Burial and sedimentary history of the well GY1 in the Songliao Basin. (b) Hydrocarbon generation history of well GY1. (c) Burial and sedimentary history of the F23 in the Songliao Basin. (d) Hydrocarbon generation history of well F23.
Processes 14 00814 g010
Figure 11. (a) Spatial distribution of (VRo) for the K2qn1 in the Songliao Basin. (b) Maturity contour map of the K2qn1 in the Songliao Basin.
Processes 14 00814 g011
Figure 12. Contour map of hydrocarbon generation intensity for the first member of the Qingshankou Formation in the northern Songliao Basin.
Processes 14 00814 g012
Table 1. Basic geochemical parameters of the low-maturity sample.
StratumRo (%)Tmax (°C)S1 (mg/g)S2 (mg/g)TOC (%)HI
K2qn10.554453.5064.277.79825.03
Table 2. Hydrocarbon generation amounts of secondary structural units in the Central Depression Zone.
Structural UnitQijia-Gulong
Sag
Sanzhao SagDaqing PlacanticlineLonghupao TerraceTotal
Hydrocarbon generation amount (×108 t)266.13132.7140.9066.81506.55
Disclaimer/Publisher’s Note: The statements, opinions and data contained in all publications are solely those of the individual author(s) and contributor(s) and not of MDPI and/or the editor(s). MDPI and/or the editor(s) disclaim responsibility for any injury to people or property resulting from any ideas, methods, instructions or products referred to in the content.