1. Introduction
Vigorously developing new energy sources, represented by wind power and photovoltaic (PV), and gradually replacing traditional fossil fuels with new energy to the greatest extent possible while ensuring system safety and reliability, is a crucial approach to constructing a new-type power system [
1]. Against this backdrop, the proportion of electricity generated from new energy sources such as wind power and PV in China continues to rise. However, new energy generation is closely tied to seasons and climate, exhibiting significant randomness and volatility [
2]. Consequently, the rapid development of new energy has increased uncertainty on the generation side, posing a tremendous challenge to the traditional power balance model [
3].
A virtual power plant (VPP) can aggregate various distributed resources, including distributed power generation, distributed energy storage, flexible adjustable loads, etc., into a flexibly controllable entity through advanced communication and regulation technologies, enabling participation in power system operation and electricity market transactions [
4]. The rapid development of VPPs can effectively promote the consumption of new energy, alleviate the contradiction between power supply and demand in the power system, and support the flexible and efficient operation of the new-type power system, making it an essential path for constructing such a system [
5]. Ref. [
6] proposes that a VPP is an energy management system whose task is to aggregate distributed generation resources and adjustable loads. Ref. [
7] suggests that a VPP serves as a carrier for integrating distributed generation, energy storage, and user-side resources to participate in demand response programs. Ref. [
8] describes a VPP as a distributed energy network that includes distributed power generation, energy storage systems, electric vehicle charging facilities, and adjustable loads, among others. Ref. [
9] argues that the concept of a VPP should not be confused with concepts such as demand response and load aggregators, and that VPPs should be managed as power plants, with specific requirements outlined from three perspectives: technical platforms, business models, and operational modes.
With the development of virtual power plants (VPPs), their definitions and positioning have evolved. Early definitions of VPPs were limited to a single type of controllable resource [
10]. Today, VPPs have gradually transformed into intelligent management systems that aggregate a vast number of distributed power sources, energy storage systems, and controllable loads [
11]. The positioning of VPPs has shifted from ensuring reliable grid integration of distributed energy resources to the aggregation and management of massive distributed controllable resources. VPPs have emerged as independently operated entities that integrate internal controllable resources to participate in energy trading in the electricity market and provide grid ancillary services. For instance, Ref. [
12] defines a VPP as a holistic entity driven by the electricity market that participates in market transactions and ancillary services by coordinating, optimizing, and controlling distributed energy clusters. Ref. [
13] considers a VPP as a novel operational model that leverages market mechanisms to synergistically optimize and control distributed energy resources. Ref. [
14] designs an architectural framework for VPPs to participate in market transactions as independent entities, describing the process by which VPPs coordinate various controllable resources to engage in market transactions. In the current field of resource aggregation and management, some scholars define load aggregators as intermediaries for direct interaction between the grid and users [
15]. The differences between VPPs and load aggregators primarily lie in their functions and the scope of resource management. VPPs participate in both power generation and consumption sectors within the grid by aggregating distributed controllable resources, encompassing multi-type distributed controllable resources from the source-load-storage sides [
16]. In contrast, load aggregators focus more on managing load-side resources related to electricity consumption, utilizing load resources to participate in demand-side response and grid service sectors.
Unlike coordinated control technologies, the optimized scheduling of virtual power plants (VPPs) refers to the joint optimized scheduling conducted by VPPs, acting as independent entities, with other VPPs or entities within the system, participating in grid operation regulation and electricity market transactions [
17]. Ref. [
18] constructed a multi-VPP hybrid game optimization scheduling model considering carbon trading, enhancing the economic efficiency and low-carbon nature of VPP alliances. Ref. [
19] proposed a two-layer optimized scheduling method for multiple VPPs based on shared energy storage systems, aiming to improve the operational efficiency of VPPs and increase the consumption of renewable energy. Ref. [
20] considered dynamic demand response pricing within VPPs to achieve a win–win situation for their operators and internal consumers. Ref. [
21] introduced a real-time pricing-based demand response mechanism that effectively facilitates transactions between VPP operators and loads by setting real-time prices for internal loads, significantly reducing load fluctuations and achieving excellent peak-shaving and valley-filling effects. Ref. [
22] managed intraday loads through price-based demand response (PBDR), enabling a more precise reflection of the daily variation characteristics and response potential of user loads, thereby better utilizing flexible user loads. Ref. [
23] optimized the operation of urban VPPs based on incentive-based demand response, achieving optimal allocation of urban energy resources and supporting the balance between urban energy supply and demand. Ref. [
24] proposed a low-carbon operation strategy incorporating progressive demand response, which incentivizes energy users to participate in demand response by leveraging consumer surplus value, helping to reduce the operational costs of the energy system. Ref. [
25] classified demand response into PBDR and replaceable-based DR (RBDR), considering that VPPs with demand response reduce partial loads during peak periods and increase loads during off-peak periods, while electric and thermal loads are mutually replaceable, achieving deep coupling among energy sources. Ref. [
26] proposed a joint optimization model for virtual power plants based on the synergistic mechanism of the electricity-carbon market, which incorporates carbon trading costs into the power generation cost function and introduces a carbon price fluctuation prediction module. Ref. [
27] proposed a low-carbon economic dispatch strategy for virtual power plants based on a tiered carbon trading mechanism, addressing the insufficient incentives for low-carbon dispatch under traditional carbon trading mechanisms by designing tiered penalty coefficients linked to emissions and dynamic carbon quota adjustment methods. Ref. [
28] designed a hierarchical dispatch architecture for virtual power plants based on distributed multi-agent algorithms, achieving global objective decomposition by upper-level coordination agents and autonomous optimization by lower-level execution agents.
However, there are still some deficiencies in current research:
- (1)
The characterization of the uncertainty of renewable energy output is overly conservative. In previous studies on urban virtual power plants, most only considered the fluctuations of renewable energy output under several simple and limited scenarios or used relatively broad probability distributions to describe its uncertainty. This conservative characterization method fails to fully capture the dynamic change characteristics of renewable energy output in complex and ever-changing real-world scenarios, especially when influenced by a combination of multiple factors. This, in turn, affects the economic efficiency and stability of urban virtual power plant operations.
- (2)
The resources on the load side are not fully utilized, resulting in low flexibility in decision-making. In the process of formulating scheduling strategies for urban virtual power plants in existing research, there is a significant lack of exploration and utilization of resources on the load side. Most studies merely focus on the optimal allocation of resources on the generation side while neglecting the enormous regulation potential inherent in various types of resources on the load side. These resources possess different characteristics and response capabilities in terms of time and space. If fully integrated and effectively utilized, they would greatly enhance the flexibility of scheduling decisions.
To address these issues, this paper proposes a sustainable and optimal economic dispatch strategy for urban virtual power plants considering flexible resource responses under uncertain scenarios. The main innovations of this paper can be summarized as follows:
- (1)
This paper innovatively constructs a joint prediction model that combines VMD with an improved bidirectional multi-gated long short-term memory network for accurate prediction of renewable energy output. By integrating these two approaches, the prediction model overcomes the limitations of traditional prediction methods in handling nonlinear and non-stationary new energy output data, significantly improving the accuracy and reliability of predictions. This provides solid data support for the optimal scheduling of urban virtual power plants under uncertain scenarios.
- (2)
This paper proposes a load regulation model based on optimal time-of-use electricity pricing, fully considering the flexibility and diversity of resources on the load side. Centered around the formulation of optimal time-of-use electricity prices, this model incentivizes users to actively participate in demand response by reasonably setting electricity price levels for different time periods, enabling flexible regulation of the load. The model not only takes into account users’ response characteristics to electricity prices but also considers the economic and stability goals of urban virtual power plant operations. It effectively integrates various types of resources on the load side, transforming load regulation from traditional passive execution to active participation, and providing an innovative solution for the sustainable and optimized operation of urban virtual power plants in complex and changing environments.
2. Renewable Energy Output Forecasting Method Based on Combined Model
In virtual power plants with a high proportion of renewable energy, prediction uncertainty fundamentally changes the structure of the economic dispatch problem: The dimension of the objective function shifts from a single cost-minimization function to a complex multi-objective function that comprehensively considers both costs and risks, resulting in a more intricate structure and significantly increased difficulty in solving. Constraint conditions become dynamic and complex in response to uncertainty, necessitating the addition of new constraints related to energy storage and interruptible loads, among others, while the upper and lower limits on unit output may also undergo dynamic adjustments. The number of decision variables increases substantially; in addition to the output of conventional units, new variables such as the charging and discharging power of energy storage systems must be considered, transforming the problem structure from simple linear or nonlinear programming to mixed-integer programming, which is more complex and time-consuming to solve. Traditional deterministic methods are insufficient to ensure optimal decision-making because they are unable to cope with uncertainty. It is difficult for them to account for the uncertainty in prediction errors and load demand, often leading to a disconnect between generation plans and actual operations. They lack risk assessment and optimization, focusing solely on cost minimization and failing to strike a balance between costs and risks. Moreover, they struggle to adapt to a dynamically changing environment, as they are based on fixed prediction periods and strategies and cannot adjust generation plans in a timely manner to accommodate the constant fluctuations in renewable energy and load demand.
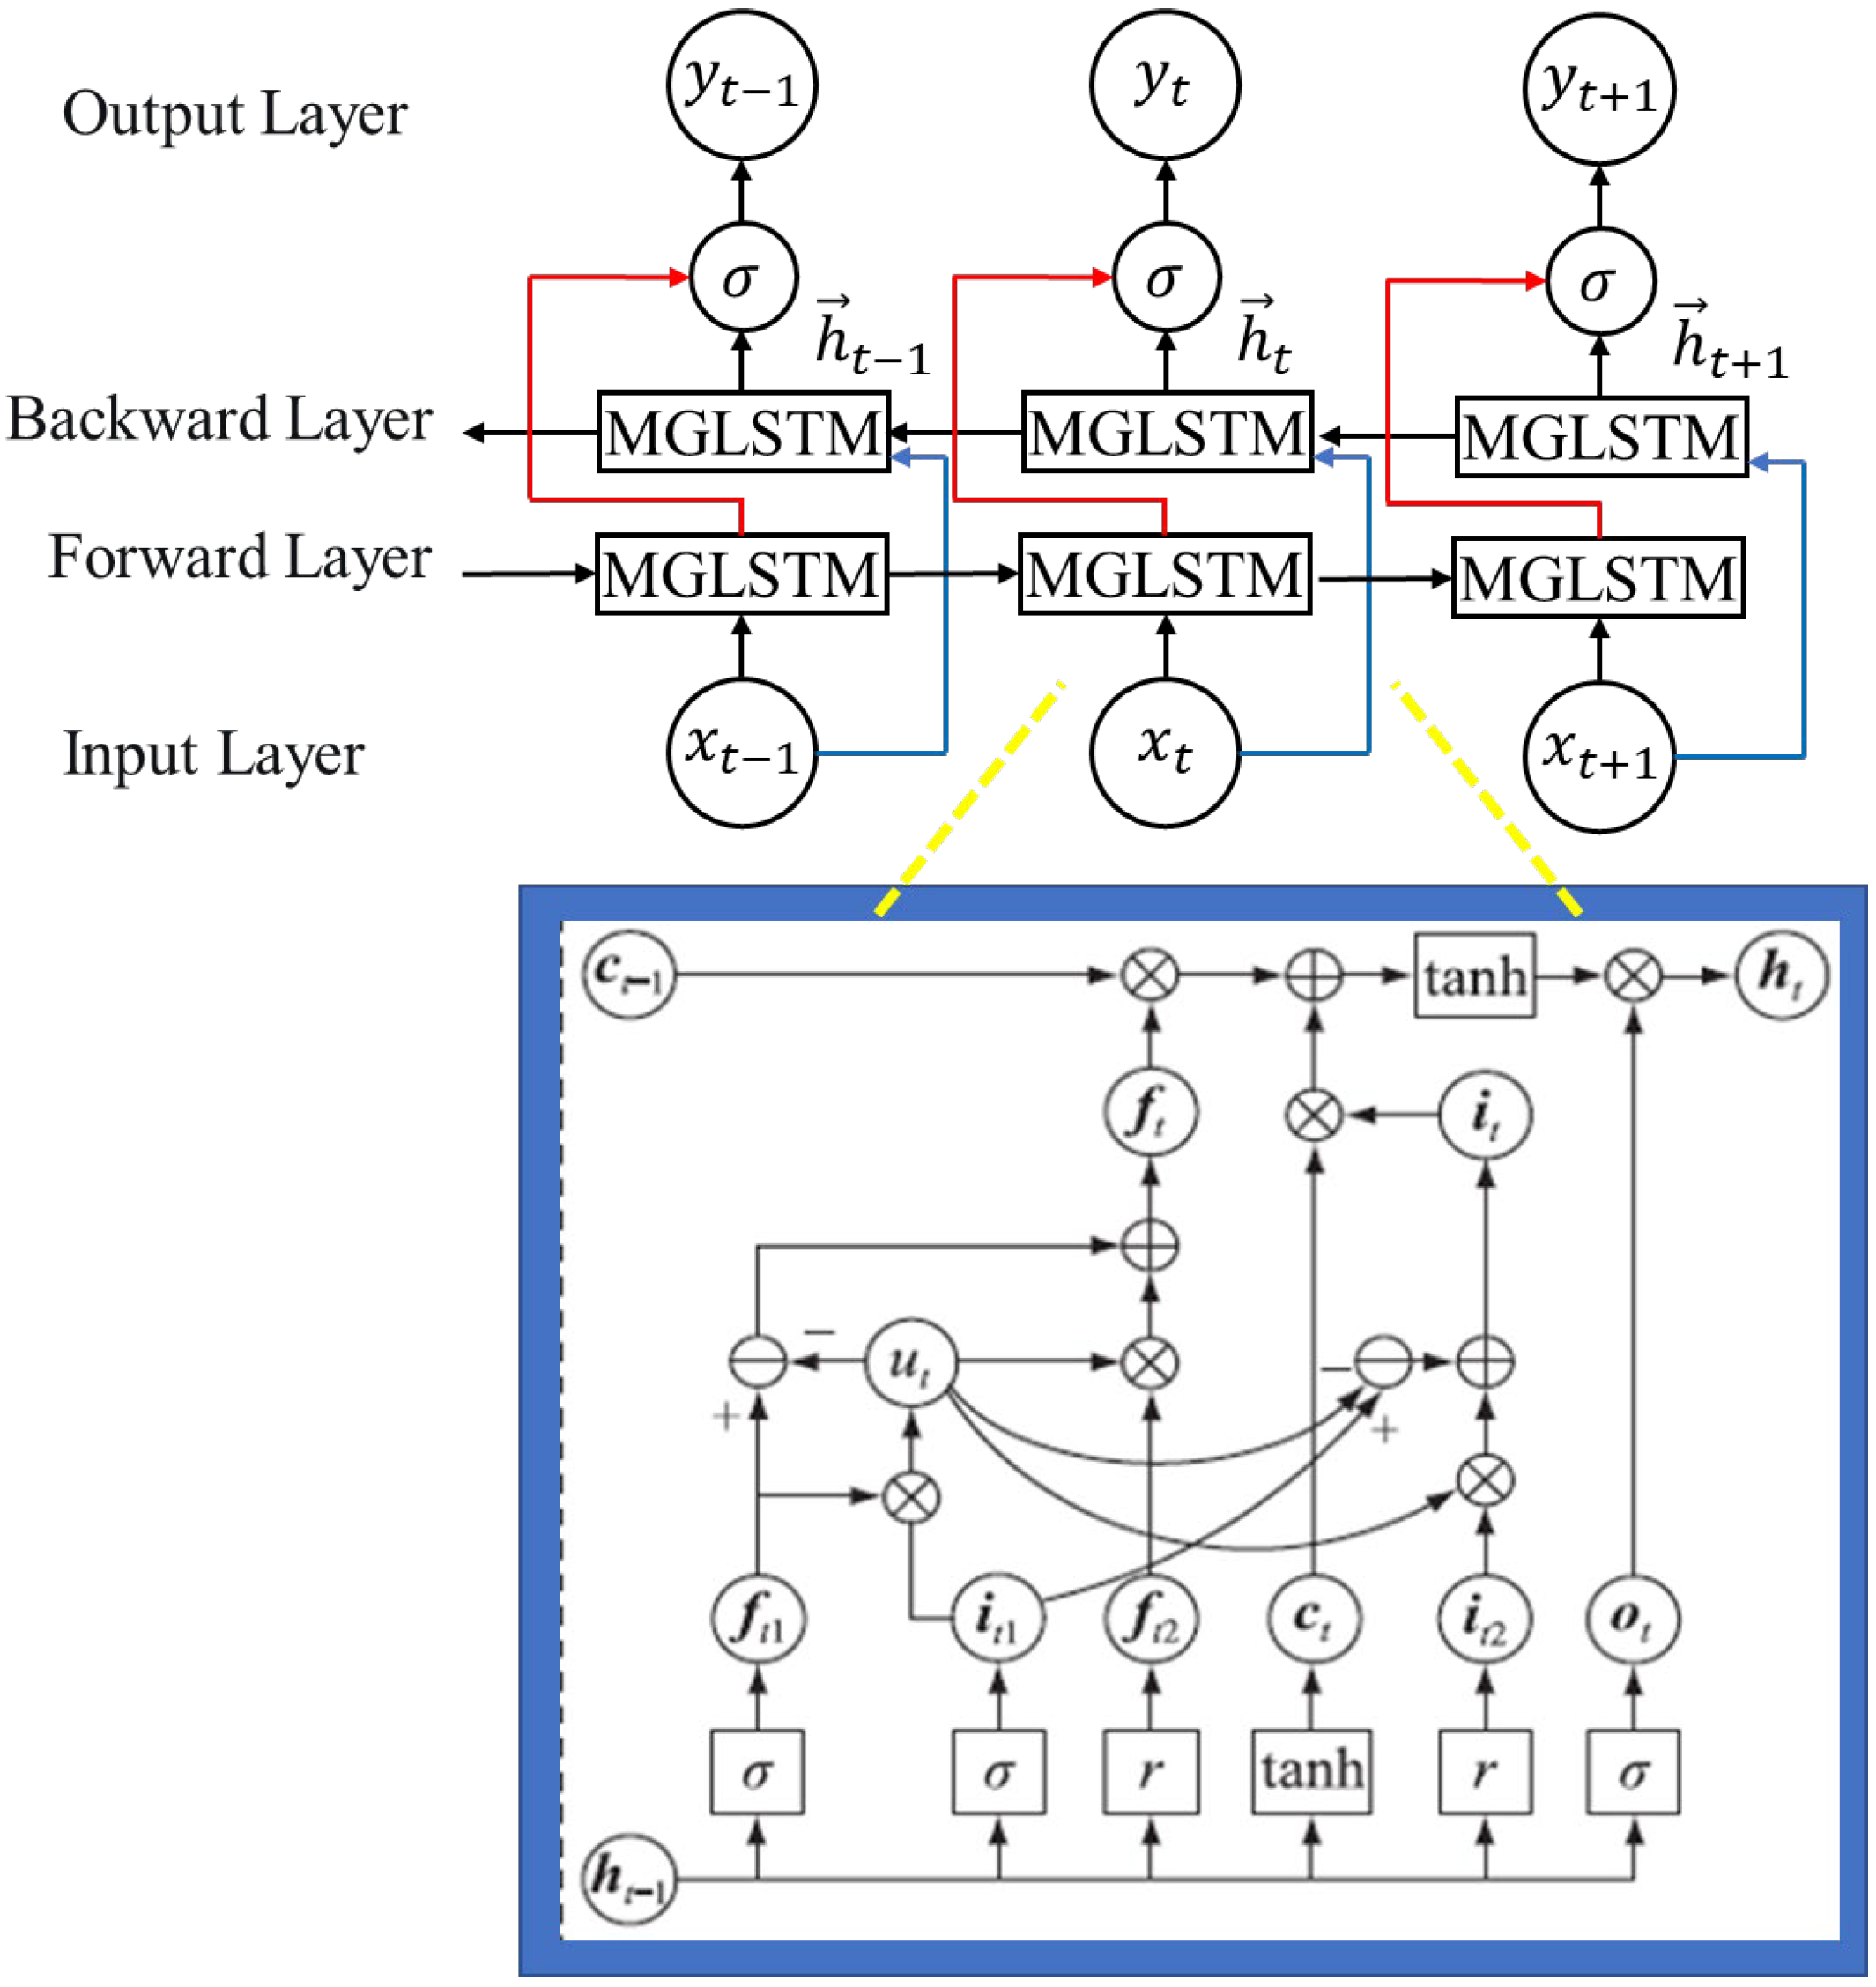
The wind–solar power forecasting module employs the Bidirectional Multi-Gated Long Short-Term Memory (Bi-MGLSTM). This model adds one additional forget gate and one additional input gate to the conventional LSTM network model. The functions of these added gates are identical to those of the original gates, but the MG-LSTM network exhibits stronger information filtering capabilities and better generalization ability. Furthermore, the inputs from the forward and backward layers facilitate an in-depth exploration of the intrinsic connections between past and future information, thereby enhancing the utilization rate of feature data.
Figure 1 illustrates the network structure of the Bi-MGLSTM. In
Figure 1,
yt represents the output at time
t;
σ and
r are the Sigmoid and ReLU activation functions, respectively;
and
represent the forward and backward hidden layer states at time
t, respectively;
ft1 and
ft2 are the forget gates 1 and 2 at time
t, respectively;
it1 and
it2 are the input gates 1 and 2 at time
t, respectively;
ot is the cell state of the output gate at time
t;
ct is the cell state at time
t;
ut is the result of the dot product between
ft1 and
it1;
xt and
ht are the input and hidden layer output at time
t, respectively;
ft and
it are the overall forget gate and overall input gate of a single MG LSTM, respectively, and their calculations are shown in Equation (1).
The final hidden layer output
ht is:
where
Wo and
bo are the weight and bias corresponding to the output gate, respectively;
Wg and
bg are the weight and bias corresponding to the cell, respectively;
gt is the temporary cell state at time
t.
The reasons why Forget Gate 2 and Input Gate 2 do not use the Sigmoid activation function are: (1) The ReLU function is computationally simpler than the Sigmoid function, which can significantly improve computational efficiency. (2) The ReLU function can alleviate the vanishing gradient problem associated with the Sigmoid function to some extent. (3) When the input to the ReLU function is negative, the cell information output becomes 0.
For the Bi-MGLSTM network, Equation (3) describes the process of obtaining the final output of the Bi-MGLSTM by updating the hidden layer states of the forward and backward MGLSTMs.
Here, f1 and f2 are the computational functions for the forward and backward directions of the MGLSTM network, respectively; Wy and by are the weight and bias of the output layer, respectively. The role of VMD is to decompose non-stationary signals into stationary subsequences. Renewable energy generation time series often exhibit significant non-stationarity, with their statistical characteristics changing over time. VMD is an adaptive signal decomposition method capable of breaking down complex non-stationary time series into a series of IMFs with different central frequencies. These IMFs are relatively more stationary, with each component containing information from a specific frequency range of the original time series. For instance, in wind power generation time series, there may be different frequency components caused by factors such as short-term fluctuations in wind speed, diurnal variations, and seasonal changes. VMD can decompose these components, enabling each IMF to better reflect the variation patterns at a specific scale, thereby reducing the complexity and non-stationarity of the original time series.
On the other hand, VMD can reduce the degree of nonlinearity. Nonlinear characteristics in the original renewable energy generation time series manifest as non-simple linear relationships between data points. After decomposition by VMD, the degree of nonlinearity in each IMF is relatively lower compared to that of the original series. This is because the decomposition process disperses nonlinear components of different frequencies into various IMFs, making the nonlinear information contained in each IMF more singular and concentrated, and thus easier for subsequent models to process and analyze. Meanwhile, LSTM networks can fully leverage these decomposed subsequences, utilizing their powerful nonlinear modeling capabilities to make accurate predictions for each subsequence.
3. Dynamic Electricity Price Mechanism Design for Demand Response
Time-of-use electricity pricing mechanisms guide demand-side adjustments in electricity consumption patterns through economic incentives, playing a significant role in reducing peak-to-valley load differences and enhancing system operational stability. The price elasticity matrix captures the relationship between electricity prices and user responses. Utility companies can leverage this matrix to adjust pricing mechanisms and alleviate supply–demand imbalances. By modifying electricity tariffs, grid operators can optimize the overall load curve and achieve higher operational revenue. Introducing a price elasticity matrix for electricity demand helps characterize the impact of price changes on load. Price variations in each period affect not only the load demand within the same period but also the load in other periods. Therefore, price elasticity coefficients are further divided into self-elasticity coefficients and cross-elasticity coefficients. For time-of-use electricity pricing to transform from a passive economic signal into an active control mechanism that enhances the operational flexibility of virtual power plants, it is necessary to precisely construct and dynamically update the price elasticity matrix. This enables the quantification of the spatiotemporal coupling effects of electricity price changes on load during different time periods, and adjustments based on real-time data can be made to avoid prediction deviations caused by static models. It is also essential to deeply integrate and flexibly schedule demand response resources, leveraging electricity price signals to achieve arbitrage and system peak shaving through charging at low prices and discharging at high prices. Controllable loads should dynamically adjust their operational plans according to electricity prices, activating the regulatory potential of resources through price leverage and enabling virtual power plants to shift from passively responding to grid instructions to actively optimizing resource allocation. Furthermore, support from real-time communication and control technologies is required, with the deployment of advanced communication technologies such as 5G and the Internet of Things, as well as control technologies, to facilitate bidirectional data interaction. This allows users to upload electricity consumption data in real time and enables virtual power plants to issue electricity price signals and scheduling instructions. Simultaneously, it is crucial to optimize user participation mechanisms and ensure incentive compatibility by designing reasonable user participation models and enhancing user participation enthusiasm through time-of-use electricity price differentials and demand response subsidies.
The self-elasticity coefficient
represents the impact of price changes in period
i on the load demand within the same period
i, as shown below:
where
and
are the load change and initial load in period
i, respectively;
and
are the electricity price change and initial electricity price in period
i, respectively.
The cross-elasticity coefficient
represents the response of the load change in period
i to the electricity price change in period
j, as shown below:
where
and
are the electricity price change and initial electricity price in period
j, respectively.
If the scheduling period
T is divided into
NT time periods, then an
NT -dimensional electricity price elasticity matrix
E can be obtained, as shown in (6):
The relationship between the rate of electricity price change and the rate of electricity consumption change can be expressed as:
Then, the load demand based on time-of-use electricity pricing is expressed as follows:
Here, , … represent the actual load under time-of-use electricity pricing. The price–demand elasticity matrix reveals latent information about inter-temporal and cross-load dependencies: The self-elasticity coefficients reflect the direct impact of electricity price changes within a specific time period on the load demand in that same period, demonstrating users’ ability to adjust their electricity consumption behavior in response to price changes in the current period. The cross-elasticity coefficients reflect the influence of electricity price changes in different periods on the load demand in a specific period, revealing the demand dependencies between periods. The matrix can also uncover dependencies between different types of loads, such as the mutual influence between industrial and residential loads when electricity prices change. Additionally, it reflects the correlation between loads and distributed energy resources, where power generation from distributed energy affects electricity prices, and changes in electricity prices, in turn, influence load demand. This interaction can be quantified through matrix analysis. If such spatiotemporal coupling effects are ignored, various systematic errors will emerge in demand response modeling: Ignoring inter-temporal dependencies can lead to deviations in load demand forecasts for different periods, affecting power system dispatch plans, resulting in a mismatch between power generation plans and actual load demand, and causing either excess or insufficient power generation. The scenario-based method offers significant advantages in handling the uncertainty of renewable energy output, but the issue of high computational burden restricts its application in real-time large-scale power grid operation. By employing strategies such as scenario reduction techniques, efficient optimization algorithms, real-time data-driven approaches, hierarchical scheduling architectures, and hardware acceleration, this problem can be effectively overcome, enabling the practical application of the scenario-based method in real-time large-scale power grid operation and providing strong support for the efficient, flexible, and low-carbon operation of virtual power plants.
4. Optimal Economic Dispatch Strategy for Active Distribution Networks Considering Flexible Resource Participation
In the actual operation of user loads, it is not possible to fully interrupt or shift them according to time-of-use electricity pricing. Therefore, an electricity consumption comfort index must be introduced as a constraint, which is expressed as (9):
Here, Fc represents the electricity consumption comfort index; is the optimized load change at time t; is the load consumption at time t before optimization.
Using scenario analysis, the uncertainty of wind and solar power generation is converted into a deterministic set of probability scenarios. With electricity prices and the output of various flexible adjustment response devices as control variables, the objective function, aiming to minimize voltage fluctuations and operational costs in the distribution network, is expressed as:
where
is the probability of scenario
s occurring;
is the network loss cost;
is the electricity purchasing cost;
I is the number of nodes;
is the voltage value at node
i at time
t;
is the reference voltage value at node
i;
is the penalty factor;
K is the number of clustered scenarios.
Network loss primarily results from power losses caused by fluctuations in distributed renewable energy sources within the distribution network. The network loss cost is mainly expressed as:
where
is the compensation cost coefficient for network loss;
is the current magnitude in branch
ij at time
t;
is the resistance parameter of the distribution network.
During the operation of the distribution network, to maintain power balance, it is necessary to purchase electricity from the upper-level grid. The cost of purchasing electricity from the main grid is:
Here, represents the electricity purchase price from the main grid at time t; represents the electricity purchased from the main grid at time t. The study makes two key assumptions: (1) wind/solar power output can be accurately predicted using a VMD-Bi-MGLSTM model, contingent on sufficient historical data covering extreme weather and stable meteorological-power relationships, though extreme climate events may distort data and equipment aging is ignored; (2) demand response resources are fully controllable, with users adjusting loads flexibly to time-of-use pricing via a price–demand elasticity matrix, yet this overlooks user behavior heterogeneity (industrial rigidity, residential low responsiveness) and assumes instantaneous, linear responses, whereas real-world decisions often involve lag or nonlinearity, causing model-actual discrepancies.
The relevant operational constraints primarily include:
Here, and represent the active and reactive power flowing into node i, respectively; and represent the active and reactive power output from distributed photovoltaic/wind turbines at node i, respectively; and are the active and reactive power consumed by the load at node i, respectively; is the reactive power output of the compensation capacitor at node i; is the reactive power output of the static var compensator at node i; , , and represent the conductance, susceptance, and phase angle difference in branch ij, respectively.
During the operation of the distribution network, electricity prices must not be excessively high or low, and therefore must satisfy certain price constraints:
Here, the constraint for the static var compensator is given by (15).
Here, and represent the minimum and maximum reactive power compensation output of the static var compensator installed at node i, respectively.
The constraints for the discrete reactive power compensator are given by (16)–(17).
Here, is the number of var compensation switching groups at node i; and represent the minimum and maximum number of switching groups for reactive power compensation at node i, respectively.
The node voltage constraints are given by (18).
Here, and represent the minimum and maximum voltage at node i, respectively.
The transmission power constraint is given by (19).
Here, represents the transmission power in branch ij; is the maximum transmission power in branch ij.
5. Solution Strategy Based on an Improved PSO Algorithm
In order to improve solution efficiency, this paper employs an Improved Particle Swarm Optimization (IPSO) algorithm that incorporates adaptive inertia weights and asynchronous learning factors for solving the problem.
The IPSO iterative formulas are as follows:
Here, is the inertia weight, and are acceleration coefficients, and represent the iteration velocities of particle i at the t-th and t + 1-th iterations, respectively, and are random numbers ranging from 0 to 1, is the personal best position of particle i, is the global best position of the population, and and denote the positions of particle i at the t-th and t + 1-th iterations, respectively.
The adaptive inertia weight directly influences the convergence performance of the algorithm, as it is related to local search capability. It adjusts according to the fitness value of the particle, enabling timely updates of the local search state based on global information. An appropriate
can enhance both solution speed and accuracy. The value of the inertia weight is set as follows:
Here, and are the maximum and minimum values of the weighting coefficient, respectively; is the fitness value of particle i; and are the average fitness value and the minimum fitness value of particle i, respectively.
The learning factors
and
reflect the particle’s ability for self-learning and social learning. A larger
value tends to cause the particle to deviate from the optimal particle, while a larger
value may lead the particle to fall into local optima. Appropriate learning factors can improve identification accuracy and prevent entrapment in local optima. Conventional learning factors are mostly fixed or change synchronously, whereas asynchronous learning factors can update according to the number of iterations, enhancing convergence speed. The improved formulas for
and
are as follows:
In the formula,
and
are the initial values of the learning factors;
and
are the final values of the learning factors;
t and
tmax represent the current iteration number and the maximum number of iterations, respectively. In the early stage, individual exploration is emphasized, with a higher
and a lower
; in the later stage, group collaboration is emphasized, with a lower
and a higher
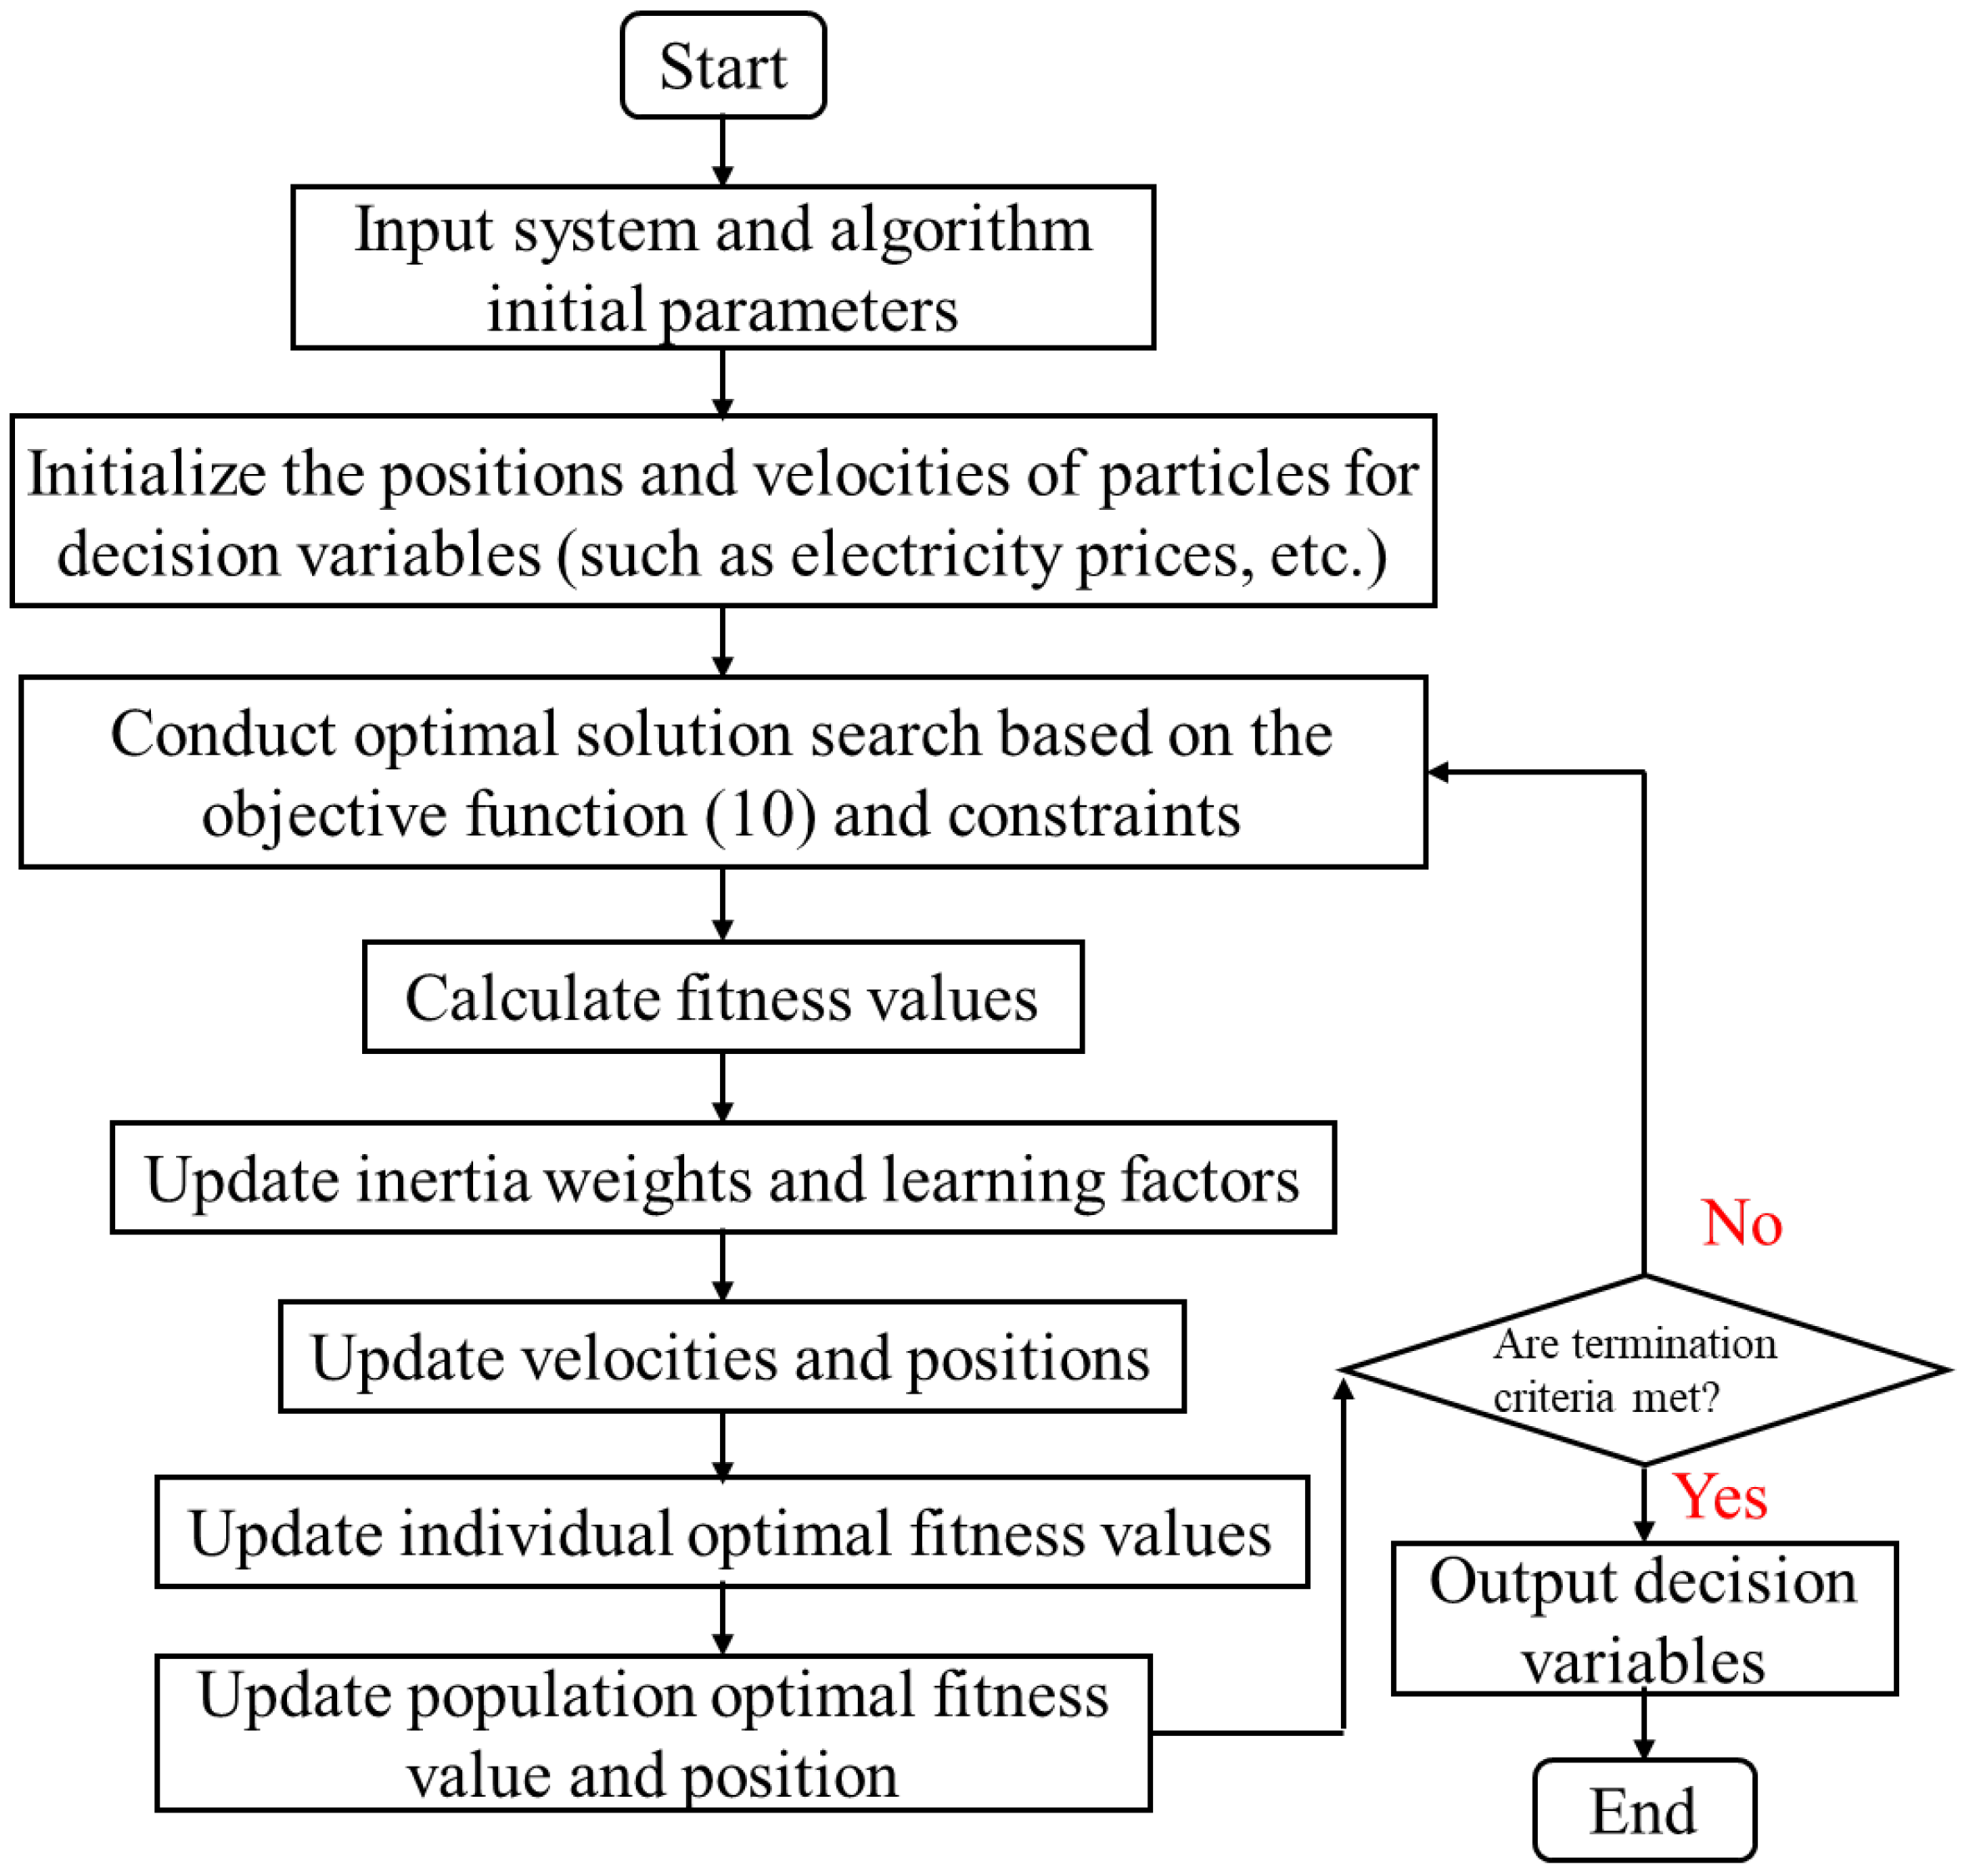
. For better understanding, a detailed flowchart of the problem-solving process is shown in
Figure 2 below.
6. Case Study
6.1. Introduction to the Test System
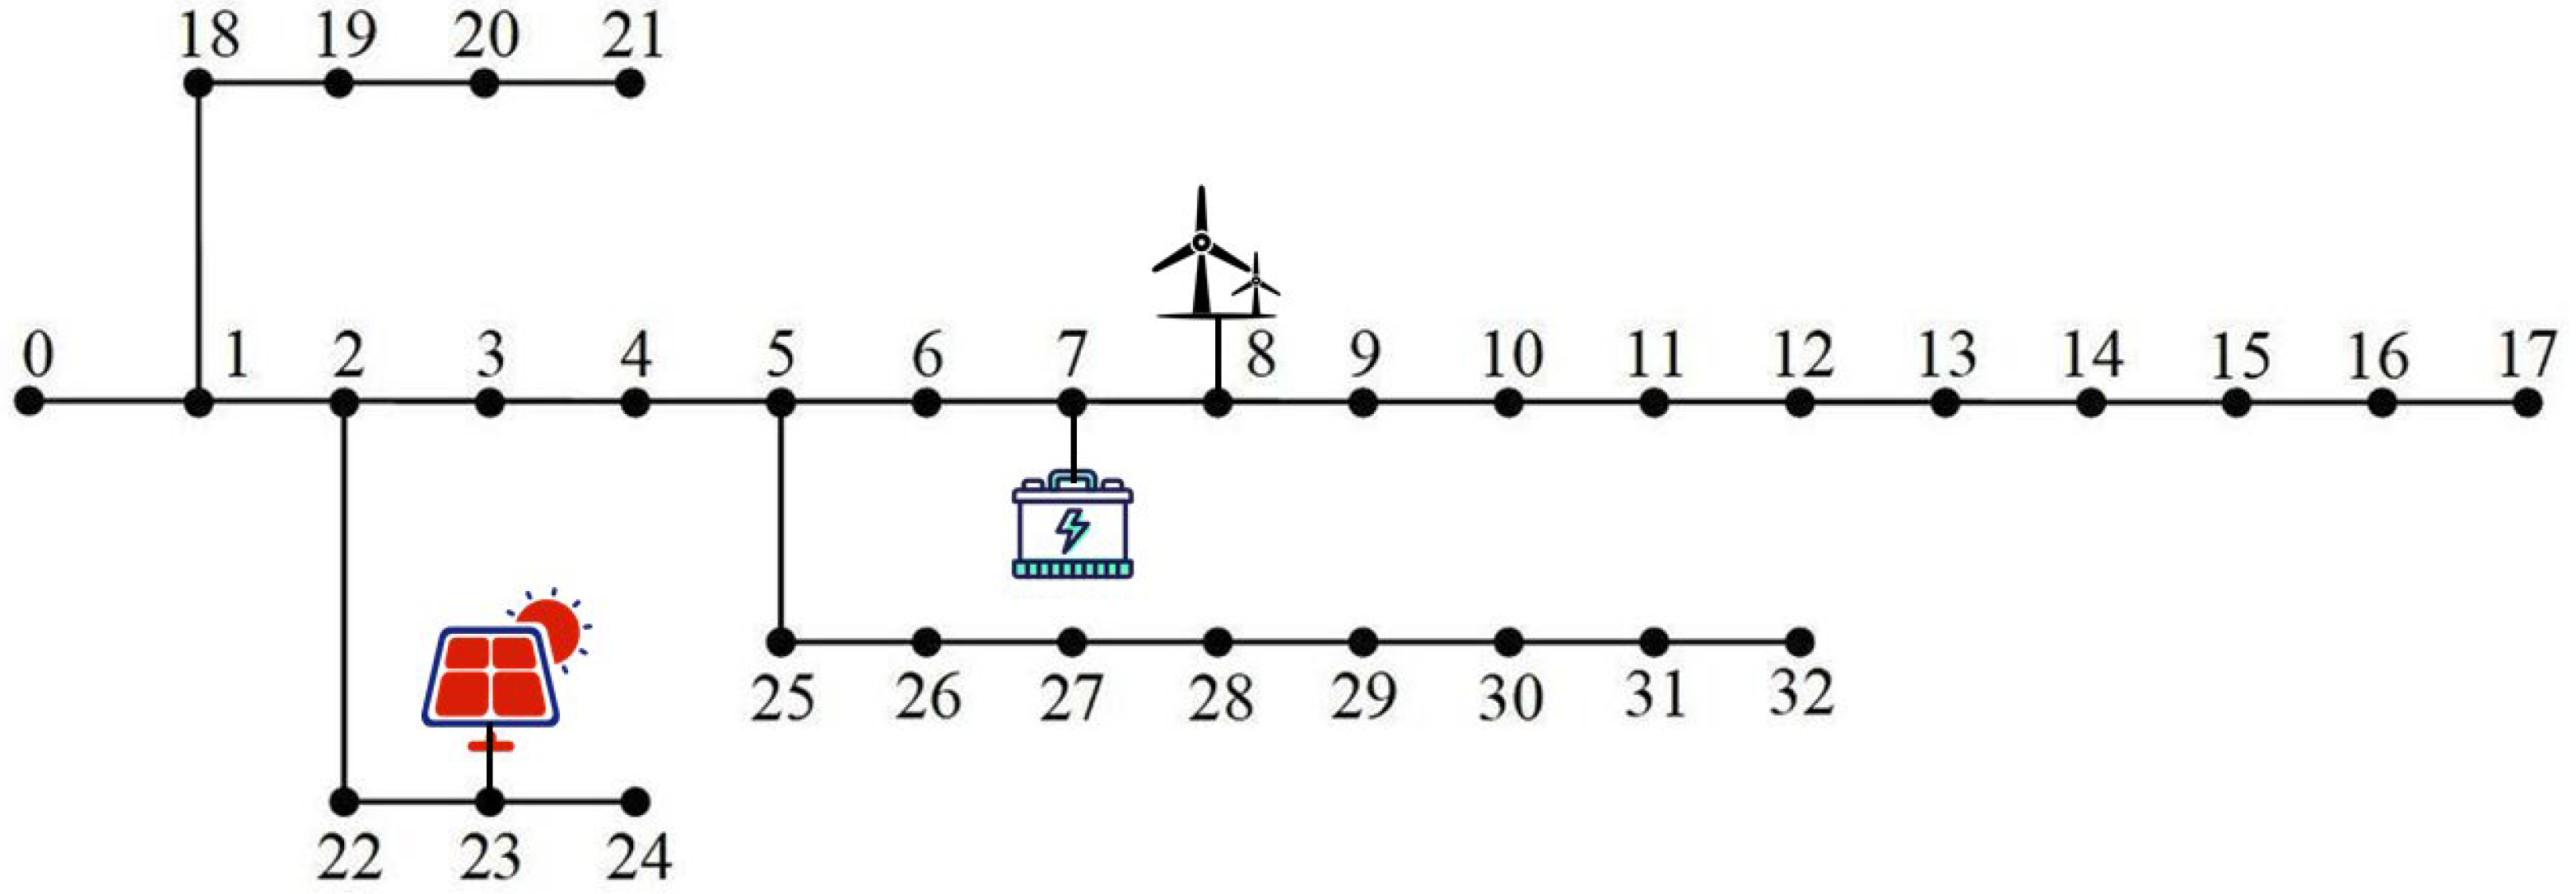
To verify the effectiveness and feasibility of the method proposed in this paper, an improved IEEE-33 bus system is employed for demonstration and validation. The network structure of the test system is illustrated in
Figure 3 below. Specifically, distributed wind power and photovoltaic systems are installed at Bus 8 and Bus 23, respectively, while an energy storage device is installed at Bus 7.
6.2. Accuracy Analysis of Renewable Energy Output Forecasting Models
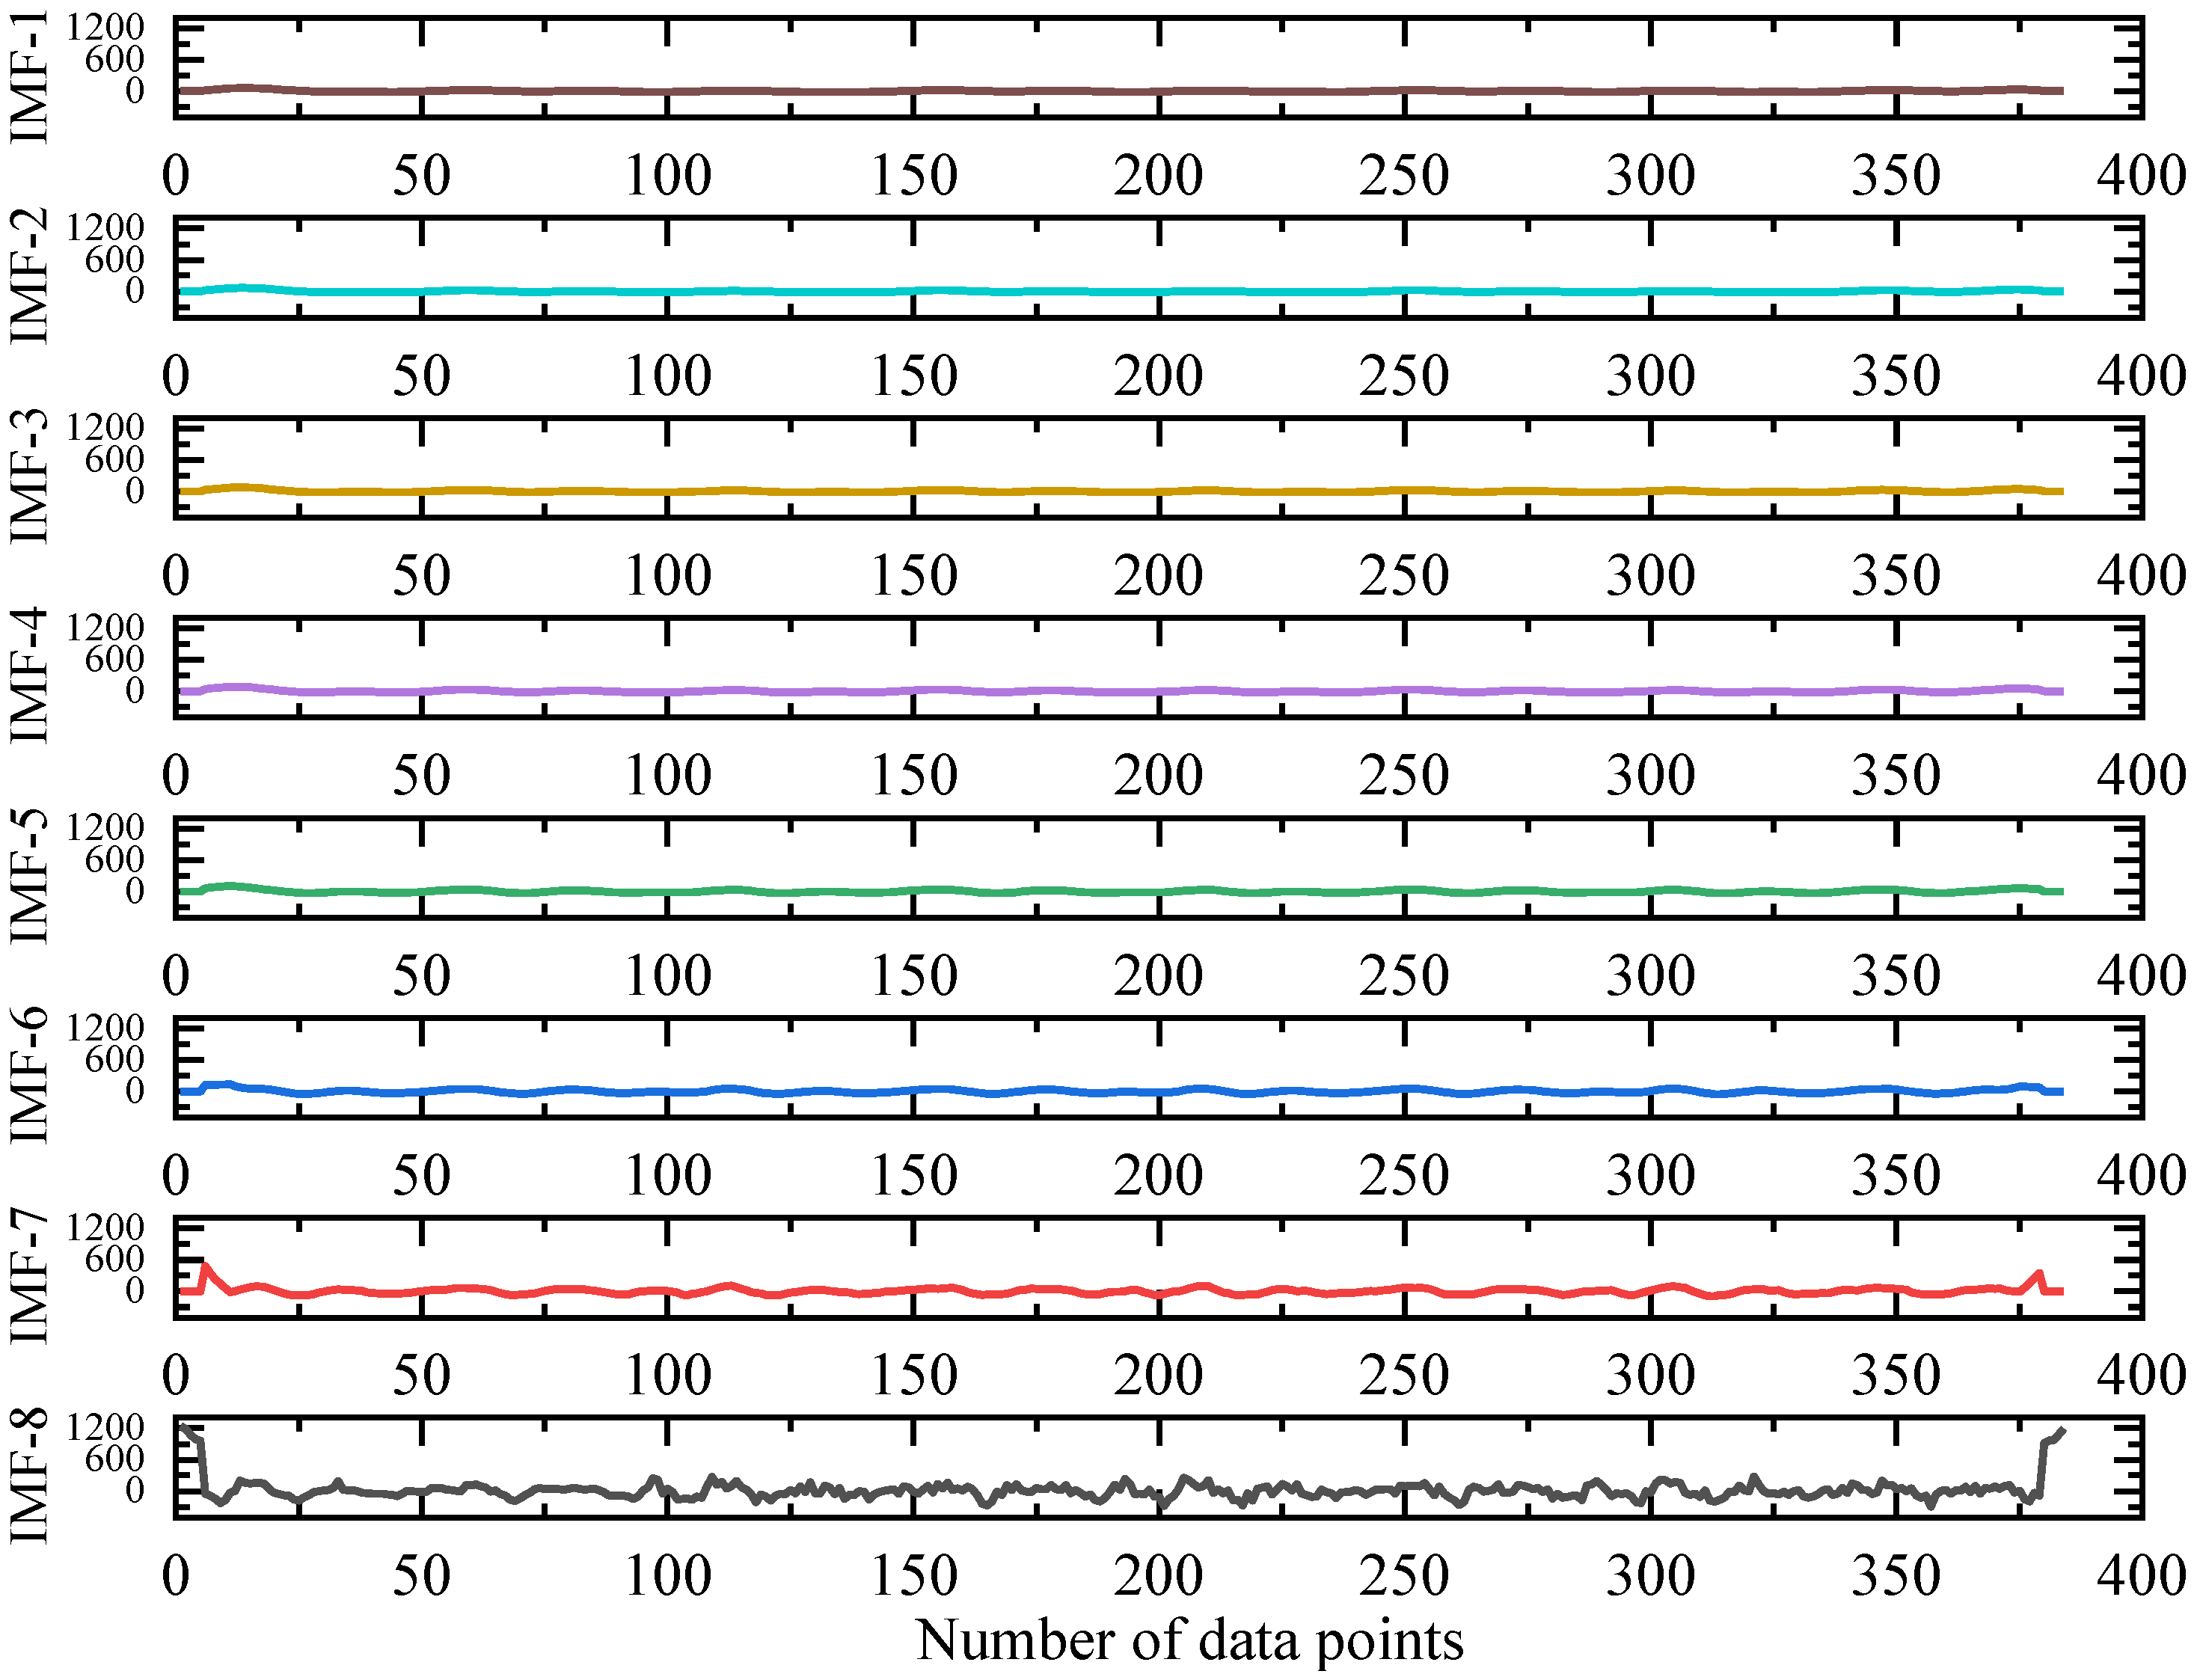
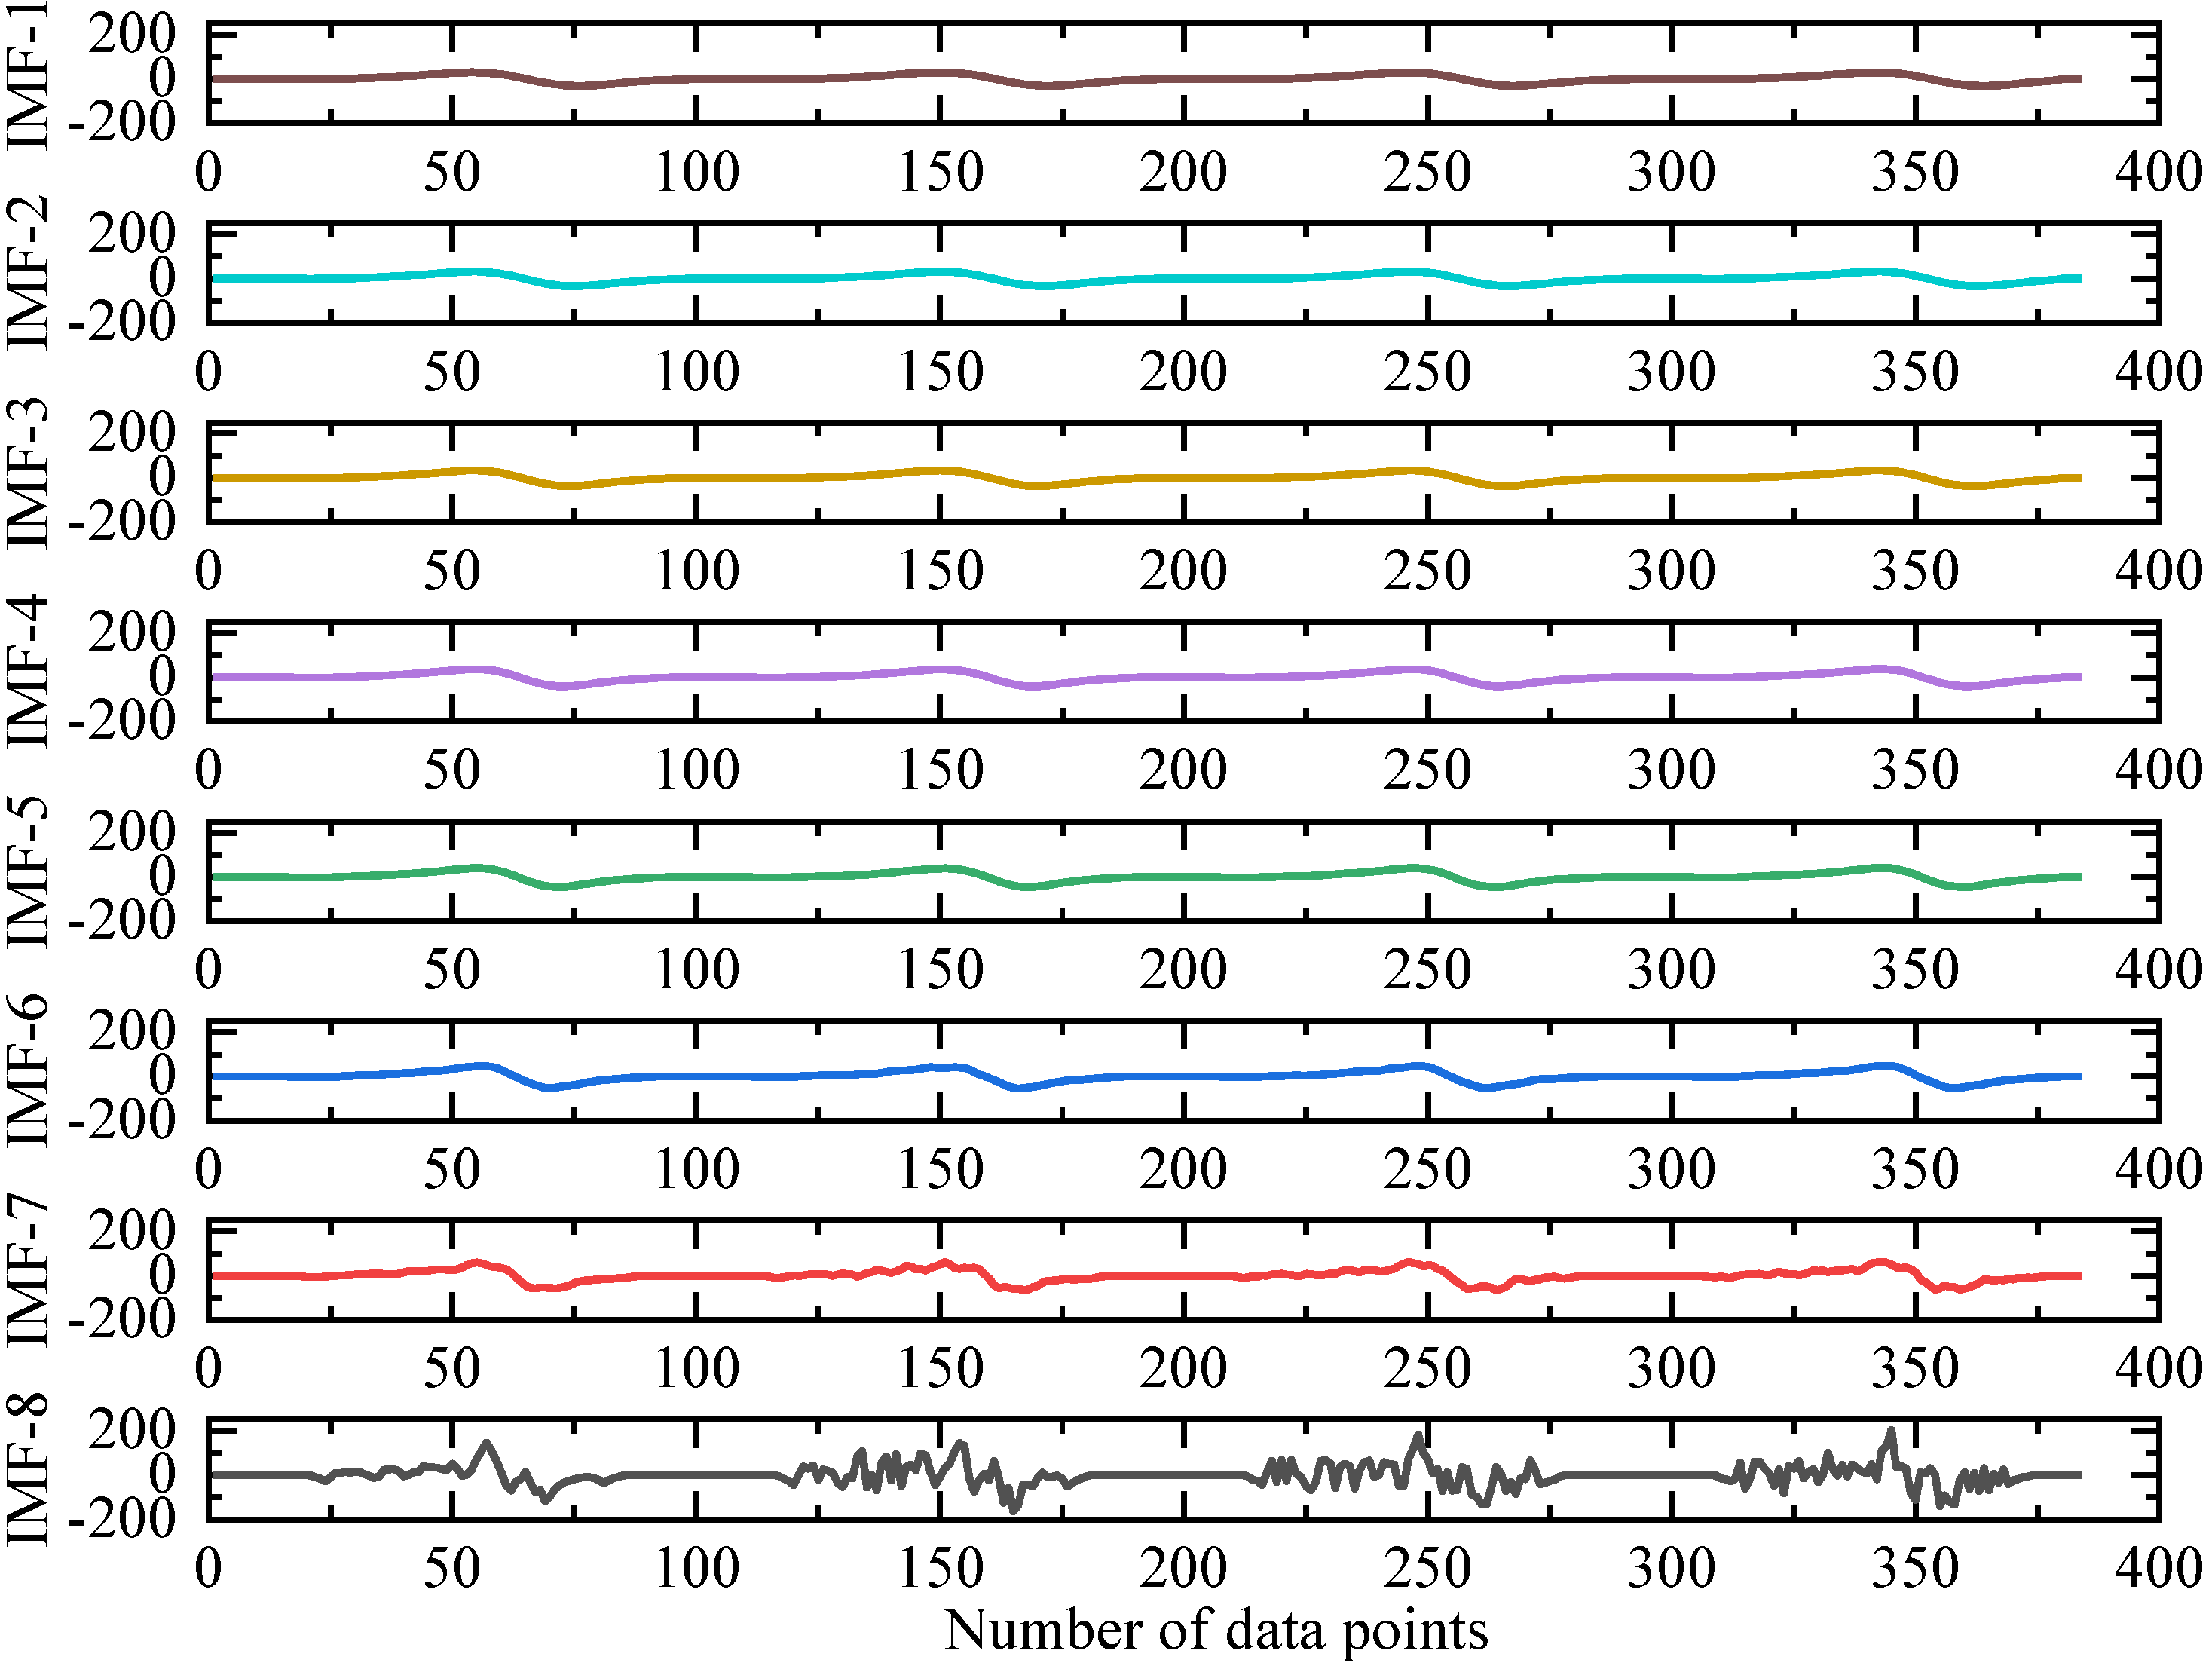
To illustrate the accuracy of the forecasting model, this paper uses wind-PV power samples with a total time span of 4 days for validation, with the dataset sampled every 15 min. Initially, the VMD method is employed to decompose the initial data, yielding the modal components as shown in
Figure 4 and
Figure 5 below.
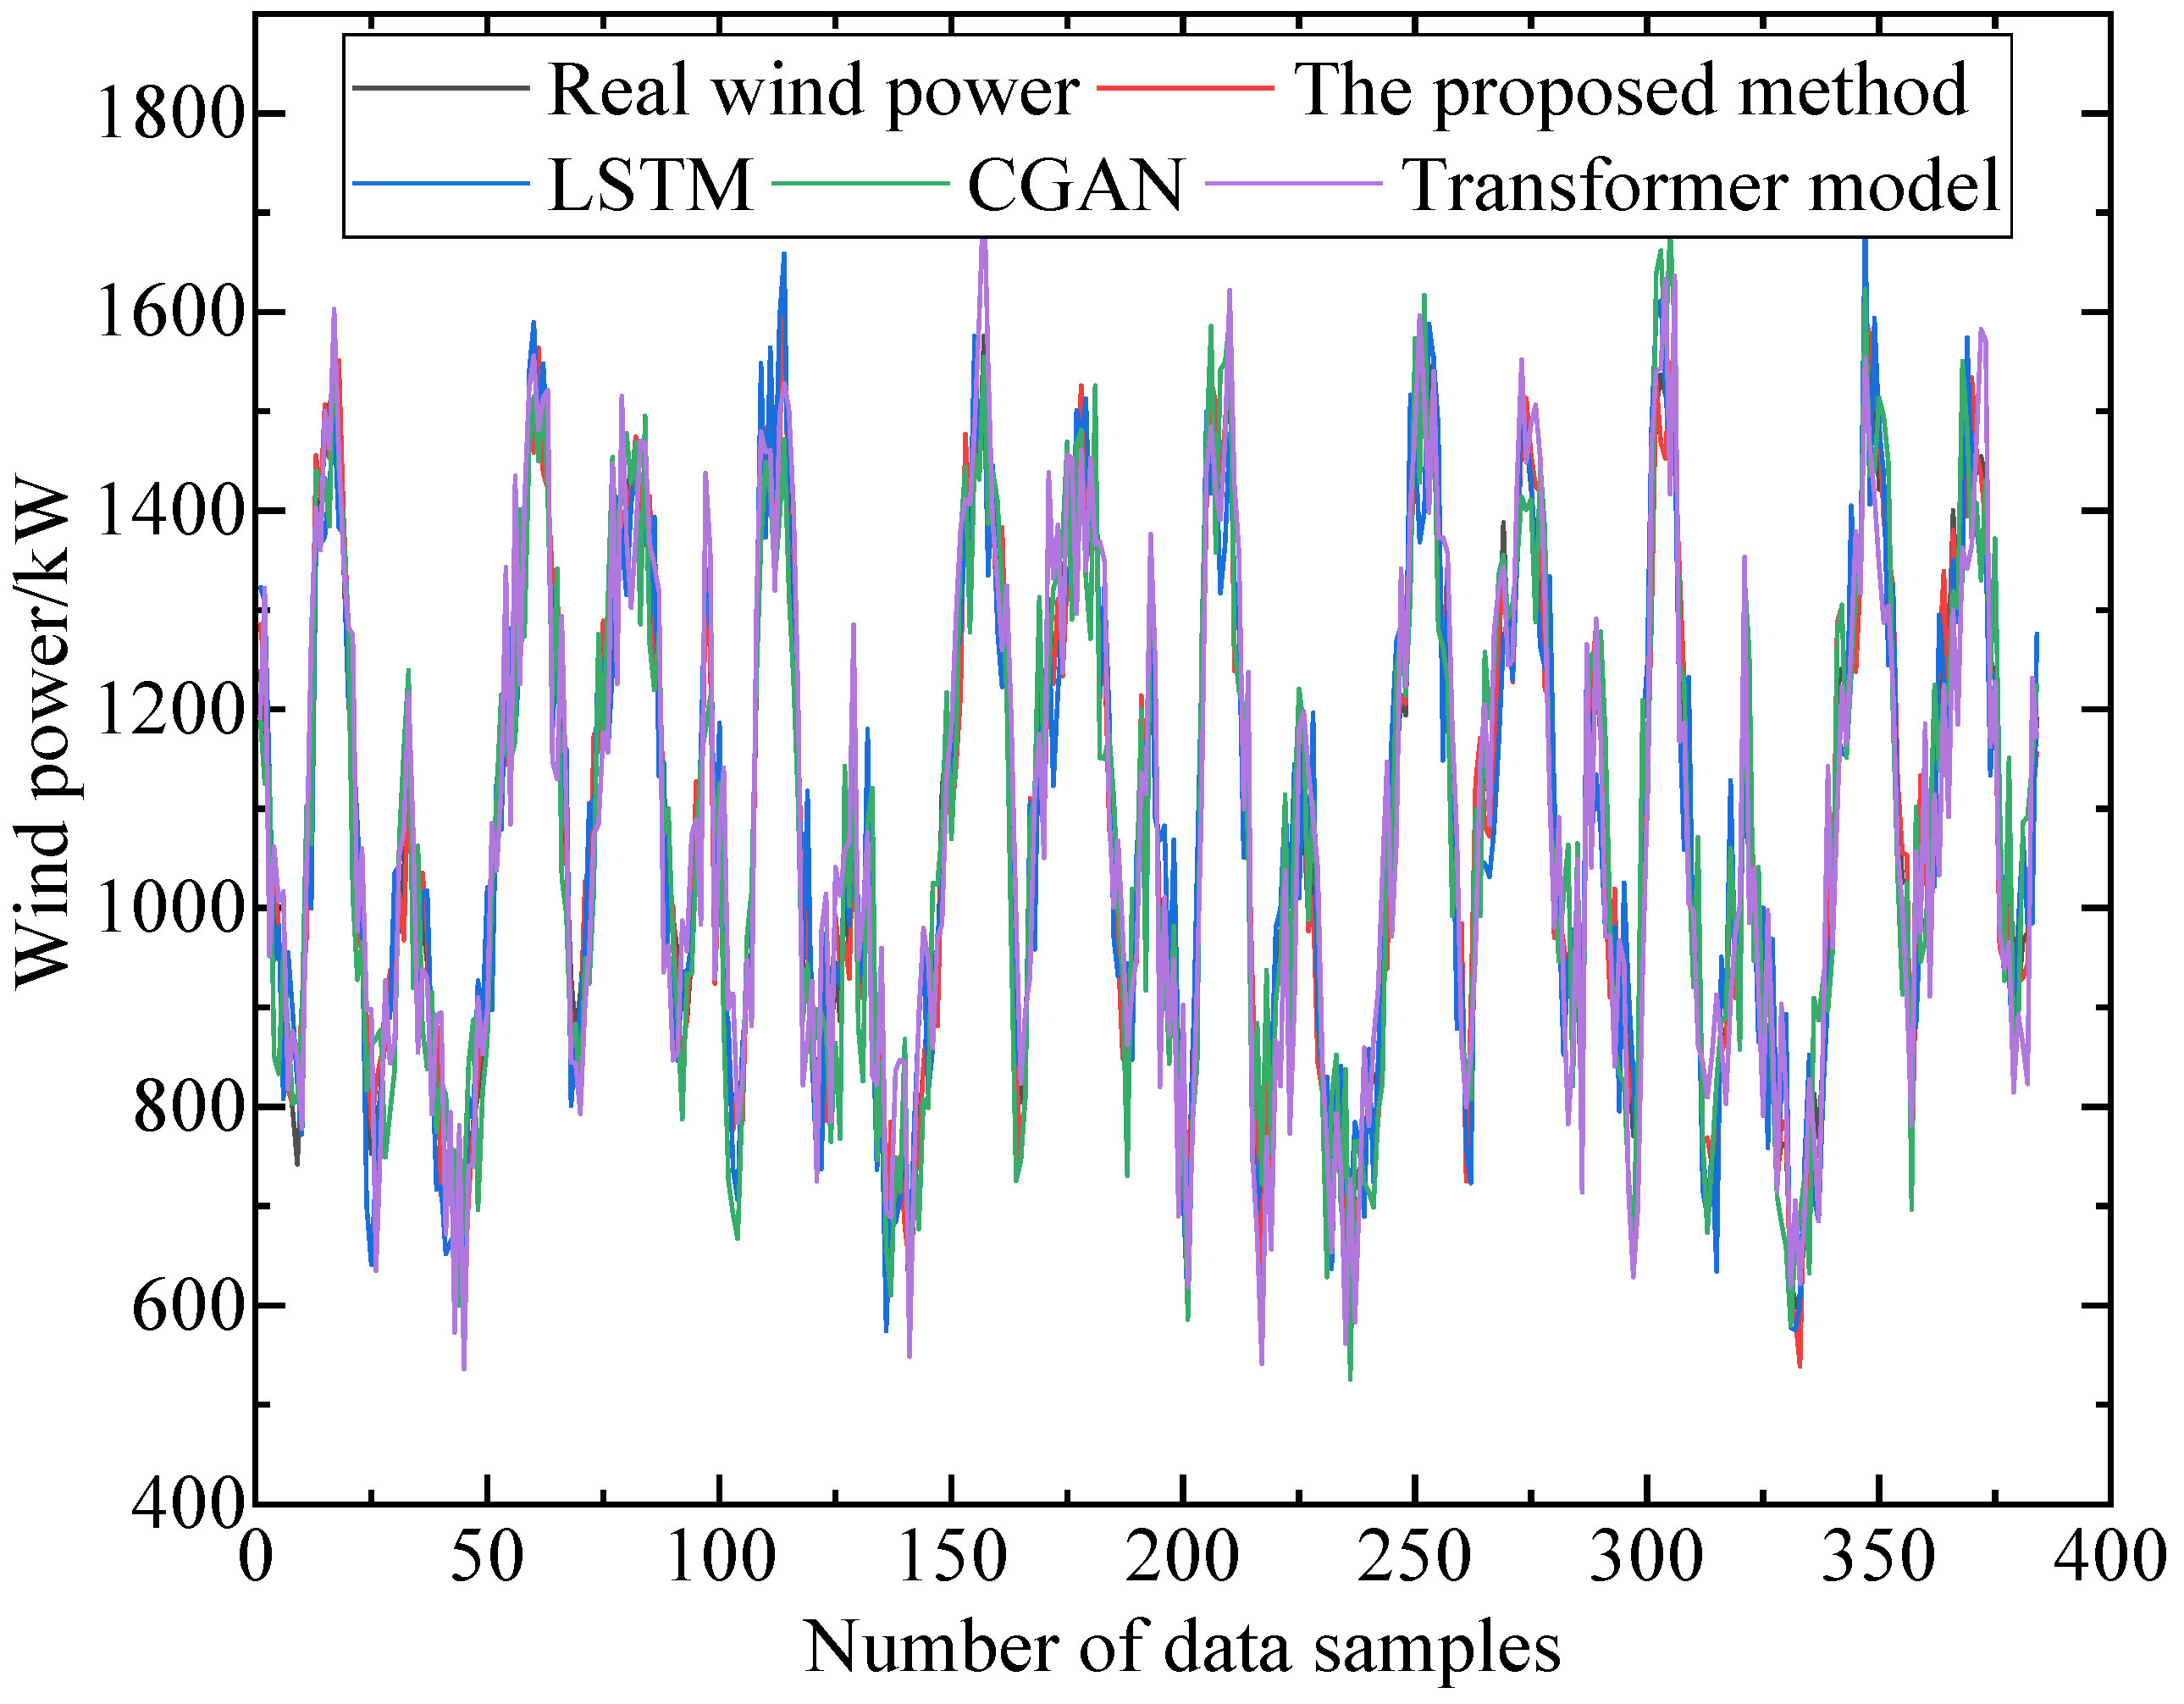
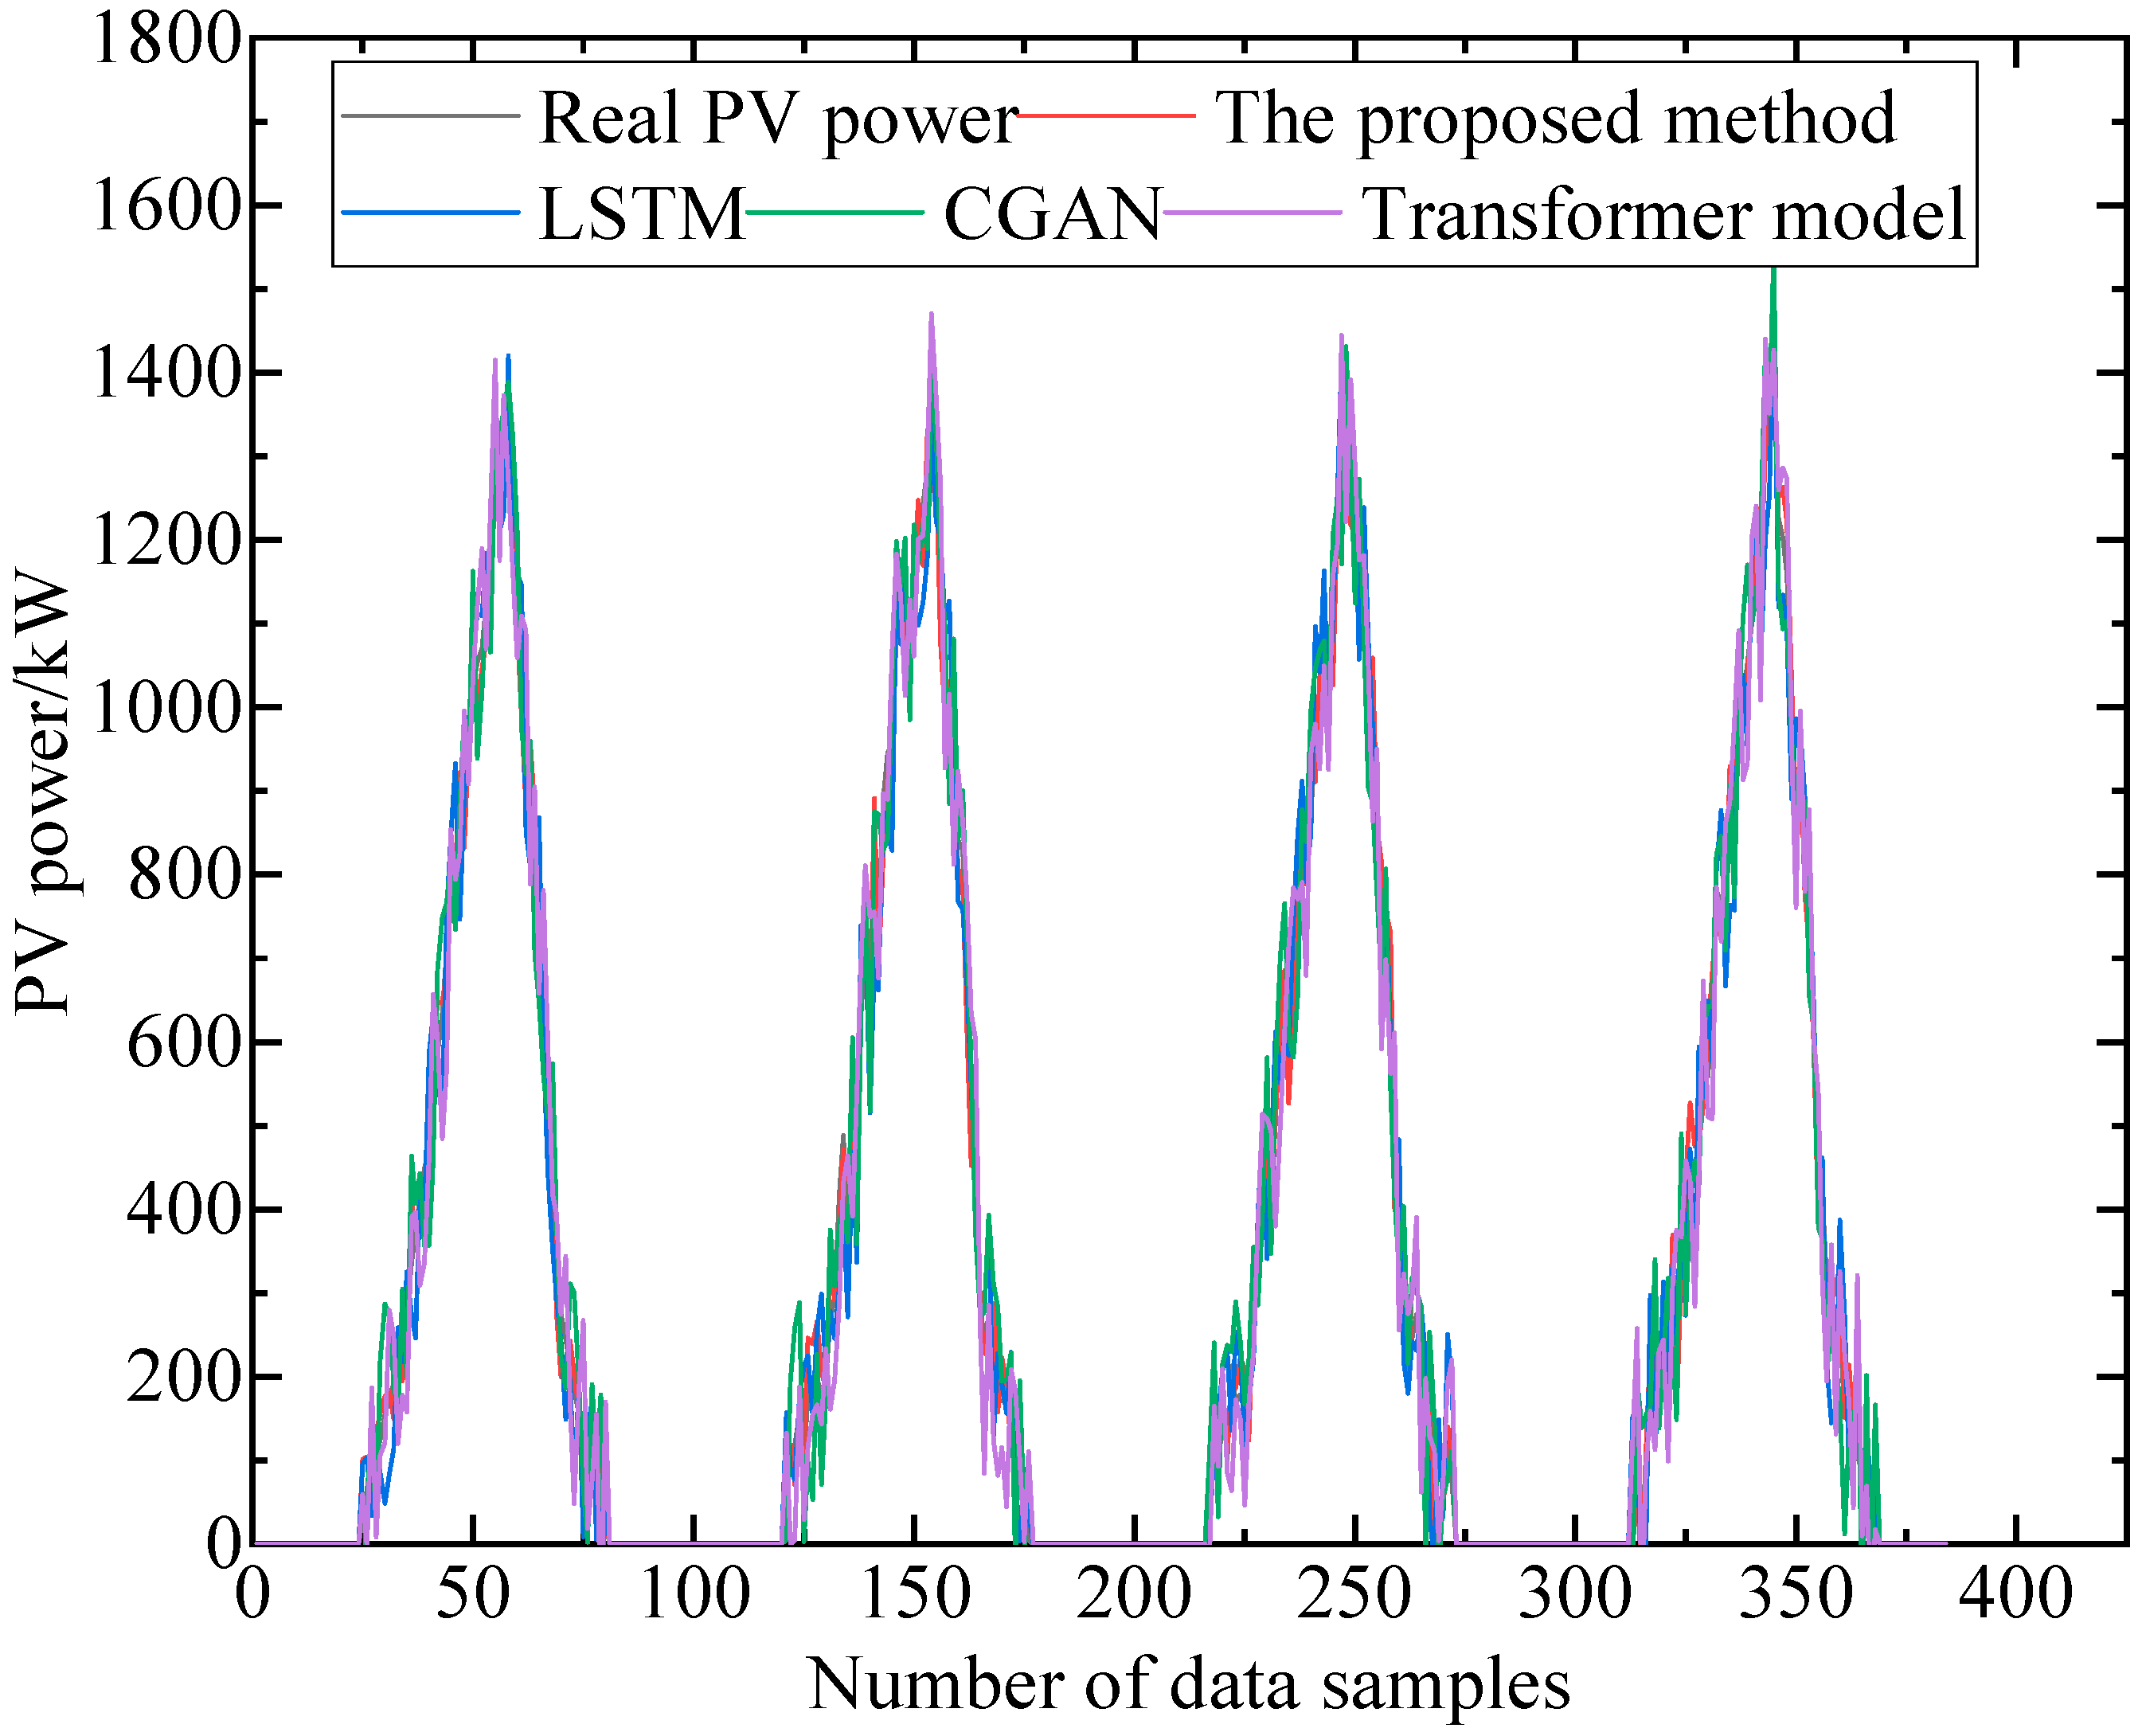
By processing the original wind power/photovoltaic power sequences using VMD, complex non-stationary signals can be adaptively decomposed into a series of intrinsic mode components with finite bandwidth, arranged from high to low frequency. Among these, the high-frequency components (e.g., IMF1) primarily capture random noise, instantaneous fluctuations, and uncertainties in the original data; the intermediate-frequency components (e.g., IMF2-IMF3) typically correspond to short-term regular fluctuations caused by sudden changes in wind speed, cloud movement, etc., and the low-frequency components (e.g., the last IMF) reflect long-term smooth trends dominated by weather systems, diurnal cycles, etc. This decomposition is critically helpful for subsequent forecasting: firstly, it transforms the non-stationary original sequence into a series of relatively stationary subsequences, significantly reducing the difficulty of direct model fitting; secondly, different components can be modeled in a targeted manner (e.g., simple networks for high-frequency components and complex networks for low-frequency components), improving the efficiency and accuracy of feature extraction; finally, the decomposition effectively separates noise from useful information, enhancing the model’s robustness. The lower the frequency of a component, the smother its curve, which fundamentally stems from the energy distribution characteristics of the signal—high-frequency components carry the rapidly changing, irregular details and noise parts of the signal, while low-frequency components concentrate the main energy and slowly varying trend information of the signal, exhibiting longer time scales and gentler changes, thus demonstrating stronger stationarity. Through the extraction and analysis of data from each component, the forecasting accuracy of different models is shown in
Figure 6 and
Figure 7 below.
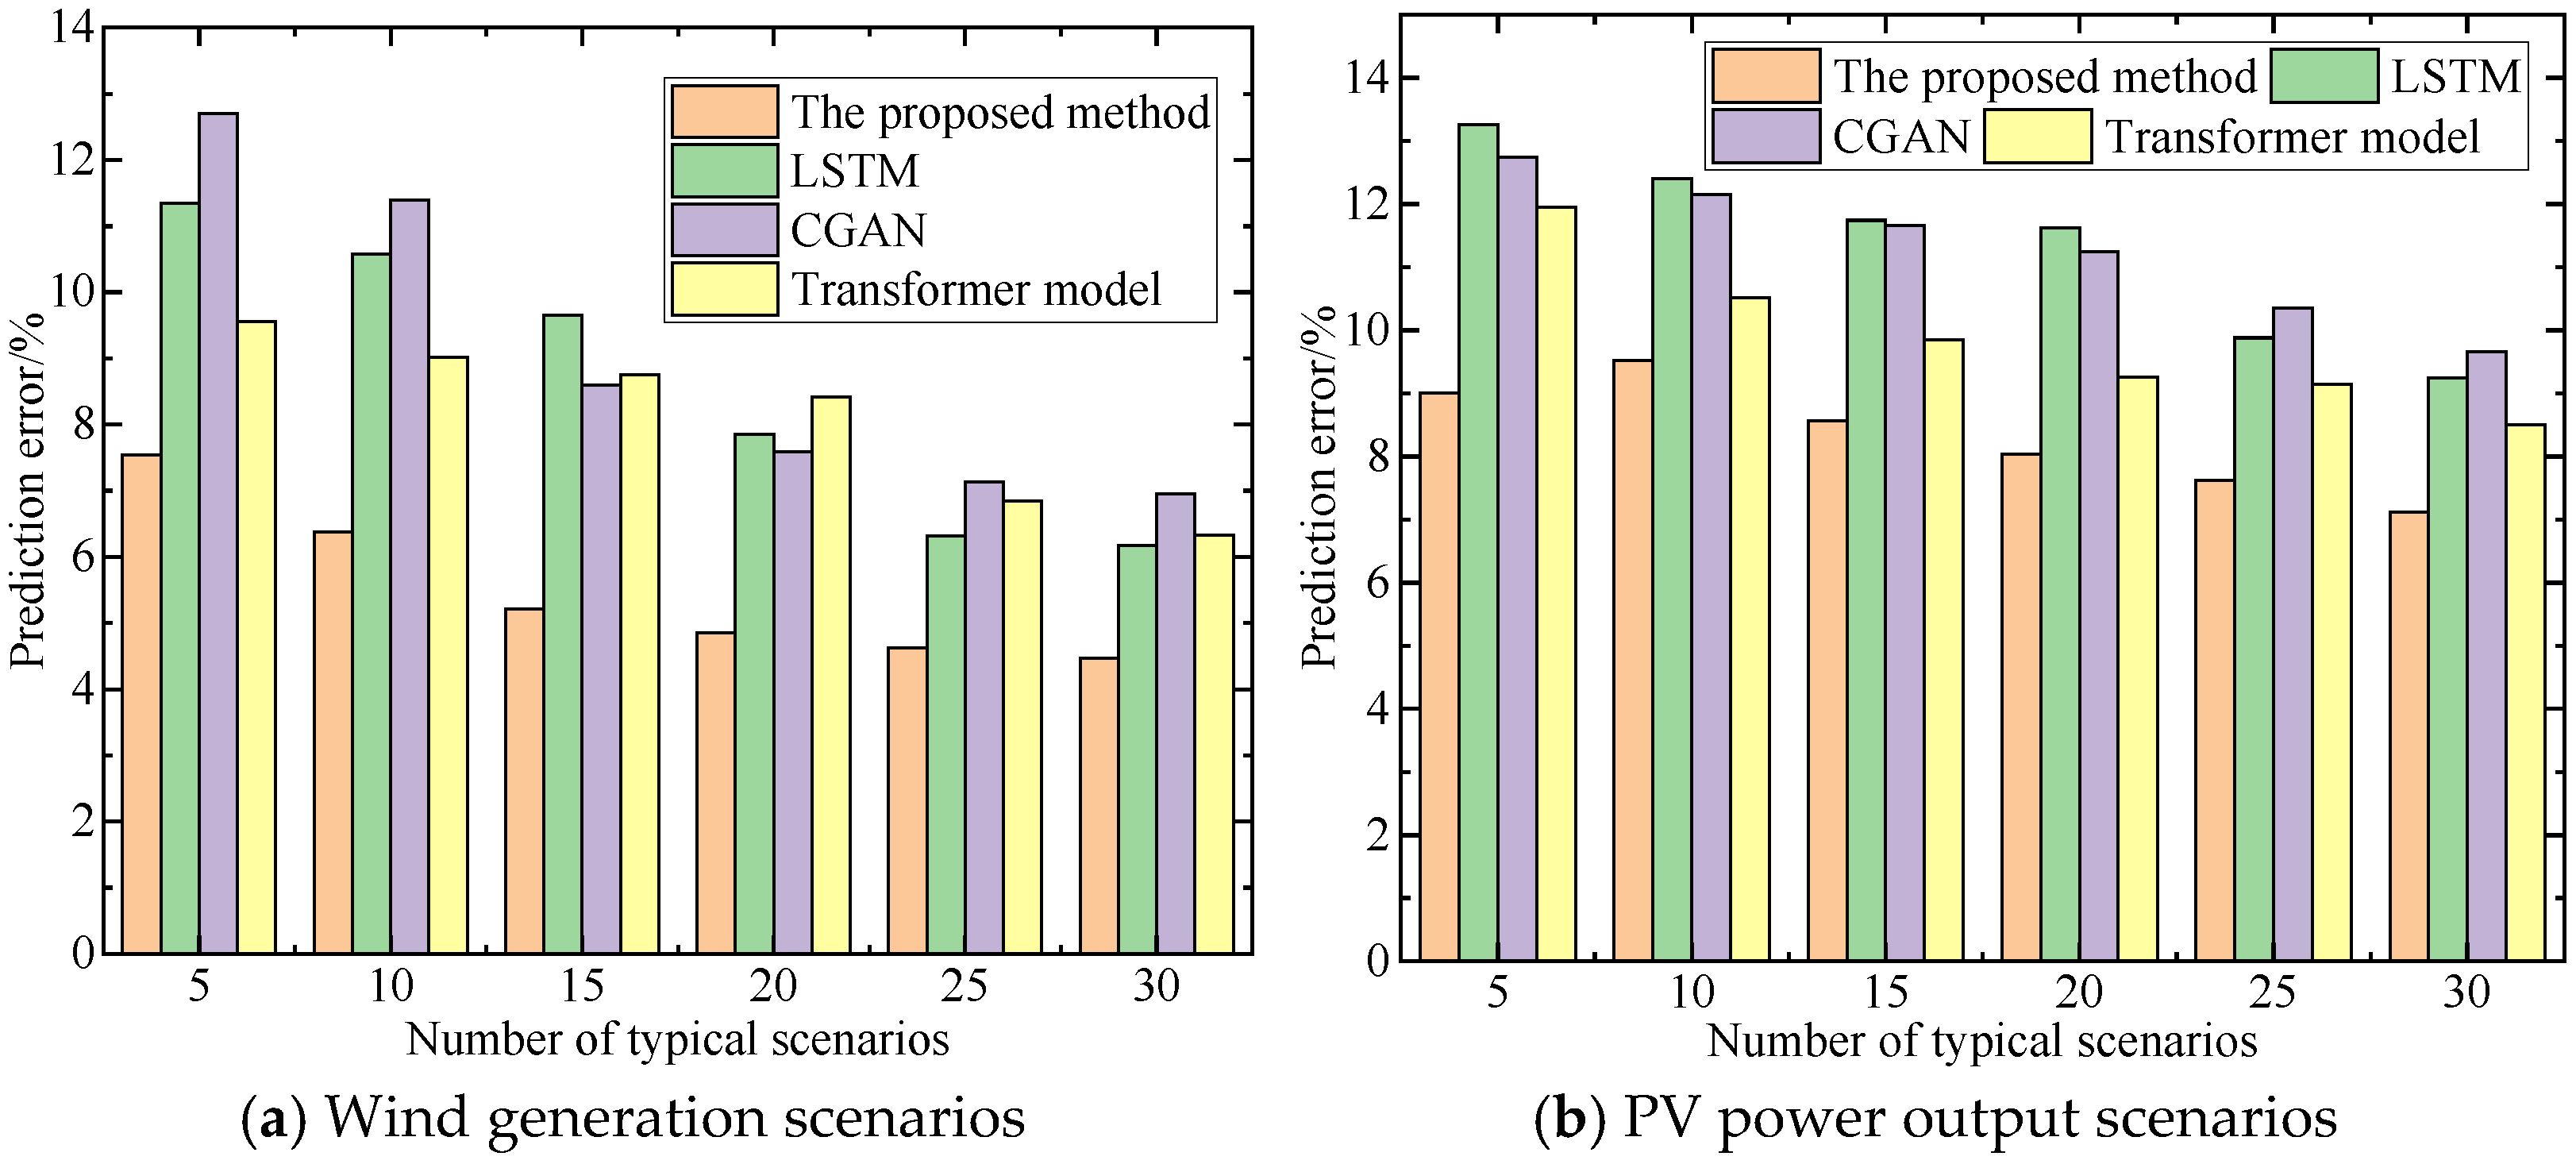
To demonstrate the differences in prediction accuracy among the various methods,
Figure 8 is used to illustrate the comparison of prediction errors under different numbers of typical scenarios.
By observing the figure above, it can be found that the prediction errors of all methods decrease as the number of typical scenarios increases. A greater number of scenarios leads to more precise characterization of renewable energy power output, but it also increases the computational burden.
6.3. Effectiveness Analysis of the Scheduling Decisions
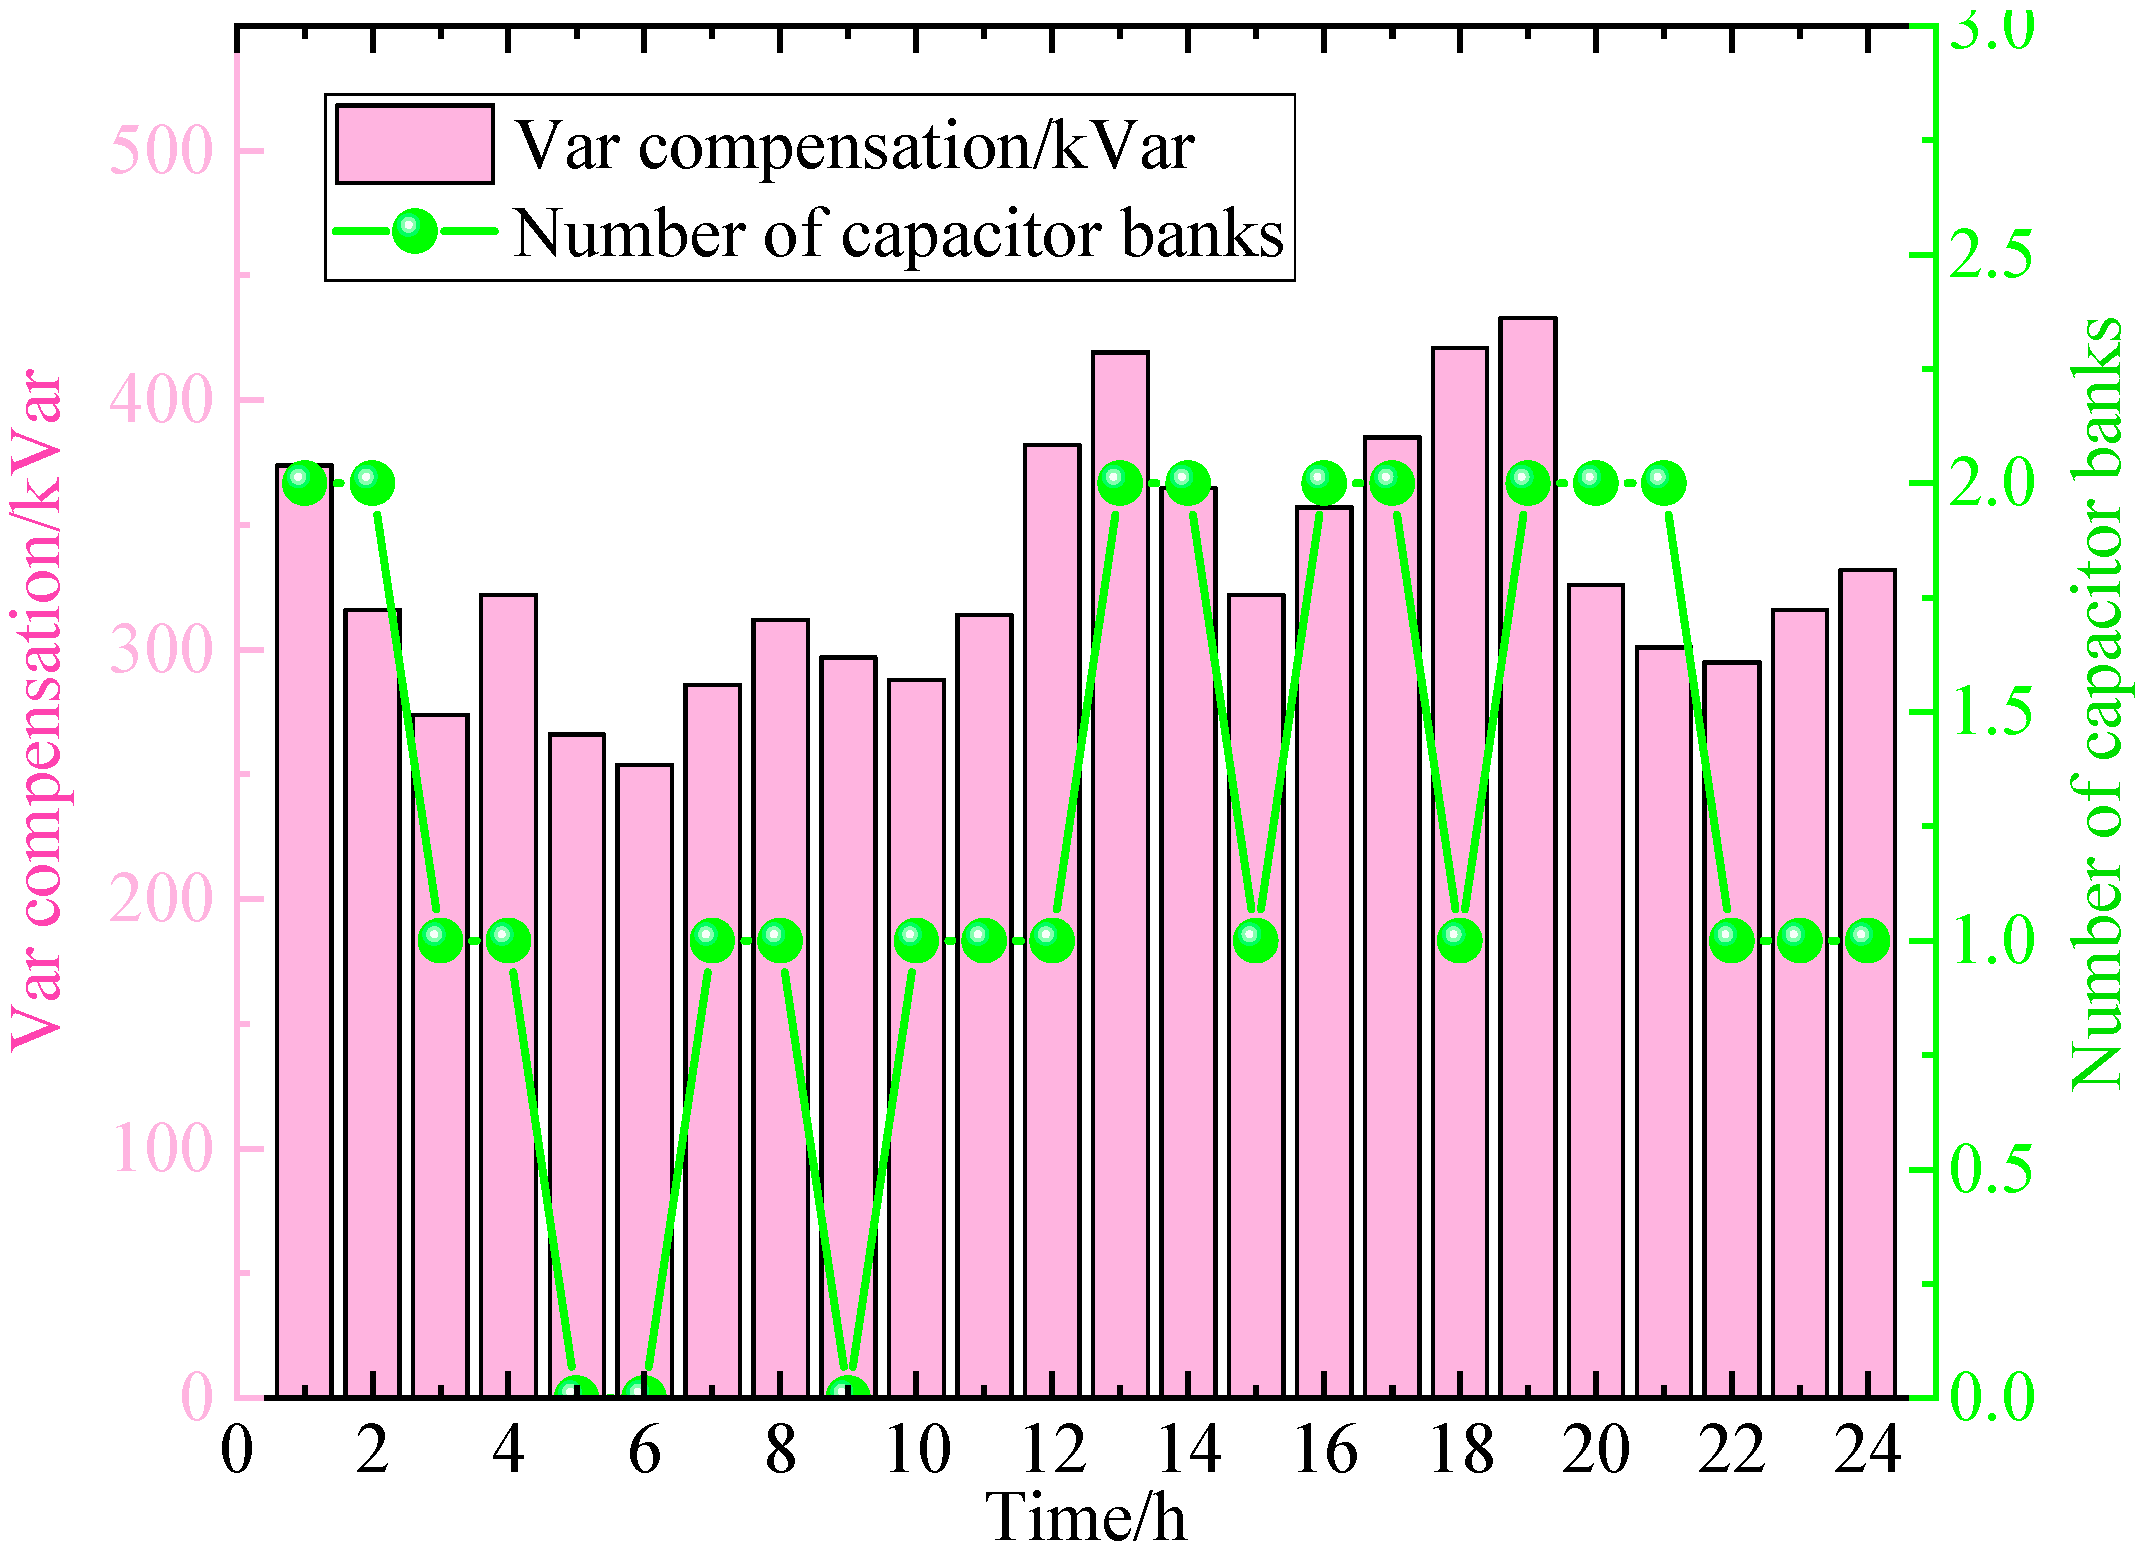
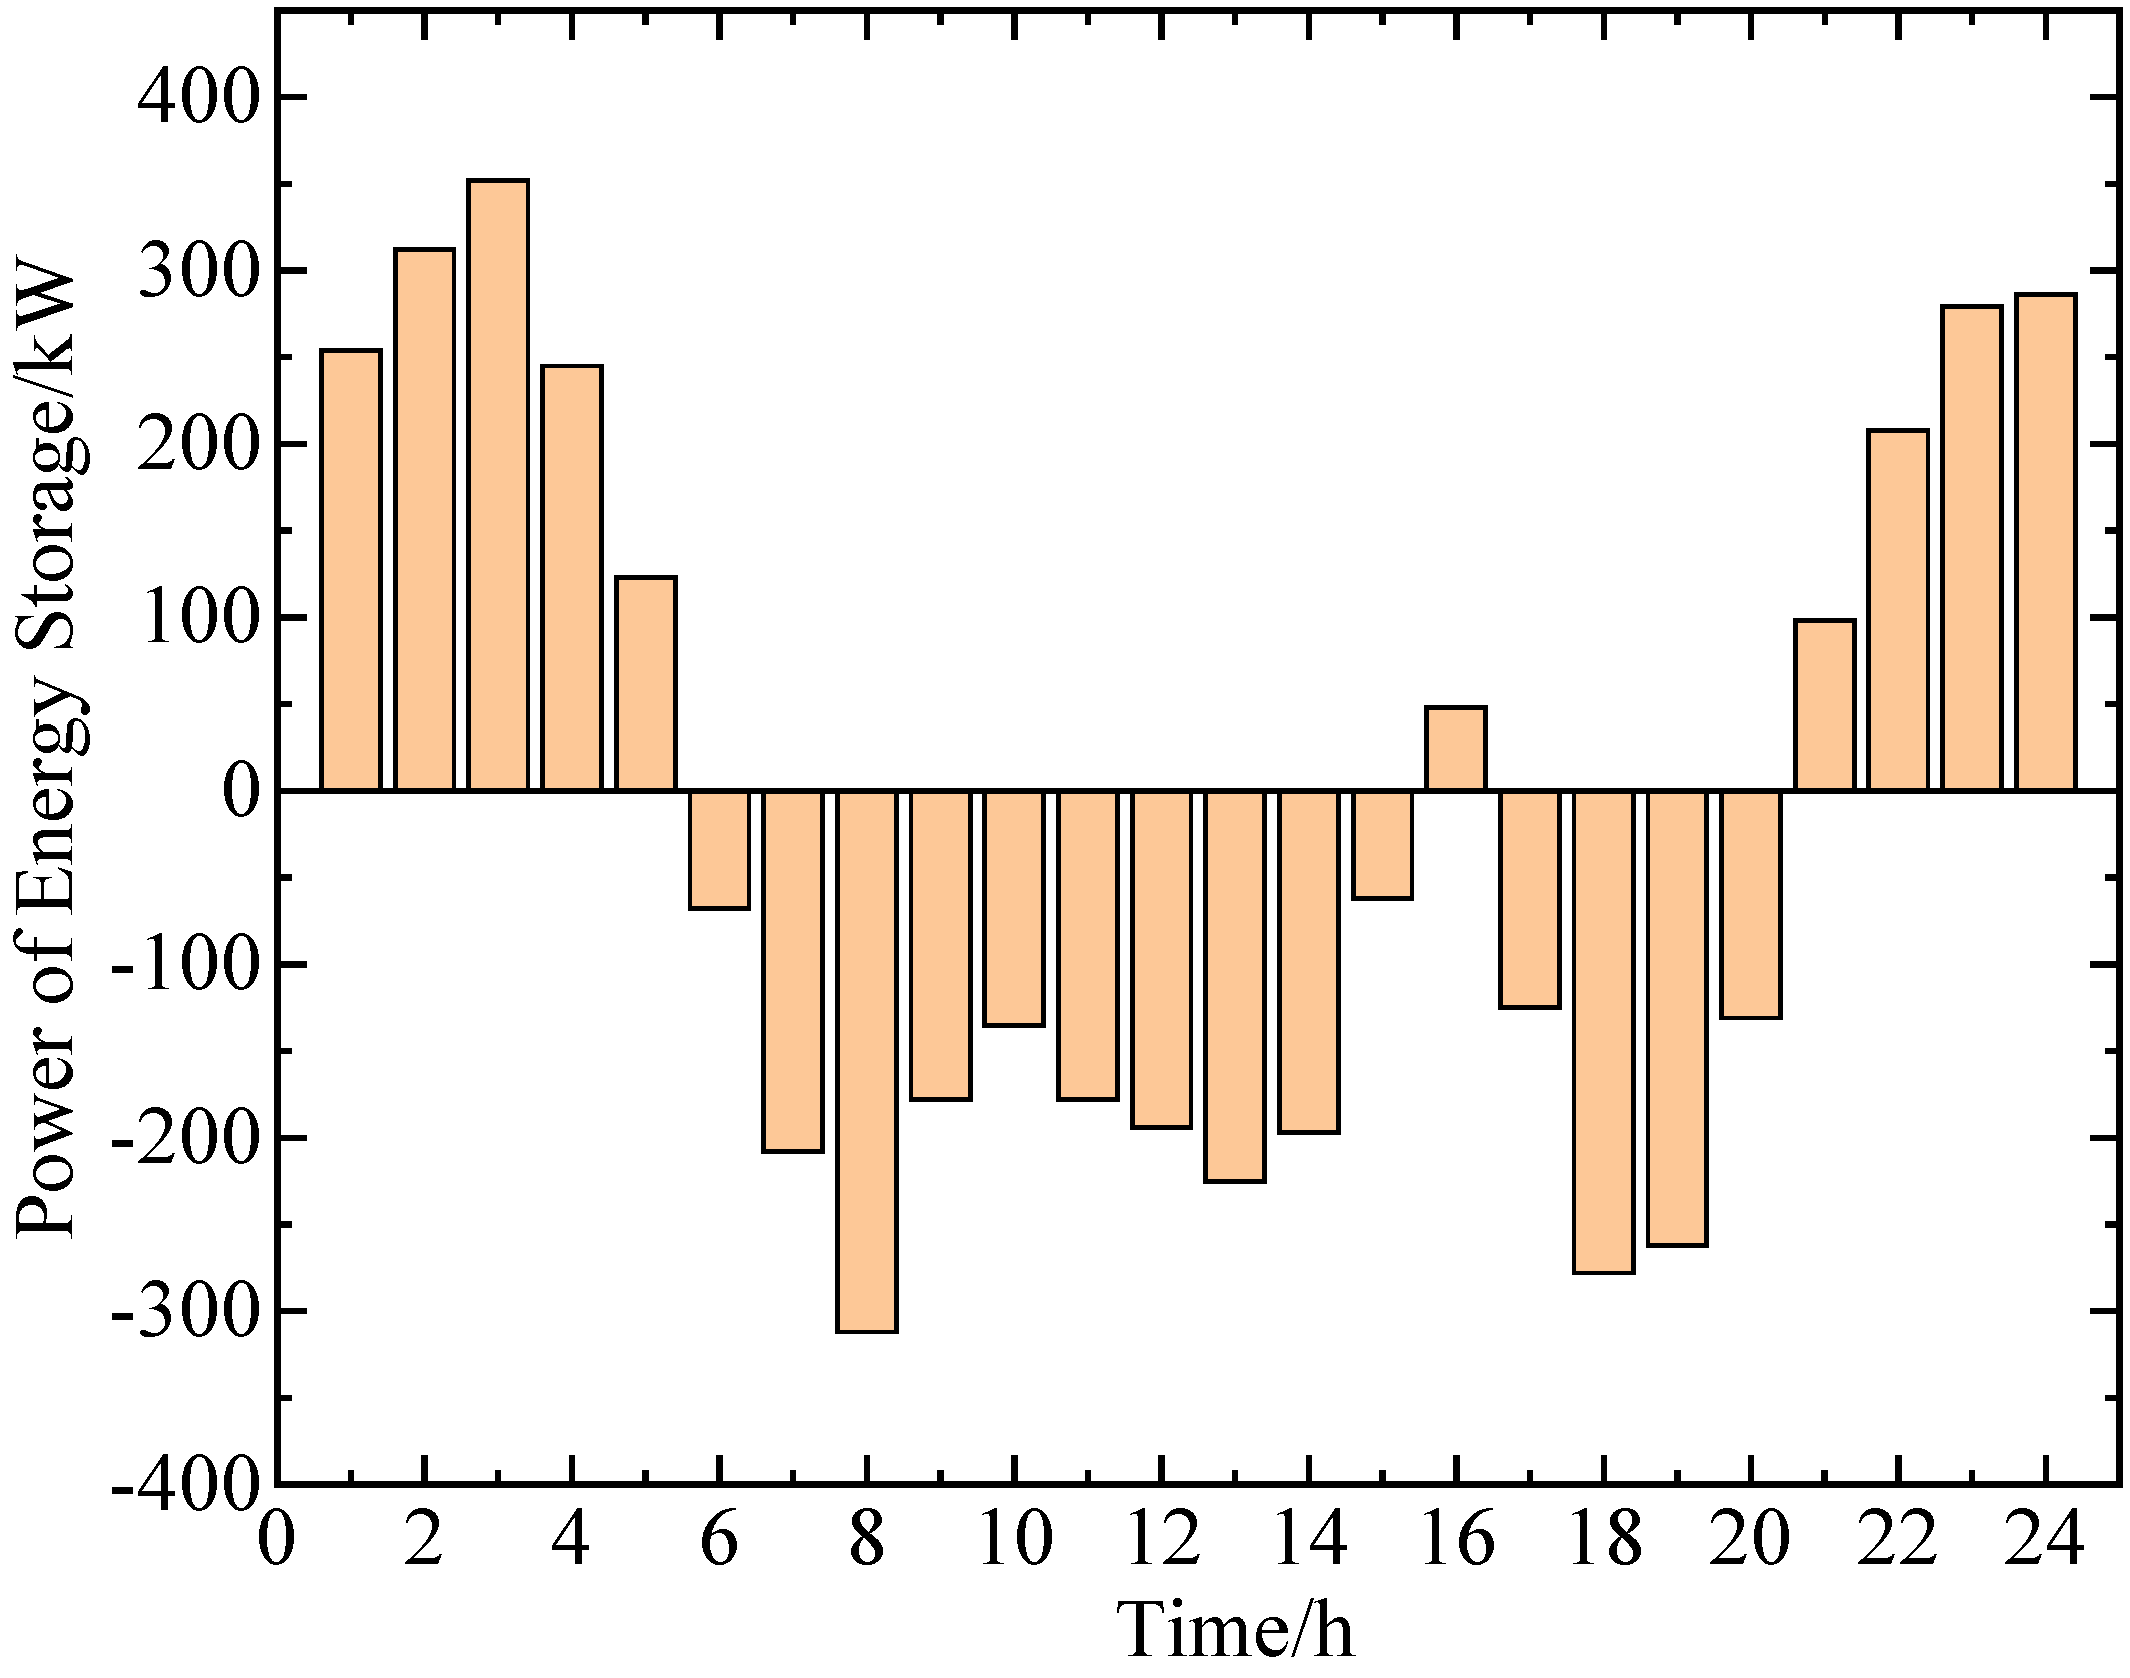
To verify the effectiveness of the proposed scheduling decisions, this paper selects a specific scheduling period, namely 24 h, for analysis. The charging and discharging power of the energy storage equipment is illustrated in
Figure 9 below, while the response of the reactive power compensation equipment is shown in
Figure 10 below as well.
Observing
Figure 9 and
Figure 10 above, when the output of renewable energy is substantial, the generated power may exceed the instantaneous load demand. In such cases, energy storage charging can absorb the surplus electricity, preventing wind and solar power curtailment while balancing system power. Conversely, during peak load periods, energy storage discharging can supplement the power generation deficit, meeting electricity demand and alleviating transmission congestion. Meanwhile, during periods of intense fluctuations in renewable energy output or heavy load moments, the direction and magnitude of power flow in the grid can change rapidly, leading to sharp fluctuations in line voltage. As key voltage and reactive power regulation equipment, capacitor banks and OLTCs must operate frequently to rapidly inject or absorb reactive power, thereby stabilizing voltage within acceptable ranges and ensuring power supply quality. These two types of phenomena collectively underscore the urgent need for flexible regulation resources and rapid voltage support measures in power systems with a high proportion of renewable energy integration.
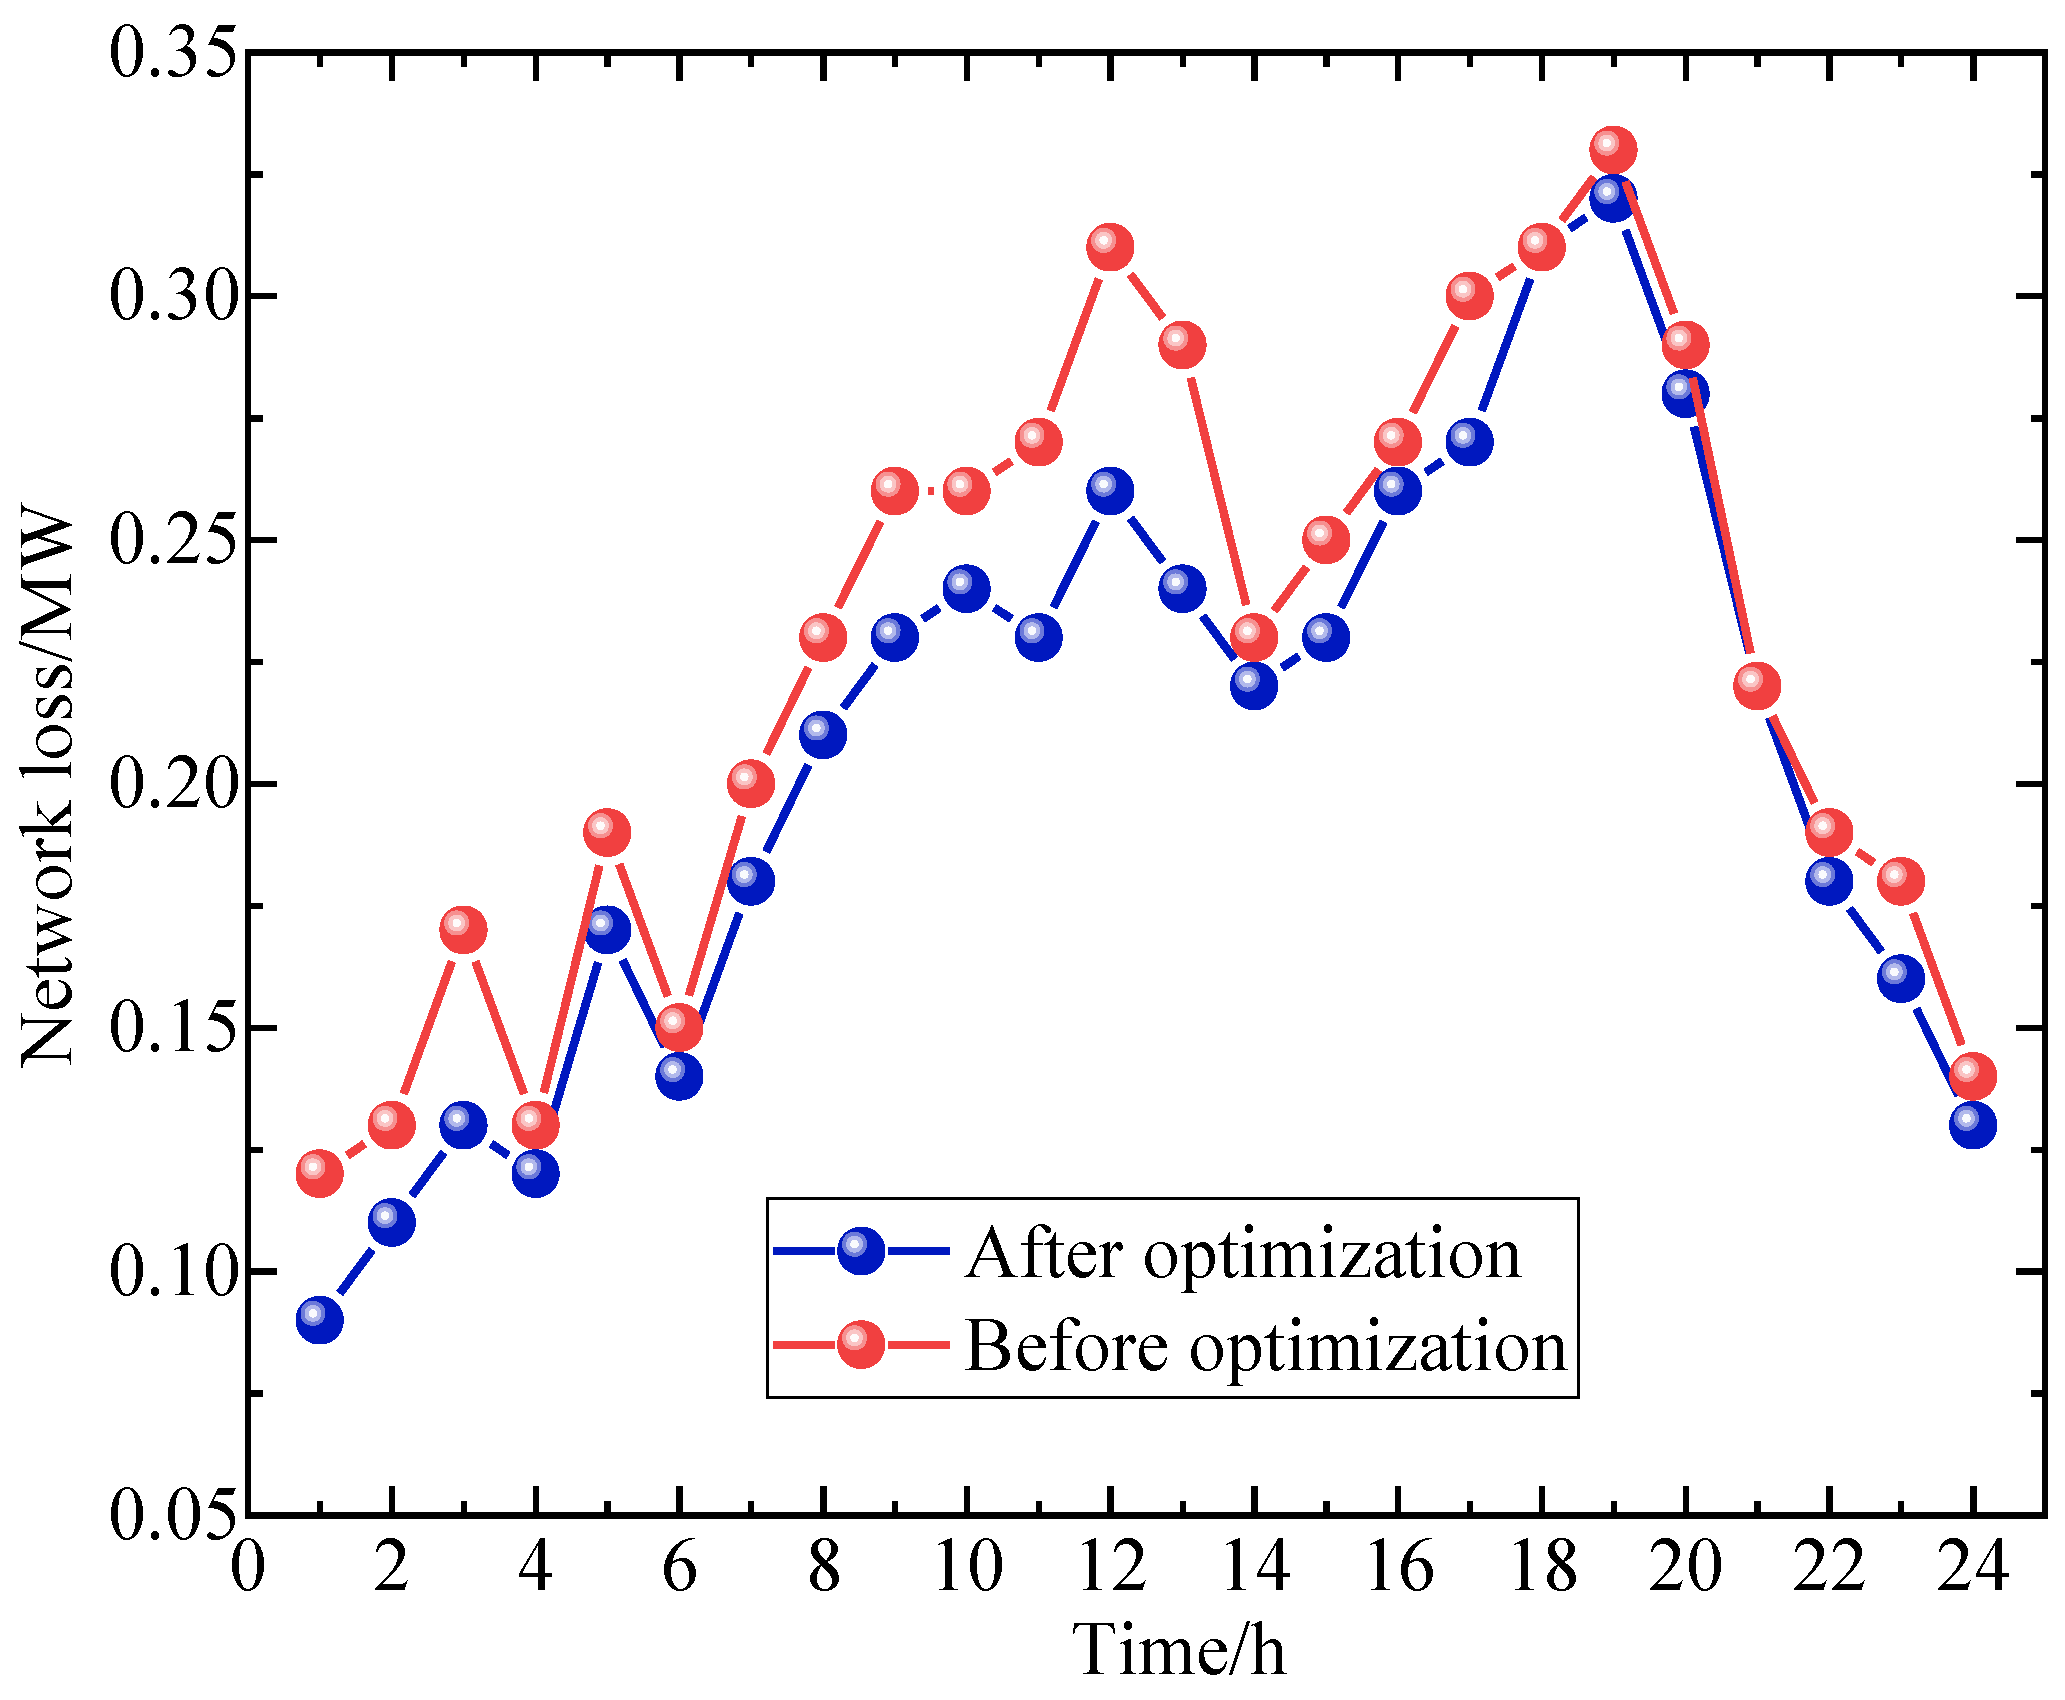
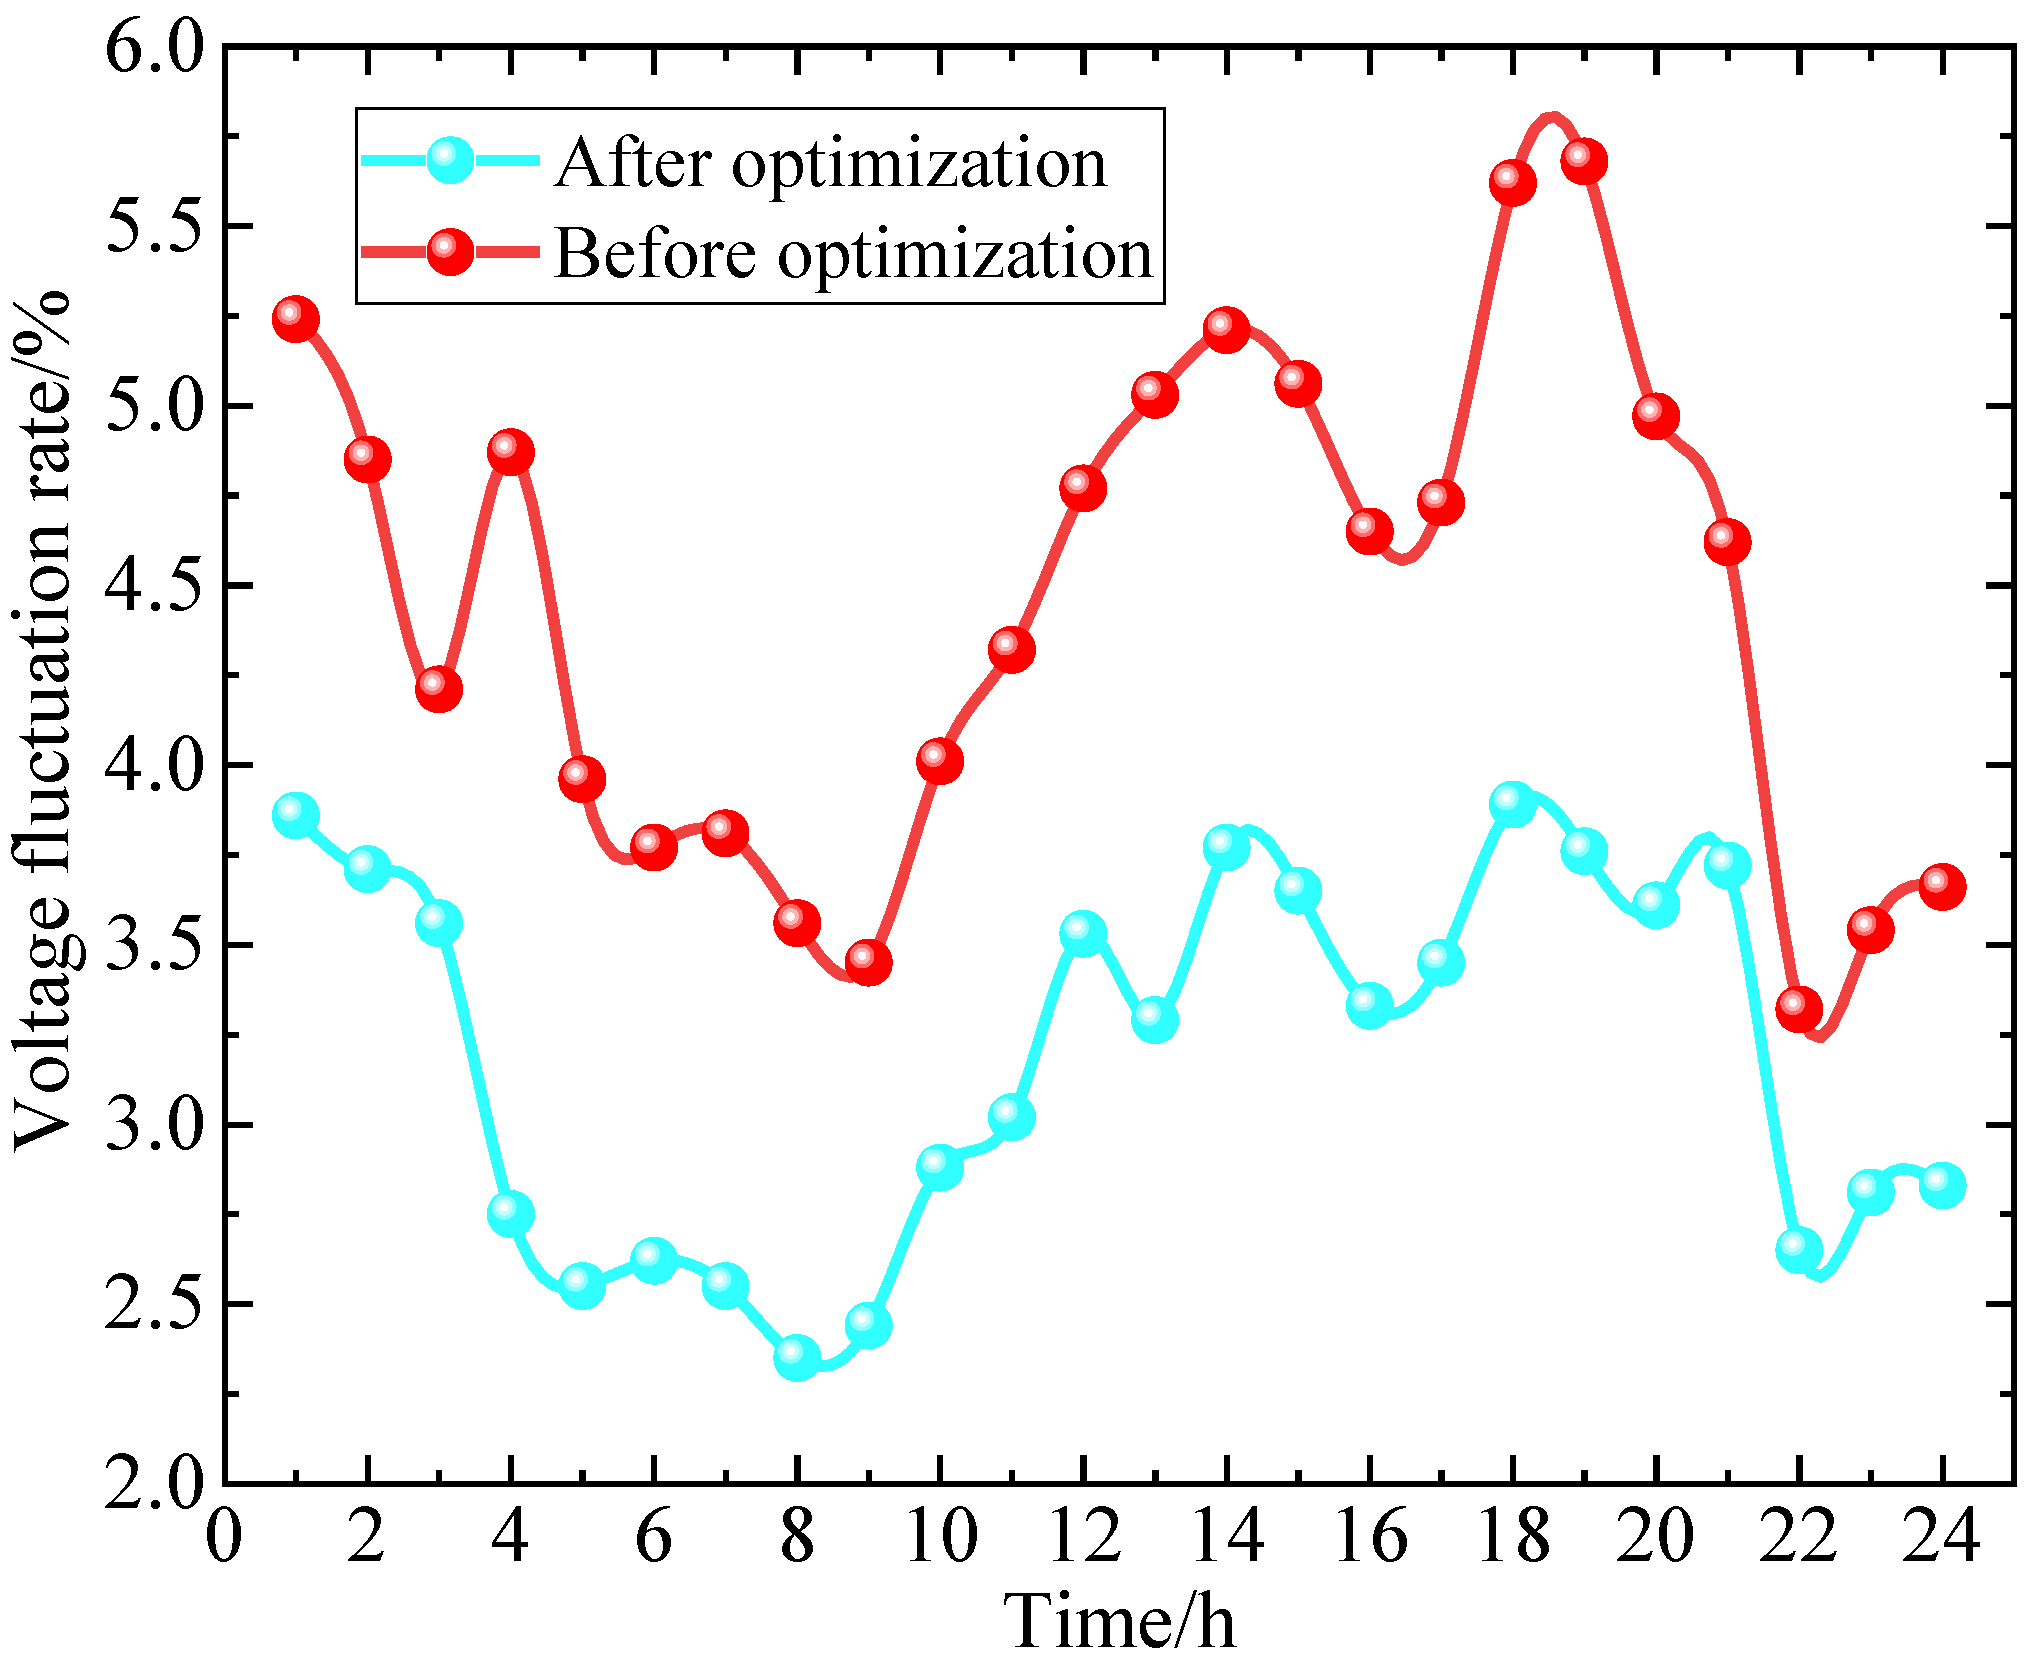
Figure 11 and
Figure 12 further illustrate the voltage fluctuation rate and network losses before and after optimization. Through comparison, it is evident that the optimized voltage fluctuation rate has decreased by 1.7%, and network losses have dropped by 17.4%.
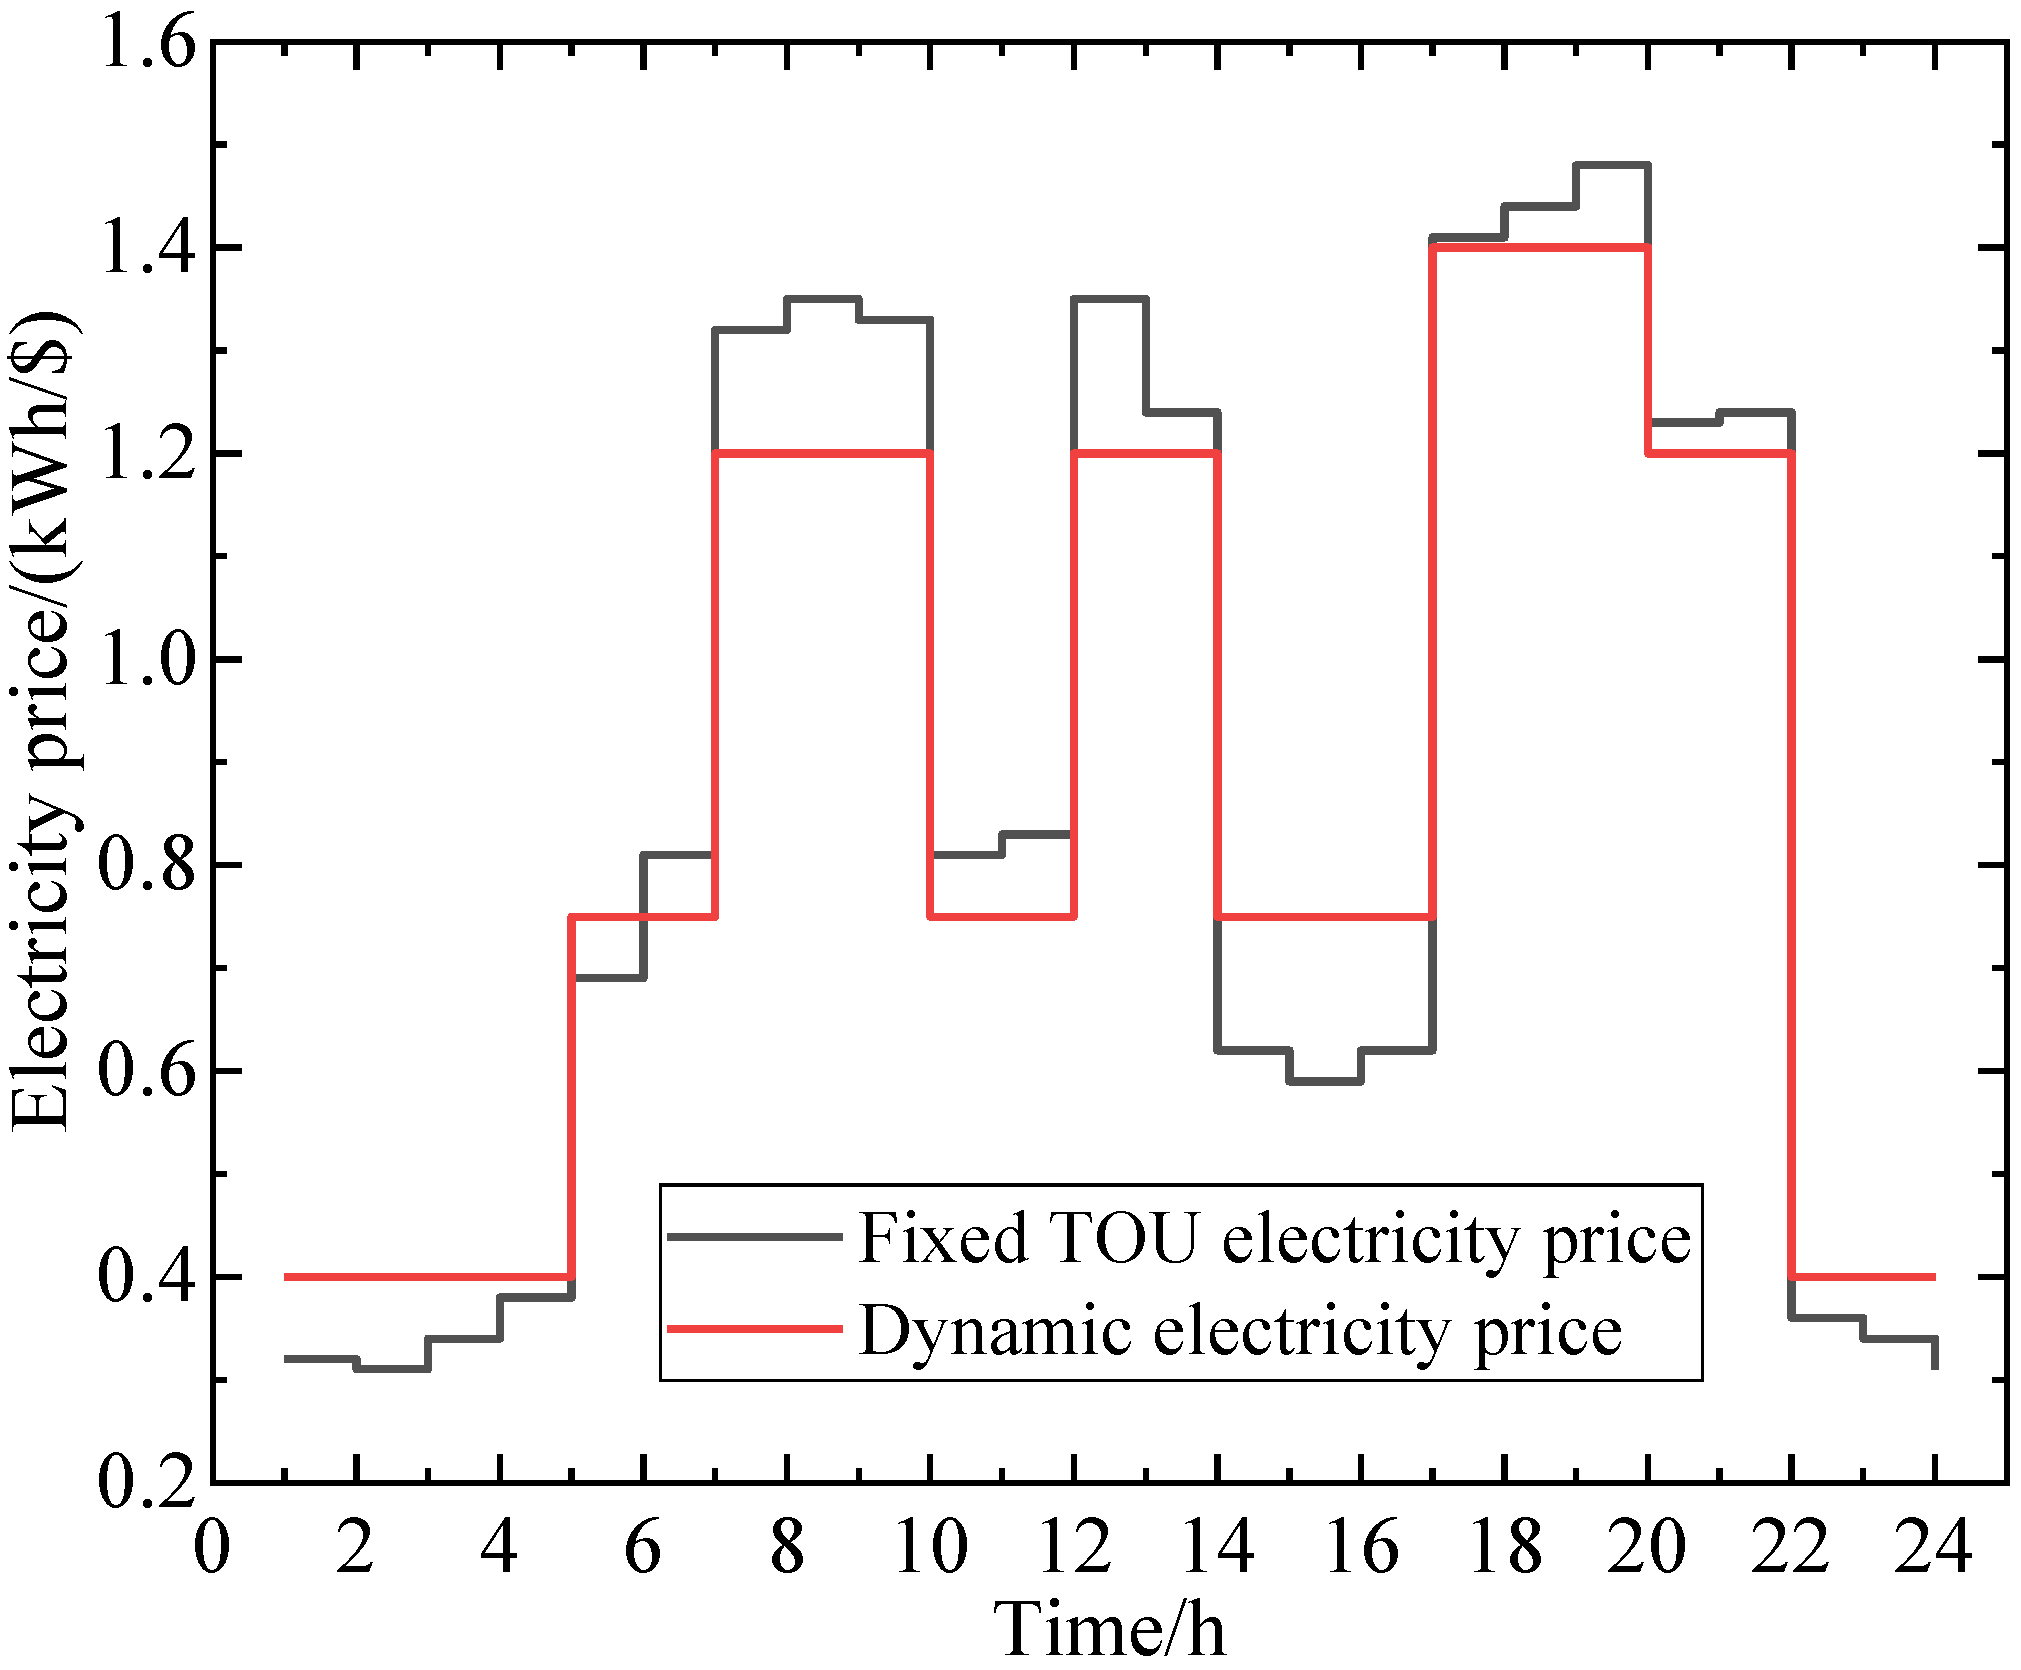
Figure 13 and
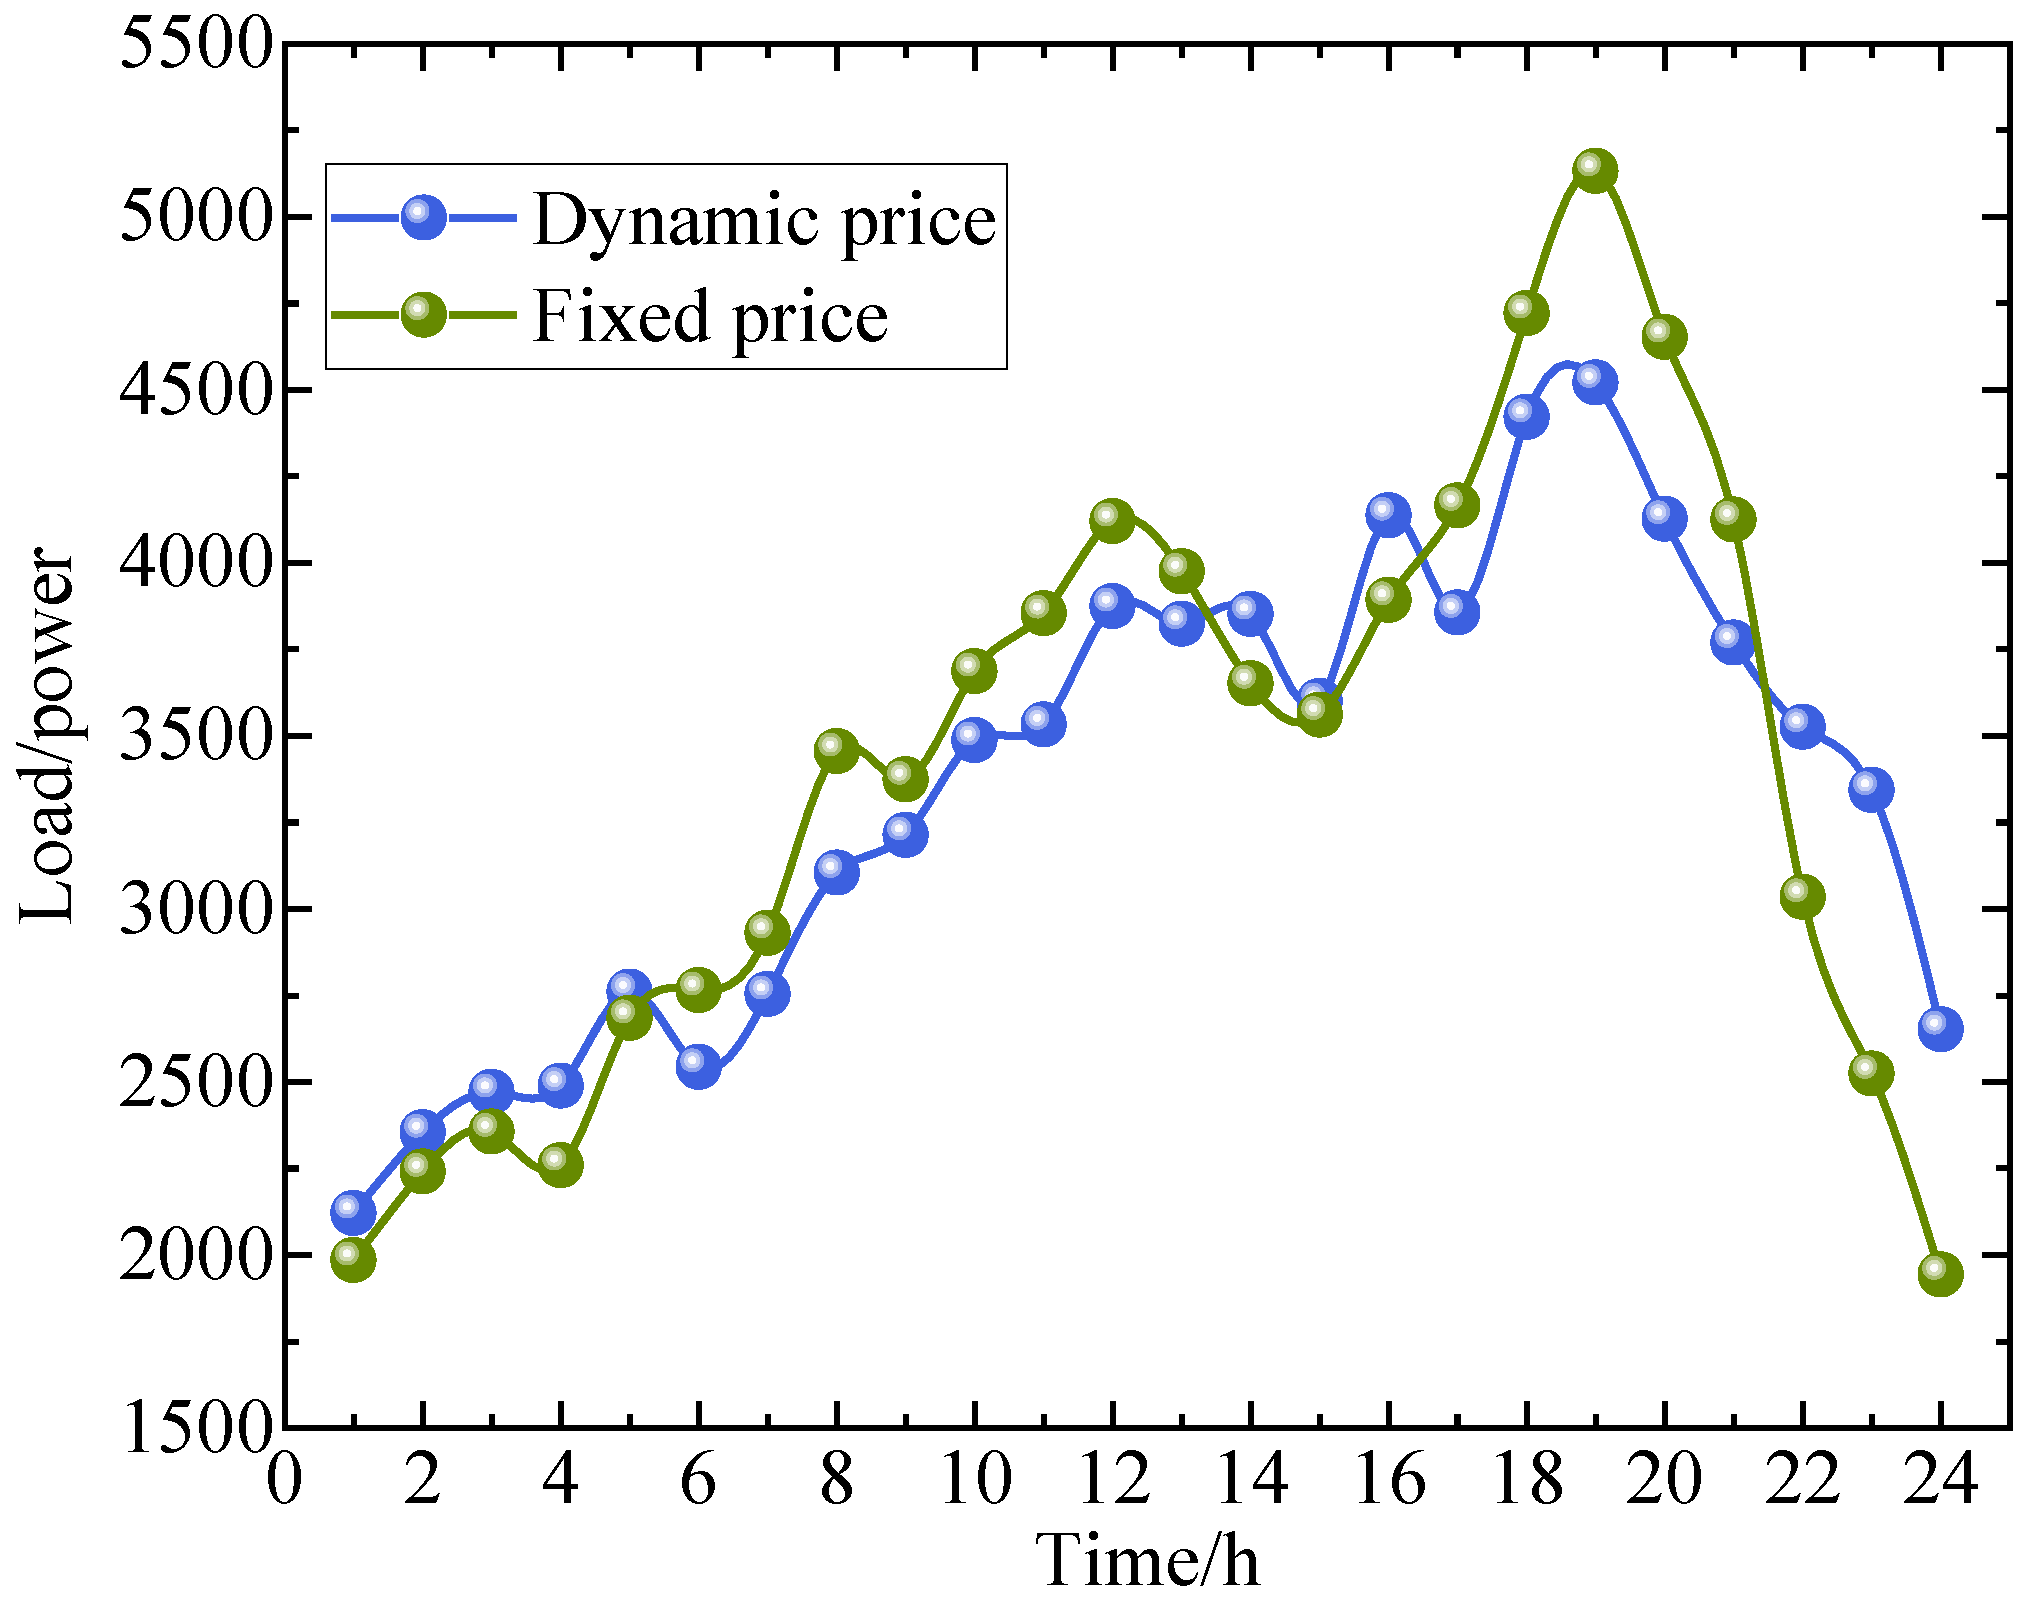
Figure 14 further demonstrate the dynamic electricity pricing and load regulation effects presented in this paper. Compared to a fixed time-of-use pricing mechanism, the core advantage of dynamic electricity pricing lies in its high degree of alignment between price signals and the real-time supply–demand conditions of the power system. It can more accurately and promptly reflect instantaneous fluctuations in generation costs, network congestion, and renewable energy output, thereby economically guiding users to increase electricity consumption when generation is abundant and prices are low, and actively reduce demand during periods of supply constraint and high prices, such as peak load hours. This flexible response not only grants users greater choice in reducing their electricity bills but, more importantly, efficiently flattens load fluctuations from the demand side, promoting the consumption of renewable energy. There exists a fundamental conflict between around-the-clock electricity price adjustments and users’ need for price stability. Residential and small-to-medium commercial users require stable prices to plan their electricity consumption in advance and control costs, while frequent price fluctuations can lead to decision-making dilemmas and additional costs for them, thereby undermining their enthusiasm for participation. Industrial users’ production plans rely on long-term cost forecasts, and dynamic pricing can easily result in cost overruns and affect efficiency. From a psychological perspective, price stability is the foundation of trust, and dynamic pricing exceeds the cognitive and operational capabilities of most users. Technically, it relies on high-precision forecasting and real-time communication, but users, constrained by hardware and cognitive limitations, may choose “non-response.” Therefore, designing a limited dynamic pricing mechanism that retains the framework of fixed or time-of-use pricing, triggers short-term adjustments only during severe supply–demand imbalances with advance notification, and allows users to delay non-essential loads can reconcile the needs of both sides.
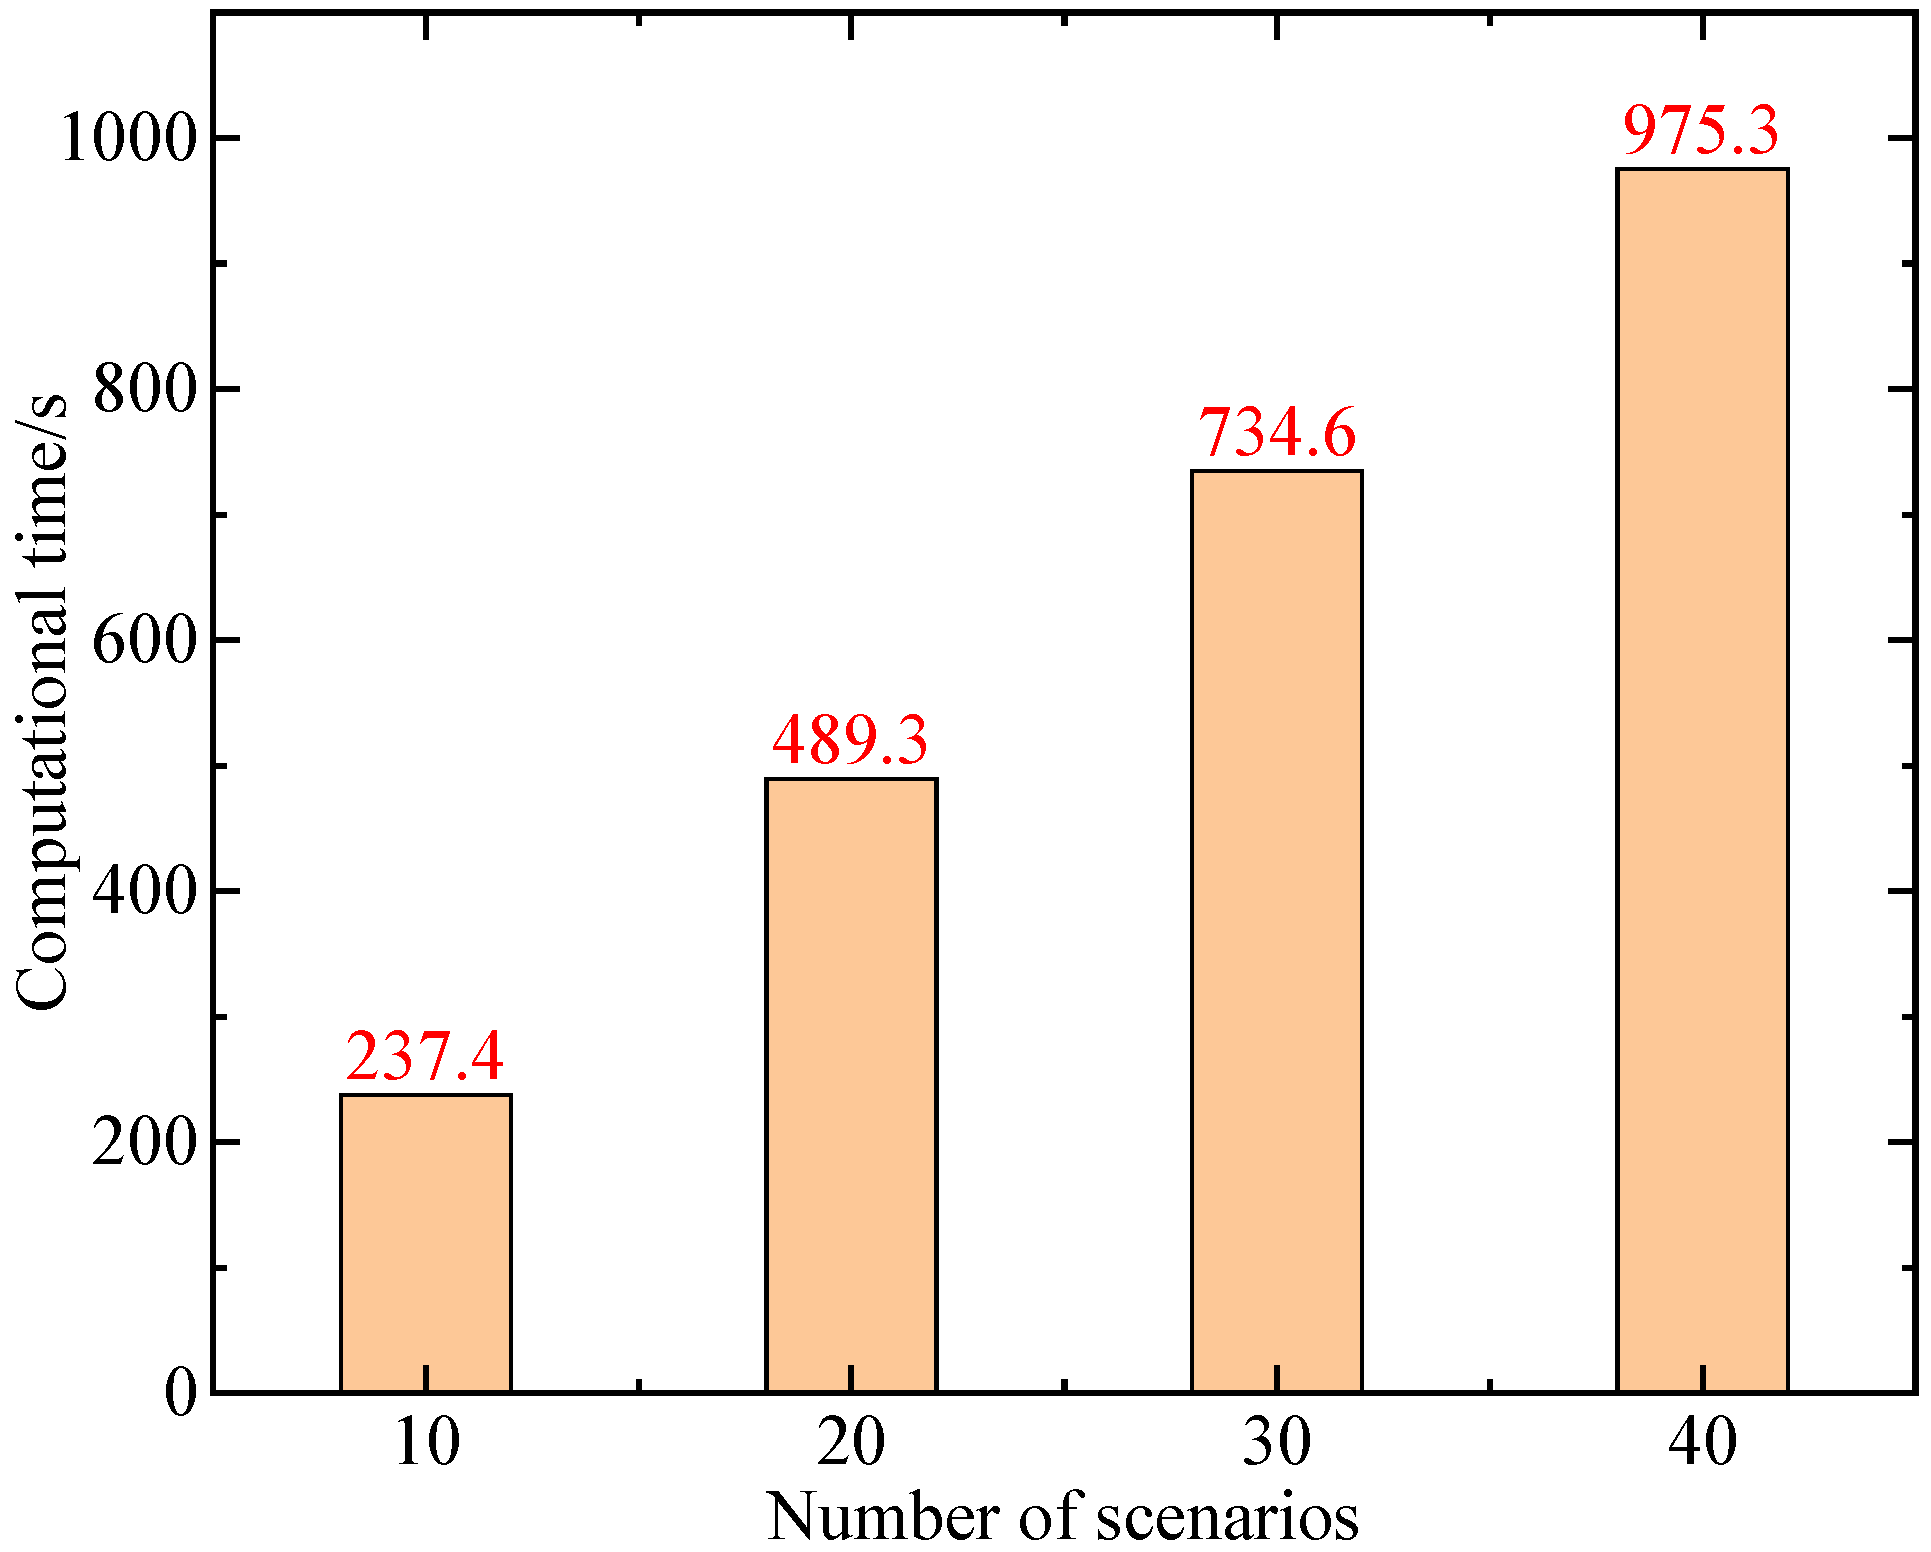
Table 1 and
Figure 15 further present the computational results of different methods as well as the computational efficiency of the method proposed in this paper. The proposed approach approximates the probabilistic distribution of uncertainties in renewable energy output by employing a set of discrete, probabilistic typical scenarios. Its advantage lies in optimizing decisions to achieve either the expected cost optimality or the conditional value-at-risk optimality across all scenarios, rather than targeting an extreme, low-probability worst-case scenario as in box-type robust models, nor does it require handling complex chance-constrained formulations. This enables decision-making solutions to better align with the actual statistical patterns of uncertainties, avoiding the reservation of excessive reserve capacity or the sacrifice of numerous economically efficient scheduling opportunities due to over-conservatism within an acceptable risk level, thereby significantly enhancing expected economic benefits. However, as the number of scenarios increases, the corresponding variables and constraints in the model grow proportionally, leading to a sharp expansion in the scale of the optimization problem. Consequently, the computational time and memory resources required for solving the problem rise substantially, resulting in reduced computational efficiency. This reflects the inherent trade-off between modeling accuracy and computational burden. In the simulation of the improved IEEE-33 bus system, comparing individual and coordinated optimization of generation, energy storage, and demand-side resources shows that coordinated optimization brings significant synergistic benefits: it reduces total system operating costs by 12.3% through spatiotemporal complementarity, narrows the voltage fluctuation range by 28.6% by suppressing voltage violations, increases the renewable energy consumption rate by 15.7% by avoiding supply–demand mismatches, and improves the charging and discharging cycle efficiency of energy storage devices by 19.4% by reducing ineffective cycles. These results collectively demonstrate that coordinated optimization unlocks complementary potential among components through an information-energy coupling mechanism, which is unattainable through individual component optimization.
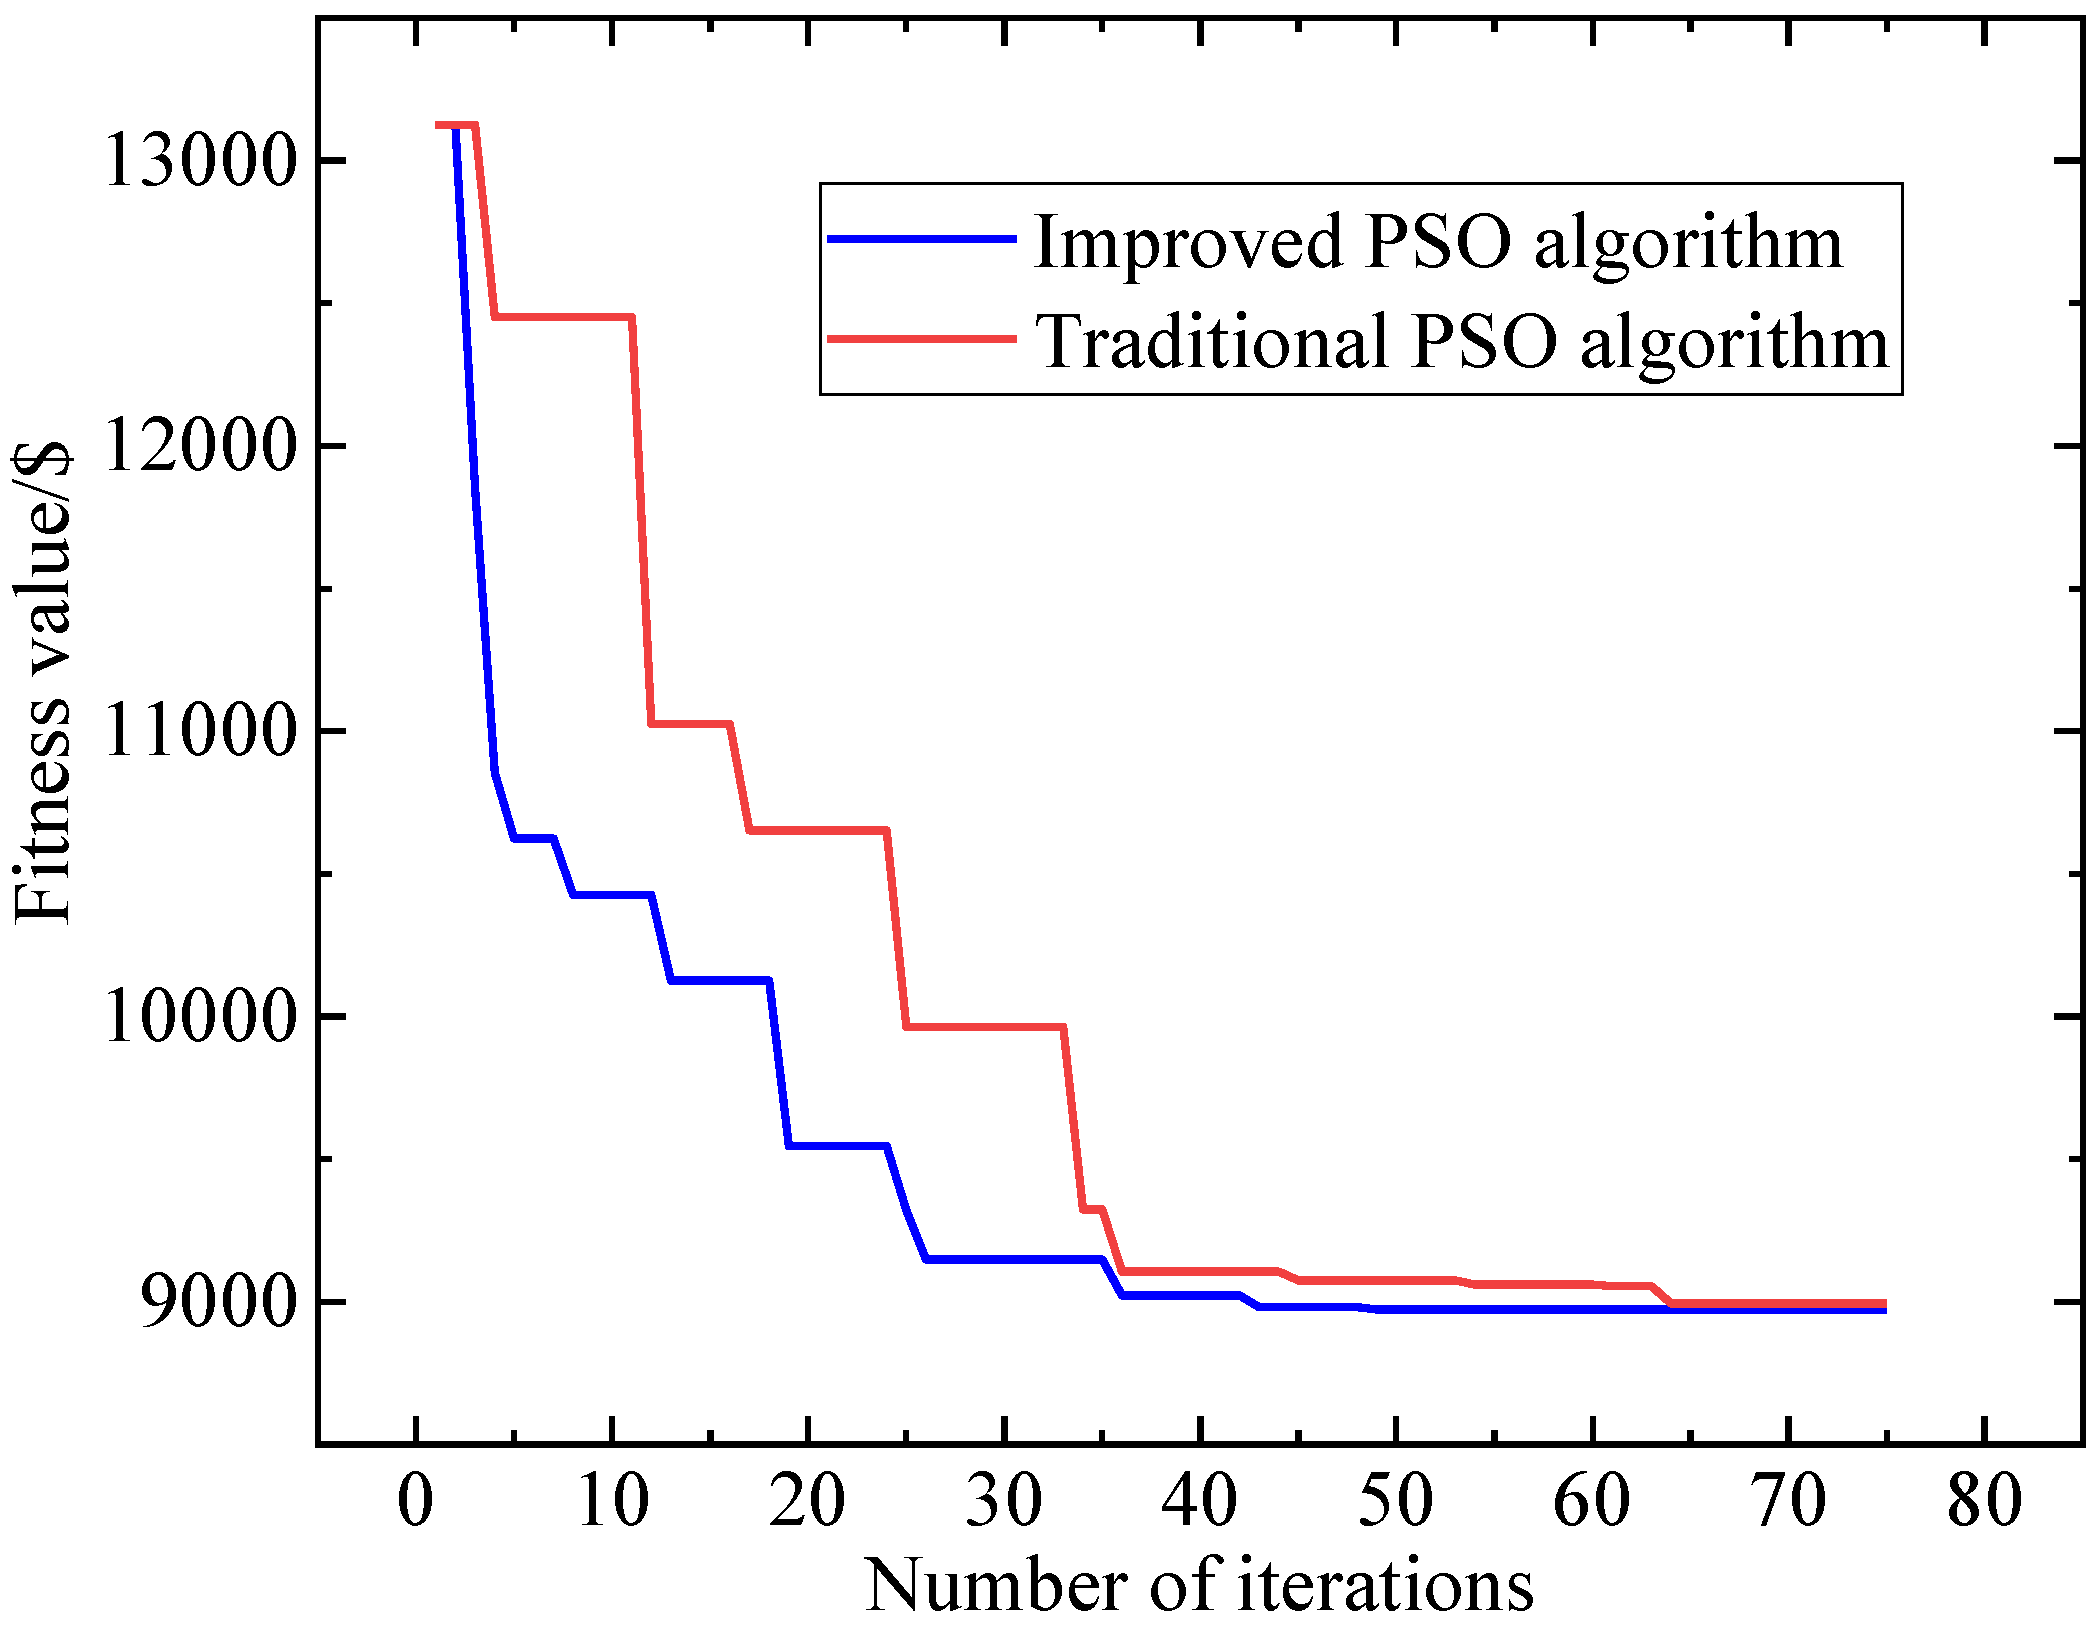
Figure 16 illustrates the convergence curves of the proposed IPSO algorithm and the traditional PSO algorithm.
Compared with the traditional algorithm, the proposed algorithm has improved its convergence efficiency by 18.3%. An adaptive inertia weight based on particle fitness is introduced to dynamically adjust the local search capability according to the current particle’s performance. When the particle fitness is poor, the inertia weight is increased to enhance global exploration; when the fitness is good, the weight is decreased to finely exploit local optimal solutions. Under scenario-based uncertainty conditions, the adaptive weight enables the algorithm to quickly escape from local optima while avoiding premature convergence to suboptimal solutions, thereby improving its ability to handle non-convex constraints. Classical PSO typically employs a fixed or linearly decreasing inertia weight, which cannot be dynamically adjusted according to the real-time characteristics of the problem. Simple parameter adjustments lack responsiveness to uncertainty, whereas the IPSO achieves closed-loop control through fitness feedback, making it more suitable for complex scenarios. On the other hand, this paper proposes asynchronous learning factors that emphasize individual exploration in the early iterations and reinforce group collaboration in the later iterations. In multi-constraint scheduling problems, the asynchronous learning factors enable the algorithm to independently explore the boundaries of each constraint first and then integrate feasible solutions through group collaboration, avoiding the search direction confusion caused by synchronous updates in classical PSO. It should be noted that this paper transforms the uncertainty of renewable energy output into discrete probability scenarios and optimizes the objective function through scenario weighting, enabling decisions to consider both economic efficiency and stability simultaneously. In non-convex scheduling problems, scenario analysis enables IPSO to generate robust solutions for different output scenarios, avoiding solution invalidation in classical PSO due to neglecting uncertainty.
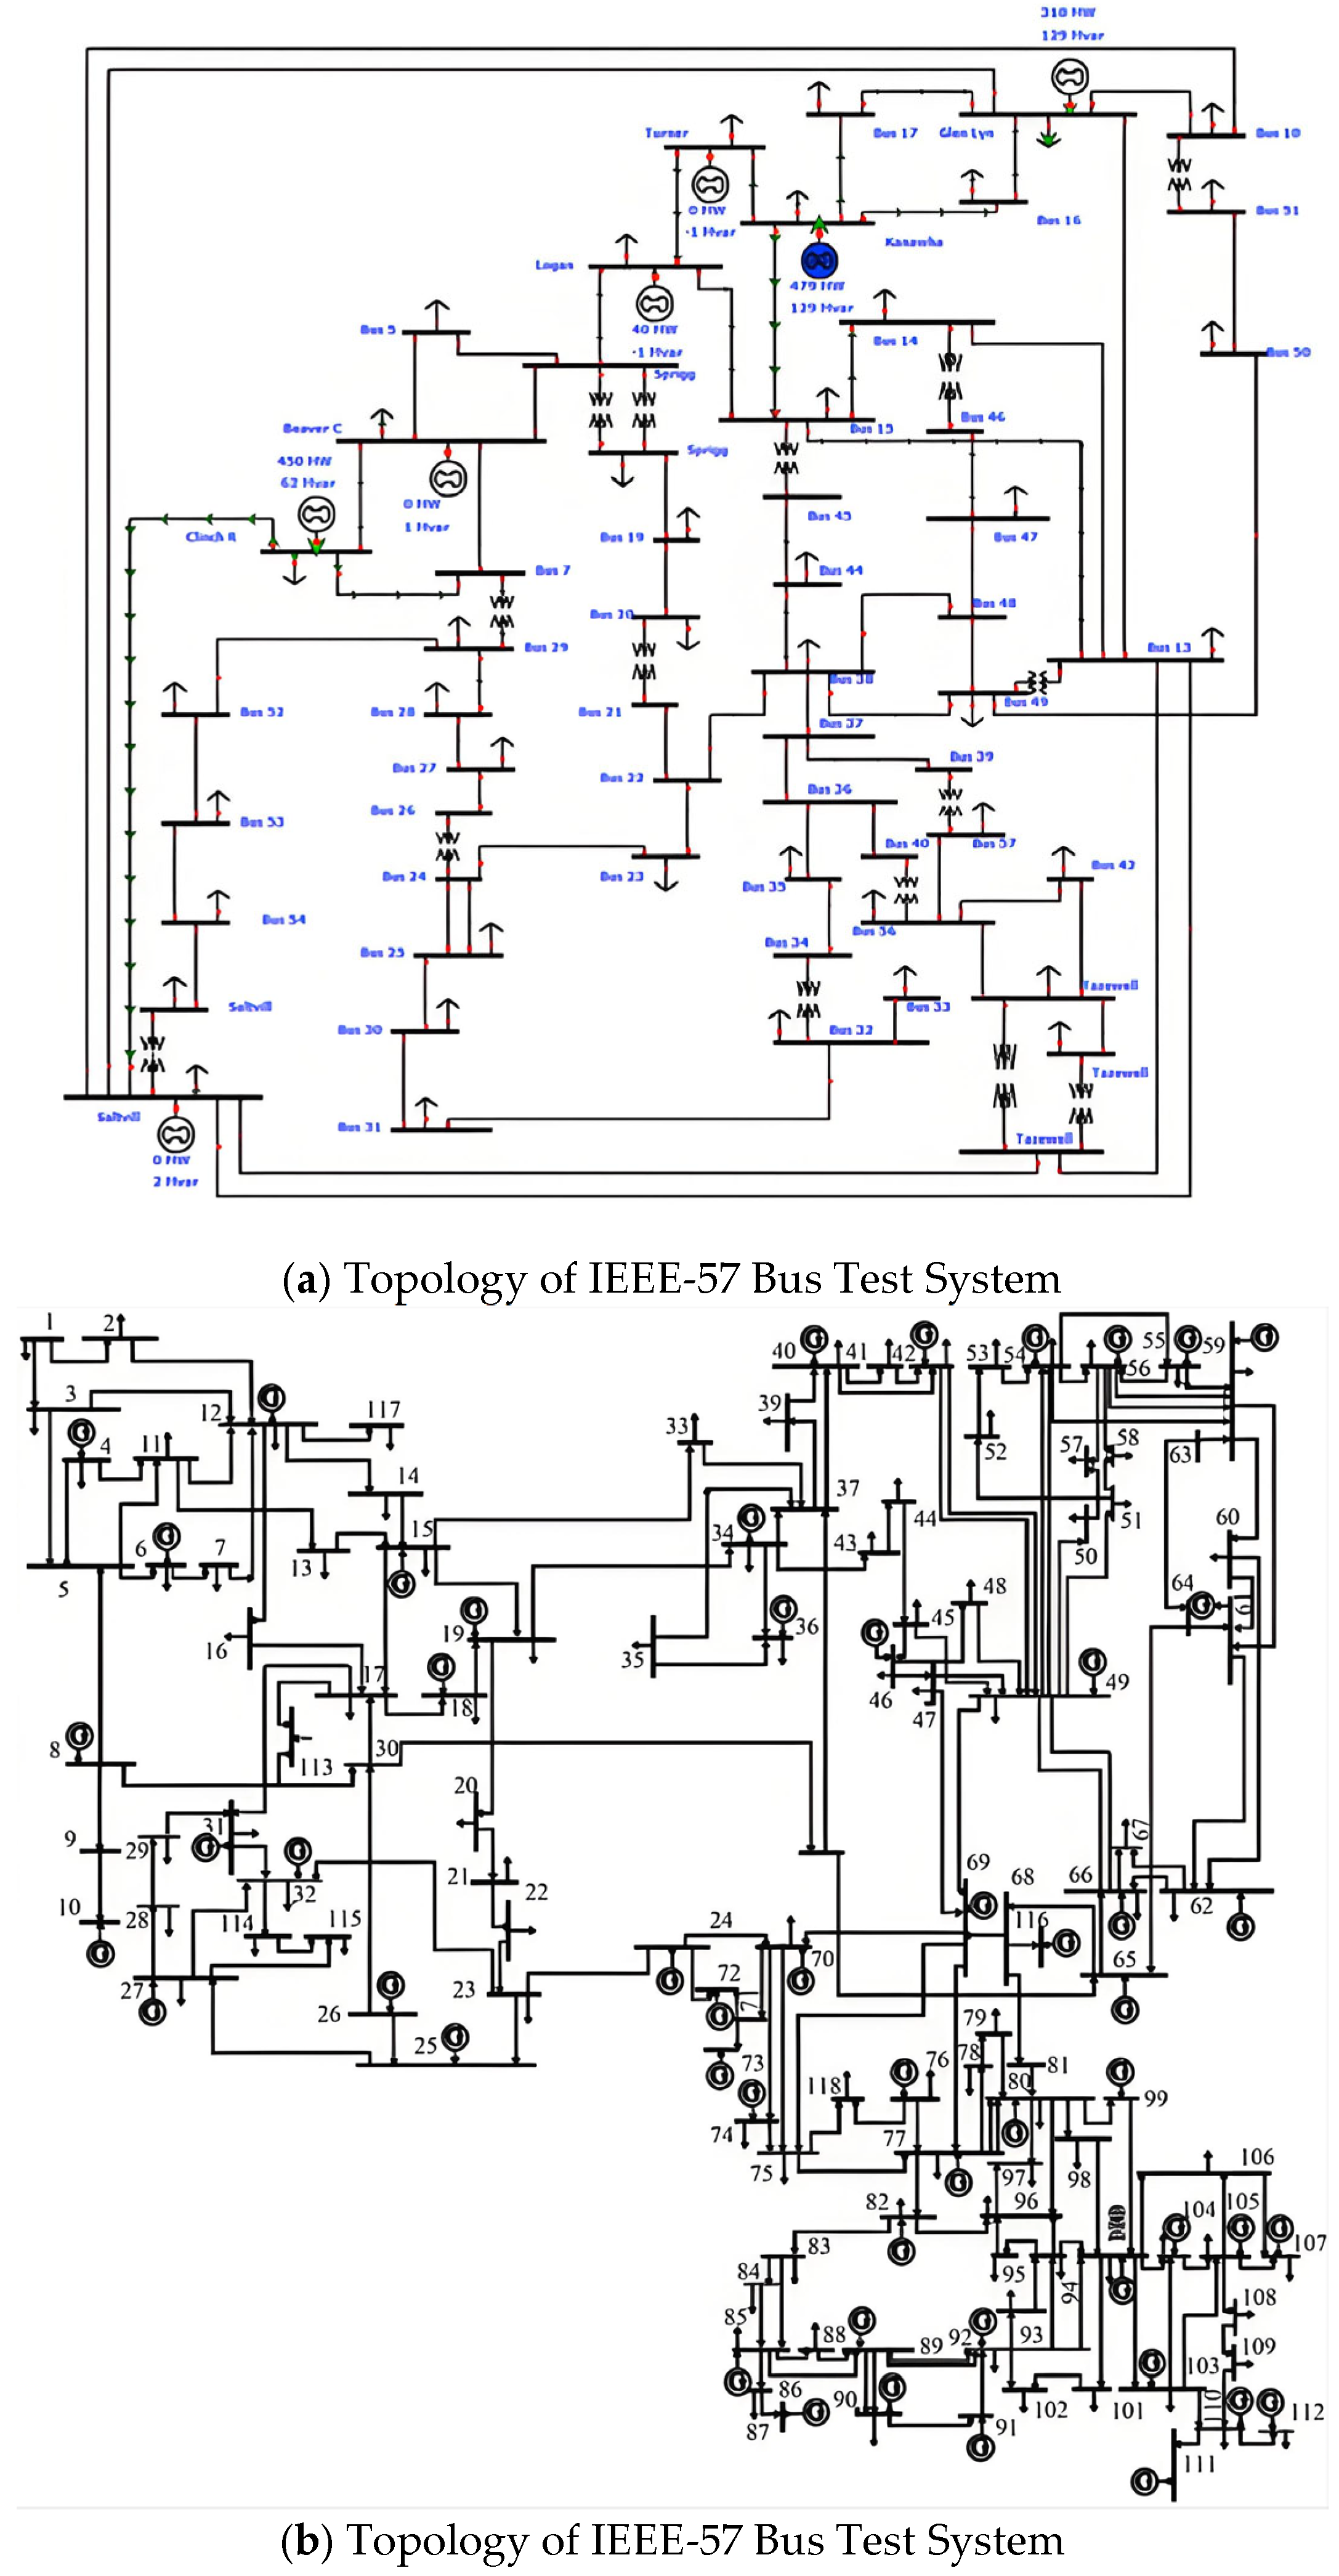
To further verify the scalability of the proposed method, two larger-scale test systems, namely the IEEE-57 and IEEE 118 bus systems, were adopted. The structures of these two bus test systems are shown in
Figure 17 below.
Table 2 respectively presents the computational time, new energy accommodation rate, and other key indicators of the two test systems under different typical scenarios.
Observing the above table, it can be found that there is a positive correlation between the computational time, the scale of the test system, and the number of typical scenarios. As the scale of the test system increases, more constraints need to be considered, particularly the increase in the number of power flow constraints and nodal power balance constraints, leading to longer computational times. With an increase in the number of scenarios, the performance of various indicators shows a trend of improvement, primarily because a greater number of considered scenarios allows for a more precise depiction of the uncertainty in renewable energy output. Compared to small-scale test systems, large-scale test systems exhibit lower renewable energy accommodation rates and greater voltage fluctuations due to the limited dispatchable and responsive flexible resources within the region, which restricts the adjustment margin. In practical implementation of the scenario analysis-based VPP optimized economic dispatch strategy, challenges include communication infrastructure demands, as it relies on real-time data exchange for renewable energy forecasting, load response, and storage monitoring, imposing high requirements on bandwidth, latency, and reliability. Additionally, customer participation is hindered by insufficient peak-valley price differentials to cover adjustment costs, users’ lack of understanding for optimizing plans, concerns over data leakage and privacy due to sensitive information collection, as well as potential security threats from remote control of devices.
7. Conclusions
This paper addresses the challenges of output uncertainty and optimal decision-making faced by virtual power plants when aggregating massive distributed energy resources to participate in electricity market transactions. An optimal economic dispatch strategy for virtual power plants is proposed, which accounts for flexible resource responses under uncertain scenarios. By integrating theoretical modeling with algorithmic optimization, this study achieves the following objectives: First, a combined prediction model based on variational mode decomposition and an improved bidirectional multi-gated long short-term memory network is constructed, effectively enhancing the prediction accuracy of renewable energy output and providing reliable front-end data support for dispatch decisions. Second, a price–demand elasticity matrix is innovatively introduced to characterize the spatiotemporal coupling effect of time-of-use electricity prices on load. Building on this, a demand response model based on optimal time-of-use electricity pricing is established, strengthening the virtual power plant’s ability to guide load and mitigate fluctuations through price signals. Simultaneously, an improved Particle Swarm Optimization algorithm is employed to achieve efficient and precise solutions for the model, ensuring both convergence speed and solution accuracy under complex constraints. Finally, simulation validation is conducted using an improved IEEE-33 bus test system. The results demonstrate that the proposed strategy can effectively coordinate distributed power sources, energy storage, and demand-side resources under uncertain environments, achieving synergistic optimization between the operational economy of the virtual power plant and system stability. This study not only provides a feasible dispatch method for virtual power plants participating in the electricity market but also offers theoretical references and technical pathways for the flexible operation and market-oriented management of high-penetration renewable energy systems.