1. Introduction
Social demand to reduce the manufacturing sector’s impact on climate change has been increasing. In the Long-Term Strategy as a Growth Strategy Based on the Paris Agreement [
1], G7 countries have pledged specific greenhouse gas (GHG) emission reductions by 2030 and committed to achieving net-zero emissions by 2050, with each nation working toward a carbon-neutral society. Japan has set a target of a 46% reduction in emissions from 2013 levels by 2030. Following the 2008 Lehman Shock, GHG emissions in the United States (US) and Europe declined, but this trend has slowed in recent years. Among Annex I countries, Japan is the fourth-largest GHG emitter, following the US, European countries, and Russia; however, Japan’s emissions have remained static or decreased only slightly in recent years, potentially jeopardizing its ability to meet its stated reduction target [
2].
In 2019, total GHG emissions from Annex I countries amounted to 24.8 GtCO
2 equivalents (CO
2-eq), reflecting a 2.76% decrease from the previous year and a 5.91% reduction compared to 2013, the designated base year. China is excluded from this analysis because it is not classified as an Annex I country and its data are unavailable; however, according to other statistics [
3], China’s GHG emissions in 2019 totaled 9.8 GtCO
2-eq, bringing global GHG emissions to 34.6 GtCO
2-eq.
Analyzing Japan’s CO
2 emissions in 2022—after accounting for the distribution of electricity and heat (i.e., the allocation of CO
2 emissions from electricity and heat generation to consumers)—indicated that the industrial sector (including factories) contributed 34% of total emissions. At the same time, the transportation sector accounted for 18.5% [
4], while the automotive industry accounts for 85.8% of total CO
2 emissions. Moreover, the transition from conventional internal combustion engine vehicles to electric vehicles (EVs) has been progressing rapidly; however, considerable debate remains over whether EVs are environmentally sustainable throughout their life cycles. While EVs clearly reduce CO
2 emissions during operation, concerns have been raised about the significant emissions generated during manufacturing, particularly from battery production. Such emissions may undermine EVs’ overall environmental benefits, given their relatively short operational lifespan [
5].
To address this issue, Lander et al. (2021) [
6] found that extending battery lifespan significantly reduced the carbon footprint and life cycle costs (LCCs) of EVs. Furthermore, they demonstrated that an efficient battery thermal management system that effectively dissipates heat is crucial for prolonging battery life. They investigated battery-cooling strategies by comparing several cooling methods, including air cooling, tab cooling, surface cooling, and immersion cooling. Their analysis evaluated the cooling performance of each approach and assessed its impact on battery lifetime, life-cycle carbon footprint, and cost. The results indicated that enhanced cooling performance contributes to a prolonged battery lifetime and reduced carbon emissions; however, the study primarily focused on comparisons among different cooling methods, and the specific geometries of the battery cooling heat sinks were not disclosed. Consequently, detailed comparisons of heat sinks with different geometries within the same cooling method remain underexplored, underscoring the need for further investigation.
Recent advances in battery research have significantly expanded the understanding of degradation mechanisms and improved battery control strategies. For example, enhanced electrochemical models have been used to investigate the degradation behavior of lithium-ion batteries under periodic excitation, capturing dominant mechanisms at high-frequency operating conditions (Wang et al., (2024) [
7]).
At the same time, state-of-health (SOH) estimation methods have rapidly evolved, including integrated frameworks that utilize incremental-capacity features and advanced feature-extraction techniques to enhance diagnostic accuracy (Hamed et al., (2023) [
8]; Zhang et al., (2025) [
9]). Furthermore, optimal fast-charging strategies that mitigate lithium plating have been proposed using electrochemical-thermal models and real-time control algorithms (Wang et al., (2023) [
10]; Ma et al., (2025) [
11]).
These prior studies primarily focus on electrochemical degradation modeling and control. In contrast, this study complements the literature by evaluating how improvements in thermal-management component design—enabled by additive manufacturing (AM)—translate into extended battery lifetime and product-level life-cycle impacts.
In recent years, AM, also known as 3D printing, has gained significant attention in the manufacturing industry. AM enables the production of complex geometries that are difficult or impossible to create through conventional manufacturing (CM); thus, AM is expected to enhance component functionality. Numerous studies have compared the environmental impacts of CM and AM. For example, Huan et al. (2016) investigated energy consumption reductions resulting from the adoption of AM in the cradle-to-gate process using five types of aircraft components as case studies [
12]. Their study estimated the net changes in life-cycle primary energy consumption and GHG emissions associated with AM adoption for lightweight metallic aircraft components through 2050. Their results indicated that fleet-wide life cycle primary energy savings could reach approximately 70–173 million GJ per year by 2050, with cumulative savings of about 1.2–2.8 billion GJ. The corresponding cumulative GHG emission reductions were estimated at approximately 92.1–215.0 million metric tons of CO
2-eq; however, the analysis did not account for the manufacturing costs of AM components. Although AM components can contribute substantially to GHG emission reductions, aircraft manufacturers are unlikely to adopt them if their production costs are prohibitively high. From this perspective, both environmental and cost impacts must be evaluated when assessing the practicality of AM adoption.
Similarly, Tang et al. (2015) directly compared the cradle-to-gate environmental impacts of CM and AM, focusing on bracket components used in aircraft engines manufactured by GE [
13]. Their study selected machining as the CM process and adopted binder jetting technology (BJT) as the AM process. The CM component was manufactured from titanium; in contrast, the AM component was produced using bronze-infiltrated stainless steel, reflecting the technical limitations of BJT at the time of the study. BJT is a metal AM process with the potential for higher productivity and lower manufacturing cost than laser-based powder bed fusion (PBF) processes. Their results indicated that the environmental impact of BJT was lower than that of CM, primarily because the component’s complex geometry led to higher energy consumption during machining-based manufacturing. However, this comparison raises concerns because it was conducted using materials that would not be practically employed in real-world applications due to the technical limitations of BJTs at the time. Furthermore, they did not address the LCCs, including both manufacturing and operational costs.
Likewise, Ingarao et al. (2018) compared the cradle-to-gate environmental impacts of CM and AM using components with simple geometries; the material considered was aluminum [
14]. Machining and forging were selected as CM processes, while selective laser melting (SLM)—one of the most widely used PBF processes for metal AM—was adopted as the AM process. The results showed that the environmental impact was somewhat dependent on component geometry; however, the manufacturing-related environmental burden of AM was approximately one order of magnitude higher than that of CM. This disparity was primarily attributed to the high electricity consumption of the SLM process, which relies on high-power lasers. Their study also presented an estimation of the environmental break-even point when the component was assumed to be used in automobiles and aircraft. For aircraft applications, the break-even point was reached within a realistic period, approximately one year for short-haul aircraft and 0.2 years for long-haul aircraft. In contrast, for automobiles, an average driving distance of 2.2 × 10
6 km was required; however, their study did not consider life cycle cost factors, including component manufacturing costs or the economic value of GHG emission reductions during the use phase.
As discussed, the existing literature comparing CM and AM remains undecided on which approach is more environmentally benign. The reported results collectively indicate that the environmental performance of AM relative to CM strongly depends on component geometry, manufacturing process selection, and material choice; however, most existing studies focus primarily on the cradle-to-gate phase. At the same time, life cycle cost aspects—including both manufacturing and operational costs—are often not addressed, underscoring the need for further investigation.
Few studies have compared CM and AM in terms of their environmental impact across the entire life cycle, including the use phase. For example, comprehensive studies by Ford et al. (2016) [
15] and Chen et al. (2020) [
16] have explored this issue, recognizing certain advantages of AM—particularly its environmental benefits in specific applications. Moreover, they also highlighted that AM’s role in sustainability remains unclear and that it may pose risks of unintended negative environmental impacts. This consideration is crucial, as it suggests that AM’s environmental impacts and benefits depend on the entire life cycle of AM products.
The authors have previously published a study comparing the LCCs of CM and AM, including their environmental impacts [
17]. They evaluated the LCC advantages of CM and AM for manufacturing EV inverter heat sinks and aircraft components; the BJT method was selected as the AM approach due to its relatively high productivity and cost-reduction potential. The results showed that AM was more cost-effective for aircraft components, whereas CM exhibited lower LCC for EV inverter heat sinks. In mass-production applications such as EVs, components manufactured using CM generally cost less to produce. BJTs can produce high-functionality parts; however, the reduction in operating costs from enhanced functionality was insufficient to offset the increased manufacturing costs.
Nevertheless, the study demonstrated that redesigning EV inverter heat sinks into complex AM-specific geometries improved cooling efficiency, reduced component size and weight, and enhanced vehicle energy efficiency. While these improvements reduced LCC and GHG emissions, the overall impact remained limited because the weight reduction was relatively small compared to the vehicle’s total mass.
Batteries represent a major contributor to EV manufacturing emissions. Lander et al. (2021) [
6] showed that improving battery cooling efficiency significantly reduces both the carbon footprint and LCC; however, the extent to which AM-enabled battery cooling components, combined with enhanced cooling performance, influence battery lifetime, GHG emissions, and LCC remains unclear.
Given these considerations, this study aims to quantify the improvement in cooling performance enabled by BJT-based manufacturing of EV battery cooling heat sinks. Furthermore, it evaluates the resulting extension of battery lifetime. We also assess the associated impacts on GHG emissions and life cycle costs, thereby clarifying the environmental and economic significance of transitioning from CM to AM for EV battery thermal management components.
2. Materials and Methods
2.1. Experimental Setup and Simulation Conditions
In the first step, the battery heat sink’s cooling efficiency was measured.
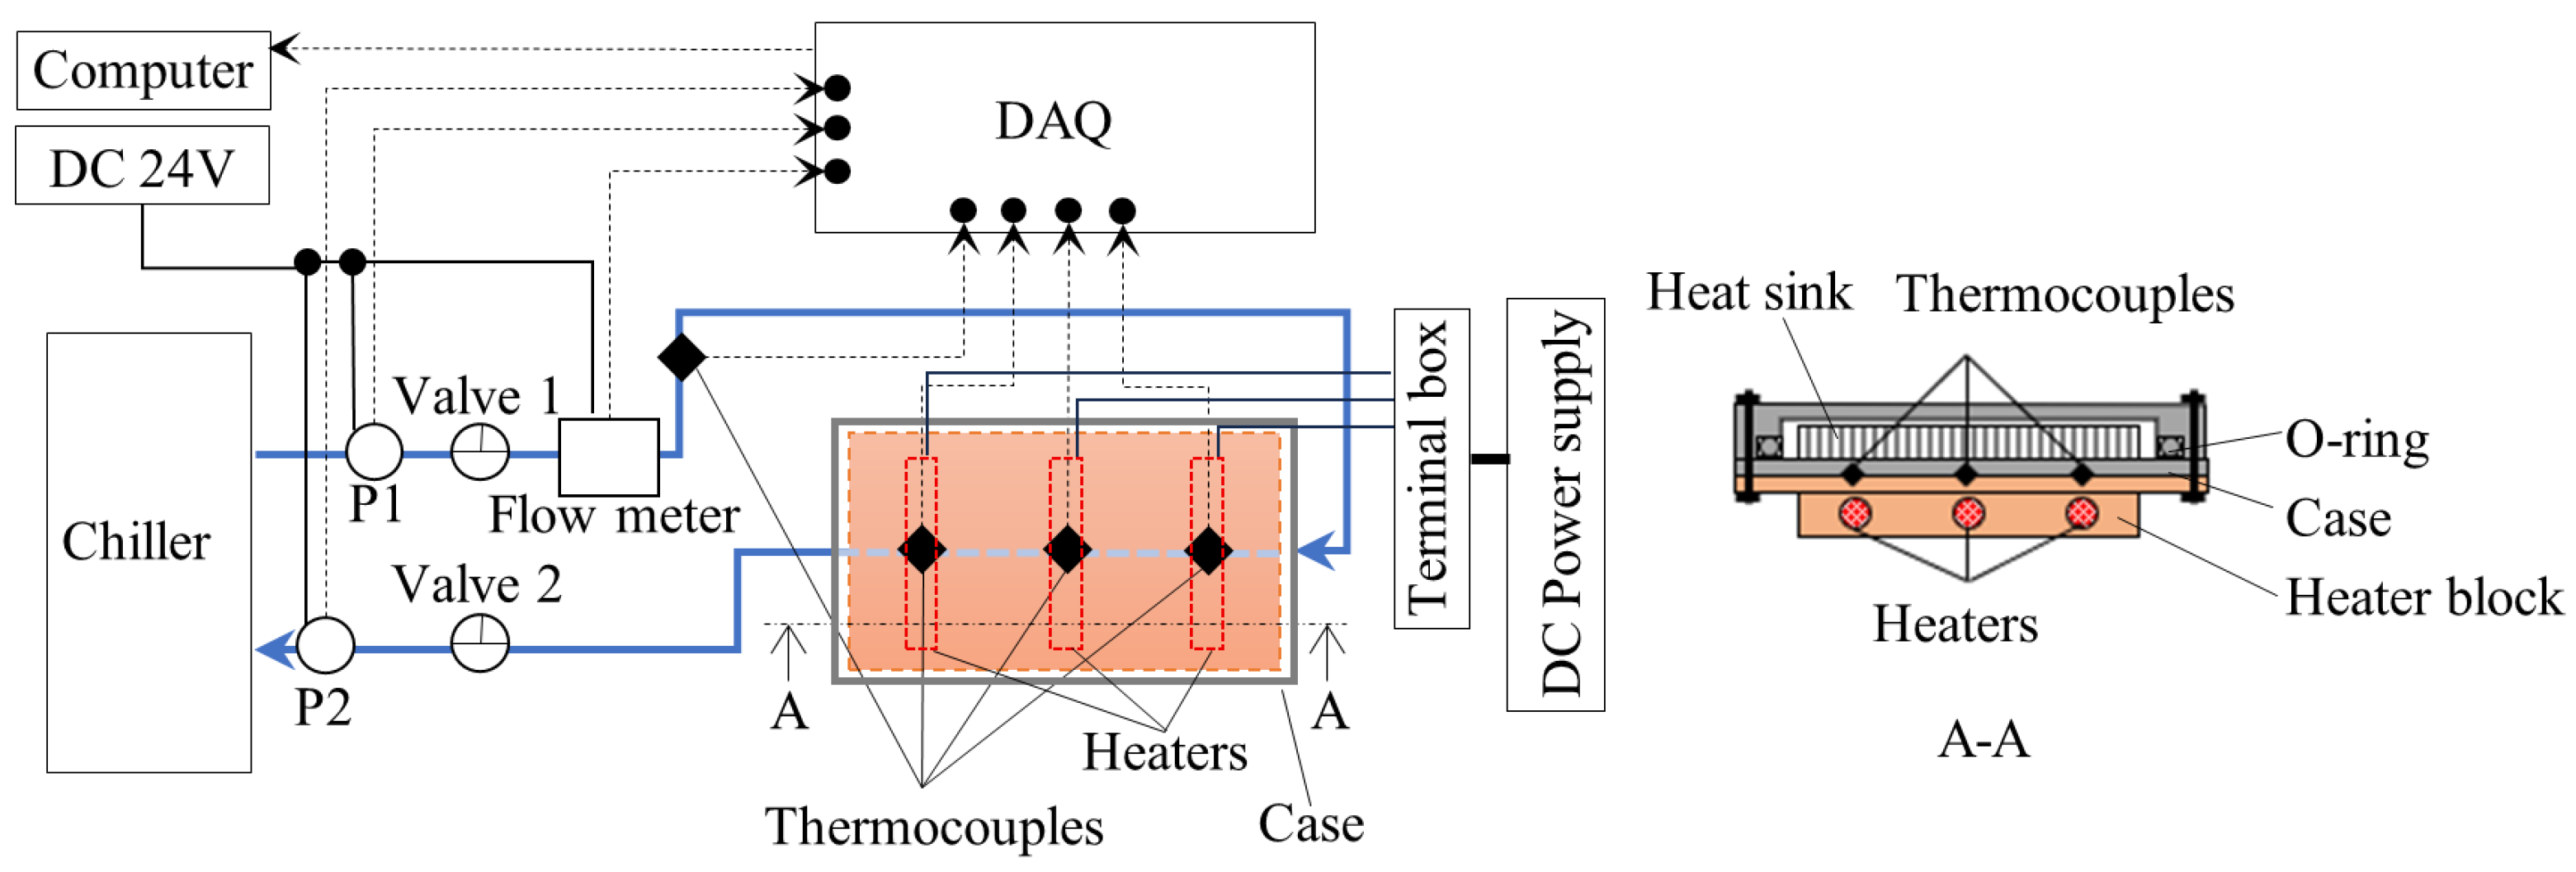
Figure 1 and
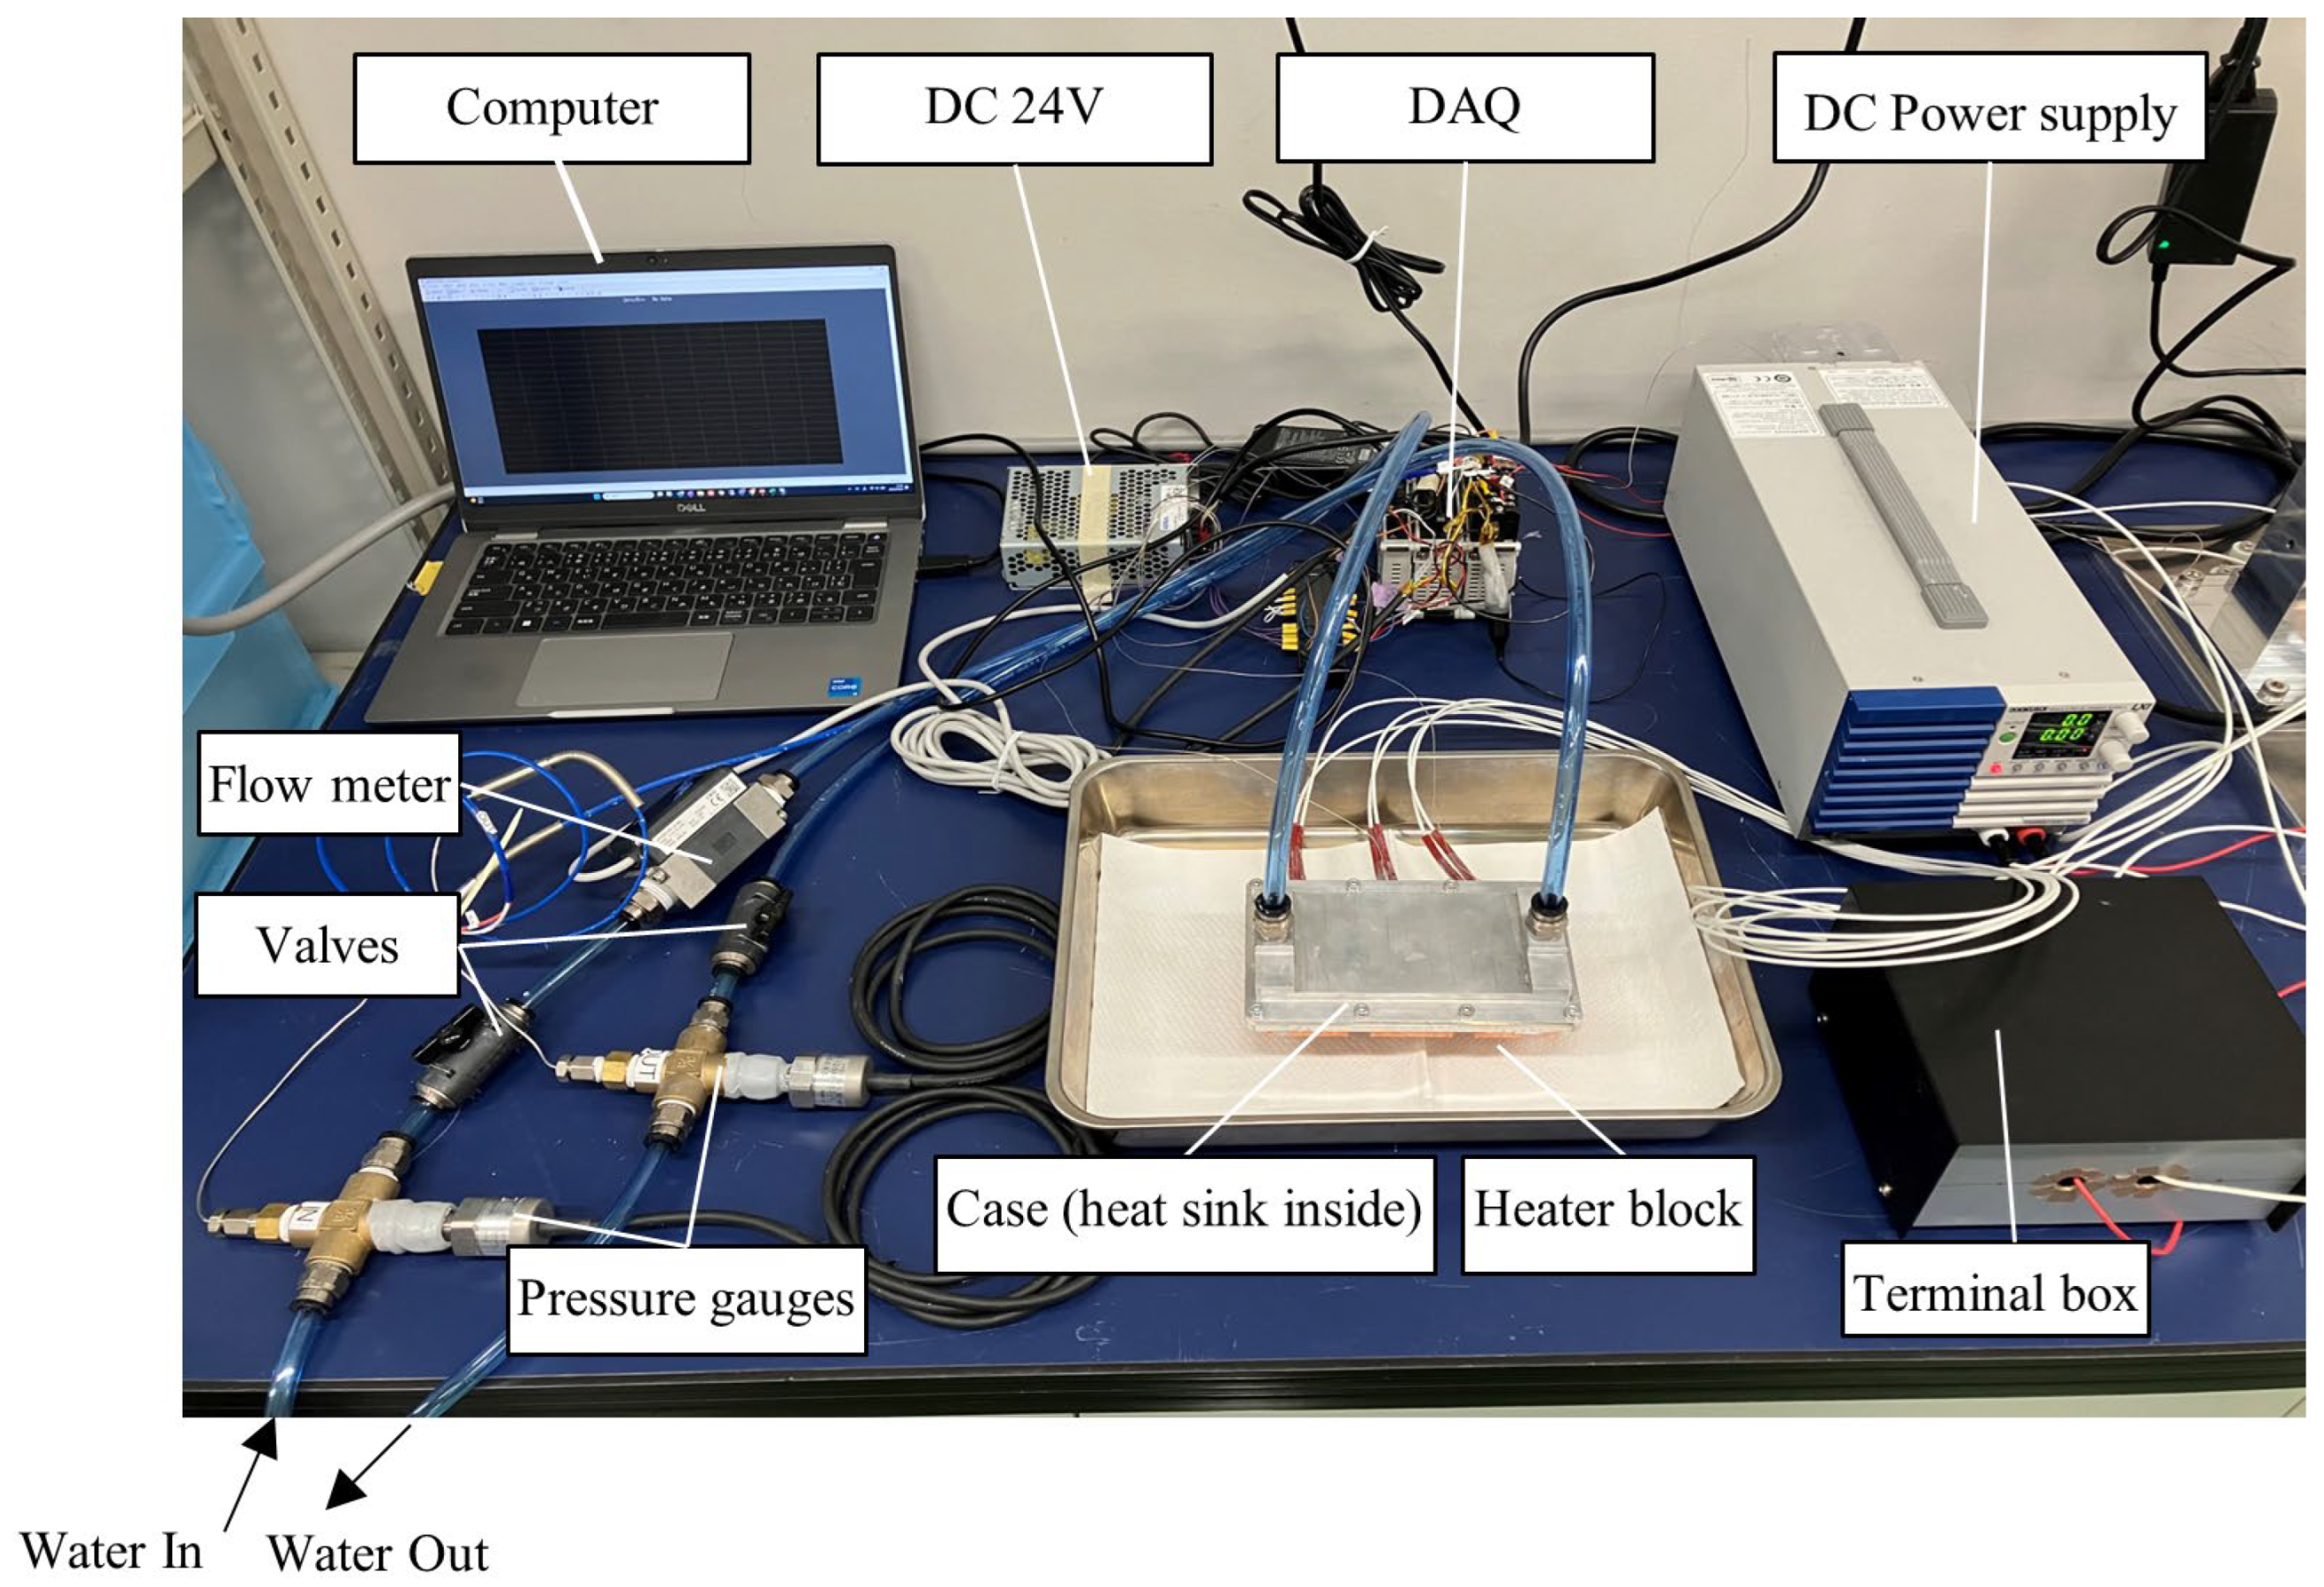
Figure 2 illustrate the schematic experimental setup and overall view of the experimental apparatus, respectively. The system was designed to evaluate the cooling efficiency of heat sinks manufactured using both CM and AM.
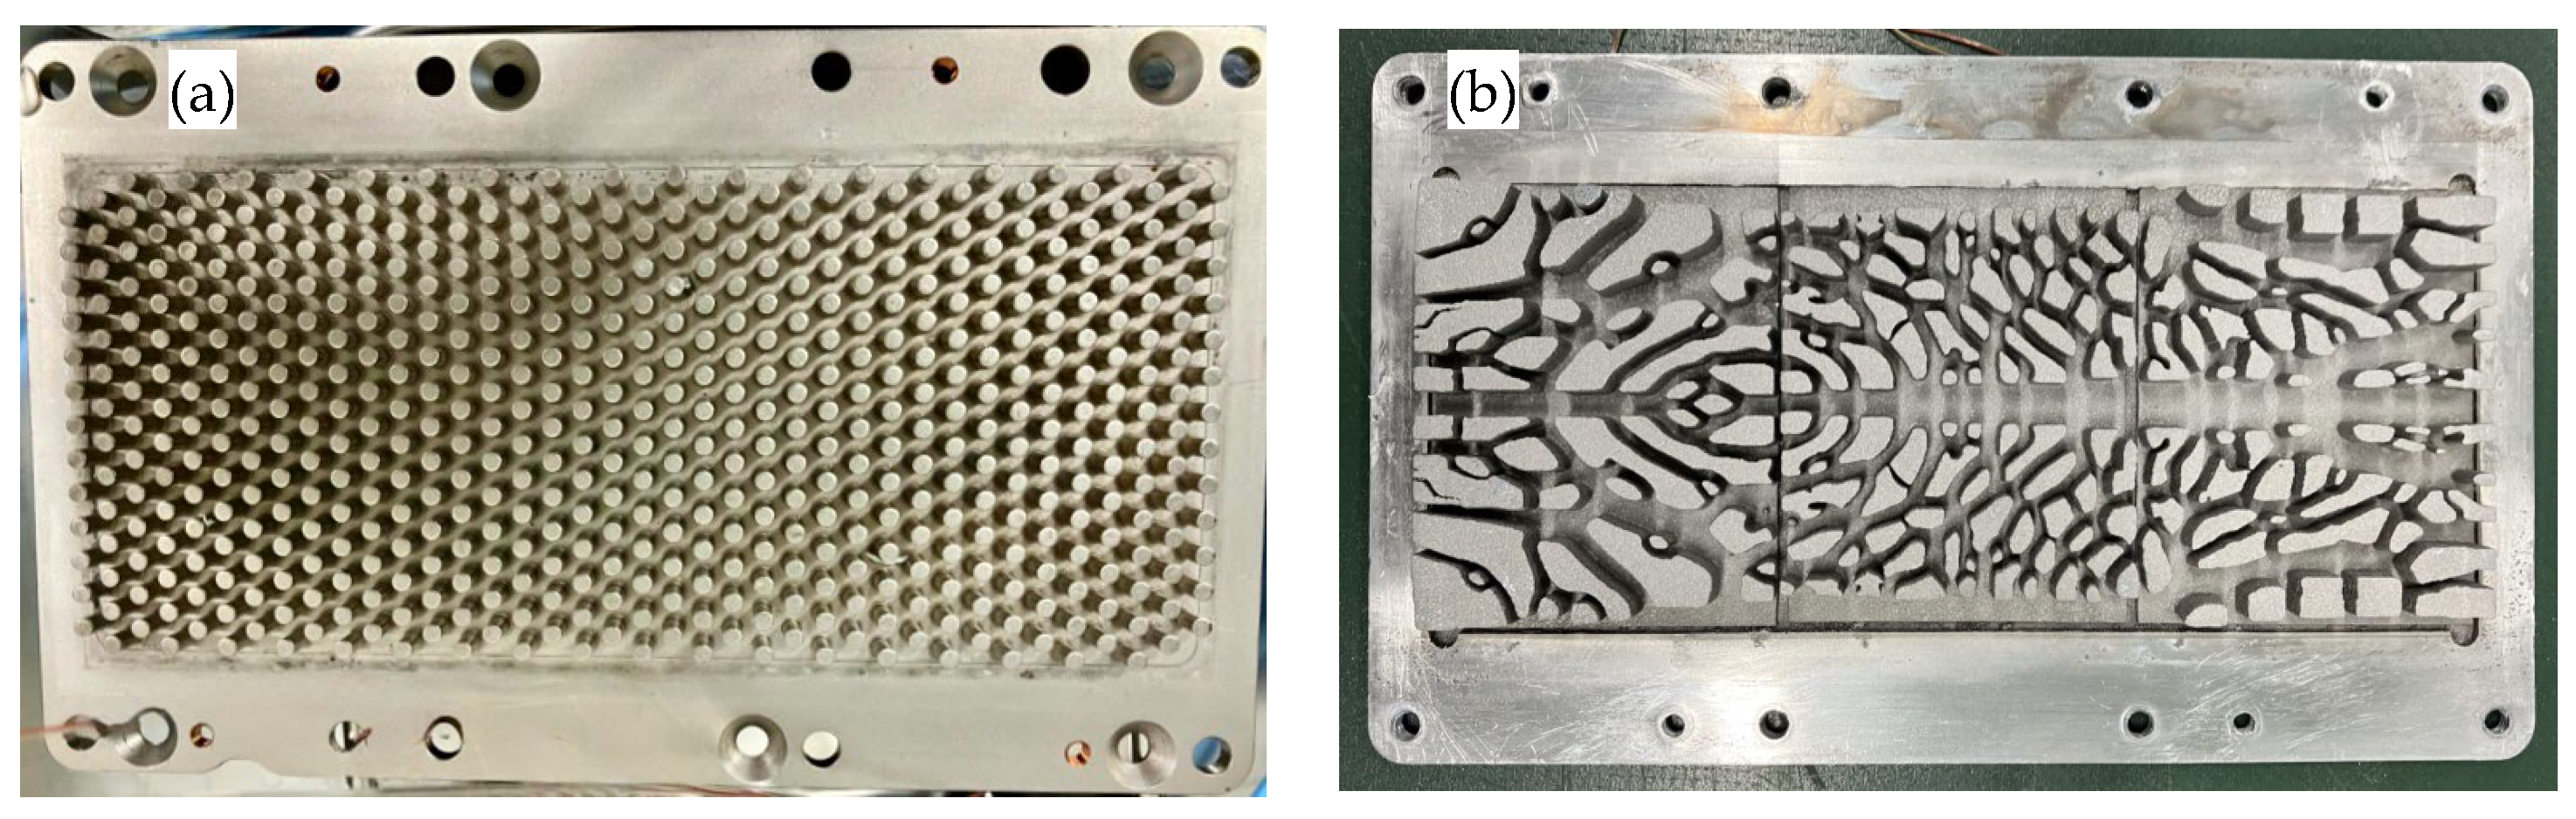
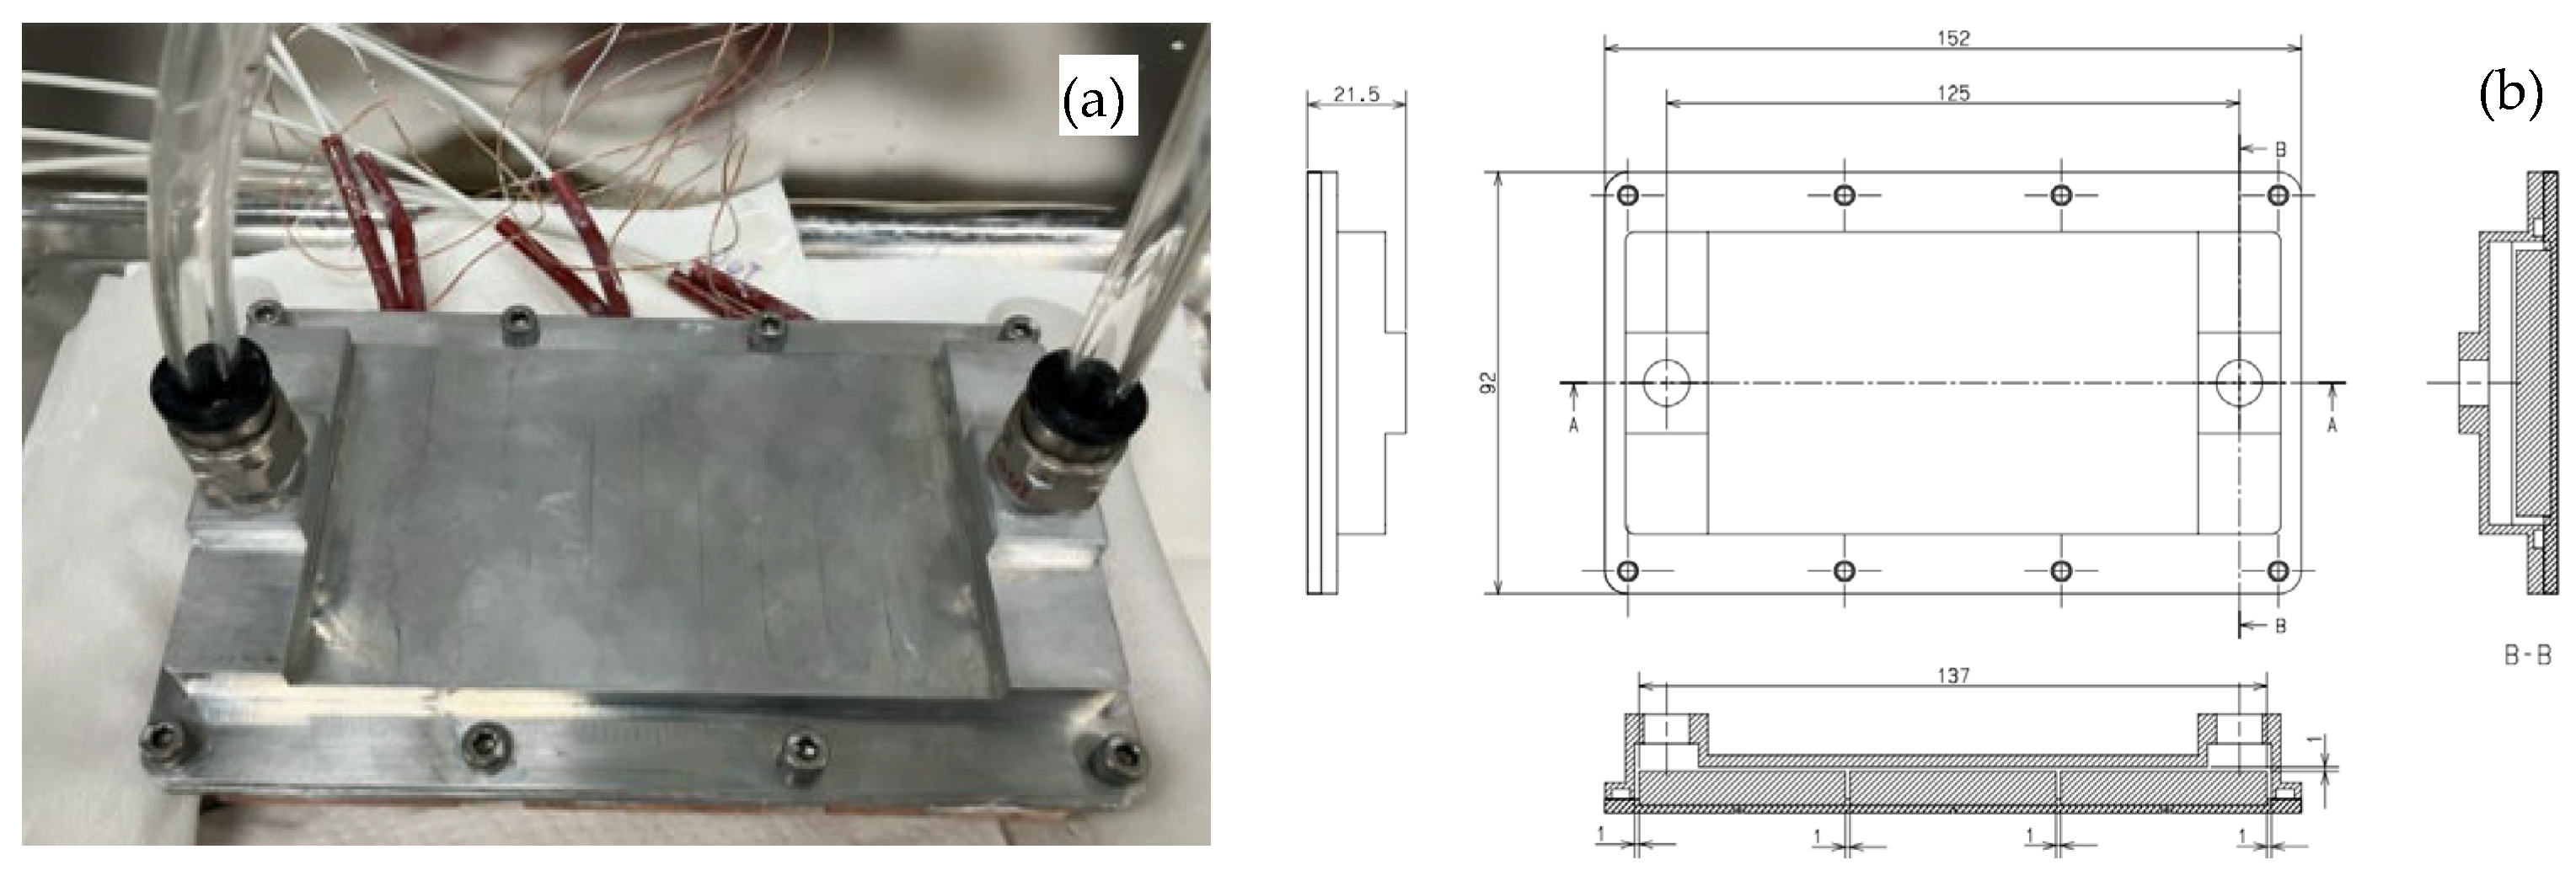
To minimize measurement errors and ensure a stable heat source, electric heaters (KIKUSUI, Kanagawa, Japan, PWR801MH) were used instead of batteries. Three 200 W heaters, totaling 600 W, were employed. The system was preheated for ten minutes before data collection, which lasted an additional ten minutes. Heat sinks were manufactured using both CM and AM, with their external appearances shown in
Figure 3a and
Figure 3b respectively. Based on interviews with multiple heat sink manufacturers, we found that weight reduction is generally considered a critical requirement for the automotive sector to improve energy efficiency and reduce fuel consumption. Furthermore, amid the recent rise in copper prices and the risk of resource depletion, manufacturers have shown strong interest in shifting heat sink materials from copper to aluminum. Naturally, aluminum has lower thermal conductivity than copper; thus, achieving comparable thermal performance requires substantial design modifications to improve heat transfer efficiency. Therefore, this study was conducted to utilize geometries that could only be realized through AM, enabling aluminum heat sinks to achieve heat-dissipation performance comparable to that of copper heat sinks.
The CM-manufactured heat sink featured a pin-fin design (hereafter referred to as the pin-fin heat sink), a common industry standard; it was assumed to be produced via cold forging, the de facto manufacturing method for this shape. The pin-fin heat sink was made of copper and weighed 0.48 kg, with a fin diameter of 1.5 mm, fin pitch of 3 mm, fin height of 8 mm, and a minimum channel width of 1.25 mm.
The AM-manufactured heat sink was designed using a topology-optimization method with the recently applied ToffeeX software to maximize thermal and fluid performance (hereafter referred to as the topology-optimized heat sink). This heat sink was made of aluminum and weighed 0.16 kg, with a minimum wall thickness of 0.4 mm, a fin height of 8 mm, a minimum primary flow path width of 1.15 mm, and a minimum secondary flow path width of 0.4 mm.
In the topology optimization process, the widths of the primary flow paths were set to at least 1 mm to prevent clogging by foreign particles; this threshold is commonly adopted in automotive cooling-water circulation systems. As a result, the minimum primary flow path width in the final design was 1.15 mm; however, due to the nature of topology optimization, extremely thin secondary flow paths can be generated locally when the algorithm prioritizes the formation of the main flow paths for optimal performance. These secondary features do not significantly contribute to cooling performance, and, in this design, they were as narrow as 0.4 mm. Because these structures are not functionally important and arise merely as byproducts of the optimization process, their potential clogging would have only a negligible impact on both cooling performance and pressure drop. Moreover, previous experimental studies have demonstrated that BJT-manufactured aluminum components provide mechanical strength comparable to that of conventionally cast parts [
18], confirming the structural feasibility of the topology-optimized heat sink.
The topology optimization conditions are described below.
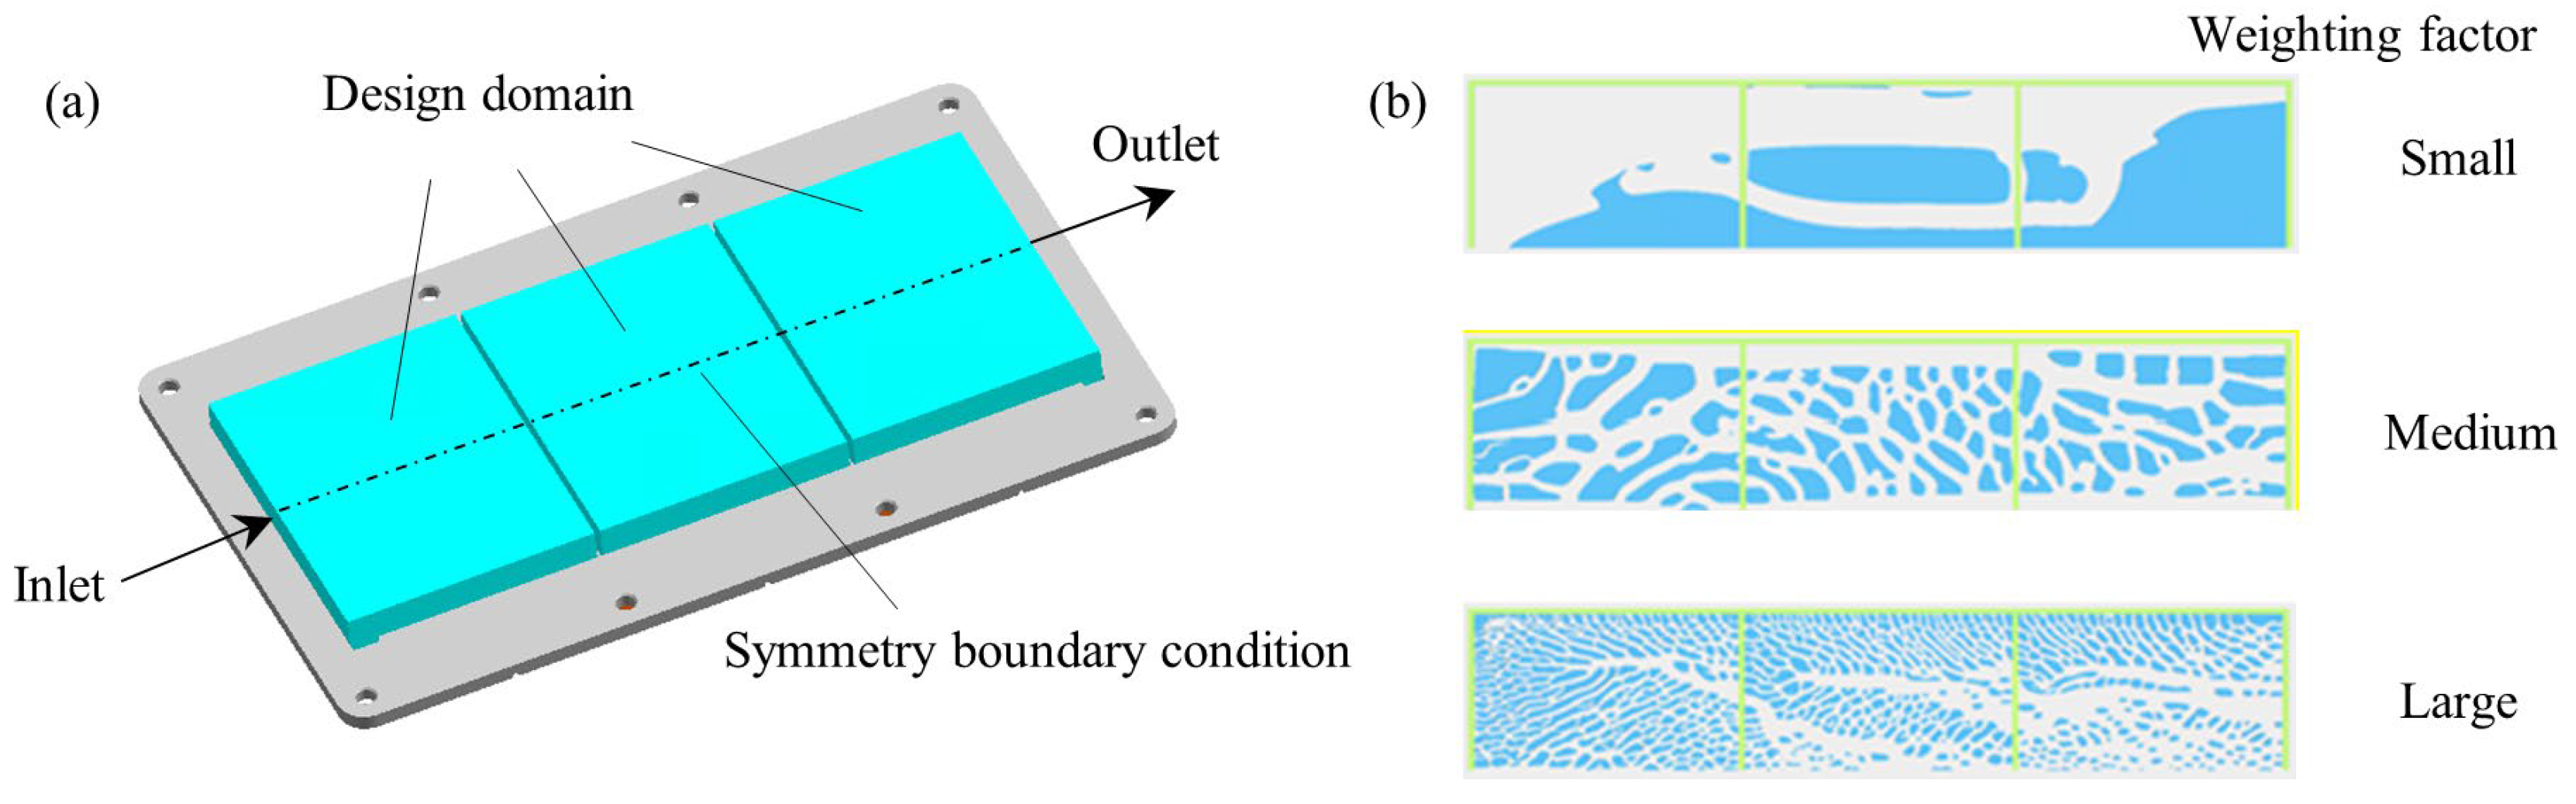
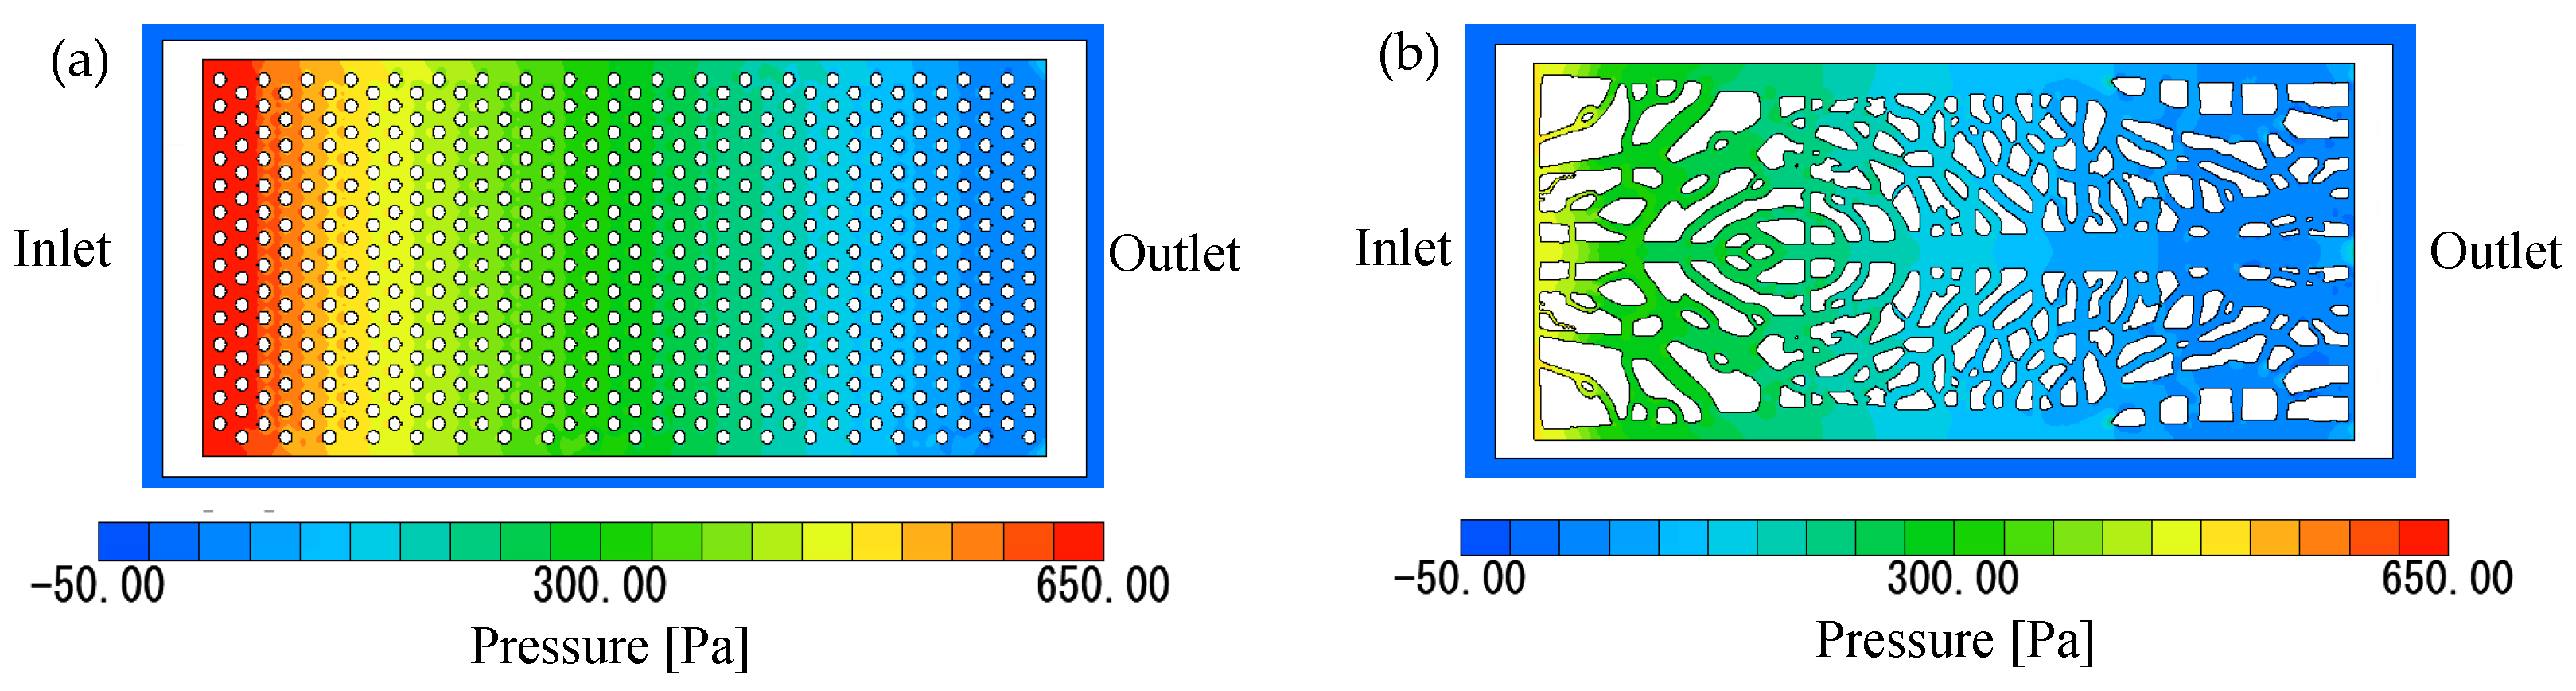
Figure 4a shows the design domain and the locations of the applied boundary conditions. To ensure manufacturability by BJT, the design domain was divided into three sections along the flow direction, and 1 mm clearances were introduced between each section. Because the height of the fins in this study was relatively low (8 mm) and variations in the thickness direction had only a minor influence on the flow field, the topology optimization was conducted using a two-dimensional model to reduce computational cost. Therefore, a uniform cross-section was assumed in the thickness direction. A straight flow was assumed, with the inlet and outlet boundaries placed on surfaces perpendicular to the main flow direction. The inlet boundary was set to a constant velocity of 0.2 m/s and a coolant temperature of 300 K, whereas the outlet boundary was set to a reference pressure of 0 Pa. A symmetry boundary condition was applied at the mid-plane, and all other outer boundaries were treated as adiabatic.
A multi-objective optimization problem was formulated to simultaneously minimize (i) the maximum temperature and (ii) the pressure drop between the inlet and outlet. The weighting factor between the two objectives was treated as a design parameter and varied over a wide range from 1 to 1 × 10
10. Increasing this weighting factor made the temperature-minimization term more dominant, resulting in more complex internal flow path structures, as shown in
Figure 4b.
The solid volume fraction, which is typically used to impose a mass or weight constraint, was employed in this study as a design parameter to control the geometric complexity of the optimized structure. This value was varied between 40% and 60%.
Several candidate geometries obtained from the topology optimization were evaluated using thermo-fluid simulations under the conditions described later in this paper. Their thermal performance and pressure drop were assessed, and the manufacturability by BJT—including minimum wall thickness and residual powder-removal capability—was also taken into account. Based on these considerations, the final geometry was selected.
The BJT method was selected for manufacturing the topology-optimized heat sink because of the productivity and cost limitations of PBF, the dominant AM process, which is not suitable for the mass production of EV components.
City water was used as the cooling agent; its temperature was maintained at approximately 293 K (20 °C) using a chiller (EYELA, Tokyo, Japan, CA-1115A).
The cooling water entered the heat sink through the inlet and was discharged through the outlet. Pressure gauges P1 and P2 (HTVC-100KP-02-V; accuracy within ±0.5% full scale, corresponding to ±1 kPa for a full scale of 200 kPa) were installed at each water channel to measure the pressure difference between the inlet and outlet. Additionally, a flow meter was placed downstream of the outlet to measure the flow rate, which was systematically varied at 2, 3, 4, and 4.8 L/min.
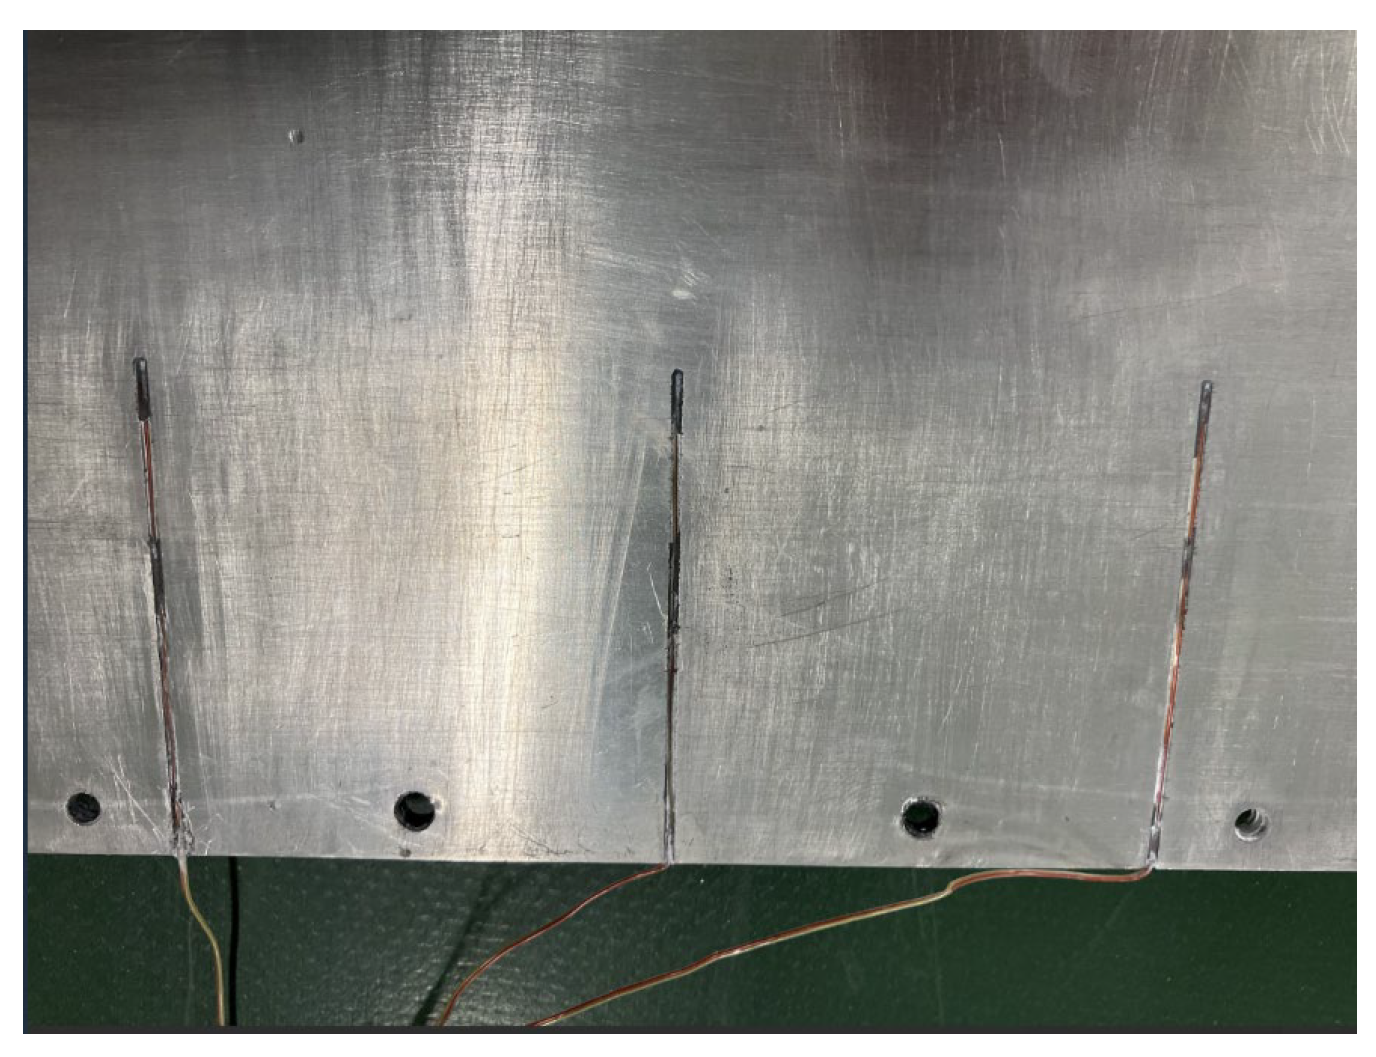
Figure 5 shows that thin grooves were machined on the posterior surface of each heat sink, and three thermocouples (TI-SP-K, accuracy: ±2.5 °C, corresponding to Class 2 of JIS C 1602) were installed in these grooves. The thermocouples were affixed to measure the temperature gradient between the heaters and the heat sink.
Voltage data from the pressure gauge, flow meter, and thermocouples were recorded using a data logger (KYENCE, Osaka, Japan, NR-5000, NR-TH08) at a sampling frequency of 500 milliseconds; these data were stored on a computer for subsequent analysis.
Figure 6 illustrates the configuration of the experimental apparatus. The unit comprising the heaters, heat sink, and thermocouples was equipped with water inlets and outlets.
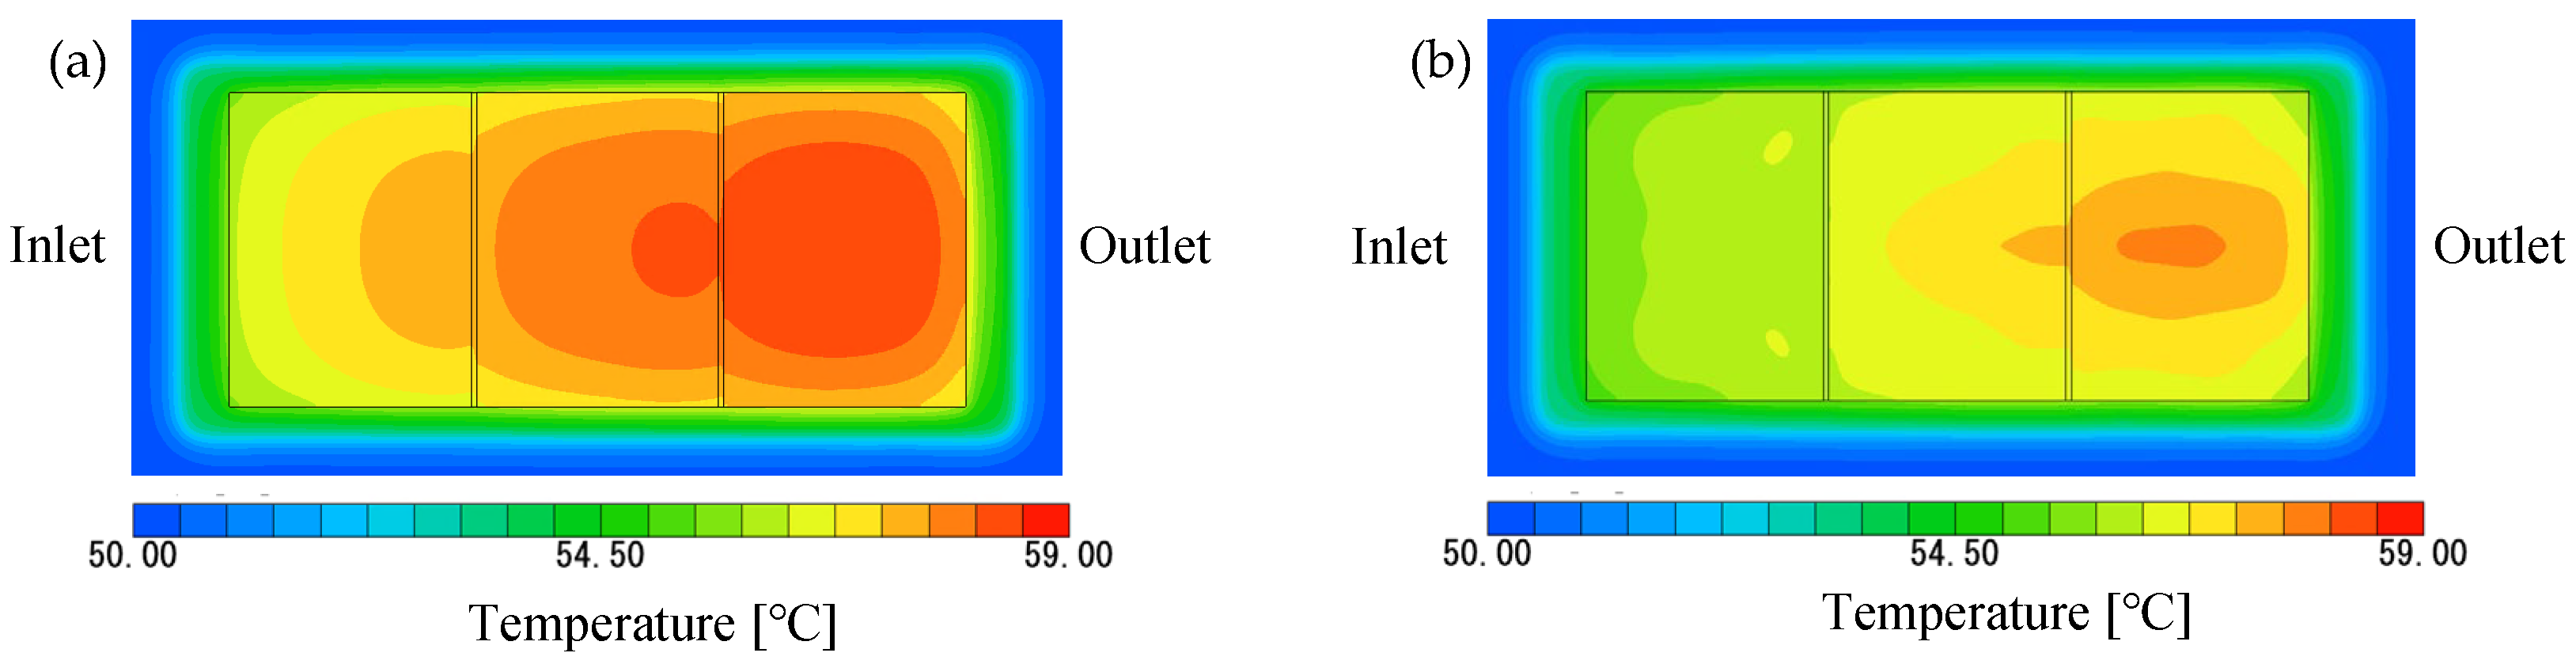
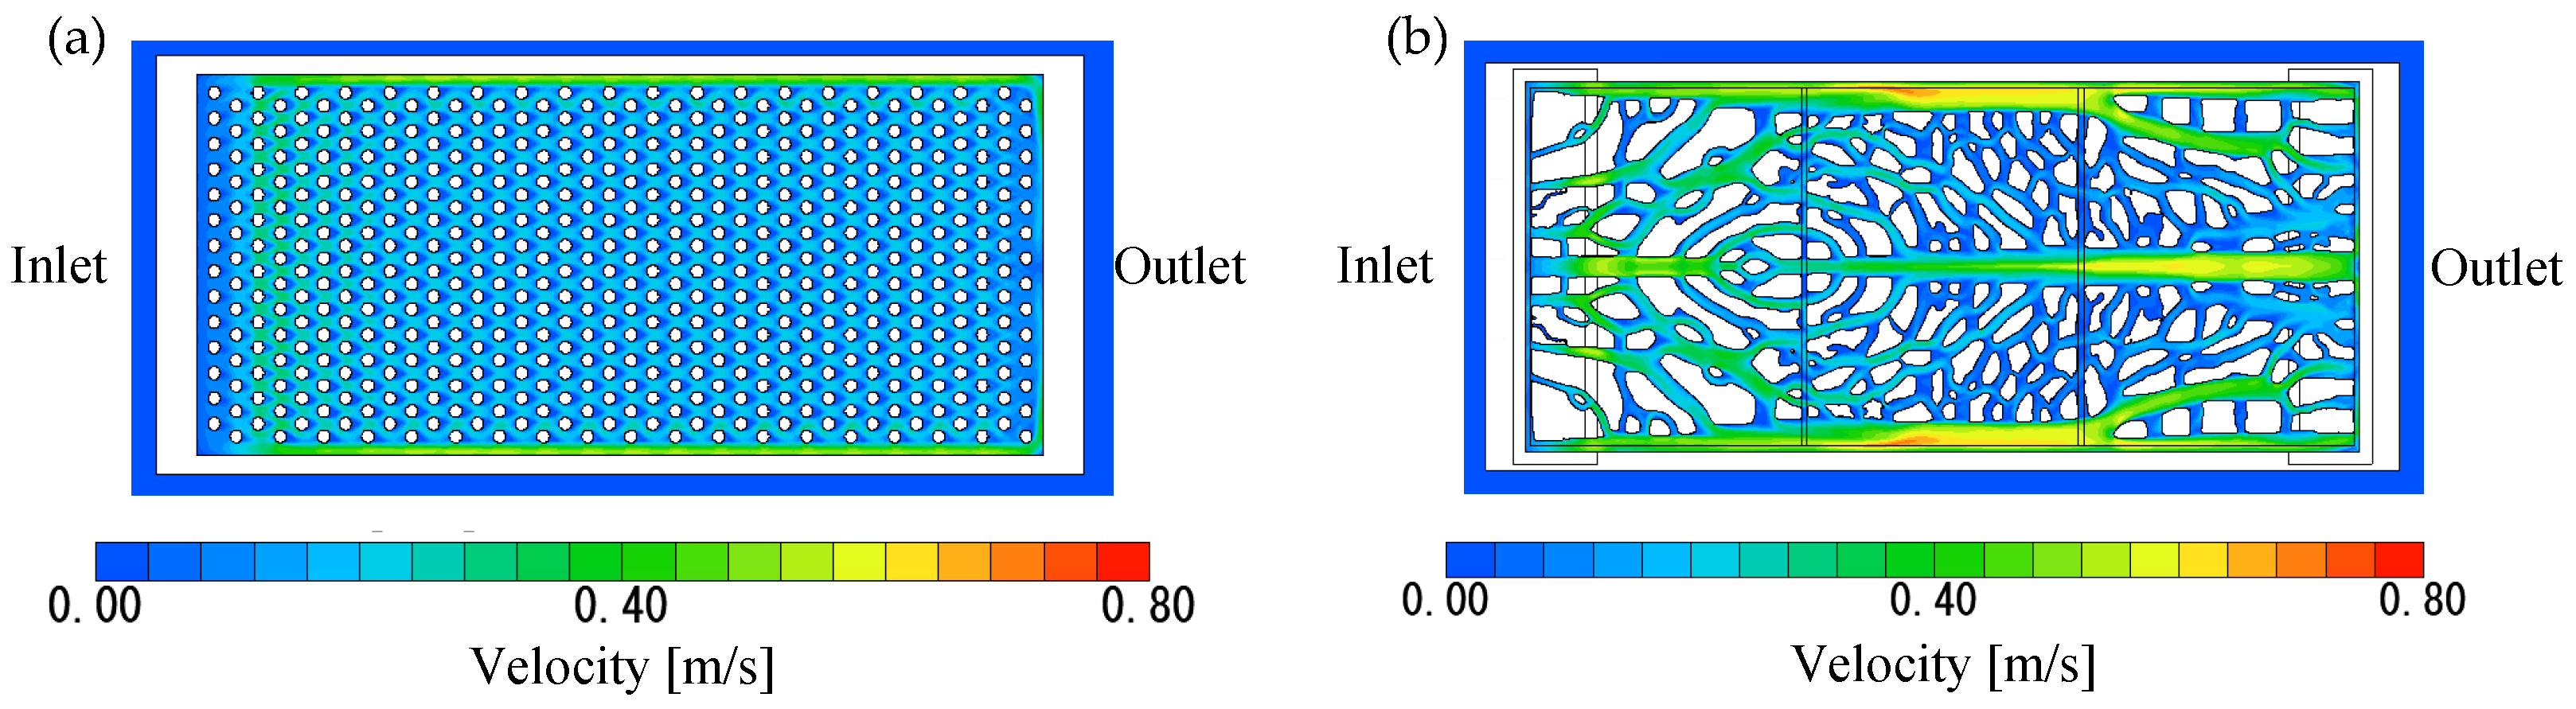
Simulations were performed using the same setup as the experiment to analyze the fluid dynamics within the cooling plate, which is difficult to observe experimentally.
These simulations were conducted with Hexagon’s STREAM Ver. 2023.2. The detailed simulation conditions are described below.
- -
Mesh type: Unstructured grid.
- -
Mesh size: 0.3 mm around the cooling channel; 1.0–2.0 mm in the solid region and outer region.
- -
Steady state analysis considering coolant flow and heat conduction within the solid.
- -
Turbulence model: k–ε model.
- -
Thermal conductivity of copper was set to 398 W/m·K based on the material library implemented in the simulation solver.
The thermal conductivity of aluminum was set to 180 W/m·K, which was measured using the laser flash method.
- -
A uniform flow rate condition was applied at the fluid inlet.
- -
The inlet flow rate was set to 4–20 L/min and the inlet temperature was 323 K (50 °C).
- -
The fluid outlet was assigned a reference pressure of 0 Pa.
- -
No-slip conditions were applied to all channel walls.
- -
A uniform volumetric heat-generation condition was applied to the heat source, with a total heat generation of 600 W.
2.2. Calculation of Cell Cooling Coefficient (CCC)
In the second step, the cell cooling coefficient (CCC) was obtained from the heat sink’s cooling efficiency measured in the experiment. In recent years, CCC has been introduced as a key indicator of battery cooling performance [
19,
20]. In this experiment, the CCC was also calculated using Equation (1).
where
is the maximum cell temperature,
is the refrigerant inlet temperature, Δ
T is the temperature difference between
and the cell temperature, and
is the heat generation rate per cell.
Following the definition introduced by Hales et al. [
19,
20] and Lander et al. [
6], the CCC is defined as
where
represents the amount of heat generated per cell within the battery. This experiment used electric heaters instead of an actual battery; thus,
was assumed to be 1.664 W. This value is consistent with that reported by Lander et al. (2021) [
6], who defined
for a 20 Ah pouch cell (A123, Watertown, MA, USA, Nanophosphate
® AMP20M1HD-A) based on BatPac simulations and set to 1.664 W. The electric heaters used in this experiment were operated at a power of 600 W (3 A × 200 V), corresponding to the heat generation of approximately 360 cells, each generating 1.664 W. This value is consistent with the total number of cells (360 pouch-type cells) considered in the battery pack analyzed by Lander et al. (2021) [
6]. Although the number of battery cells in commercial EVs varies by model, it is generally several hundred. For example, the early Nissan Leaf contains 192 cells [
21], the BMW iX3 uses 188 cells [
22], and the Volvo Polestar 2 incorporates 324 cells [
23]. In contrast, Tesla’s Model 3 contains approximately 21,700 cells [
24], as it employs cylindrical cells rather than pouch-type cells. Considering these variations, the assumption of 360 pouch-type cells was deemed reasonable for the purpose of this study.
Based on these assumptions, we calculated the CCC at the three measurement points using the temperature difference (ΔT) between each thermocouple reading and the cooling water inlet temperature. To enable a direct comparison with the results reported by Lander et al. (2021) [
6], the CCC values were normalized by the battery pack’s surface area as described below.
Per Han et al. (2018) [
25], the inlet temperature difference
is formulated as follows:
where
represents the total heat generated by the entire battery pack, which is distinct from the heat generated by an individual battery cell (
). Here,
denotes the coolant’s mass flow rate,
is the specific heat capacity,
is the convective heat transfer coefficient, and
is the heat transfer surface area. This equation is derived from the principle of energy conservation, which states that the heat generated by the battery pack is transferred to the coolant.
The heat transfer surface area must be normalized to enable a meaningful comparison between the study by Lander et al. (2021) [
6] and this current study. The solid–fluid thermal resistance considered in this study is inversely proportional to the contact surface area between the solid and the coolant fluid; however, since Lander et al. (2021) [
6] did not explicitly report the heat transfer area, we estimated it as described below.
According to Lander et al. (2021) [
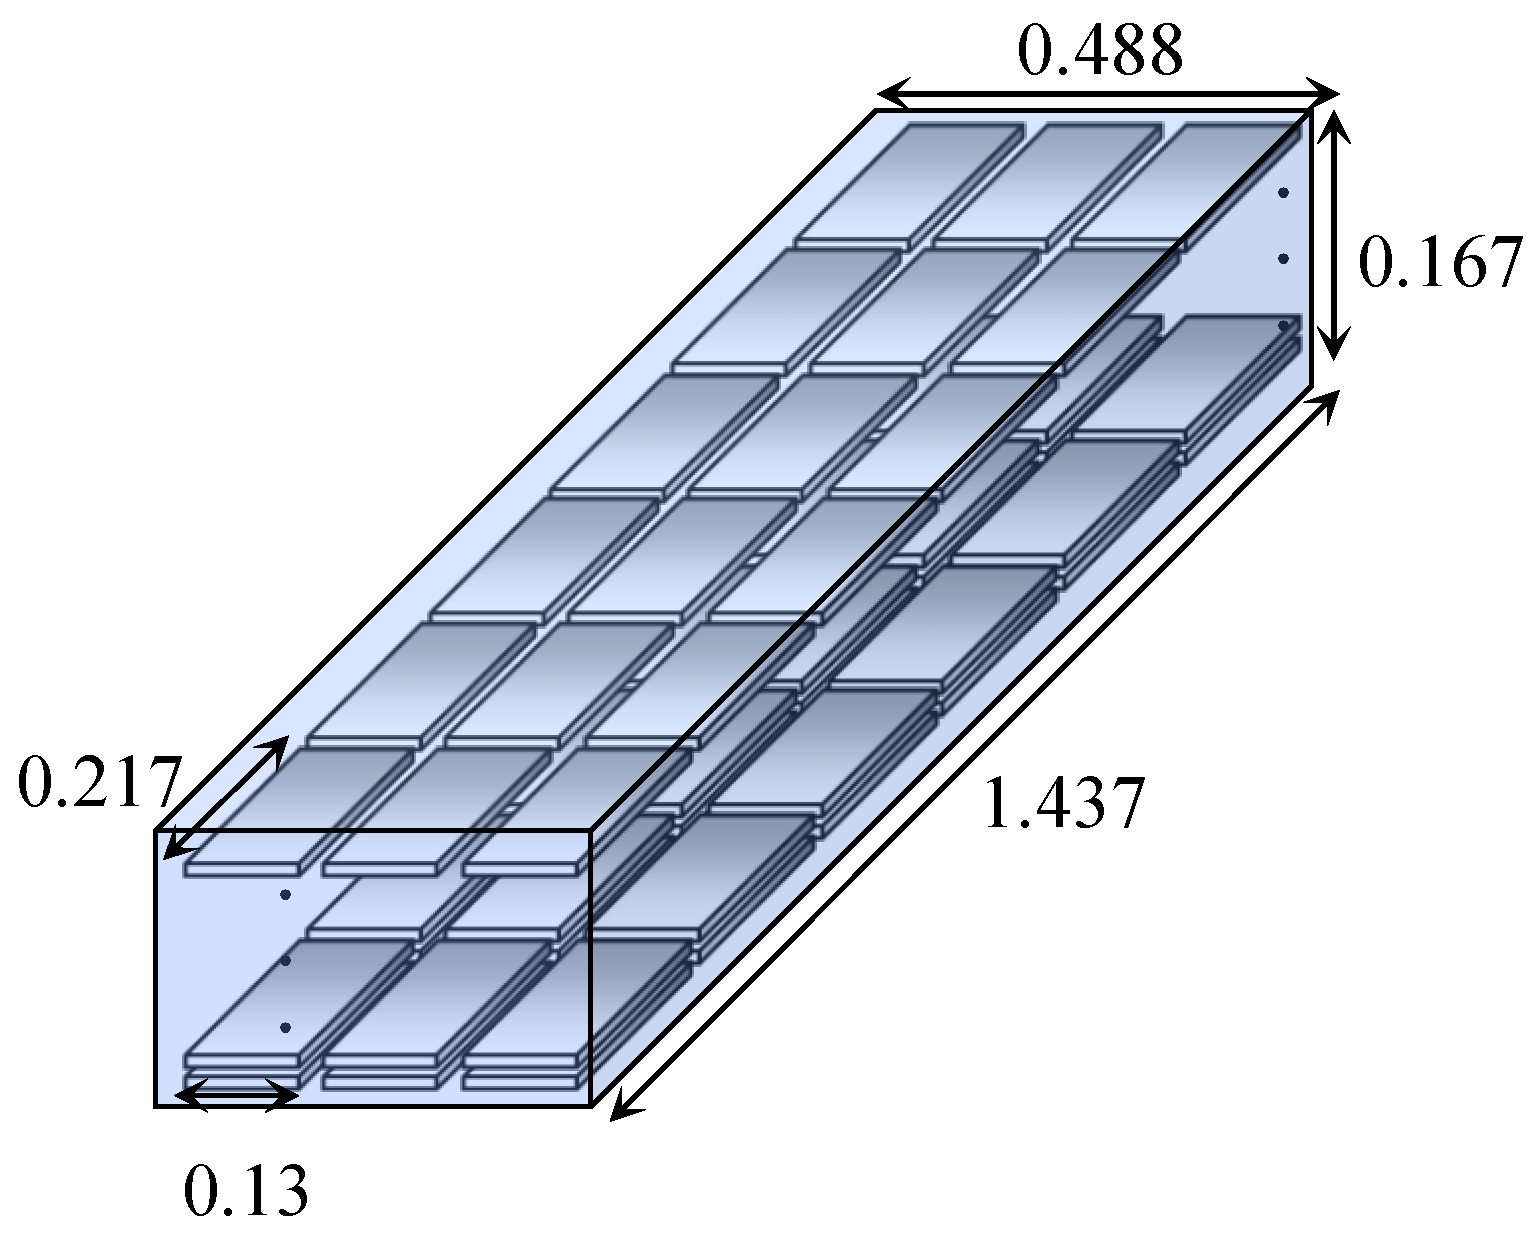
6], the dimensions of each battery cell are explicitly specified as 0.217 m × 0.13 m, and the overall dimensions of the battery pack are 1.437 m in length, 0.488 m in width, and 0.167 m in height. Based on these reported dimensions, we can reasonably infer that 18 cells are arranged on each surface and that the battery pack consists of 20 stacked layers (
Figure 7). Accordingly, the total surface cooling area was calculated as 0.217 m × 0.13 m × 18 cells × 2 sides ≈ 1.02 m
2. This calculation is consistent with Figure SI2 of Lander et al. (2021) [
6], which illustrates the heat extraction directions for surface and tab cooling and confirms that heat is extracted from both sides of the battery cells.
In contrast, this study’s heat sink had a length of 0.152 m, a width of 0.092 m, and a total surface area of 0.014 m
2, resulting in an area ratio of approximately 72.6 between the two systems. Substituting these values into Equation (3) yields an effective difference of approximately thirty-five. A larger heat transfer surface area enhances heat dissipation; therefore, the CCC value obtained in the present experiment was multiplied by thirty-five to enable a direct comparison with the results reported by Lander et al. (2021) [
6].
2.3. Assessment of Impact on GHG Emissions and Life Cycle Costs
In this third step, the impact of improved heat sink cooling performance on the battery module’s lifespan was calculated. Lander et al. (2021) [
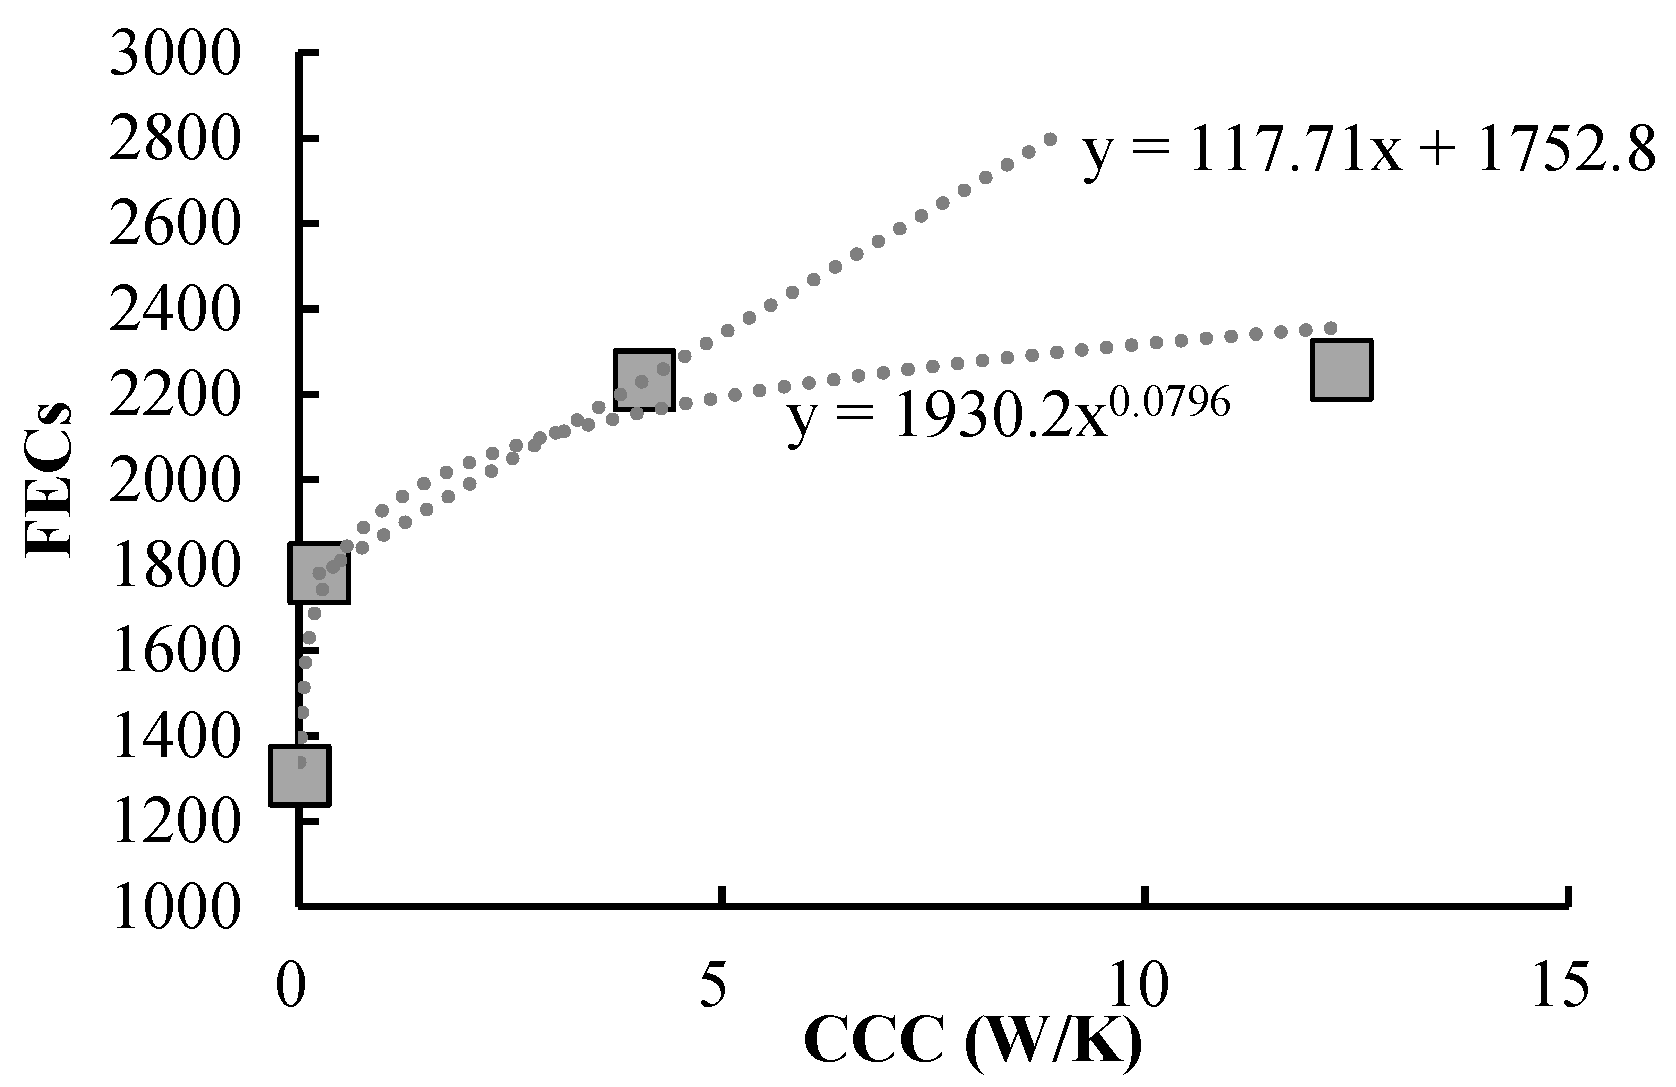
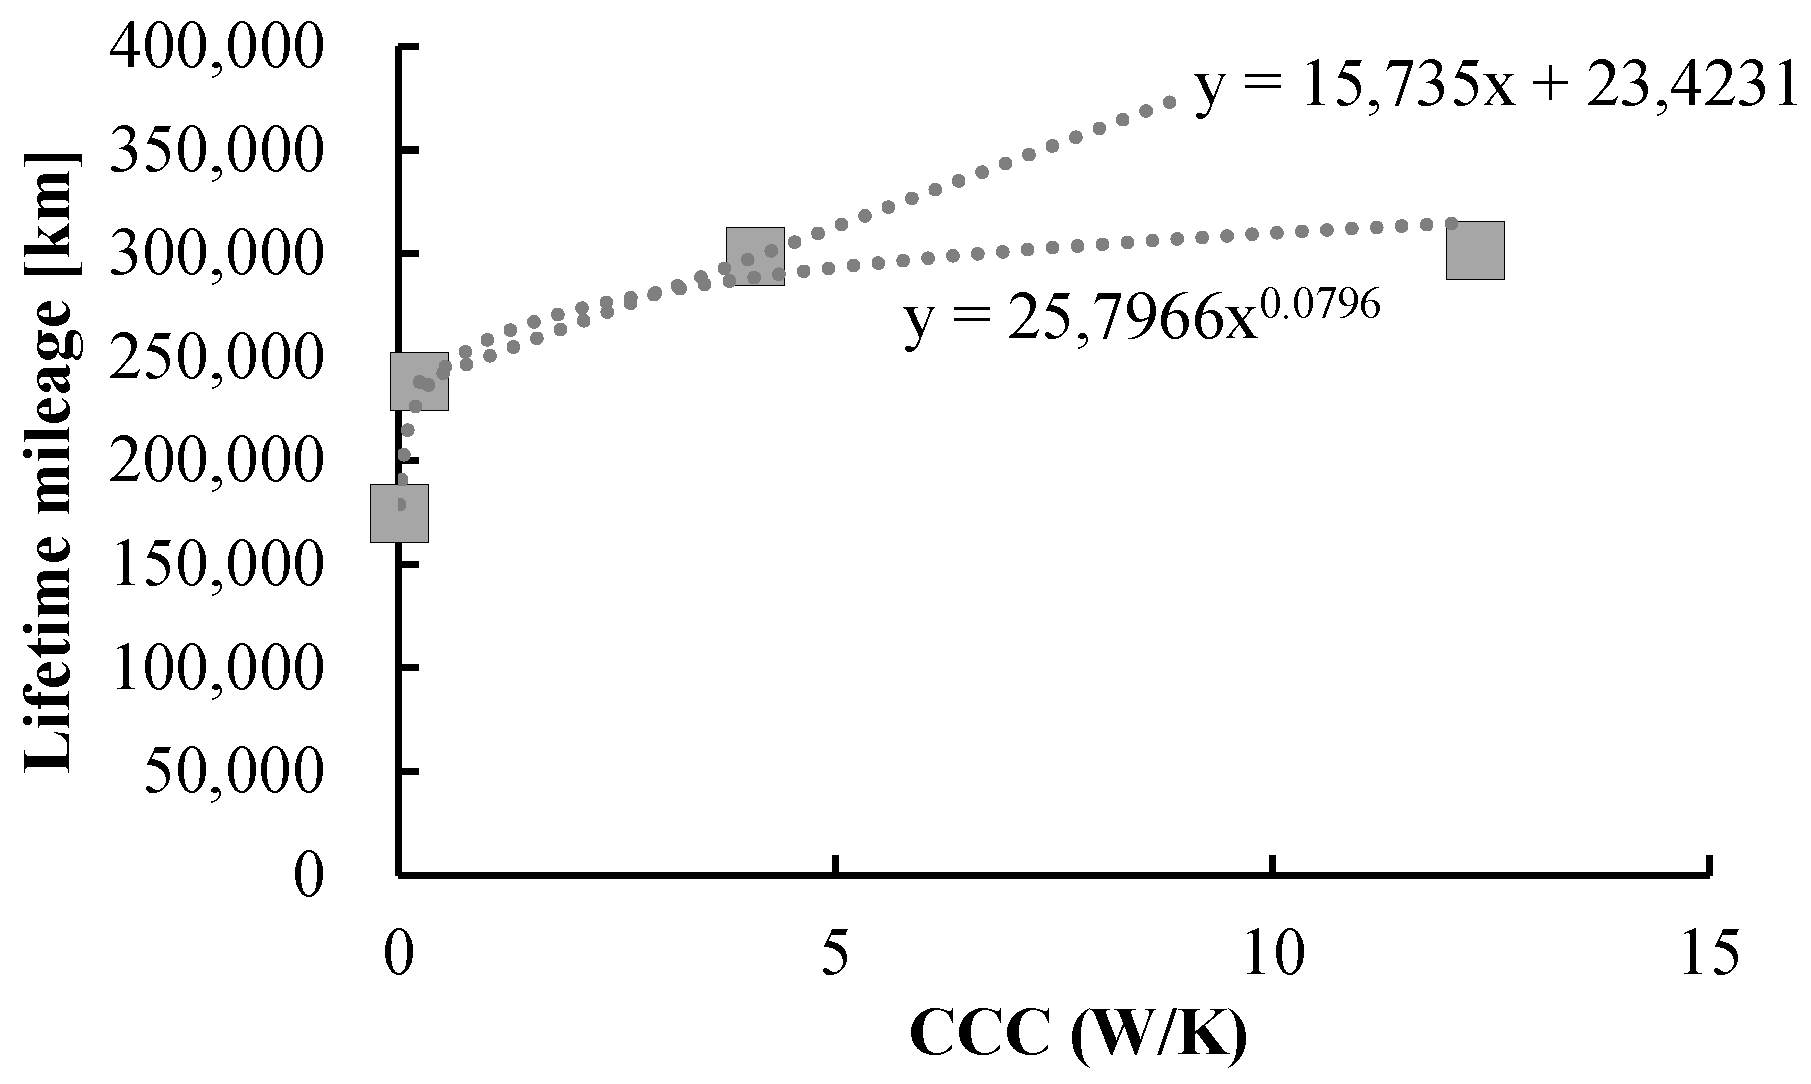
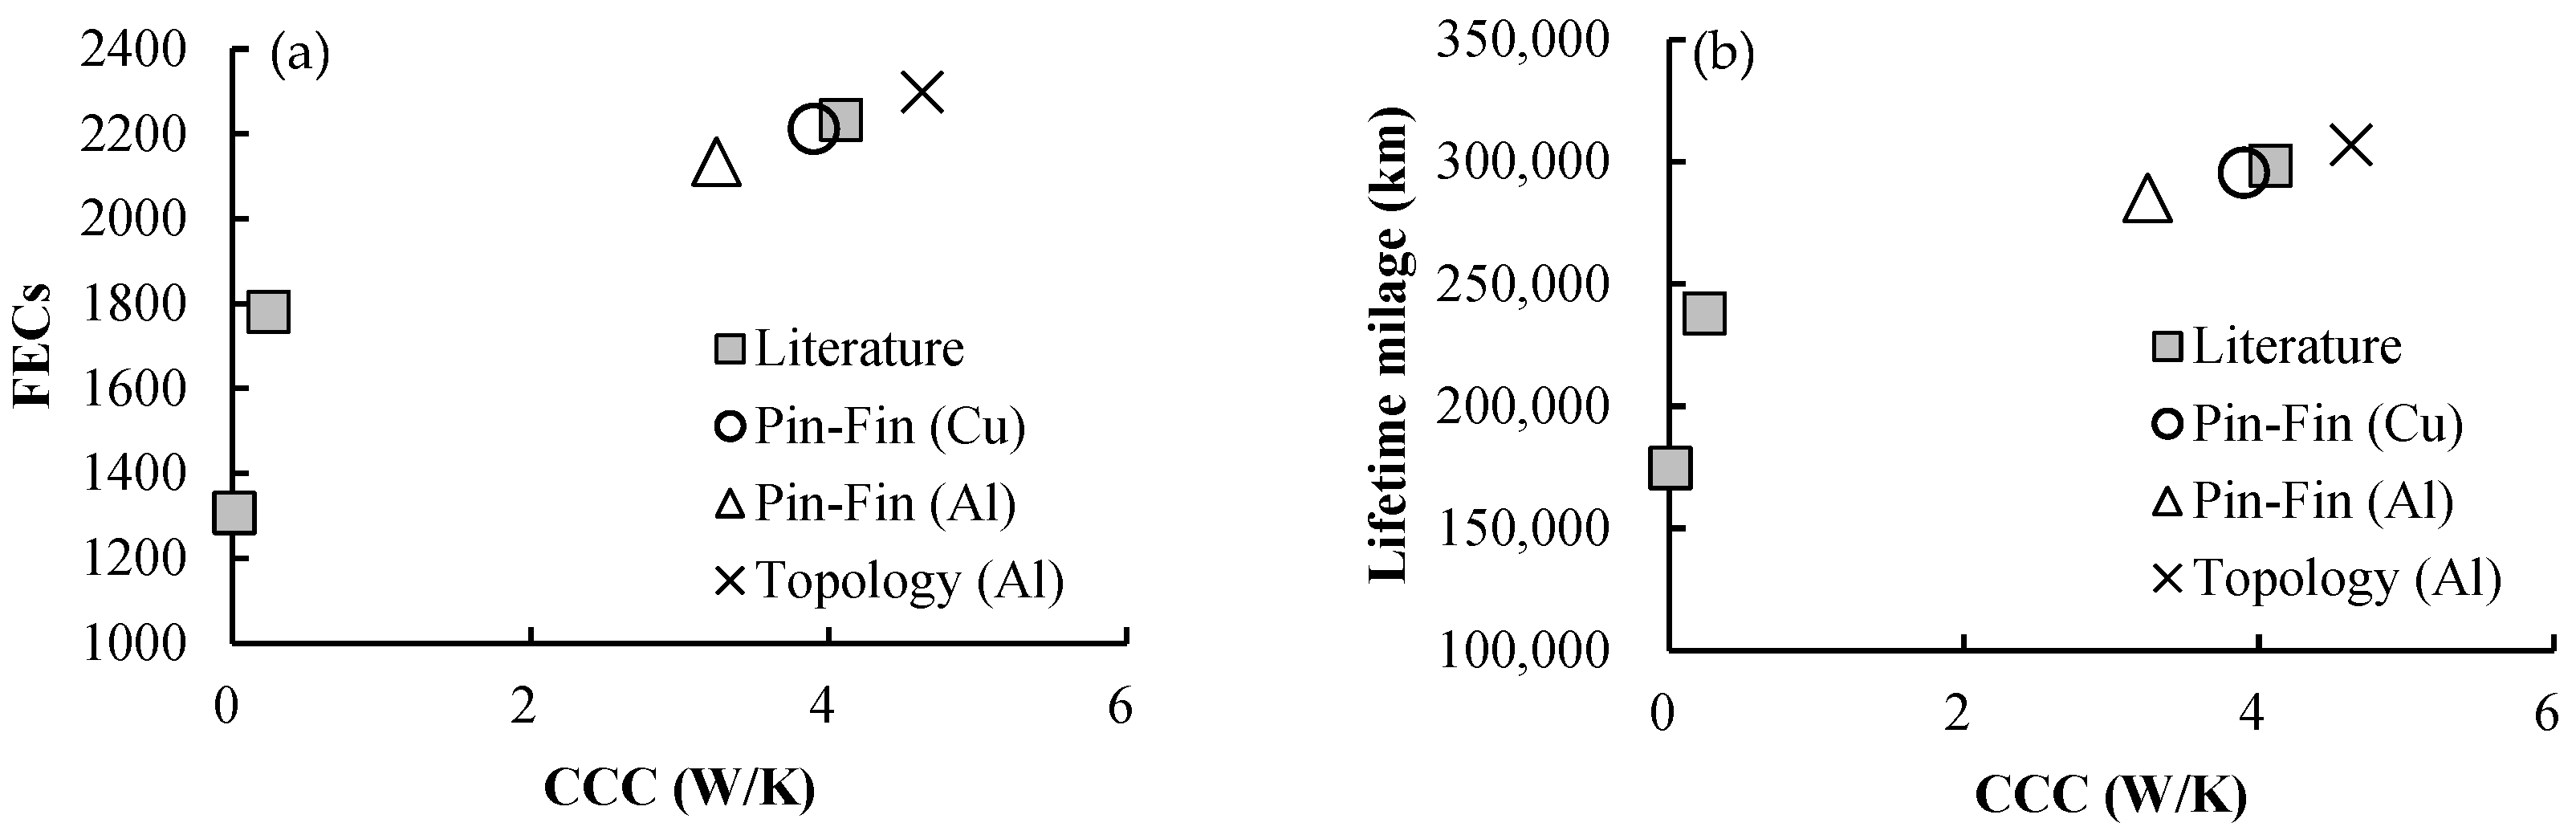
6] demonstrated the relationship between increased CCC, full equivalent cycles (FECs), and lifetime mileage, as illustrated in
Figure 8 and
Figure 9, respectively. A higher CCC allows the battery to operate at higher charging and discharging rates while suppressing increased temperature, thereby reducing degradation mechanisms such as ohmic heating and kinetic and mass-transfer limitations. As a result, an increase in CCC directly leads to a higher usable FEC count, thereby extending the practical battery lifetime. We used these findings to extrapolate FECs and lifetime mileage from the CCC values obtained in our experiment. In Lander et al. (2021) [
6], the difference in cooling performance between immersion cooling (IC) and surface cooling (SC) was negligible. This was because, even with SC, the temperature difference (ΔT) was already minimal at 0.41 K; thus, further improvements in cooling performance had a limited effect on FECs and lifetime mileage. Moreover, their analysis assumed a depth of discharge of 80%, a mid-state of charge of 50%, and a charge/discharge rate of 1C (i.e., charging/discharging the full cell capacity in one hour), corresponding to a heat generation rate (
) of 1.664 W; however, in real-world battery usage, the 1C rate may be exceeded during scenarios such as vehicle startup, uphill driving, or fast charging, leading to
surpassing 1.664 W. We predicted the potential impact using two scenarios to account for this variability: (1) a linear prediction model, which extrapolates the CCC increase observed when transitioning from Tab Cooling to SC, and (2) a power-law prediction model, which incorporates the diminishing rate of CCC improvement when shifting from SC to IC, as described by Lander et al. (2021) [
6].
Finally, we calculated the GHG emissions and LCC contributions for CM- and AM-manufactured heat sinks. By implementing a topology-optimized heat sink produced via AM, battery cooling efficiency improved, extending battery lifespan. This extension is expected to reduce the total number of batteries manufactured, thereby lowering GHG emissions associated with battery production. Currently, EV batteries are typically warranted for eight years or 100,000 miles [
26]. If battery life is extended, original equipment manufacturers (OEMs) may increase the warranty period and mileage coverage. Additionally, users may be less likely to replace their EVs before the battery warranty expires, potentially reducing battery production and associated emissions.
Conversely, surveys conducted by OEMs and research institutions suggest that the actual battery lifespan often exceeds the vehicle’s operational life [
27], implying that users are unlikely to replace their EVs solely due to battery degradation. Consequently, extending battery life may not directly reduce the frequency of EV replacements. However, recent research has increasingly focused on the potential for second-life applications of retired EV batteries [
28,
29,
30]. Prolonging battery lifespan could enhance opportunities for secondary use in energy storage systems or other applications.
The baseline GHG emissions from battery production were estimated based on the following reports. Volvo reported seven tCO
2-eq per battery pack [
5]. Similarly, the baseline scenario in the referenced report [
31] estimated GHG emissions per battery pack at 6980 kgCO
2-eq. Additionally, Lander et al. (2021) [
6] reported a GHG emission factor of 29.1 kg CO
2-eq per kg of battery mass and a total battery pack weight of 253 kg, resulting in 7362 kg CO
2-eq per pack. Given the close agreement between these estimates, this study adopted seven tCO
2-eq per pack as the default value for GHG emissions during battery production.
The LCC included the cost of manufacturing battery heat sinks, electricity consumption for charging (based on Japanese energy prices), electricity generation costs, and the cost of offsetting GHG emissions at each phase over the life cycle using a carbon price. The following subsection presents the calculation logic for each cost.
2.3.1. Manufacturing Phase Cost of Heat Sinks
The manufacturing cost of the pin-fin heat sink was determined through interviews with manufacturers. The cost of the BJT-manufactured heat sink was calculated in collaboration with Ricoh Co., Ltd, Kanagawa, Japan: this cost included depreciation of manufacturing equipment (such as a 3D printer, sintering furnace, and peripheral devices), raw material expenses (powder and binder), labor costs, equipment maintenance, and electricity consumption [
17].
The LCC analysis excluded the cost of battery production. Although this study replaces the pin-fin structure with a topology-optimized AM design, the heat sink’s external geometry, mounting points, and packaging constraints were intentionally kept unchanged. Consequently, the design modification does not require any changes to battery-pack assembly procedures or tooling and thus has no impact on battery production cost. As such, excluding this cost in the LCC calculation would not influence the relative comparison between the CM and AM heat sink designs.
2.3.2. Use Phase Cost
We calculated the lifetime cost of EV usage based on the total electricity cost for battery charging, assuming operation in Japan. The EV’s electricity energy efficiency was estimated to be seven km/kWh [
17], and lifetime electricity consumption was determined by dividing the total lifetime mileage by the energy efficiency and then multiplying this by the applicable electricity rate. The electricity rates used were those of the Tokyo Electric Power Company as of July 2023, specifically 30.00 JPY/kWh for up to 120 kWh per month in the Kanto region and 36.60 JPY/kWh for 121 kWh–300 kWh [
32].
We assumed that EVs’ energy efficiency would remain unchanged regardless of whether a vehicle was equipped with a pin-fin heat sink manufactured by CM or a topology-optimized heat sink manufactured by AM. In other words, improvements in battery cooling efficiency were not expected to increase the driving range per charge. The optimal battery temperature is approximately 21 °C, and deviations above or below this threshold reduce energy efficiency [
33]. Therefore, enhanced cooling efficiency was not expected to have a direct impact on energy efficiency; however, because improved cooling extends battery lifespan, the total electricity consumed over the battery’s lifetime could increase due to an extended operational range.
2.3.3. GHG Emissions, Carbon Price
To calculate GHG emissions from manufacturing, use, and disposal, this study primarily sourced emission intensities obtained from the Inventory Database for Environmental Analysis (IDEA) Version 3.4.1 Life Cycle Inventory (LCI) database [
34], in accordance with ISO 14040/14044 [
35,
36].
No existing database contained data on BJT; therefore, GHG emission intensity was determined experimentally in collaboration with Ricoh Co., Ltd. [
17]. The obtained GHG emissions were converted to costs by multiplying them by the carbon price. A 2019 World Bank report recommended a carbon price of 40–80 USD/tCO
2-eq by 2020 and 50–100 USD/tCO
2-eq by 2030 to meet the Paris Agreement’s temperature targets [
37]. This study adopted the median 2030 carbon price of 75 USD/tCO
2-eq from the same report. However, carbon prices differ widely across regions, depending on policy frameworks and the maturity of carbon-trading schemes—for example, prices in the EU ETS tend to be higher than those in emerging markets. Therefore, the carbon price used here should be regarded as a reference value, and the LCC framework can flexibly incorporate region- or time-specific carbon price assumptions as needed.
4. Discussion
In general, liquid-cooled heat sinks achieve better cooling performance by increasing the surface area in contact with the coolant; however, as the surface area increases, pressure loss also rises. This situation creates challenges, such as insufficient flow speed to enhance heat transfer or the need for a larger pump to supply the required coolant volume, which adds weight; therefore, a well-balanced design is essential. Achieving this balance typically requires repeated simulations and experiments, which are time-consuming; however, this study’s topology optimization method significantly reduced design time by automatically optimizing thermal-fluid characteristics once the objective function was set. One limitation of conventional topology optimization is that it does not account for manufacturing constraints, which can pose challenges when fabricating the optimized design directly; however, the ToffeeX software allows manufacturing constraints to be set as parameters, enabling the production of parts with relatively little trial and error. This approach highlights a key advantage of the method used in this study.
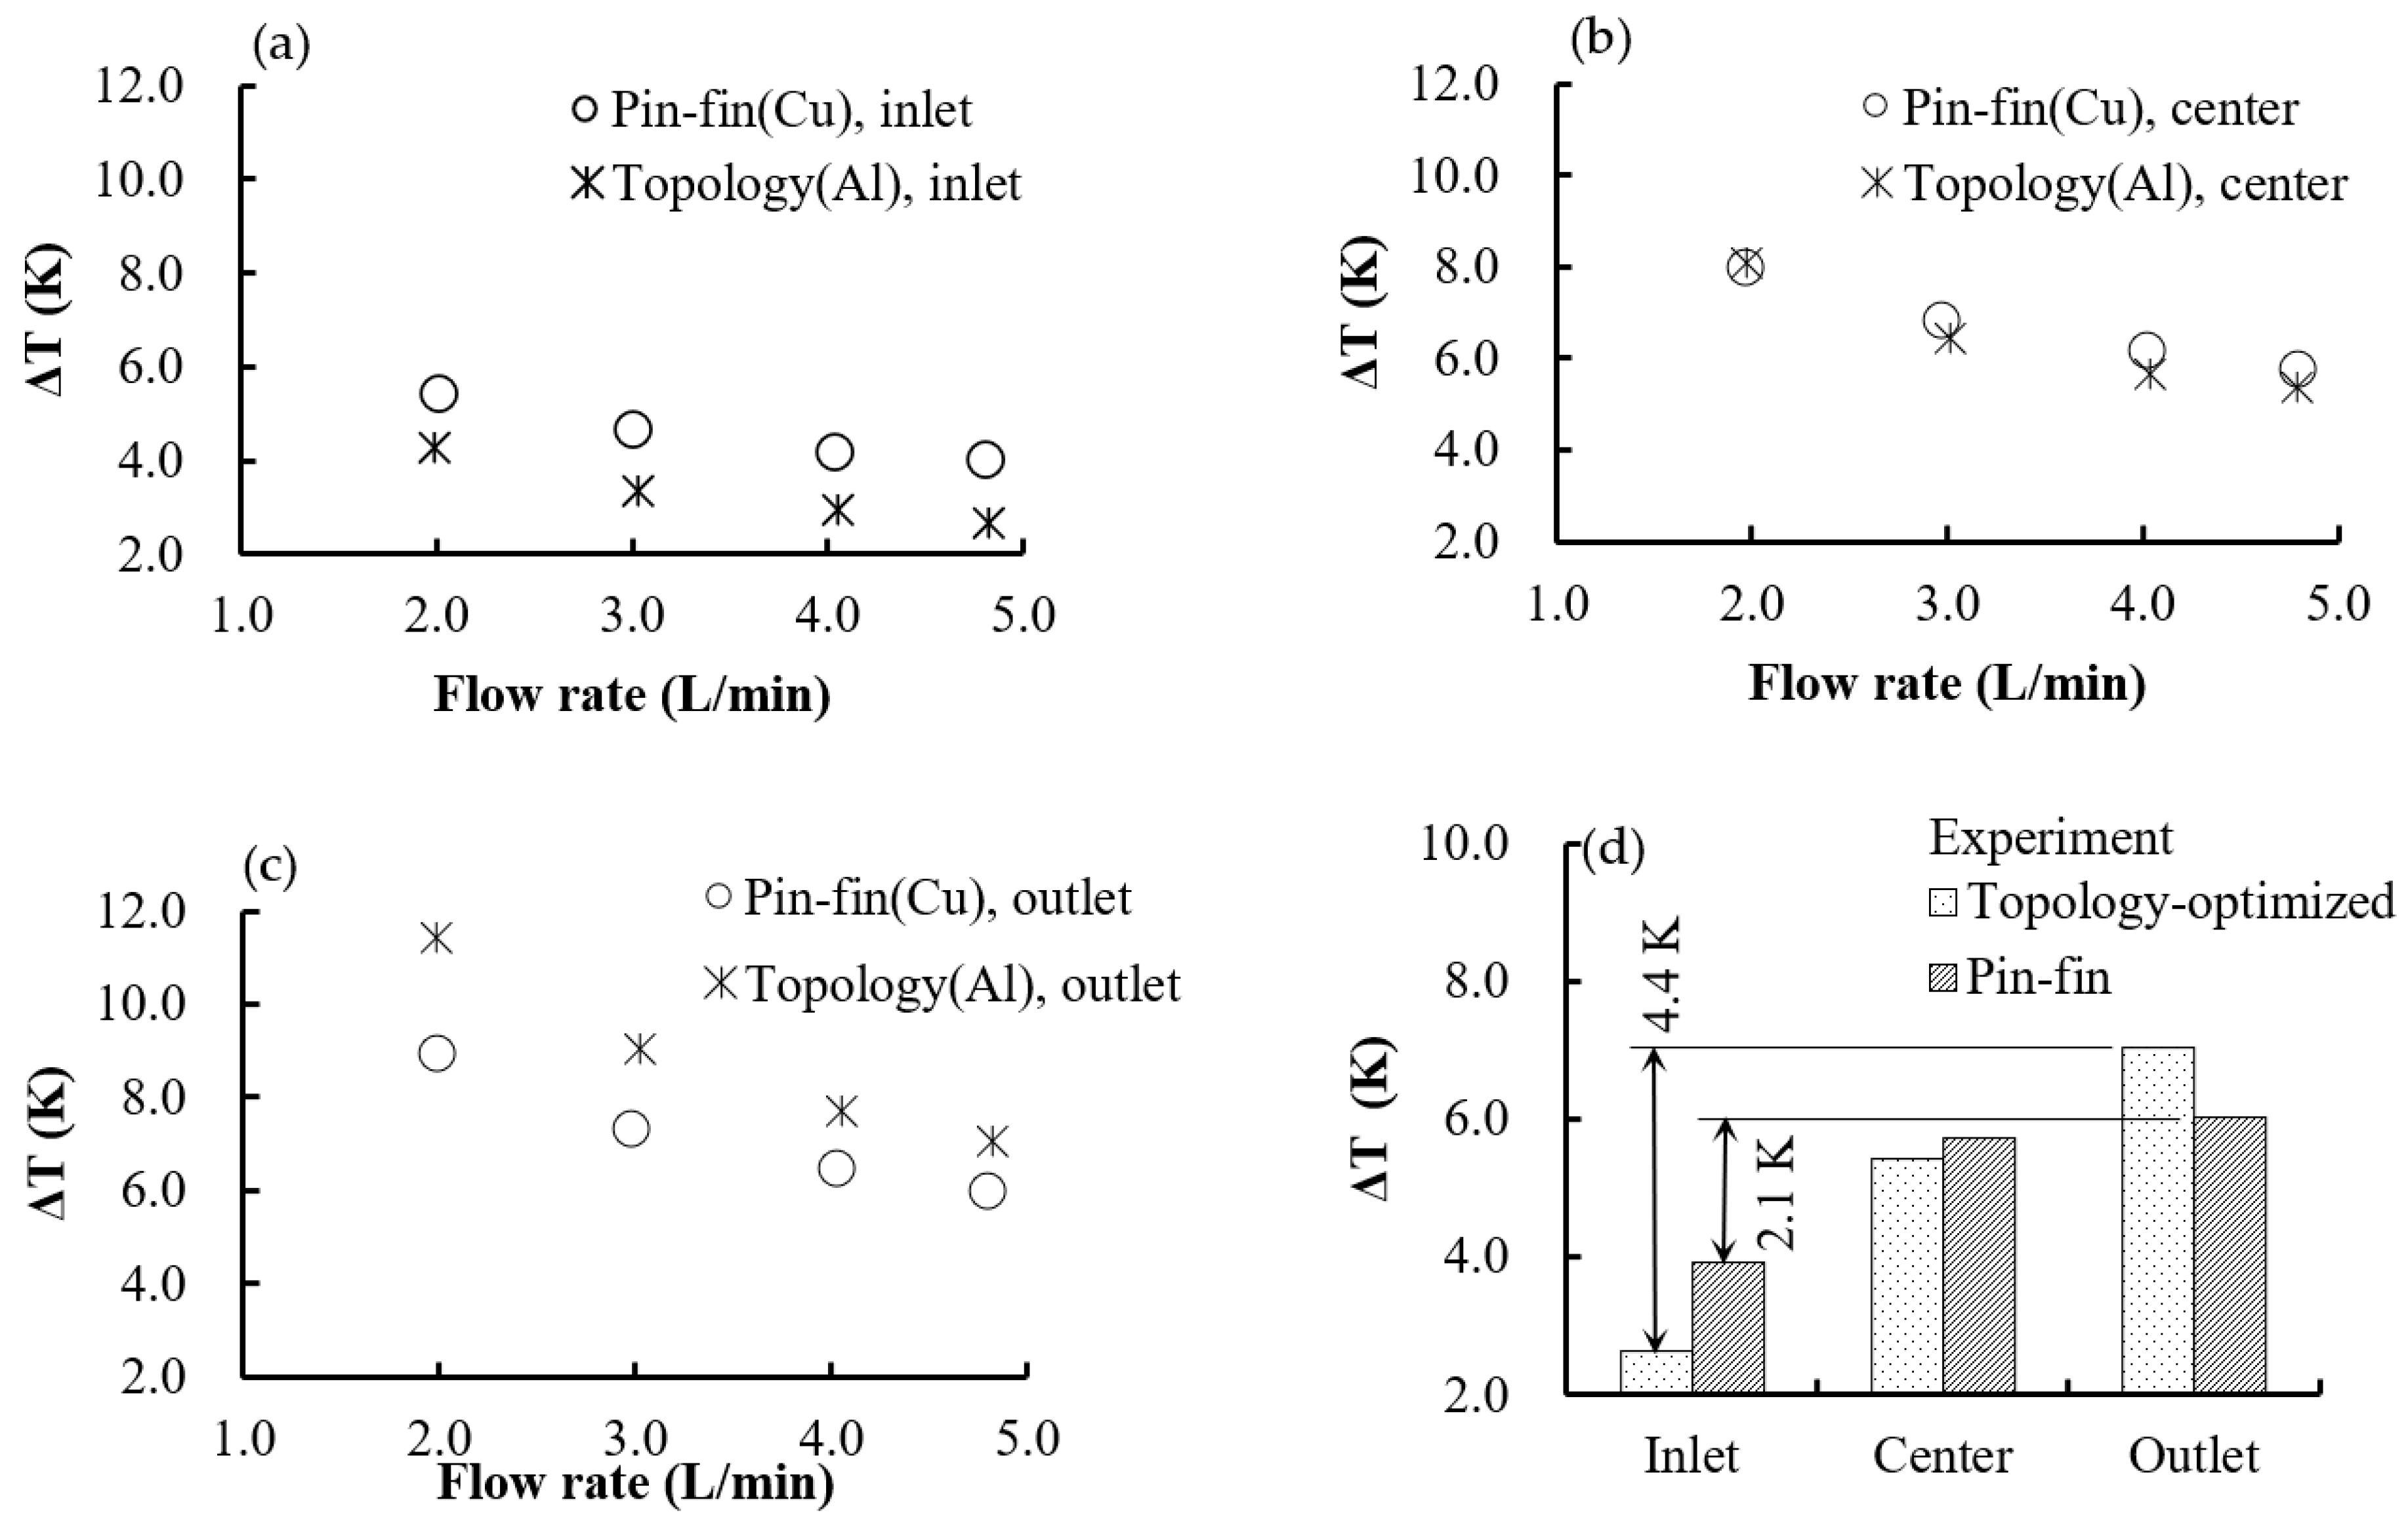
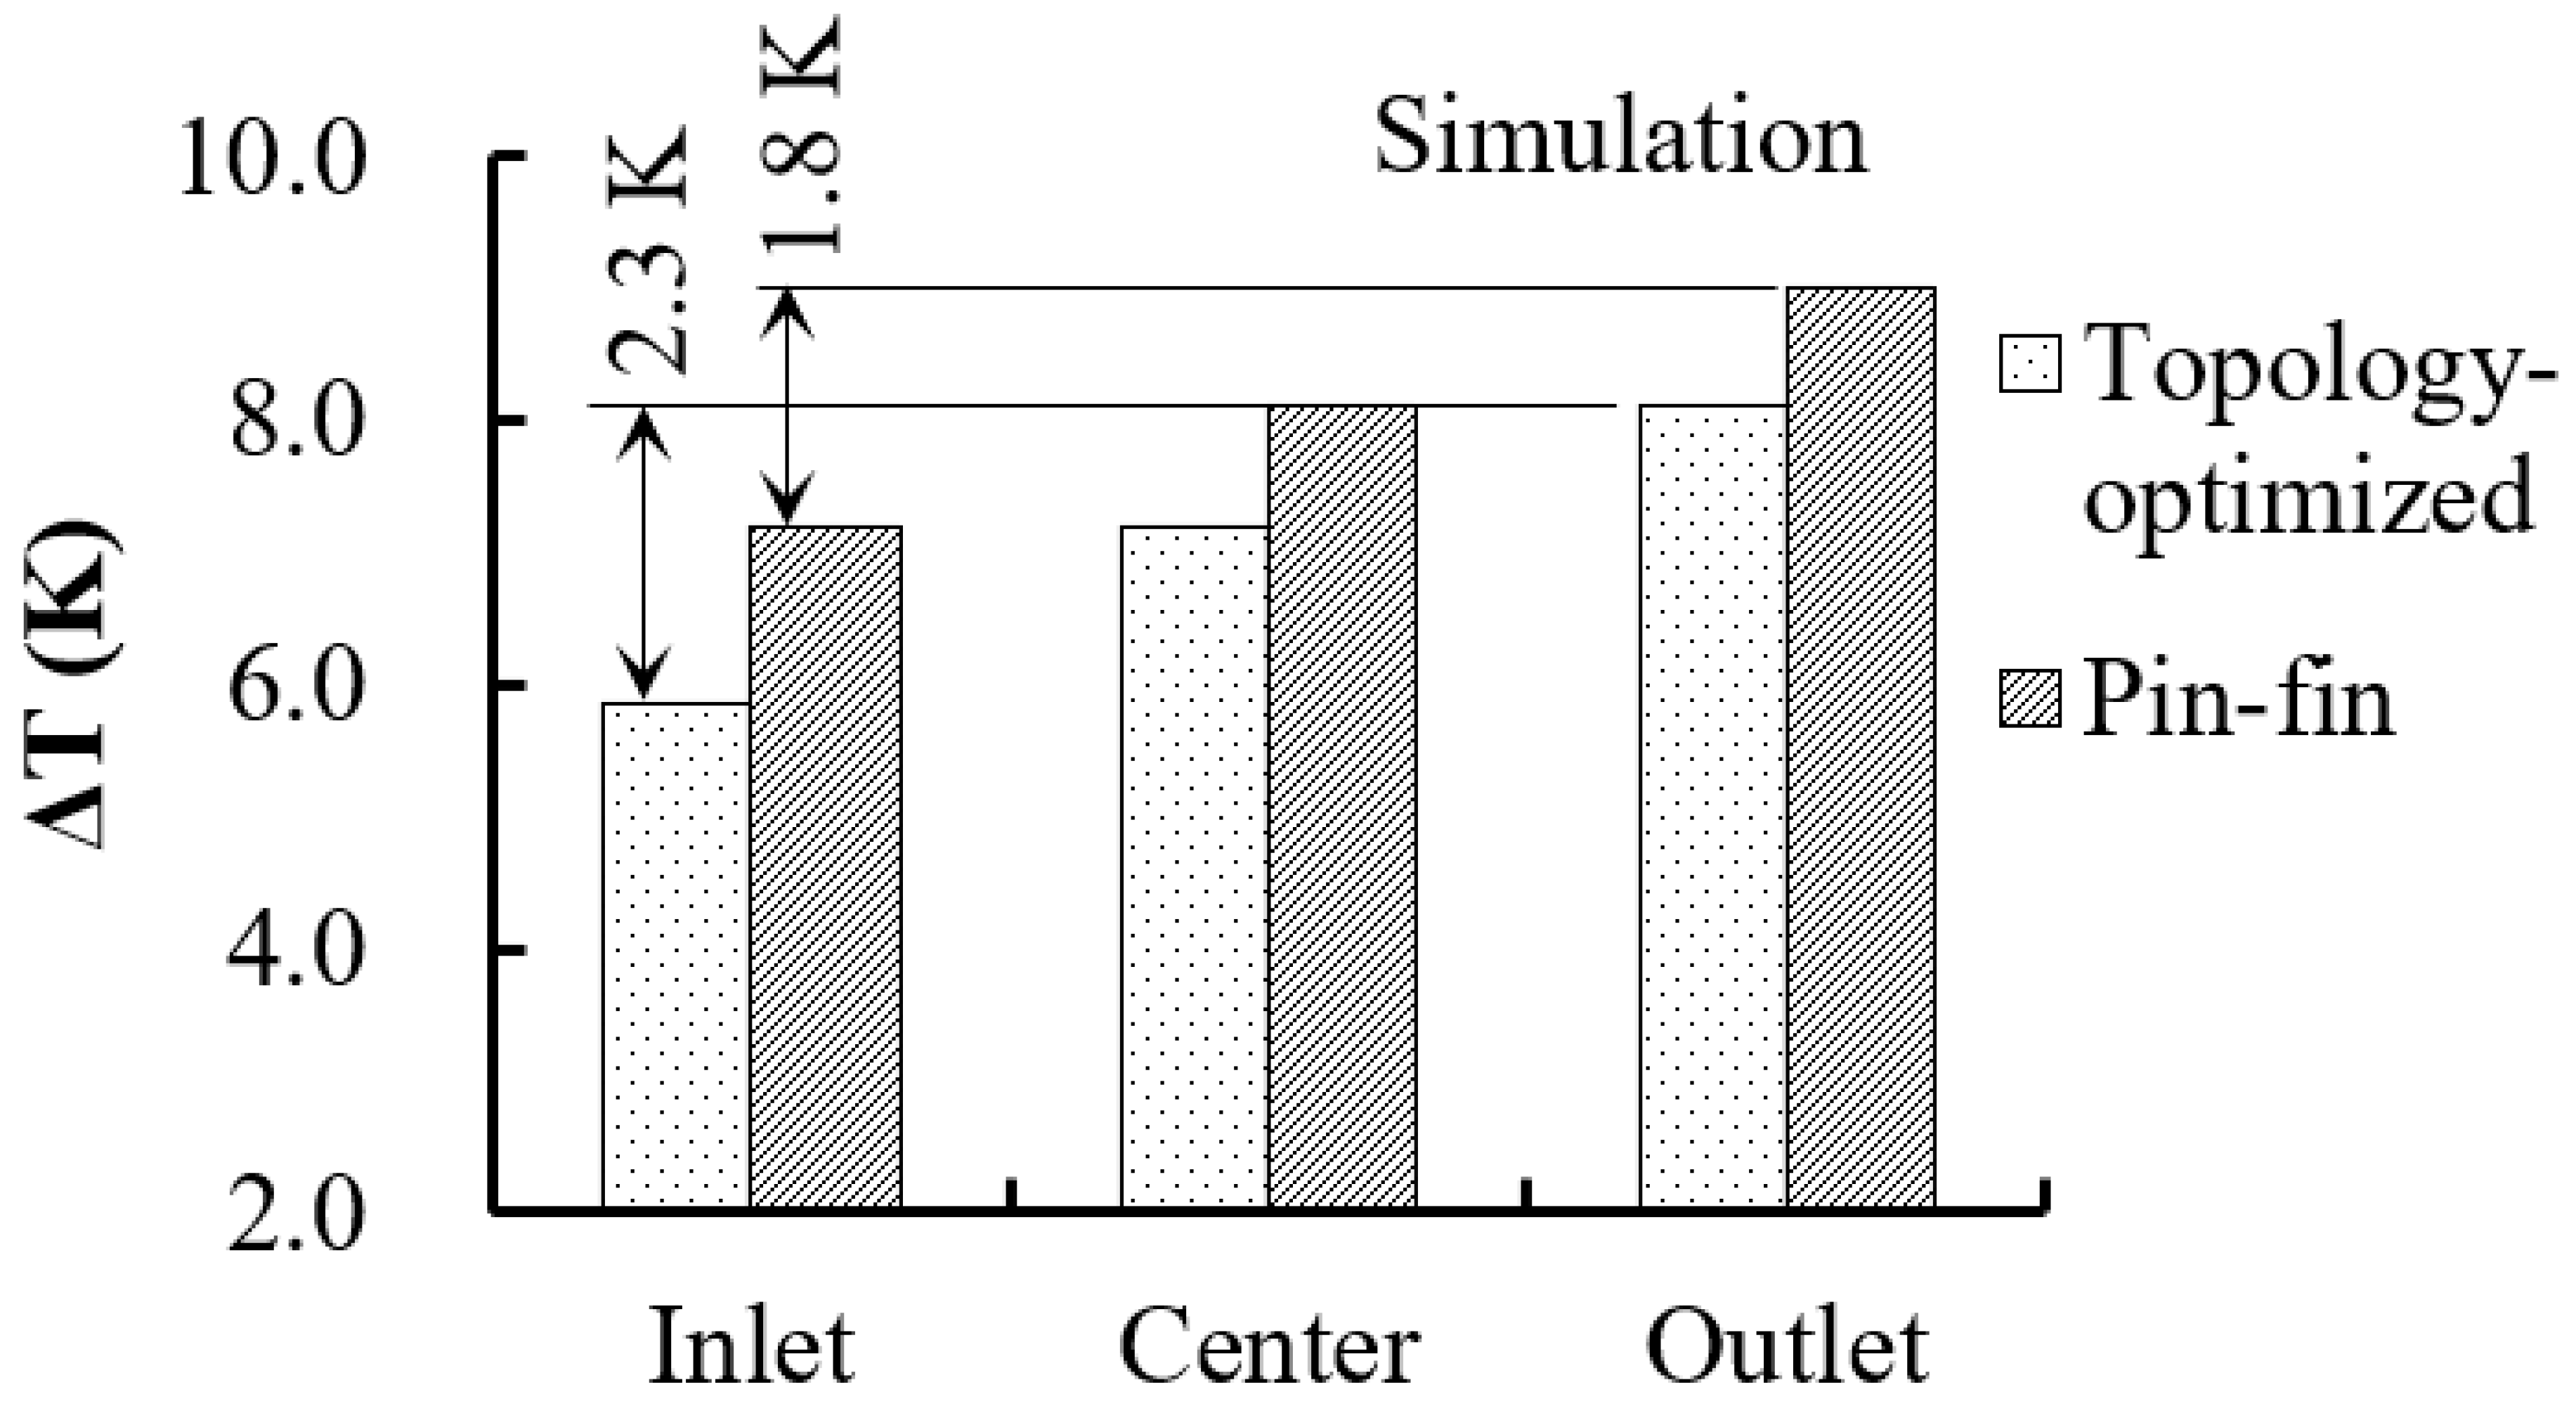
As shown in
Figure 10d and
Figure 12, the topology-optimized design exhibited a larger inlet–outlet temperature difference than that of the conventional pin-fin heat sink. This trend can be attributed to the substantially lower inlet temperature observed in the topology-optimized design, which indicates that the higher flow velocity near the inlet promoted more efficient heat removal in that region. In contrast, at the outlet, the topology-optimized heat sink showed larger ΔT values than the pin-fin design in the experimental measurements, whereas the simulations predicted the opposite trend, namely, a smaller ΔT for the topology-optimized design. This discrepancy suggests that the actual fabricated topology-optimized heat sink did not fully reproduce the intended geometry or flow path characteristics assumed in the simulation, leading to deviations in thermal–fluid behavior. This likely occurred because the objective function did not include a requirement for uniform heat distribution, resulting in temperature variation in the topology-optimized heat sink. Future research could address this issue by incorporating uniform heat-distribution requirements into the objective function and improving the manufacturability and geometric fidelity of topology-optimized designs.
Next, the ripple effect of global GHG emission reductions resulting from improved battery cooling efficiency enabled by the topology-optimized heat sink manufactured with AM was calculated.
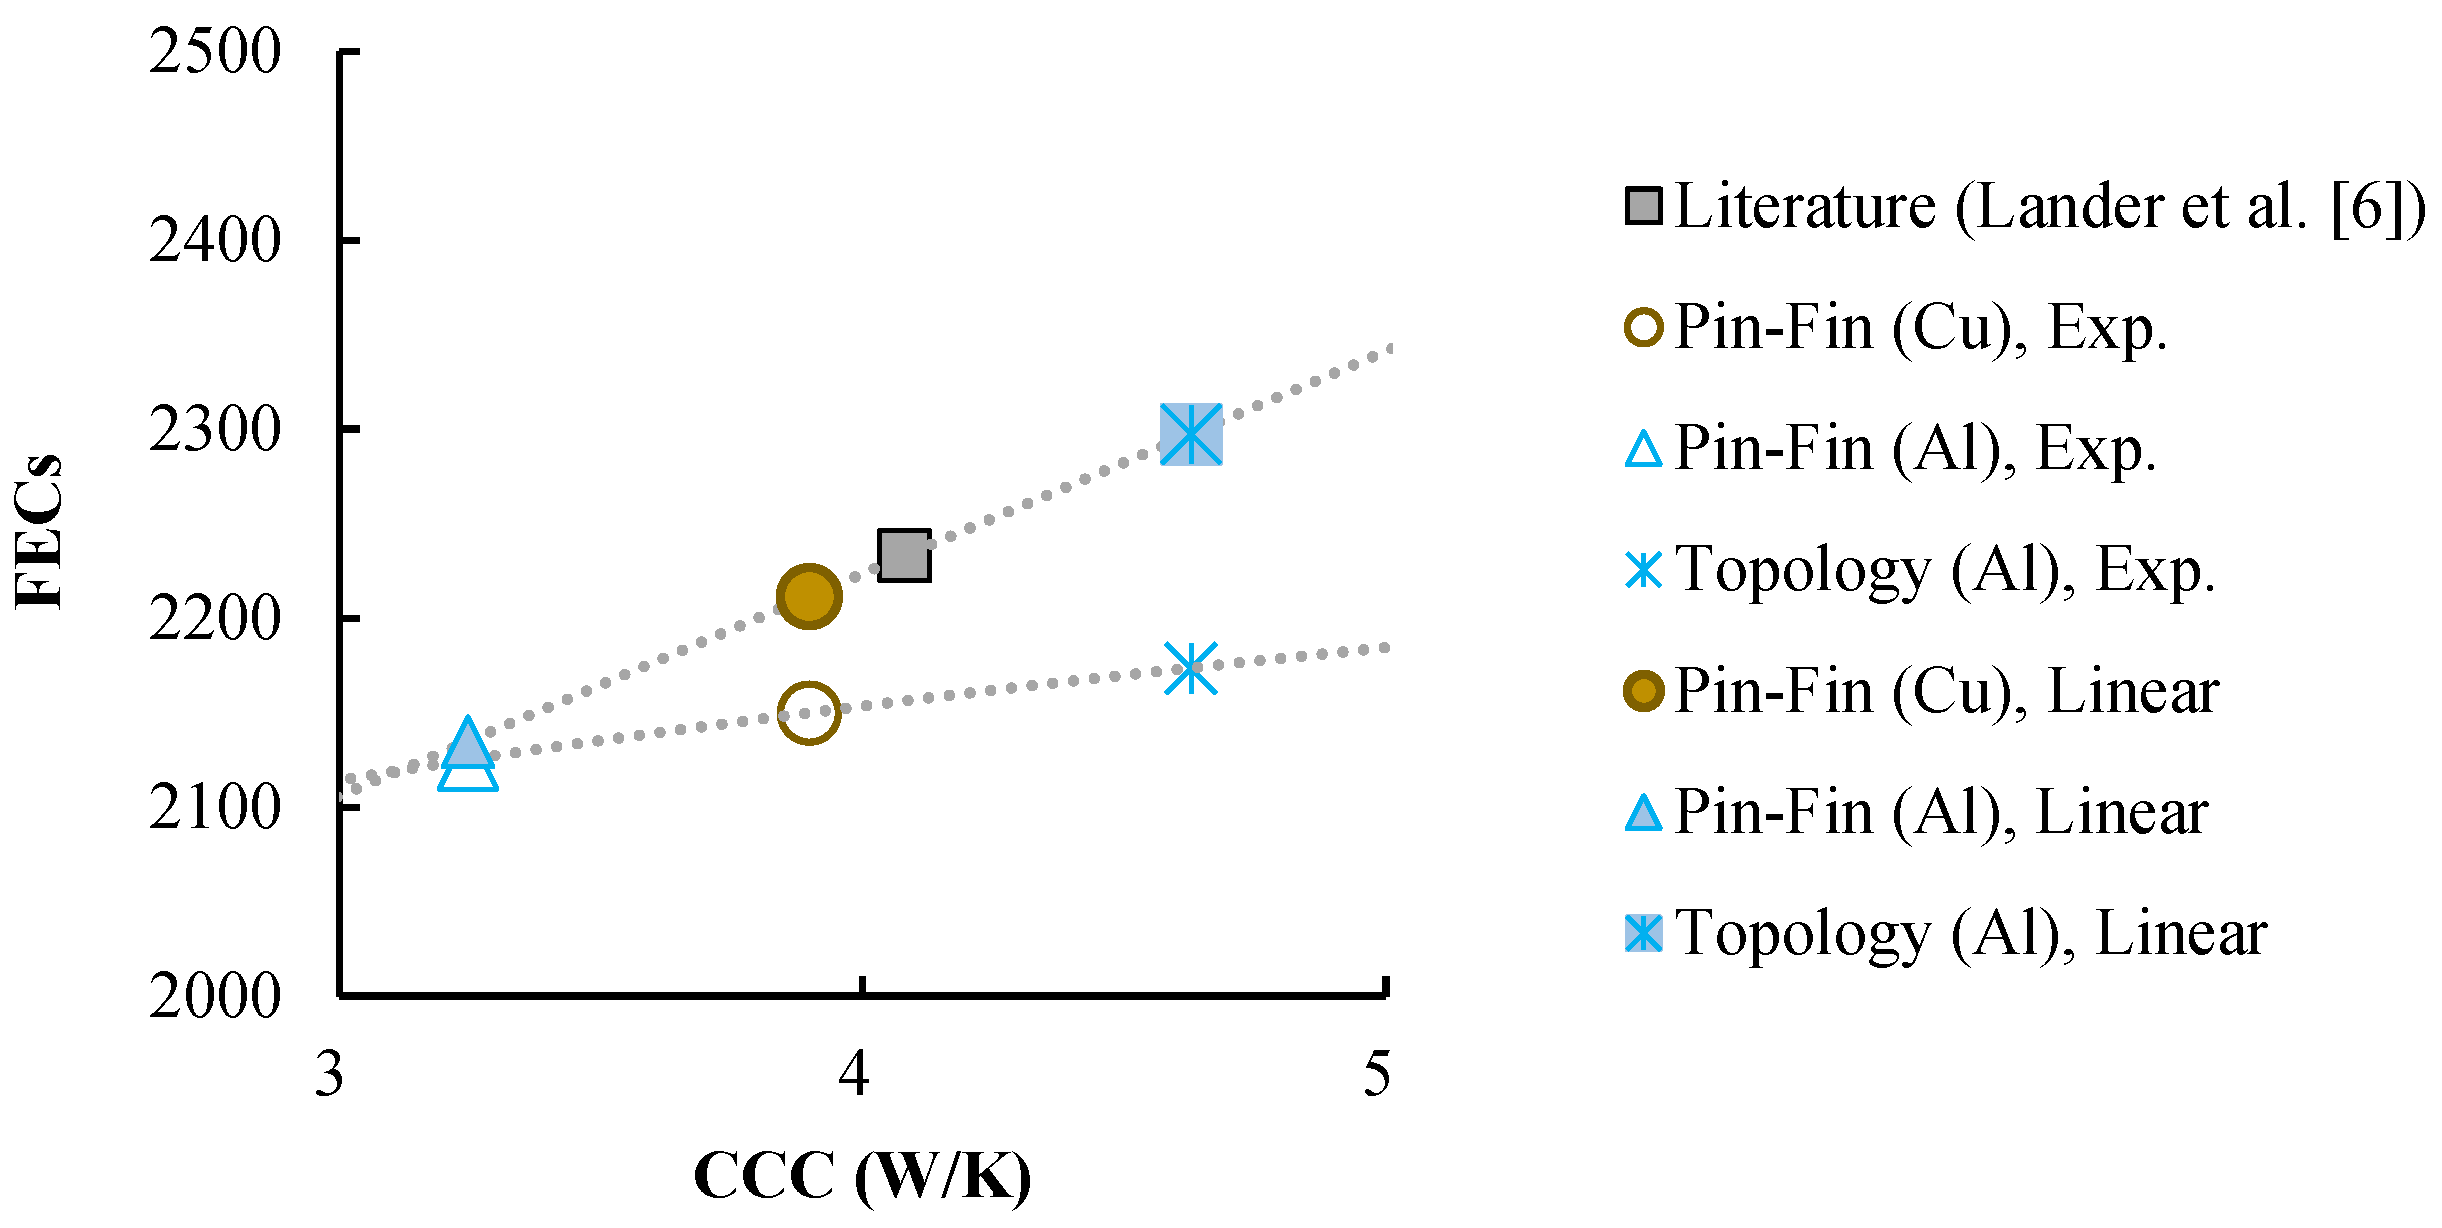
Figure 16 illustrates the relationship between CCC and FECs (from
Figure 8 and
Figure 9), with the experimental data from this study superimposed. Based on the linear approximation scenario, the FECs of a battery equipped with an aluminum topology-optimized heat sink were 7.6% higher than those with a pin-fin heat sink. In contrast, the FECs were 2.9% higher under the power approximation scenario.
We used these two improvement rates and projected EV sales to calculate the potential reduction in GHG emissions from battery manufacturing. A report published by the International Energy Agency (IEA) in April 2024 stated that approximately 14 million EVs were sold in 2023. The projected sales figures were 17 million in 2024, 45 million in 2030, and 65 million in 2035 [
40]. In a speculative scenario where topology-optimized heat sinks are introduced in 2026 and initially installed in 1% of EVs sold that year, followed by a gradual 1% annual increase in market penetration, the market share could reach 15% by 2040. The reduction in GHG emissions was estimated by calculating the number of battery packs whose replacement could be avoided due to extended battery lifetime. Specifically, EVs sold in 2024 were assumed to undergo battery replacement in 2033 (following a typical eight-year warranty period); the battery lifetime is extended by 7.6%, and some fraction of the batteries that would ordinarily require replacement would instead remain in service, thereby reducing the number of newly manufactured battery packs in 2040. The avoided number of battery packs was then multiplied by the GHG emission intensity of battery manufacturing (as described in
Section 2.3), yielding the estimated reductions.
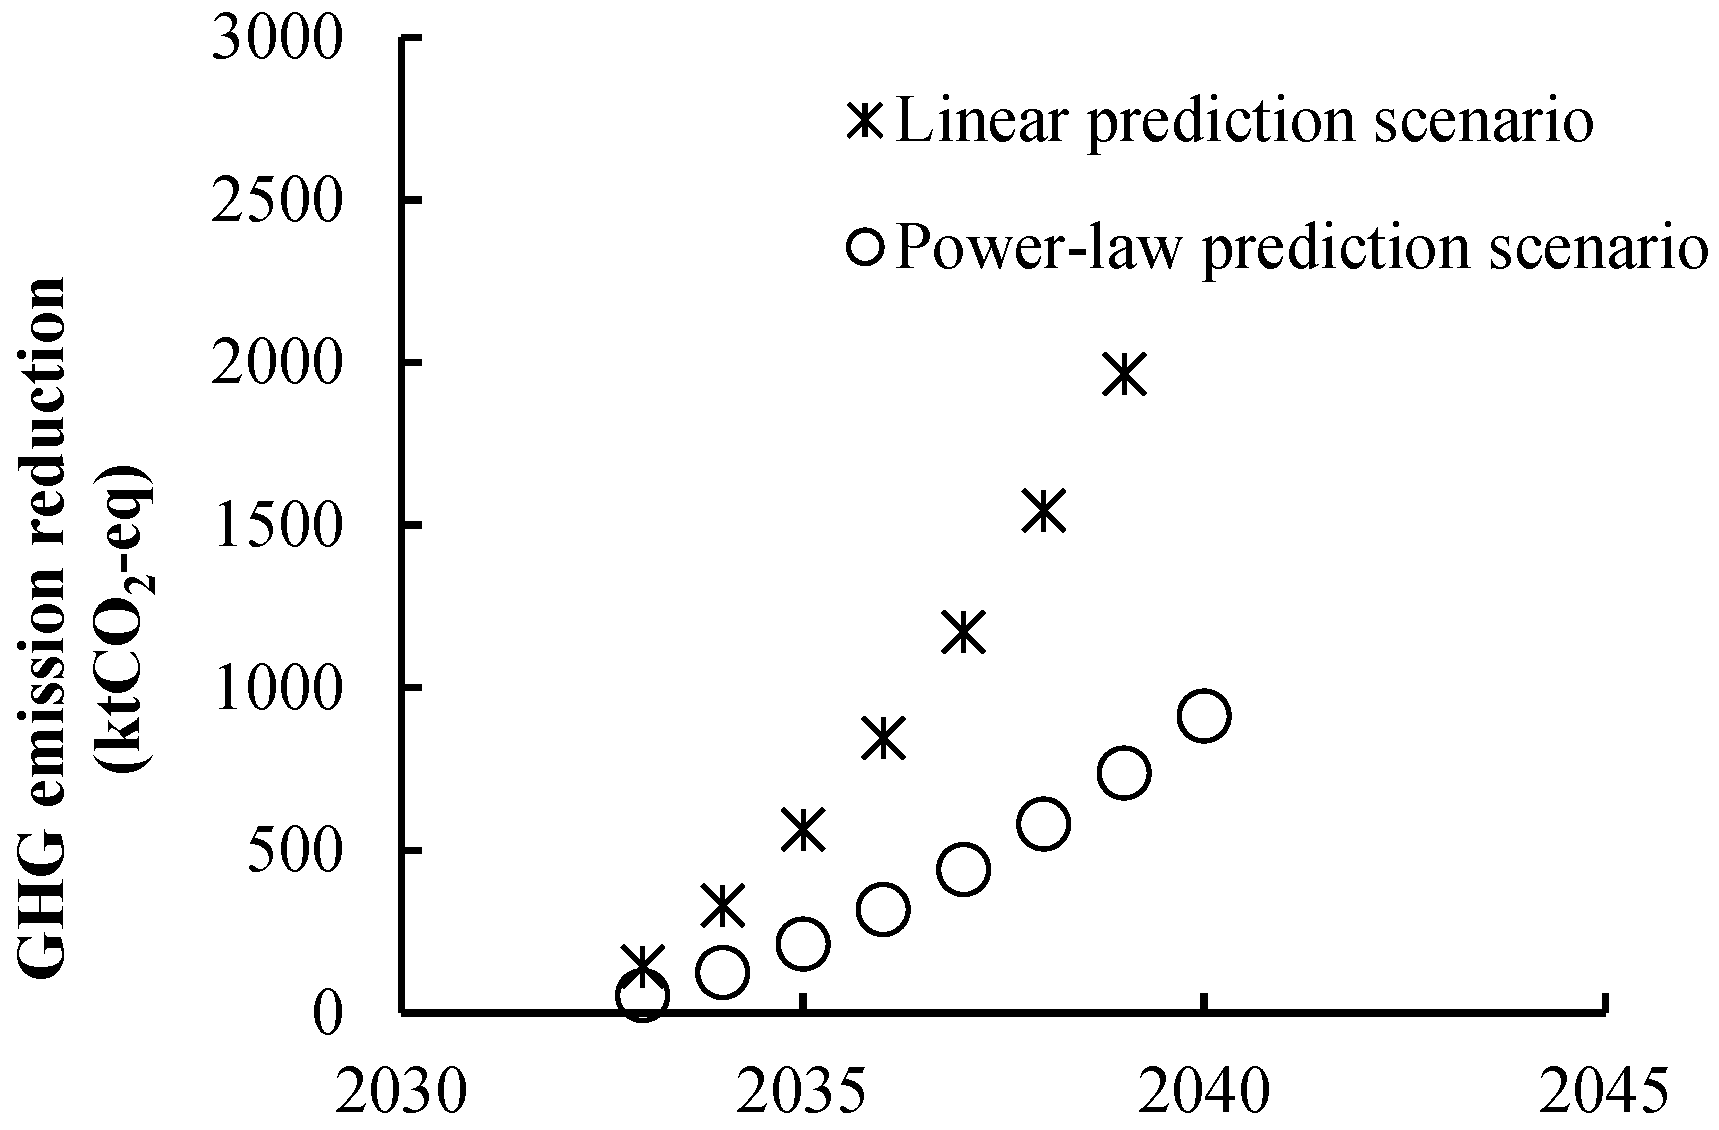
Notably, these projections rely on simplifying assumptions regarding market adoption and replacement behavior; therefore, they are intended as illustrative scenario analyses rather than predictive forecasts. Under these assumptions, the estimated GHG emission reduction in 2040 is 2.4 MtCO
2-eq under the linear approximation scenario and 914 ktCO
2-eq under the power approximation scenario (
Figure 17).
To further evaluate the robustness of the long-term GHG results, a sensitivity analysis was conducted on the battery-pack surface area assumed in the degradation model of Lander et al. (2021) [
6]. Because the improvement in cooling performance is applied on a surface cooling area basis, as written in
Section 2.2, variations in the assumed pack area directly affect the scaling used in the linear approximation model. When the battery pack area was varied by ±20%, the resulting lifetime mileage changed by approximately ±5%, while the final projected GHG emission reduction in 2040 changed by approximately ±15%. Importantly, this sensitivity affected only the linear approximation scenario; the power-law approximation showed negligible dependence on surface cooling area variation. These findings indicate that although surface cooling area uncertainty influences the magnitude of linear approximation estimates, the overall trends and conclusions of the GHG analysis remain robust.
5. Conclusions
This study compared the cooling performance of an EV battery heat sink manufactured using AM with that produced using CM, as well as their environmental and LCC impacts.
The BJT-manufactured heat sink applied topology optimization techniques to maximize thermal-fluid performance, improving the CCC by 42.6% compared to the conventional pin-fin heat sink. Consequently, it extended battery life by up to 7.6%. Assuming the topology-optimized heat sink is introduced to the EV market in 2026, with an adoption rate increasing by 1% annually, the estimated GHG emission reduction by 2040 is 2.4 MtCO2-eq.
Additionally, the results of the LCC analysis indicated that although the manufacturing cost of the topology-optimized heat sink using a BJT was higher, the extended EV lifespan—resulting from increased battery longevity—outweighed the additional cost. Over the full life cycle, the topology-optimized heat sink reduced total operating costs by 5.3% compared to the pin-fin heat sink.
Furthermore, this study’s quantitative evaluation framework demonstrated its usefulness in assessing the benefits of functional improvements enabled by AM, thereby supporting its broader adoption in industrial applications. Future changes in material costs, carbon intensity, and manufacturing technologies may affect the absolute numerical values presented in this study; however, the comparative framework proposed here remains broadly applicable. This study’s key contribution lies not in the specific numerical outcome under today’s assumptions but in the methodology for evaluating heat sink designs in terms of cooling performance, battery lifetime extension, GHG emissions, and life-cycle cost. As market conditions or technological parameters evolve, the same framework can be applied to re-evaluate design choices under updated assumptions; thus, this study’s analytical approach provides a robust basis for future decision-making in thermal management system design.