Article

Mechanism of Conductivity Attenuation of Cross-Layer Fractures in Sand–Mudstone Interbedded Formation in WZ Oilfield

1
National Key Laboratory of Petroleum Resources and Engineering, China University of Petroleum, Beijing 102249, China
2
Department of Petroleum Engineering, China University of Petroleum (Beijing) at Karamay, Karamay 834000, China
*
Author to whom correspondence should be addressed.
Processes 2026, 14(5), 753; https://doi.org/10.3390/pr14050753
Submission received: 18 January 2026 / Revised: 12 February 2026 / Accepted: 21 February 2026 / Published: 25 February 2026

Abstract

To address the significant decline in fracture conductivity after cross-layer fracturing in the L3 sand–mudstone interbedded reservoir of the WZ Oilfield, which restricts efficient development, this study investigates three typical fracture types formed after fracturing: simple fractures in muddy siltstone, simple fractures in mudstone, and complex fractures in muddy siltstone. Based on downhole full-diameter cores, fracture conductivity plates were prepared, and long-term (50 h) conductivity evaluation experiments were conducted under a simulated formation closure pressure of 28 MPa. The interaction modes between fracture surfaces and proppants, as well as the conductivity evolution laws of different fracture types were systematically analyzed. The results indicate that the interaction modes between proppants and fracture walls vary significantly with lithology and fracture morphology. Specifically, proppant embedment dominates in simple muddy siltstone fractures, whereas hydration-induced embedding and wrapping by swelled clay particles dominate in mudstone fractures. The conductivity evolution of simple fractures in muddy siltstone and mudstone follows an exponential decay law, with attenuation amplitudes of 35% and 98% after 50 h, respectively. Complex fractures in muddy siltstone exhibit a staged decay pattern with an attenuation amplitude of 92%, and their long-term conductivity primarily depends on shear-induced self-support. The overall conductivity of cross-layer fractures is controlled by the minimum conductivity among the intersected layers. Under the specific experimental conditions of 28 MPa closure pressure and 30/50 mesh ceramic proppant, the poor long-term conductivity of mudstone simple fractures (only 2% of the initial value) becomes the key bottleneck restricting productivity. This study characterizes the evolutionary features of conductivity evolution of cross-layer fractures in sand–mudstone interbedded reservoirs and provides theoretical support and engineering guidance for optimizing fracturing fluid systems to inhibit hydration and refining stage isolation strategies in similar reservoirs.

1. Introduction

Sand–mudstone thin interbed reservoirs consist of thick sandstone layers vertically separated by multiple thin mudstone interlayers with thicknesses of 1–3 m, resulting in poor connectivity between individual sand bodies and posing significant challenges to reservoir exploitation [1]. Such thin interbed reservoirs are characterized by numerous vertical pay zones, uneven thicknesses, and well-developed interlayer weak structural planes [2]. Cross-layer fracturing is the primary stimulation technique for thin interbed reservoirs, and the vertical extension height of fractures across multi-lithology thin layers determines the fracturing effect and stimulation magnitude. Therefore, field evaluation of hydraulic fracturing effectiveness mainly relies on fracture geometric parameters (e.g., fracture length and height) [3] and Stimulated Reservoir Volume (SRV) [4]. For formations without microseismical monitoring or fiber optic monitoring, fracturing effects can be evaluated through production performance. However, numerous studies over the past decade have demonstrated that no positive correlation exists between SRV/fracture height and actual productivity in low-permeability, tight, and thin interbed reservoirs [5,6]. Some wells achieve large SRV or considerable fracture height after fracturing but exhibit rapid production decline, short stable production periods, and failure to meet the expected cumulative oil production. This indicates that fracture geometric dimensions cannot fully reflect the fracturing effect [7].
In recent years, scholars have proposed that one of the key indicators for evaluating fracturing effects is the capacity of fractures to maintain long-term stable conductivity. Raterman et al. [8] demonstrated through field and numerical simulation studies that only fractures that are effectively propped and capable of maintaining a certain permeability under production pressure difference and high closure stress can substantially contribute to productivity. Thus, the concept of “effective conductive fracture volume” has been proposed, emphasizing that fracturing effects should be dominated by fracture conductivity rather than geometric dimensions [9]. In deep shale gas development, Wang et al. [10] pointed out that the improvement of single-well Estimated Ultimate Recovery (EUR) depends on the formation and maintenance of high-conductivity channels. Zheng et al. revealed the mechanical mechanisms of proppant entry into branch fractures through three modes (gravity-driven sliding, high-velocity fluid suspension, and fracture structure induction) in the rough fracture networks formed by supercritical CO2 fracturing using Computational Fluid Dynamics–Discrete Element Method (CFD-DEM) coupled simulation [11]. Tong and Mohanty, through laboratory experiments and Dual-Domain Percolation Model (DDPM) numerical simulation, found that proppant migration at fracture intersections exhibits three regions: a fixed sand bed at the bottom, flowing mortar in the middle, and clarified fluid at the top. Increased shear rate reduces the equilibrium sand bed height; small bypass angles (45°) and small-sized proppants are more conducive to distal migration, and the numerical model can effectively capture the characteristics of sand bed formation and migration [12]. Yu et al. verified the impact of uneven proppant distribution in multi-layer fractures on shale gas well productivity based on CMG-IMEX numerical simulation, indicating that matrix permeability is the most sensitive factor. Uneven distribution can lead to a 5–17% difference in ultimate recovery factor, and the negative impact is more significant under conditions such as high initial reservoir pressure and long fracture half-length [13]. While these CFD-DEM and numerical studies provide critical insights into proppant transport and placement, they primarily focus on geometric distribution. There remains a need for experimental verification of how these distribution patterns physically evolve into long-term conductivity under stress, particularly in water-sensitive lithologies. In terms of fracture conductivity and permeability, Wu et al. demonstrated through core experiments that the conductivity of unsupported shale fractures is 2–4 orders of magnitude lower than that of propped fractures. Water-based fracturing fluids reduce conductivity by softening shale and generating fine particles; while amino clay stabilizers can inhibit clay-based fine particles, they have limited effect on non-clay fine particles. Samples with high clay content exhibit stronger stress sensitivity, and cyclic stress can cause an 80% decrease in conductivity [14]. Ye and Ghassemi confirmed through injection-induced shear tests that rough granite fractures can achieve retainable permeability enhancement through dilatant shear slip. Surface roughness affects hydrodynamic responses through protrusion self-propping, and shear-induced protrusion degradation and cuttings generation can impact long-term permeability [15]. Tan et al. systematically clarified the regulatory effects of proppant type, concentration, size, and closure pressure on shale fracture permeability and compressibility through laboratory tests, providing data support for proppant selection and long-term fracture stability [16]. In terms of proppant embedment and damage mechanisms, Li et al. derived analytical models for embedment, deformation, and conductivity applicable to single-layer and multi-layer proppant modes, considering key factors such as closure pressure and elastic modulus. Experimental verification showed that the accuracy of these models is superior to existing ones, providing theoretical support for proppant selection and conductivity improvement [17]. Ahamed et al. summarized the main mechanisms of proppant damage in hydraulic fracturing of coalbed reservoirs (embedment, crushing, fine particle migration and plugging, chemical corrosion, etc.), analyzed influencing factors such as reservoir and proppant properties, and fracturing fluid type, reviewed the progress of damage evaluation and prevention technologies, and pointed out research gaps and future directions [18]. These studies have revealed the interaction laws between proppants, fractures, and reservoirs in hydraulic fracturing from multiple dimensions, providing comprehensive theoretical and experimental support for the optimization of fracturing parameters, proppant selection, and improvement of fracturing effects.
Traditional conductivity experiments are conducted in accordance with standards “API RP 19D” specified by the American Petroleum Institute (API) [19]. Typically, proppants are placed between two smooth conductivity plates to evaluate fracture conductivity. While this experimental method can reflect real field conditions for evaluating the conductivity evolution of simple tension-dominated fractures, it fails to accurately capture the true conductivity characteristics of non-planar fractures formed by tensile–shear coupling [20]. However, for the specific lamina-type fractures in thin interbed reservoirs investigated in this paper, the applicability of these standard methods is limited. The influence mechanism of fracture morphology on proppant migration is multifaceted. Studies have shown that the propagation path of hydraulic fractures is jointly determined by the in situ stress difference and interlayer interfaces, with the interlayer interface strength governing the relative importance of these two factors [21]. When the interlayer interface strength is low, its ability to trap hydraulic fractures is enhanced, leading to the formation of complex fracture networks with diversion–cross-layer interconnections through the interaction between hydraulic fractures and interlayer interfaces [22]. Proppants are usually difficult to enter such fractures [23], and fracture conductivity mainly relies on shear self-propping [24]. When the interlayer interface strength is high, simple-shaped cross-layer fractures can be generated under the strong constraint of the in situ stress difference, resulting in an optimal cross-layer effect and ideal proppant placement [25]. However, the SRV in this case may be smaller than that of complex fracture networks.
To address the challenge of evaluating cross-layer fractures in lamina-type sand–mudstone thin interbed reservoirs, this study aims to characterize the conductivity evolution mechanisms of simple fractures in argillaceous siltstone and mudstone layers. Furthermore, it seeks to elucidate the impact of complex fracture morphologies at laminae on long-term flow capacity.

2. Geological Backgrounds

The WZ Oilfield in the South China Sea, as an important offshore oil and gas production area, is characterized by reservoirs with sand–mud interbedding, strong heterogeneity, and large interlayer stress differences [26]. To connect these discrete sand bodies for efficient development, cross-layer fracturing has been carried out in the early stage. The efficient development of the sand–mud thin interbed reservoir in L3 is confronted with specific challenges: Firstly, the interlayer stress difference leads to large vertical differences in fracture width; although mudstone interlayers are penetrated by hydraulic fractures, they are at a high risk of closure [27]. Secondly, well-developed laminas affect the fracture propagation path and morphology, making the evolution mechanism of conductivity more complex [28]. Finally, the strong reservoir heterogeneity results in uneven proppant distribution, which affects long-term conductivity [29].
Under the comprehensive influence of long-term closure stress, rock creep, proppant embedment and crushing, and fluid–rock interaction, fractures will gradually close, leading to a significant decrease in conductivity. Due to the alternating lithology and significant differences in mechanical properties of the sand–mud thin interbed reservoir in Member L3, the fracture morphology after fracturing is complex, and its closure behavior is essentially different from that of single lithology reservoirs. Therefore, targeted research is urgently required. In the early stage, rock mechanics tests have been conducted (Table 1). While these data are derived from the key appraisal well W1, due to the fact that hydraulic fracturing in the area is still in the experimental stage, there is only one core drilling well, and the rock samples selected are considered to be representative based on core observations. Notably, the lower elastic modulus of mudstone (approx. 10–14 GPa) compared to siltstone (approx. 17 GPa) indicates a lower resistance to proppant embedment, which quantitatively accelerates conductivity loss.
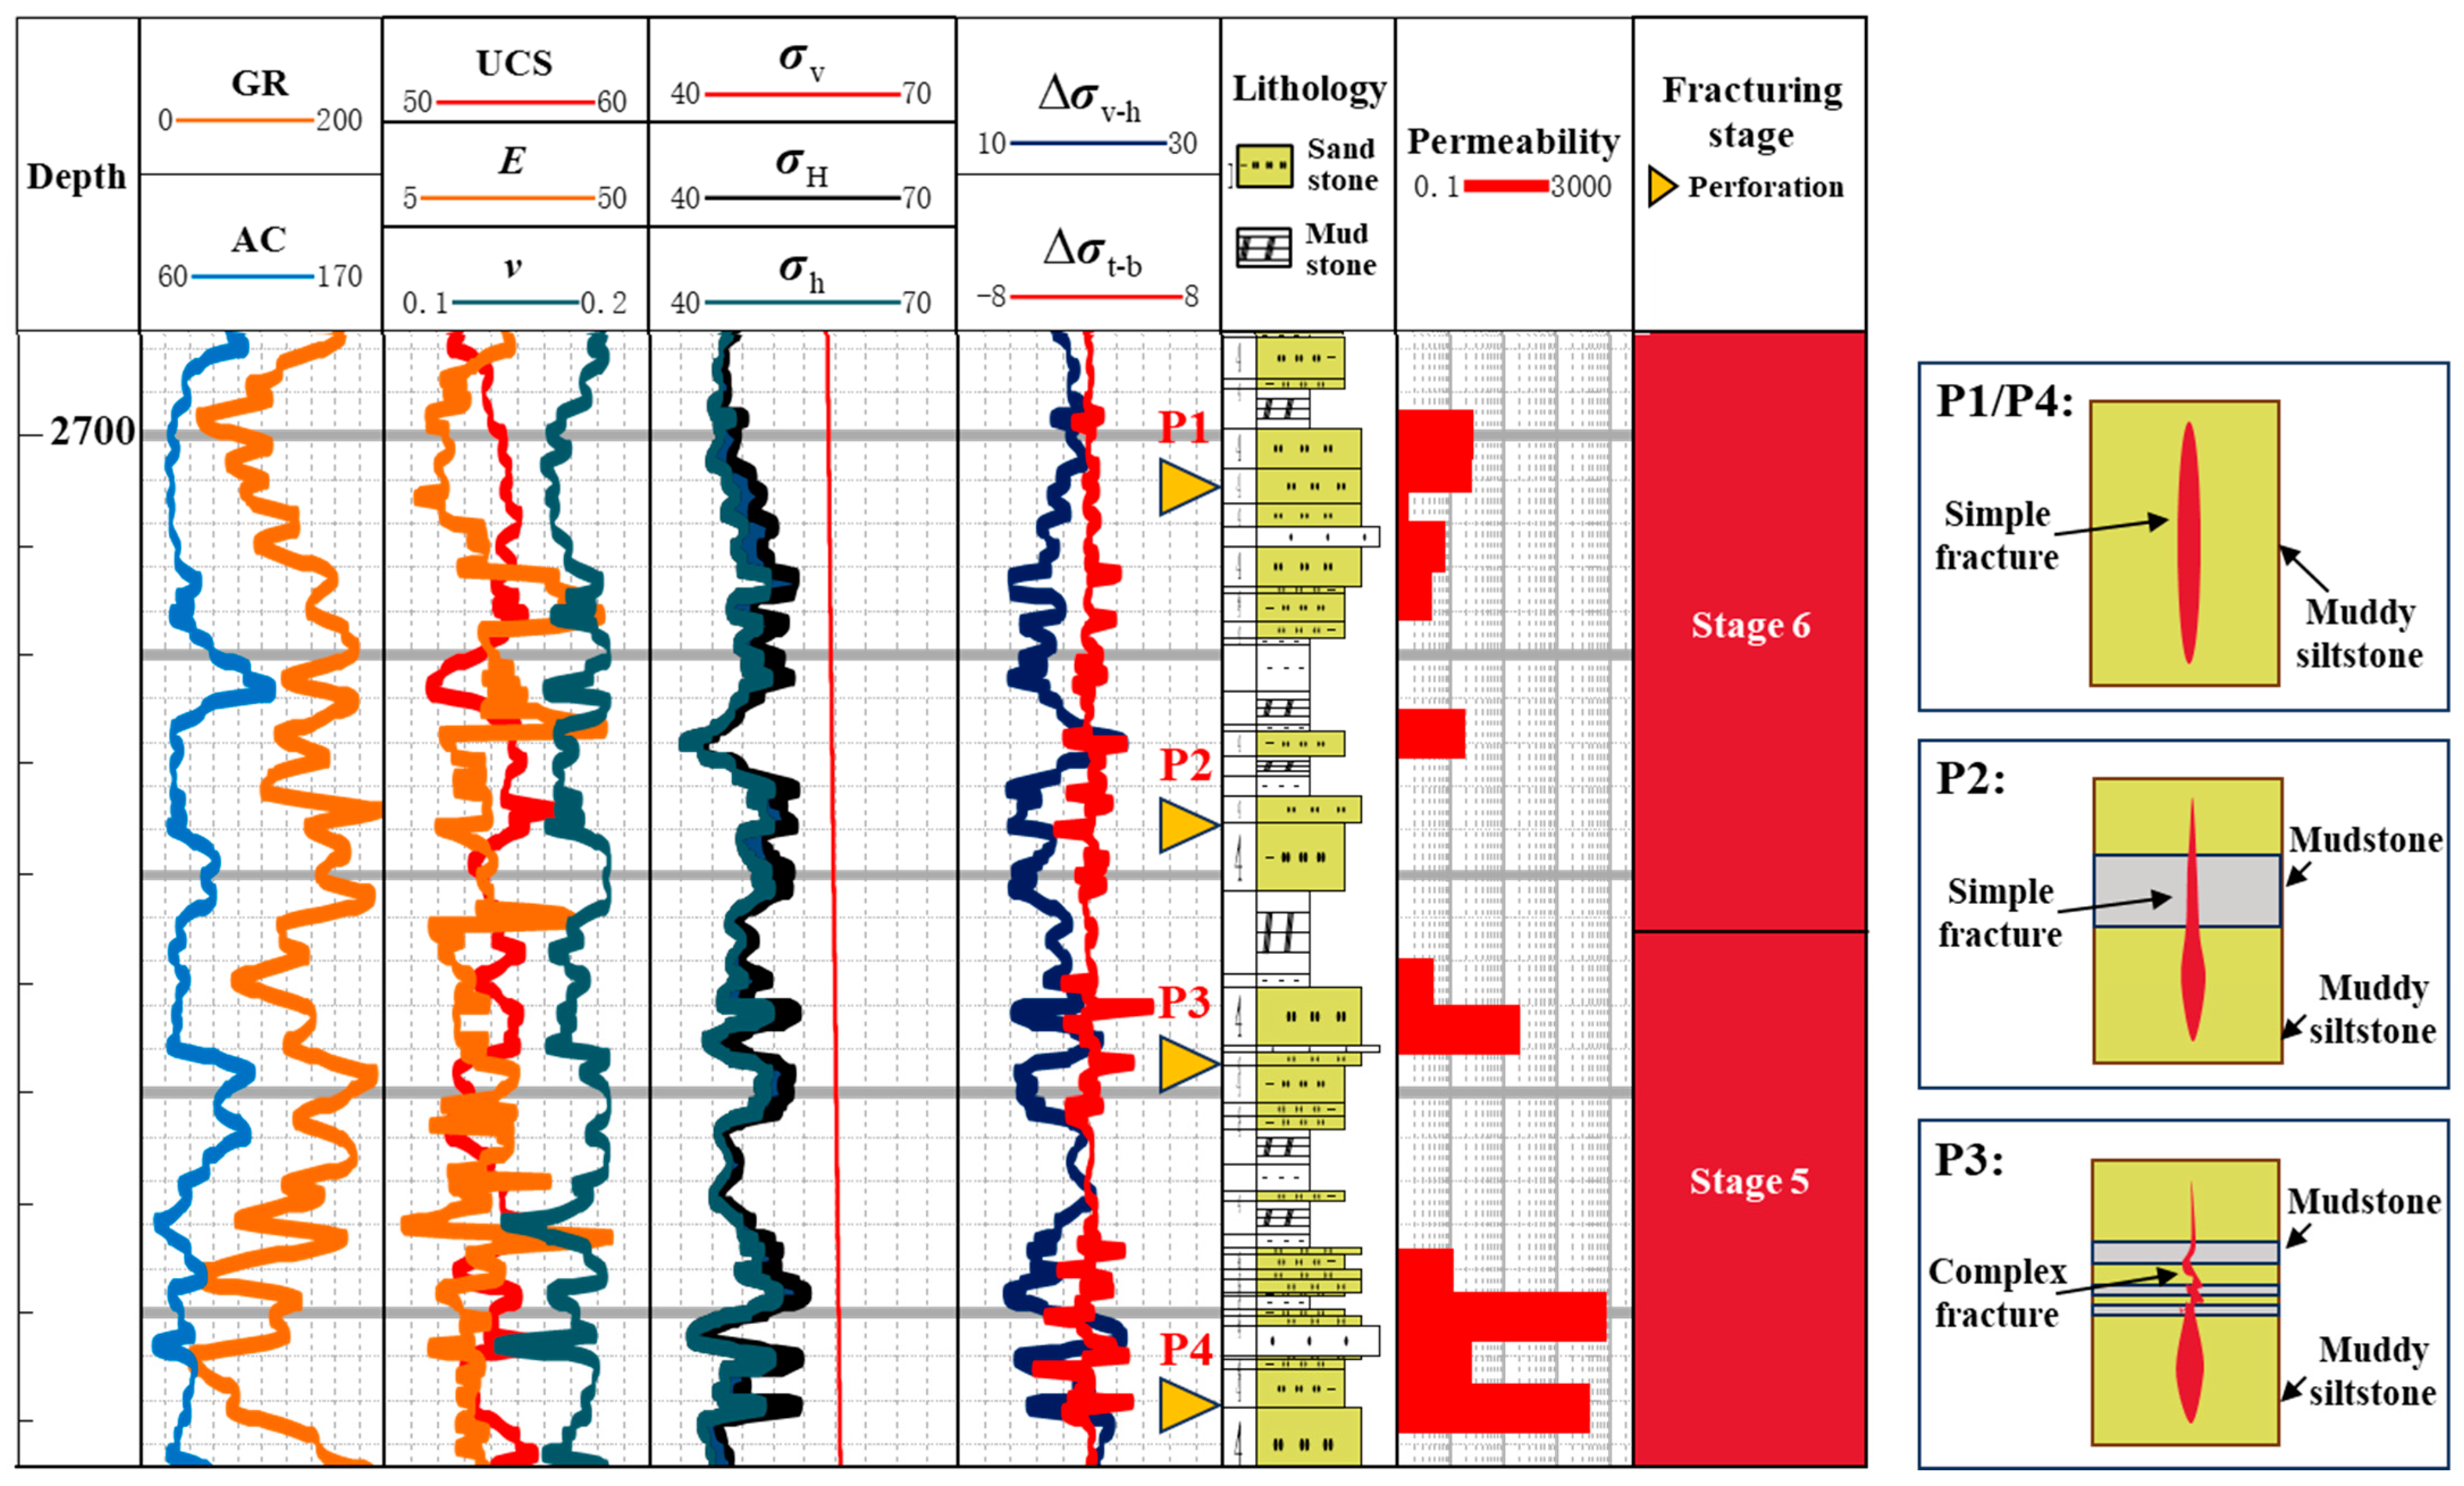
The stratigraphic profile of Member L3 is shown in Figure 1. In this well block, six-stage fracturing has been implemented with highly deviated wells. To clarify the evolution law of fracture conductivity after fracturing, Stages 5–6 were selected as the research targets. Fractures are classified into three types according to the sequence and characteristics of hydrocarbon flow from the formation to the production wellbore during production, namely simple fractures in muddy siltstone, simple fractures in mudstone, and complex fractures in muddy siltstone. In the figure, Δσvh represents the horizontal stress difference with the unit of MPa. Δσtb represents the interlayer stress difference with the unit of MPa. Other logging curves are common and thus no separate explanation is provided.
The fractures at positions P1 and P4 in the figure are identified as simple fractures in muddy siltstone, and their conductivity remains solely dependent on the muddy siltstone. In contrast, the conductivity of cross-layer fractures in thin interbeds exhibits specific characteristics. Taking the fracture at P2 as an example, hydrocarbons in the upper reservoir are required to flow into the wellbore through hydraulic fractures that have penetrated mudstone interlayers. In this case, the actual conductivity is determined by the conductivity of fractures in the mudstone interval. Therefore, the clarification of the conductivity of simple fractures in mudstone is deemed crucial.
More specifically, the complex fractures in muddy siltstone represented by the fracture at P3 are characterized by high morphological complexity due to the influence of ultra-thin mudstone laminas (1–5 cm) and are observed to propagate tortuously in the vertical direction. It has been indicated in existing studies that proppants are difficult to introduce into such fractures and effective propping cannot be formed, leading to a more complex evolution mode of their conductivity.

3. Long-Term Fracture Conductivity Evaluation Experiment

3.1. Experimental Equipment and Procedures

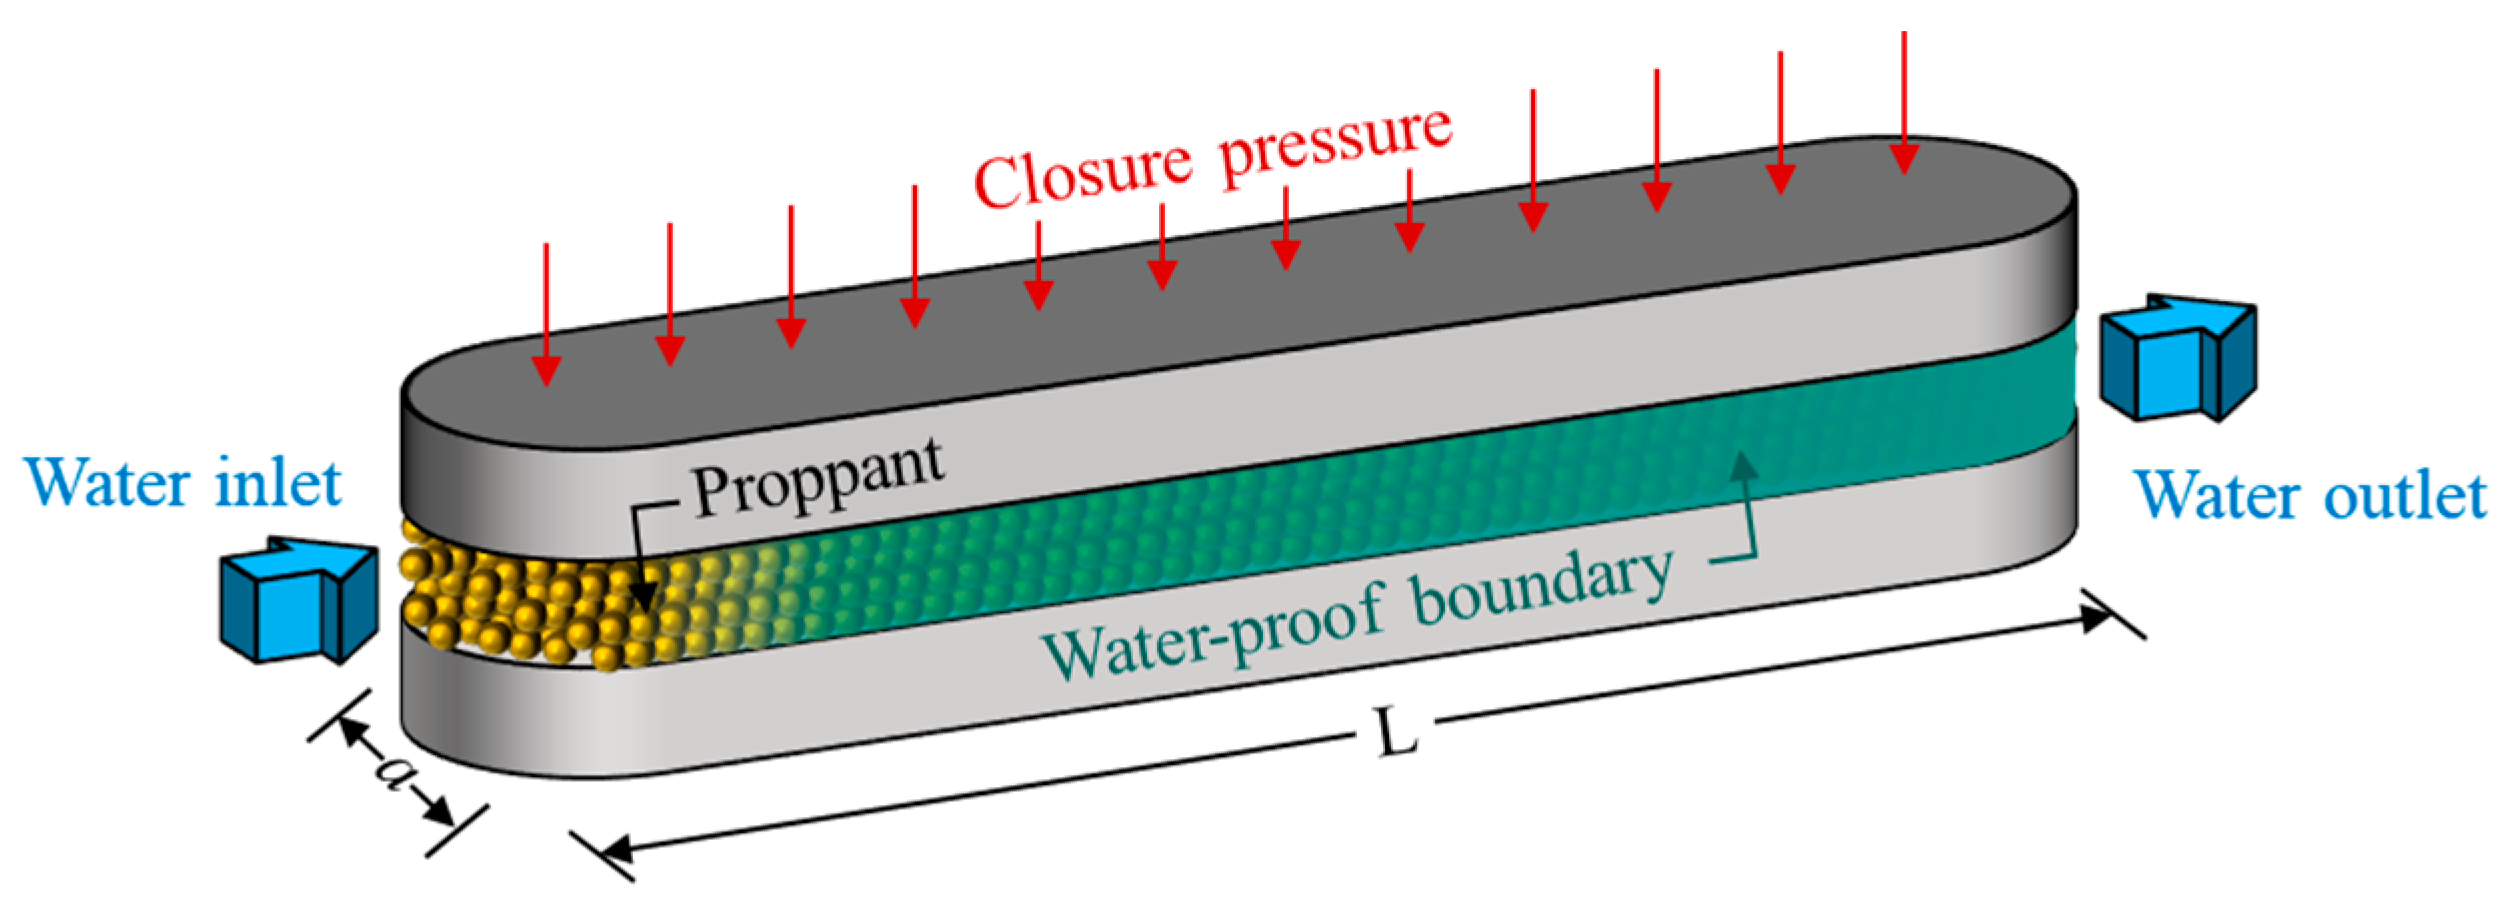
The laboratory evaluation of fracture conductivity is based on Darcy’s law. By simulating the real stress environment of the formation, the attenuation law of fracture conductivity over time is quantitatively evaluated. During the experiment, the experimental proppant placement thickness is set according to the on-site proppant concentration, and then a certain closure pressure is applied to carry out the experiment, as shown in Figure 2.
The long-term proppant conductivity experiment is recognized as an important method that is employed to evaluate the capacity of proppant packs to maintain fracture flow channels after hydraulic fracturing. The definition of proppant conductivity is as follows:
F c   =   k f   ×   w f
where k f   is the permeability of the fracture filled with proppant, in square meters (m2), and w f   is the fracture width, in meters (m).
The experiment was conducted using the FCS-842 Fracture Conductivity Test System, and the apparatus was developed in accordance with API standards. By simulating the temperature and pressure conditions of fluid flow in the formation during hydraulic fracturing operations, the fracture conductivity under different closure pressures was determined. The maximum experimental temperature was 177 °C, the maximum closure pressure was 137 MPa, and the maximum fluid injection rate was 50 mL/min. The placement area of proppants in the conductivity cell was 64.5 cm2, with a length of 18.8 cm and a width of 3.8 cm. The distance between pressure measuring ports was 12.7 cm, and the maximum load capacity was 667 kN. This system can accurately simulate the fracture closure pressure of 28 MPa for the L3 formation interval. The conductivity can be calculated by substituting the actual dimensions of the conductivity cell into the following formula:
F c   =   5.411 × 10 4 Q μ Δ P
where Q refers to the stable fluid flow rate, in cubic meters per second (m3/s); μ denotes the fluid viscosity, mPa’s; and ΔP stands for the pressure difference in the fluid between the inlet and outlet of the conductivity cell, Pa.

3.2. Preparation of Experimental Samples

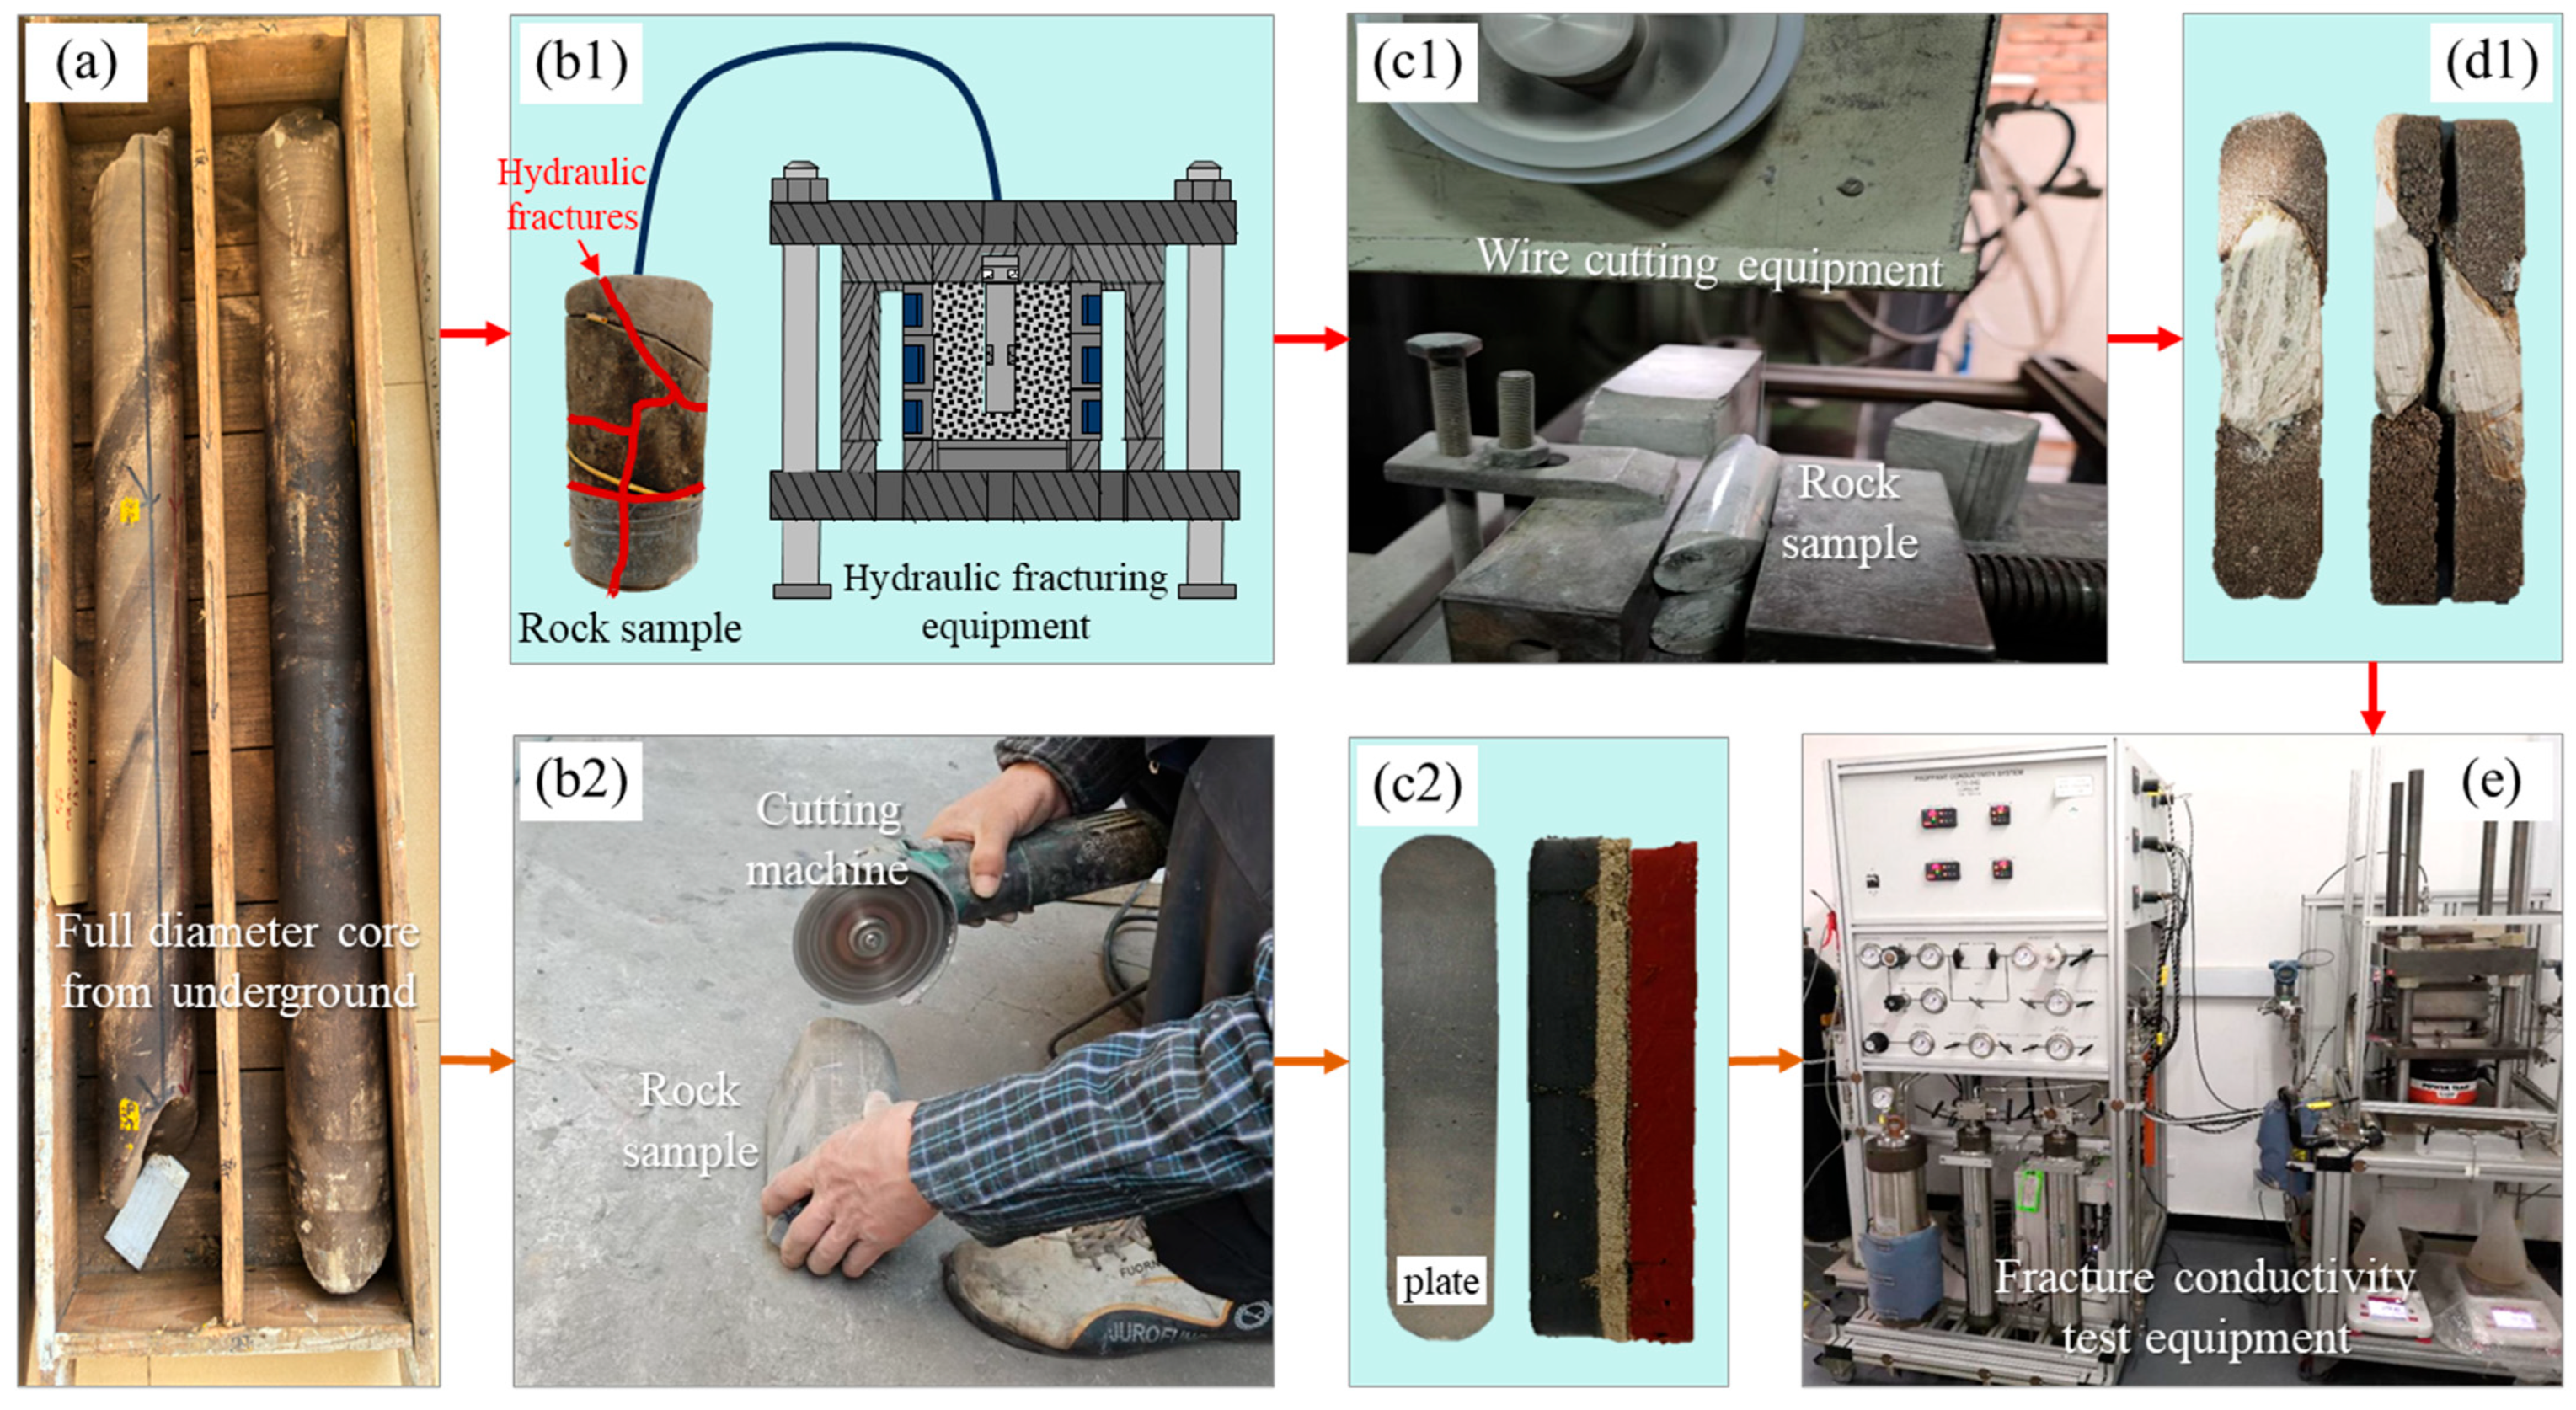
To investigate the differences in conductivity between two types of fracture morphologies, namely simple cross-layer fractures and complex shear fractures, two types of conductivity plate samples were employed to conduct the experiments. Both groups of experimental samples were prepared from downhole full-diameter cores. Specifically, the conductivity plate samples for simulating simple fractures were directly cut from full-diameter cores into two rock plates with dimensions of 178 × 38 × 15 mm (Figure 3b2). In particular, the preparation process of conductivity plate samples for simulating complex fractures was more complex. First, physical simulation of hydraulic fracturing was carried out on the full-diameter cores, and complex stair-like hydraulic fractures were observed at the laminae (Figure 3b1). To preserve the fracture characteristics at this location, the fractured surface was cut and extracted by wire cutting technology (Figure 3c1). Subsequently, concrete casting was performed in a custom-made mold to form rock plates with dimensions of 178 × 38 × 15 mm (Figure 3d1). Finally, conductivity tests were conducted on both types of rock plates under the closure pressure and proppant thickness that simulated the formation conditions (Figure 3e).
It should be noted that due to the early development stage of the WZ block, downhole cores were exclusively obtained from the single-fractured well (W1). Given the scarcity of full-diameter core resources and the necessity to allocate samples for a broad spectrum of petrophysical and geomechanical characterizations, the core quantity was insufficient for multi-run repeatability tests. To ensure experimental representativeness under these constraints, we performed a rigorous manual screening of the available cores, selecting samples that most typically exhibited the lithological and mechanical characteristics of the L3 formation’s argillaceous siltstone and mudstone layers.

3.3. Experiment Parameters

The 30/50 mesh ceramic proppant completely consistent with that used in the field was employed in the experiment, and the tests were conducted at room temperature to simulate the field proppant concentration of 20 kg/m2. First, the prepared conductivity plates were installed into the conductivity cell, and the proppant was uniformly placed. Then, the conductivity cell was mounted on the press, the pipelines were connected properly, and a closure pressure of 28 MPa was applied, which corresponds to the calculated effective closure stress of the L3 formation reservoir depth. After the closure pressure stabilized, fluid injection was initiated at a constant rate of 3 mL/min, and the test data were recorded simultaneously. The test duration was set to 50 h to capture long-term conductivity evolution, as preliminary tests indicated that the rate of conductivity decline stabilizes and becomes negligible beyond this timeframe for these lithologies.
Three groups of samples used in the experiment are illustrated in Figure 4. Among them, sample No. 1 was designed to simulate simple fractures in argillaceous siltstone, which contained five strips with a width of approximately 20 mm separated by laminae; the dark strips had high argillaceous content while the light strips had low argillaceous content (marked by the white dashed box in Figure 4a). Sample No. 2 was fabricated to simulate complex fractures in argillaceous siltstone, and the parts circled in red represented the stepped complex fractures generated by the interaction between hydraulic fractures and laminae at the lamina position extracted from the fractured full-diameter core. The lower diagram in Figure 4b showed the surface scanning image of such complex fractures, where the color depth indicated the height of the fracture surface; the fracture surface exhibited a vertical fluctuation of 10 mm, which increased the complexity of fracture conductivity. Sample No. 3 was prepared to simulate simple fractures in mudstone, which contained four natural fractures that were not fully opened or penetrated (marked by the white dashed lines in Figure 4c).
The experimental parameters employed are listed in Table 2. Sample 1# and sample 2# were designed to simulate the simple fracture morphologies of argillaceous siltstone and mudstone, respectively. Based on the field understanding of hydraulic fracturing in the L3 Oilfield, a 1.2 cm-thick layer of ceramic proppant with a particle size of 30/50 mesh was placed between the conductivity plates. In complex tortuous fractures, most proppants cannot enter the fractures [23]. For sample 3#, to simulate the evolution characteristics of conductivity of complex fractures induced by formation shear failure, only a 0.2 cm-thick (only one layer of ceramic proppant) proppant layer was placed to qualitatively represent this condition.

4. Analysis and Discussion of Experimental Results

4.1. Interaction Modes Between Fracture Walls and Proppants

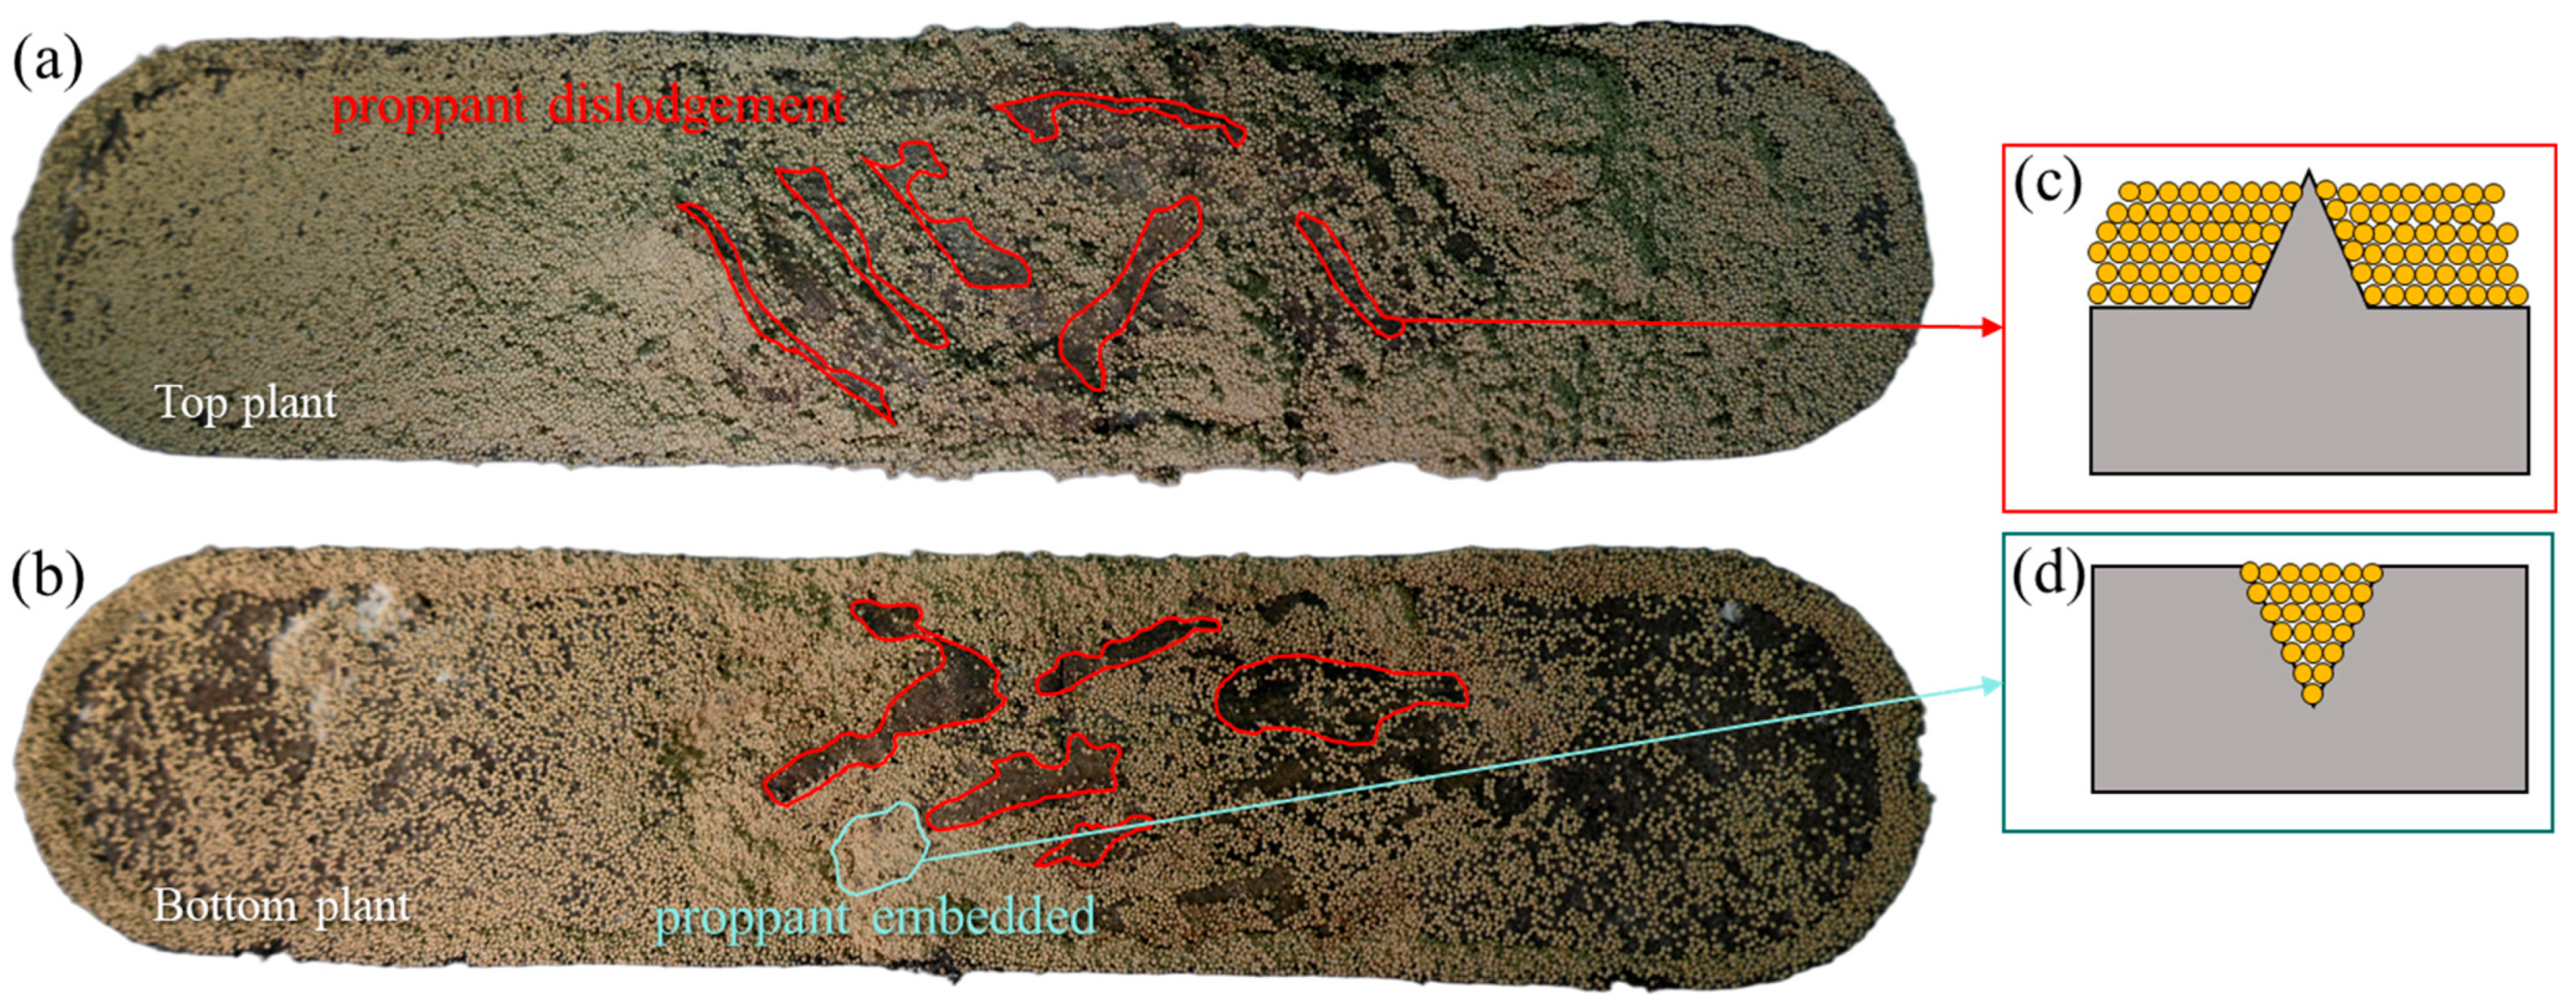
The morphology of the bottom rock plate of sample 1# argillaceous siltstone after the experiment is presented in Figure 5. Distinct zoning was observed on the fracture walls, which was classified into three types according to the interaction modes between proppants and fracture surfaces, namely proppant crushing, proppant dislodgement, and proppant embedment into the wall. In the area delineated by the yellow box in the figure, the proppants were crushed by the fracture surfaces under closure stress and embedded into the rock plate surface. This area was characterized by white strips with relatively low argillaceous content before the experiment, indicating that it had high hardness and the proppants in this area endured relatively greater external forces during fracture closure. In the area circled by the red dashed line in the figure, the proppants were arranged loosely and shed after the experiment. Before the experiment, this area was featured by black strips with relatively high argillaceous content. A large number of clay particles were present on the surface after the experiment, indicating that significant hydration occurred in this area during the experiment. The particles shed after clay swelling exerted a buffering effect on the contact between proppants and fracture walls, thus preventing the proppants from being crushed during fracture closure. Meanwhile, the shed clay particles would migrate slowly with the fluid, avoiding the embedment of proppants into the fracture walls in this area. In actual field proppant placement, the proppant particles in such fractures will be scoured and migrated away with the extension of production time, making it difficult to form effective propping. As a result, this area becomes a bottleneck for oil and gas migration in the entire fracture, leading to a poor propping effect. In the area delineated by the black box in the figure, the proppants were embedded into the fracture walls. Before the experiment, this area was also characterized by white strips with relatively low argillaceous content, but unlike the yellow area, the proppants in this area were embedded under pressure rather than being crushed.
Figure 6 shows the schematic diagrams of sample 1# before and after the experiment. Figure 6a is the schematic diagram of the conductivity plate prior to the experiment, where the proppants can be approximately regarded as uniformly distributed. Owing to the heterogeneity of the argillaceous siltstone plate, the argillaceous content varies across the bottom plate. After the experiment was initiated, under the effect of the fluid pressure gradient, the pressure at the inlet of the proppant placement layer was higher, which caused the closure stress actually borne by the proppants at the inlet to be greater than that at the outlet. Accordingly, a gradient in the solid stress field was generated, leading to non-uniform proppant embedment and crushing along the flow path. This resulted in the apparent tilting characteristics of the conductivity plate (Figure 6b).
The morphology of the bottom rock plate of sample 2# mudstone after the experiment is presented in Figure 7. Proppant embedment was observed across the entire surface of the conductivity plate in the figure. Further observation revealed that severe hydration occurred on the fracture surface. The visual observation of extensive clay swelling and paste-like particle shedding (Figure 7) provides macro-scale evidence of the mineralogical instability described in clay hydration literature (e.g., montmorillonite expansion), confirming that chemical interaction is the primary driver of the 98% conductivity loss. The proppants were embedded in the clay particle layer after hydration and swelling, and the clay particles completely filled the 1–3 proppant layers adjacent to the fracture wall.
The morphology of the argillaceous siltstone plate of sample 3# (simulating the complex fracture morphology) after the experiment is shown in Figure 8a,b. A highly non-uniform distribution of proppants was observed after the experiment. No proppants were distributed at the protrusions on the fracture surface (circled in red in the figure), as presented in Figure 8c. However, self-propping was formed at these protrusions, and a certain degree of conductivity was still retained. The concave areas were filled with multiple layers of proppants; after the experiment, it was observed that the proppants in these areas combined with clay particles to form agglomerates.

4.2. Evolution Law of Fracture Conductivity for Different Lithologies

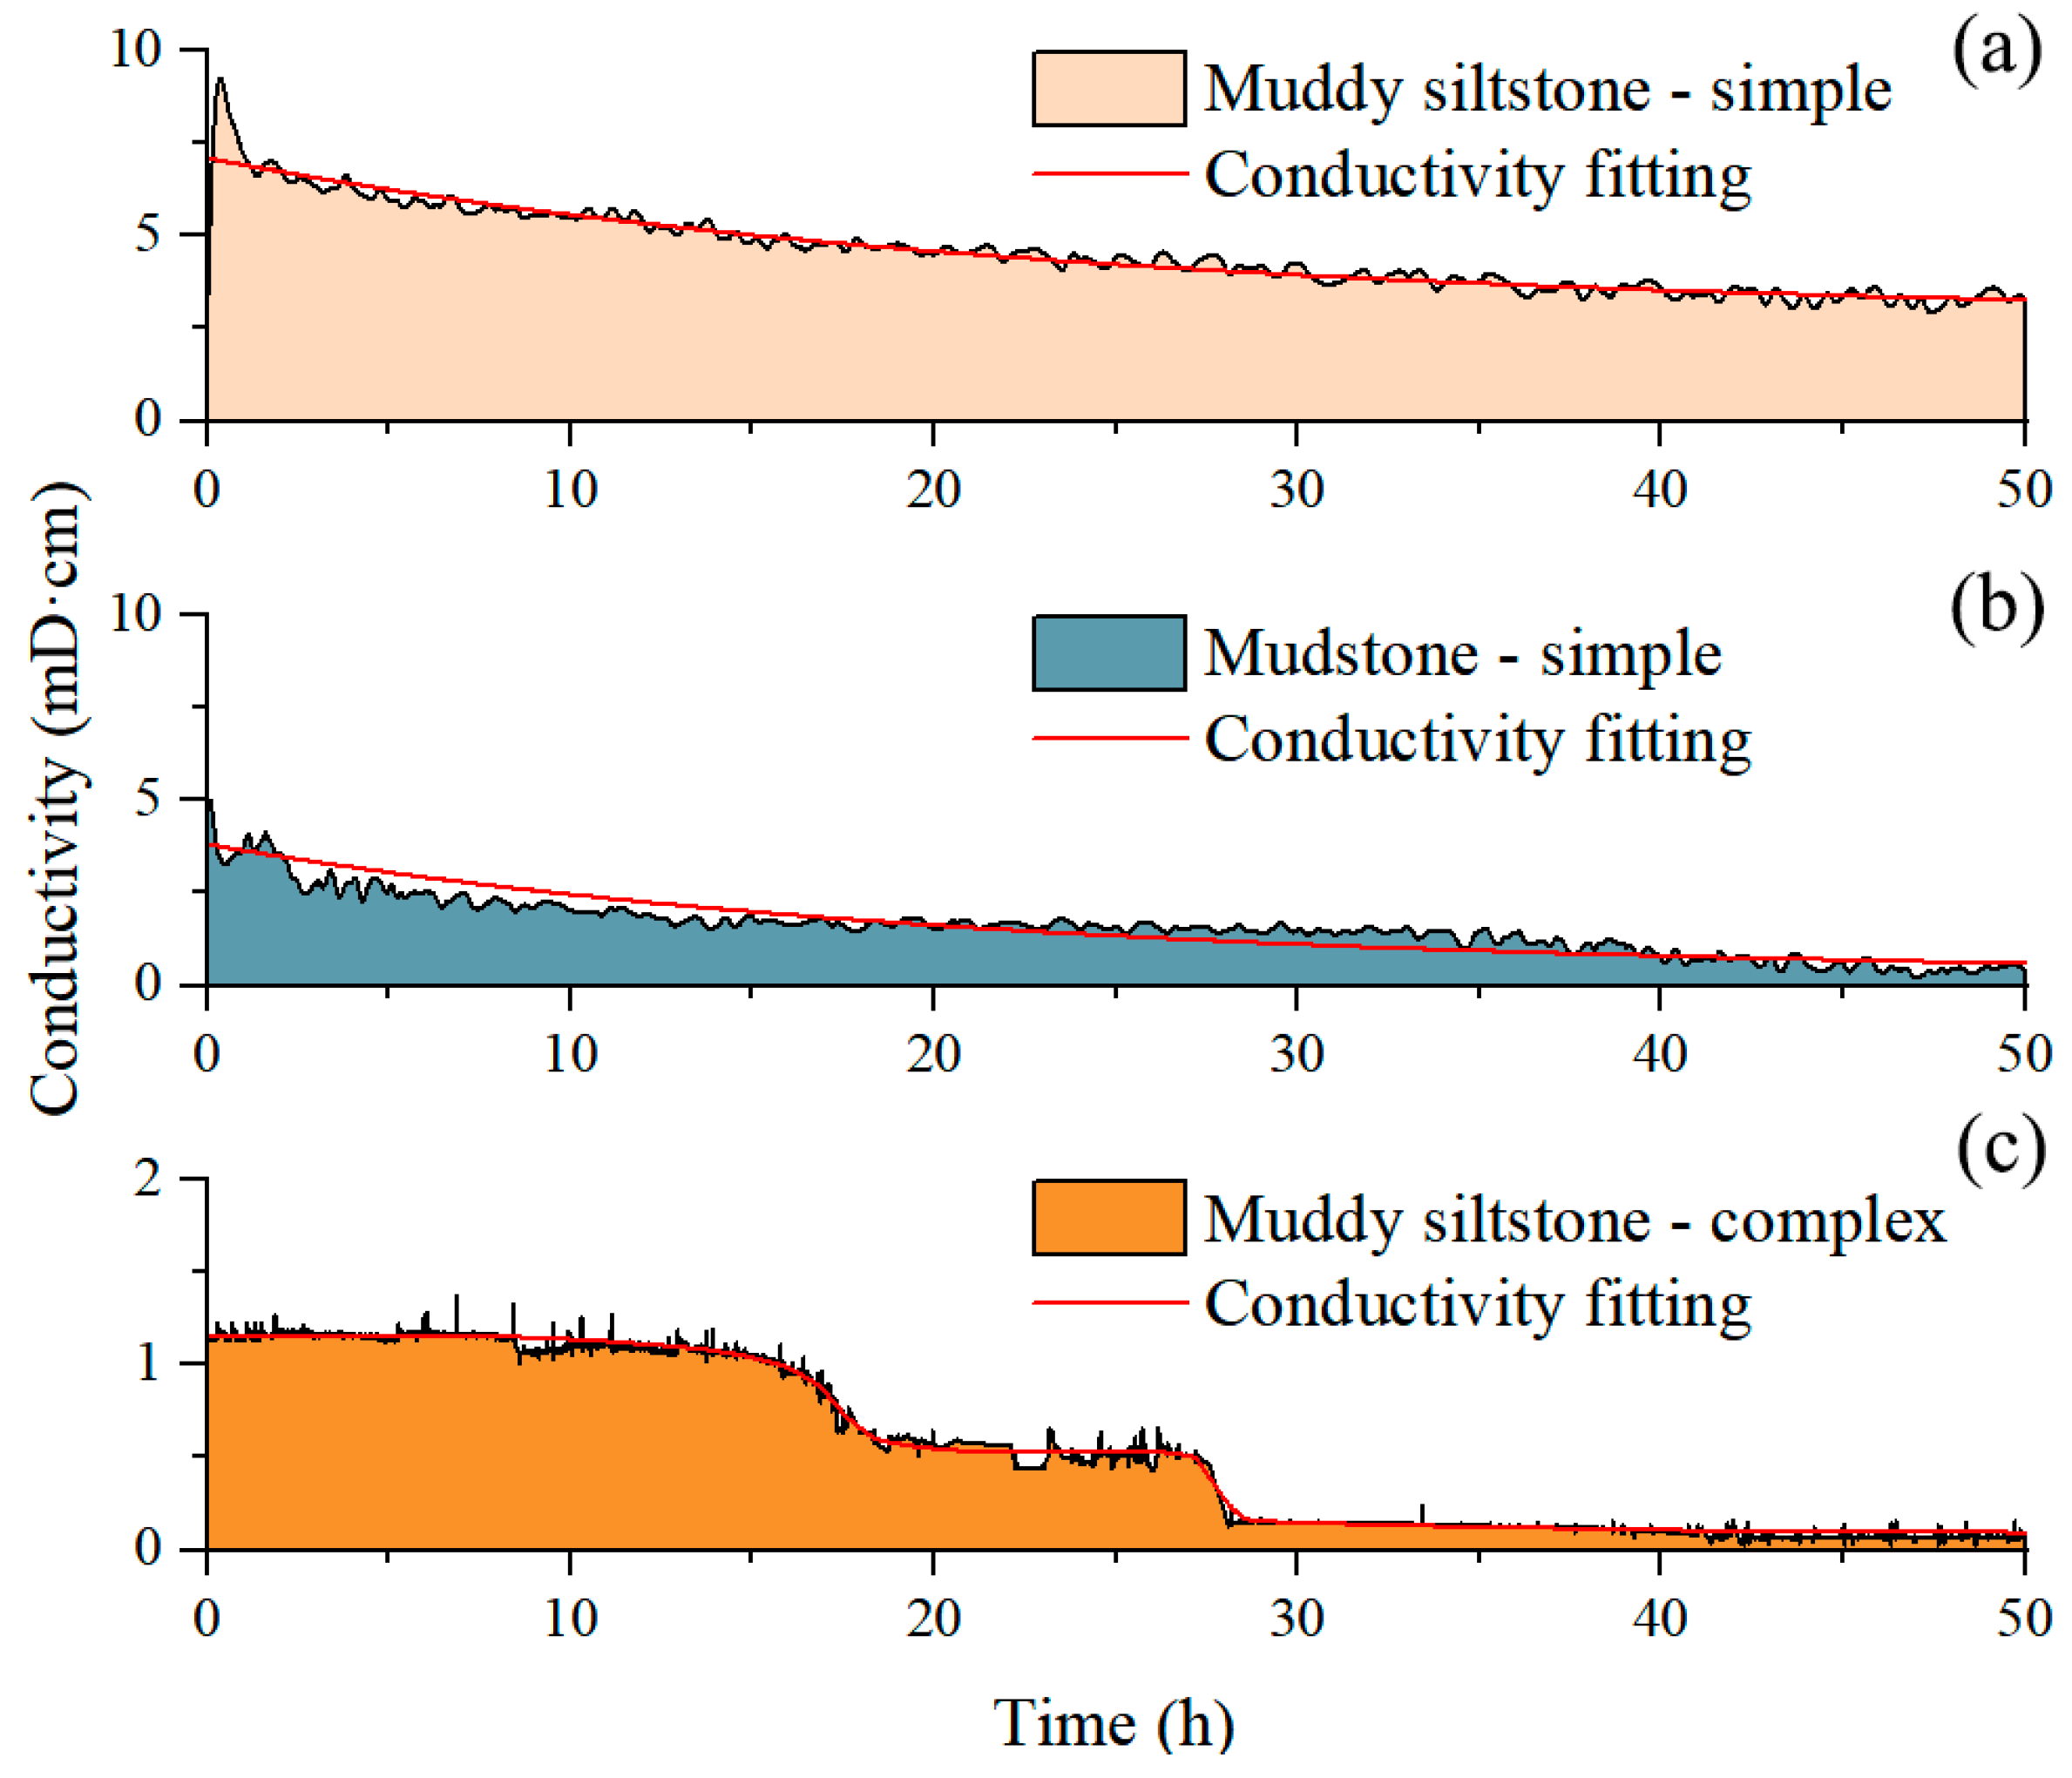
The conductivity of simple fractures in argillaceous siltstone is presented in Figure 9a. The initial conductivity was 4.31 mD·cm, and it decayed exponentially with time. After 50 h, the conductivity decreased to 2.78 mD·cm and remained relatively stable, corresponding to a decay rate of 35%, which indicated that the fracture conductivity was well maintained. The conductivity of simple fractures in mudstone is shown in Figure 9b. The initial conductivity was 3.51 mD·cm, and it exhibited an exponential decay trend over time. After 50 h, the conductivity dropped to 0.05 mD·cm, with a total decay rate of 98%. The hydration of mudstone severely restricts the productivity of sandstones in the non-perforated intervals of thin interbed reservoirs. The conductivity of complex fractures in argillaceous siltstone is illustrated in Figure 9c. The initial conductivity was 1.16 mD·cm, and it decreased to 0.09 mD·cm after 50 h, representing a decay rate of 92%. Unlike simple fractures, the conductivity of complex fractures showed a stage-wise attenuation characteristic. The underlying mechanism is that self-propping was formed at the protruding fractures, which then failed under the combined effects of sustained closure pressure and strength weakening induced by hydration, thus forming new propping contacts. The reduction in fracture height at this stage resulted in the decrease in conductivity. This process repeated multiple times during the experiment, leading to the unique stage-wise attenuation characteristic of fracture conductivity.

4.3. Evolution Law of Conductivity for Different Lithologies

An exponential function was employed to fit the time-dependent attenuation characteristics of conductivity of sample 1# and sample 2# under the simple fracture morphology, as expressed in Equation (3):
F c , t = F c 0   e α t + F c
where Fc,t is the fracture conductivity at time t, in mD·cm; Fc0 is the initial conductivity, in mD·cm; α is the conductivity attenuation coefficient, dimensionless; t is the attenuation time, in h; and Fc is the remaining conductivity, which reflects the long-term conductivity of fractures after attenuation, in mD·cm. The time-dependent attenuation characteristics of conductivity of sample 1# and sample 2# were fitted separately, and the fitting results are presented in Table 3. When comparing the remaining conductivity, the order is determined as follows: simple fractures in argillaceous siltstone > simple fractures in mudstone > complex fractures in argillaceous siltstone. With respect to the attenuation coefficient, under the exponential attenuation characteristic of conductivity, the initial conductivity of simple fractures in mudstone was 81% of that of simple fractures in argillaceous siltstone; after 50 h, its remaining conductivity accounted for only 3% of the initial value. Nevertheless, the attenuation coefficient of simple fractures in mudstone was merely 10% higher than that of simple fractures in argillaceous siltstone. This phenomenon reflects that the initial conductivity and attenuation coefficient exert a crucial impact on the long-term conductivity of fractures.
It is noteworthy that although the total conductivity attenuation of mudstone fractures (98%) is significantly higher than that of argillaceous siltstone fractures (35%), the attenuation coefficient of mudstone is only approximately 10% higher (0.0486 vs. 0.0438). This phenomenon indicates that the magnitude of conductivity loss is primarily governed by the remaining conductivity (which approaches zero for mudstone due to severe hydration-induced embedment and plugging, whereas siltstone retains a high stable conductivity) and initial conductivity. However, limited by the scarcity of full-diameter core samples in this study, the specific geological and mechanical factors controlling the attenuation rate (e.g., elastic modulus or creep viscosity) have not yet been quantitatively identified, which warrants further investigation with larger sample sizes.

5. Discussion

The overall conductivity of cross-layer fractures is determined by the minimum conductivity of different intervals. This follows the principle of series flow in layered reservoirs, where the effective vertical permeability is controlled by the harmonic mean of individual layer permeabilities. Since the fluid must pass through the lower-conductivity mudstone barrier to reach the wellbore, the system is throttled by this “weakest link” [30]. In comparison with the conductivity test results of sample 1# argillaceous siltstone, the results of sample 2# mudstone fractures indicate that the conductivity of cross-layer fractures in sand–mudstone thin interbed reservoirs consists of two components. The productivity at the perforation target zones depends on the conductivity of the argillaceous siltstone intervals, where the long-term conductivity retains 65% of the initial value, capable of providing high-speed migration channels for oil and gas over an extended period.
For argillaceous siltstone reservoirs separated by mudstone interlayers, oil and gas migrate through cross-layer fractures and must pass through the penetrated mudstone layers. At this point, the factor governing fracture conductivity is the conductivity of the mudstone layers, which exhibits poor long-term retention with the long-term conductivity accounting for merely 2% of the initial value, failing to form effective propping. It is thus necessary to adopt engineering measures to inhibit mudstone hydration and prevent fracture closure. It should be noted that these experiments were conducted at room temperature. In the actual reservoir environment (approx. 120 °C), thermal effects would likely accelerate mudstone hydration and rock creep. Therefore, the significant conductivity loss observed in mudstone (98% reduction) represents a conservative estimate; actual downhole attenuation could be even more rapid.
For more complex fracture morphologies formed by tensile–shear coupling effects, proppants are difficult to accumulate and place effectively. Based on the analysis of the interaction morphology between fracture surfaces and proppants after the experiment, the conductivity of such fractures is mainly derived from the shear self-propping formed by fracture dislocation. The primary reason is that the lateral displacement of protrusions on fracture surfaces prevents proper interlocking with their original matching fracture surfaces. Consequently, the conductivity of such fractures is lower than that of proppant-supported fractures, with the long-term conductivity retaining only 8% of the initial value and relying primarily on fracture shear self-propping. For formations prone to developing complex fracture morphologies, rational division of fracturing stages and clusters should be implemented, and large-scale fracture networks should be formed through fracturing operations. These intervals should be treated as independent fracturing stages to maximize oil and gas production before fracture closure.

6. Field Application

Well W1 is a fractured well located in the WZ Oilfield; its primary pay zone is the L3 interval investigated in this study, and the cores used in the experiments were also collected from this well. This well is a highly deviated well with six fracturing stages implemented in total, and all the fracturing target zones were positioned in the argillaceous siltstone layers. After fracturing, fracture height was evaluated via microseismic monitoring; the fracture height ranged from 36 m to 45 m and the fracture half-length varied from 120 m to 150 m, which satisfied the fracture height requirement for penetrating the mudstone interlayers.
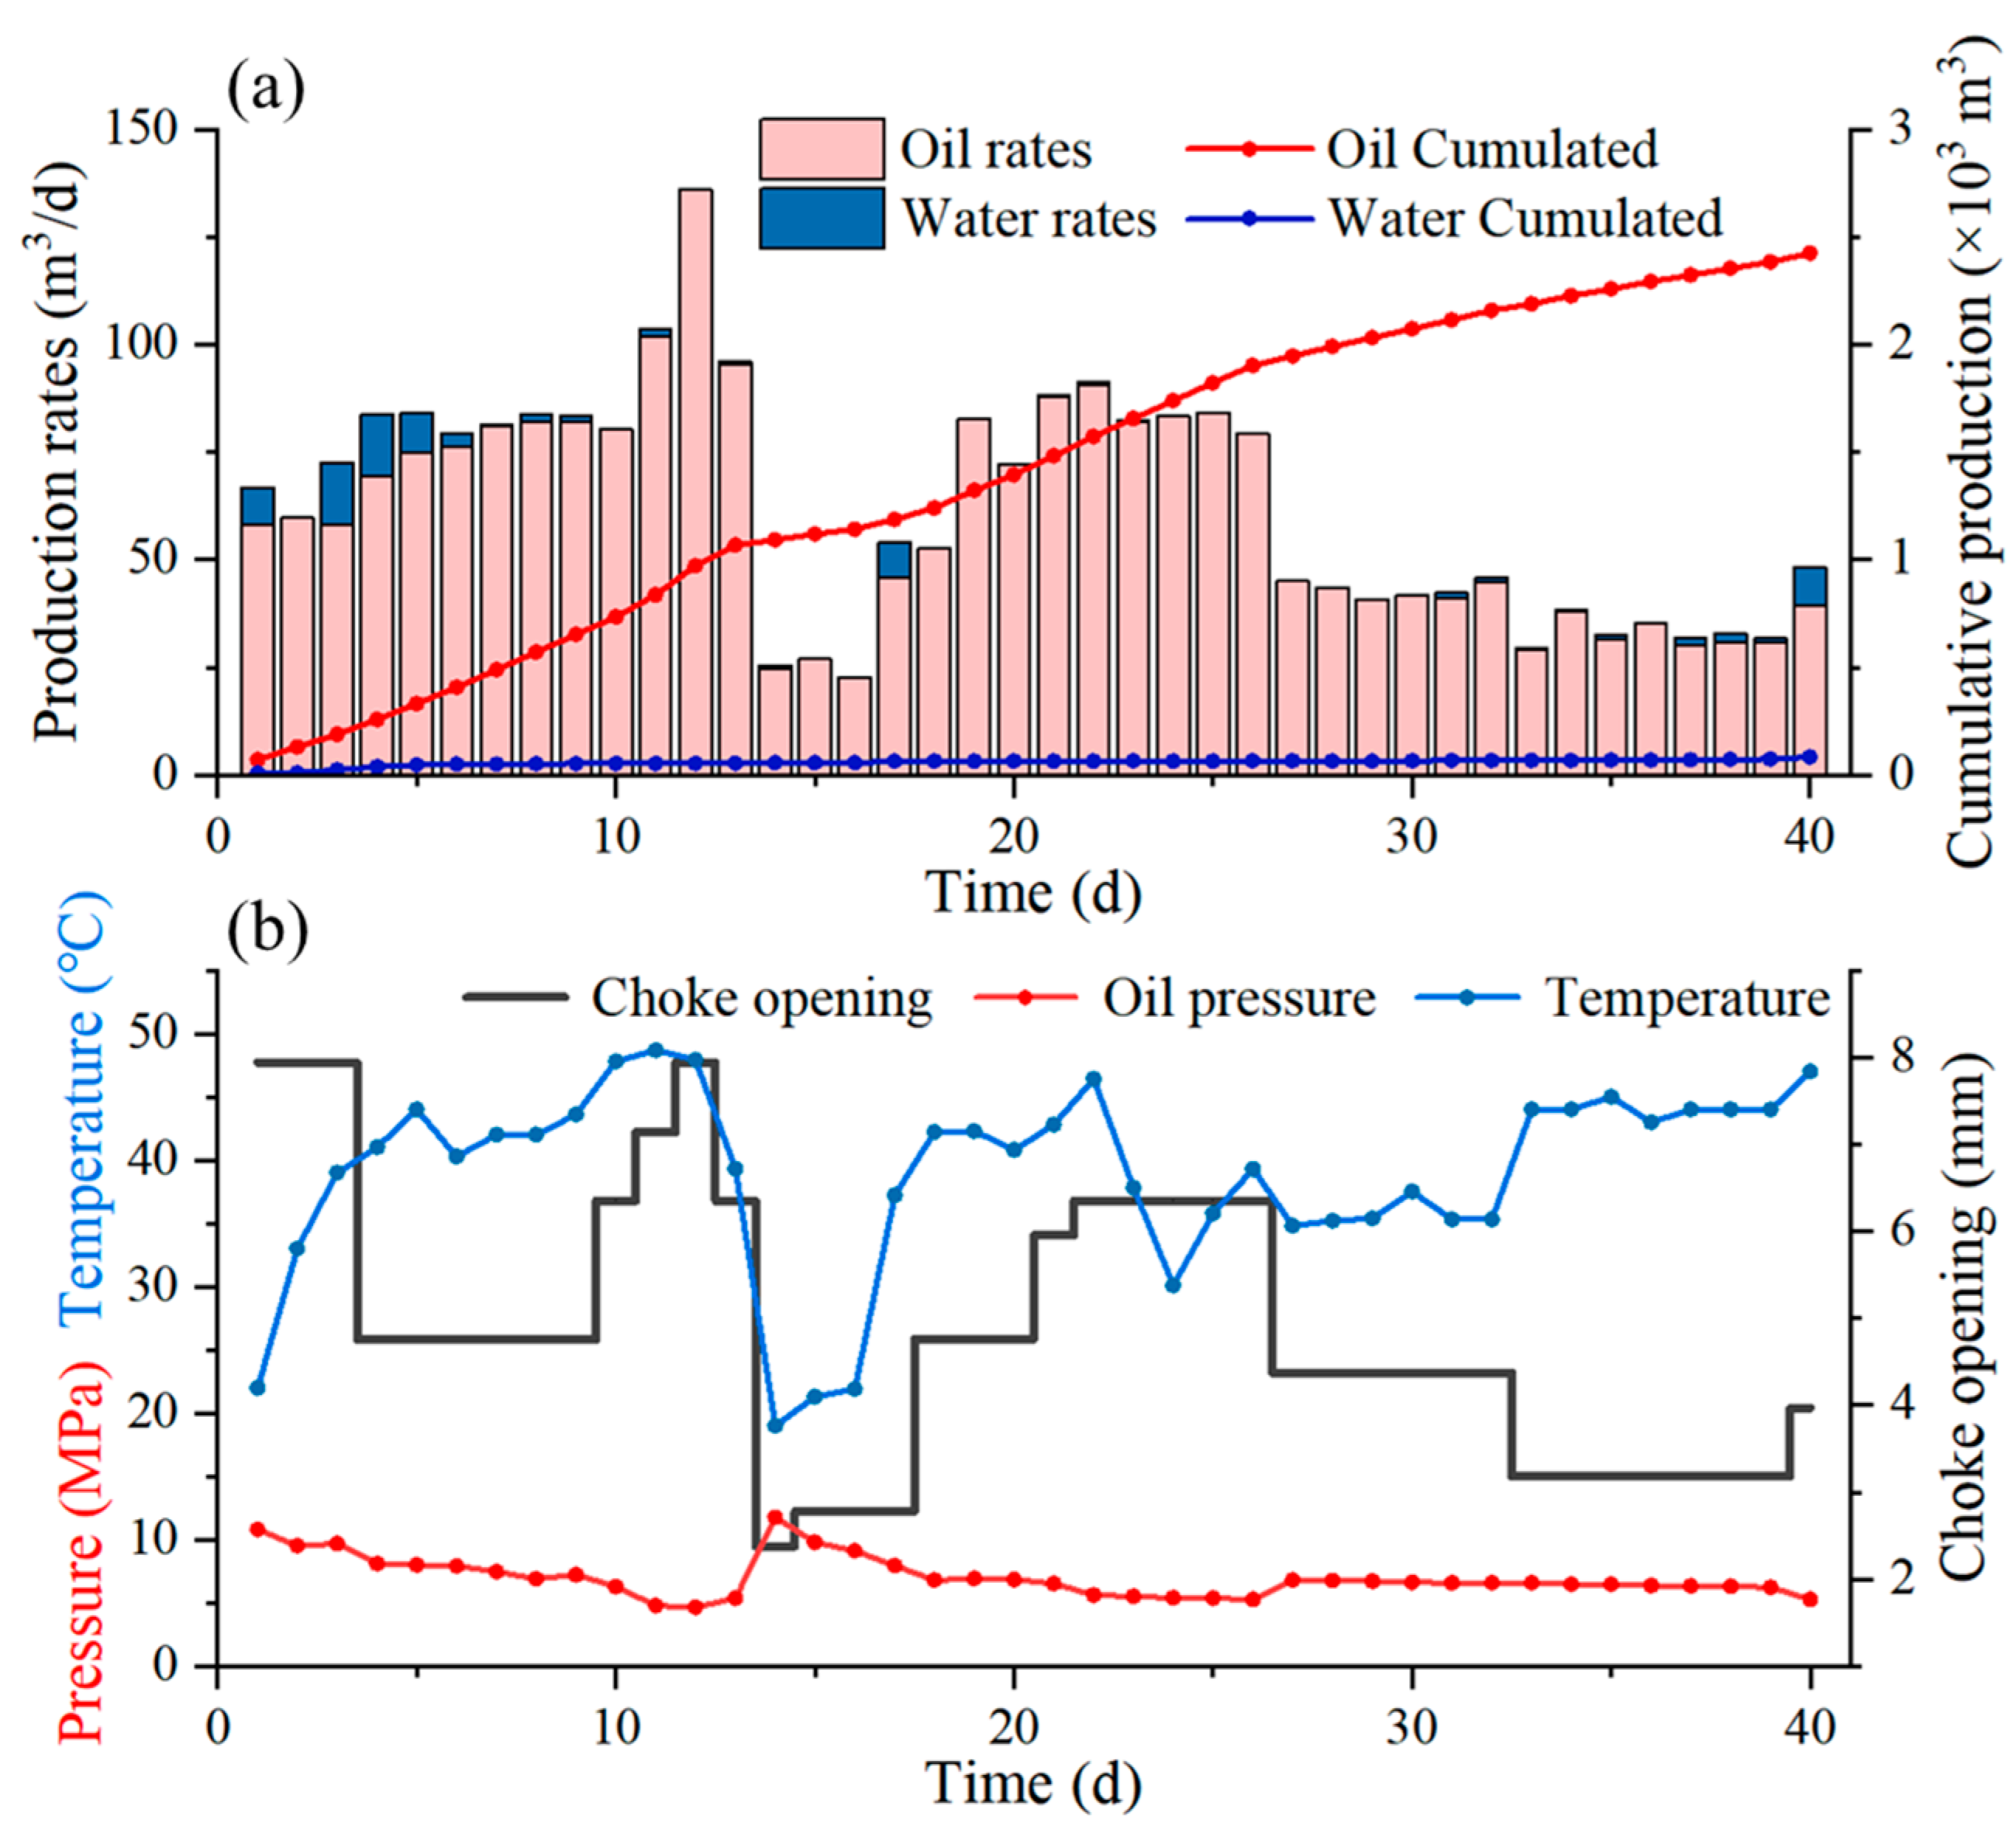
Well test analysis was performed using the post-fracturing production data of this well, which was conducted during the 10–40 days of production testing after fracturing. The production data of this well are presented in Figure 10 below. Under the production condition relying on natural energy depletion, the cumulative oil production of this well reached 2507 m3 within 40 days. The wellhead pressure decreased from 10.80 MPa at well startup to 5.28 MPa, and the daily oil production declined from 58.05 m3 at well startup to 39.44 m3, with a decline rate of 32%. The reasons for the reduction in daily oil production are the decrease in formation pressure and the attenuation of fracture conductivity caused by fracture closure. Since the wellhead pressure has been documented, the conductivity values at different time points can be calculated via well test analysis.
Fracture conductivity values at 10, 20, 30 and 40 days were calculated separately via well test analysis and compared with the conductivity formula established in Equation (3) of this study. The comparison results are presented in Table 4. By comparing the calculated results, the fracture conductivity derived from well test interpretation was consistent with the argillaceous siltstone conductivity predicted based on the laboratory test results and the conductivity formula established in Equation (3) of this study. However, it remains unclear whether the conductivity obtained from well test analysis at this stage represents only the conductivity of the oil layer at the perforation intervals—implying that the mudstone interlayers were completely closed and the isolated oil layers connected by fractures did not contribute to production—or the comprehensive permeability integrating the perforation-interval oil layers, connected isolated oil layers and mudstone interlayers. In fact, since the conductivity of mudstone interlayers is extremely low, this value is very close to the conductivity of argillaceous siltstone, making it impossible to draw a conclusion solely based on the numerical value. Therefore, different reservoir thicknesses were tested separately during the production data fitting process. It was found that the fitting effect was optimal when the pay zone thickness was close to the thickness of the single sand body in the perforation interval. This can serve as auxiliary evidence that although hydraulic fractures penetrated the mudstone interlayers, the mudstone intervals were closed and thus lacked conductivity, resulting in no significant oil production contribution from the connected isolated oil layers. It should be specifically noted that this method cannot be used for quantitative evaluation due to the inconsistent reservoir thicknesses of different fracturing stages; it only serves as a qualitative auxiliary judgment method. Furthermore, since hydraulic fracturing in this area is still in the experimental stage, sufficient field data are not available for verification; we acknowledge that this field application analysis is based on a single representative well (W1). While W1 typifies the reservoir conditions, the heterogeneity of the WZ block means that these findings should be further validated with multi-well production data as field development proceeds.

7. Conclusions

A post-fracturing rock plate was used to evaluate the conductivity of complex fractures. It preserves stepped and rough fracture surfaces compared with the conventional flat-plate test. The complex fracture plate showed a much lower conductivity than the simple fracture plate (1.16 vs. 4.31 mD·cm at initial). After 50 h, it decreased to 0.09 mD·cm. The decay rate was 92%. The complex fracture also showed stage-wise attenuation rather than a single exponential trend.
For simple fractures, lithology dominated the conductivity attenuation. In muddy siltstone, conductivity decreased from 4.31 to 2.78 mD·cm after 50 h (35% loss, 65% retained). In mudstone, conductivity decreased from 3.51 to 0.05 mD·cm after 50 h (98% loss, 2% retained). This rapid collapse in mudstone indicates a strong hydration-related damage to proppant support.
Cross-layer stimulation is constrained by the weakest conductivity interval, so mudstone interlayers should be treated as the primary bottleneck. Hydration inhibition should be prioritized. Proppant selection and placement should be optimized. For lamina-controlled complex fractures, stage/cluster design and treatment scale should be adjusted to improve effective proppant entry and long-term conductivity.

Author Contributions

Conceptualization, B.H.; methodology, R.L.; writing—original draft preparation, R.L. and Y.Z.; visualization, J.L.; funding acquisition, B.H. All authors have read and agreed to the published version of the manuscript.

Funding

This research was funded by the Science and Technology Program of Xinjiang Uyghur Autonomous Region (grant number: 2024B01014), the National Science and Technology Major Project (grant number: 2025ZD1402500), and the PetroChina Science and Technology Major Project (grant number: 2023ZZ16).

Data Availability Statement

Data will be made available on request.

Conflicts of Interest

The authors declare no conflicts of interest.

Abbreviations

EYoung’s modulus of rock, Pa
VPoisson ratio, dimensionless
σ H In situ maximum horizontal stress, Pa
σ h In situ minimum horizontal stress, Pa
σ v In situ vertical stress, Pa
σ v h In situ stress difference between vertical and minimum horizontal stress, Pa
σ t b In situ stress difference between each layer, Pa
F c Conductivity of fractures, D·m
k f   Permeability of the fracture filled with proppant, m2
w f   Fracture width, m
QStable fluid flow rate, m3/s
μFluid viscosity, Pa·s
ΔPPressure difference between the inlet and outlet of the conductivity cell, Pa

References

  1. Lyu, J.; Hou, B.; Zhou, T. Fracture Propagation Behavior via Multi-Cluster Fracturing in Sandstone-Shale Interbedded Reservoirs. Geoenergy Sci. Eng. 2024, 243, 213356. [Google Scholar] [CrossRef] [Scilit]
  2. Xu, R.; Xu, H.; Li, X.; Deng, Y.; Yang, G.; Lv, S.; Hu, F.; Qu, X.; Bai, Z.; Zhang, R. Study on the Mechanism of Cross-Layer Fracture Propagation in Deep Coal Rock Based on True Triaxial Physical Simulation Experiments. Processes 2025, 13, 3411. [Google Scholar] [CrossRef] [Scilit]
  3. Dai, Y.; Hou, B.; Lee, S.; Wick, T. A Thermal–Hydraulic–Mechanical–Chemical Coupling Model for Acid Fracture Propagation Based on a Phase-Field Method. Rock Mech. Rock Eng. 2024, 57, 4583–4605. [Google Scholar] [CrossRef] [Scilit]
  4. Ci, J.; Wang, L.; Xiong, F.; Zhao, Y. Investigation into the Variation Law of Network Fracture Conductivity in Unconventional Oil and Gas Reservoirs. Processes 2024, 12, 1803. [Google Scholar] [CrossRef] [Scilit]
  5. Ren, L.; Dou, M.; Dong, X.; Chen, B.; Zhang, L.; Sun, J.; Jing, C.; Zhang, W.; Zhou, D.; Li, H. Quantitative Characterization of Stimulated Reservoir Volume (SRV) Fracturing Effects in Naturally Fractured Unconventional Hydrocarbon Reservoirs. Front. Earth Sci. 2024, 12, 1419631. [Google Scholar] [CrossRef] [Scilit]
  6. Li, Z.; Wu, X.; Han, G.; Ma, G.; Zhang, L.; Wang, B.; Shi, S. Transient Pressure Analysis of Volume-Fractured Horizontal Wells Considering Complex Fracture Networks and Stress Sensitivity in Tight Reservoirs. ACS Omega 2019, 4, 14466–14477. [Google Scholar] [CrossRef] [Scilit] [PubMed]
  7. Dai, L.; Yin, H.; Yuan, H.; Meng, F. Production Decline Analysis of Vertical Well with Multi-layer Network Fracturing in Tight Oil Reservoir. J. Petrochem. Univ. 2021, 34, 50. [Google Scholar] [CrossRef]
  8. Raterman, K.; Liu, Y.; Warren, L. Analysis of a Drained Rock Volume: An Eagle Ford Example. In Proceedings of the SPE/AAPG/SEG Unconventional Resources Technology Conference, Denver, CO, USA, 22 July 2019; p. D033S053R002. [Google Scholar]
  9. Zhang, Q.; Zhang, Z.; Zhang, B.; Sun, T.; Chen, X.; Hou, B. Research and Application of Self-Suspending Proppants Based on Block Copolymer Modification in Coalbed Methane Wells. Phys. Fluids 2025, 37, 077162. [Google Scholar] [CrossRef] [Scilit]
  10. Wang, T.; Ji, G.; Liu, J.; Xie, Z. Impact of Deep Shale Gas Dense-Cutting Fracturing Parameters on EUR. Processes 2025, 13, 66. [Google Scholar] [CrossRef] [Scilit]
  11. Zheng, Y.; Zhou, M.-M.; Kuru, E.; Wang, B.; Ni, J.; Yang, B.; Hu, K.; Huang, H.; Wang, H.-Z. Proppant Transport in Rough Fracture Networks Using Supercritical CO2. Pet. Sci. 2024, 21, 1852–1864. [Google Scholar] [CrossRef] [Scilit]
  12. Tong, S.; Mohanty, K.K. Proppant Transport Study in Fractures with Intersections. Fuel 2016, 181, 463–477. [Google Scholar] [CrossRef] [Scilit]
  13. Yu, W.; Zhang, T.; Du, S.; Sepehrnoori, K. Numerical Study of the Effect of Uneven Proppant Distribution between Multiple Fractures on Shale Gas Well Performance. Fuel 2015, 142, 189–198. [Google Scholar] [CrossRef] [Scilit]
  14. Wu, W.; Zhou, J.; Kakkar, P.; Russell, R.; Sharma, M.M. An Experimental Study on Conductivity of Unpropped Fractures in Preserved Shales. SPE Prod. Oper. 2019, 34, 280–296. [Google Scholar] [CrossRef] [Scilit]
  15. Ye, Z.; Ghassemi, A. Injection-Induced Shear Slip and Permeability Enhancement in Granite Fractures. J. Geophys. Res. Solid Earth 2018, 123, 9009–9032. [Google Scholar] [CrossRef] [Scilit]
  16. Tan, Y.; Pan, Z.; Liu, J.; Feng, X.-T.; Connell, L.D. Laboratory Study of Proppant on Shale Fracture Permeability and Compressibility. Fuel 2018, 222, 83–97. [Google Scholar] [CrossRef] [Scilit]
  17. Li, K.; Gao, Y.; Lyu, Y.; Wang, M. New Mathematical Models for Calculating Proppant Embedment and Fracture Conductivity. SPE J. 2015, 20, 496–507. [Google Scholar] [CrossRef] [Scilit]
  18. Ahamed, M.A.A.; Perera, M.S.A.; Dong-yin, L.; Ranjith, P.G.; Matthai, S.K. Proppant Damage Mechanisms in Coal Seam Reservoirs during the Hydraulic Fracturing Process: A Review. Fuel 2019, 253, 615–629. [Google Scholar] [CrossRef] [Scilit]
  19. Ramlan, A.S.; Zin, R.M.; Abu Bakar, N.F.; Othman, N.H. Recent Progress on Proppant Laboratory Testing Method: Characterisation, Conductivity, Transportation, and Erosivity. J. Pet. Sci. Eng. 2021, 205, 108871. [Google Scholar] [CrossRef] [Scilit]
  20. Raimbay, A.; Babadagli, T.; Kuru, E.; Develi, K. Effect of Fracture Roughness, Shear Displacement, Fluid Type, and Proppant on the Conductivity of a Single Fracture: A Visual and Quantitative Analysis. SPE Reserv. Eval. Eng. 2017, 20, 446–470. [Google Scholar] [CrossRef] [Scilit]
  21. He, J.-C.; Zhang, K.-S.; Liu, H.-B.; Tang, M.-R.; Zheng, X.-L.; Zhang, G.-Q. Laboratory Investigation on Hydraulic Fracture Propagation in Sandstone-Mudstone-Shale Layers. Pet. Sci. 2022, 19, 1664–1673. [Google Scholar] [CrossRef] [Scilit]
  22. Han, W.; Cui, Z.; Zhu, Z.; Han, X. The Effect of Bedding Plane Angle on Hydraulic Fracture Propagation in Mineral Heterogeneity Model. Energies 2022, 15, 6052. [Google Scholar] [CrossRef] [Scilit]
  23. Cooke, C.E. Conductivity of Fracture Proppants in Multiple Layers. J. Pet. Technol. 1973, 25, 1101–1107. [Google Scholar] [CrossRef] [Scilit]
  24. Cheng, C.; Milsch, H. Hydromechanical Investigations on the Self-Propping Potential of Fractures in Tight Sandstones. Rock Mech. Rock Eng. 2021, 54, 5407–5432. [Google Scholar] [CrossRef] [Scilit]
  25. Li, Z.; Guo, R.; Wang, H.; Teng, Y.; Ripepi, N.; Fernandez, C.A.; Chen, C. Experimental and Numerical Investigation of Fracture Conductivity between Non-Smooth Rock Surfaces with and without Proppant. Geoenergy Sci. Eng. 2025, 246, 213582. [Google Scholar] [CrossRef] [Scilit]
  26. Deng, Y.; Hu, D.; You, J.; Man, Y.; Man, X.; Chen, L.; Fu, D. Exploration progress and breakthrough direction of crude oil in the western South China Sea. China Offshore Oil Gas 2024, 36, 11–24. [Google Scholar] [CrossRef]
  27. Fan, B.; Deng, J.; Lin, H.; Gao, B.; Wang, X. Influence of frac-packing methods on oil-water migration in unconsolidated sandstone reservoirs. China Offshore Oil Gas 2019, 31, 111–117. [Google Scholar]
  28. Tian, F.; Jia, Y.; Yang, L.; Liu, X.; Guo, X.; Martyushev, D.A. Experimental Study on Factors Affecting Fracture Conductivity. Processes 2024, 12, 1465. [Google Scholar] [CrossRef] [Scilit]
  29. Luo, M.; Jia, G.; Yang, Y.; Si, X.; Ge, Y.; Zhan, Y.; Lu, M. Numerical Simulation of Proppant Transportation and Placement in Several Complex Structure Fractures of a Shale Reservoir Using a CFD Approach. Gas Sci. Eng. 2023, 118, 205115. [Google Scholar] [CrossRef] [Scilit]
  30. Xiao, H.; Zhang, L.; Xiang, J.; Lu, Y. Research on Optimization of Conductivity of Multilevel Fractures in Tight Sandstone Based on Similar Circuit Principle. Energy Sci. Eng. 2024, 12, 2627–2642. [Google Scholar] [CrossRef] [Scilit]
Figure 1. Stratigraphic profiles of Stages 5 and 6 of hydraulic fracturing in L3 and classification of fracture morphologies. The schematic on the right illustrates the three fracture types corresponding to perforation points P1–P4: simple muddy siltstone fractures, simple mudstone fractures, and complex muddy siltstone fractures.
Processes 14 00753 g001
Figure 2. Schematic diagram of conductivity experiment.
Processes 14 00753 g002
Figure 3. Preparation processes of two types of rock plates for simulating the conductivity of simple fractures and complex fractures. (a) Photograph of downhole full-diameter core. (b1) For preparing rock plates simulating complex fracture conductivity: First, conduct physical simulation of hydraulic fracturing to obtain the complex fracture morphology near laminas. (c1) Extract the complex fractures near laminas using wire cutting. (d1) Place them into a customized mold and cast with concrete to form rock plates with dimensions of 178 mm × 38 mm × 15 mm (length × width × height). (b2) For preparing rock plates simulating simple fracture conductivity: Directly cut the full-diameter core into conductivity plates using a cutting machine. (c2) Perform precision grinding on the cut conductivity plates to meet experimental requirements. (e) Place the two types of processed conductivity plates into the experimental setup for fracture conductivity testing. Red arrows in the figure indicate the preparation process of rock plates simulating complex fractures, while brown arrows denote the preparation process of rock plates simulating simple fractures.
Processes 14 00753 g003
Figure 4. Three groups of samples employed for the fracture conductivity experiment. (a) Sample 1#, which was taken from argillaceous siltstone and used to simulate the simple fracture morphology; the laminae were marked by white dashed lines. (b) Sample 2#, which was prepared to simulate the simple fracture morphology in mudstone; the natural fractures were marked by white dashed lines in the figure. (c) Sample 3#, which was derived from argillaceous siltstone and designed to simulate the complex fracture morphology; the complex fracture morphology extracted after hydraulic fracturing was marked by red dashed boxes, and the two-dimensional color map reflects the undulation degree of the fracture surface.
Processes 14 00753 g004
Figure 5. Interaction characteristics between the rock plate surface and proppants of sample 1# argillaceous siltstone after the experiment.
Processes 14 00753 g005
Figure 6. Schematic diagram of the mechanical mechanism of differential proppant distribution characteristics of sample 1# before and after the experiment. Where, the yellow ball is proppants, and red vector indicates the closure pressure. (a) Schematic diagram of the force-bearing status and proppant distribution characteristics of the conductivity plate before the experiment. (b) Schematic diagram of the tilting characteristics, proppant embedment and crushing characteristics of the conductivity plate under the dual effects of fluid pressure gradient and hydration after the experiment.
Processes 14 00753 g006
Figure 7. Interaction characteristics between the rock plate surface and proppants of sample 2# mudstone after the experiment.
Processes 14 00753 g007
Figure 8. Interaction characteristics between the rock plate surface and proppants of sample 3# argillaceous siltstone simulating complex fracture morphology after the experiment. (a) post-experiment morphology of the upper plate of argillaceous siltstone simulating complex fractures; (b) post-experiment morphology of the lower plate of argillaceous siltstone simulating complex fractures; (c) distribution characteristic of proppant absence at the protrusions of complex fracture surfaces; (d) distribution characteristic of proppant agglomeration at the depressions of complex fracture surfaces.
Processes 14 00753 g008
Figure 9. Long-term conductivity evolution laws and fitting results of the three groups of samples. (a) Conductivity evolution law (pale yellow fill) and fitting characteristics (red line) of argillaceous siltstone simulating simple fracture morphology; (b) conductivity evolution law (blue fill) and fitting characteristics (red line) of mudstone simulating simple fracture morphology; (c) conductivity evolution law (orange fill) and fitting characteristics (red line) of argillaceous siltstone simulating complex fracture morphology.
Processes 14 00753 g009
Figure 10. Statistical chart of production data for 40 days after fracturing of field well W1. (a) Statistical chart of oil and water production rates within 40 days after fracturing. (b) Monitoring data of wellhead pressure and temperature as well as choke opening degree settings within 40 days after fracturing.
Processes 14 00753 g010
Table 1. Rock mechanics test results of L3 formation.
IndexDepth (m)LithologyE (MPa)vUCS (MPa)
1#2726.0Muddy siltstone17,731.810.11139.45
2#2726.0Muddy siltstone17,546.580.10163.17
3#2733.5Mudstone14,635.560.2475.22
4#2733.5Mudstone10,159.320.1766.93
Table 2. Experiment parameters for each group.
IndexLithologyFracture ShapeClosure Pressure
(MPa)
Test Duration
(h)
Fluid TypeProppant Thickness
(cm)
Proppant Size
(mesh)
1#Muddy siltstoneSimple2850Distilled water1.230/50
2#MudstoneSimple2850Distilled water1.230/50
3#Muddy siltstoneComplex2850Distilled water0.230/50
Table 3. Fitting results of conductivity attenuation for different lithologies.
IndexLithologyFracture ShapeAttenuation
Mode
Initial
Conductivity
(mD·cm)
Remaining
Conductivity
(mD·cm)
Attenuation
Coefficient
R2
1#Muddy siltstoneSimpleExponential4.30992.78210.04380.9278
2#MudstoneSimpleExponential3.51240.30010.04860.8102
3#Muddy siltstoneComplexStage-by-stage1.15770.0964//
Table 4. Comparison between the fracture conductivity obtained from well test interpretation and that calculated by Equation (3).
Time (d)Conductivity by Well Test (mD·cm)Conductivity by Equation (3) (mD·cm)
Muddy SiltstoneMudstone
102.74662.78220.3000
202.70382.78210.3001
302.69942.78210.3001
402.69572.78210.3001
Disclaimer/Publisher’s Note: The statements, opinions and data contained in all publications are solely those of the individual author(s) and contributor(s) and not of MDPI and/or the editor(s). MDPI and/or the editor(s) disclaim responsibility for any injury to people or property resulting from any ideas, methods, instructions or products referred to in the content.