Article

Capillary–Viscoelastic Coupling and Multiscale Imbibition Dynamics in Tight Conglomerate Rocks

1
School of Petroleum Engineering, China University of Petroleum (Beijing), Beijing 102249, China
2
Xinjiang Petroleum Engineering Pilot Plant Key Laboratory, Karamay 834000, China
*
Author to whom correspondence should be addressed.
Processes 2026, 14(4), 625; https://doi.org/10.3390/pr14040625
Submission received: 6 January 2026 / Revised: 3 February 2026 / Accepted: 9 February 2026 / Published: 11 February 2026

Abstract

Tight conglomerate reservoirs exhibit strong pore-scale heterogeneity and extremely low permeability, in which spontaneous imbibition is primarily governed by capillary and viscoelastic effects. In this study, the imbibition dynamics of four representative fracturing fluid systems, including slickwater, 3% potassium chloride (KCl) brine, hydrolyzed polyacrylamide (HPAM) viscoelastic fluid, and a nanoemulsion (NE), were investigated using a temperature-controlled nuclear magnetic resonance (NMR) monitoring system. This approach enables real-time quantification of fluid uptake and pore-scale redistribution through time-resolved T2 spectral analysis. The experimental results reveal a three-stage imbibition process consisting of rapid capillary-driven uptake, viscoelastic-retarded transition, and final equilibrium. Among the four fracturing fluid systems, the nanoemulsion exhibits the lowest interfacial tension (1.72 mN/m), the strongest wettability alteration, and the highest equilibrium recovery (0.76), which is nearly 80% greater than that of slickwater. Based on these observations, a multiscale capillary–viscoelastic coupling model was developed by extending the Lucas–Washburn framework to incorporate pore-size distribution, time-dependent wettability evolution, and viscoelastic damping. The model fits the experimental data well (R2 > 0.90) and identifies viscosity as the most influential parameter controlling the imbibition rate (sensitivity = 0.78). Energy analysis further indicates that capillary energy dominates the early stage, whereas viscoelastic energy storage sustains fluid transport during the later stage. SEM observations were further used to qualitatively corroborate pore heterogeneity and pore–mineral associations, supporting the NMR-based pore-scale interpretation. This study provides a quantitative framework for describing non-Newtonian capillary flow in tight conglomerate rocks and enhances the understanding of capillary–viscoelastic interactions relevant to multiphase fluid migration.

1. Introduction

Tight conglomerate reservoirs in the Junggar Basin and other continental basins are characterized by strong pore-scale heterogeneity, wide grain-size distributions, and extremely low permeability, with pore systems spanning from nanometers to micrometers and comprising intergranular pores, microfractures, and clay-bound nanopores [1,2,3,4]. Under such conditions, natural reservoir energy is insufficient to sustain commercial production, making hydraulic fracturing essential [5,6,7]. During the post-fracturing shut-in period, spontaneous imbibition of fracturing fluids into the matrix plays a critical role in mobilizing residual oil and improving early-to-mid-term recovery [8,9]. Unlike conventional sandstones, imbibition in tight conglomerates is jointly controlled by capillary pressure, wettability, interfacial tension, and the rheological behavior of complex fluids, resulting in highly nonlinear and multiscale flow dynamics [10]. Previous studies have investigated spontaneous imbibition in tight rocks using capillary-based models such as the Lucas–Washburn framework and its extensions, as well as experimental techniques including nuclear magnetic resonance (NMR) T2-spectrum analysis to infer pore-scale fluid redistribution [11,12,13]. Meanwhile, emerging fracturing fluid systems, such as polymer viscoelastic fluids and nanoemulsions, have shown strong potential to reduce interfacial tension, alter wettability, and enhance imbibition-driven oil recovery, particularly in tight reservoirs where conventional slickwater performs poorly [14].
Despite these advances, several key challenges remain unresolved. Existing models rarely integrate capillary pressure, time-dependent wettability evolution [15,16,17], and viscoelastic effects within a unified quantitative framework, limiting their ability to describe nonlinear imbibition behavior in multiscale pore systems [18,19]. In addition, although NMR techniques provide indirect pore-size information, the respective contributions of micro-, meso-, and macropores to imbibition under different fluid systems are still insufficiently quantified, and most studies rely on endpoint recovery measurements rather than real-time dynamic observations [20,21,22].
To address these limitations, this study systematically investigates the spontaneous imbibition behavior of four representative fracturing fluid systems—slickwater, 3% KCl brine, a polymer viscoelastic fluid (HPAM), and a nanoemulsion—using a temperature-controlled NMR monitoring system. Time-resolved T2 spectra are employed to quantify multiscale pore contributions during imbibition, and a multiscale capillary–viscoelastic coupling model is developed by extending the Lucas–Washburn framework to incorporate pore-size distribution, dynamic wettability evolution, and viscoelastic damping. By integrating real-time experimental observations with quantitative modeling and energy partition analysis, this work provides new physical insight into non-Newtonian imbibition mechanisms in tight conglomerate rocks and offers a robust framework for optimizing fracturing fluid design and shut-in strategies.

2. Experimental Materials and Methods

2.1. Core Samples and Petrophysical Characteristics

2.1.1. Microstructural Characterization

Scanning Electron Microscopy (SEM)
Scanning electron microscopy (SEM) was used to examine pore morphology and mineral–pore associations at the microscale. Core samples were mechanically polished and then coated with a gold layer of approximately 10 nm thickness using a sputter coater to ensure electrical conductivity. SEM observations were conducted using a FEI Quanta 450 FEG scanning electron microscope (Thermo Fisher Scientific, Waltham, MA, USA) operated at an accelerating voltage of 15 kV and a working distance of 10 mm. Imaging was performed in secondary electron (SE) mode to resolve pore structures, microfractures, and clay mineral distributions.

2.2. Fracturing Fluid Systems and Properties

In this study, tight conglomerate samples from the Baikouquan Formation of the Mahu Sag were selected as the experimental objects. This formation is mainly composed of medium-to-coarse-grained conglomerates with dense cementation. The matrix is primarily composed of quartz and feldspar, with minor amounts of calcite and clay minerals, exhibiting typical low-porosity and low-permeability characteristics. The core samples were taken from actual drilling cores in the northern part of the Mahu Sag, sealed on-site, and subsequently dried and characterized in the laboratory.
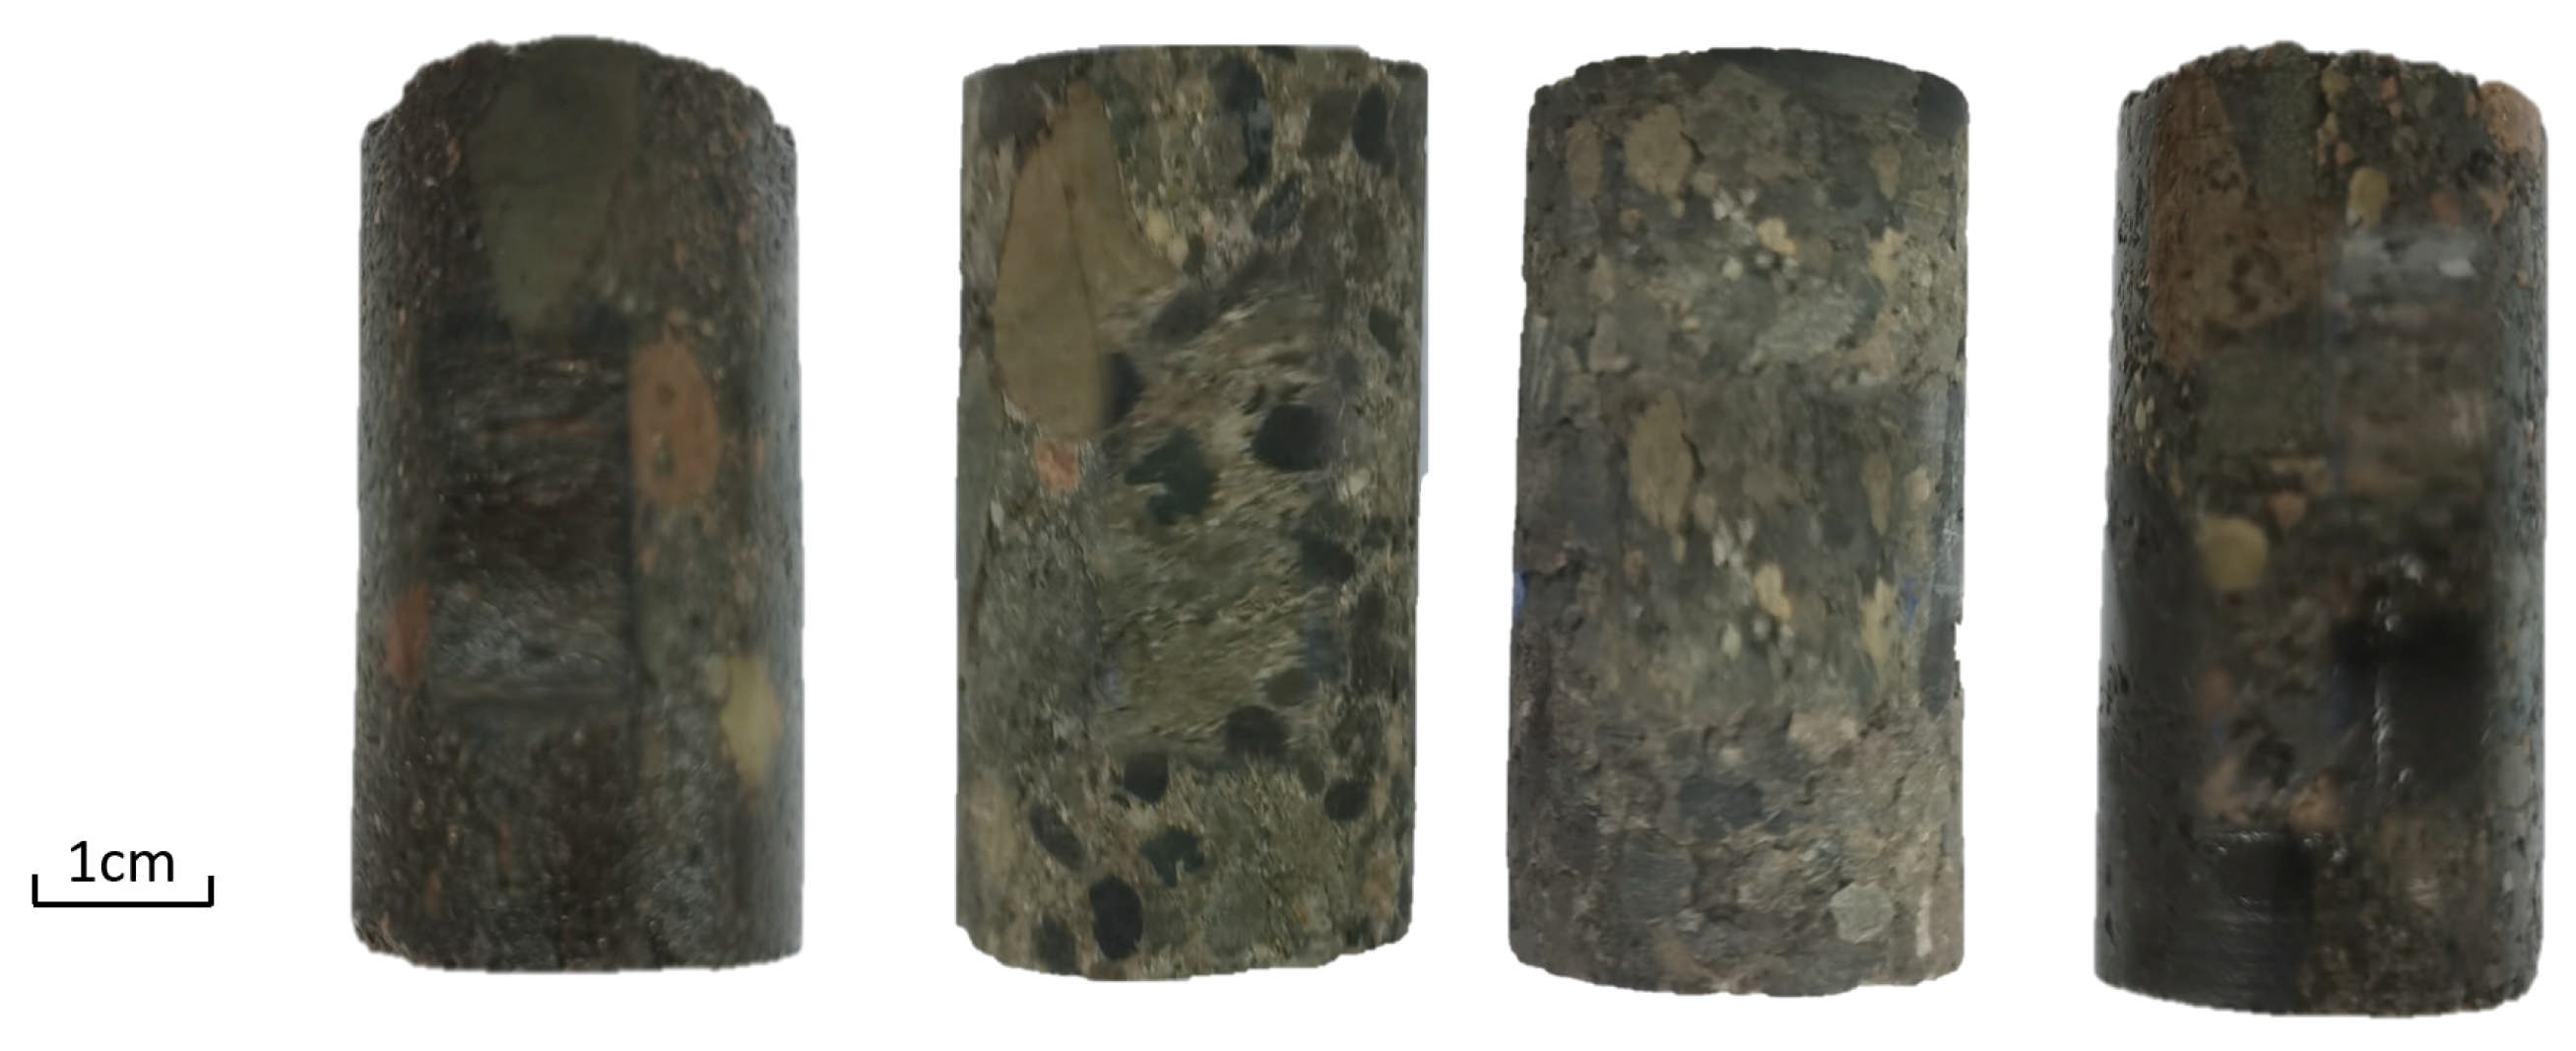
Four representative core samples (labeled MH-1 to MH-4, Figure 1) were selected. Each core sample has a diameter of 25 mm and a length of 50 mm. After nitrogen drying at 60 °C for 48 h, their petrophysical parameters were measured, as shown in Table 1. The porosity (φ) of the cores ranges from 6.1% to 8.5%, and permeability (k) ranges from 0.12 × 10⁻³ μm2 to 0.45 × 10⁻³ μm2, indicating that the samples are typical tight conglomerate reservoir rocks.
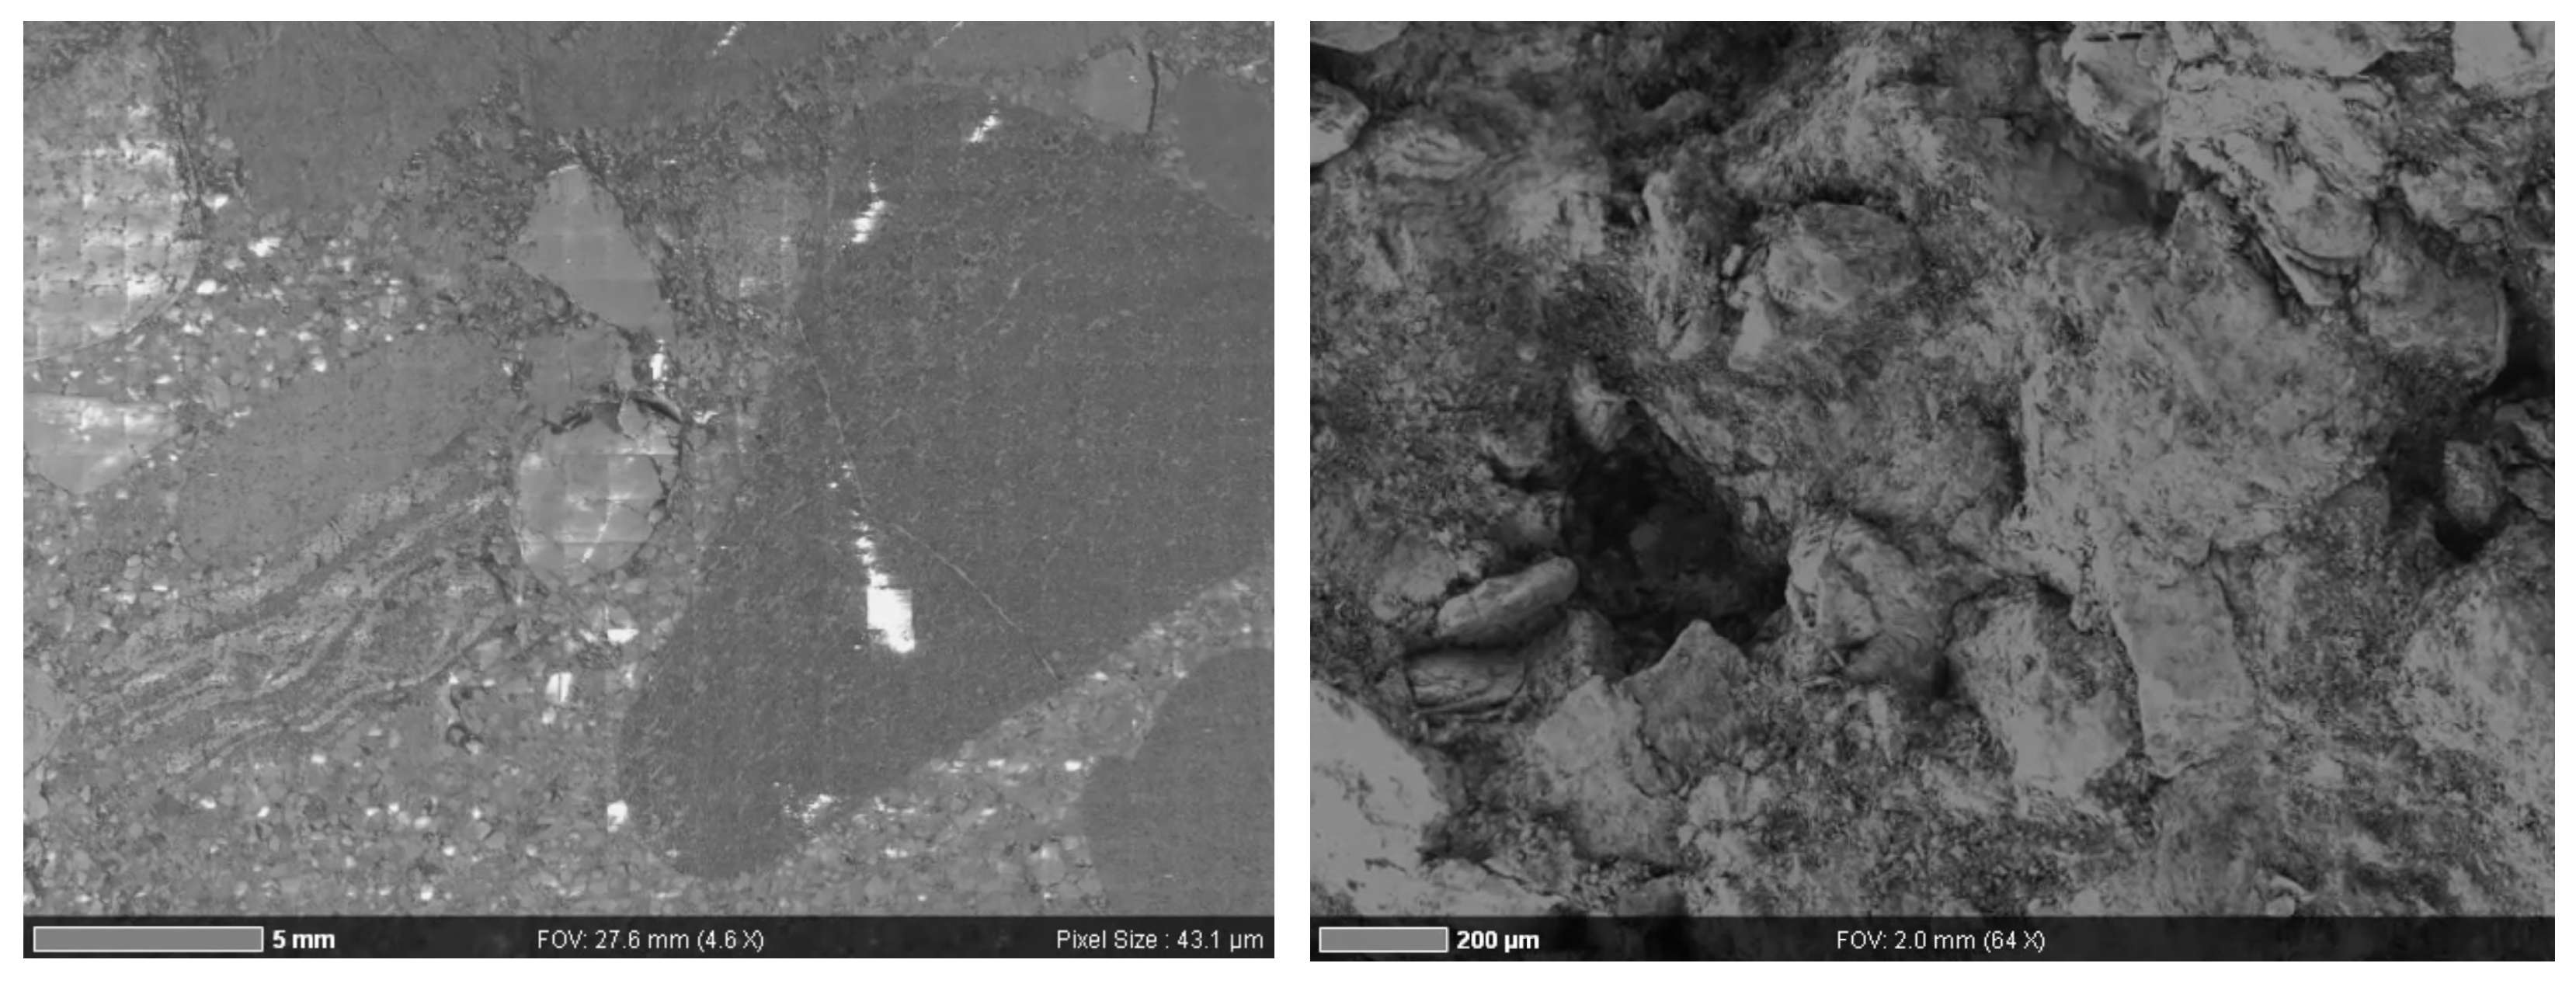
SEM images (Figure 2) indicate that the pore system is dominated by intergranular micro-pores and clay-associated nano/micro-pores, with locally developed microfractures. Clay minerals occur near pore throats, implying strong constriction and tortuosity, which can amplify viscous/viscoelastic resistance during imbibition. These features support the NMR observation that early-time uptake is dominated by small pores, whereas sustained transport at later times increasingly relies on connected medium pores.

2.3. Fracturing Fluid Systems and Physical Properties

To systematically compare the effects of different fracturing fluid systems on imbibition behavior, four representative fluid systems were designed in this study:
Low-viscosity slickwater (SW);
3% KCl solution (KCl);
Polymer variable-viscosity fluid (HPAM);
Nanoemulsion system (NE).
The nanoemulsion system consisted of 1.0 wt% nonionic surfactant (a Span80/Tween80 blend, HLB = 9.2), 0.2 wt% SiO2 nanoparticles (average particle size 30 nm), and 0.3 wt% polyacrylamide (HPAM). The emulsified oil phase was mineral oil, with an oil-to-water volume ratio of 1:9. The system was ultrasonicated for 30 min at room temperature to form a stable emulsion.
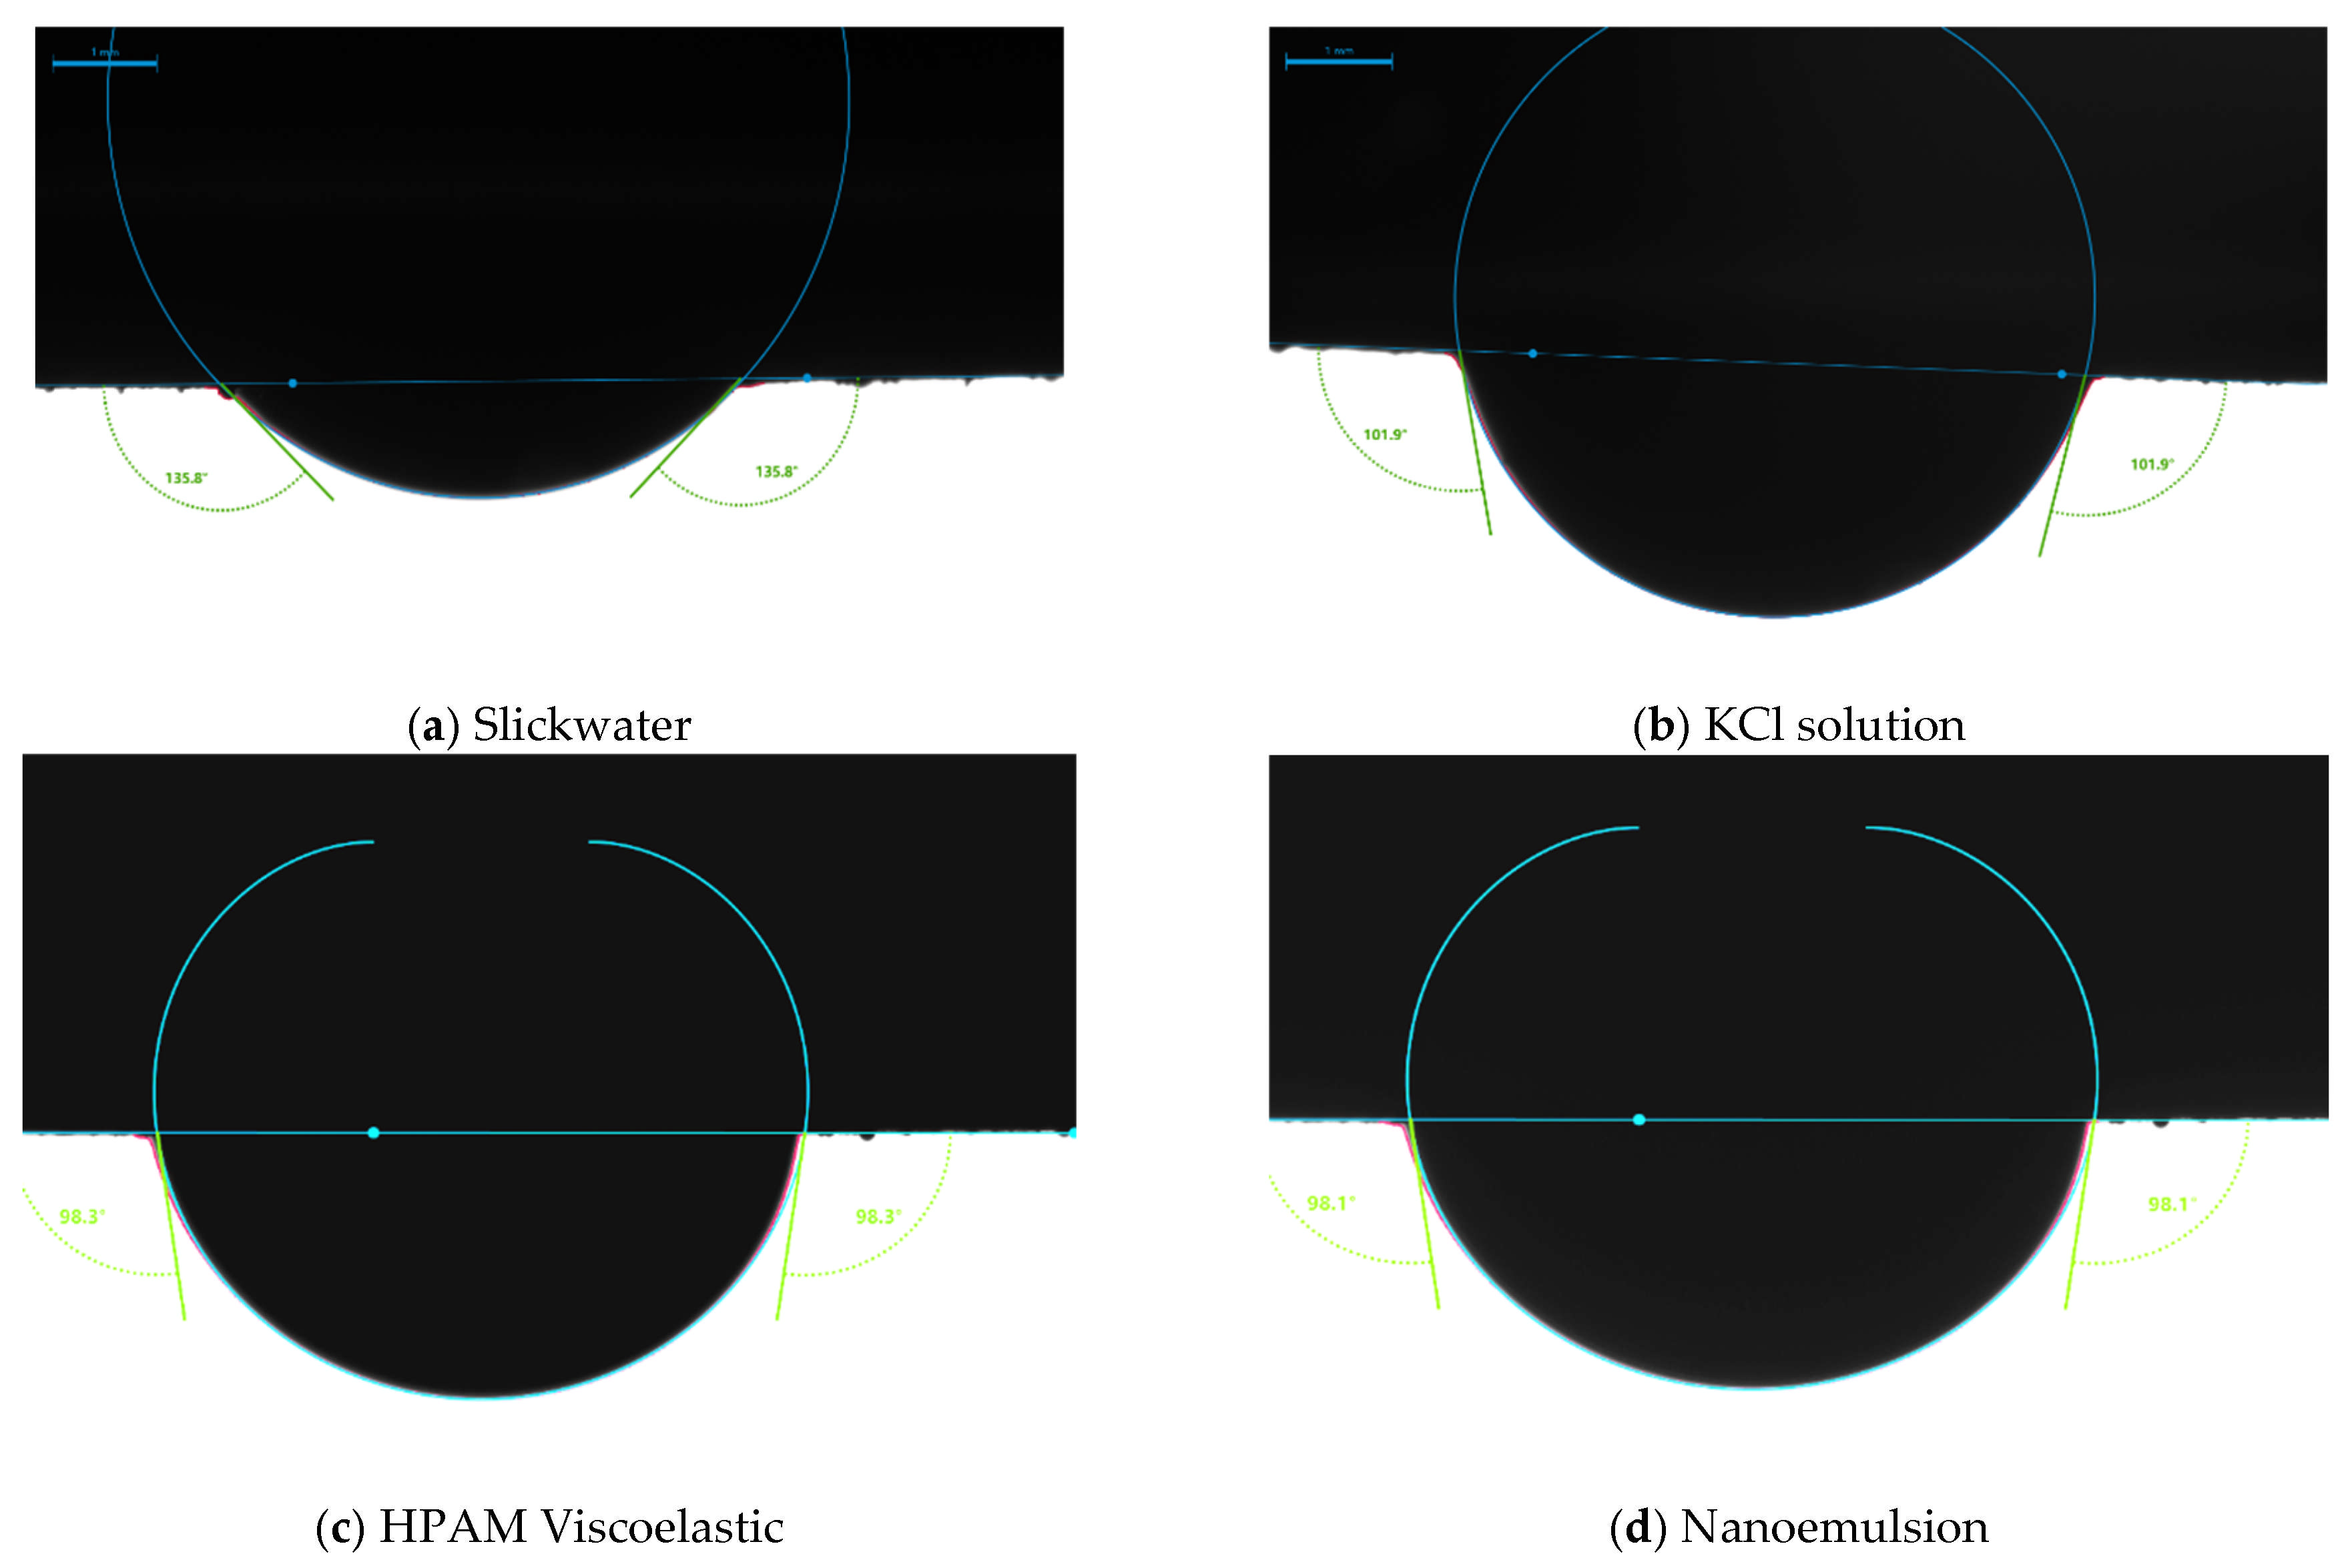
The physical parameters of each system were measured using a rotational rheometer (Anton Paar MCR302) and a pendant-drop interfacial tensiometer (KRÜSS DSA100) at 60 °C, as summarized in Table 2 and Figure 3. The results show that the nanoemulsion system (NE) exhibits the highest viscosity (62.3 mPa·s), the lowest interfacial tension (1.72 mN/m), and a ζ potential of −36.5 mV, indicating excellent emulsion stability. In contrast, the slickwater system shows the lowest viscosity (14.8 mPa·s) and the highest interfacial tension (24.1 mN/m).
Overall, all four fracturing fluid systems display typical pseudoplastic (shear-thinning) fluid behavior. The nanoemulsion system exhibits significantly higher viscosity in the low shear rate range (γ̇ < 10 s−1) compared with other systems, suggesting stronger liquid retention and pore-trapping capability during the static imbibition stage. This characteristic favors maintaining the capillary driving force and prolonging the effective imbibition duration.

2.4. Spontaneous Imbibition Experimental System

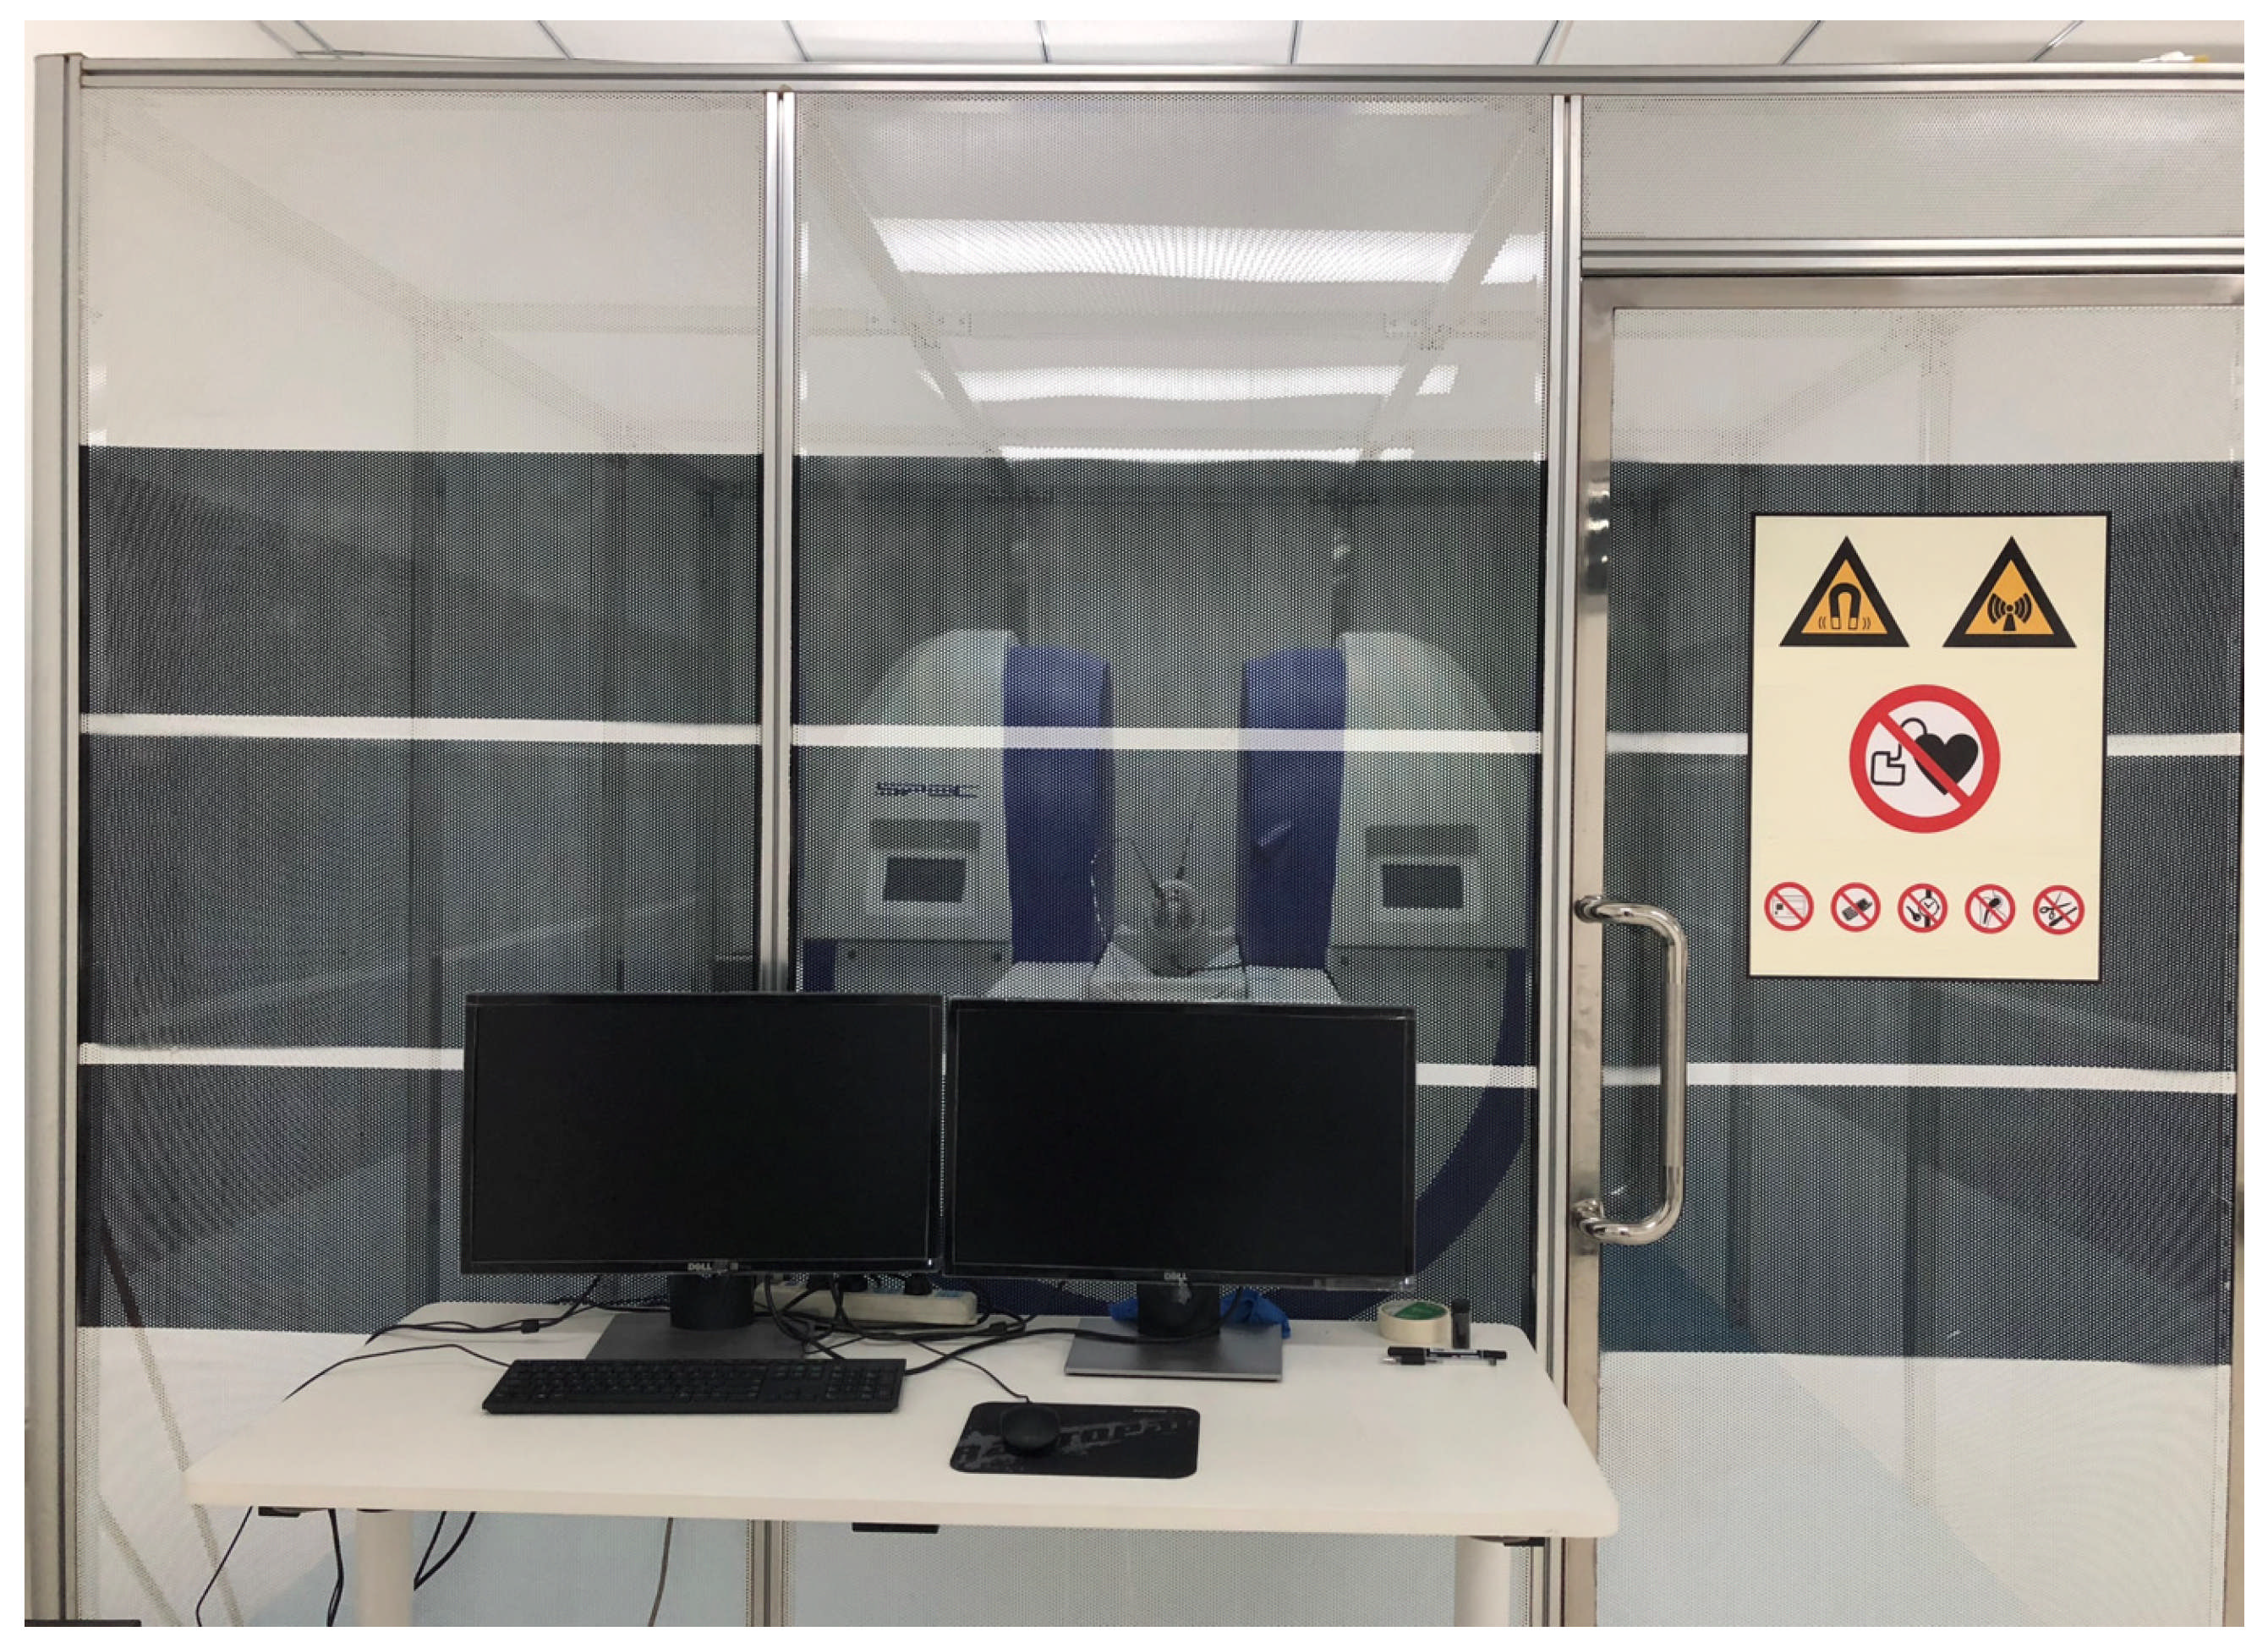
The experiments were conducted using a self-developed sealed and temperature-controlled NMR imbibition monitoring system (Figure 4). The system consists of a temperature control module, an imbibition cell unit, an NMR detection device, and a data acquisition module, allowing real-time recording of fluid volume changes during imbibition without disturbing the core samples. The measurement accuracy of the apparatus is ±0.01 mL, and the temperature control precision is ±0.2 °C.
The experimental procedure was as follows:
(1)
Sample Preparation: After drying the core samples at 60 °C for 48 h, they were vacuum-saturated with water for 12 h to remove trapped air. The samples were then saturated with crude oil (viscosity: 16.5 mPa·s; density: 0.86 g/cm3) and aged at 60 °C for 72 h.
(2)
Imbibition Experiment: Each sample was placed vertically in the imbibition cell, ensuring that only the bottom surface was in contact with the test fluid. The imbibition process was initiated, and timing began at this point.
(3)
Monitoring Process: The experiments were conducted under an isothermal condition of 60 °C. NMR measurements were taken every 2 h during the first 24 h and every 6 h thereafter, continuing until the imbibition process reached equilibrium (approximately 168 h).
(4)
NMR Parameters: The Carr–Purcell–Meiboom–Gill (CPMG) pulse sequence was employed, with an echo spacing of 0.1 ms, 32 scans, and a T2 range of 0.1–104 ms. The NMR instrument used was a MacroMR12-150H model.

2.5. Data Processing Method

To quantitatively characterize the imbibition behavior under different fracturing fluid systems, the following key parameters were defined:
(1) 
Instantaneous imbibition volume Q(t):
It represents the cumulative volume of fluid spontaneously imbibed by the core at a given time t. It is obtained directly from NMR monitoring data or by measuring the mass change in the sample over time, and can be expressed as:
Q t = M t M 0 ρ f
where M t is the mass of the core at time t, M 0 is the initial mass of the core before imbibition, and ρ f is the density of the imbibing fluid.
R t = M t M 0 M M 0 × 100 %
where M is the core mass at equilibrium, corresponding to the equilibrium imbibition. where R(t) denotes the cumulative imbibition recovery at time t.
The experimental data were fitted to the following empirical model by nonlinear least squares (Levenberg–Marquardt algorithm):
R t = R ( 1 e k t )
where R is the equilibrium recovery rate and k is the imbibition rate constant. The goodness of fit is characterized by the coefficient of determination R2, which is >0.9 for all data, and the model parameters will be quantitatively verified with the experimental results.

3. Theoretical Model and Mathematical Derivation

3.1. Control Equations and Derivation

To describe spontaneous imbibition in tight conglomerates, we model the pore space as a bundle of independent capillaries with radius r . The capillaries are aligned with the main imbibition direction, and the pore-size distribution f(r) follows a log-normal function normalized over [rmin,rmax]. The imbibing fluid is treated as incompressible and non-Newtonian with an effective viscosity μ e f f that depends on shear rate; in the low-shear regime relevant to shut-in imbibition, it is approximated as quasi-steady viscoelastic. The driving force is capillary pressure pc = 2γcosθ/r, where both wettability θ(t) and viscoelastic damping are allowed to evolve with time. Gravity and evaporation are neglected. Under these assumptions, the meniscus position L(r,t) depends on r, γ, θ(t), μeff, and time t.
The imbibition process follows the principle of balance between capillary pressure and viscous resistance. For a single capillary tube with radius r, there are:
8 μ e f f L ( r , t ) r 2 d L ( r , t ) d t = 2 γ c o s   θ r
The integral yields the classical Lucas–Washburn equation:
L 2 ( r , t ) = r γ c o s   θ 2 μ e f f t
where L is the length of the imbibition front (m); γ is the liquid–gas interfacial tension (N/m); θ is the contact angle (°); and μeff is the effective viscosity of the fluid (Pa-s).
Considering the diversity of pore sizes in the reservoir, the pore size distribution was introduced into the volume calculation. The imbibition volume V(t) in unit cross-sectional area A is expressed as:
V ( t ) = ϕ A r m i n r m a x L ( r , t ) f ( r )   d r
where ϕ is the porosity. Substituting into the Lucas–Washburn equation yields:
V ( t ) = ϕ A r m i n r m a x ( r γ c o s   θ 2 μ e f f t ) 1 / 2 f ( r )   d r
If the average effective pore size is defined as r ¯ = r f ( r )   d r , which can be approximated by:
V ( t ) C 1 ( γ c o s   θ ) 1 / 2 μ e f f 1 / 2 t 1 / 2
where C 1 = ϕ A r ¯ 1 / 2 / 2 is a constant related to the pore structure. This equation shows that in the early stage, the imbibition volume is proportional to the square root of time, which is in accordance with most experimental results.
In Tight Conglomerates, the contact angle θ is no longer constant because the wettability of the fluid–rock interface changes with time. An exponential decay model is used to describe the wettability evolution:
c o s   θ ( t ) = c o s   θ 0 + ( c o s   θ e q c o s   θ 0 ) ( 1 e α t )
where θ0 is the initial contact angle, θeq is the equilibrium contact angle, and α is the coefficient of wettability evolution (min−1). We assume a first-order relaxation of wettability toward equilibrium, i.e., d θ / d t = α ( θ θ e q ) , whose solution yields the exponential form in Equation (9). This empirical relaxation form has been widely adopted for dynamic wettability/adsorption-controlled interfacial evolution [23]. For the nanoemulsion system experimental fitting results: θ0 = 115.6°, θeq = 46.8°, α = 0.021 min−1.
The exponential decay form is adopted to describe the gradual stabilization of wettability with time, which has been widely used to represent dynamic wettability alteration processes in previous studies.
Substitutions were made to obtain a corrected relationship for the imbibition length as a function of time:
L 2 ( t ) = r γ 2 μ e f f 0 t c o s   θ ( τ )   d τ
The experimental data are brought in and obtained by integration:
L 2 ( t ) = r γ 2 μ e f f [ c o s   θ e q t + c o s   θ 0 c o s   θ e q α ( 1 e α t ) ]
This equation can reflect the nonlinear imbibition behavior due to the change in wettability in different fluid systems.
It should be noted that the capillary bundle model simplifies the complex pore network by representing multiscale pores as independent capillaries, neglecting pore connectivity and throat constraints. This assumption is adopted as a first-order approximation to capture the dominant capillary–viscoelastic coupling behavior during imbibition, rather than to explicitly describe detailed pore-network topology.

3.2. Viscoelastic Corrections and Dimensionless Quantization

For polymer or nanoemulsion systems, the fluid has a viscoelastic characteristic and its viscosity can be expressed as:
μ e f f = μ ( 1 + β G λ )
where μ is the zero shear viscosity; G is the energy storage modulus (Pa); λ is the relaxation time (s); β is the empirical coefficient (generally 0.05–0.15).
According to experimental measurements: nanoemulsion system G = 1.76 Pa, λ = 0.8 s, β = 0.1, then μeff ≈ 1.14 μ. This correction explains the slightly lower imbibition rate but higher equilibrium recovery.
If the characteristic length L c = ( r γ c o s   θ / 2 μ e f f ) 1 / 2 t c 1 / 2 , dimensionless variable is calculated as follows:
t = t t c , L = L L c
The dimensionless control equation is obtained:
d ( L ) 2 d t = 1
After considering wettability and viscoelastic corrections:
d ( L ) 2 d t = F ( t ) = c o s   θ ( t ) cos   θ 0 ( 1 + β G λ )
Combined with the hydrodynamic similarity theory, three types of dimensionless parameters that characterize the imbibition process can be defined: the Capillary number (Ca = μv/γ), which is used to characterize the relative strengths of viscous resistance and capillary forces; the Weber number (We = ρv2r/γ), which measures the degree to which fluid inertia affects interfacial tension; and the Deborah number (De = λv/r), which is used to describe the ratio of the fluid viscoelastic response time to the characteristic flow time. Based on the experimental conditions (nanoemulsion system, r ≈ 2 μm, v ≈ 10−5 m/s, μ ≈ 60 mPa-s, γ ≈ 1.7 mN/m), Ca ≈ 3.5 × 10⁻⁴, We ≈ 2.3 × 10⁻⁶, De ≈ 0.4. The results show that capillary forces are still the dominant driving force in this experimental system, while viscoelastic effects are significant but not the main controlling factor.

3.3. Empirical Kinetic Law and Parameter Correlation

The experimental results show that the variation in the imbibition rate with time exhibits a typical exponential and gradually stabilizing law, which can be characterized by the following empirical equation:
R ( t ) = R ( 1 e k t )
where R(t) is the cumulative imbibition recovery at time t; R is the equilibrium recovery; and k is the imbibition rate constant (min−1).
Equation (16) represents a time-dependent form derived from Equation (3) by incorporating dynamic wettability evolution.
The fitting results show that the relationship between k and the physical parameters of the four systems can be expressed as follows:
k = α ( γ c o s   θ ) a μ b λ c ϕ p d
where α is the empirical coefficient (10−3 magnitude), ϕp is the porosity, and a,b,c,d are empirical indices. According to the multiple regression analysis (R2 > 0.91), the empirical parameters were obtained as shown in Table 3.
The four fluid systems used to derive Equation (18) span a representative range of fluid properties: viscosity 14.8–62.3 mPa·s, interfacial tension 1.7–24.1 mN/m, and contact angles 46.8–115.6°. The tested cores exhibit porosities of 6.1–8.5% and permeabilities of 0.12–0.45 × 10⁻³ μm2. Therefore, the empirical correlation is applicable to tight conglomerate rocks with similar pore structures and to fracturing fluids within the tested rheological range. Extrapolation beyond these ranges (e.g., ultralow IFT < 1 mN/m or viscosities > 100 mPa·s) may introduce uncertainty, and additional calibration is recommended for field applications.
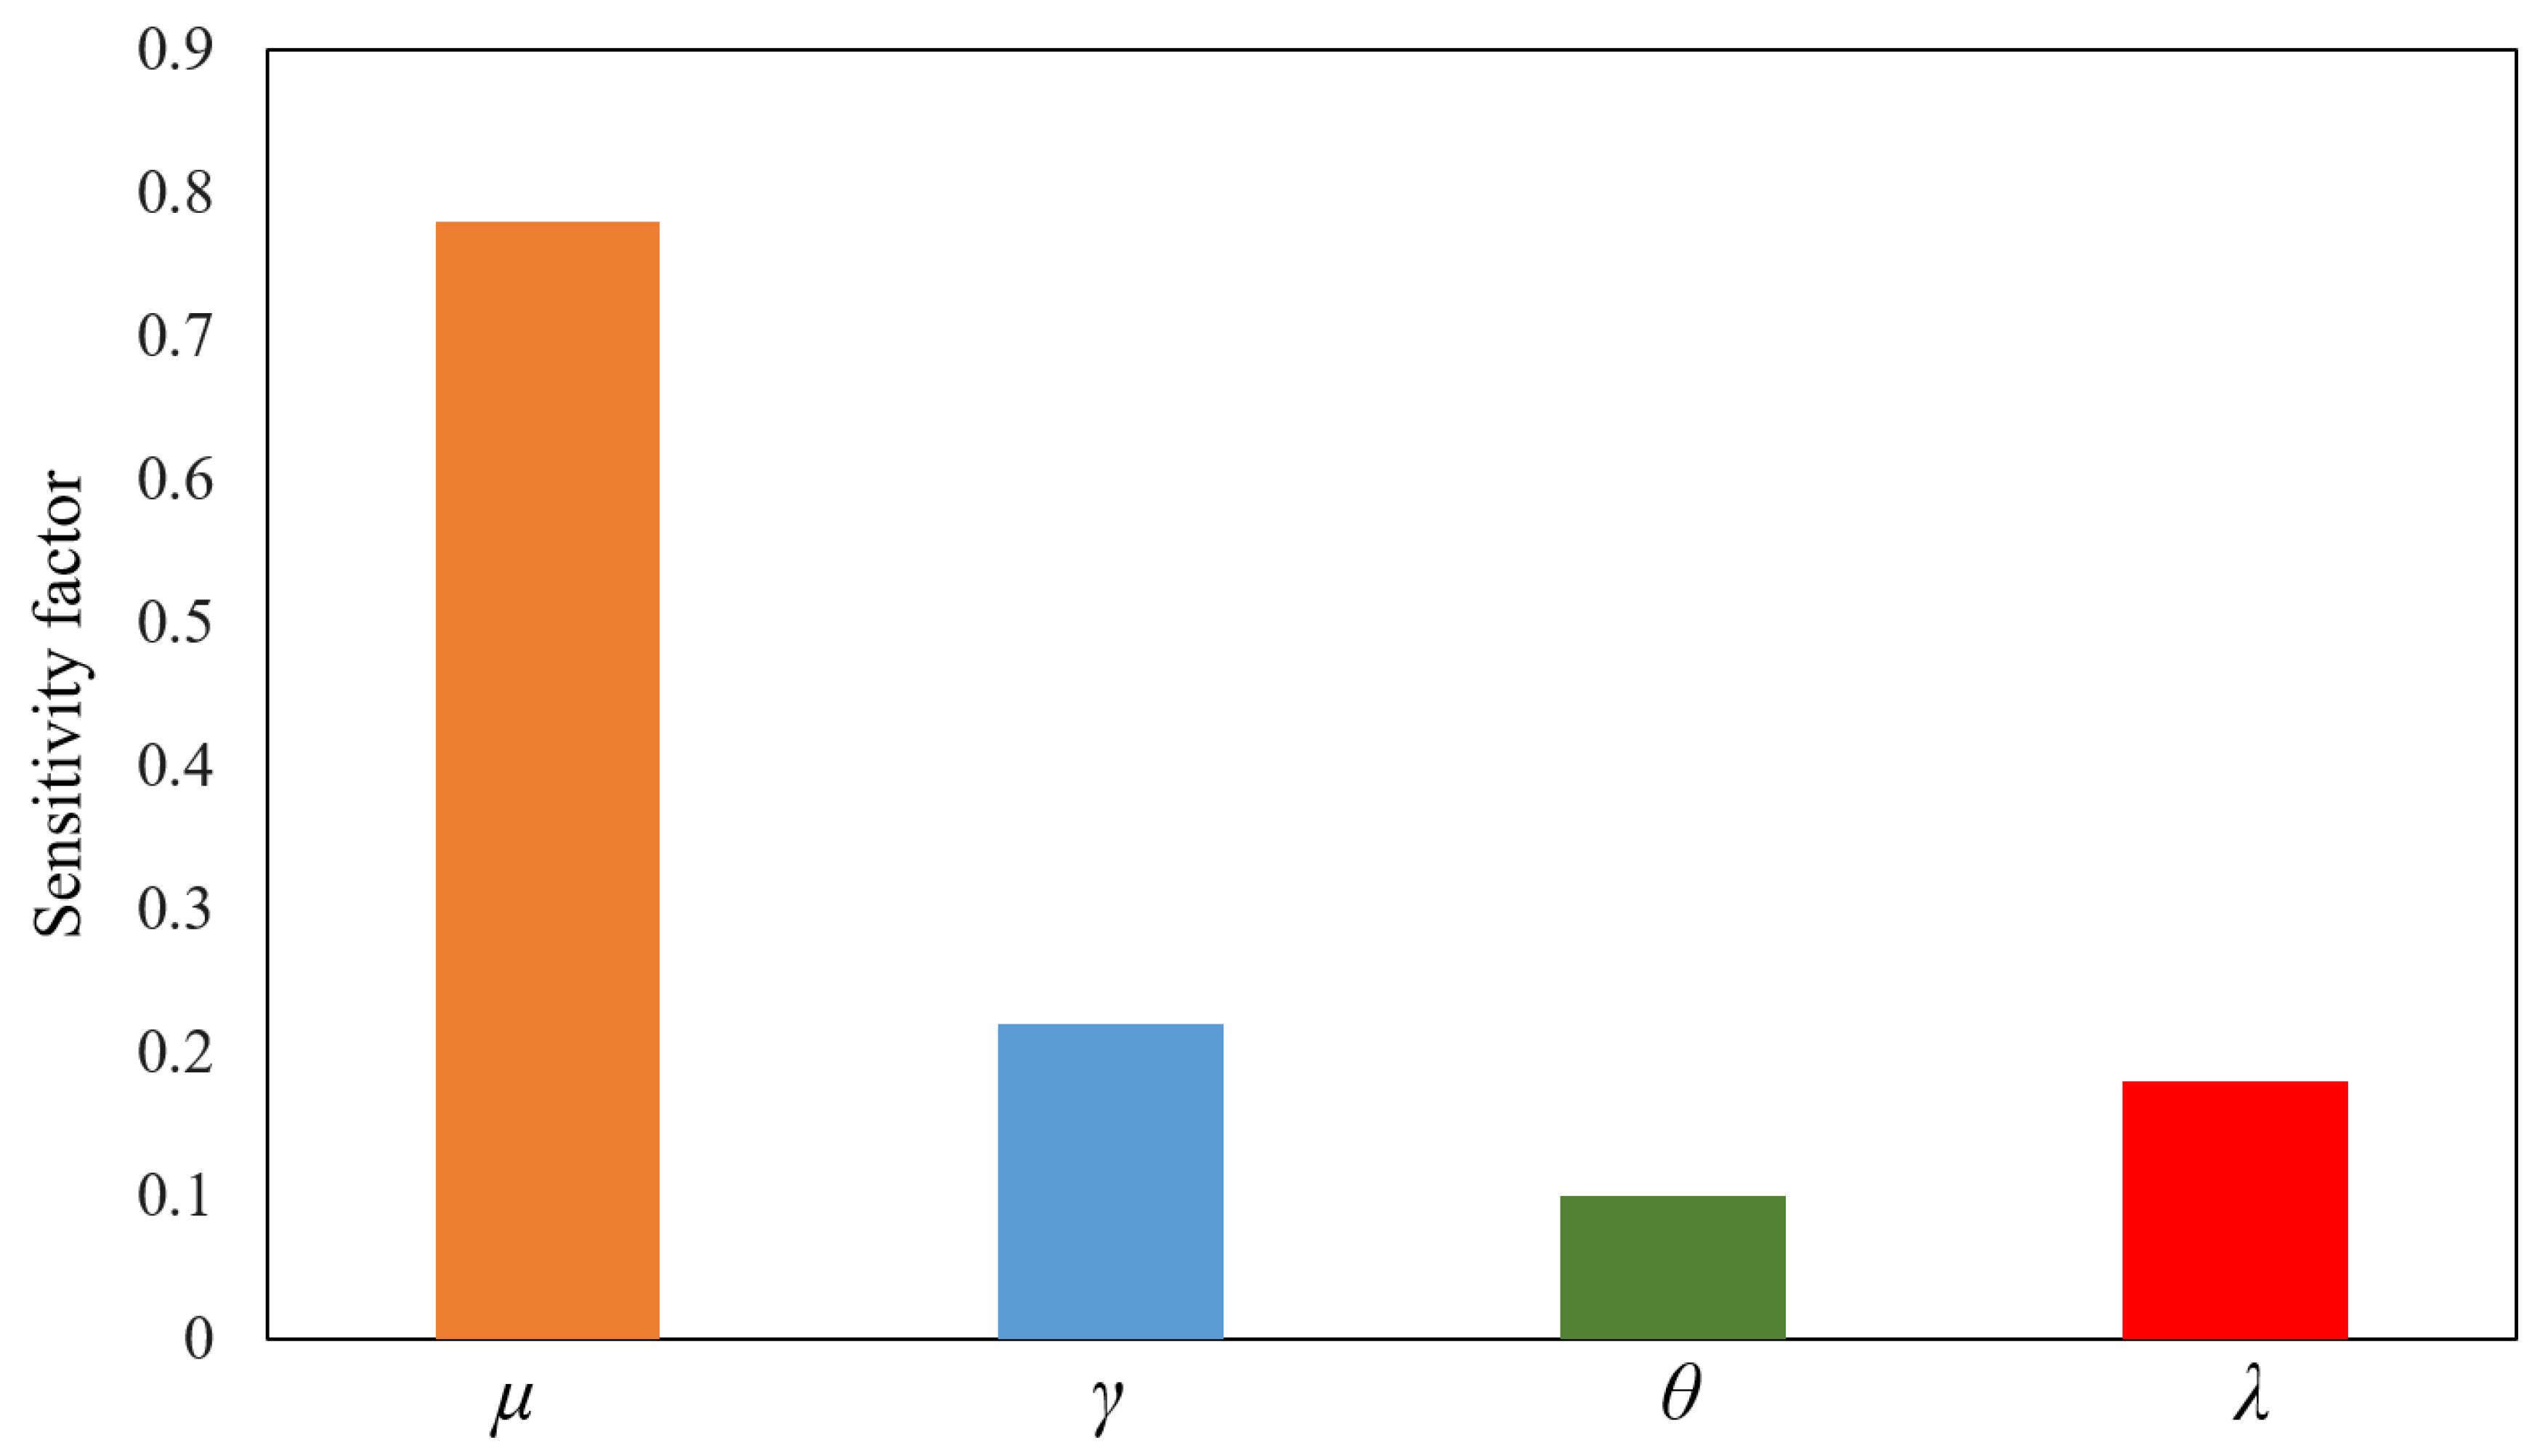
It can be seen that the imbibition rate constant k is most sensitive to changes in fluid viscosity (b = 0.78), followed by a combination of interfacial tension and wettability (a = 0.52), suggesting that viscosity is the dominant factor controlling the sorption rate, while interfacial properties have an important synergistic modulation of the sorption process.

4. Experimental Results and Analysis

4.1. Imbibition–Absorption Kinetic Curves

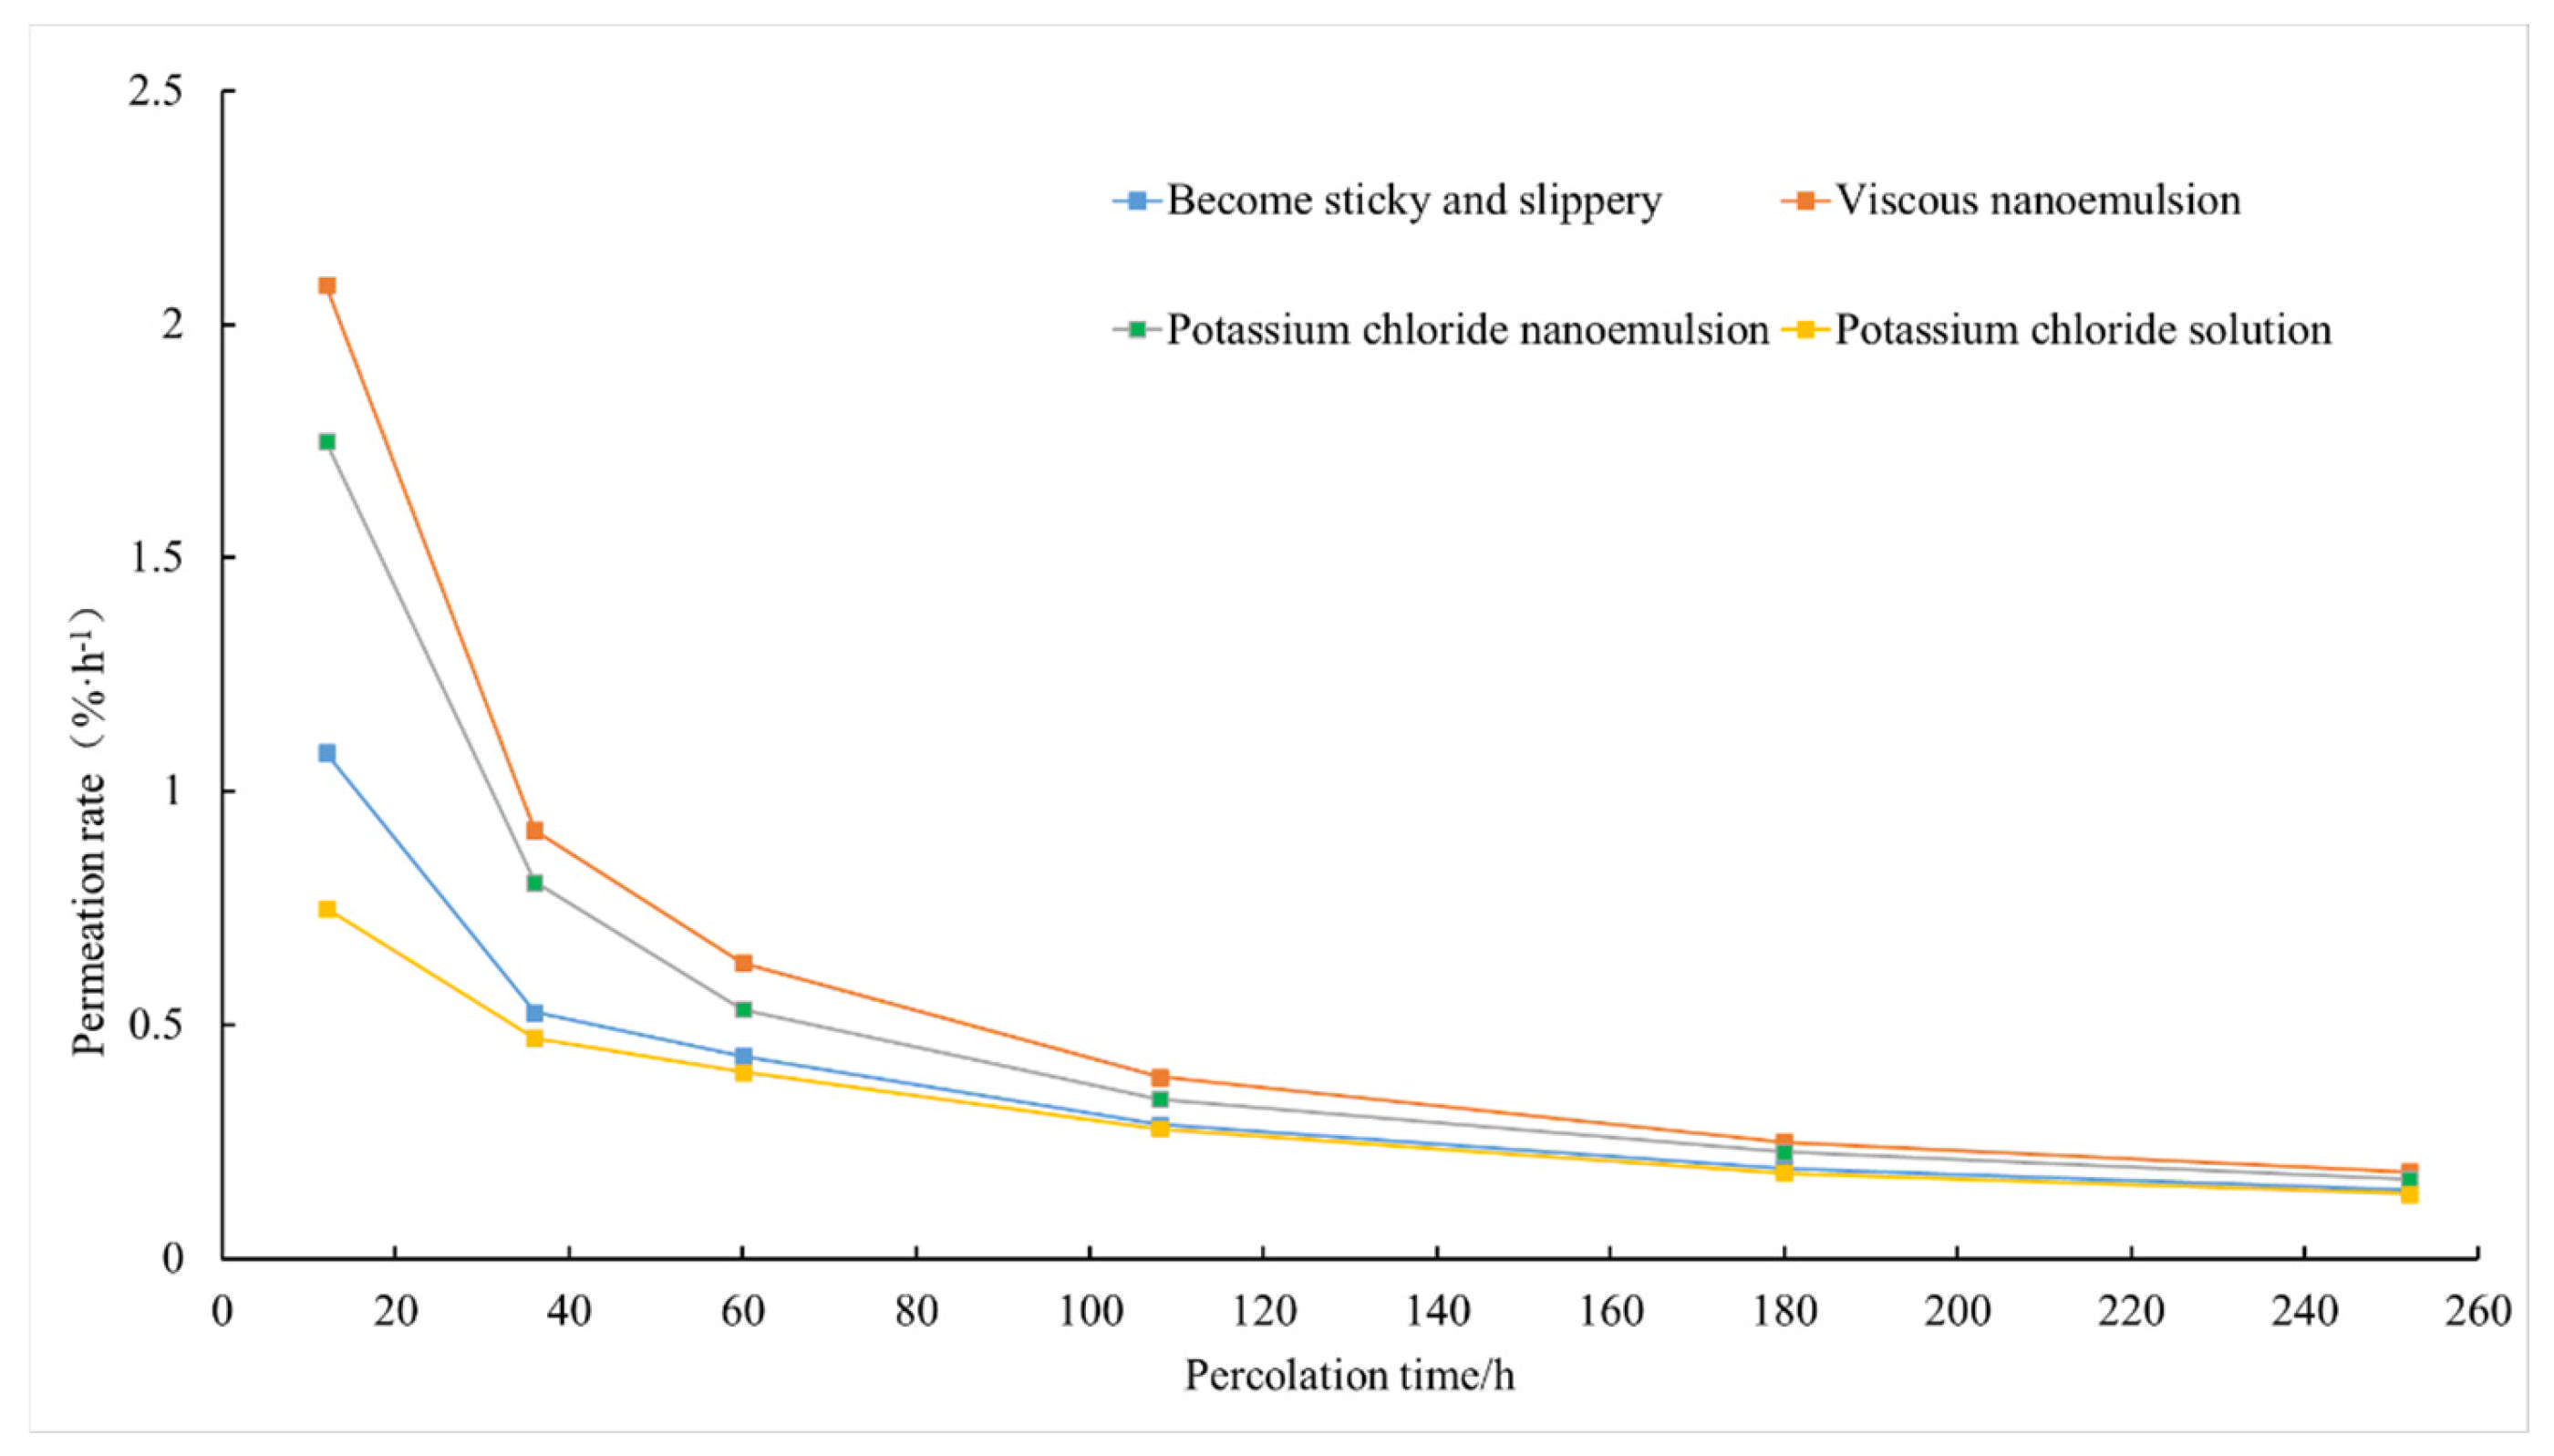
Figure 5 compares the imbibition recovery R ( t ) for the four fluid systems. The imbibition process can be divided into three stages. (1) Early rapid uptake (0–48 h): recovery increases quickly and is mainly driven by capillary pressure. The nanoemulsion (NE), with the lowest interfacial tension (1.72 mN/m) and the smallest contact angle (46.8°), reaches R = 0.55 within the first 12 h, which is ~62% higher than slickwater. (2) Transition stage (48–128 h): as viscosity and viscoelastic effects become more pronounced, flow resistance in small pores increases and the recovery rate gradually decreases; HPAM and NE show a more evident retardation behavior. (3) Late quasi-equilibrium stage (128–260 h): recovery approaches a plateau controlled by coupled wettability alteration and capillary–viscoelastic interactions. The equilibrium recoveries R are 0.42 (slickwater), 0.48 (KCl), 0.63 (HPAM), and 0.76 (NE).

4.2. NMR Spectra and Pore Size Contribution

In this study, multiscale characterization of imbibition dynamics is primarily achieved through time-resolved NMR T2 spectral analysis, while SEM observations are used as a complementary qualitative tool for identifying pore types and structural heterogeneity.
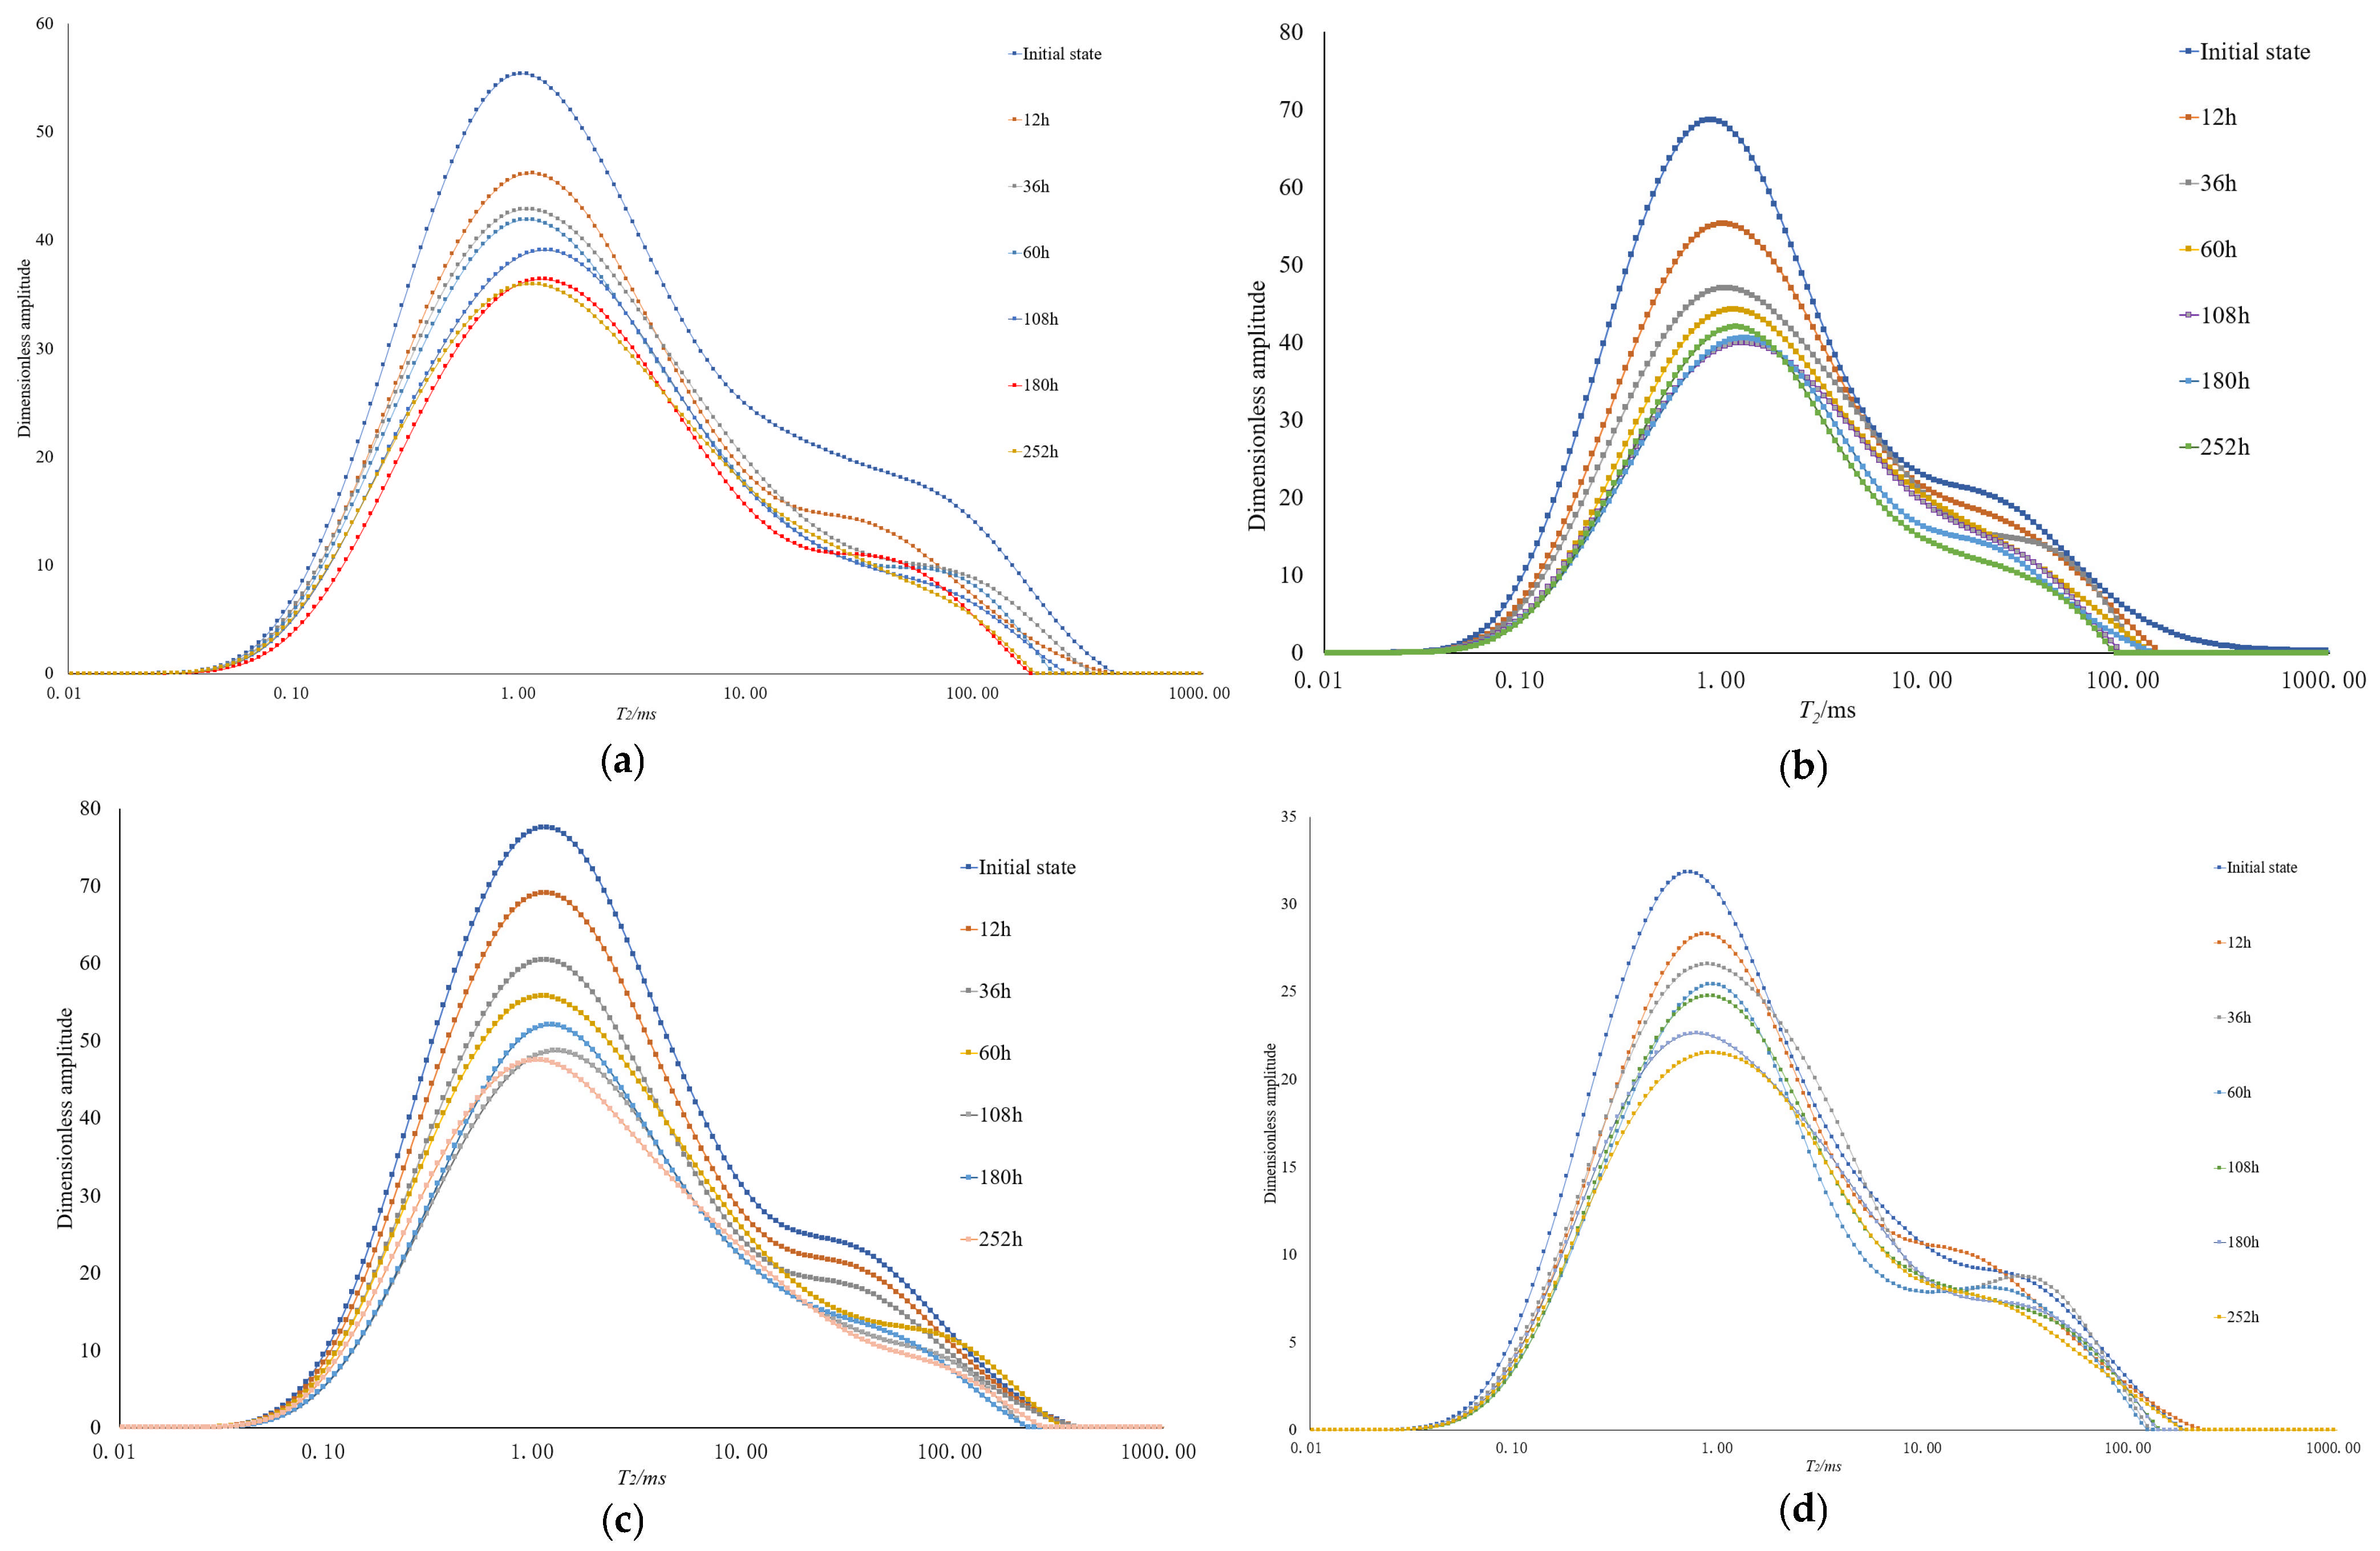
Nuclear magnetic resonance (NMR) technique was used to monitor the distribution and evolution characteristics of the fluid within the pore space during the imbibition process. Figure 6 shows the T2 distribution curves of different fracturing fluid systems at typical time nodes. The results show that with the extension of the imbibition time, the spectral peak area gradually decreases and the peak position is shifted to the right, which indicates that the inhaled fluid gradually spreads from the micropores to the large pores and connecting pores. For example, in the NE case, the peak T2 increases from ~0.50 ms at 0 h to ~0.82 ms at 60 h, providing quantitative support for the right-shift in the dominant relaxation component. Based on the empirical relationship between T2 and pore radius, r = a T2 + b, the pore space can be divided into three zones: small pore zone (T2 < 10 ms), medium pore zone (10 ms ≤ T2 < 100 ms), and large pore zone (T2 ≥ 100 ms). Calculated results show that in the early stage of imbibition (t < 12 h), the contribution of the small pore section is as high as 63–71%, which is the main space controlling the early imbibition rate; in the middle and late stages (t > 48 h), the contribution of the medium pore rises significantly to about 30%, which becomes the dominant pore size range to maintain the sustained imbibition; whereas the large pore has a contribution of less than 10% in the equilibrium stage, which mainly plays the role of a fluid connectivity and transport channel. The macropores contributed less than 10% at the equilibrium stage and mainly played the role of fluid connectivity and transportation channels.
Comparing the contributions of different pore sizes of each fracturing fluid system in the imbibition process, it can be seen that the imbibition contribution of the nanoemulsion system in the small pore section is increased by about 14%, which indicates that this system realizes more significant wettability reversal and capillary driving force enhancement in the micropores, and thus effectively promotes the suction and diffusion of the fluids in micropores; whereas the polymer viscous system has a higher contribution to the imbibition in the medium pore section, which is mainly due to the high viscosity, leading to a certain degree of retention of fluids in the medium pore channel, which concentrates the imbibition process towards the medium pore area. The higher viscosity leads to a certain degree of fluid retention in the medium-sized pore channels, which concentrates the imbibition and absorption process towards the mesopore region.
Although full 2D NMR maps are not included here, the time-resolved T2 spectra already demonstrate clear pore-scale redistribution of the imbibed fluids. The progressive shift in spectral peaks toward longer relaxation times and the expansion of peak areas provide sufficient evidence of fluid migration from micropores to meso- and macropores, thereby capturing the essential spatial evolution of the imbibition process even without full 2D visualization.

4.3. Contact Angle and Wettability Change

In order to reveal the change rule of wettability at the fluid–rock interface, a contact angle meter was used to measure the contact angle of each system on the surface of the core before and after imbibition (Table 4). The results show:
Among them, the nanoemulsion system exhibits the most significant wettability inversion effect, with the contact angle decreasing by about 69°. This result is consistent with the theory of interfacial adsorption layer: nanoparticles form an oleophobic and hydrophilic film layer on the rock surface, which greatly enhances the rock surface polarity, and thus boosts the capillary driving force, pc = 2γcosθ/r. With the same interfacial tension decreasing by 90%, the increase in capillary differential pressure due to the change in contact angle can be as much as 3 times, which explains the significant increase in the imbibition rate of the NE system.

4.4. Model Fitting and Parameter Analysis

The quantitative error metrics indicate consistently high model accuracy across all four fluid systems. R2 values range from 0.91 to 0.95, and RMSE remains below 0.03, confirming that the model captures both the early-time imbibition kinetics and the late-stage stabilization behavior (Table 5). No systematic bias is observed in the residual distribution.
Based on the kinetic model established in the previous section, the experimental data of the four fracturing fluid systems were nonlinearly fitted (Equation (17)), and the results showed that the goodness-of-fit R2 was more than 0.9, and the model was highly consistent with the experimental results. The sensitivity analysis of the parameters (see Figure 7) shows that the fluid viscosity μ is the main controlling factor influencing the imbibition rate (sensitivity of 0.78), and its change has the most significant influence on the imbibition process; the combined influence of the interfacial tension γ and the contact angle θ accounts for about 35%, which is a significant regulator of the imbibition rate; and the viscoelastic relaxation time λ shows a positive promotion of the equilibrium process in the mid- and late-stages of imbibition. The distribution of residuals is random with no obvious systematic deviation, indicating that the model has good applicability and prediction accuracy for different fluid systems.
Overall, the four fluid systems demonstrate distinct imbibition behaviors controlled by viscosity and interfacial properties. High-viscosity systems (HPAM, NE) exhibit slower early imbibition due to viscoelastic damping but achieve higher equilibrium recovery. In contrast, slickwater and KCl brine show faster early intake but limited ultimate recovery because of their higher interfacial tension and weaker wettability alteration. These results highlight that imbibition dynamics are governed by the coupling of viscosity, interfacial tension, and wettability evolution rather than any single factor.

5. Imbibition Mechanisms and Energy Analysis

5.1. Capillary–Viscoelastic Synergistic Mechanism

Energy terms were computed by integrating the corresponding driving/dissipation rates derived from Equations (18) and (19) over time, and the stage-wise percentages in Table 6 were obtained by normalizing each term by the total energy within the same time window.
According to the model calculation and experimental results, the total energy in the process of imbibition can be decomposed as:
E t o t a l = E c a p i l l a r y E v i s c o u s E e l a s t i c
where Ecapillary is the capillary energy, which is the energy released by the decrease in interfacial energy; Eviscous is the energy loss to overcome the viscous resistance in the flow process; and Eelastic is the fluid viscoelastic energy storage loss.
Through the energy distribution calculation of nanoemulsion system and polymer viscous system (see Table 6), it can be seen that, in the early stage of the imbibition (time less than 12 h), the capillary energy accounted for 82%, as the main driving force of the imbibition process; in the mid-stage (12–72 h), with the enhancement of the viscosity of the fluid and viscoelastic characteristics, the proportion of viscous dissipation rises to 35%, while viscoelastic energy storage accounts for 10%. 10%, the system energy distribution gradually tends to be complex; and in the later stage (more than 72 h), the capillary energy and viscoelastic energy storage reaches a relative balance, and the imbibition rate gradually tends to be stabilized, showing the characteristics of the synergistic effect of capillary drive and viscoelastic regulation.
The energy partition explains the “fast-then-slow” imbibition behavior of the nanoemulsion. In the early stage, capillary energy provides the dominant driving force and enables rapid fluid uptake into small pores. As imbibition proceeds, viscous dissipation increases and viscoelastic energy storage becomes non-negligible, which retards the imbibition rate but helps sustain transport during the late stage. As a result, the system transitions from capillary-dominated uptake to a coupled regime controlled by capillary driving and viscoelastic regulation.

5.2. Wettability Reversal and Interfacial Structure Effect

The results of magnetic resonance tests and contact angle experiments show that the nanoemulsions achieve significant wettability reversal in the process of imbibition, and the mechanism is mainly reflected in the following aspects: the nano-particles can be adsorbed on the surface of the rock to form a stable hydrophilic film layer, which reduces the adsorption of the oil-phase molecules; surfactant molecules are reorientated at the interface, and the polarity end is oriented towards the surface of the rock, so that the surface energy is significantly reduced; meanwhile, the stability of the emulsification system is enhanced under high temperature At the same time, the stability of the emulsification system is enhanced under high temperature conditions, and the oil droplet encapsulation effect is more durable. Figure 7 shows the relationship between the contact angle and the imbibition rate constant, and the results show that cosθ and the imbibition rate constant k show a good linear correlation (R2 = 0.92), i.e., the stronger the wettability (the smaller the contact angle), the higher the imbibition rate, which further verifies the dominant role of the capillary pressure in the imbibition process.

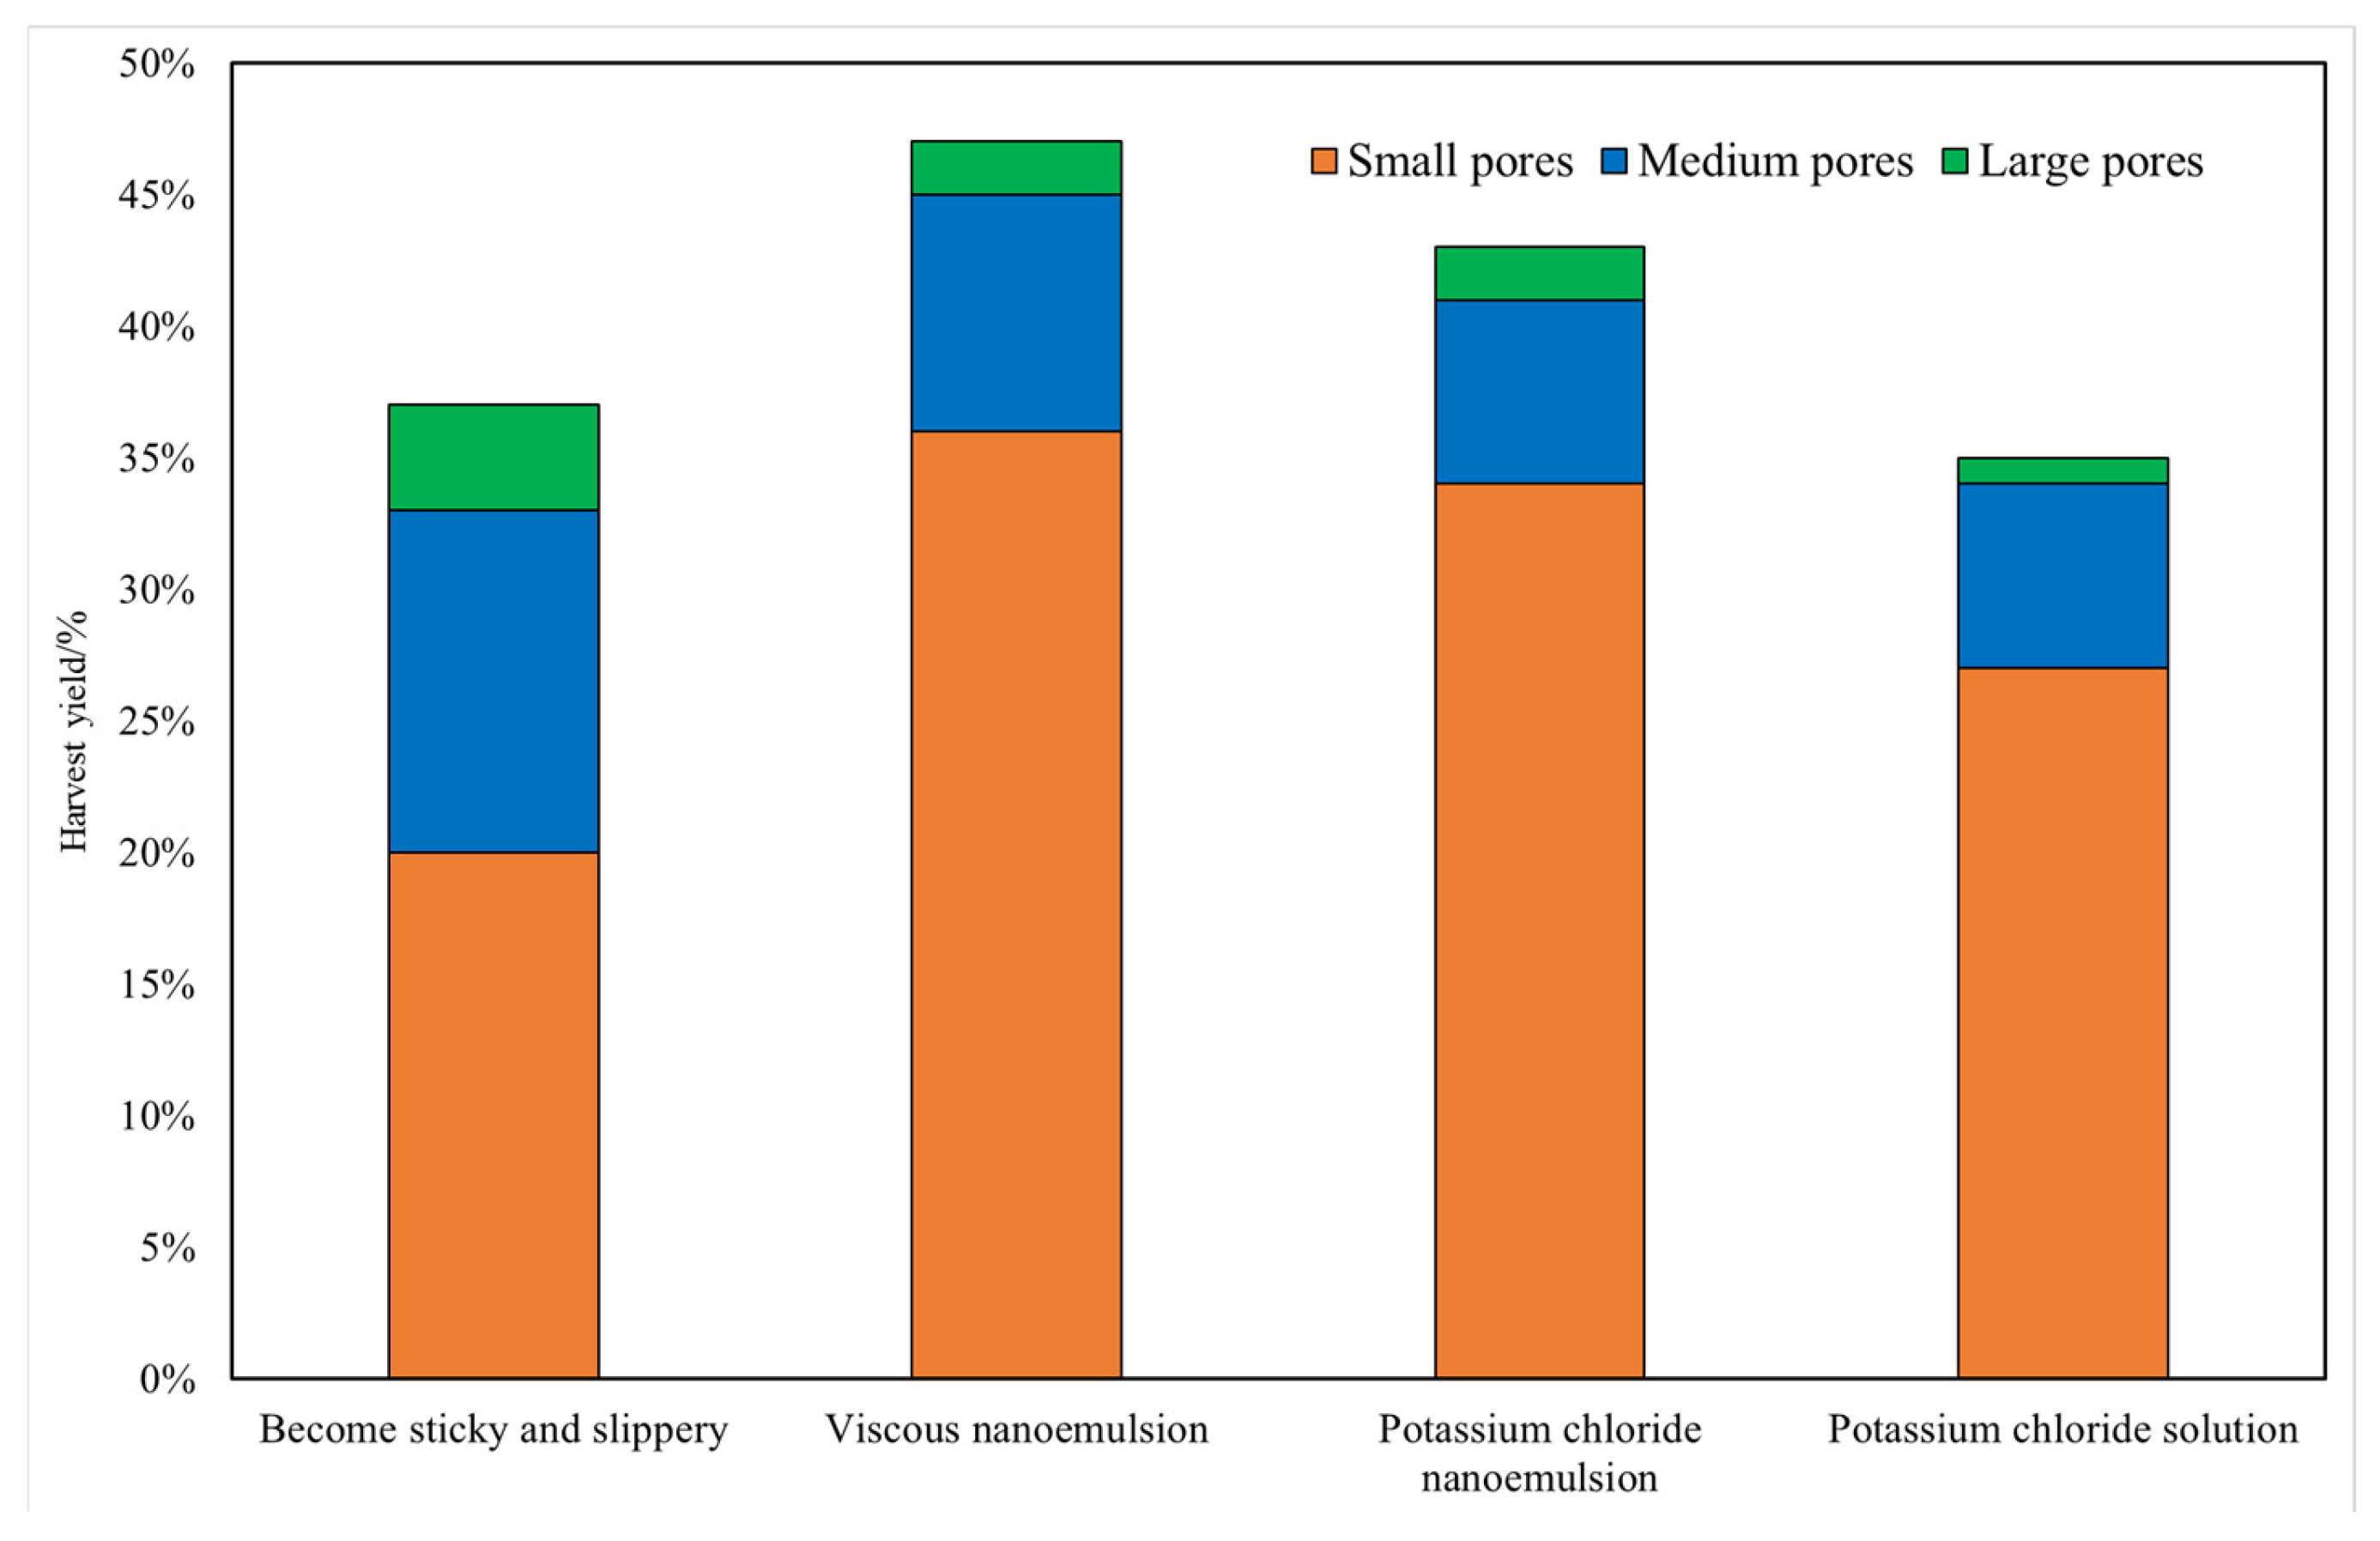
5.3. Multi-Scale Imbibition Behavior

Based on the pore-size-resolved information derived from NMR T2 spectra, complemented by SEM observations, the contributions of different pore-size segments during imbibition were analyzed (Figure 8). The results show that small pores (r < 0.5 μm) dominate the early stage of imbibition, with a contribution rate of 60–70%, and play a decisive role in the early rate of imbibition; medium pores (0.5–2 μm) continue to supply liquid in the middle and late stages, with a ratio of about 30%, and are the main range of pore sizes to maintain the stability of imbibition process; and large pores (r > 2 μm) play the role of a connecting and transporting channel, and contribute less than 10% of the overall imbibition rate. Large pores (r > 2 μm), on the other hand, mainly played the role of connecting and transferring channels and contributed less than 10% to the overall imbibition.
Further fitting of the small pore imbibition contribution Cs to the capillary pressure pc:
C s = 0.12 + 0.68 e x p ( p c p 0 )
where p0 = 1.2 × 10⁵ Pa is an empirical constant. This relationship indicates that when the capillary pressure decreases below about 105 Pa, the contribution of small pores to the imbibition process decreases rapidly, and the dominant mechanism of the system gradually changes from capillary-driven to viscoelastic-controlled phase.

6. Engineering Significance and Application Outlook

6.1. Design Implications and Recommended Parameter Window

The screening-based workflow is summarized as follows:
(i) Design parameters: viscosity μ , interfacial tension γ , and wettability represented by the equilibrium contact angle θ e q , with viscoelasticity as an auxiliary descriptor ( G / G ). These quantities are taken from Table 3 ( μ , γ , G / G ) and Table 4 ( θ e q ). (ii) Performance metrics—including the plateau recovery (R∞) and the time required to approach stabilization (e.g., reaching >90% of the plateau)—are evaluated from the recovery curves in Figure 5 and the corresponding kinetic fitting described in the Methods and Results sections. (iii) Importance ranking: sensitivity analysis (Figure 7) indicates that μ dominates the kinetic rate, while γ and wettability jointly regulate the overall imbibition efficiency. (iv) Decision logic: within the tested design points, the nanoemulsion provides the best overall trade-off between interfacial efficiency and operational viscosity, and is therefore selected as the recommended design target. Specifically, the nanoemulsion exhibits μ = 62.3 mPa·s and γ = 1.72 mN/m (Table 3) and achieves a strongly water-wet equilibrium state with θ e q = 46.8 ° (Table 5). Consequently, a practical target window of γ 2 mN/m, θ e q 50 ° , and μ 60 mPa·s is recommended within the tested rheological/interfacial range to maximize imbibition efficiency while maintaining feasible pumping/flowback. For completeness, the nanoemulsion formulation used in this study contained 0.2 wt% SiO2 nanoparticles (average size ~30 nm) as described in Section 2.2; the present recommendation is based on the tested formulation and may require recalibration for different compositions.

6.2. Optimization of Shut-In Time and Drainage Strategy

Based on the kinetic analysis, the imbibition recovery approaches stabilization after approximately 120–160 h (about 5–7 days), when more than 90% of the ultimate recovery is achieved. Therefore, a shut-in time of 6–8 days is recommended to allow sufficient imbibition while avoiding unnecessary delays in flowback and production startup. Here, we define t 90 as the time required to reach 90% of the plateau recovery R ; based on Figure 5 (recovery curves), t 90 falls in the range of ~120–160 h for the tested systems. In addition, combining wellbore pressure monitoring with microseismic diagnostics can help identify the turning point from rapid uptake to plateau behavior and thereby support a more objective decision on the optimal flowback timing. Premature flowback (i.e., an early pressure drawdown before the kinetics enters the plateau stage) may interrupt the capillary–viscoelastic uptake and reduce the effectiveness of oil mobilization; therefore, flowback is recommended after the rapid-uptake stage is completed.

6.3. Production Recovery and Field Application Strategy

Research results show that the imbibition–absorption process in Tight Conglomerate reservoirs is not driven by capillary action alone, but is a complex process in which capillary pressure and fluid viscoelasticity check and balance each other and work together. Based on this understanding, the concept of “viscoelastic–capillary synergistic regulation” should be introduced into the design of fracturing fluid system, and the comprehensive optimization of the imbibition–absorption and oil-driving process can be achieved by reasonably adjusting the viscoelastic modulus (G′/G″) and surface activity parameters (γ, θ) of the fluid. This strategy can effectively enhance the sustained infiltration ability of the fluid in the pore throat, reduce the interfacial energy consumption and capillary resistance, promote the release of residual oil in the return stage, and further enhance the flow conductivity and long-term recovery of the fractured cracks.
In the field application, it is recommended to organically combine the nanoemulsion system with segmental fracturing, temporary plugging and steering to construct a multi-scale fluid control system, so as to realize efficient imbibition and energy utilization of multi-stage pore space in the reservoir, and thus to comprehensively improve the fracturing and reforming effect of tight conglomerate reservoirs and the development efficiency.

6.4. Prospect of Subsequent Research

In order to further expand the application scope of the present research results and deepen the understanding of the mechanism of imbibition and suction in Tight Conglomerates, the follow-up work can be carried out in the following aspects. First, the viscoelastic–capillary coupling model should be constructed under high temperature and high-pressure conditions, the energy coupling equation at the interface between nanoemulsion and rock should be established, and the description of non-isothermal viscoelastic imbibition and absorption dynamics should be improved, so as to realize the accurate simulation of the real geologic environment of deep reservoirs. Secondly, we can rely on a large-scale true triaxial physical simulation device to carry out stress-imbibition-chemistry multi-field synergistic experiments to quantitatively reveal the coupling mechanism of interface evolution, pore structure reconstruction and energy conversion.
In addition, it is recommended to introduce the real-time monitoring technology of fiber-optic distributed acoustic wave (DAS) and nuclear magnetic resonance (NMR) in the on-site fracturing construction to dynamically track the process of imbibition and fluid diffusion, and to realize the parameter correction by combining with the model inversion, so as to build a predictable and controllable imbibition optimization system. At the same time, experimental data should be combined with numerical simulation to establish a computational fluid dynamics (CFD) model based on porous media flow and a multi-scale imbibition and suction inversion algorithm, so as to realize cross-scale prediction from core to wellbore and from laboratory to field, and to provide scientific support and decision-making basis for the development and production optimization of tight oil fields.

7. Conclusions

This study integrates time-resolved NMR experiments with a multiscale capillary–viscoelastic coupling framework to elucidate the spontaneous imbibition behavior of non-Newtonian fracturing fluids in tight conglomerate rocks. By linking pore-scale fluid redistribution, wettability evolution, and viscoelastic effects, a unified physical picture of imbibition dynamics is established. The results demonstrate that imbibition in tight conglomerates is inherently multiscale and time-dependent, governed by the coupled action of capillary driving forces in smaller pores and viscoelastic regulation during later stages of fluid transport, rather than by a single dominant mechanism.
Against the knowledge gaps identified in previous studies, this work provides several novel contributions. First, multiscale imbibition behavior is quantitatively characterized using time-resolved NMR T2 spectra, enabling direct identification of pore-size-resolved contributions during different imbibition stages. Second, a capillary–viscoelastic coupling model is developed by extending the classical Lucas–Washburn framework to incorporate pore-size distribution, dynamic wettability alteration, and viscoelastic damping, allowing accurate reproduction of experimentally observed imbibition kinetics. Third, energy partition analysis reveals the dynamic transition from capillary-dominated early imbibition to viscoelastic-regulated late-stage transport, offering a mechanistic explanation for the enhanced performance of non-Newtonian fluid systems.
The implications of these findings extend beyond the specific experimental system investigated in this study. The proposed framework provides a generalizable approach for interpreting spontaneous imbibition in tight and heterogeneous reservoirs, where complex fluid rheology and evolving interfacial properties play a critical role. In particular, the results highlight that optimizing fracturing fluid formulations requires simultaneous consideration of capillary efficiency, wettability alteration, and viscoelastic behavior, rather than focusing on individual fluid properties in isolation.
Several limitations of the present study should be acknowledged. Multiscale characterization is primarily based on NMR-derived dynamic pore-scale information, while high-resolution imaging techniques are used only for qualitative structural assessment. In addition, the experiments are conducted at the core scale under controlled laboratory conditions, which may not fully capture the coupled effects of in situ stress, temperature, and fracture–matrix interactions present in field-scale reservoirs.
Future work should aim to integrate high-resolution imaging, true triaxial physical simulation, and in situ monitoring techniques to further validate and extend the proposed capillary–viscoelastic coupling framework. Coupling laboratory observations with numerical modeling and field data will be essential for translating the mechanistic insights obtained in this study into predictive tools for optimizing fracturing operations and shut-in strategies in tight reservoirs.

Author Contributions

Methodology, C.Z.; data curation, Y.W. and X.X.; writing—original draft preparation, X.G.; writing—review and editing, X.G., S.Z. and J.Z.; supervision, J.Z.; funding acquisition, C.Z. All authors have read and agreed to the published version of the manuscript.

Funding

This research was funded by Silk Road Economic Belt Innovation-Driven Development Pilot Zone & Urumqi-Changji-Shihezi National Independent Innovation Demonstration Zone Science and Technology Development Program (Grant No. 2024LQ03023) and Karamay Municipal Science and Technology Program (Champion Project) (Grant No. HX20231166).

Data Availability Statement

The data supporting the findings of this study are available from the corresponding author upon reasonable request.

Acknowledgments

This research was financially supported by Xinjiang Autonomous Region Key Laboratory “Xinjiang Petroleum Engineering Pilot-Scale Key Laboratory”, the Science and Technology Development Program of the Silk Road Economic Belt Innovation-driven Development Pilot Zone and Urumqi–Changji–Shihezi National Independent Innovation Demonstration Zone. The authors gratefully acknowledge this support.

Conflicts of Interest

The authors declare no conflicts of interest.

References

  1. Jing, W.; Huiqing, L.; Genbao, Q.; Yongcan, P.; Yang, G. Investigations on spontaneous imbibition and the influencing factors in tight oil reservoirs. Fuel 2019, 236, 755–768. [Google Scholar] [CrossRef] [Scilit]
  2. Xia, Y.; Tian, Z.; Xu, S.; Wei, W.; Cai, J. Effects of microstructural and petrophysical properties on spontaneous imbibition in tight sandstone reservoirs. J. Nat. Gas Sci. Eng. 2021, 96, 104225. [Google Scholar] [CrossRef] [Scilit]
  3. Wang, Q.; Zhou, F.; Su, H.; Zhang, S.; Dong, R.; Yang, D.; Wang, Y.; Chen, Z.; Li, J. Experimental evaluations of nano high-viscosity friction reducers to improve acid fracturing efficiency in low-permeability carbonate reservoirs. Chem. Eng. J. 2024, 483, 149358. [Google Scholar] [CrossRef] [Scilit]
  4. Pryazhnikov, M.I.; Zhigarev, V.A.; Minakov, A.V.; Nemtsev, I.V. Spontaneous imbibition experiments for enhanced oil recovery with silica nanosols. Capillarity 2024, 10, 73–86. [Google Scholar] [CrossRef] [Scilit]
  5. Hu, Y.; Zhao, C.; Zhao, J.; Wang, Q.; Zhao, J.; Gao, D.; Fu, C. Mechanisms of fracturing fluid spontaneous imbibition behavior in shale reservoir: A review. J. Nat. Gas Sci. Eng. 2020, 82, 103498. [Google Scholar] [CrossRef] [Scilit]
  6. Xiao, Y.; You, Z.; He, Y.; Du, Z.; Zheng, J.; Wang, L. Capillary-dominated imbibition in heterogeneous-wet reservoirs: Mechanisms, characterizations, and critical insights. Geoenergy Sci. Eng. 2025, 246, 213606. [Google Scholar] [CrossRef] [Scilit]
  7. Zhao, M.; Ma, Z.; Song, X.; Wu, W.; Sun, Y.; Cheng, Y.; Wang, X.; Yan, X.; Dai, C. Study on the main factors and mechanism of functional silica nanofluid spontaneous imbibition for enhanced oil recovery. J. Mol. Liq. 2024, 394, 123699. [Google Scholar] [CrossRef] [Scilit]
  8. Li, Q.; Wang, Y.; Wei, B.; Wang, L.; Lu, J.; Tang, J. Imbibition oil recovery from tight reservoir cores using microemulsion: Experiment and simulation. Capillarity 2024, 10, 38–47. [Google Scholar] [CrossRef] [Scilit]
  9. Sun, Z.; Li, M.; Yuan, S.; Hou, X.; Bai, H.; Zhou, F.; Liu, X.; Yang, M. The flooding mechanism and oil recovery of nanoemulsion on the fractured/non-fractured tight sandstone based on online LF-NMR experiments. Energy 2024, 291, 130226. [Google Scholar] [CrossRef] [Scilit]
  10. Li, Y.; Fu, P.; Zhang, L.; Wang, Y.; Zhang, D.; Guo, R.; Tian, M.; Han, X.; Zhou, F.; Chen, L. Evaluation of nanoemulsion properties in tight sandstone reservoir. J. Mol. Liq. 2025, 433, 127955. [Google Scholar] [CrossRef] [Scilit]
  11. Kumar, N.; Pal, N.; Mandal, A. Nanoemulsion flooding for enhanced oil recovery: Theoretical concepts, numerical simulation and history match. J. Pet. Sci. Eng. 2021, 202, 108579. [Google Scholar] [CrossRef] [Scilit]
  12. Massarweh, O.; Abushaikha, A.S. Application of surfactants in enhancing oil recovery from tight carbonates: Physicochemical properties and core flooding experiments. Geoenergy Sci. Eng. 2023, 221, 211400. [Google Scholar] [CrossRef] [Scilit]
  13. Lyu, C.; Ning, Z.; Chen, M.; Wang, Q. Experimental study of boundary condition effects on spontaneous imbibition in tight sandstones. Fuel 2019, 235, 374–383. [Google Scholar] [CrossRef] [Scilit]
  14. Shen, M.; Zhang, C.; Yan, X.; Wang, L.; Wu, Y.; Jin, X. Research progress and prospects of utilizing carbon-based nanomaterials in enhanced oil recovery. Adv. Geo-Energy Res. 2024, 14, 201–214. [Google Scholar] [CrossRef] [Scilit]
  15. Xu, H.; Li, Y.; Wu, H.; Ding, Z.; Yuan, S.; Bai, H.; Yao, E.; Zhou, F. Development and performance evaluation of nonionic surfactant-stabilized nanoemulsion for enhanced oil recovery applications in tight reservoir. Phys. Fluids 2024, 36, 032015. [Google Scholar] [CrossRef] [Scilit]
  16. Yang, L.; Li, J.; Dong, Q.; Wang, F.; He, H.; Meng, Z. Preparation and Application Research of Highly Efficient Suction-Driven Oil Displacement Agents for Ultra-Low-Permeability Reservoirs. Appl. Chem. 2025, 54, 1236–1241. [Google Scholar] [CrossRef]
  17. Yang, Y.-B.; Xiao, W.-L.; Zheng, L.-L.; Lei, Q.-H.; Qin, C.-Z.; He, Y.-A.; Liu, S.-S.; Li, M.; Li, Y.-M.; Zhao, J.-Z.; et al. Pore throat structure heterogeneity and its effect on gas-phase imbibition capacity in tight sandstone reservoirs: A case study from the Triassic Yanchang Formation, Ordos Basin. Pet. Sci. 2023, 20, 2892–2907. [Google Scholar] [CrossRef] [Scilit]
  18. Li, G.; Gao, H.; Qi, Y.; Zhang, C.; Cheng, Z.; Li, T.; Wang, C.; Li, H. Study on the Mechanism of Clean Fracturing Fluid Permeation and Displacement in Tight Reservoirs Based on 2D Nuclear Magnetic Resonance Technology. Bull. Pet. Sci. 2025, 10, 283–297. [Google Scholar]
  19. Wang, Y.; Shang, Q.; Zhou, L.; Jiao, Z. Utilizing macroscopic areal permeability heterogeneity to enhance the effect of CO2 flooding in tight sandstone reservoirs in the Ordos Basin. J. Pet. Sci. Eng. 2021, 196, 107633. [Google Scholar] [CrossRef] [Scilit]
  20. Xiao, Y.; Liu, Y.; He, Y.; Wang, L.; Guo, B.; Li, G.; Du, Z. Impacts of mineralogy and pore structure on spontaneous imbibition in tight glutenite reservoirs. Geoenergy Sci. Eng. 2023, 227, 211943. [Google Scholar] [CrossRef] [Scilit]
  21. Wang, H.; Cai, J.; Su, Y.; Jin, Z.; Wang, W.; Li, G. Imbibition behaviors in shale nanoporous media from pore-scale perspectives. Capillarity 2023, 9, 32–44. [Google Scholar] [CrossRef] [Scilit]
  22. Hou, X.; Zhang, F.; Hu, G.; Zhang, T.; Miao, H. Current Status and Prospects of Surfactants for Suction-Driven Oil Recovery. Chem. Eng. 2024, 38, 70–74. [Google Scholar] [CrossRef]
  23. Tian, Y.; Liao, Y.; Zhao, Y.; Wang, J.; Yao, L.; Liao, Y.; Han, G.; Meng, S. Deciphering wetting mechanisms in janus membranes via real-time impedance spectroscopy for stable oily wastewater desalination. Desalination 2026, 623, 119833. [Google Scholar] [CrossRef] [Scilit]
Figure 1. Photographs of experimental cores (from left to right: MH-1 to MH-4).
Processes 14 00625 g001
Figure 2. Scanning Electron Microscope Results for Tight conglomerate.
Processes 14 00625 g002
Figure 3. Contact Angle Test Results for Fracturing Fluid.
Processes 14 00625 g003
Figure 4. Confined thermostatic NMR imbibition monitoring system.
Processes 14 00625 g004
Figure 5. Imbibition recovery R(t) of four fluid systems versus time.
Processes 14 00625 g005
Figure 6. Time-resolved NMR T2 distributions during spontaneous imbibition for (a) slickwater, (b) KCl brine, (c) HPAM, and (d) nanoemulsion.
Processes 14 00625 g006
Figure 7. Parameter sensitivity analysis diagram.
Processes 14 00625 g007
Figure 8. Comparison of crude oil recovery under different fluid systems.
Processes 14 00625 g008
Table 1. Petrophysical properties of tight conglomerate core samples.
Sample NumberPorosity φ
(%)
Permeability k
(×10−3 μm2)
Average Particle Size
(mm)
Feldspar (%)Calcite
(%)
Clay
(%)
MH-18.50.451.855810
MH-27.90.371.6501213
MH-36.80.251.3521011
MH-46.10.121.449912
Table 2. Physical parameters of the fracturing fluid system.
Fluid SystemViscosity μ (mPa·s)Interfacial Tension γ (mN/m)Contact Angle θ (°)Potentiometric ζ (mV)Viscoelastic Modulus G′/G″ (Pa)
Slickwater14.824.1135.8/0.21/0.12
KCl solution16.318.7101.9/0.27/0.16
HPAM Viscoelastic45.57.8398.3/1.12/0.88
Nanoemulsion62.31.7298.1−36.51.76/1.15
Table 3. Empirical parameter fitting table.
Parametersabcd
numerical value0.520.780.210.35
Table 4. Contact angle change in rock core.
Fluid SystemInitial Contact Angle θ0 (°)Equilibrium Contact Angle θeq (°)Decline (%)
Slickwater115.6109.85.0
KCl solution103.496.27.0
HPAM Viscoelastic79.558.726.2
Nanoemulsion115.646.859.5
Table 5. Model Fitting Accuracy Metrics.
Fluid SystemR2RMSE (Dimensionless Recovery)
Slickwater0.910.024
KCl brine0.930.021
HPAM0.940.017
Nanoemulsion0.950.015
Table 6. Energy distribution of nanoemulsion system and polymer-to-viscous system.
Imbibition StageCapillary Energy (%)Viscous Dissipation (%)Viscoelastic Storage (%)
Early stage (0–12 h)82144
Mid-term (12–72 h)553510
Late stage (>72 h)473815
Disclaimer/Publisher’s Note: The statements, opinions and data contained in all publications are solely those of the individual author(s) and contributor(s) and not of MDPI and/or the editor(s). MDPI and/or the editor(s) disclaim responsibility for any injury to people or property resulting from any ideas, methods, instructions or products referred to in the content.