Article

Mathematical Modeling and Sustainable Optimization of Rubberized Asphalt Mix Design Using Deep Learning Approach


1
Department of Civil Engineering, College of Engineering, University of Bahrain, Sakhir 32038, Bahrain
2
Department of Urban and Infrastructure Engineering, NED University of Engineering and Technology, Karachi 75270, Pakistan
3
Department of Civil and Environmental Engineering, College of Engineering, King Faisal University, PO Box 380, Al-Ahsa 31982, Saudi Arabia
*
Authors to whom correspondence should be addressed.
Processes 2026, 14(4), 621; https://doi.org/10.3390/pr14040621
Submission received: 13 January 2026 / Revised: 28 January 2026 / Accepted: 8 February 2026 / Published: 11 February 2026
(This article belongs to the Section AI-Enabled Process Engineering)

Abstract

The integration of recycled materials, such as tire rubber, into asphalt mixtures is a critical strategy for sustainable pavement engineering. This research aimed to employ deep learning (DL) to mathematically model and optimize Marshall stability and flow for asphalt mixes prepared with recycled rubber. The Multi-Layer Perceptron (MLP) regressor was used to predict these parameters using six design parameters. The DL approach could handle multiple outputs and provided noticeable improvement over the baseline regressor models. The analysis identified the sample volume as the most important variable followed by proportion of the recycled rubber and air voids. Using the DL model as a digital simulator, the optimal mix characteristics were found to be in the range of 3.8% to 4% bitumen and 4% to 5.5% recycled rubber. These findings validate the use of DL for efficient design of sustainable infrastructure materials.

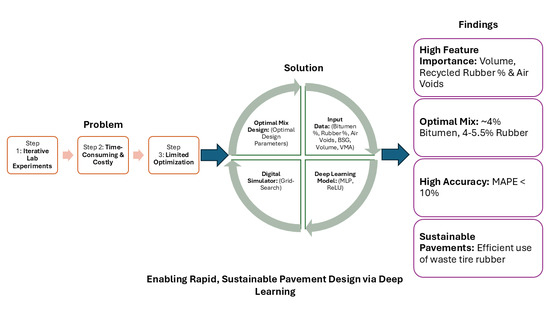
Graphical Abstract

1. Introduction

Sustainable pavement engineering focuses on integrating environmental and economic considerations into the design and lifecycle of pavements [1]. It involves the use of recycled materials, lifecycle assessments, innovative technologies, and preventive treatments [2].
Recycled materials are commonly used to replace virgin asphalt binder and aggregates, thus reducing their consumption while minimizing waste [3]. Such practices have proved to be environmentally beneficial in the construction industry [4].
However, it is crucial to ensure that these sustainable practices do not compromise pavement, performance, and durability. Proper modification and engineering of mix designs is necessary to achieve or improve the design specifications [5]. Among the mix design methods, Marshall mix design is used in many countries across the world due to its simplicity and cost-effectiveness [6]. This traditional process is iterative, time-consuming [7] and may not easily capture complex non-linear interactions between mix parameters [8].
To address these issues, there has been a shift in the attention of researchers towards the use of machine learning (ML) techniques. The shift is attributed to the non-linear variable interactions and lack of a piori knowledge about the impact of recycled materials. ML techniques, especially deep learning (DL) models, excel in capturing non-linear relationships in data with high dimensionality [9]. Therefore, researchers have already ventured into the prediction of asphalt properties using ML techniques [10]. However, research employing DL as a simulator for rubberized asphalt mixtures is still limited.
To address this gap, this study proposes a convenient solution of applying a DL model, namely a digital twin, to simulate the Marshall design process. This novel, data-driven ML-based optimization approach can be used to support empirical design methods.
The remainder of this paper is structured as follows. Section 2 provides the methodology, including a description of the available data and analysis techniques. Section 3 contains the results of this research including model performance, feature importance, and optimization results. Lastly, Section 4 highlights the main findings and provides key recommendations.

2. Methodology

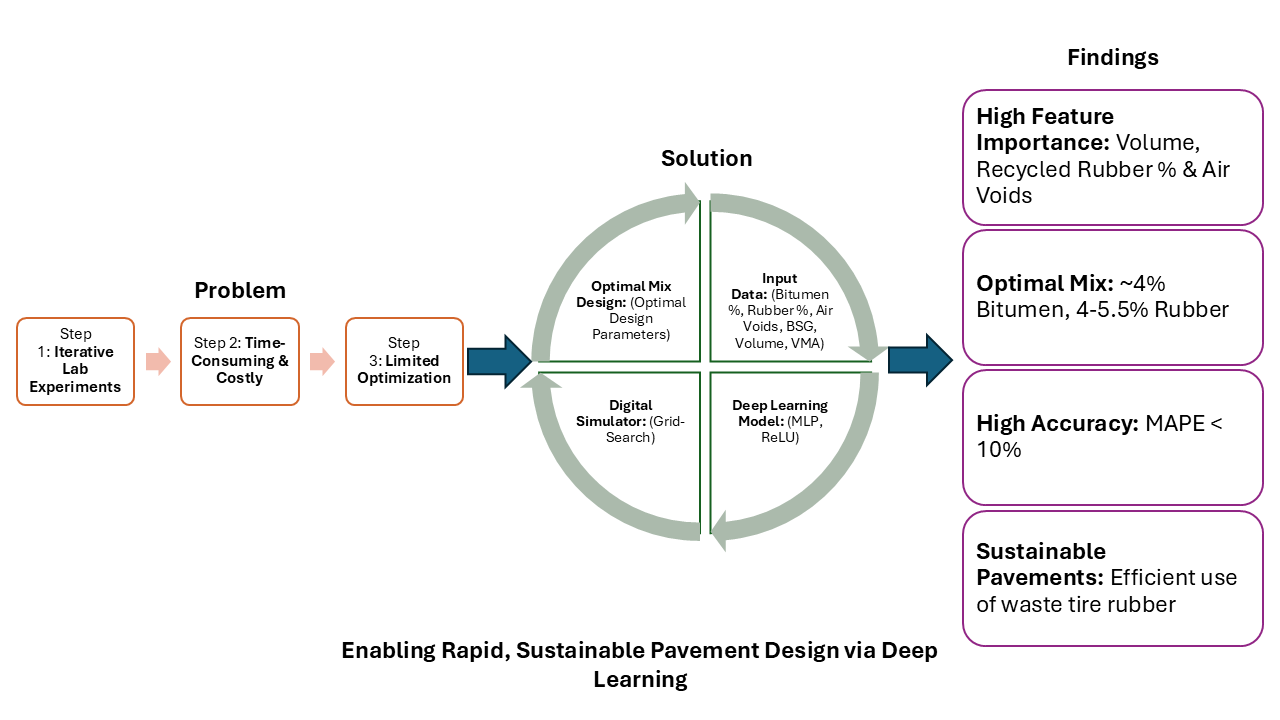
Figure 1 shows the research methodology adopted for this study. The crucial practical novelty of this study lies in the use of the digital twin concept for practical design optimization. The methodology starts with the experimental program, moves on to data processing and then to model training. This is followed by feature analysis and design optimization. The process is described in further detail in the subsequent sections.

2.1. Data Description

The dataset was acquired from a comprehensive and thorough experimental program. It centered on the preparation of two kinds of samples, conventional and modified samples. Modified samples were prepared using recycled tire crumb rubber as an additive. The samples went through the Marshal Mix design process in the laboratory at optimum temperatures to evaluate the effect of water on both kinds of samples. During the laboratory work, standard test methods were employed as they provided accuracy and validity to our work. More details about the experimental program are available in Qadir et al. [11].
There were 57 samples tested during the program. The input features used in the modeling process were bitumen %, bulk specific gravity, air void %, mineral aggregate void %, recycled rubber %, and volume (cm3). On the other hand, the target outputs included corrected Marshall stability and Marshall flow. The descriptive statistics of these parameters are given in Table 1. The small sample size is one of the limitations of this study.
The table shows that bitumen % is in the range of 3.0% to 5.0%, which is perfectly standard for asphalt mixes. Mineral aggregate void % values are between 14.17 and 17.45%. Corrected Marshall stability values (~2876 to ~5482 lbs) are high due to a dense-graded mix. They are also expected to be higher for samples modified with rubber, which can increase stability, as noted by Al-Mosawe [12]. The small dataset (n = 57) remains a valid limitation, but the data are reliable, as shown with these observations. Moreover, material investigation studies often face this issue due to resource restrictions. However, this issue was dealt with by employing a representative test sample to validate the data and regularizing the model training process. This robust methodology provided meaningful insights into the underlying process of the experiments.

2.2. Data Preprocessing

The first step in the modeling process was to calculate the values of corrected Marshall stability, which is one of the target parameters. Marshall flow is the other target. Considering the size of the dataset, a standard 5-fold cross-validation scheme was used for model training and validation. Feature scaling is also an essential process to enable neural networks to handle outliers, especially with multiple outputs. Hence, all features were standardized using mean of 0 and standard deviation of 1, a process which can also be referred to as normalization.
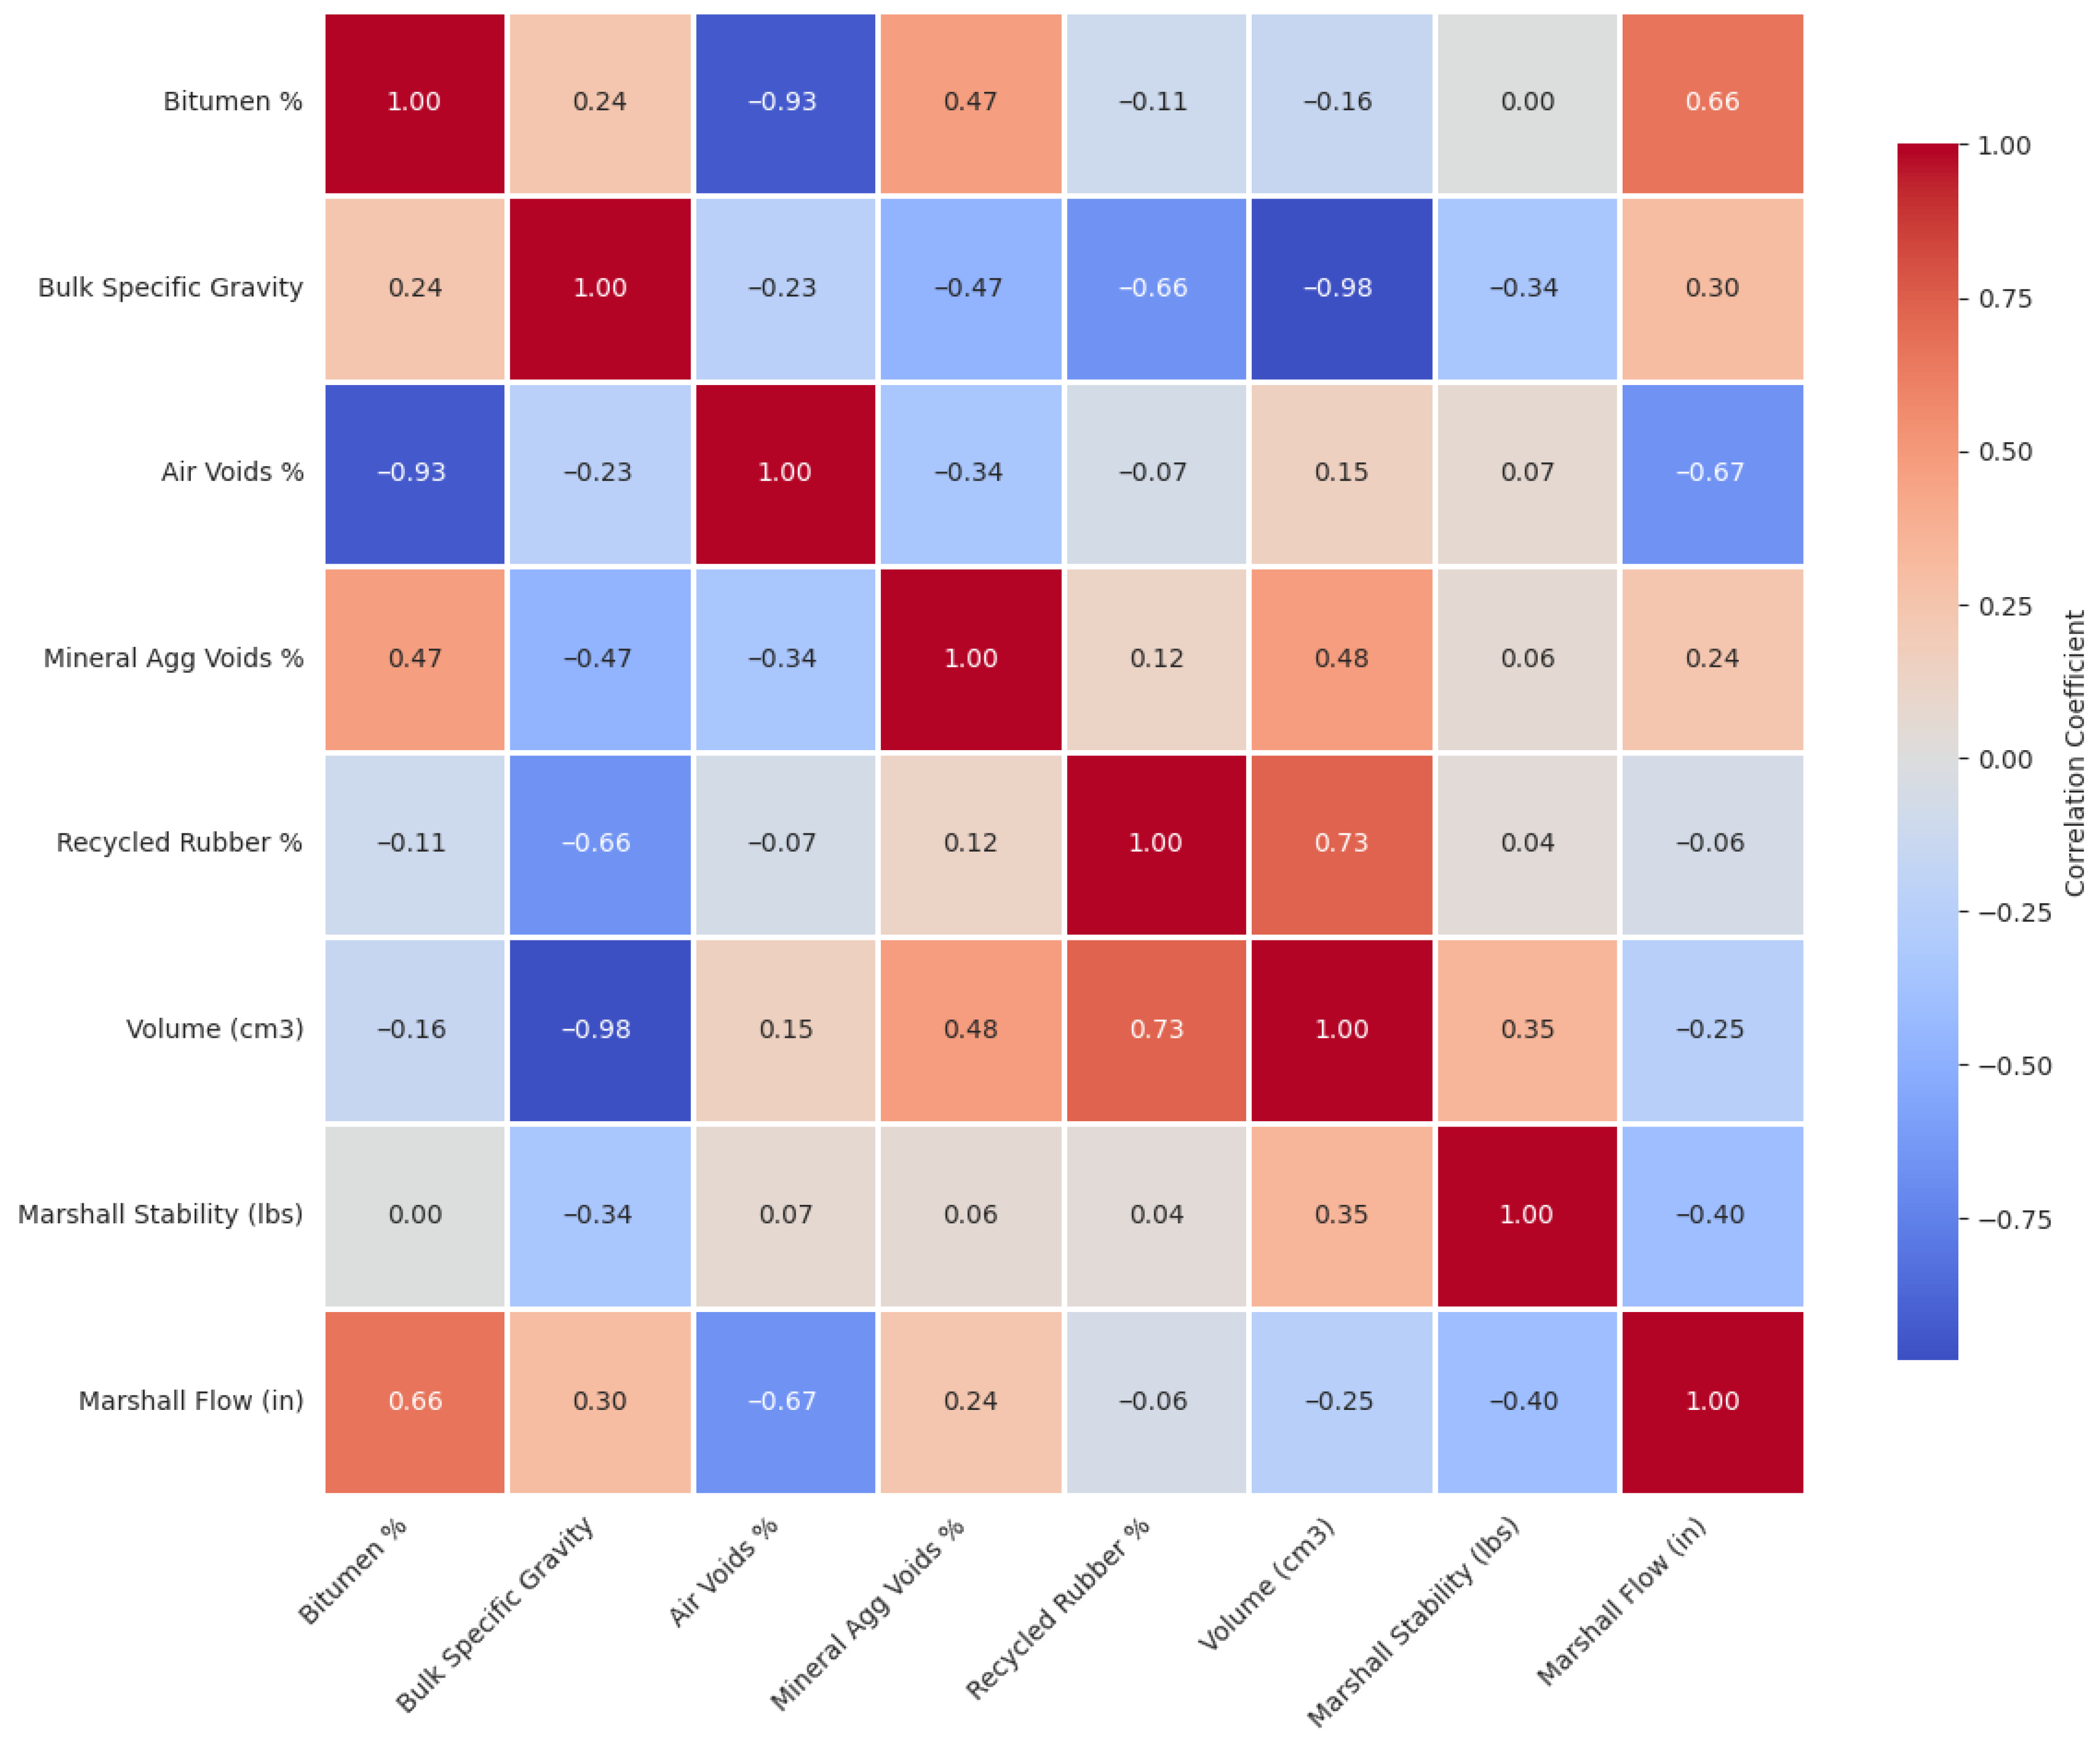
Prior to standardization, outlier detection was performed using interquartile range (IQR) method for Marshall stability and flow. However, no exclusions were made to maintain the integrity of the data and a sufficient sample size for analysis. A correlation analysis (Figure 2) was also performed to determine the strength of linear relations between the parameters. It was found that some of the input parameters had strong negative correlations. On the other hand, none of them had a strong correlation with stability and flow. Since these parameters are part of standard design procedures, it is clear that the correlation analysis is affected by interactive and non-linear effects of the variables. These observations further justify the use of the non-linear modeling methods adopted in this study. All random seeds, wherever applicable, were set to 42 for complete reproducibility. Processing was performed in Google Colab environment using Python code in version 3.12.12.

2.3. Deep Learning Model Architecture and Mathematical Formulation

A Multi-Layer Perceptron (MLP) regressor was chosen for the development of the DL simulator because of its ability to handle complex, non-linear relationships with multiple outputs [13].
The model is used to capture the relationships between six input features ( X = x 1 , x 2 ,   , x 6 ) and the two target variables ( Y = [ S t a b i l i t y , F l o w ] ) simultaneously. A typical MLP architecture consists of three types of layers, namely an input, hidden (one or more), and output layer. Each layer is completely interconnected with the previous layers’ units (neurons) and processes the input signals using the function shown in Equation (1).
a l = σ ( W l a l 1 + b l )
where a ( l 1 ) is the input from the previous layer, W ( l ) is the weight matrix, b ( l ) is the bias vector, and σ is a non-linear activation function. In this research, the Rectified Linear Unit (ReLU) activation function was used in all hidden layers. This function is preferred for DL models because it provides computational efficiency while mitigating the problem of vanishing gradients associated with large networks. The model was trained using the Adam optimizer to attain the best combination of network architecture and learning parameters. A 2-phase optimization approach was used in this study, employing random searching. Firstly, 50 iterations were used to optimize the network architecture. Secondly, an early stopping criterion of 30 epochs with an initial learning rate of 0.001 was used for final model training. This was employed to avoid overfitting, a likely scenario with a limited dataset [14], as in the current research with 57 samples. During model training, three distinct architectures (small, medium, large) were evaluated for accuracy using the loss function of Mean Squared Error (MSE) as per Equation (2). The “large” network (128-64-32 neurons) was selected as it yielded the highest predictive accuracy on the test set. The final model was achieved after 150 epochs including network optimization and final model training.
M S E = 1 N i = 1 N ( y i y ^ i ) 2
where N is the number of samples, y i is the actual value, and y ^ i is the predicted value. Apart from the MSE loss function, the model’s performance was evaluated on a held-out test set (20% of data), using R2 scores, Root Mean Square Error (RMSE), and Mean Absolute Percentage Error (MAPE). The DL model was compared with standard statistical and machine learning regressors, using the same cross-validation scheme. The other models included Linear Regression (LR), Ridge Regression (RR), Support Vector Regression with Radial Basis Kernel function (SVR RBF), and Simple MLP (SMLP). A robust approach was employed, using MAPE, to demonstrate that the proposed DL model offers material improvement beyond classical baselines. R2 was reported only for the final model as a reference instead of using it as a parameter in model tuning and comparison due to its limitations in gauging complex regression scenarios with multiple outputs for non-linear models [15]. On the other hand, the use of MAPE aligns with best practices for complex regression problems. Its percentage scale makes it more meaningful for practitioners and less sensitive to outliers than squared error metrics [16].

3. Results and Discussion

3.1. Model Selection and Performance

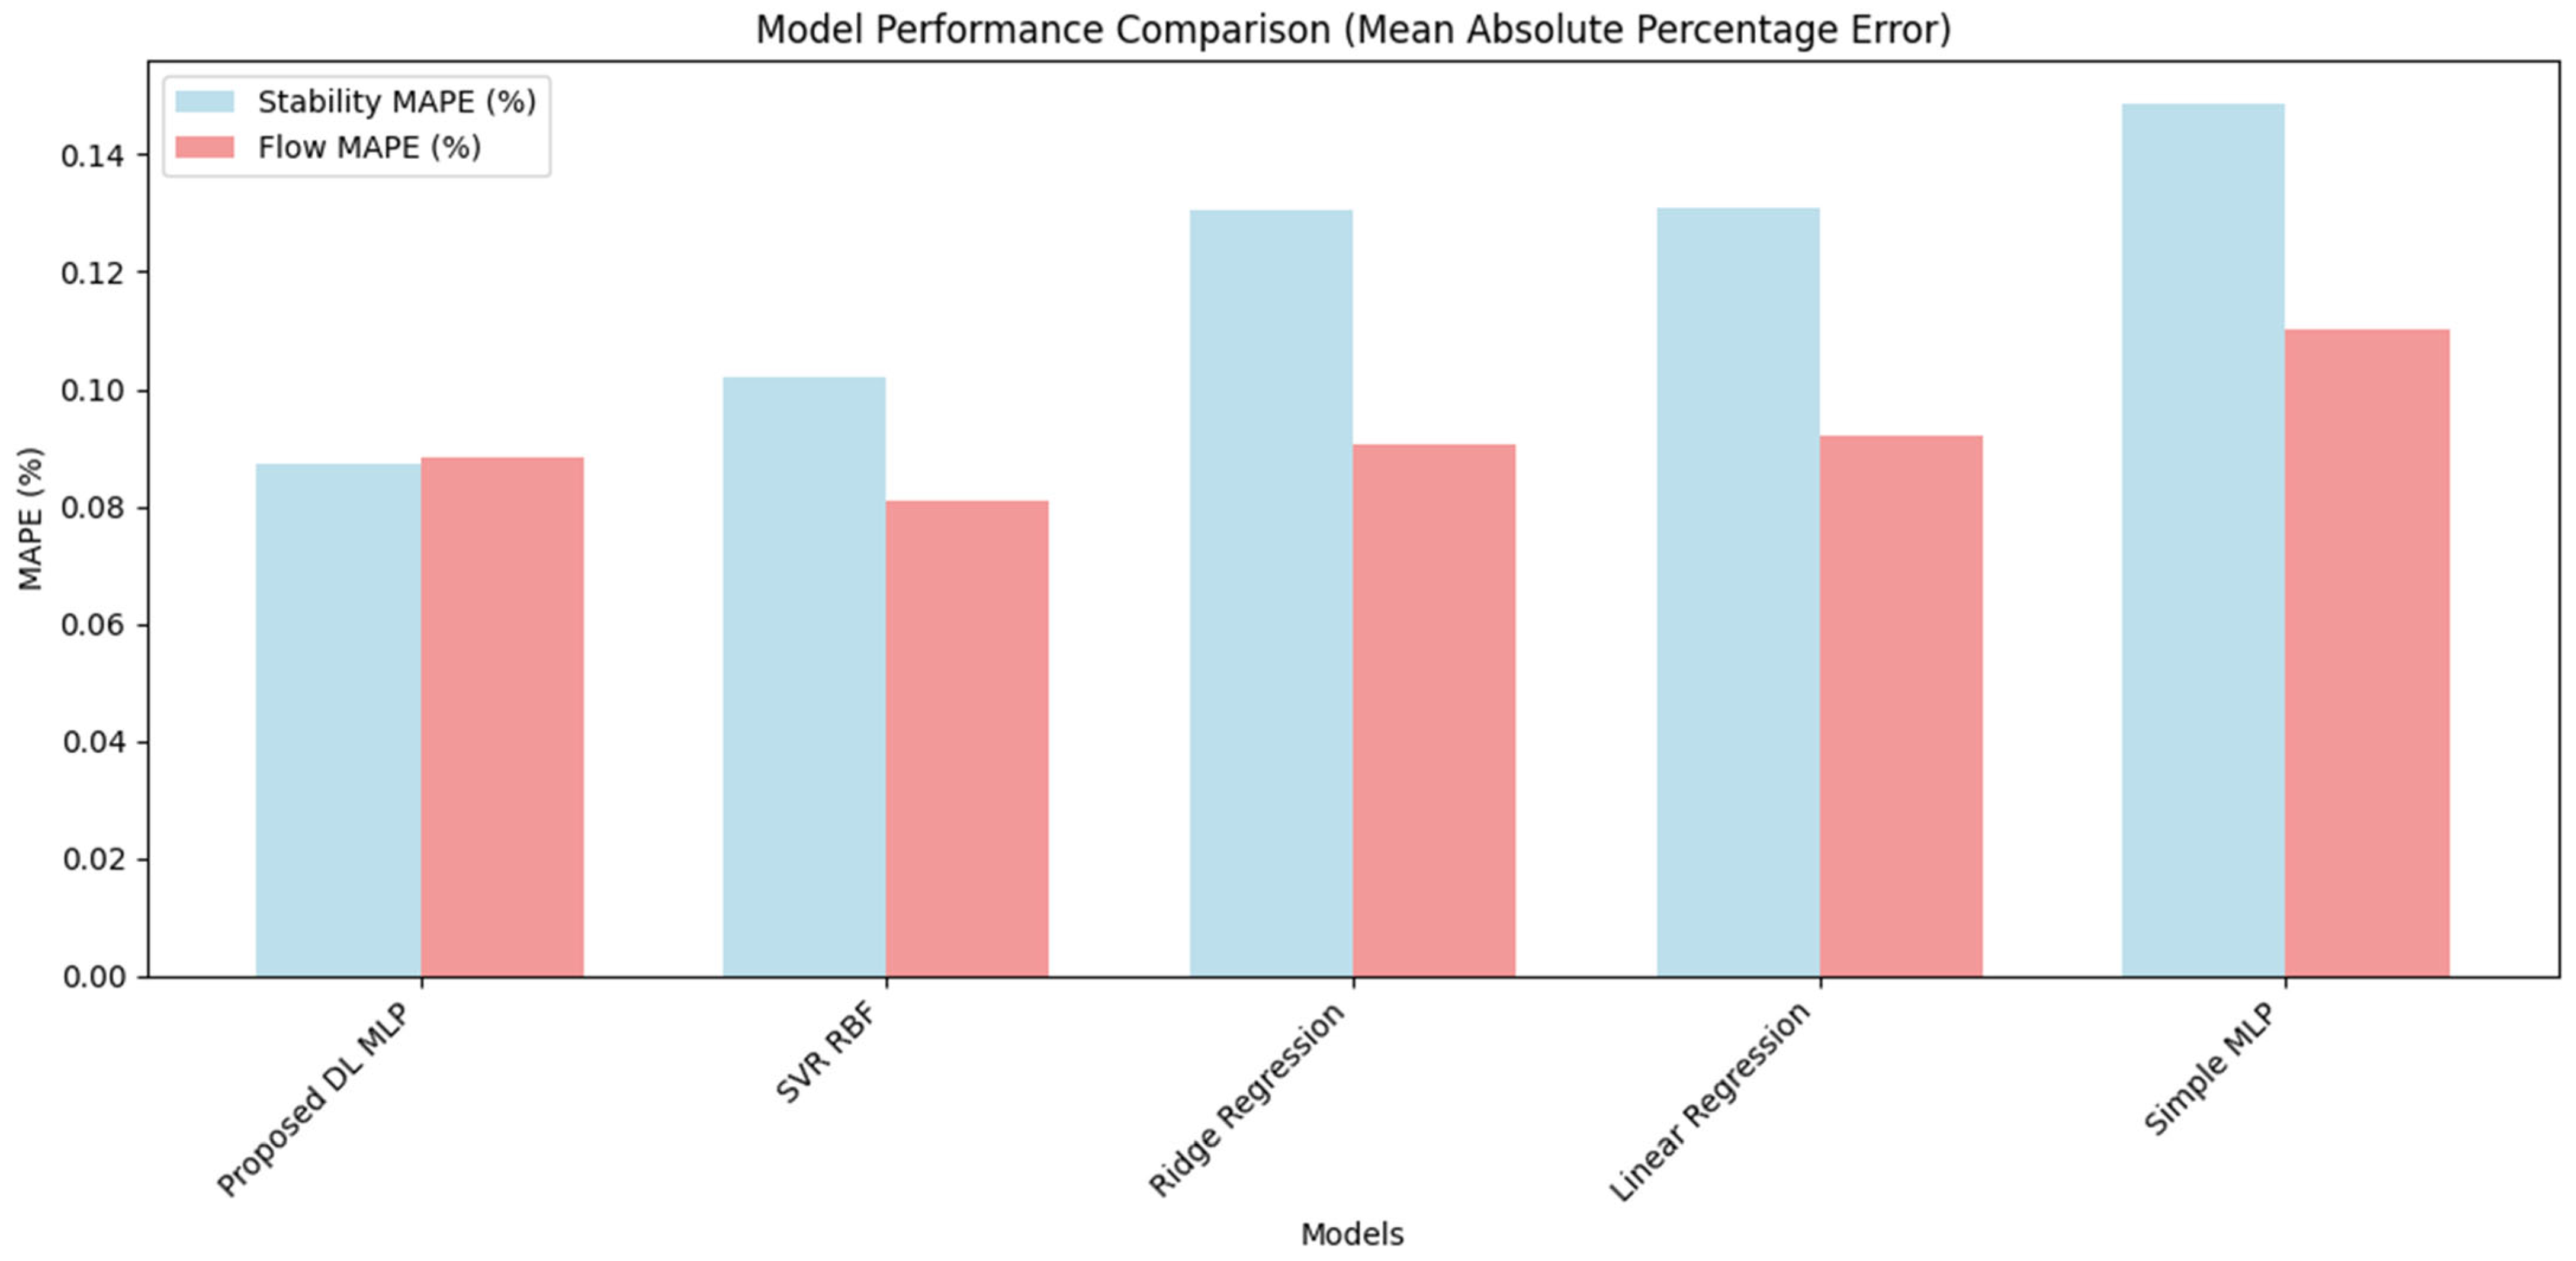
The proposed DL model was found to be a consistent performer in comparison to other baseline models, as shown in Figure 3. It was noted that all of the models provided a better MAPE value for flow prediction compared to stability prediction. This could be linked with its restricted range in the dataset due to design specifications. The MAPE values for flow prediction by DL and SVR RBF are very close to each other. However, the deciding aspect is stability prediction, as the DL model is superior to all other baseline models. This shows its advantage as a convenient and balanced approach to complex multifactor prediction problems.
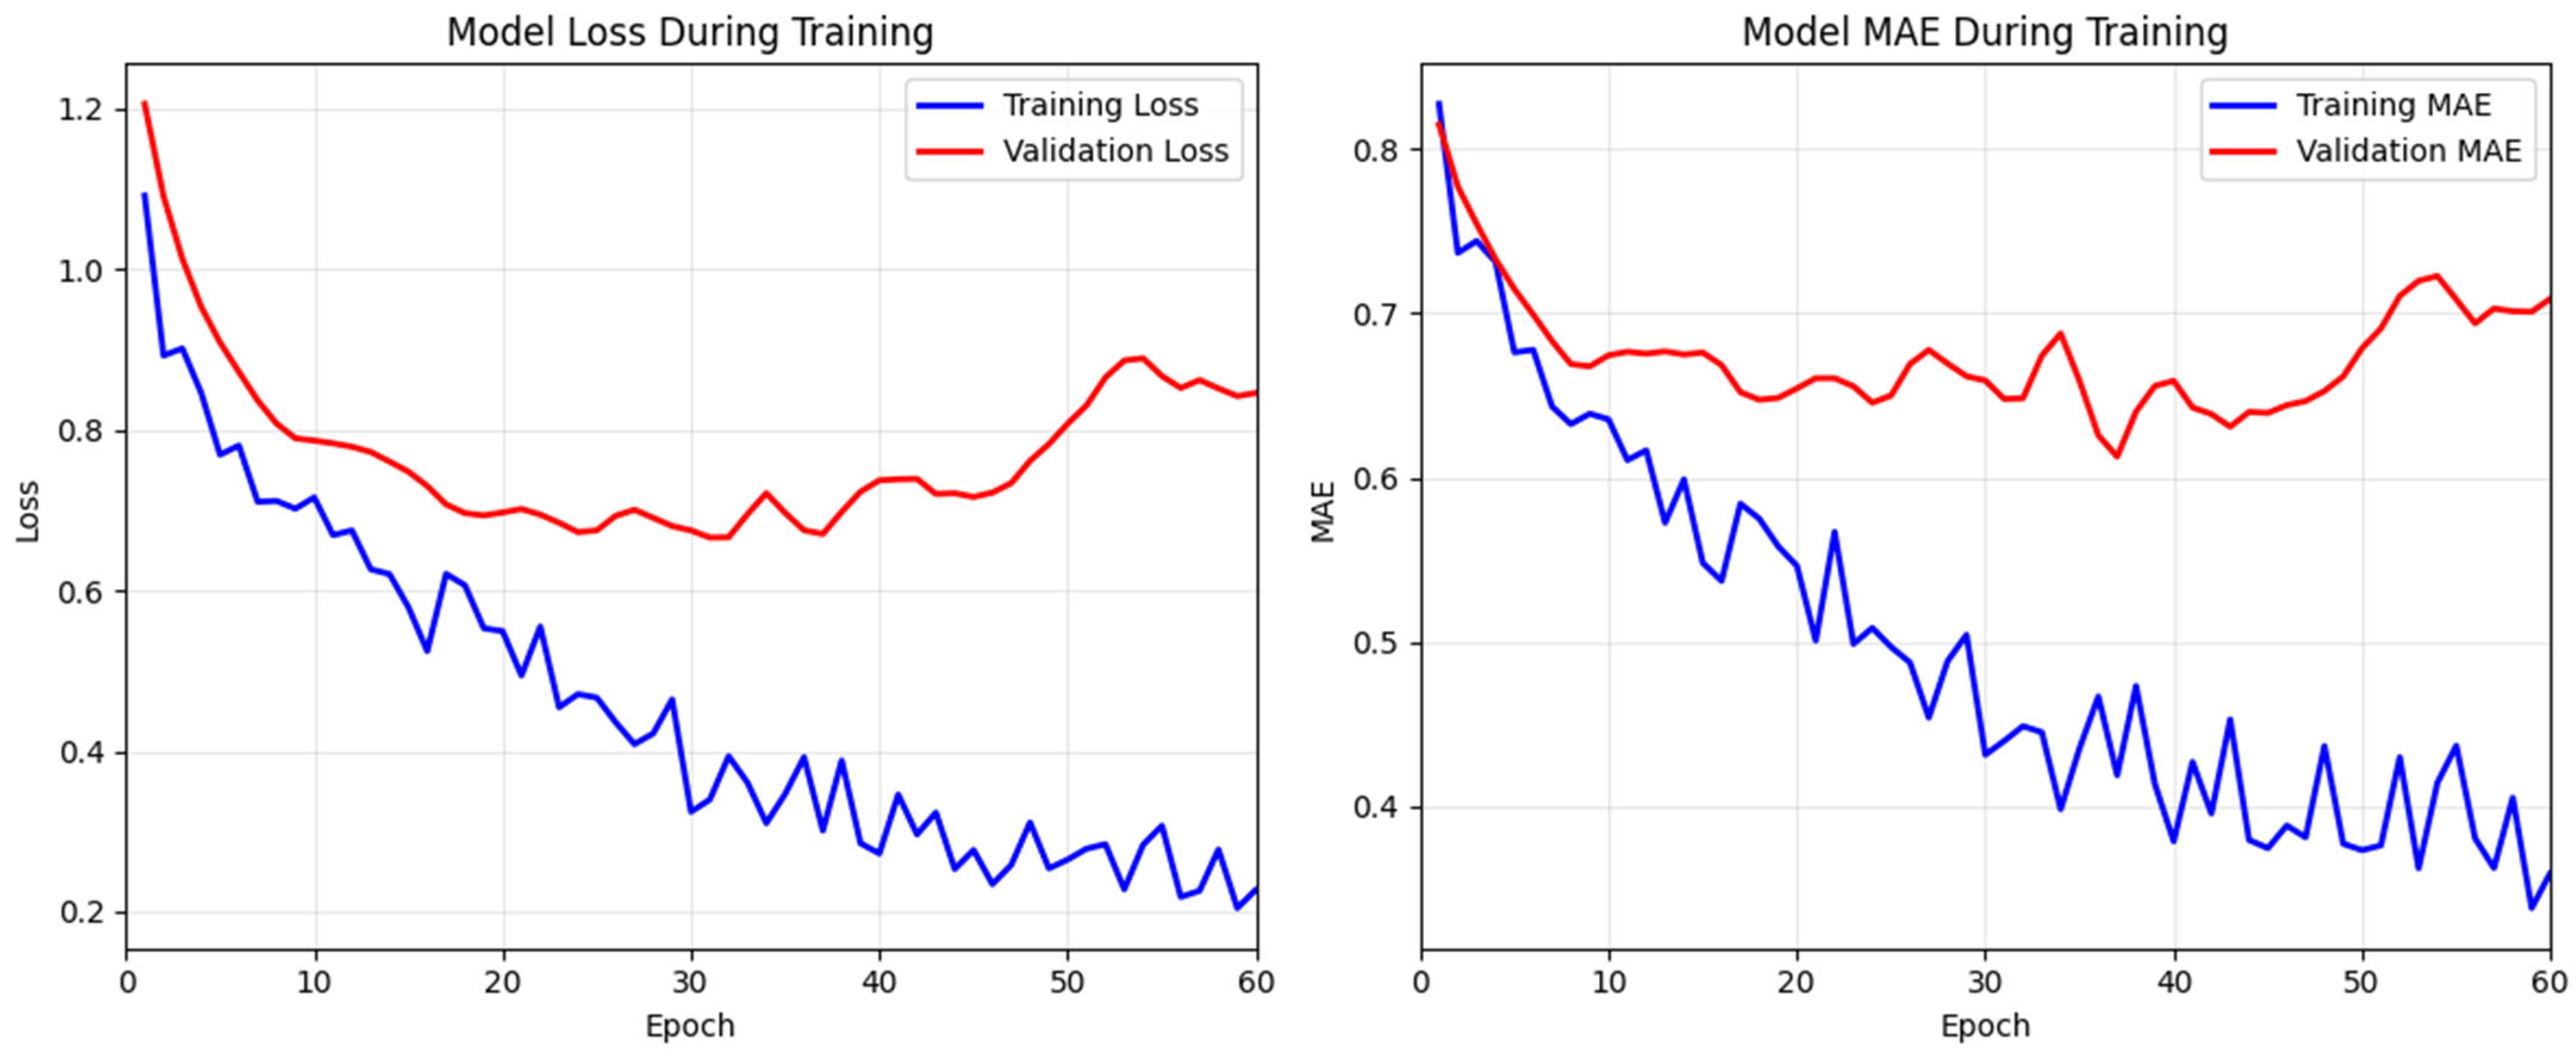
After model selection, advance training of this model was performed. At this stage, early stopping and proper validation ensured that the resulting model is a robust predictor for practical application. The training process was critical for this study, which is shown in Figure 4. The figure shows two clear lines, training loss and validation loss, decreasing over epochs of model training for each target parameter. The ends of these graphs show the point where validation loss begins to increase slightly, and training stops near this point. This is due to the early stopping criteria. This demonstrates that the model generalizes well and does not just memorize the training data.
After hyperparameter optimization, the best_architecture was found to be as follow: {“neurons_layer1”: 128, “neurons_layer2”: 64, “neurons_layer3”: 32, “name”: “Large”}. The performance metrics of the finalized model are given in Table 2. The model shows consistent performance, with both stability and flow having moderate and similar errors. This is a realistic outcome for a complex material science problem with a small dataset. Furthermore, it shows a drastic improvement from the linear regression model (R2 < 0.55). It is acknowledged that the model’s performance is good but not exceptional, likely attributed to the complexity of the problem and the limited dataset size.
The model’s performance in Table 2 shows that the model predicts Marshall stability and flow with ~10% MAPE, which can be considered acceptable for mix design optimization.

3.2. Feature Importance Analysis

Model interpretability was carried out using Permutation Feature Importance (PFI), which is a robust, model-agnostic technique [17]. It measures the increase in model error when a feature’s values are randomly shuffled, thus indicating its importance. The method is also suitable for dealing with interactive and non-linear effects of the parameters suggested by the correlation analysis (Figure 2).
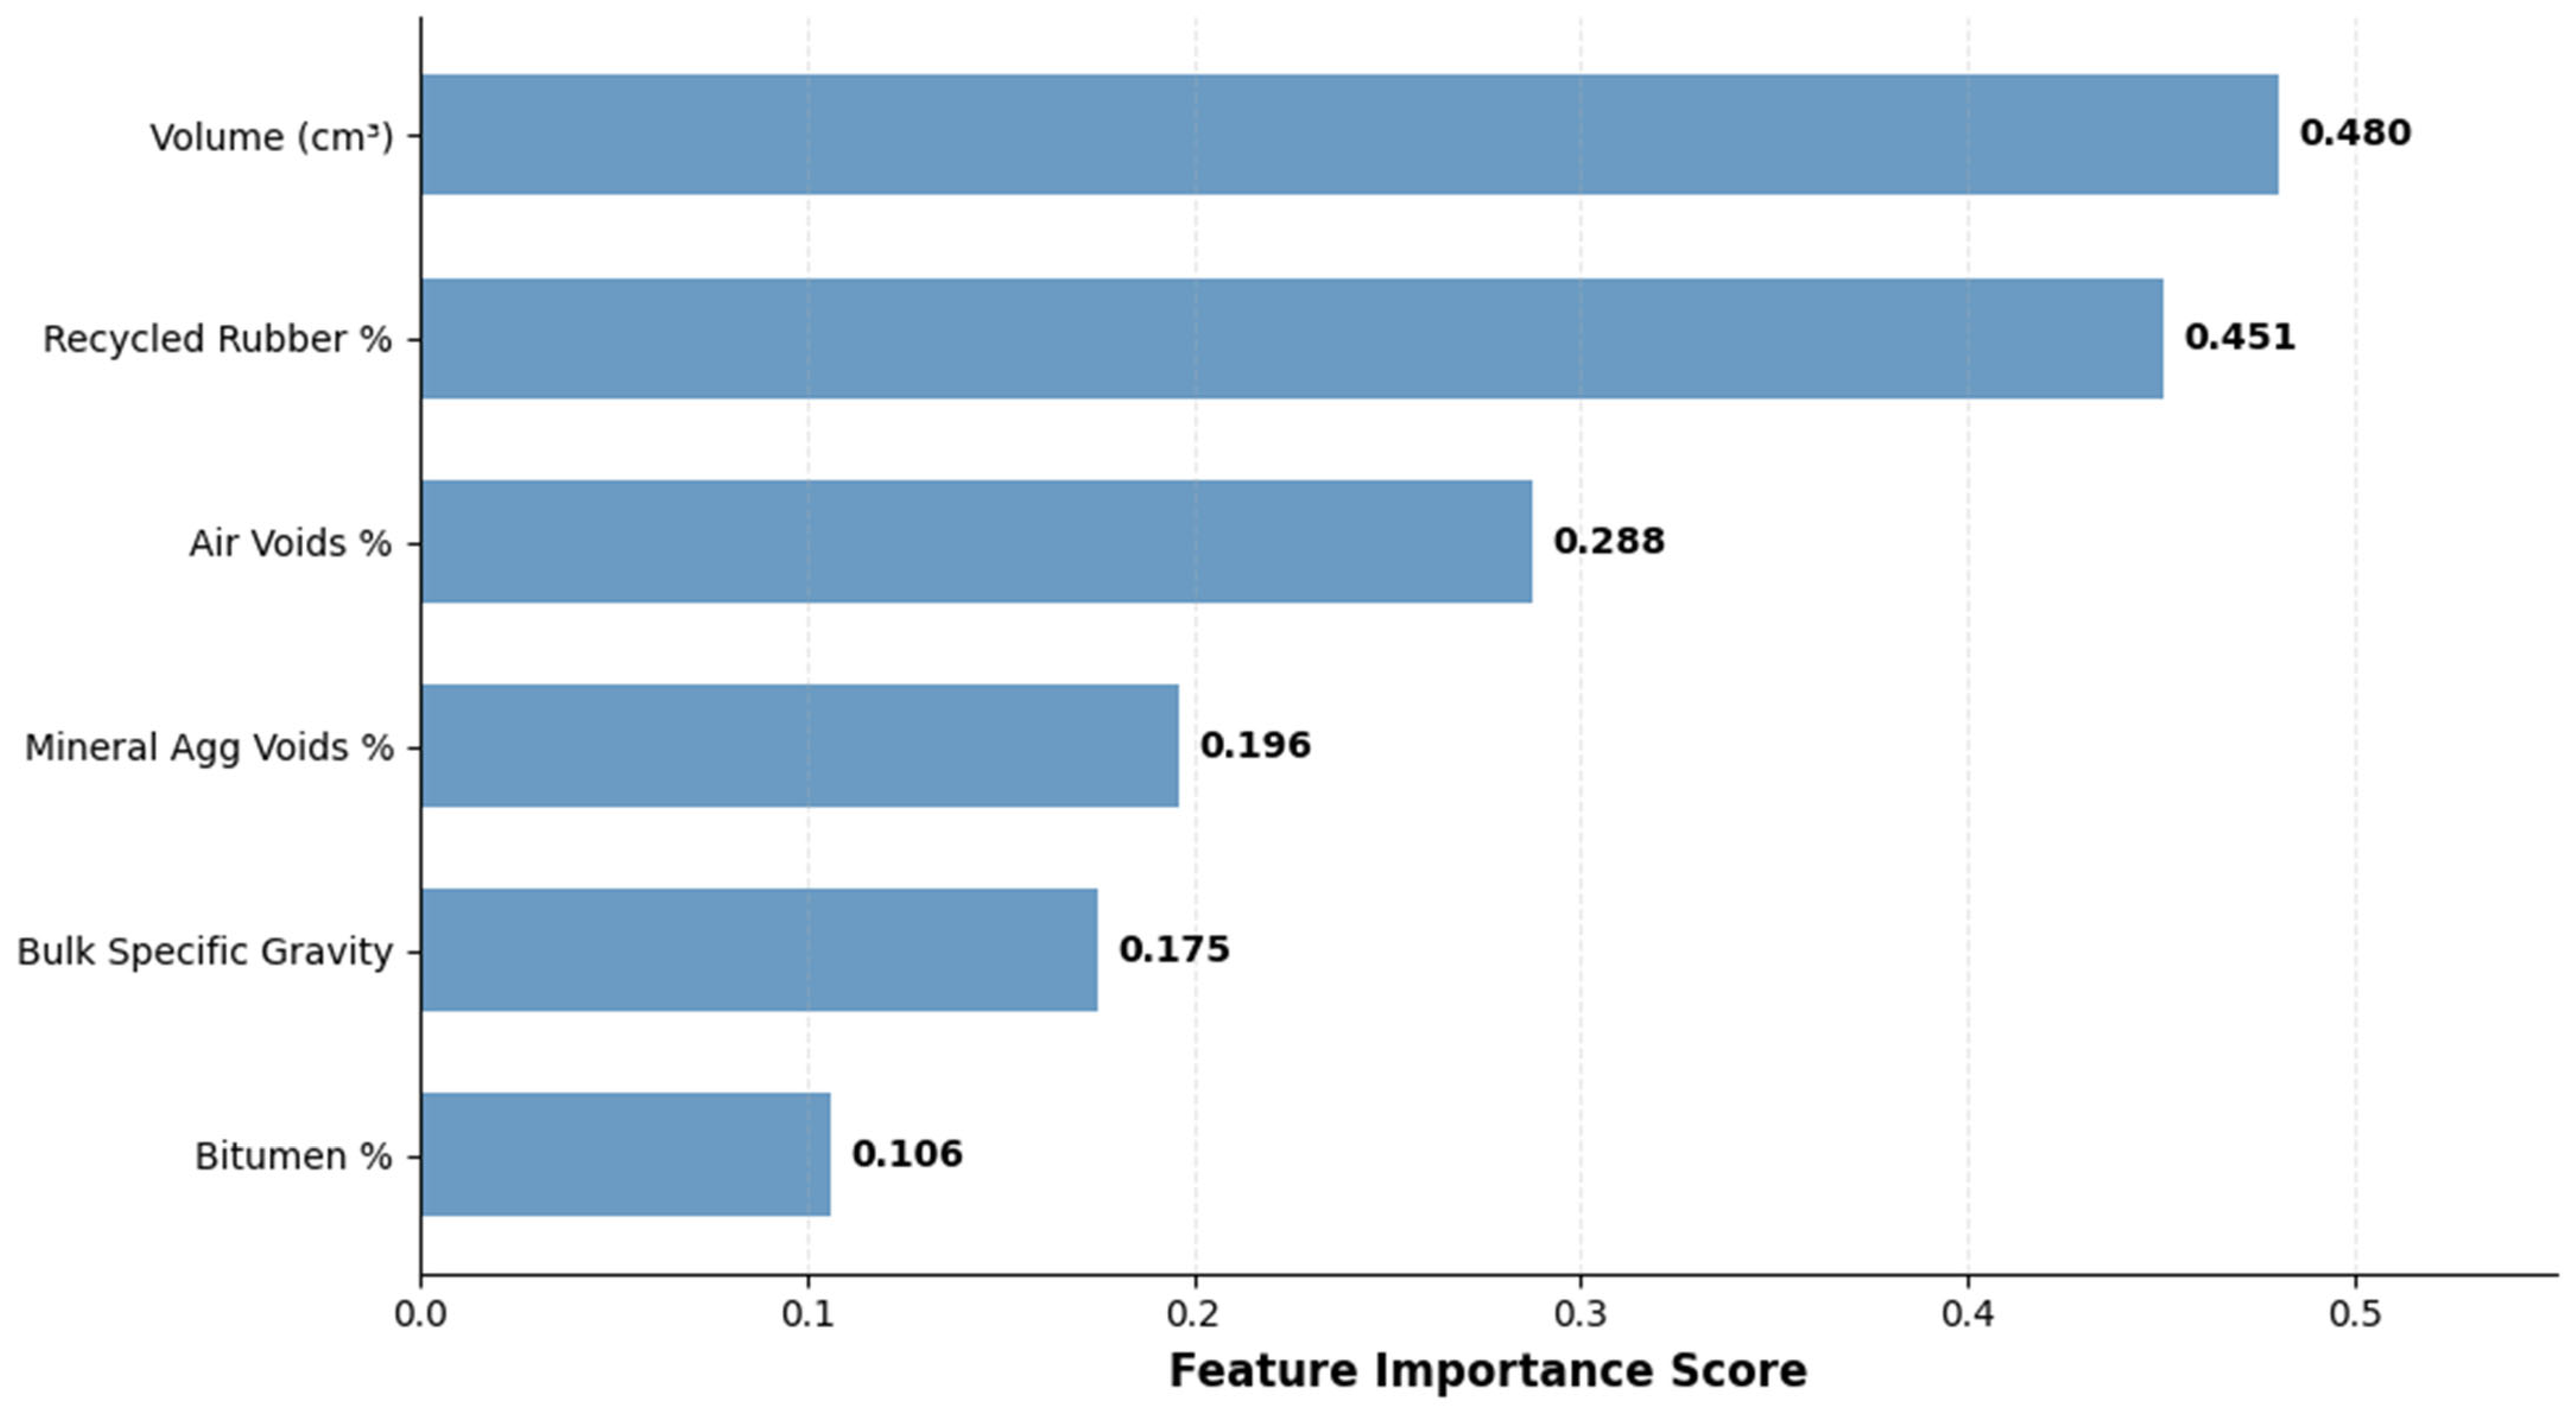
The analysis quantitatively identified the importance of parameters for predicting Marshall properties. The following order of importance is shown in Figure 5: volume (cm3) > recycled rubber % > air void % > mineral aggregate void % > bulk specific gravity > bitumen %. This ranking confirms that the incorporation of recycled rubber has a dominant effect on the mechanical properties of the mix. This is followed by the fundamental volumetric properties, most prominently sample volume and air voids, which is an expected phenomenon in asphalt mix design which relies on these properties [18].
The low importance of bitumen % is expected as all the samples were tested within the narrow optimum content range of 4–5%. The lower impacts of VMA and bulk specific gravity could be explained indirectly through other correlated variables like air voids.

3.3. Mix Sensitivity and Optimization Analysis

The trained model was deployed as a surrogate digital simulator to identify optimal mix designs while targeting 4% air voids and flow < 14 in. To achieve the optimization of rubberized mixtures, a search space of more than 10,000 combinations was created virtually using a grid-based approach. The optimization aimed to find the ideal combination of bitumen and recycled rubber content that maximizes Marshall stability within the constraints. The air void constraint was enforced by fixing its value to exactly 4.0% for all virtual mix combinations during the optimization process. Meanwhile, bitumen % (<5%) and recycled rubber % (0–6%) were varied within the model’s input space. The other parameters were kept at their median values to eliminate their impacts. The same approach can be adopted for optimizing the other model parameters as well.
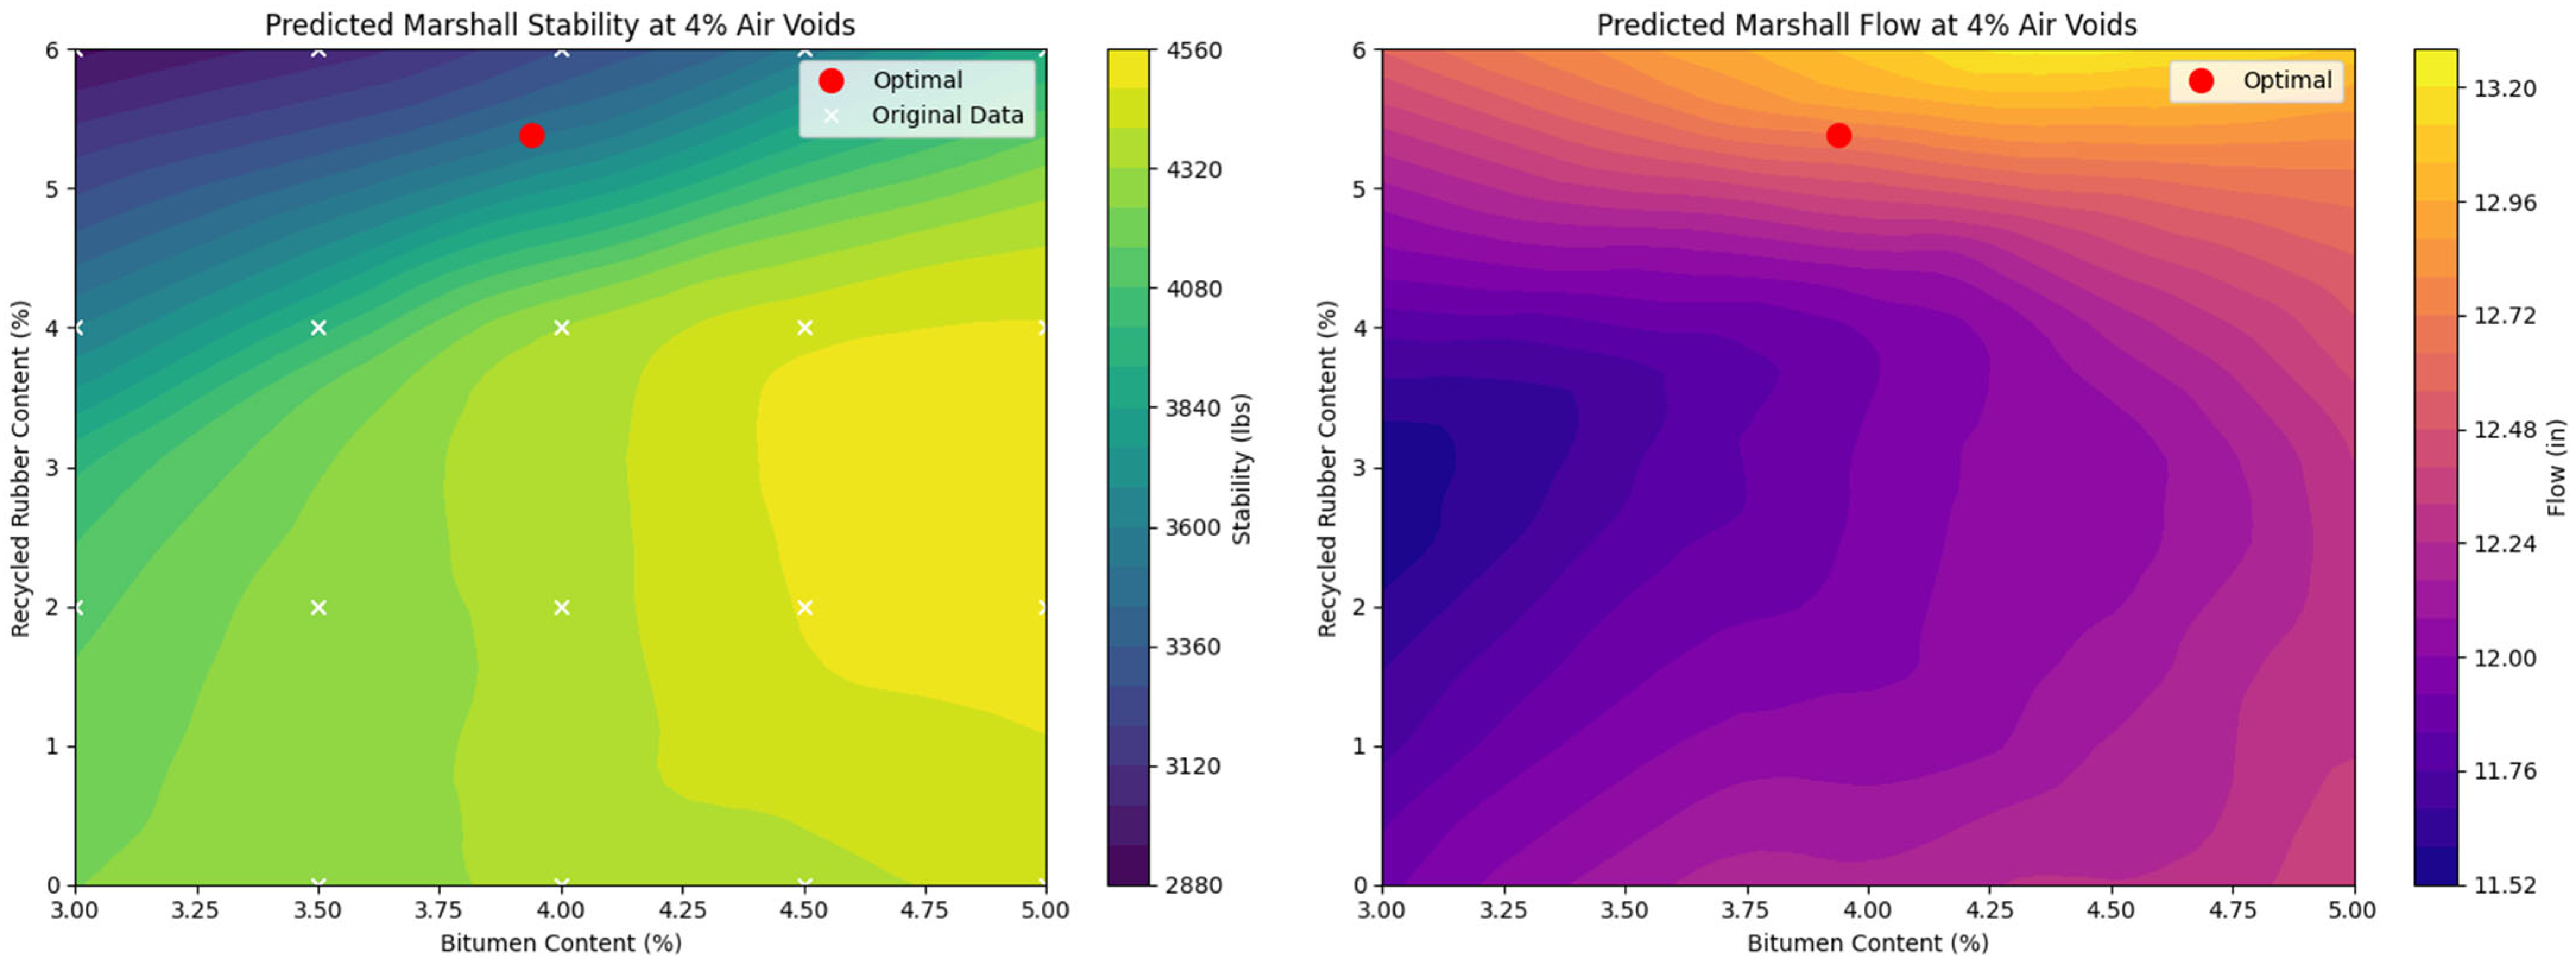
The stability and flow for each combination were simulated using the trained DL model. The results are presented as 2D contour plots, as shown in Figure 6, which provide a clear visual landscape of performance. These plots instantly reveal the suitable regions for optimal mix design. Hence, it was possible to successfully identify several optimal mix formulations that satisfy the design criteria (4% air voids, flow ≤ 14 in), demonstrating the application of modern machine learning techniques to guide and accelerate the traditional iterative mix design process.
Figure 6 presents the powerful application of the validated model. It depicts a surrogate-based grid over feasible ranges at 4% air voids that could be considered valid under the premise that the model’s predictions are consistently good (MAPE < 10%). The contour plot shows a clear gradient identifying the optimal regions for stability in darker shades and those for flow in lighter shades. Using these shaded portions, it is found that optimal stability (top-left corner) is achieved with high bitumen and rubber contents (>4%). On the other hand, the lowest flow is achieved (middle-left) with a medium content of these ingredients (~3–3.5%). As a trade-off, 3.94% bitumen and 5.39% (red dot) rubber are found to provide reasonable values of stability (~4556 lbs) and flow (~12.16 in).
The validity of model-based design optimization was tested using sensitivity analysis by changing the flow constraint. Table 3 provides the results of this sensitivity analysis with respect to model outputs (stability and flow) and design parameters (bitumen and rubber %). It can be observed that the model provides robust results, adapting to the extreme changes in constraint without a massive compromise in outputs. The low rubber content at the lowest flow constraint reflects the increase in consistency of the mix due to the addition of rubber. However, it should be noted that this study was limited by a relatively smaller sample size of 57 used for model development and proceeding analysis. Hence, future studies could build on this process and the results with a larger experimental dataset.
However, the recommendations are based on model predictions and should be validated with physical laboratory tests, especially given the model’s moderate R2 values. The DL-based simulation approach provides a quick and cost-effective method of exploring mix combinations for the best design outcomes. This is a major improvement and a more efficient alternative to time-consuming, resource-intensive laboratory experimentation approaches.

3.4. Discussion of Key Findings

The aim of this study was to employ a machine learning-based simulator to predict and optimize the Marshall mix design properties of rubberized asphalt mixtures. The research provided in several important insights and practical benefits.
Firstly, it highlighted the importance of rubber content for modified asphalt mix designs. It was found to be the second-most important element in the PFI analysis (Figure 5). In this context, the simulation study (illustrated in Figure 6) shows that the rubber content increases flow, leading to higher resistance to deformation and reduced workability.
In addition to the rubber content, volume and air voids were the other parameters among the top three parameters influencing the model predictions. The high importance of these variables confirms the importance of volumetric properties in the Marhsall mix design process.
It was found that the DL model outperformed regression models (shown in Figure 3), especially in terms of stability, with an error difference of >4% between them. This comparison advocates the use of DL as a simulator for practical and quick design estimations. However, experimental validation is still highly recommended owing to the smaller sample size of this study and the limitation of research on rubberized asphalt mix.
The approach proposed in this study has several practical and environmental benefits. Firstly, it encourages the use of recycled materials in pavements employing an efficient and convenient approach for optimizing design. Implementation of this methodology reduces the effort required by practitioners to achieve an iterative design. By doing so, it minimizes the usage of scarce raw materials and potential energy consumption required for their manufacturing (asphalt) and mining (aggregates).

4. Conclusions and Future Work

This study successfully developed a DL model acting as a mathematical regression tool to predict and optimize rubberized asphalt properties. The model shows consistently good accuracy (less 10% error) for both outputs. The most important features for the predictions were sample volume followed by recycled rubber and voids. The optimal region of the mix design was found to be ~3.8% to 4.5 for bitumen content and ~4.0% to 5.5% for rubber content. These ranges provide a trade-off between high stability to resist permanent deformation and an acceptable flow value to ensure workability. While doing so, they also prevent overly stiff pavement at 4% air voids while fulfilling the flow constraint (<14 in). This optimal region should be treated as a hypothesis requiring laboratory confirmation.
This study demonstrates the use of a carefully developed DL model as an alternative to laboratory-based material systems. It shows the validity of using a computational approach to guide the design of modified asphalt mixtures for use in economical and sustainable infrastructure systems.
This study employed a relatively small dataset, with 57 values and limited parameters. Hence, it is recommended to expand the dataset through experiments or data augmentation in future studies. Moreover, the simulated optimal regions and recommended mixes still need to be verified through experimental investigations.

Author Contributions

Conceptualization: U.G., A.Q., M.K.I., and M.A.; data curation: A.Q.; formal analysis: U.G.; funding acquisition: M.K.I. and M.A.; investigation: A.Q.; methodology: U.G. and A.Q.; project administration: A.Q., M.K.I., and M.A.; resources: A.Q., M.K.I., and M.A.; software: U.G.; supervision: A.Q.; validation: U.G.; visualization: U.G. and A.Q.; writing—original draft: U.G.; writing—review and editing: A.Q., M.K.I., and M.A. All authors have read and agreed to the published version of the manuscript.

Funding

This work was supported by the Deanship of Scientific Research, Vice Presidency for Graduate Studies and Scientific Research, King Faisal University, Saudi Arabia [Grant No. KFU253893].

Data Availability Statement

The raw data supporting the conclusions of this article will be made available by the authors on request.

Conflicts of Interest

The authors declare no conflict of interest.

References

  1. Shiboub, I.; Assaf, G.J. System dynamic model for sustainable road rehabilitation integrating technical, economic, and environmental considerations. J. Manag. Eng. 2022, 38, 04022041. [Google Scholar] [CrossRef] [Scilit]
  2. Praticò, F.G.; Giunta, M.; Mistretta, M.; Gulotta, T.M. Energy and environmental life cycle assessment of sustainable pavement materials and technologies for urban roads. Sustainability 2020, 12, 704. [Google Scholar] [CrossRef] [Scilit]
  3. Santos, J.; Flintsch, G.; Ferreira, A. Environmental and economic assessment of pavement construction and management practices for enhancing pavement sustainability. Resour. Conserv. Recycl. 2017, 116, 15–31. [Google Scholar] [CrossRef] [Scilit]
  4. Guerrero-Bustamante, O.; Camargo, R.; Duque, J.; Martinez-Arguelles, G.; Polo-Mendoza, R.; Acosta, C.; Murillo, M. Designing Sustainable Asphalt Pavement Structures with a Cement-Treated Base (CTB) and Recycled Concrete Aggregate (RCA): A Case Study from a Developing Country. Designs 2025, 9, 65. [Google Scholar] [CrossRef] [Scilit]
  5. Yang, R.; Kang, S.; Ozer, H.; Al-Qadi, I.L. Environmental and economic analyses of recycled asphalt concrete mixtures based on material production and potential performance. Resour. Conserv. Recycl. 2015, 104, 141–151. [Google Scholar] [CrossRef] [Scilit]
  6. Omar, S.M.; Sharif, B.M.; Ahmed, H.U.; Abdullah, W.A. Comparison Study between Marshall and Superpave Mix Design Methods. Halabja Univ. J. 2021, 6, 348–365. [Google Scholar] [CrossRef] [Scilit]
  7. Wan, L.; Garcia-Hernández, A.; Cui, G.; Liu, P. A novel performance-based method to design asphalt mixtures. Constr. Build. Mater. 2023, 400, 132792. [Google Scholar] [CrossRef] [Scilit]
  8. Nouman, M.; Maqbool, Z.; Ali, S.; Saleem, A. Performance evaluation of wearing course asphalt mixes based on resilient modulus, indirect tensile strength and Marshall stability. Int. J. Pavement Res. Technol. 2022, 15, 63–72. [Google Scholar] [CrossRef] [Scilit]
  9. Tobias, A.; Kittur, J. Strategic innovations and future directions in deep learning for engineering applications: A systematic literature review. Front. Educ. 2025, 10, 1583404. [Google Scholar] [CrossRef] [Scilit]
  10. Kumar, B.; Kumar, N.; Rustum, R.; Shankar, V. Comparative analysis of machine learning techniques for predicting bulk specific gravity in modified asphalt mixtures incorporating polyethylene terephthalate (PET), high-density polyethylene (HDPE), and polyvinyl chloride (PVC). Mach. Learn. Knowl. Extr. 2025, 7, 30. [Google Scholar] [CrossRef] [Scilit]
  11. Qadir, A.; Usman, T.; Gazder, U. Improving water resistance of pavement using recycled rubber. Int. J. Environ. Eng. Dev. 2025, 3, 239–248. [Google Scholar] [CrossRef] [Scilit]
  12. Al-Mosawe, H.M. Enhancing Asphalt Mixture Performance with Crumb Rubber: A Sustainable Solution for Improved Durability and Mechanical Properties. E3S Web Conf. 2023, 427, 03017. [Google Scholar] [CrossRef] [Scilit]
  13. Ahmad, I.; M’zoughi, F.; Aboutalebi, P.; Garrido, I.; Garrido, A.J. A regressive machine-learning approach to the non-linear complex FAST model for hybrid floating offshore wind turbines with integrated oscillating water columns. Sci. Rep. 2023, 13, 1499. [Google Scholar] [CrossRef] [Scilit] [PubMed]
  14. Doan, C.D.; Liong, S.Y. Generalization for Multilayer Neural Network Bayesian Regularization or Early Stopping. In Proceedings of Asia Pacific Association of Hydrology and Water Resources 2nd Conference; Department of Civil Engineering, National University of Singapore: Singapore, 2004; pp. 5–8. Available online: https://masters.donntu.ru/2012/etf/snegina/library/arl.pdf (accessed on 27 March 2025).
  15. Spiess, A.N.; Neumeyer, N. An evaluation of R2 as an inadequate measure for nonlinear models in pharmacological and biochemical research: A Monte Carlo approach. BMC Pharmacol. 2010, 10, 6. [Google Scholar] [CrossRef] [Scilit] [PubMed]
  16. Chai, T.; Draxler, R.R. Root mean square error (RMSE) or mean absolute error (MAE). Geosci. Model Dev. Discuss. 2014, 7, 1525–1534. [Google Scholar] [CrossRef] [Scilit]
  17. Khan, A.; Ali, A.; Khan, J.; Ullah, F.; Faheem, M. Using Permutation-Based Feature Importance for Improved Machine Learning Model Performance at Reduced Costs. IEEE Access 2025, 13, 36421–36435. [Google Scholar] [CrossRef] [Scilit]
  18. Farooq, G.; Hussain, A.; Yanjun, Q.; Ding, H.; Shamim, A. Performance evaluation of Marshall and Superpave asphalt mix design methods: A volumetrics-analysis based approach. Aust. J. Civ. Eng. 2025, in press. [Google Scholar] [CrossRef] [Scilit]
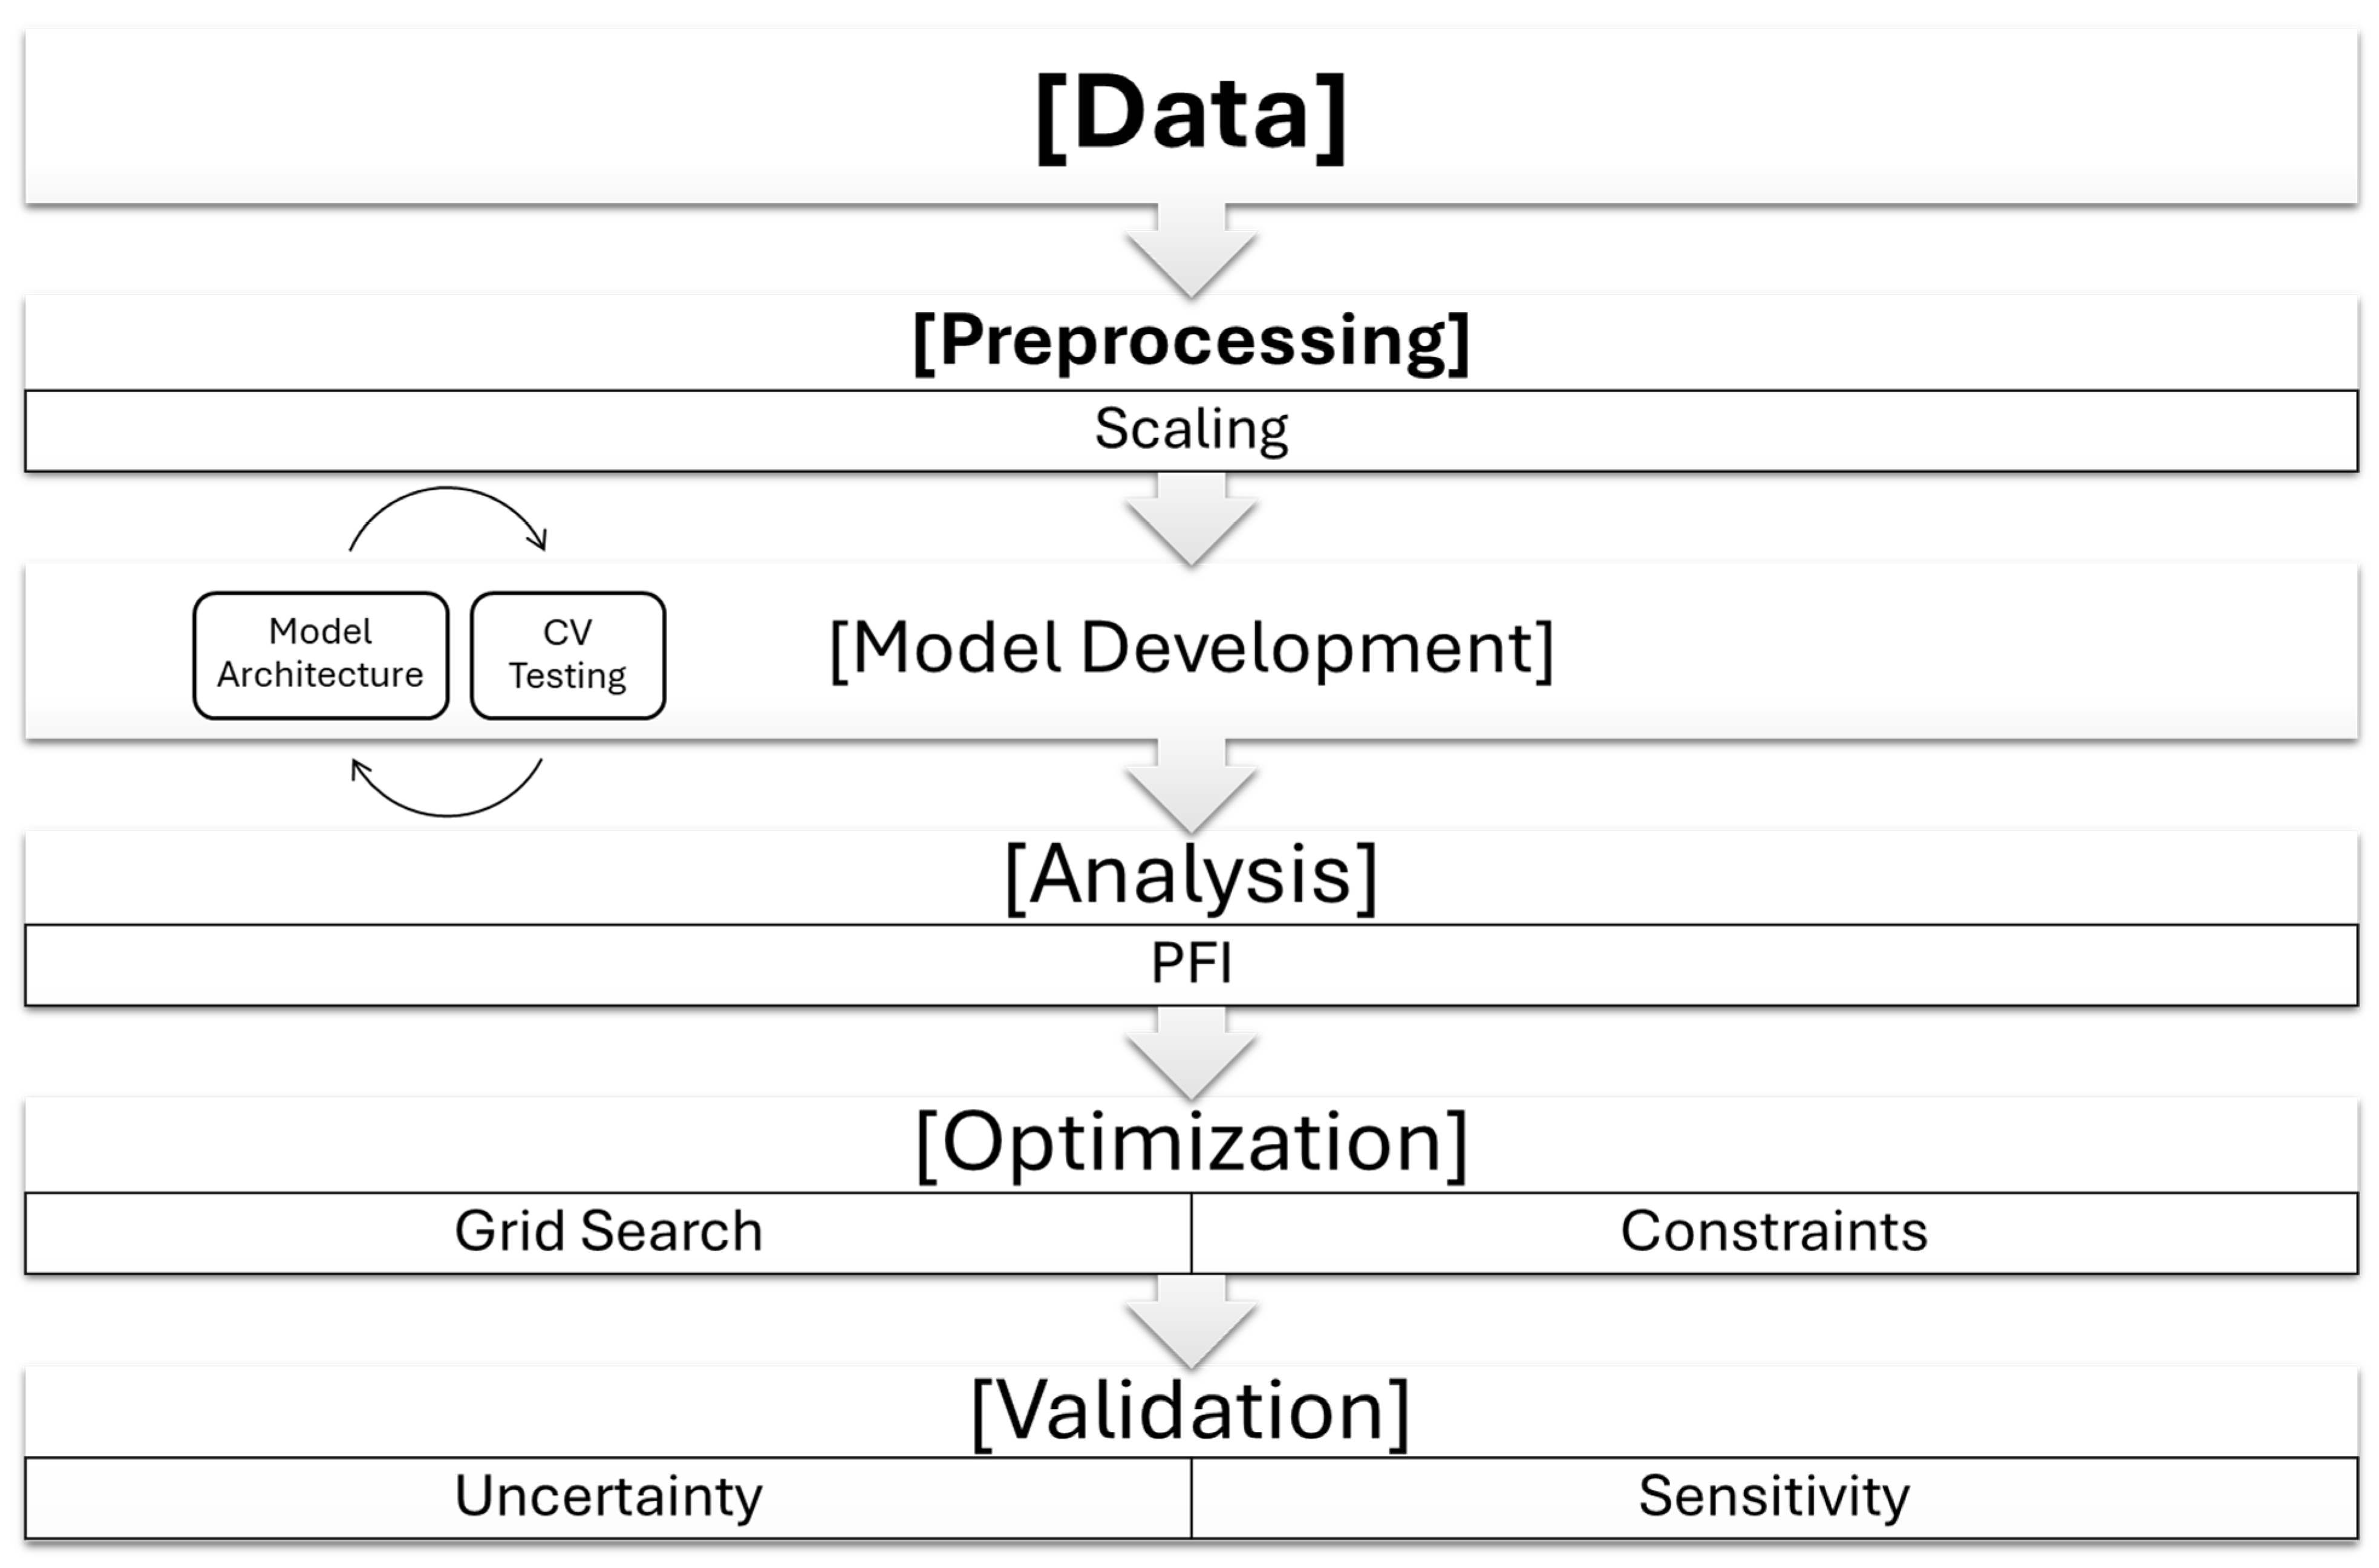
Figure 1. Research methodology of study.
Processes 14 00621 g001
Figure 2. Result of correlation analysis between all parameters.
Processes 14 00621 g002
Figure 3. Comparison of model performance in terms of MAPE.
Processes 14 00621 g003
Figure 4. Model training and validation loss during training.
Processes 14 00621 g004
Figure 5. Permutation Feature Importance for predicting Marshall properties.
Processes 14 00621 g005
Figure 6. Contour plots showing optimal regions for Marshall stability and flow contours at 4% air voids.
Processes 14 00621 g006
Table 1. Descriptive statistics of input features and target outputs.
Bitumen %Bulk Specific GravityAir Void %Mineral Agg Void %Recycled Rubber %Volume (cm3)Corrected Marshall Stability (lbs)Marshall Flow (in)
Mean 4.052.214.0415.613.16551.333827.5712.46
Std0.690.091.570.882.2027.23729.551.92
Min 3.002.101.3714.170.00487.402876.438.50
25%3.502.152.7315.212.00553.503164.5811.00
50%4.002.184.2815.344.00562.403787.9712.00
75%4.502.215.5316.176.00565.904075.2014.00
Max 5.002.436.6617.456.00588.405482.5618.00
Table 2. Performance of finalized deep learning model.
MetricValue
RMSE_Stability545.12 lbs
MAE_Stability410.71 lbs
MAPE_Stability9%
R2_Stability0.53 *
RMSE_Flow0.86 in
MAE_Flow0.74 in
MAPE_Flow6%
R2_Flow0.66 *
* Note: R2 values in multi-output non-linear models should be interpreted with caution.
Table 3. Sensitivity analysis with respect to flow constraint.
Flow Constraint Bitumen %Rubber %Stability (lbs)Flow (in)
12.04.103.674420.6012.00
13.03.945.394555.1812.16
14.03.945.394555.1812.16
15.03.945.394555.1812.16
Disclaimer/Publisher’s Note: The statements, opinions and data contained in all publications are solely those of the individual author(s) and contributor(s) and not of MDPI and/or the editor(s). MDPI and/or the editor(s) disclaim responsibility for any injury to people or property resulting from any ideas, methods, instructions or products referred to in the content.