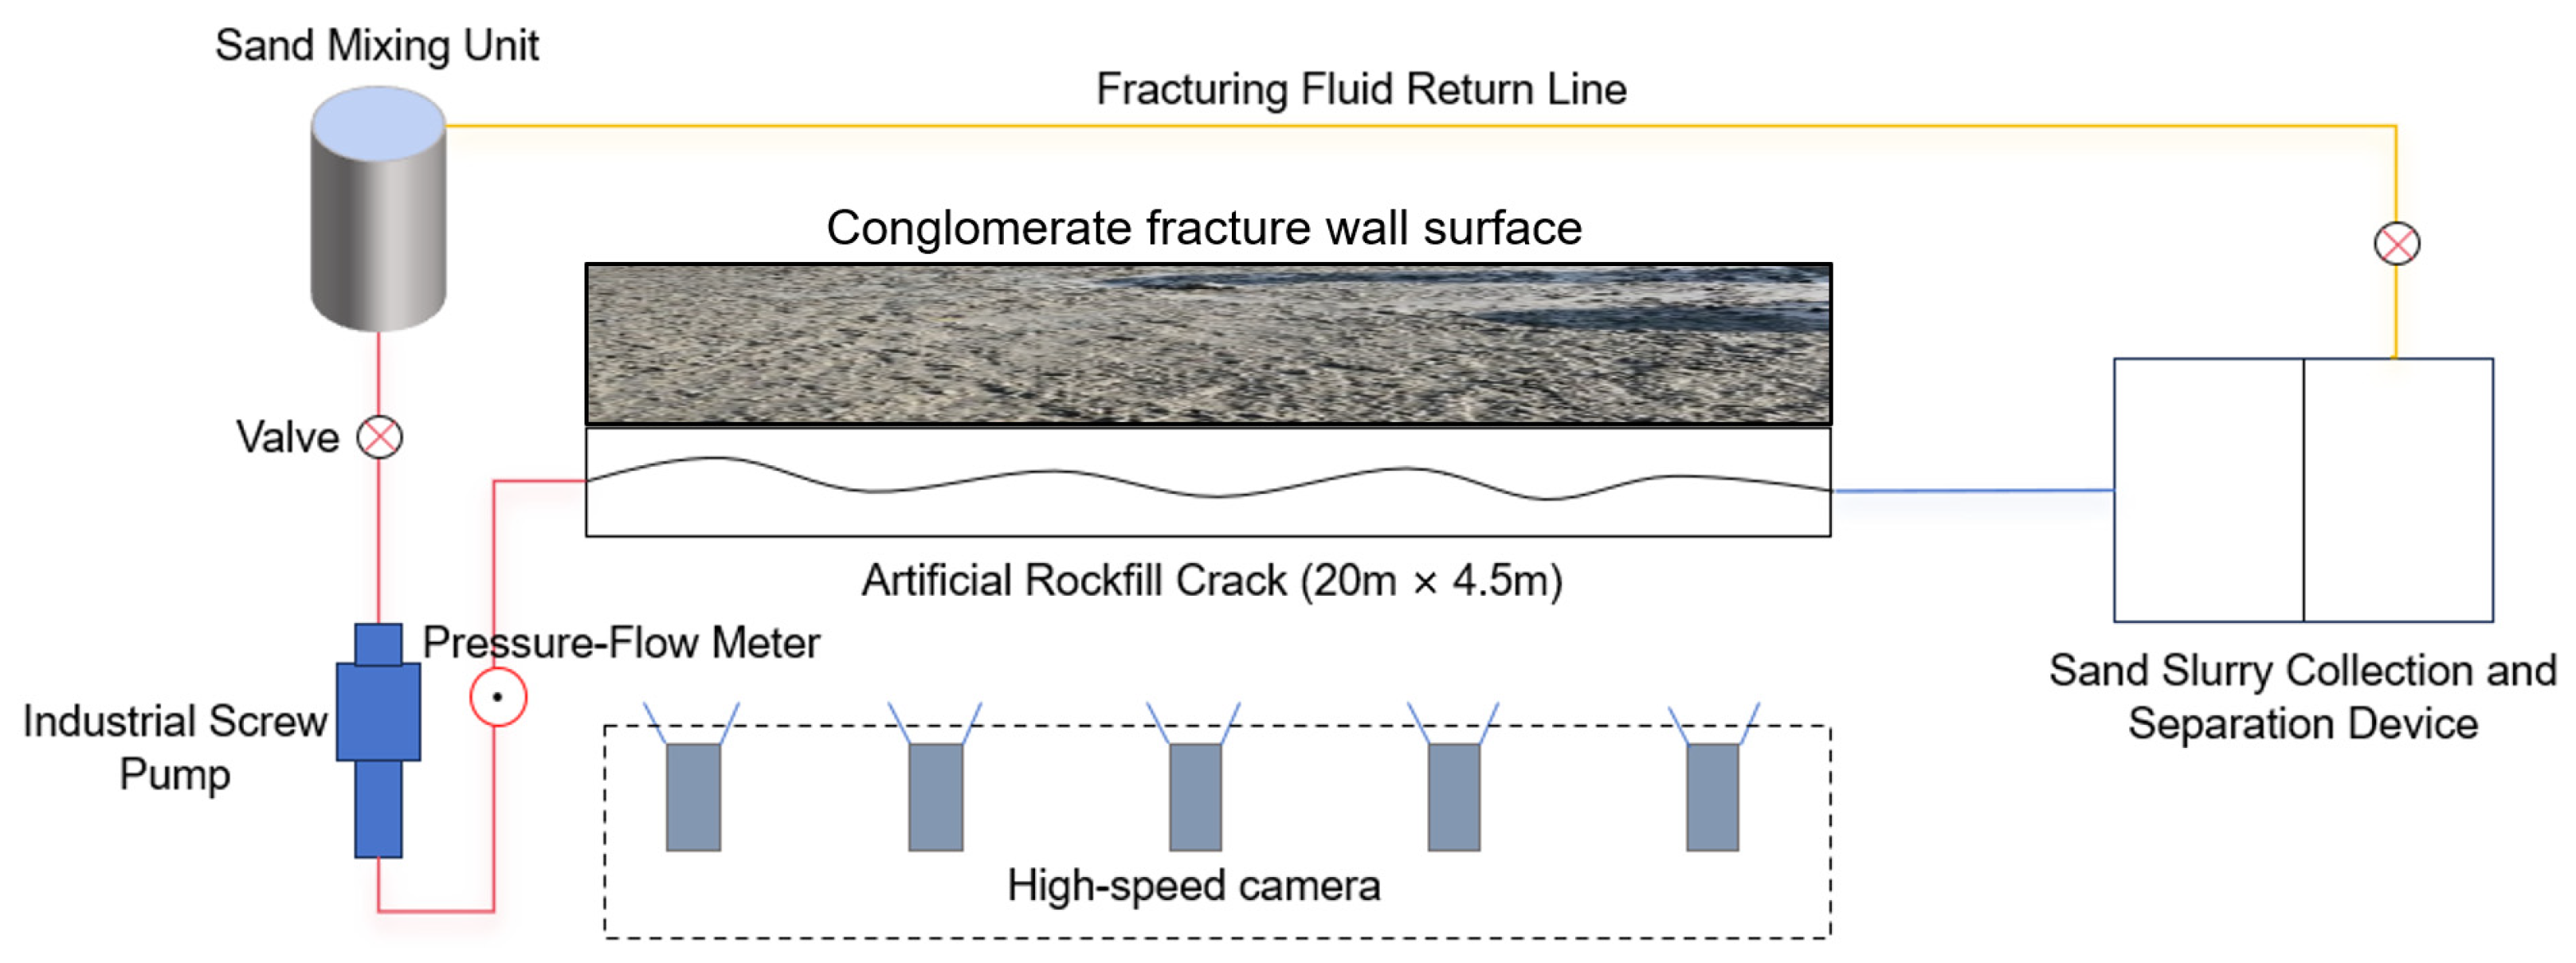
It should be noted that the present study is based on a single planar fracture model, whereas hydraulic fractures in conglomerate reservoirs often form complex, branching fracture networks with variable apertures. This simplification was intentionally adopted to isolate the fundamental mechanisms governing proppant transport and deposition under rough-wall conditions, which are difficult to decouple in highly complex fracture systems.
Although the experimental system allows adjustable fracture widths, each individual experiment was conducted under a constant width to ensure repeatability and to avoid confounding effects caused by simultaneous width variation. The influence of fracture branching and dynamic aperture evolution is therefore beyond the scope of this study and should be addressed in future investigations combining multi-branch fracture geometries and variable-width conditions.
3.1. Vertical Stratification Forms Sand Embankments
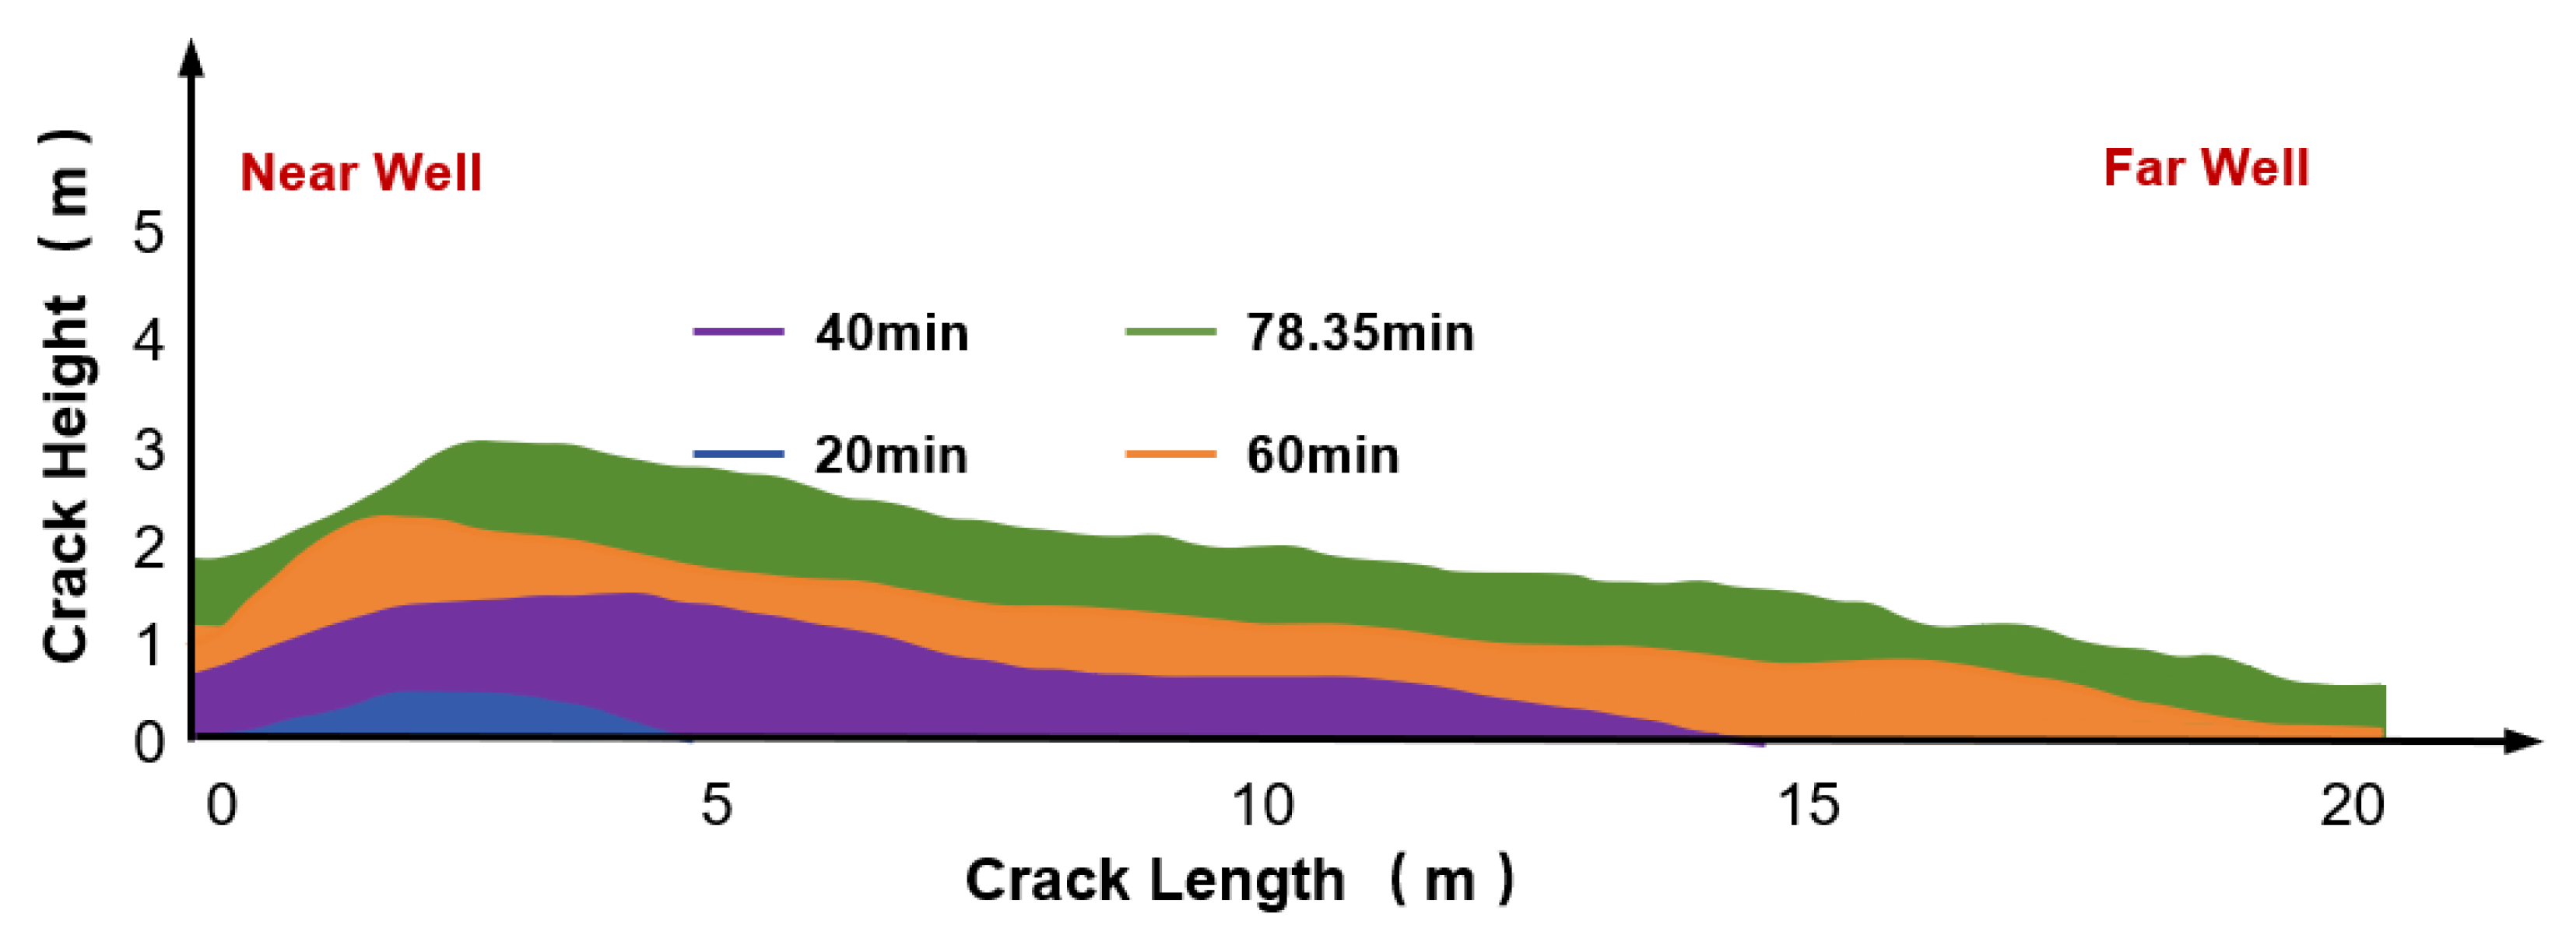
In coarse carbonaceous rock fractures, proppant migration and sand dam formation exhibit typical layered characteristics, fundamentally stemming from the coupled effects of fluid dynamics in heterogeneous fractures and particle gravitational deposition. Proppants undergo multi-stage dynamic processes within fractures, including migration, deposition, and re-accumulation. This behavior deviates from simple linear forward accumulation, instead exhibiting a “stratified growth” pattern where layers are sequentially deposited along the fracture’s longitudinal axis. Experiments demonstrate that when sand-carrying fluid enters rough fractures, particles preferentially deposit in locally low-velocity or spatially constrained zones, forming initial sand piles. Subsequently, newly introduced particles are transported by the fluid across existing sand layers, forming new deposition layers above or at the leading edge of these piles. This process causes the sand dam to gradually thicken and advance toward the downhole direction over time. Layered growth exhibits two typical patterns under different flow rates: “longitudinal spreading” and “front-pile-back-spread.” The former primarily involves layer-by-layer accumulation and thickness increase, while the latter initially forms a near-wellbore sand pile. As flow rate increases and velocity intensifies, proppants can traverse the existing accumulation body, forming new deposition zones at greater distances, thereby shifting the sand ridge’s crest toward the downhole end. This difference stems from variations in flow velocity and particle inertia caused by flow rate changes: high flow rates enhance sand-carrying capacity, facilitating longer-distance transport of fine-grained proppants; low flow rates, lacking sufficient flow energy, cause particles to concentrate near the wellbore, forming tall yet short localized sand piles.
The experimental results clearly demonstrate this displacement control effect: at a displacement rate of 0.12 m
3/min (
Figure 2), the sand mound primarily exhibited localized thickening and layered superposition. The high point remained largely fixed, displaying typical “vertical deposition” characteristics—the mound top was flat, with distinct layers and limited extension. Under 0.24 m
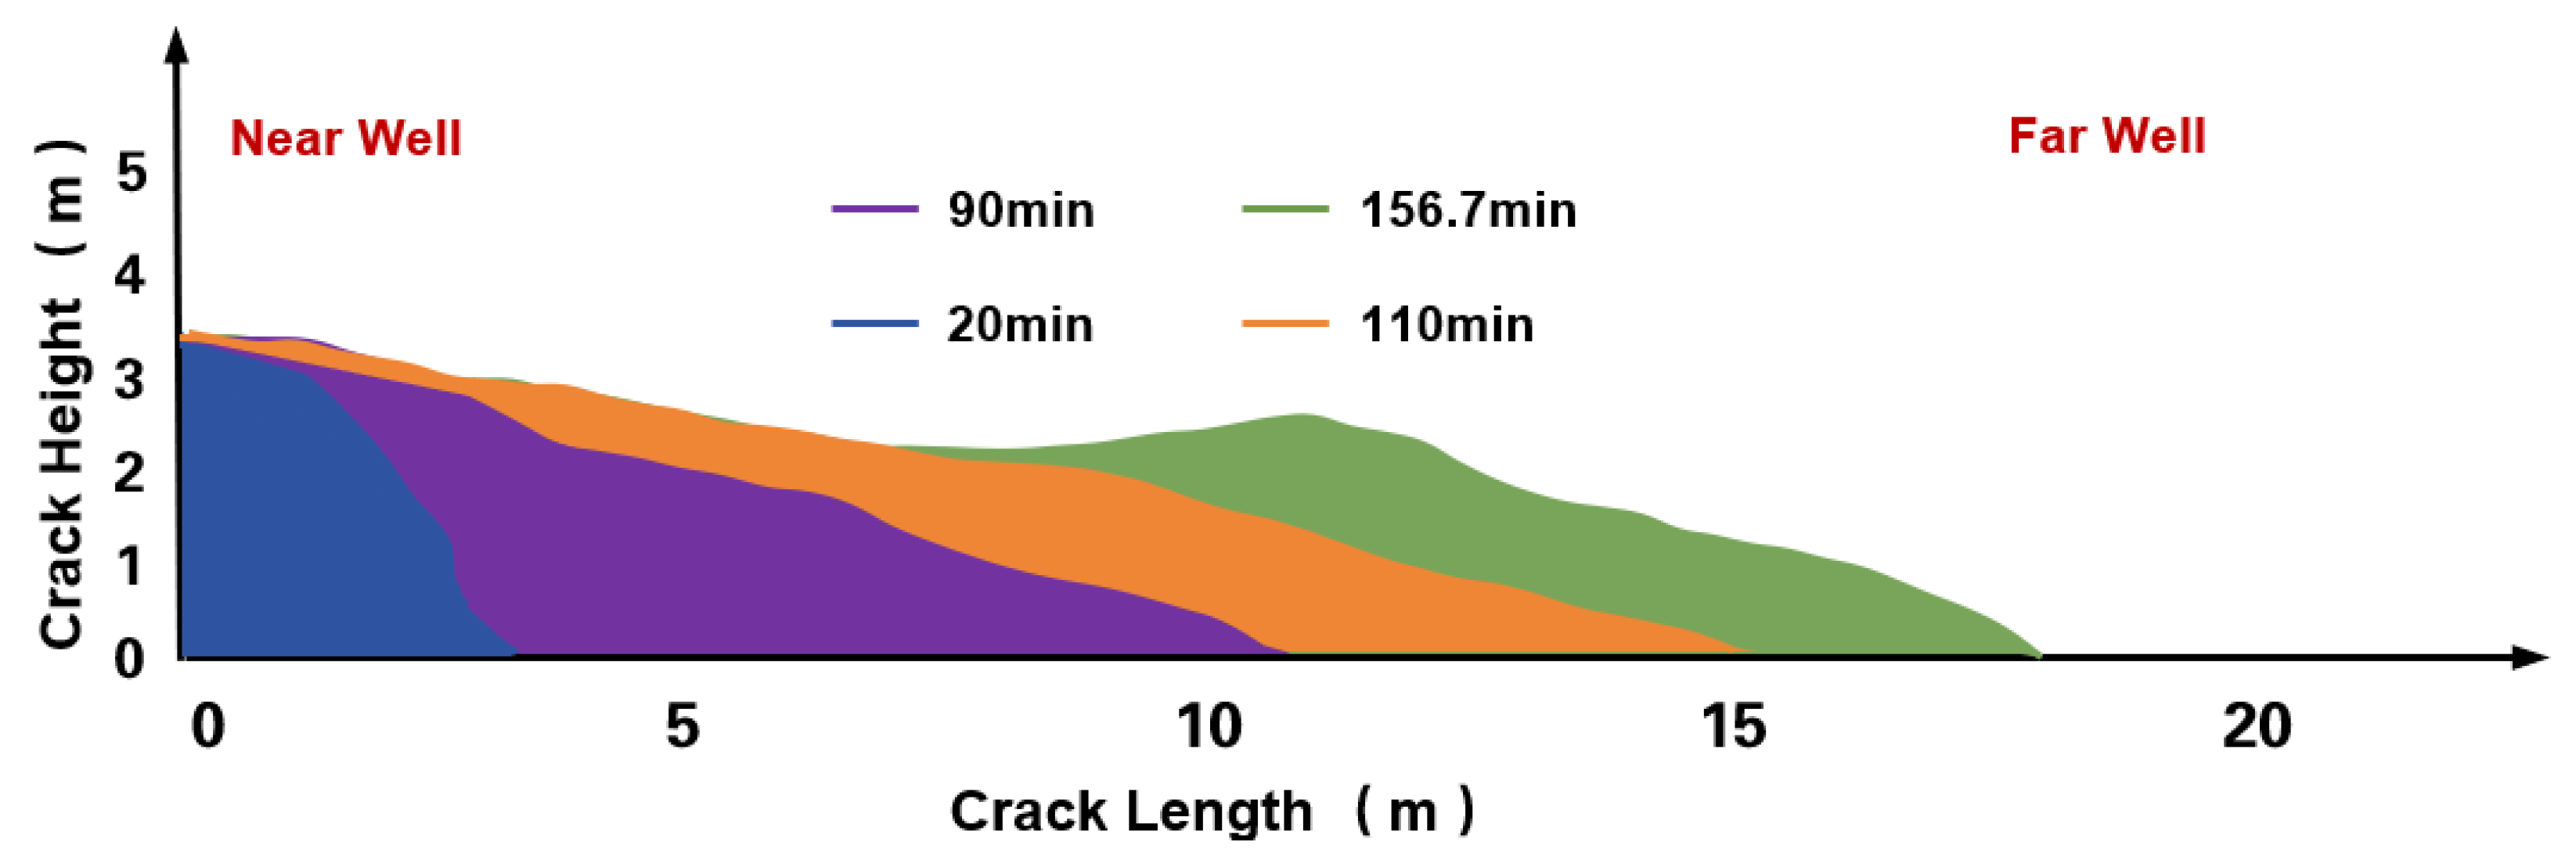
3/min flow rate (
Figure 3), the sand ridge’s high point significantly retreated over time, indicating sustained distal migration of proppants driven by high flow velocity, forming a “front deposition, rear placement” pattern. During this phase, the sand ridge exhibited rapid initial thickness growth followed by a gradual slowdown, with its overall geometry transitioning from steep to broad. The deposition distribution distinctly shifted outward. This evolutionary pattern reflects the coupled effects of flow rate, viscosity, and particle size: High flow rates combined with medium-to-high viscosity fluids extend particle migration distances, while smaller-sized proppants more readily traverse complex fracture zones with the fluid, resulting in broader sand ridges with greater distal proportions. Conversely, low-flow-rate, low-viscosity systems paired with larger-sized proppants tend to form thicker, steeper sand ridges near the wellbore.
In the classification of sandbar patterns, the layered deposition pattern formed by low-displacement, low-viscosity fluids combined with large-grain proppants primarily manifests as a “short-thick” structure thickened near the wellbore. Peak positions remain stable across all stages, reflecting sedimentary control. In contrast, the “wide-thin” sandbar formed by high-flow-rate, medium-to-high-viscosity fluids combined with fine-grained proppants primarily advances horizontally. Peak positions continuously shift forward, and the center of sedimentation progressively moves outward, better aligning with the support requirements for the distal end of fracturing fractures. Both patterns exhibit layered accumulation characteristics with sequential temporal superposition, yet their growth rates and spatial migration trends differ significantly: the former centers on thickness increase, while the latter emphasizes leading-edge advancement. This “parallel layering and advancement” mechanism demonstrates that sandbars are not passive accumulations but dynamic structures shaped by the combined effects of flow field disturbance, gravitational redistribution, and particle dynamics.
From an engineering perspective, the layered growth pattern holds significant implications for fracture design. Pump rate is the primary parameter governing the spatial distribution of sand packs: an excessively low rate leads to thick accumulation near the wellbore and insufficient support downstream, while an excessively high rate may push proppants too far forward, resulting in sparse, structurally unstable packs downstream. Therefore, pump rate should be comprehensively optimized based on fracture roughness, particle size selection, and fluid viscosity to ensure sand packs cover the primary flow zone while avoiding near-wellbore blockage. Matching fluid viscosity with proppant particle size is equally critical: while high viscosity enhances sand-carrying capacity, pairing it with large proppant particles increases resistance and promotes premature deposition; low viscosity struggles to maintain stable suspension of small particles, leading to scattered deposition. Reasonably combining viscosity and particle size parameters can significantly improve sand pile morphology and flow distribution uniformity. The layered structure of the sand dam itself exerts a dual influence on closed-off flow capacity: proper layering aids in forming a stable pressure-bearing structure, enhancing flow persistence; however, excessively thick or unevenly distributed layers reduce the local effective flow cross-section and increase friction resistance. Therefore, during construction, strategies such as multi-stage sand injection and flow rate gradient control are necessary to maintain a balance between moderate layering and appropriate forward progression of the sand dam.
3.2. Pump Injection Pressure: Gradual Increase–Rapid Increase–Steady Decrease
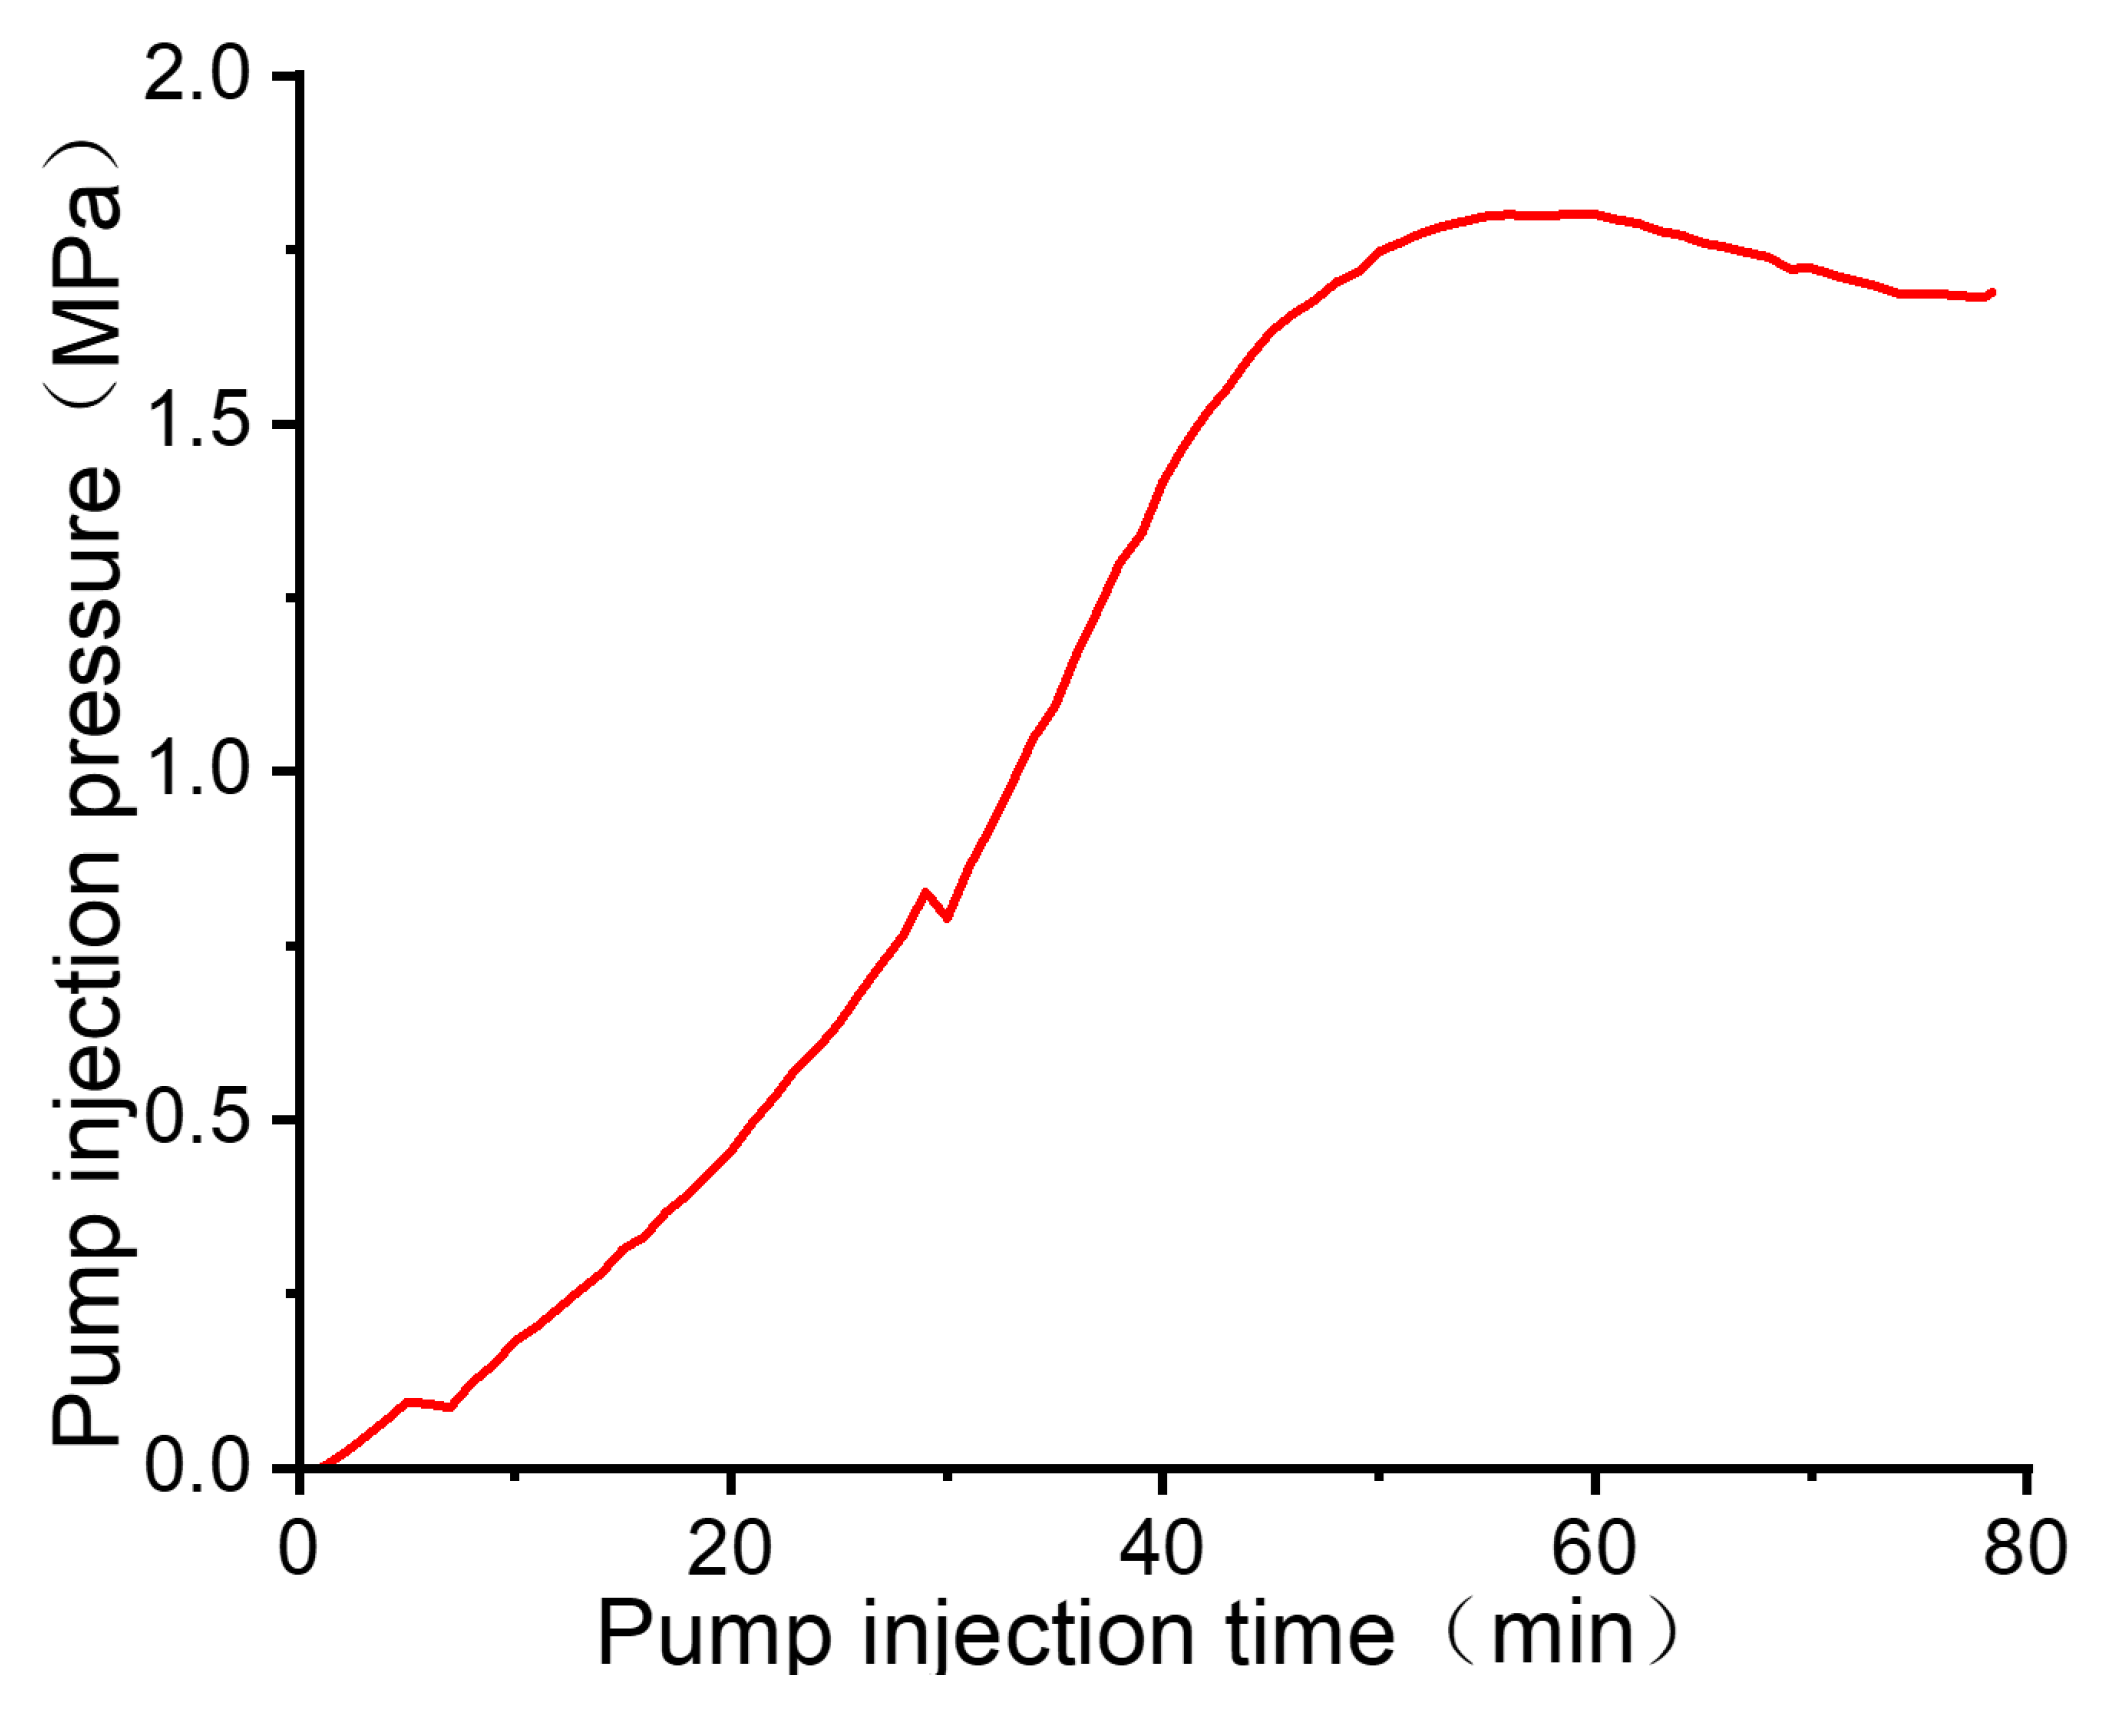
During proppant migration and sand pack evolution, the pump pressure curve reflects the coupling characteristics of the fluid-particle system within the fracture channel. Using a flow rate of 0.24 m
3/min, medium-viscosity fluid, 40/70 mesh quartz sand, and a sand concentration of 100 kg/m
3 as an example (
Figure 3 and
Figure 4), simultaneous monitoring of pump pressure and the sand dam’s peak elevation revealed a typical three-stage pressure evolution process: “slow rise—rapid rise—steady decline.” This demonstrates that pump pressure variations play a dominant role in sand dam migration.
In the first stage (slow rise), the fluid has just entered the fracture with low sand-carrying capacity. The passage remains sufficiently open, and the pump pressure rises slowly, primarily influenced by the increase in fluid volume and the accumulation of local resistance. At this point, proppants mainly deposit near the wellhead, with the sand ridge height fixed and local thickening predominant, indicating the system is still in the initial filling stage. Entering the second stage (rapid rise), the growing sand pile causes a contraction in the local cross-sectional area, leading to a rapid increase in flow velocity and a sharp rise in sand-carrying resistance. The pump pressure rapidly climbs to its peak. Pressure drop concentrates at the crest and leading edge of the sand dam, intensifying fluid flow around and impact against the dam. Driven by kinetic energy, the dam’s leading edge begins significant migration toward the downhole end. The pump pressure peak corresponds to the moment of maximum dam migration rate, reflecting the driving force of accumulated fluid inertia propelling the dam forward. As the system enters the third stage (steady decline), the sand dam is pushed to a new position, reopening the local channel and reducing overall resistance. Pump pressure then falls and stabilizes. During this stage, the sand dam’s peak height stabilizes, though lateral and longitudinal expansion continues, with its morphology gradually flattening. This indicates the system has completed energy dissipation and flow field reconstruction. The three-stage pump pressure characteristics correspond precisely to the sand ridge’s positional changes: gradual rise corresponds to sand pile initiation and positional fixation; rapid rise corresponds to the sand pile’s swift forward thrust; steady decline corresponds to sand pile stabilization and channel reconstruction. Pump pressure fluctuations regulate the equilibrium between sand ridge advancement and deposition, thus serving as a critical diagnostic signal for determining the stage of sand ridge evolution.
From a mechanical perspective, the presence of sand bars alters channel geometry, causing viscous forces, inertial forces, and particle gravity to compete. Local narrowing increases dynamic pressure, causing a sudden surge in pumping pressure. When fluid kinetic energy sufficiently overcomes resistance at the sand bar’s leading edge, the entire sand bar is displaced. Subsequently, the channel widens, resistance decreases, pumping pressure recedes, and steady-state conditions are reached. This fluid-solid coupling feedback becomes more pronounced under conditions of high discharge volume and high sand content.
In engineering practice, the pump pressure curve can be used to identify sand pack status in real time: a sharp rise indicates entry into the channel contraction phase, requiring prevention of excessive accumulation near the wellbore; a steady decline phase signifies completion of sand pack migration, allowing maintenance of current flow rates to achieve uniform distribution. By rationally controlling pump pressure to follow a “gradual increase–rapid increase–steady decrease” trajectory, an ideal sand pack morphology and flow-conducting structure can be achieved.
In summary, the “gradual increase–rapid increase–steady decrease” pattern not only reflects pressure changes but also reveals the dynamic process of proppant accumulation, migration, and stabilization. The coupling relationship between pump pressure and sand pad evolution holds significant engineering implications for proppant delivery, fracture flow structure optimization, and dynamic operation control during fracturing.
3.3. Near-Wellbore Accumulation of Proppants
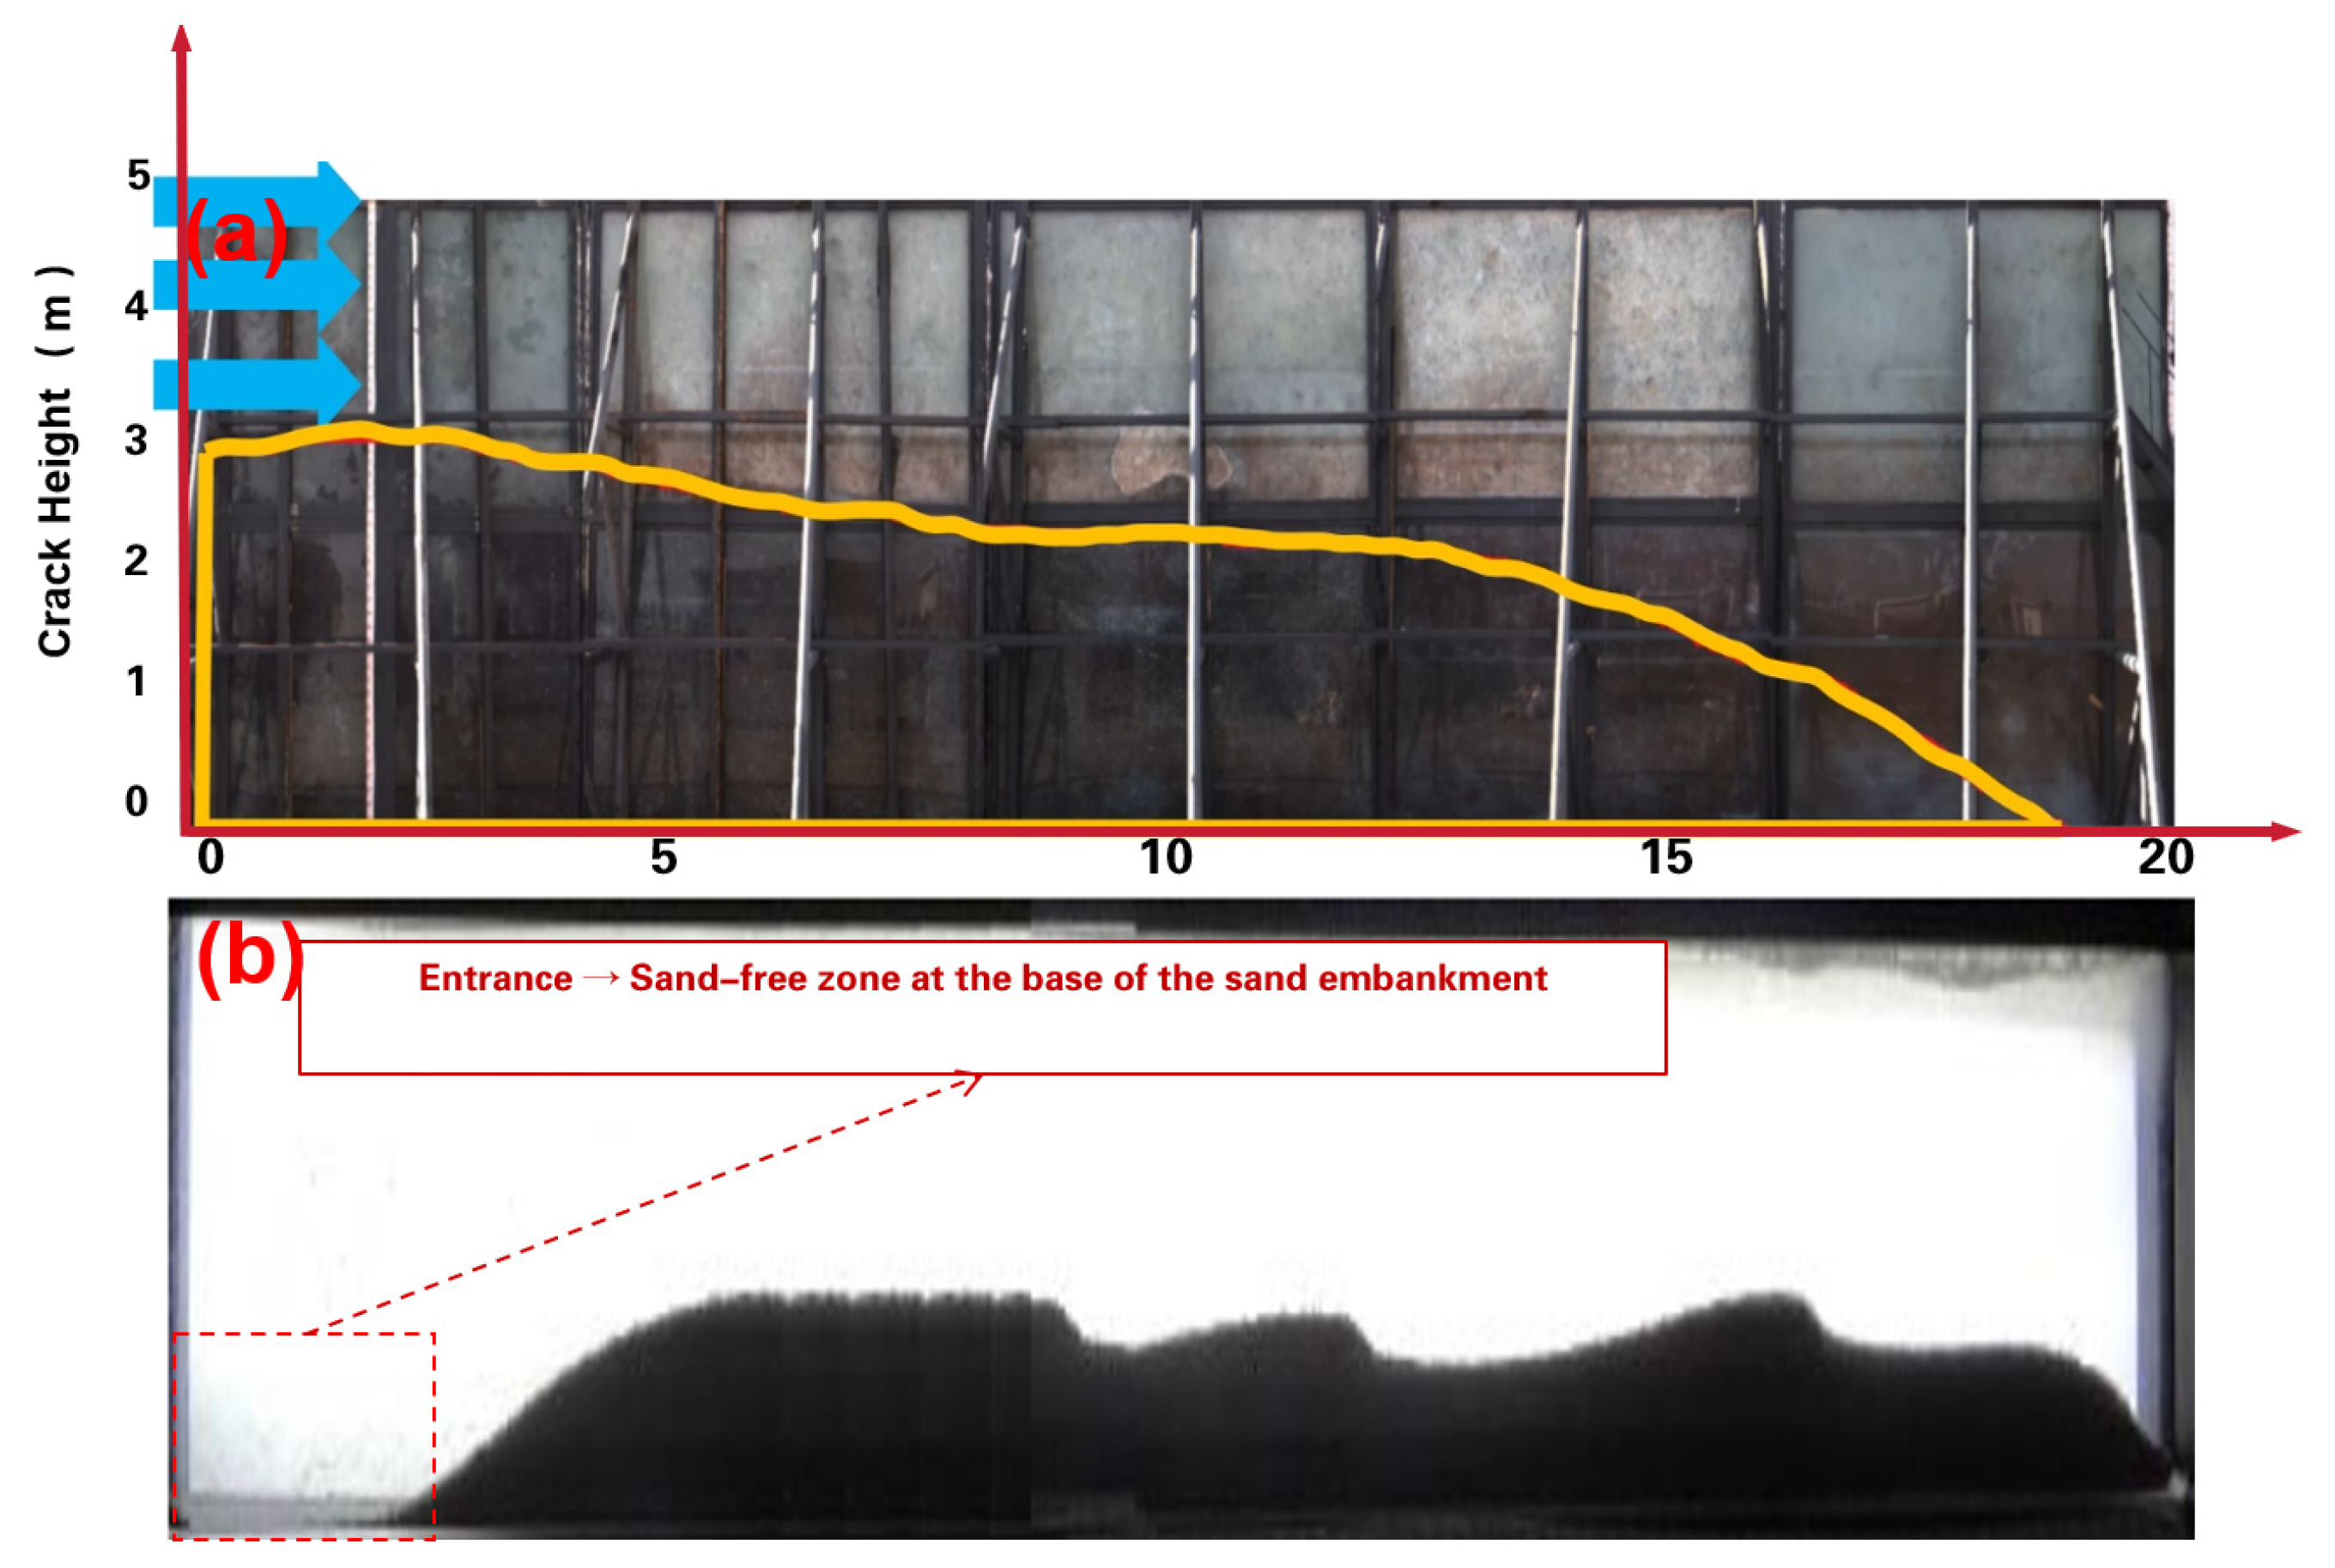
The migration and placement of proppants within rough carbonaceous rock fractures significantly govern the flow capacity of fracturing. Under rough fracture conditions (
Figure 5a), the combined effects of fracturing fluid viscosity, flow rate, proppant particle size, and rough wall surfaces readily induce a pronounced “entry accumulation effect” for proppants in the near-wellbore section. This leads to increased fluid drag and rapid energy dissipation in the sand-carrying flow. Proppant particles settle and become trapped over short distances, forming thick sand piles near the wellbore while creating distinct “sand-depleted zones” in the downhole section. This phenomenon reflects the strong coupling between fracture roughness, fluid sand-carrying capacity, and particle dynamics.
From a flow dynamics perspective, protrusions on carbonaceous rock fracture surfaces and gravel alter channel morphology, subjecting fluids near the wall to enhanced friction and turbulence. This leads to localized backflow and low-velocity zones, causing the main flow line to shift toward the channel center. Upon entering fractures, sediment-laden fluids continuously lose kinetic energy through wall friction and particle collisions, resulting in a rapid decline in overall sediment-carrying capacity. Under the combined effects of gravity, wall resistance, and velocity decay, proppants exhibit significantly shortened trajectories. They form progressively thicker accumulation zones from the inlet to the near-wellbore section, further compressing the flow cross-section. This accelerates energy dissipation in subsequent fluids, creating a self-reinforcing accumulation process. Time-series images reveal that the inlet sand pile rapidly forms initially, thickens predominantly during the middle phase with limited front advancement, and stabilizes in shape during the late phase, exhibiting typical “depositional stagnation” characteristics.
Compared to the common “entrance lift effect” observed in experiments with smooth parallel plates (
Figure 5b) [
24], the entrance region in rough fractures exhibits no lift but instead forms a highly convex sand pile. The height of this pile rapidly decreases with distance, indicating that roughness significantly suppresses long-distance migration of proppants. At the microscopic level, wall protrusions cause particles to frequently collide, roll, and rebound, with each interaction dissipating kinetic energy. When fluid velocity is insufficient to compensate for this loss, particles settle near the wellbore end and form an accumulation nucleus. Subsequent particles continuously accumulate at its leading edge and top, ultimately forming a stable inlet sand cushion.
In engineering terms, the entrance accumulation effect of coarse fractures enhances near-wellbore support and improves local anti-closure capacity on one hand, while weakening distant support and overall flow continuity on the other. Therefore, for fracturing in coarse carbonaceous rock fractures, energy decay should be mitigated by reducing fluid viscosity, increasing moderate flow rates, and optimizing particle size distribution to minimize excessive accumulation at fracture entrances. Concurrently, segmented sand packing and flow rate gradient design should be employed to extend proppant coverage while ensuring near-wellbore stability, thereby providing critical insights for optimizing fracture flow structure.
3.4. Analysis of the Influence of Pumping Parameters
To thoroughly elucidate the key control mechanisms governing proppant migration and placement behavior within rough fractures, this study conducted single-factor comparative analyses of core parameters—including pumping discharge rate, fluid viscosity, proppant particle size, and sand concentration—under conditions involving multiple interacting factors. While maintaining constant fracture geometry and other variables, each parameter was systematically altered to investigate its influence on sand bridge morphology, migration distance, and effective support area. This analytical approach isolates interactions between factors, clarifying the independent contributions of each parameter to proppant dynamics. It establishes a foundation for identifying primary controlling factors and determining optimal fracturing parameter combinations. The following sections will discuss the effects from four aspects: pumped volume, fluid viscosity, particle size, and sand concentration.
3.4.1. Pump Discharge Volume
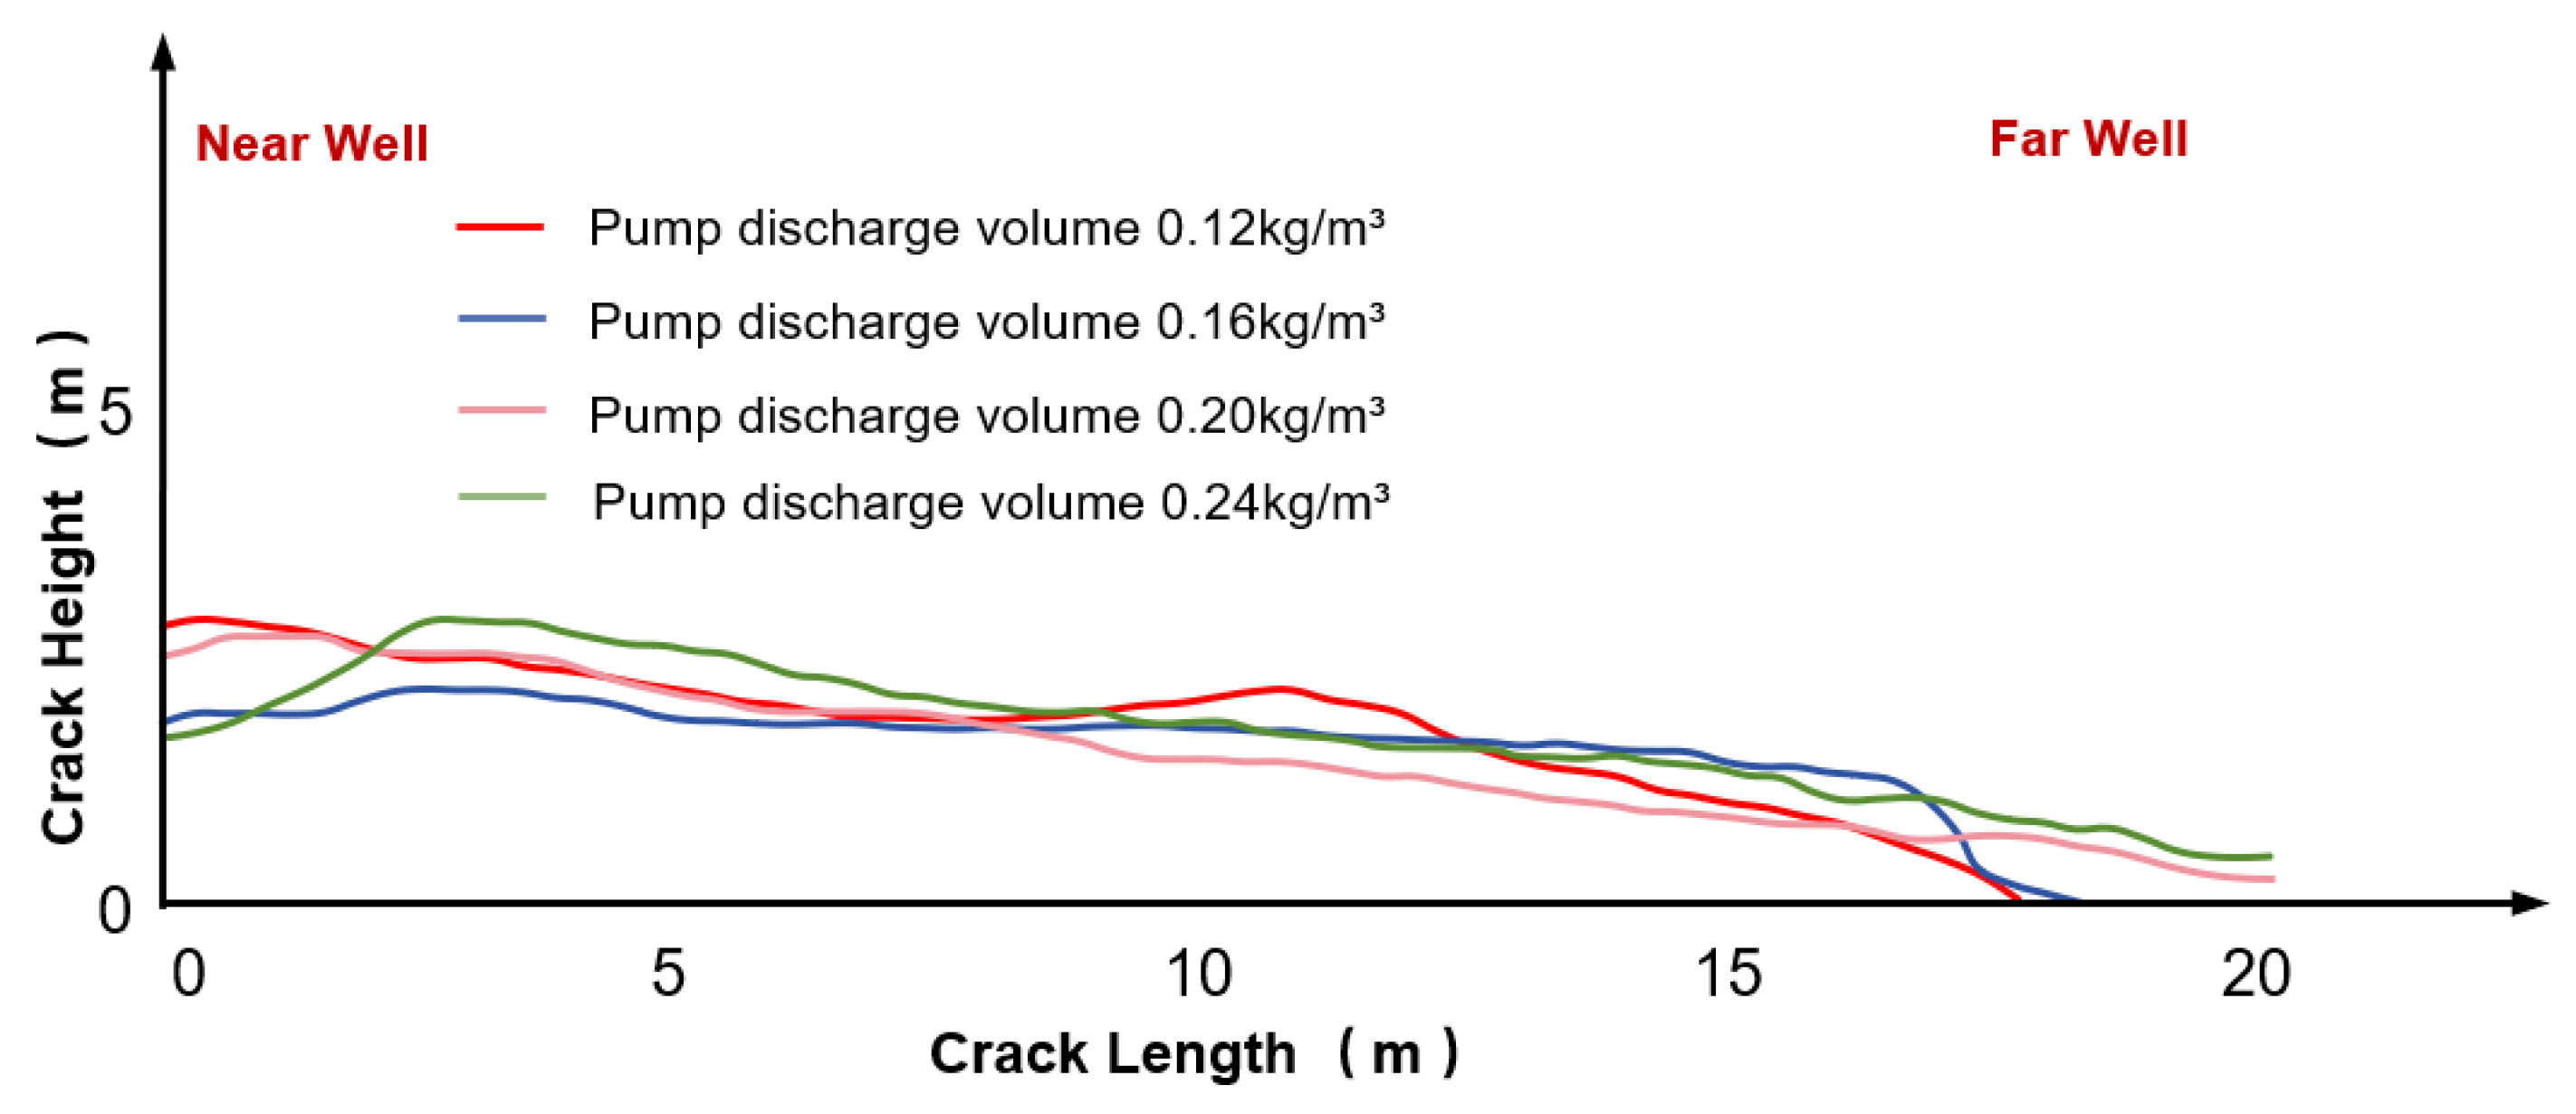
Figure 6 and
Table 2 demonstrate that under conditions of medium-viscosity fracturing fluid, 40/70 mesh proppant, and a sand concentration of 100 kg/m
3, pumped flow rate is the primary factor determining proppant migration distance, sand dam morphology, and effective propped area. This relationship exhibits a typical nonlinear pattern characterized by an initial increase followed by stabilization.
At low pumping discharge rates (0.12 m
3/min), the kinetic energy of the sand-carrying fluid is limited. Particle movement is constrained by the combined effects of gravitational settling, wall friction, and collision resistance, leading to premature retention. The sand ridge length is only approximately 17.5 m, with an effective support area below 60%, resulting in a distinct non-uniform deposition pattern characterized by a “thick front and thin rear” configuration. This phenomenon can be explained by particle settling Equation (14) [
25,
26].
In the equation, the settling distance L increases with higher flow velocity v and fluid viscosity μ, while being inversely proportional to the square of the particle radius r2 and the density difference. Low pumping rates result in reduced v, which fails to counteract the particle settling tendency. This causes particles to rapidly lose energy near rough walls, concentrating their accumulation in the near-wellbore zone and leading to significant under-support at the far-wellbore end.
When the pumping discharge rate increased to 0.16 m3/min, the enhanced flow velocity amplified the drag force on particles, prolonging their suspension time. This resulted in a rise in sand ridge length and effective support area to approximately 62.8%. The sand ridge curve flattens, the thickness difference decreases, and the support distribution shifts from localized accumulation to overall spreading, significantly enhancing the leading edge advancement capability. When the pumping discharge increases to 0.20 m3/min, the migration capability reaches its optimum, with the sand ridge length exceeding 20 m and the effective support area exceeding 64%, achieving essentially complete crack support. At this point, the flow velocity v achieves dynamic equilibrium with particle settling velocity, optimally balancing drag force, viscous damping, and gravitational settling—representing the optimal pumping rate for this system. However, when the pumping rate further increases to 0.24 m3/min, the effective support area only marginally increases to approximately 65%, entering the “pumping rate saturation zone.” Although v in Equation (14) further increases, the high pumping rate significantly enhances turbulence, resuspension, and scouring effects. This weakens the stabilizing effect of viscosity on sedimentation, causing the sediment structure to fluctuate. The top of the sand dam locally thins, and the overall support continuity decreases.
In summary, the pump injection flow rate decisively influences the migration distance of proppant, the morphology of sand pads, and the effective propped area within coarse fractures. Its variation pattern can be explained by the “velocity–viscosity–particle gravity” equilibrium relationship described by Equation (14). Excessively low pumping rates cause premature particle settling and intensified accumulation near the wellbore. At moderate pumping rates, sand-carrying capacity dynamically matches settling resistance, enabling more uniform placement. Conversely, excessively high pumping rates accelerate turbulence and resuspension effects, slowing the growth of effective support. These findings demonstrate that selecting an optimal pumping rate range is critical for controlling proppant distribution and fracture coverage.
3.4.2. Viscosity of Fracturing Fluid
In coarse fractures, fracturing fluid viscosity is the key parameter governing proppant migration distance, deposition morphology, and effective propped area.
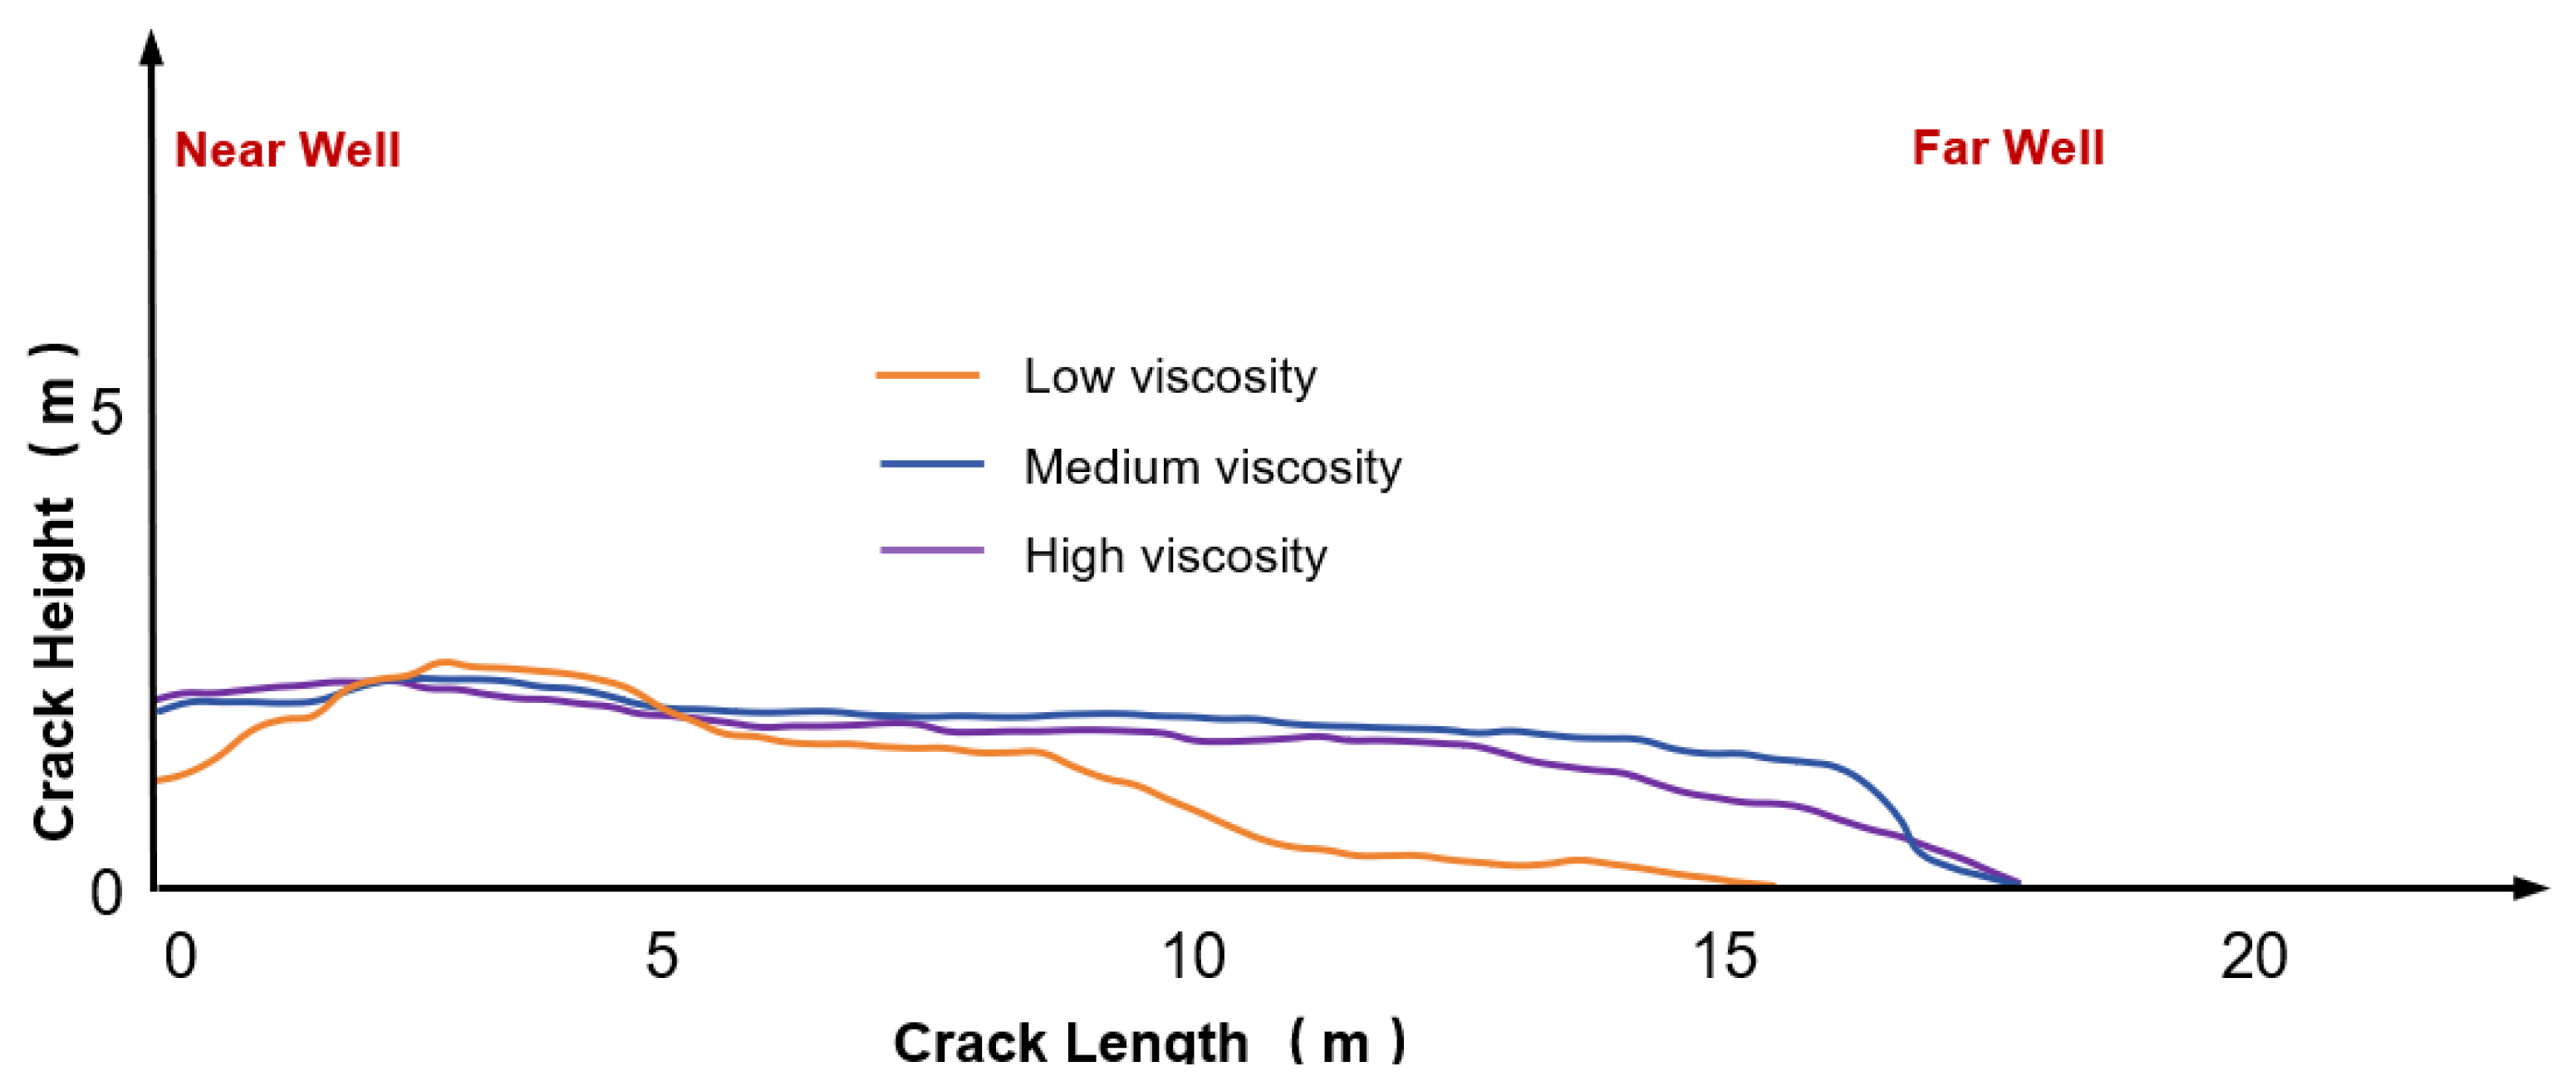
Figure 7 and
Table 3 demonstrate that viscosity determines proppant transport pathways and deposition efficiency by regulating sand-carrying capacity, particle suspension time, and flow resistance. The overall pattern exhibits a typical “bilateral effect”: as viscosity increases from low to medium ranges, sand-carrying capacity significantly enhances, markedly improving sand ridge length, distribution uniformity, and effective support area. However, when viscosity further increases to high-viscosity systems, fluid friction and energy dissipation surge dramatically. While this delays particle settling, it simultaneously weakens forward transport capability, ultimately reducing deposition efficiency.
In low-viscosity systems, fluid viscous shear is insufficient to maintain particle suspension, causing proppants to rapidly settle near the wellbore. Experiments show sand pads only 14.5 m long with an effective support area of just 25.5%, leaving approximately three-quarters of fractures unfilled and forming typical “inlet accumulation.” This state corresponds to a flow mechanism dominated by gravity settling with inadequate sand transport; When viscosity increased to the medium-viscosity system, sand-carrying capacity and flow stability significantly improved. Particle suspension time lengthened and settling rates decreased, extending the sandbar length to 17.6 m and increasing the effective support area to 62.8%. The sandbar morphology shifted from “steeply rising” to “gently spreading,” with continuous and more uniformly thick deposits within fractures. This viscosity range yielded the optimal support effect under the experimental conditions. In the high-viscosity system, deposition behavior reversed: although sand dam length and height were similar to the medium-viscosity phase, the effective support area slightly decreased to 60.7%. The dam top exhibited noticeable fluctuations, and the structure became looser. High viscosity hindered effective energy transfer in the fluid, slowing proppant migration. Some particles remained suspended for too long and became trapped in local recirculation, forming unstable deposits.
This pattern can be explained by the particle sedimentation equilibrium relationship (Equation (14)): the sedimentation distance L is proportional to the fluid viscosity μ. Increasing viscosity prolongs suspension time; however, when μ becomes excessively high, the fluid’s own movement is impeded, reducing its sand-carrying capacity. This results in slower sedimentation but difficulty in forward movement, leading to diminished sand transport performance. Therefore, viscosity possesses a “critical optimal range.” Sand bank curves also exhibit significant differences across varying viscosities: low-viscosity systems feature thicker near-wellbore sections and thinner distal sections; medium-viscosity systems display smooth, extended, and uniformly continuous profiles; high-viscosity systems tend to be thinner overall with enhanced local fluctuations. Collectively, these findings indicate that the medium-viscosity range is most conducive to forming stable, continuous, and dense effective support structures.
In summary, viscosity is the core factor determining the efficiency of proppant transport and deposition within rough fractures, with a clearly defined optimal range. Excessively low viscosity leads to premature deposition and near-wellbore accumulation, while excessively high viscosity restricts sand transport distance due to increased flow resistance and energy dissipation. Medium-viscosity systems demonstrate optimal performance in both proppant efficiency and structural stability, providing critical guidance for field-based fracturing fluid viscosity optimization.
3.4.3. Proppant Particle Size
Proppant particle size is the core factor determining the structural morphology, sandbar stability, and flow capacity within coarse fractures.
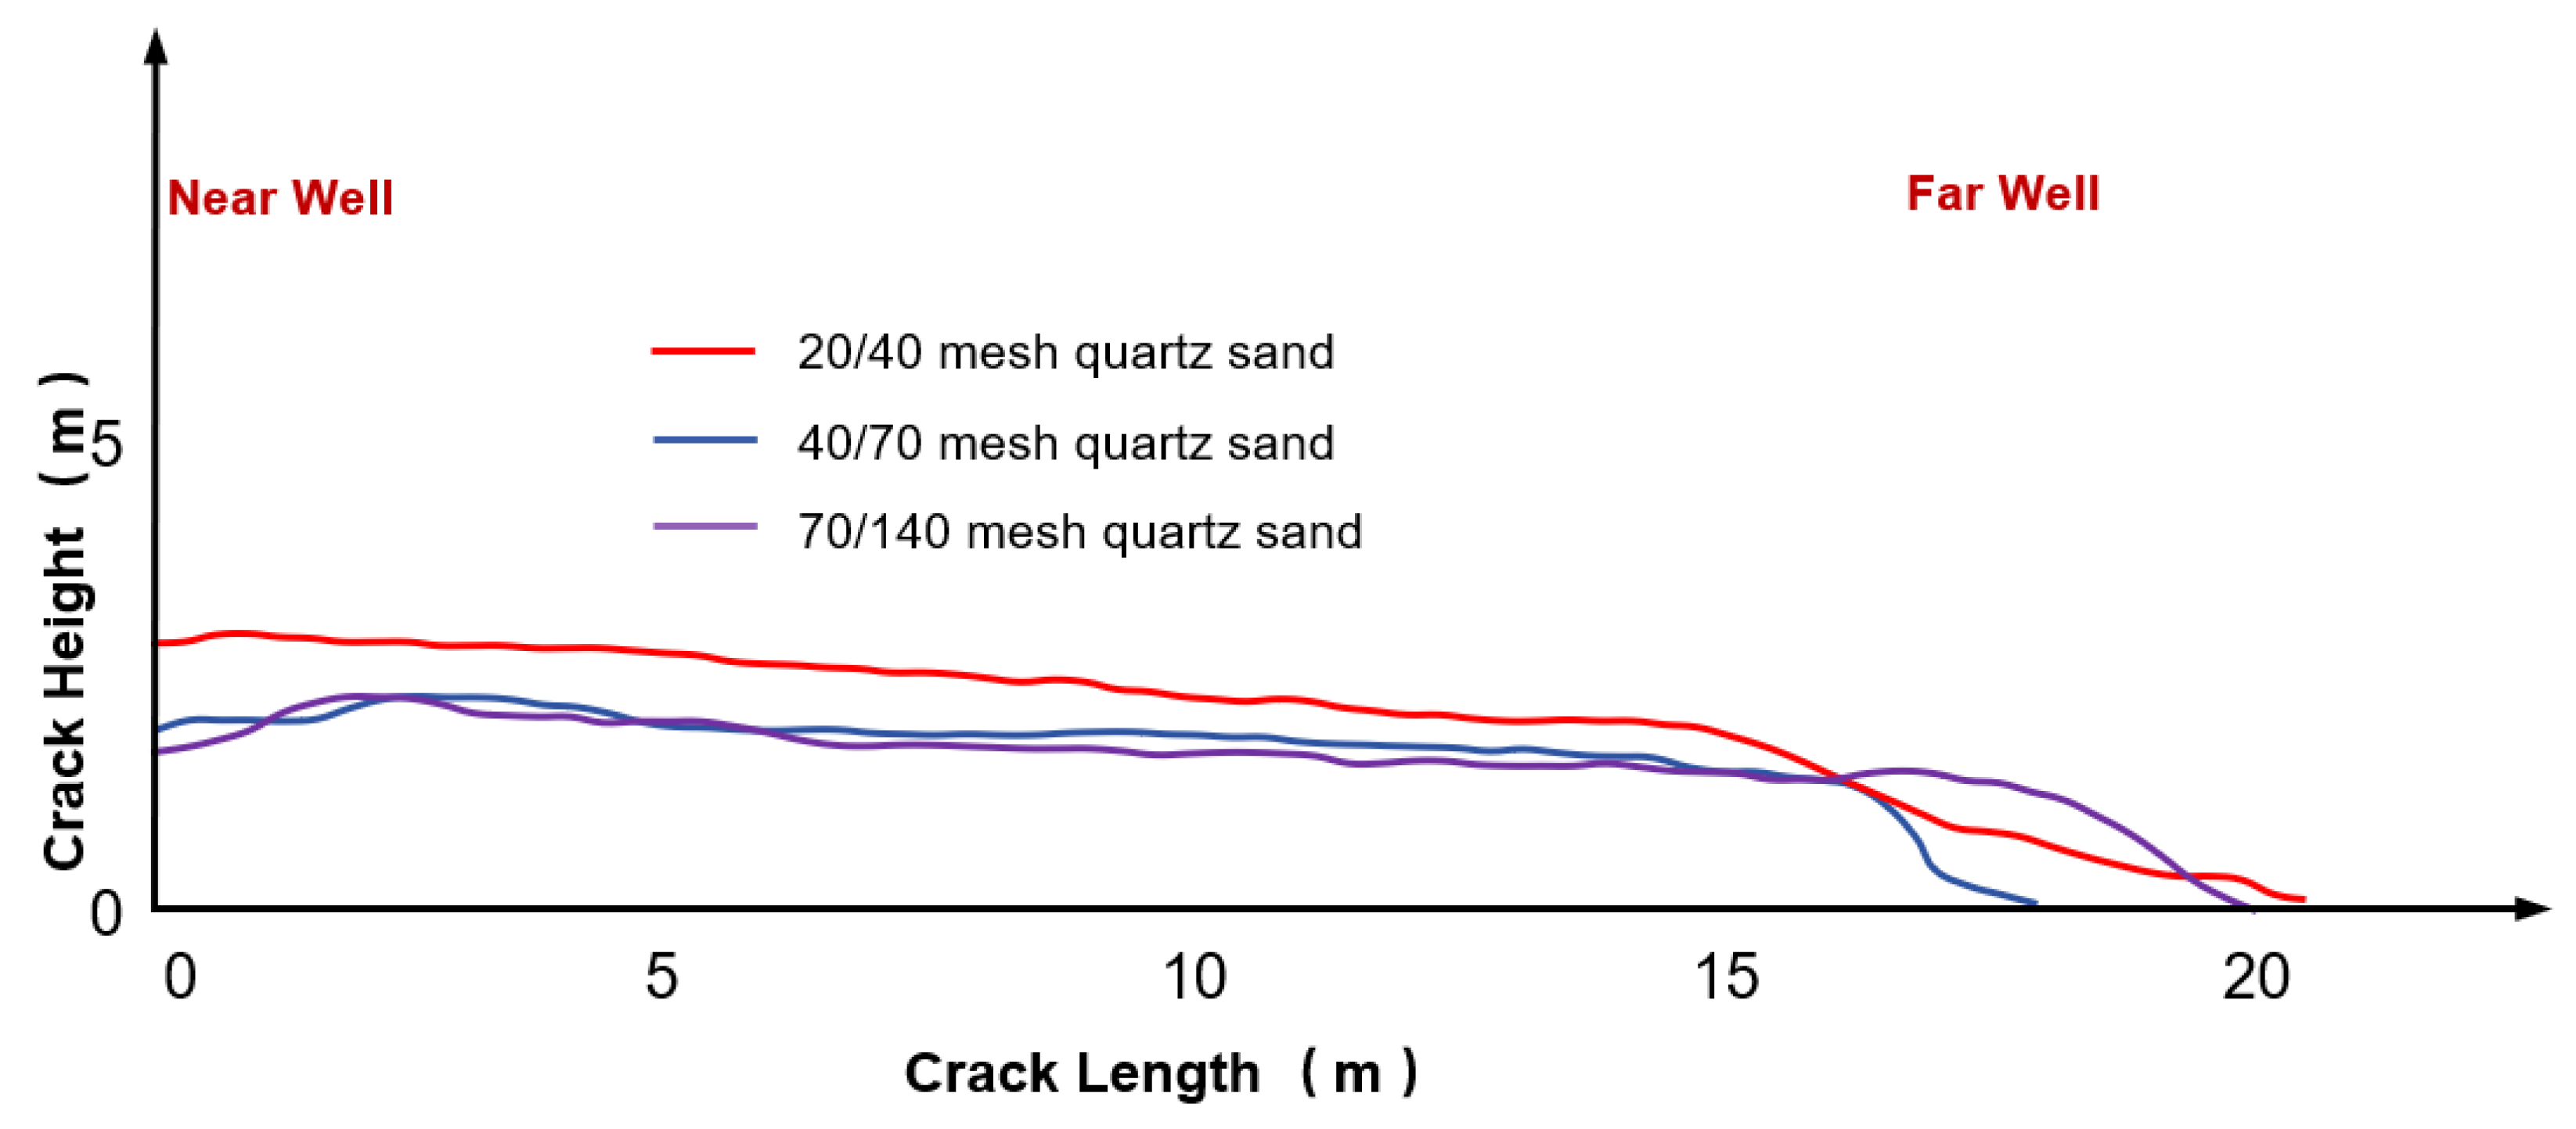
Figure 8 and
Table 4 demonstrate that proppants of different particle sizes exhibit significant differences under identical fracturing conditions, revealing a typical “dual-control” characteristic: coarse-grained (20/40 mesh) proppants offer strong support and stable accumulation but suffer from insufficient placement at the distal end; fine-grained proppants (70/140 mesh) provide extensive coverage and uniform distribution but exhibit loose structures and weak support capacity; medium-grained proppants (40/70 mesh) achieve the optimal balance between transportability and deposition stability, representing the most suitable size range.
In coarse sand formations, sand plugs can reach lengths of up to 20.3 m with an effective support area of 63.1%, exhibiting excellent overall continuity. Coarse-grained particles exhibit high inertia and rapid settling, readily forming thick accumulations near the wellbore. However, under medium viscosity and moderate displacement conditions, they still achieve some degree of distal extension. Their larger structural pores facilitate flow distribution, but insufficient distal replenishment results in weaker overall uniformity; 40/70 mesh medium sand performed optimally. The sand ridge measured 17.6 m in length with 62.8% effective support area, maintaining overall uniform continuity. Medium-sized particles achieve a dynamic equilibrium between gravity, inertia, and fluid drag forces. Their migration path is stable, preventing premature settling or drift due to insufficient mass. Sand pads form through a “constant-speed advance—steady-state accumulation” pattern, avoiding the excessive concentration seen with coarse sand while overcoming the loose structure of fine sand. This represents the optimal particle size for creating high-quality support layers. The fine sand system (70/140 mesh) can cover the entire fracture length but achieves only 59.5% effective support area. Fine particles remain suspended longer and are more susceptible to fluid disturbance, resulting in loose accumulation, high porosity, and susceptibility to compaction under closure stress, which reduces flow-conducting capacity. The sand dam curve exhibits significant fluctuations, with weak support near the wellbore and unstable structure at the far end, characterized by “uniform coverage but low load-bearing capacity.”
From the perspective of particle settling mechanisms, the settling distance L is inversely proportional to the particle diameter r2. Experimental results showing the rapid settling of coarse sand and the easy drifting of fine sand align with theoretical predictions. Excessively large particle sizes intensify accumulation near the wellbore and reduce uniformity; excessively small sizes, while expanding the distribution range, weaken support strength and stability. This indicates that particle size regulation must strike a balance between “load-bearing capacity” and “laying uniformity.”
From a flow field perspective, different particle sizes correspond to distinct migration layers: coarse sand forms a “basal-type” support along the bottom, medium sand creates a “uniformly distributed” sand cushion in the main fluid flow zone, and fine sand drifts to form a “covering-type” thin layer at the top, each exhibiting different flow diversion characteristics. The complementary nature of these three layers demonstrates the significant advantage of multi-size collaborative sand packing, enabling the ideal structure of “strong support near the wellbore and high continuity at the far end.”
Comprehensively, 20/40 mesh emphasizes strength, 70/140 mesh emphasizes coverage, while 40/70 mesh combines uniformity and stability, representing the optimal particle size range for efficient support in rough fractures. Rational particle size selection should integrate fracture dimensions, stress, and fracturing fluid properties, achieving controllable transport and stable deposition by matching particle size with fluid conditions. This study provides crucial evidence for particle size optimization and multi-graded sand injection strategies, holding significant engineering implications for enhancing fracturing proppage efficiency and flow sustainability.
Although the 20/40 mesh proppant exhibits a slightly higher effective propped area (63.1%) than the 40/70 mesh proppant (62.8%), coarse particles tend to settle more rapidly and form thicker near-wellbore sand accumulations under rough-wall conditions. This behavior reduces distal placement uniformity and increases the risk of premature bridging, particularly in long fractures. In contrast, the 40/70 mesh proppant demonstrates a more balanced performance by maintaining comparable effective propped area while exhibiting improved transport distance and more uniform distal distribution. Therefore, the designation of 40/70 mesh as the optimal particle size in this study is based on a comprehensive consideration of effective propped area, transport stability, and distal placement behavior, rather than effective area alone.
3.4.4. Sand Concentration
In hydraulic fracturing, sand concentration is a key control parameter influencing proppant migration behavior, sand dam structure, and effective propped area. Its variation not only determines the particle flux entering fractures but also reconfigures the overall mechanical characteristics of the fluid-solid two-phase system by regulating fluid viscosity, sand-carrying capacity, and particle group dynamics.
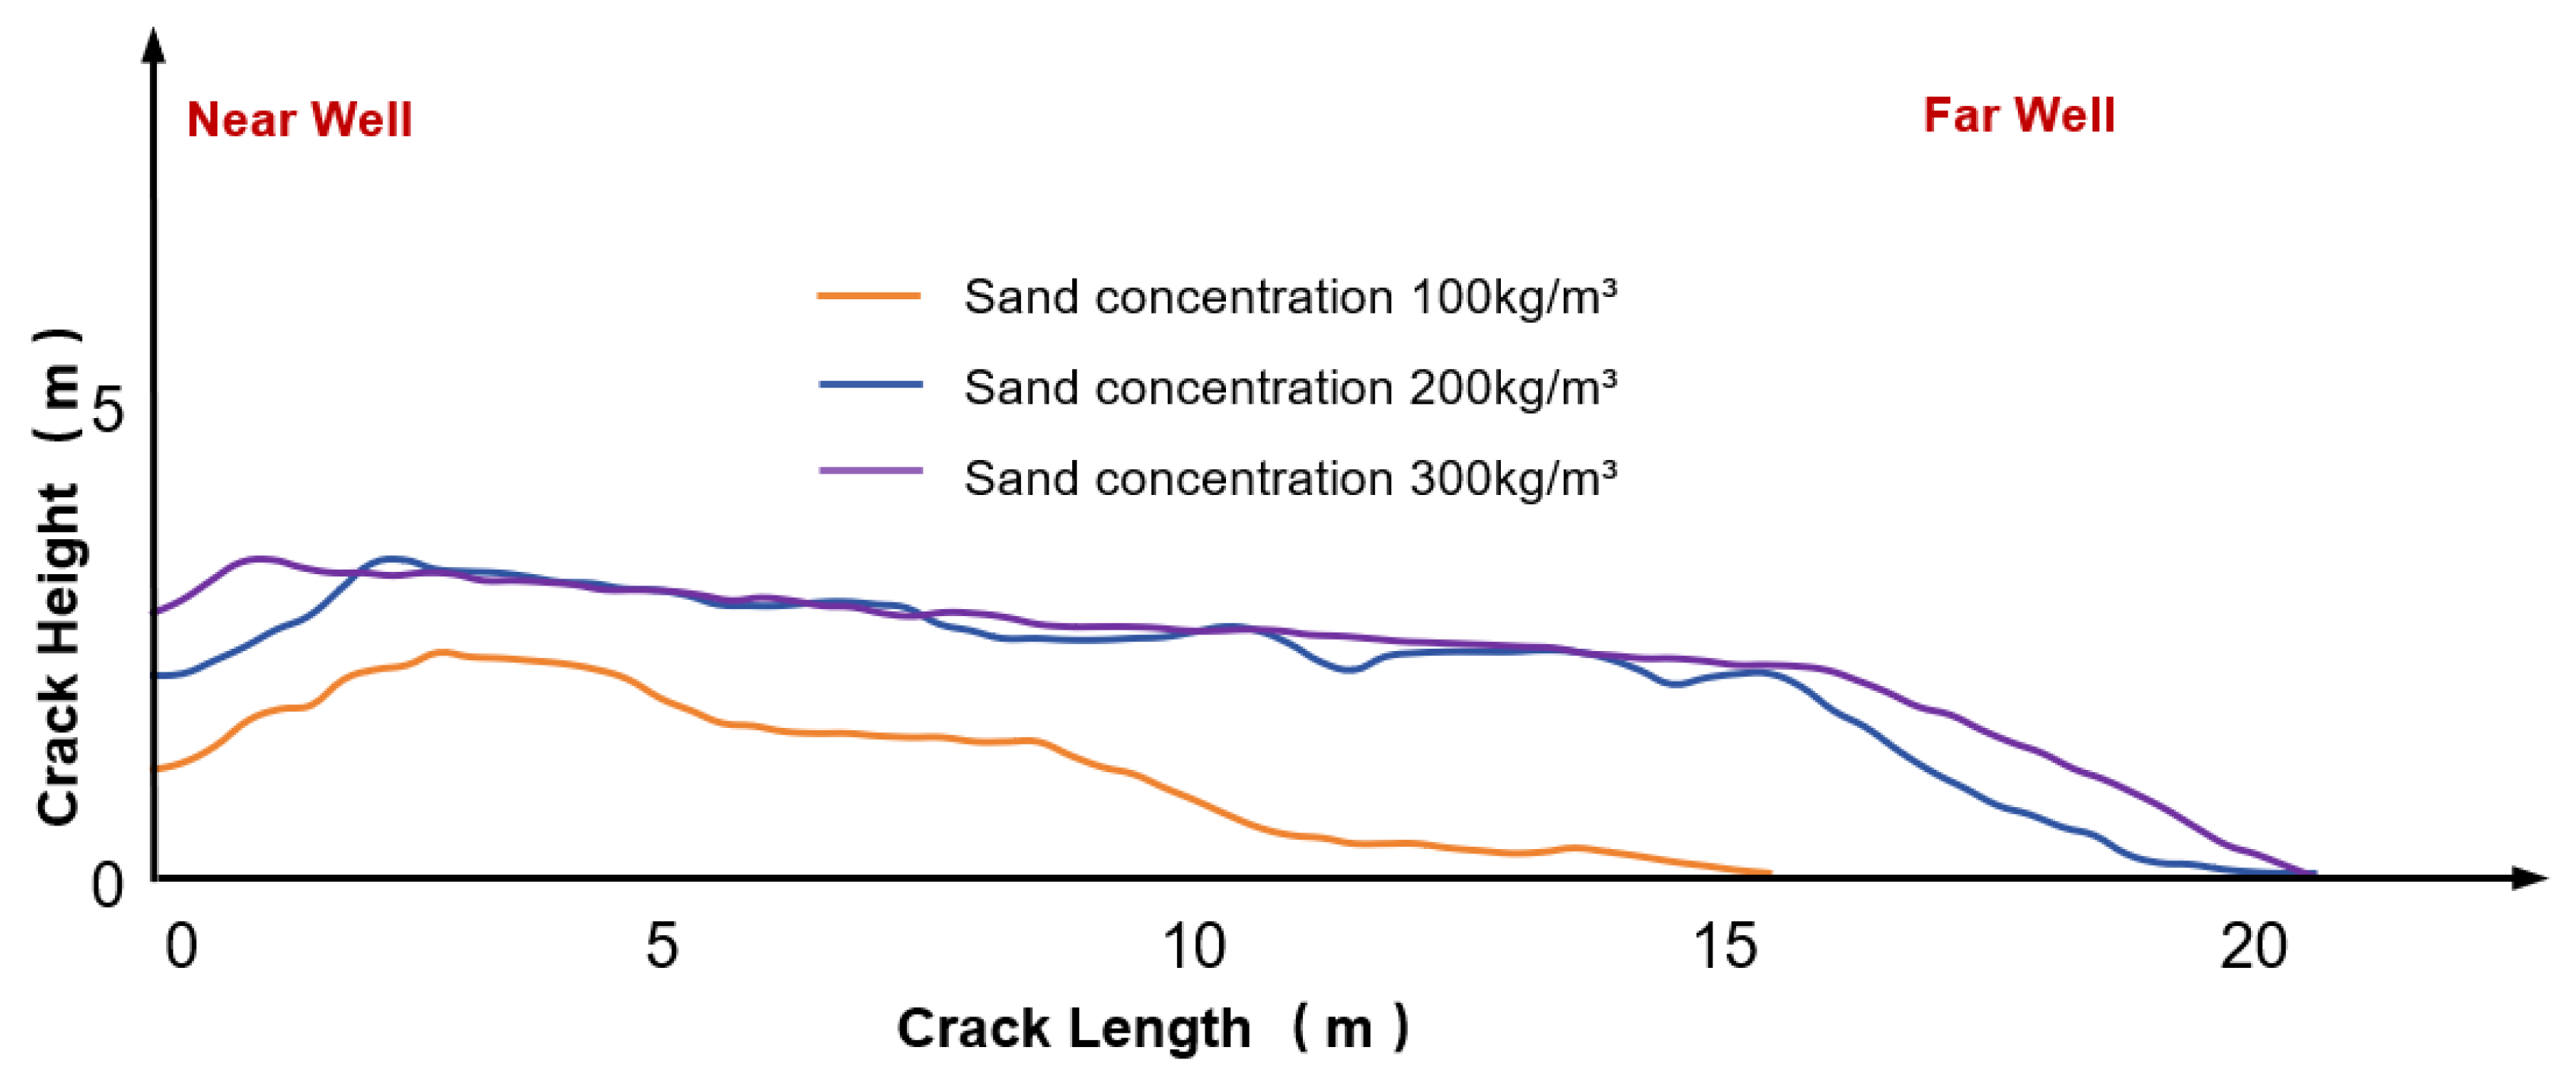
Figure 9 and
Table 5 demonstrate that under low viscosity and a pumping rate of 0.16 m
3/min, sand concentration exhibits a typical nonlinear pattern for proppant layer formation: “low concentration is insufficient, medium concentration is optimal, and high concentration is constrained.”
When the sand concentration is 100 kg/m3, the volume of sand per unit volume is insufficient, inter-particle interactions are weak, and stable particle clusters are difficult to form. This results in a sand dam length of only 14.5 m and an effective support area of just 25.5%. Sand accumulation concentrated near the wellhead and rapidly diminished, exhibiting an “insufficient sand supply—incomplete support” pattern, with virtually no effective deposition at the crack’s distal end. When sand concentration increased to 200 kg/m3, enhanced particle collisions and collective effects transformed the system into a dense-phase suspension flow. The sand ridge length extended to 20 m, and the effective support area rose to 55.5%. Particles sustain forward migration, with a smooth and continuous sand pile curve, indicating a shift in sand dam formation from localized deposition to “forward spreading.” This represents the optimal equilibrium sand concentration under the experimental conditions. When sand concentration further increases to 300 kg/m3, although the effective support area rises to 61.4%, a distinct “sand bridge” and blockage appear near the wellhead, restricting the fracture channel. Sand transport capacity at the distal end ceases to increase. Particle crowding significantly increased fluid equivalent viscosity and energy dissipation, reducing local flow velocity. The sand pile morphology exhibited protrusions and fluctuations, indicating the system entered a “high-concentration crowding” state with risks of sand blockage and sand return. According to the particle settling Equation (14), increasing sand concentration enhances particle collisions and collective transport effects, effectively suppressing rapid settling of individual particles. This delays settling and increases overall migration distance. However, excessively high concentrations significantly amplify particle friction and interlocking forces, reducing local flow velocity v and intensifying energy dissipation. This diminishes overall migration capacity, resulting in a nonlinear trend of initial increase followed by stabilization.
In summary, excessively low sand concentrations provide insufficient support, while excessively high concentrations readily cause local blockages. Moderate concentrations achieve the optimal balance between sand transport stability and deposition efficiency, forming the critical range for establishing a uniform, continuous support layer. Sand concentration should be synergistically optimized with fluid viscosity, flow rate, and particle size to balance energy distribution and particle deposition, thereby enhancing fracture support effectiveness and flow continuity.
3.4.5. Contributing Factors
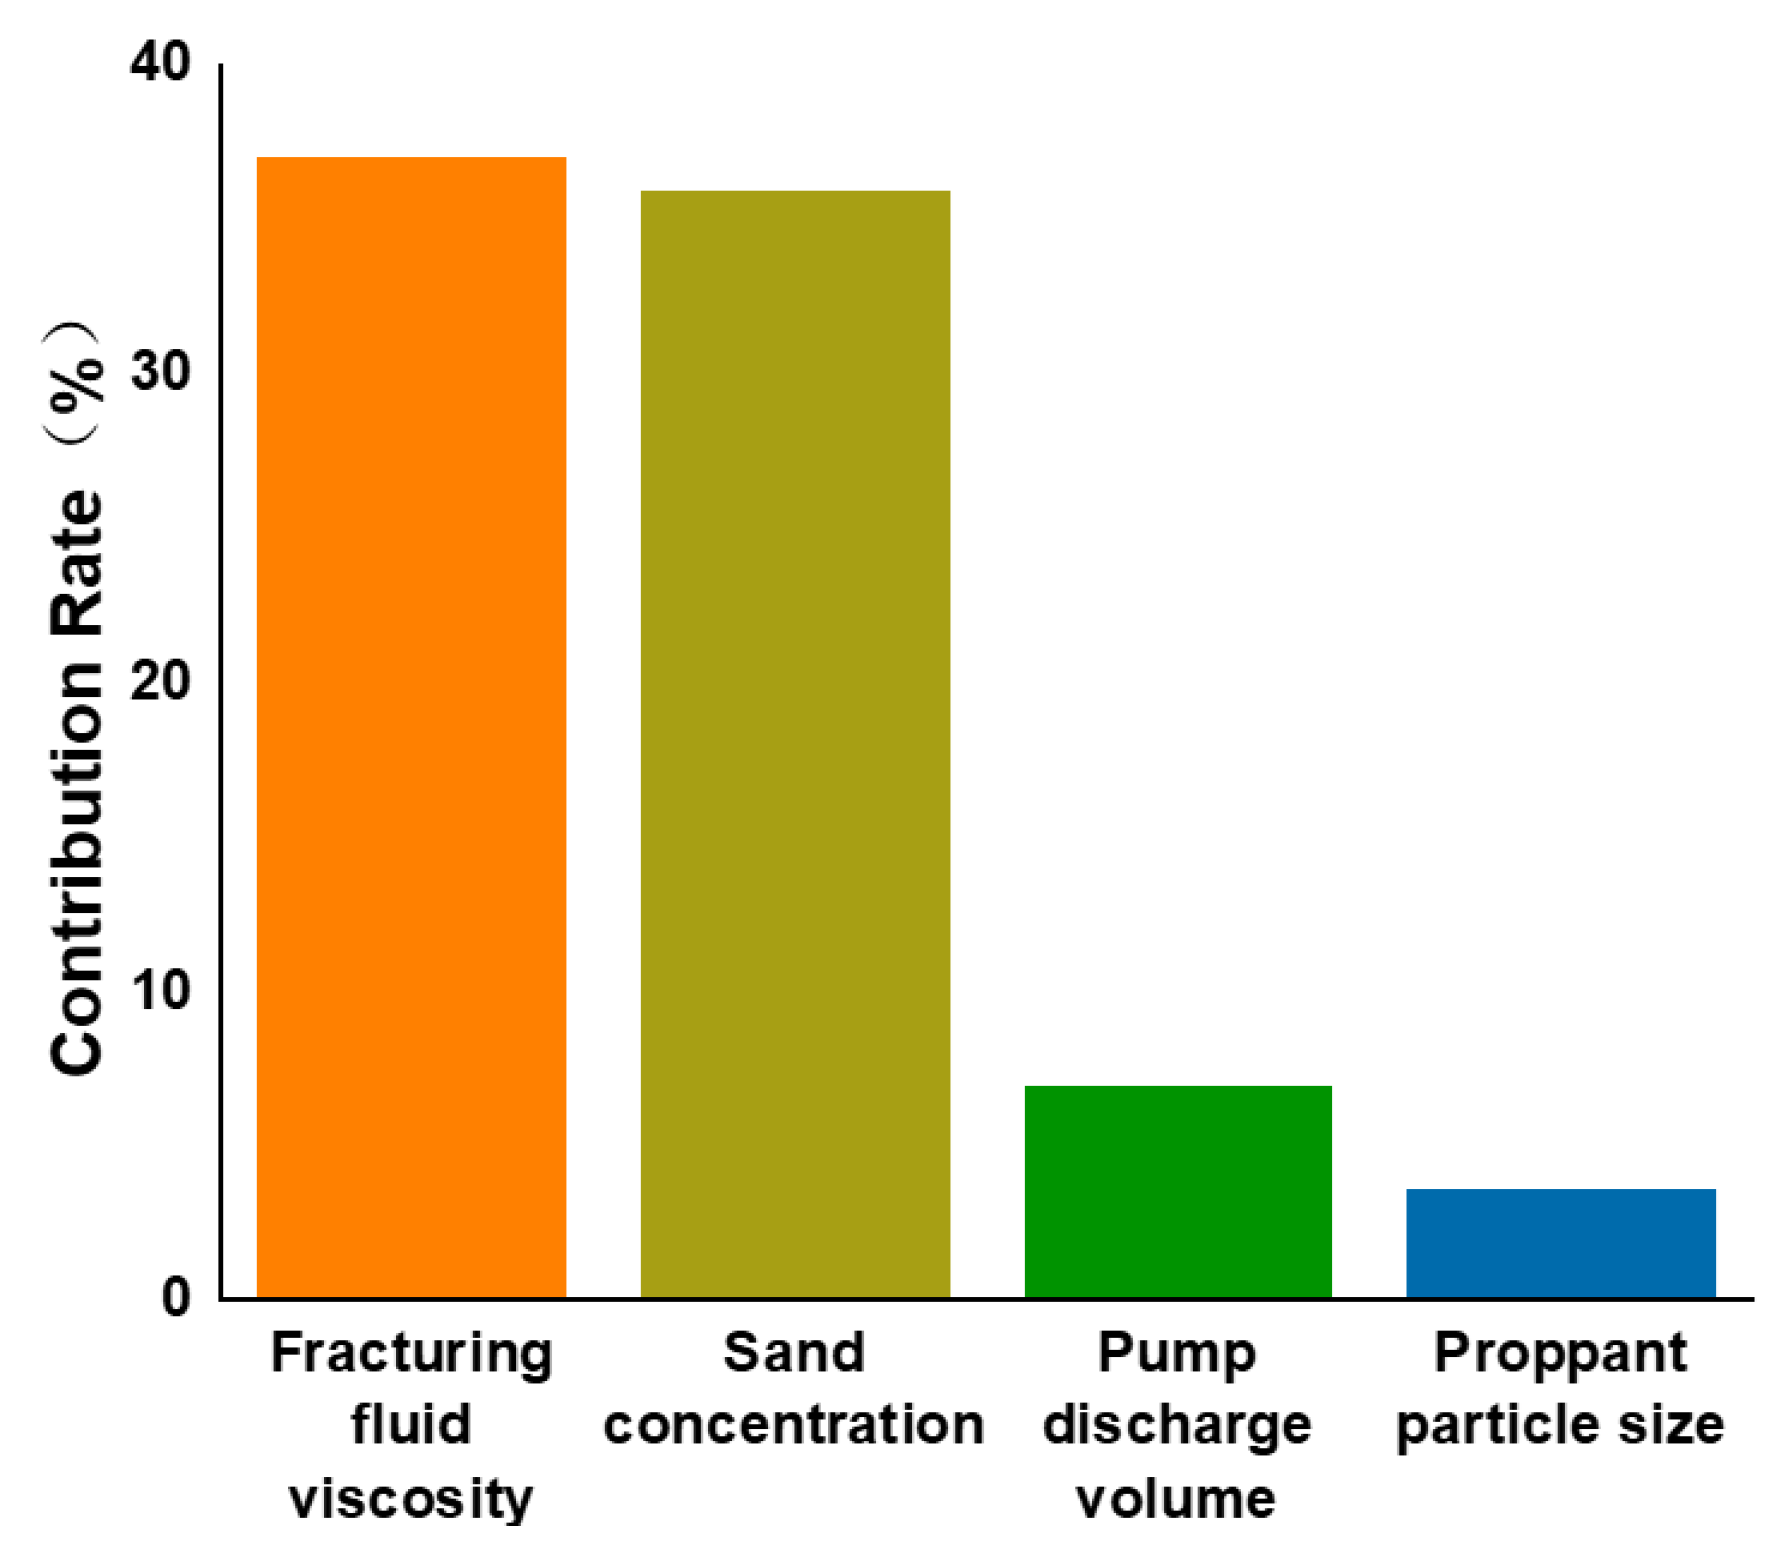
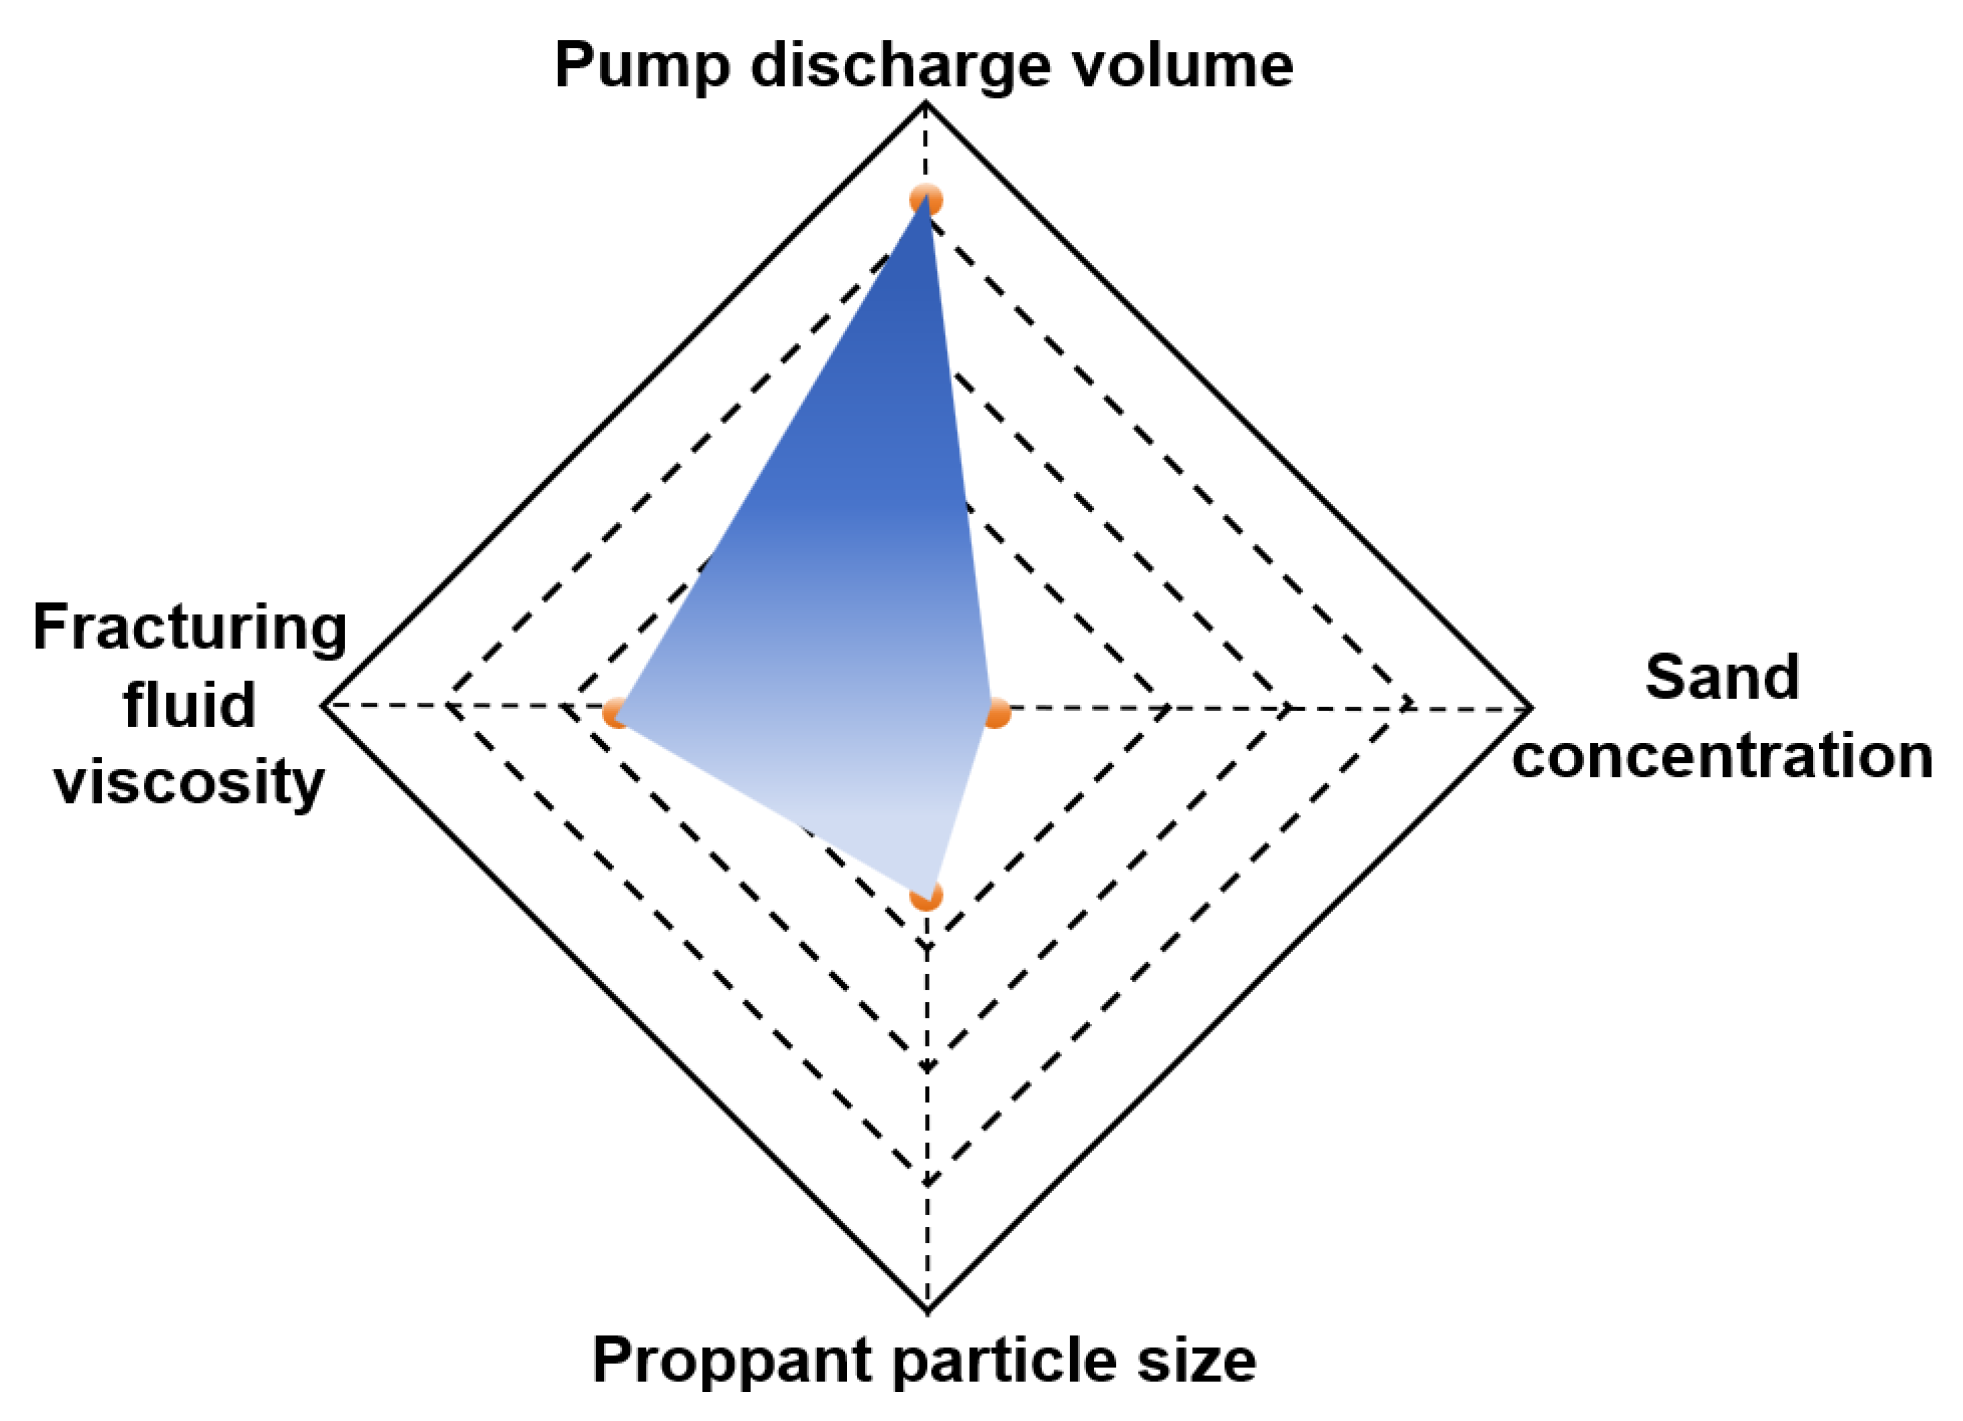
The contribution weights of different influencing factors were obtained through normalized sensitivity analysis based on experimental results. Specifically, the variation in effective propped area was analyzed with respect to each parameter while keeping other variables constant, and the relative contribution was quantified by comparing the normalized response amplitudes. The resulting weights therefore reflect the relative influence of viscosity, sand concentration, pumping rate, and particle size on proppant placement behavior rather than absolute statistical significance.
Using “effective support area” and “extendable support distance” as core metrics (
Figure 10 and
Figure 11), the experimental system quantitatively revealed the relative influence patterns of viscosity, sand concentration, pumping rate, and particle size within rough fractures. Results indicate that viscosity and sand concentration contribute most significantly to support area, accounting for 37.0% and 35.9%, respectively, while pumping rate (6.9%) and particle size (3.6%) exerted relatively weaker effects. This indicates that effective support formation is governed by a multi-factor coupling mechanism characterized by “viscosity-concentration dominance and pumping rate-particle size synergy,” fundamentally representing a dynamic equilibrium among viscous resistance, inertial sand transport, gravitational settling, and particle accumulation.
Viscosity is the most critical control variable. Increased viscosity enhances drag force and suspension stability, enabling proppants to achieve longer migration paths and more uniform deposition structures, significantly increasing effective support area. However, excessively high viscosity restricts flow and increases energy dissipation, reducing particle migration efficiency. Thus, viscosity has an optimal range. Sand concentration follows closely, playing a decisive role in the quality of propped layer filling. Medium-to-high sand concentrations enhance the synergistic migration of particle clusters, improving sand pile continuity. However, excessively high concentrations significantly increase inter-particle friction and bridging effects, potentially causing sand plugs near the wellbore that restrict distal placement. Conversely, too low a concentration results in insufficient sand supply, hindering the formation of a complete proppant layer. Pumping rate is most sensitive to “propped distance.” As pumping rate increases from 0.12 m3/min to 0.20 m3/min, sand pile length significantly extends and fracture coverage improves. However, further rate increases induce turbulence, backflow, and resuspension, destabilizing deposition and causing “rate saturation.” Although particle size has the weakest influence, it determines the microstructure and mechanical stability of the sand pile. Coarse sand exhibits high support strength but poor uniformity; fine sand provides extensive coverage but weak flow conductivity after compaction; medium-sized particles (40/70 mesh) achieve the optimal balance between load-bearing capacity, uniform placement, and migration stability.
Overall, effective support formation is a synergistic process of “energy input (flow rate + viscosity)—particle response (concentration + grain size)”. Viscosity and sand concentration govern the formation quality of the support layer, flow rate controls its extension range, and grain size modulates mechanical stability. Reasonable parameter matching enables the creation of thick, continuous, and long-reach efficient support structures, providing a clear direction for optimizing fracturing processes.
Under extreme parameter combinations, such as high viscosity with coarse particle size, proppant transport distance may be limited due to enhanced settling resistance and increased flow energy dissipation. Conversely, low-viscosity fluids with high sand concentration are prone to unstable transport and localized accumulation near the fracture entrance. These trends highlight the necessity of coordinated parameter optimization rather than single-parameter maximization in rough-wall fractures.




 ,
,