Article

True Triaxial Physical Simulation Experiment on the Fracture Propagation Law of Hydraulic Fracturing for Horizontal Wells in the Roof of Soft and Low-Permeability Coal Seams


1
School of Resources and Environmental Engineering, Suzhou University, Suzhou 234000, China
2
Key Laboratory of Coalbed Methane Development and Mining Area Environmental Remediation of Suzhou, School of Resources and Environmental Engineering, Suzhou University, Suzhou 234000, China
3
Jiangsu Bureau of Coal Geology, Nanjing 210046, China
4
State Key Laboratory of Petroleum Resources and Engineering, China University of Petroleum, Beijing 102249, China
5
Guizhou Engineering Research Institute of Oil & Gas Exploration and Development, Guiyang 550081, China
6
Key Laboratory of Unconventional Natural Gas Evaluation and Development in Complex Tectonic Areas, Ministry of Natural Resources, Guiyang 550081, China
*
Author to whom correspondence should be addressed.
Processes 2026, 14(19), 3198; https://doi.org/10.3390/pr14193198
Submission received: 26 August 2026 / Revised: 29 September 2026 / Accepted: 2 October 2026 / Published: 7 October 2026

Abstract

The key to exploiting coalbed methane in soft and low-permeability coal seams by deploying horizontal wells in roof strata lies in whether hydraulic fractures can propagate into the coal seam after initiating from the roof. True triaxial physical simulation experiments based on 15 artificially cast fracturing specimens were conducted to explore how in situ stress regimes, coal–roof interface strength, and roof mechanical properties control cross-layer propagation of hydraulic fractures. Results show that the strike-slip fault stress regime yields the highest cross-layer propagation success rate and the lowest average initiation pressure, followed by the normal fault stress regime, while the reverse fault stress regime significantly restricts vertical propagation of fractures. High-strength coal–roof interfaces can promote vertical fracture propagation and lower the fracture initiation pressure. High-strength roofs facilitate stable vertical fracture extension, while low-strength roofs containing microdefects lead to increased initiation pressure. The three geological factors exert hierarchical coupled control over the fracture propagation: in situ stress determines fracture propagation direction, coal–roof interfaces control fracture branching at stratigraphic interfaces, and roof mechanical properties regulate the complexity of induced fracture networks. To achieve high-quality reservoir stimulation, target zones with strike-slip or normal fault stress regimes, high-strength coal–roof interfaces, and matched roof types should be prioritized.

1. Introduction

Southern China was located in a marine-continental transitional environment during the Late Permian [1]. A set of coal-bearing strata dominated by the Permian Longtan Formation was deposited in eastern Yunnan-western Guizhou and southern Sichuan-northern Guizhou, constituting a coalbed-methane-enriched area in southern China [1,2,3]. Due to multiple tectonic activities, these coal seams have suffered severe primary structural damage, leading to the formation of soft and low-permeability coal seams characterized by chaotic stratification, fragmented texture, and poor permeability [3,4,5]. These soft and low-permeability coal seams severely impede the safe production of coal and the efficient utilization of coalbed methane resources [6,7,8]. Horizontal well hydraulic fracturing technology, as an effective approach for developing low-permeability oil and gas reservoirs, has demonstrated remarkable production enhancement in the development of unconventional natural gas with low porosity and permeability [9,10,11,12]. Applying this technology to soft and low-permeability coal seams will promote the efficient extraction of coalbed methane and help alleviate China’s oil and gas supply shortages [13]. The roof of coal seams is typically composed of limestone, mudstone, or sandstone, providing relatively favorable drilling conditions and high hole formation rates [14,15]. However, the successful application of multi-stage fracturing for coal-seam-roof horizontal wells depends on fractures initiating at the roof and propagating downward to achieve sufficient communication with the coal seam.
Scholars have carried out extensive research on the staged fracturing technology for horizontal wells in soft and low-permeability coal seams, with a particular emphasis on the cross-layer propagation patterns of hydraulic fractures at coal–roof interfaces [16,17,18,19,20,21,22,23,24,25,26,27,28,29,30,31,32,33]. Wu et al. [16] revealed the influences of reservoir mechanical properties, fracturing parameters, and fracturing mode on the hydraulic fracture propagation of a horizontal well in the roof of coal seams. Lu et al. [20] analyzed the effects of interfacial properties and fracturing parameters on hydraulic fracture propagation by using a coupled finite element model of fluid flow, stress, and damage. Wu [25] constructed a three-layer formation model for triaxial hydraulic fracturing physical simulations and analyzed the influence of the distance from the horizontal well to the roof and the pumping rates on vertical fracture propagation. Li et al. [26] applied large-size triaxial testing systems to investigate the effects of in situ stress, natural cracks, and elastic modulus on the expansion of hydraulic fractures. Li et al. [27] used physical simulation experiments and extended finite element numerical simulation to investigate the effects of fracture initiation location, vertical stress, and construction displacement on hydraulic fracture propagation. Hao et al. [28] simulated the fracture extension length, fracture width, and flow conductivity of various combinations of coal and surrounding rock types under different hydraulic fracturing parameters to optimize the hydraulic fracturing pump injection parameters. Tan et al. [30], Jiang et al. [31], Wan et al. [32], and Fu et al. [33] also conducted triaxial fracturing experiments to investigate the influences of in situ stress, interfacial mechanical properties, and natural fractures on hydraulic fracture propagation. However, the existing research is still restricted in terms of sample quantity and mainly focuses on individual factors, lacking systematic analysis of the in situ stress regimes, coal–roof interface strength, and roof mechanical properties. Moreover, comparative studies on fracture initiation and propagation behaviors under different in situ stress regimes are still insufficient.
To address the aforementioned issues, true triaxial hydraulic fracturing physical simulation experiments were conducted to explore the initiation and cross-layer propagation patterns of hydraulic fractures in the roof of coal seams in this study. Through the fabrication of 18 artificial boreholes and cast specimens, the research simulates the fracture evolution processes under various geological and engineering conditions. This study systematically analyzes the effects of in situ stress regimes, coal–roof interface strength, and roof mechanical properties on fracture initiation pressure, cross-layer propagation characteristics of hydraulic fractures and the final fracture assemblage types. The research results can provide theoretical foundations and practical references for optimizing the layer placement of staged fracturing horizontal wells in soft low-permeability coal seams, as well as for advancing the understanding of coal seam fracturing mechanisms.

2. Materials and Methods

2.1. Physical Simulation Model Construction

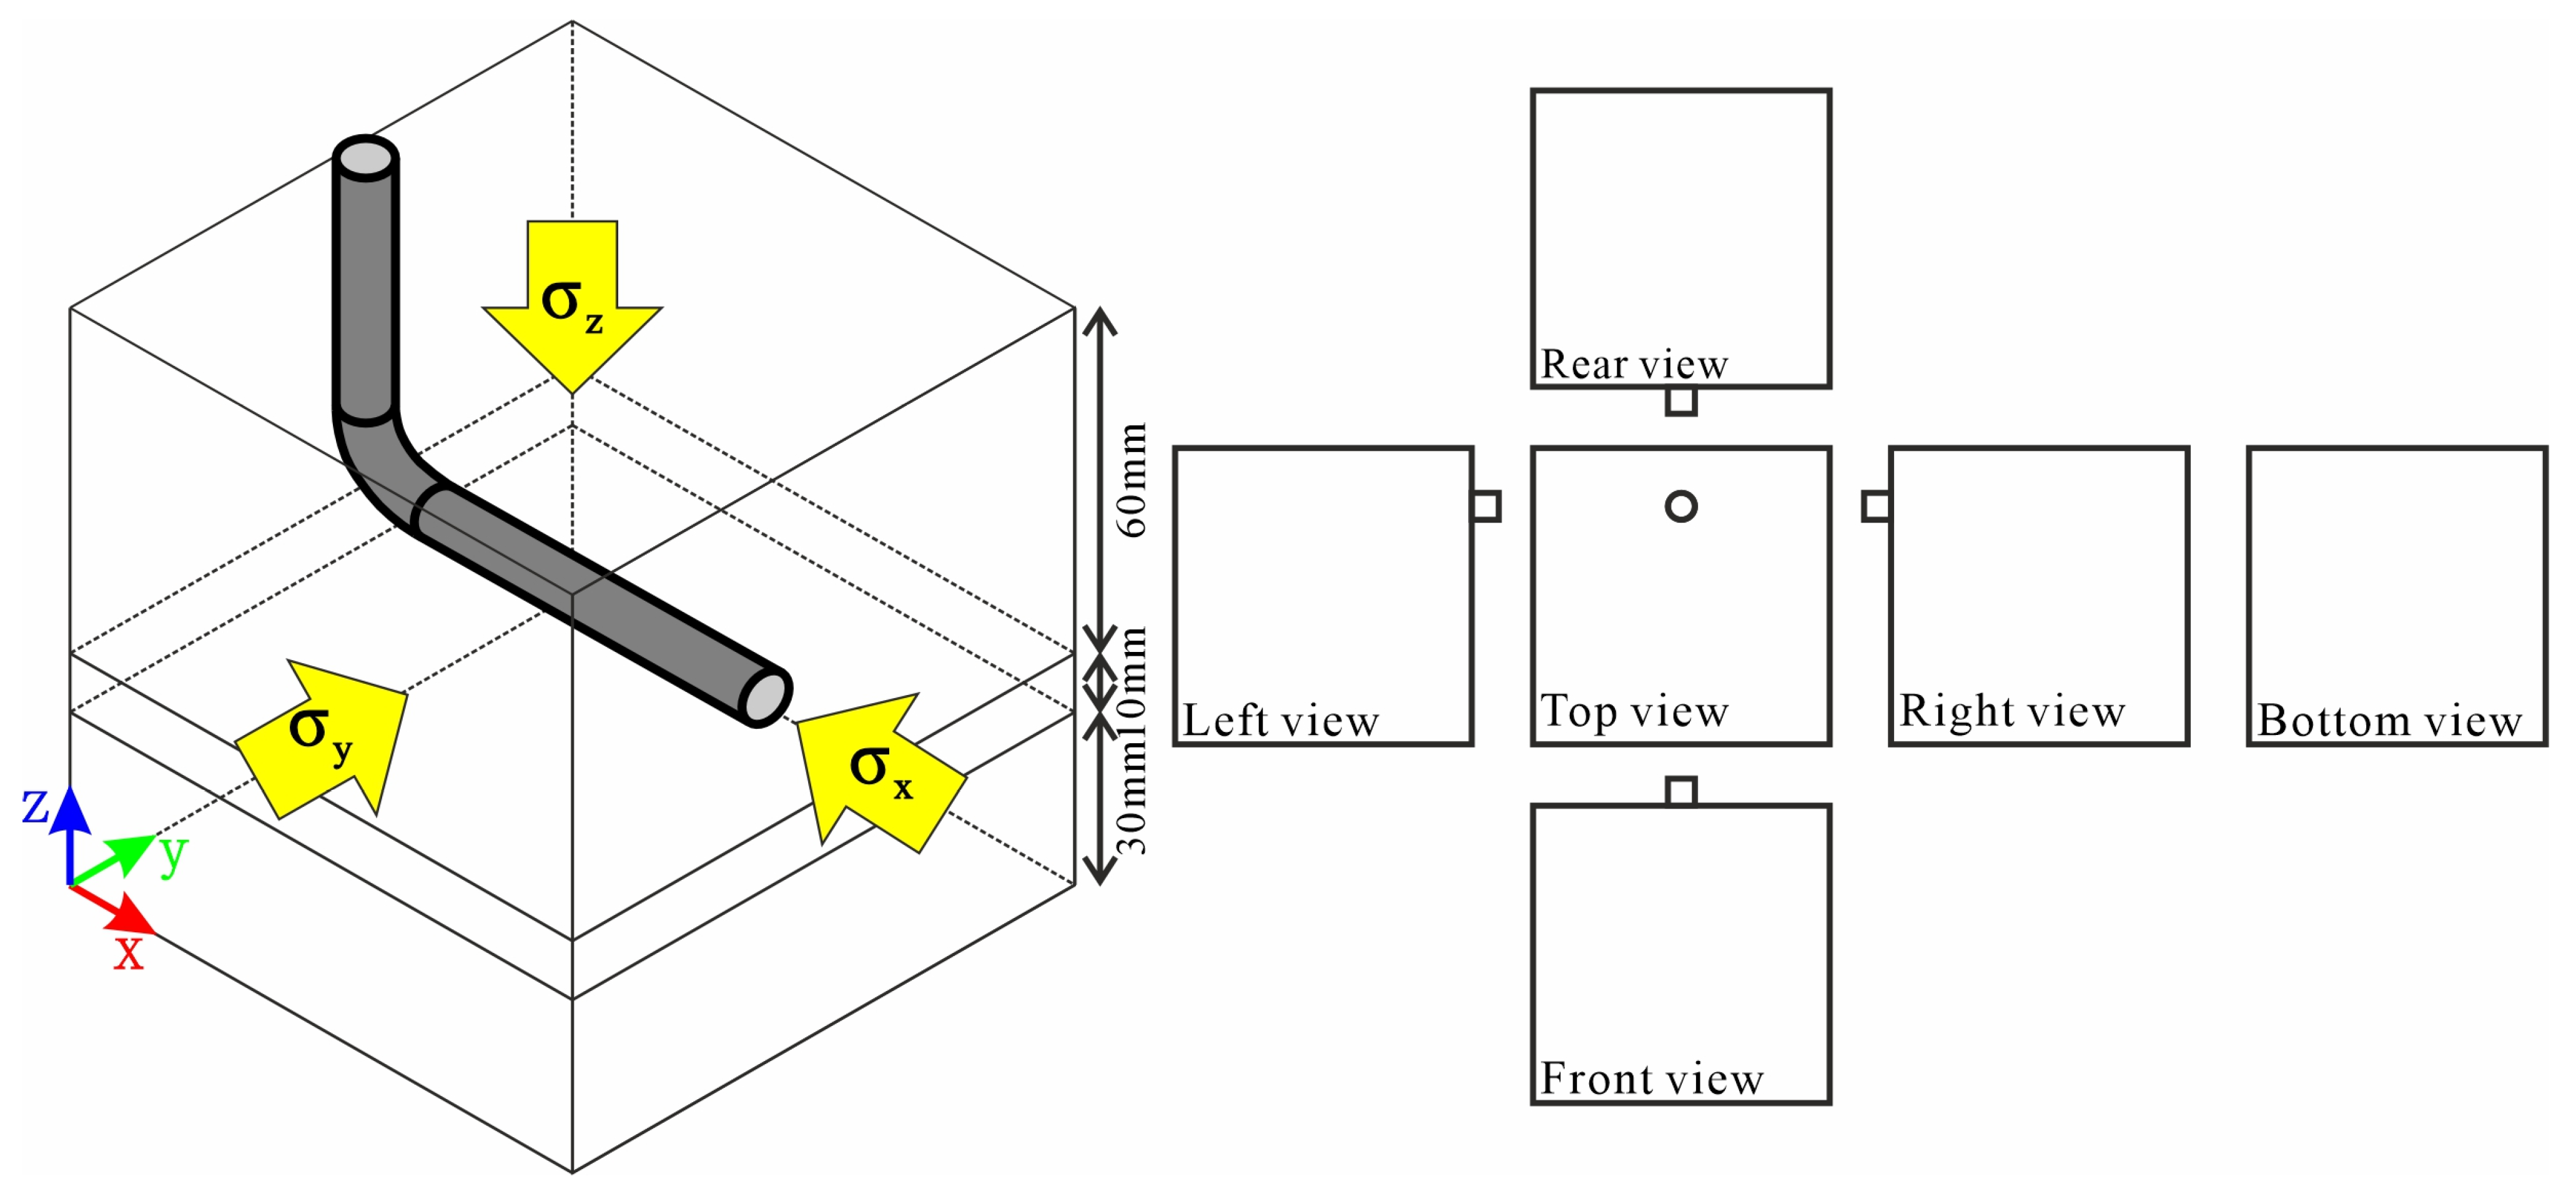
The geological environment surrounding coal seams is characterized by a high level of complexity and diversity. To facilitate research, the specimens for the fracturing experiment were configured as an integrated three-layer stratigraphic model. This model consists of the roof, the coal–roof interface, and the coal seam in a top-to-bottom sequence. L-shaped wellbores were arranged within the coal seam roof, as depicted in Figure 1. The dimensions of the model were 10 cm × 10 cm × 10 cm (Table 1). The thicknesses of the coal seam roof, the coal–roof interface, and the coal seam were 60 mm, 10 mm, and 30 mm, respectively (Table 1). The designed wellhead position was situated directly above the left side of the rock sample. The wellbore had a diameter of 8 mm (Table 1). The horizontal wellbore was 10 mm away from the coal–roof interface (Figure 1). The casing perforation method employed single-row downward perforation, with 20 perforations per meter, a perforation diameter of 1.5 mm, and a perforation length of 7 mm (Table 1).

2.2. Preparation and Casting of Fracturing Specimens

To ensure that the fracturing specimens can accurately characterize the mechanical response of actual coal–roof combinations during fracturing, the material properties of the specimens must satisfy the similarity criterion with the in situ coal–rock system. However, restricted by the complex structure and strong heterogeneity of natural coal reservoirs, it is technically unfeasible to fully replicate all mechanical parameters of the original stratum system. Accordingly, in the material design of this study, priority is given to the key mechanical characteristics that govern fracture initiation and propagation, and the simulation of mechanical properties corresponding to different coal seam roof conditions, coal–roof interfaces, and coal seams is realized by adjusting the proportion of material components.
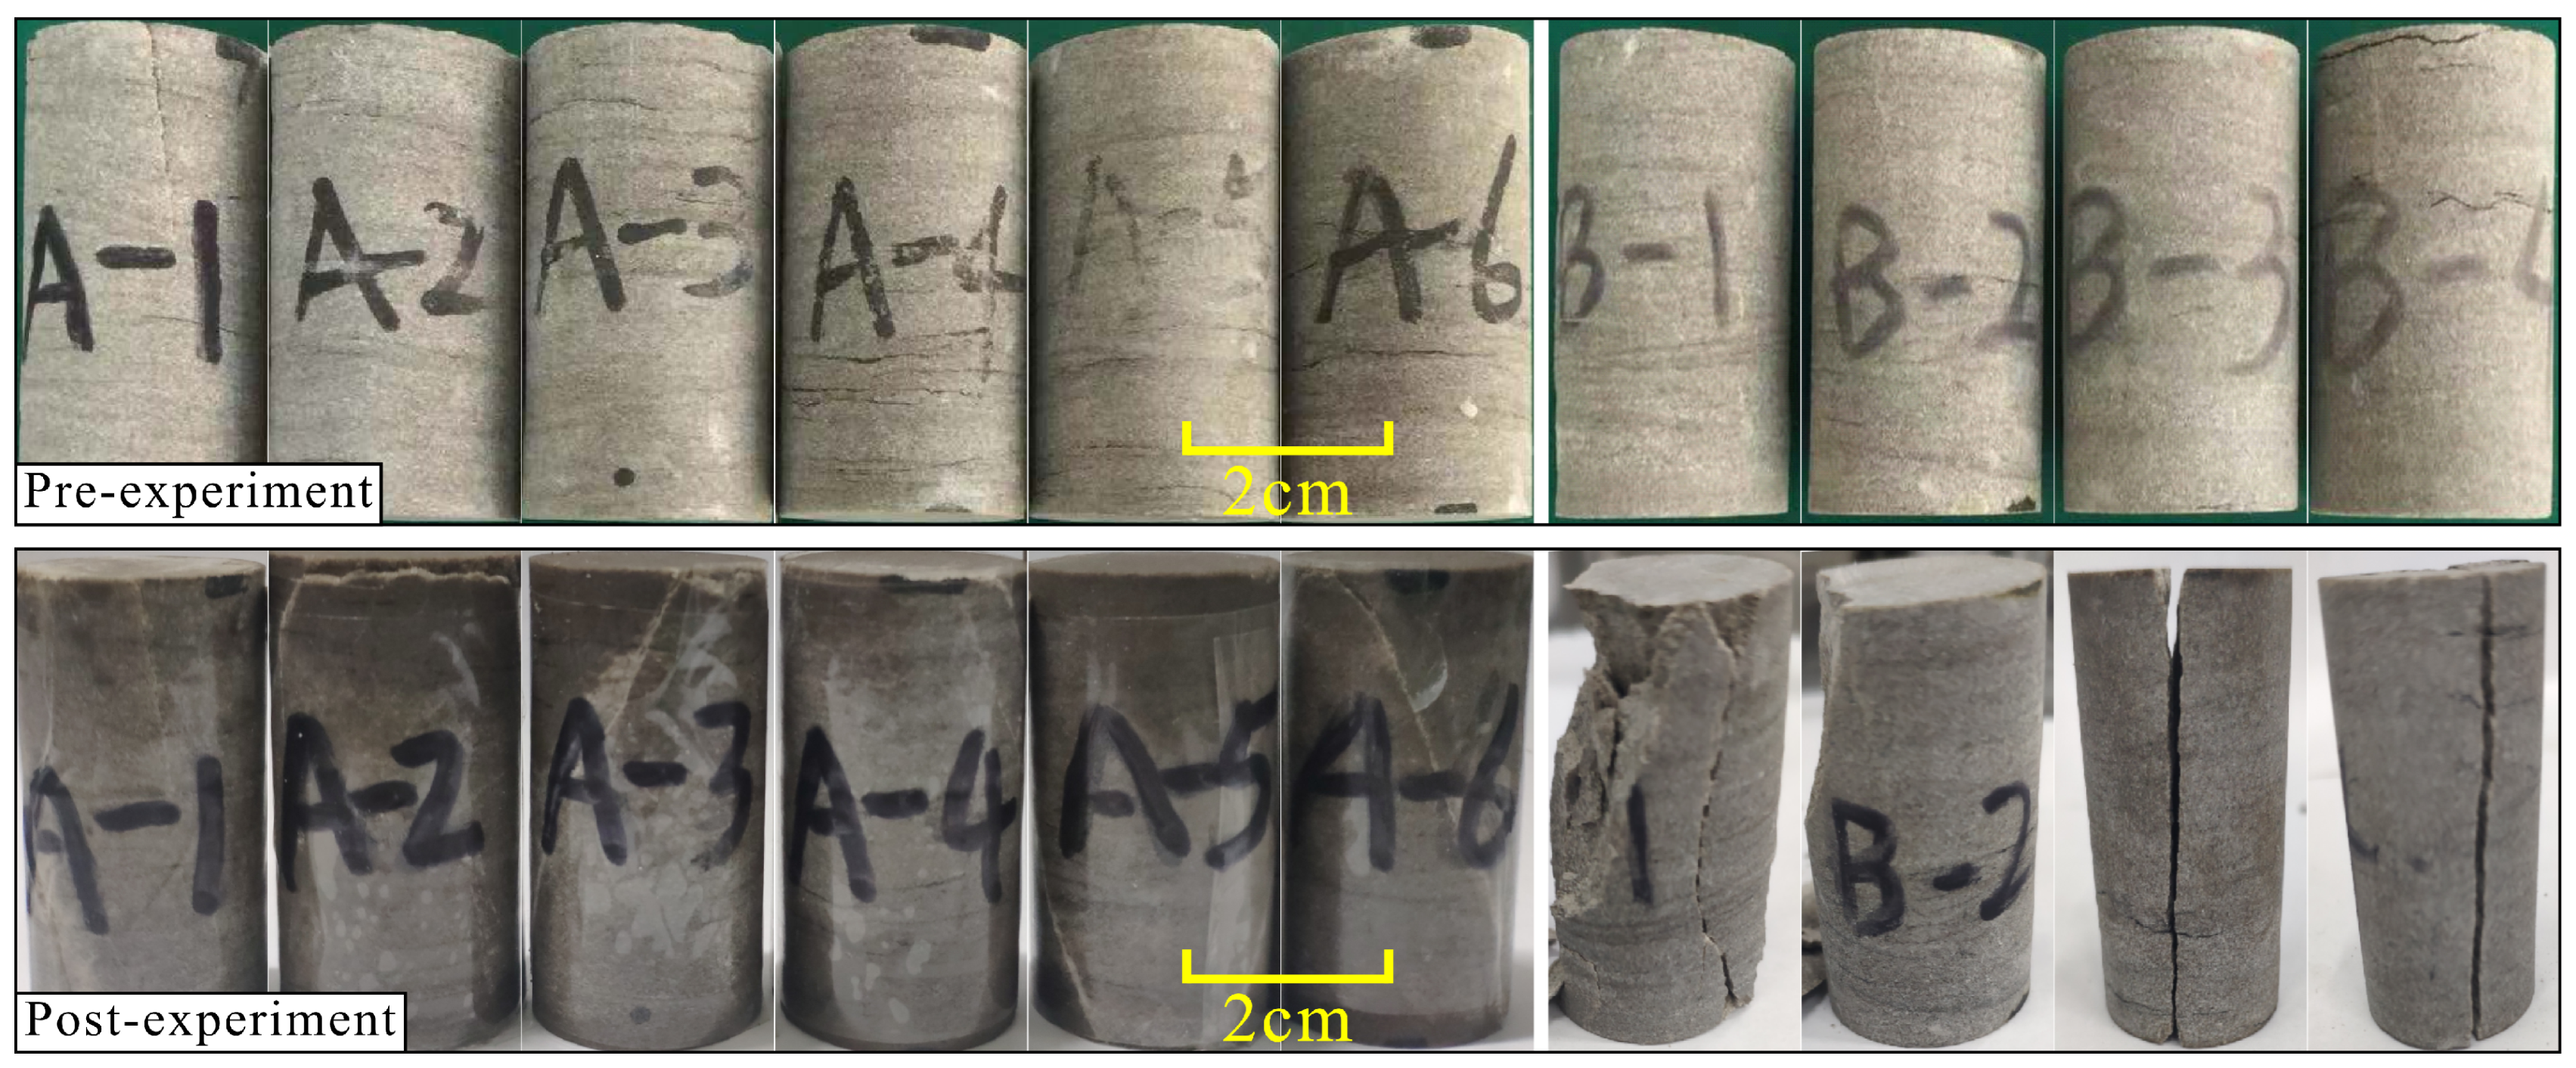
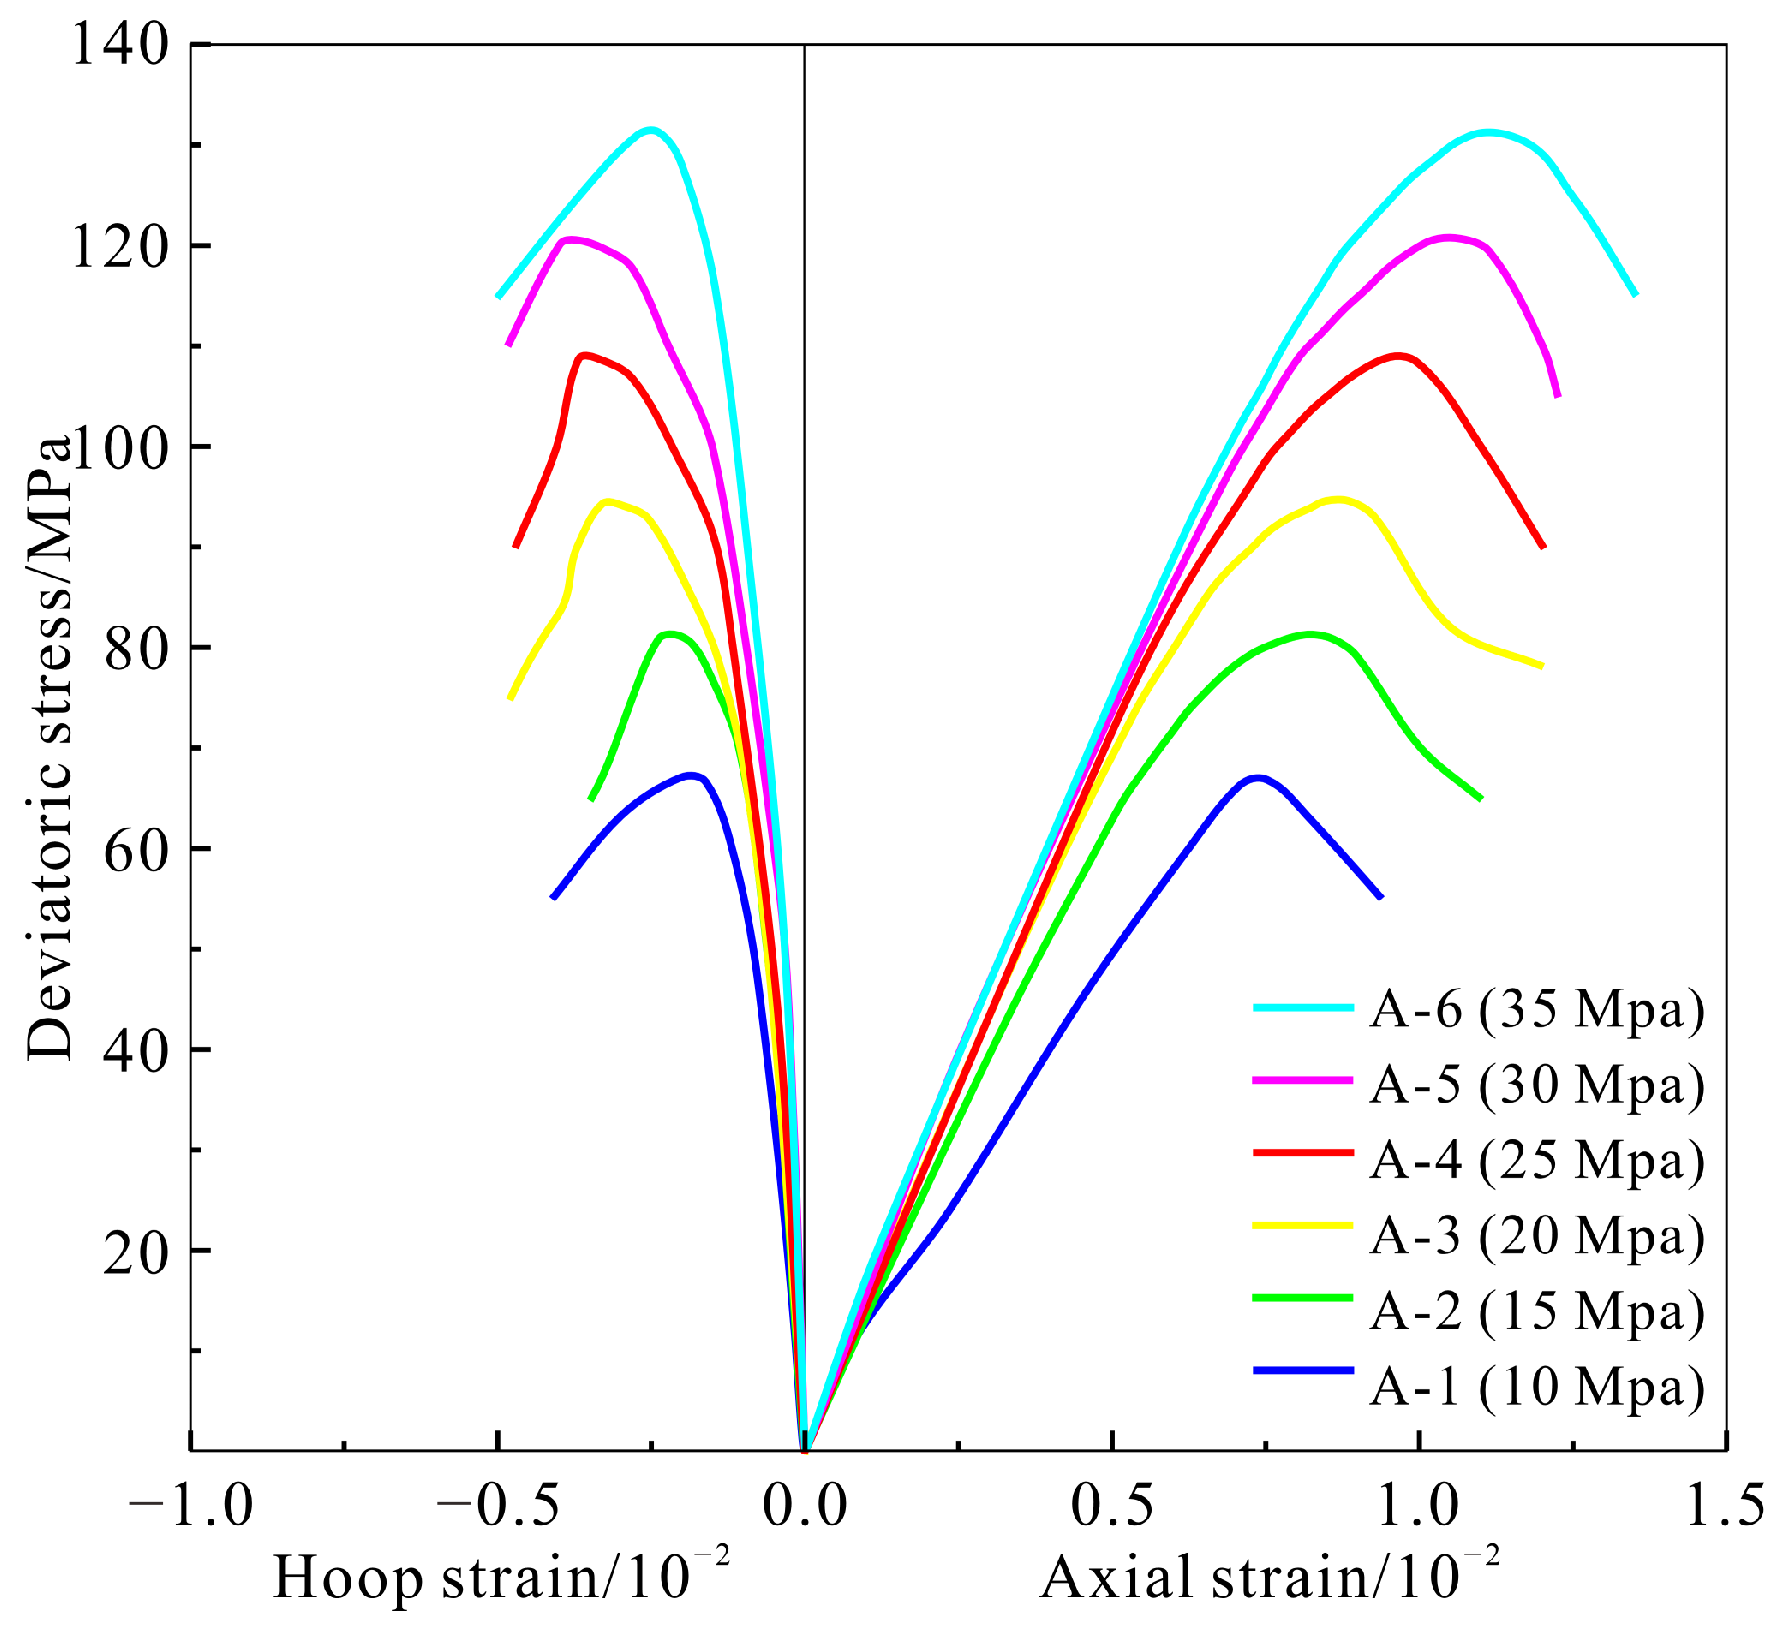
Sandstone samples were collected from the roof of No. 82 coal seam in Qidong Coal Mine, northern Anhui Province, in this paper, and then were processed into ten cylindrical specimens with dimensions of 25 mm × 50 mm. Rock mechanical tests, including triaxial compression, uniaxial compression and Brazilian splitting tests, were carried out to determine the rock mechanical parameters of the cylindrical specimens. The photographs of pre-experiment and post-experiment sandstone samples are shown in Figure 2. The test results of rock mechanical parameters are shown in Figure 3 and Table 2, Table 3 and Table 4.
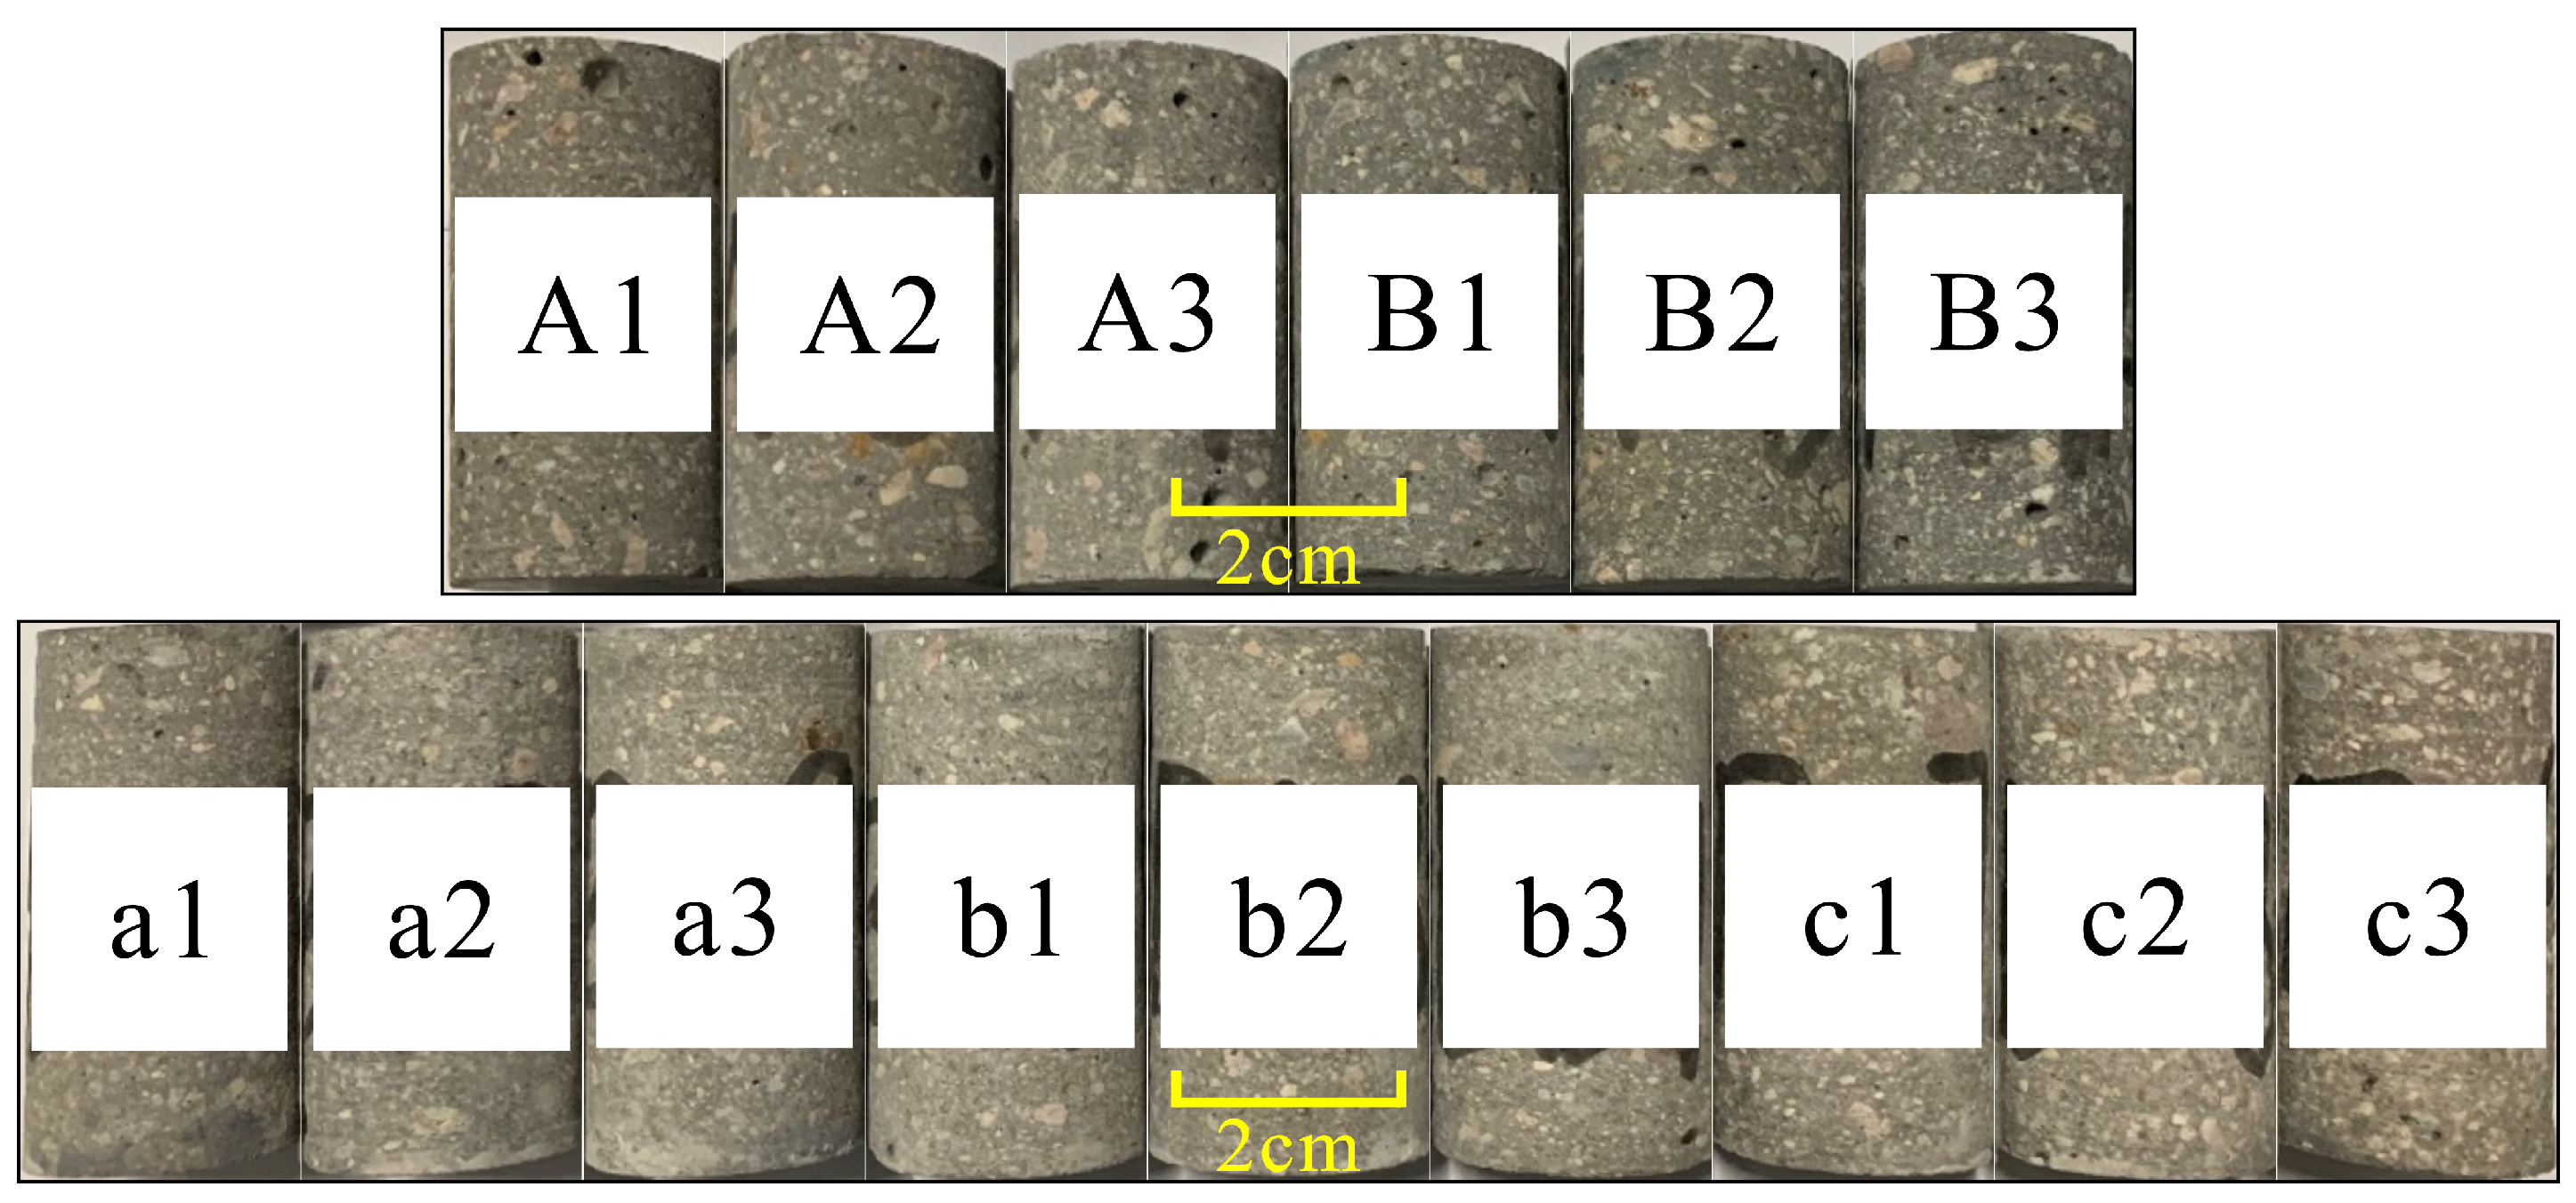
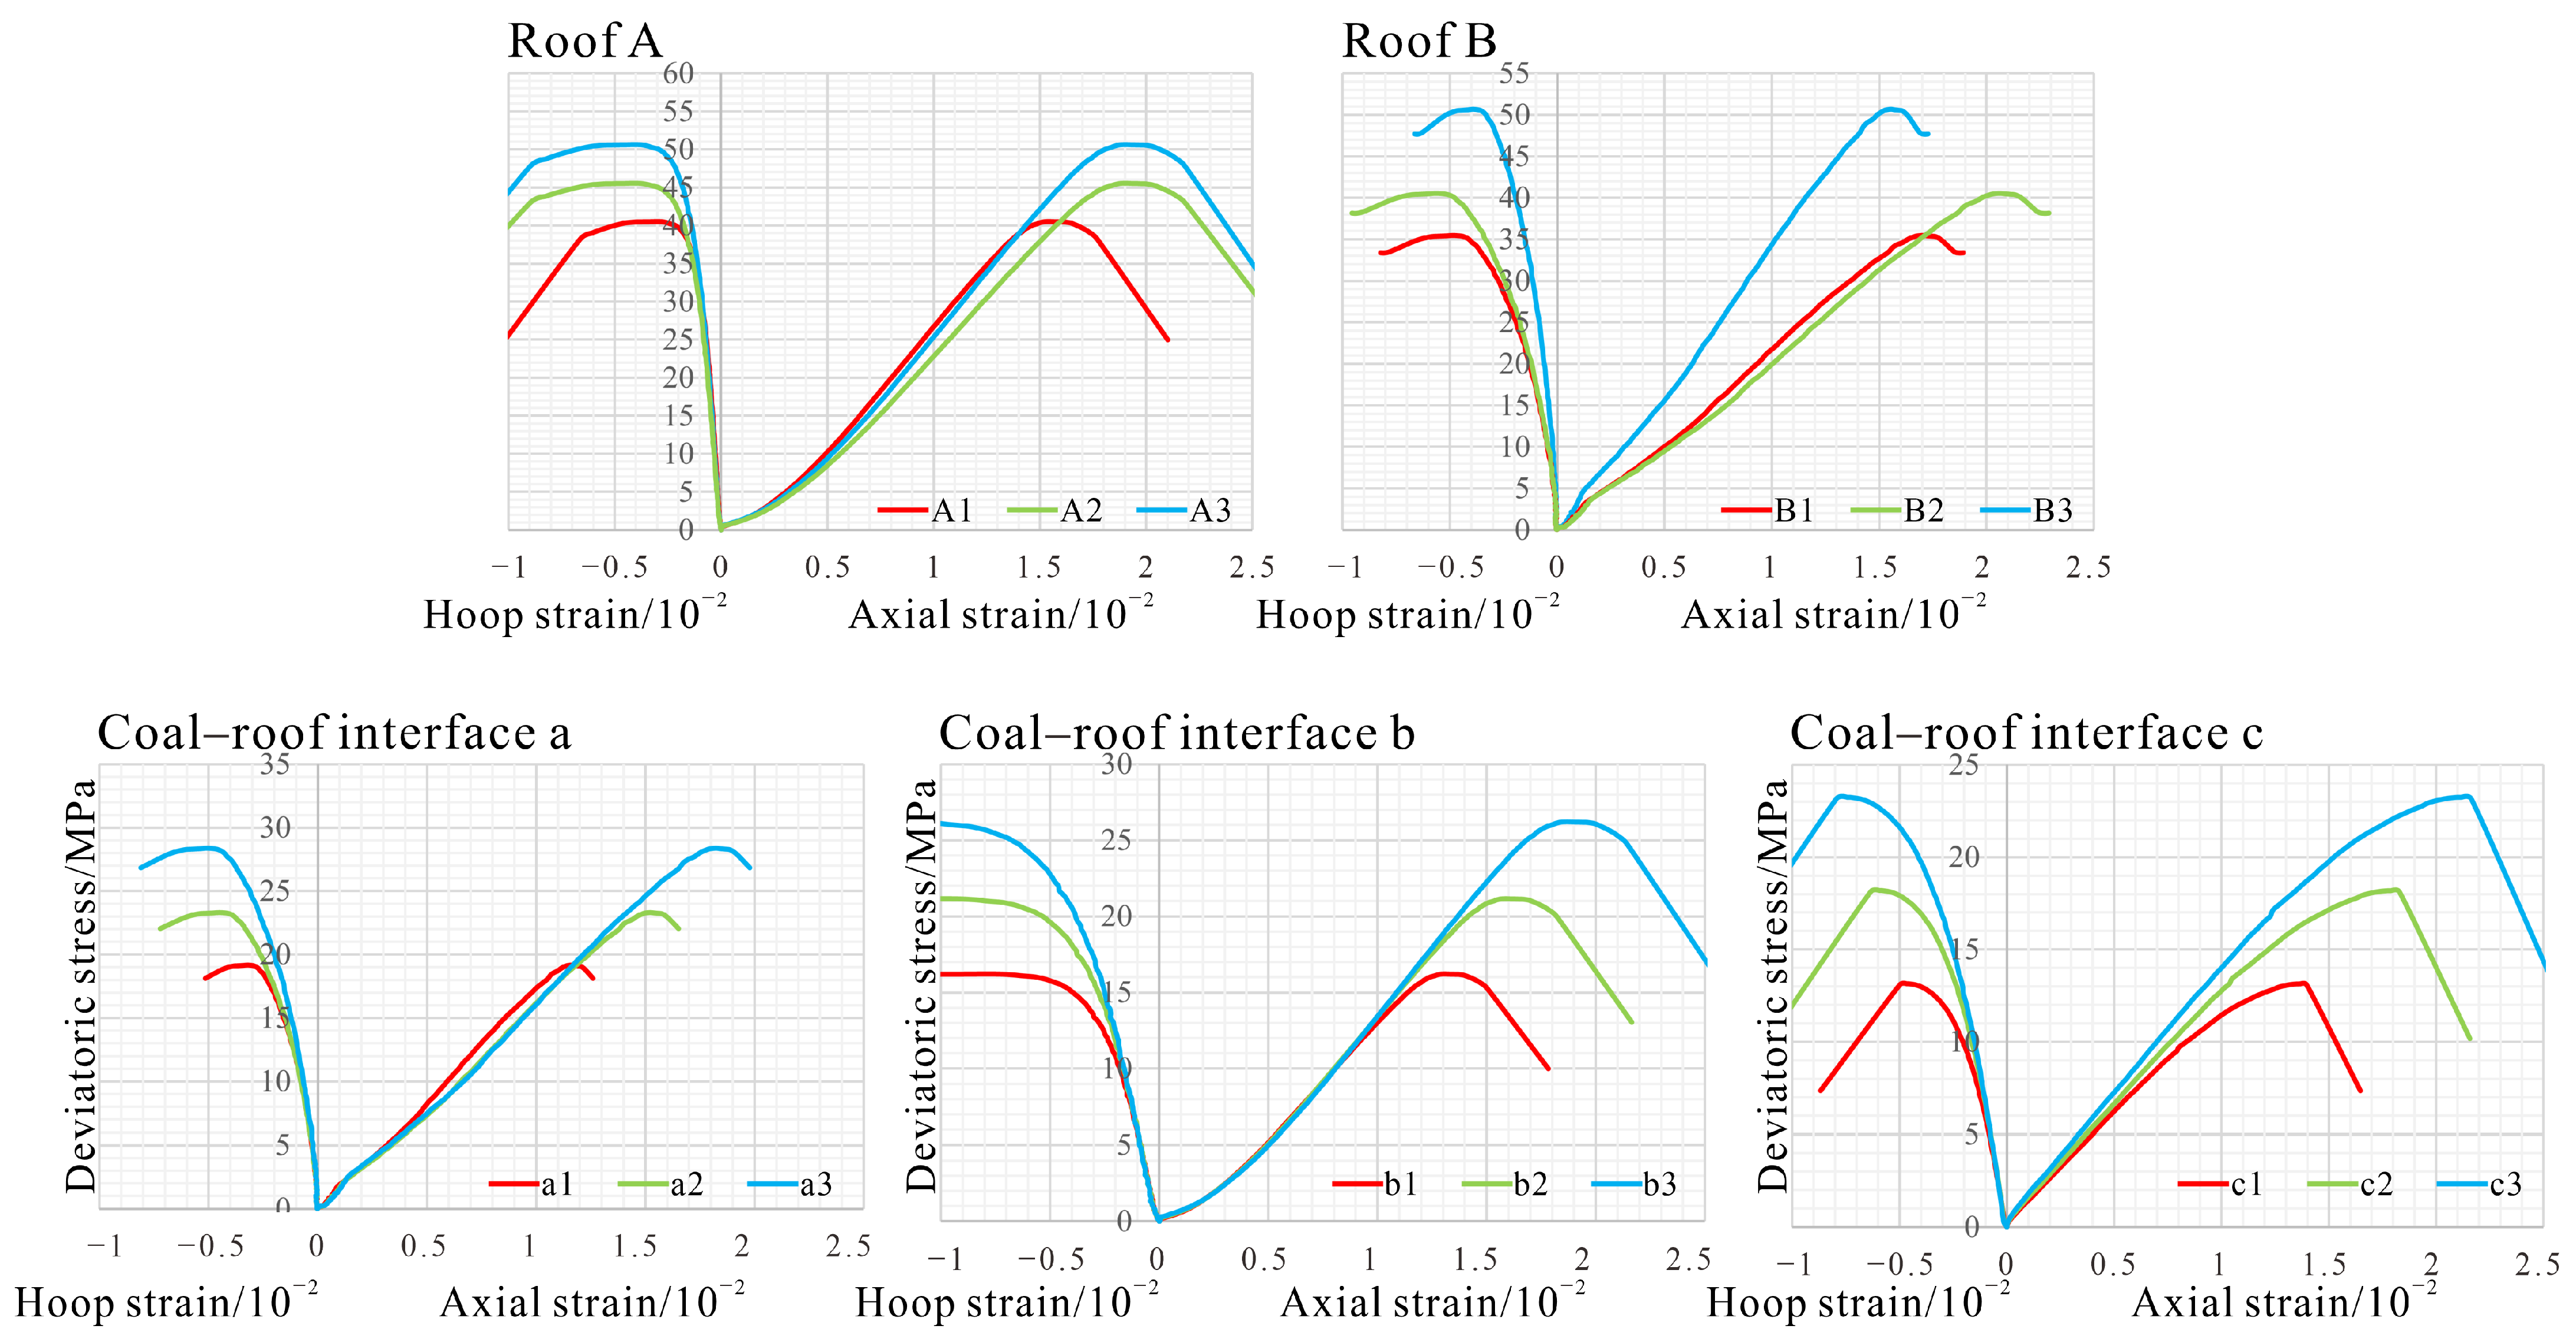
The material mixtures for the artificially cast fracturing specimens are presented in detail in Table 5. The coal seam roof utilized two mixtures (A and B) to simulate different mechanical properties, and the coal–roof interface employed three mixtures (a, b, and c) to reproduce diverse cementation strengths. These formulations were determined through triaxial compression tests to quantitatively characterize the key mechanical parameters (elastic modulus, Poisson’s ratio, cohesion, and internal friction angle) of coal seam roof and coal–roof interface materials. The specimen photographs, triaxial compression curves, and corresponding experimental results are presented in Figure 4 and Figure 5 and Table 6. Specifically, Type A roof corresponds to the high-strength roof, while Type B corresponds to the low-strength roof. Regarding the coal–roof interface, Type a corresponds to the high-strength interface, Type b corresponds to the medium-strength interface, and Type c corresponds to the low-strength interface. To eliminate the interference of coal mechanical properties on experimental results, the standard mixture for the coal seam was kept constant across all specimens.
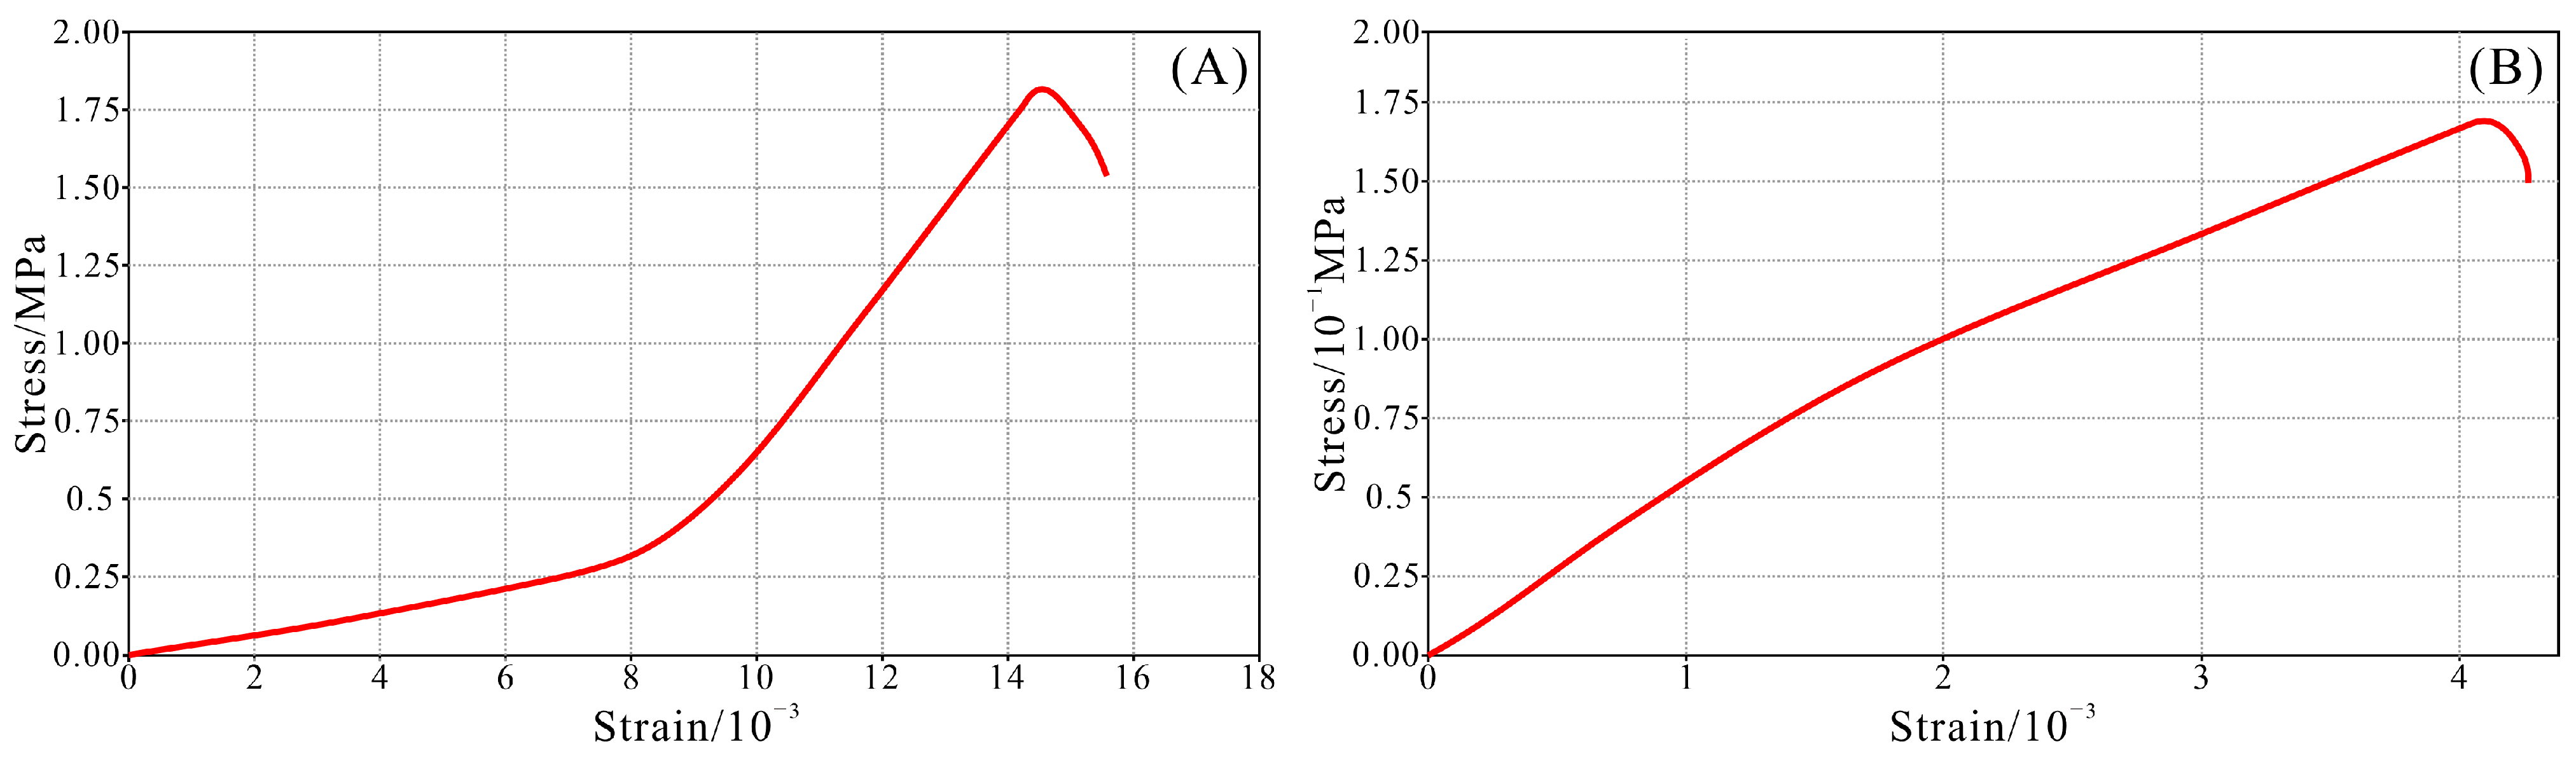
The coal seam itself adopted a standardized mixture (Table 5). Uniaxial compression and Brazilian splitting tests were carried out to determine the rock mechanical parameters of the coal seam materials. The stress–strain curves are presented in Figure 6. The compressive strength of the specimen with the coal seam material proportion is ~1.8 MPa, and its tensile strength is ~0.17 MPa (Figure 6).
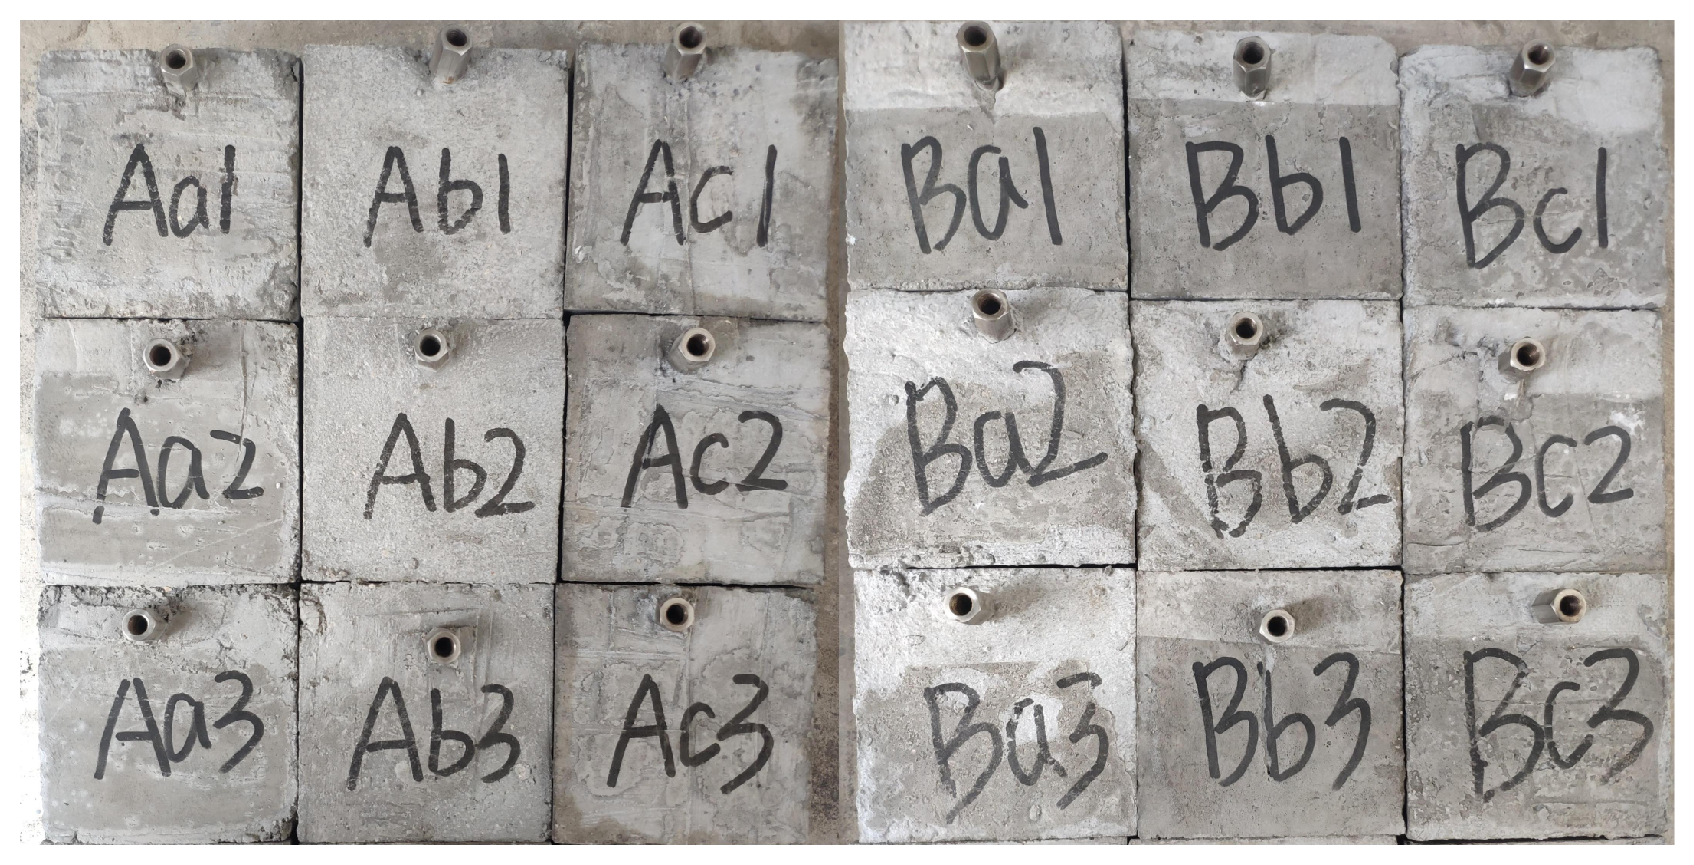
In the specimen preparation process, raw materials including cement, sand, gypsum, and water were initially weighed according to the specified proportions. After being thoroughly mixed, the mixture was poured into a 10 cm × 10 cm × 10 cm mold in layers to successively form the coal seam roof, coal–roof interface, and coal seam structure. During the pouring process, great care was taken to ensure close contact between layers to avoid delamination. An L-shaped borehole with a diameter of 8 mm was pre-embedded at the center of the specimen (Figure 7), and the perforation parameters were configured as specified in Table 1.
After specimen casting, the samples were placed in a constant temperature and humidity curing chamber for a duration of 28 days to ensure adequate development of material strength. Following the completion of the curing process, visual inspections and dimensional verifications were carried out, and specimens with obvious defects were discarded. This process ultimately yielded 18 test specimens that met the experimental requirements. Through these procedures, a three-dimensional physical model was established to characterize a three-layer structural model consisting of the coal seam roof, the coal–roof interface, and the coal seam, which provides essential support for the subsequent true triaxial hydraulic fracturing physical simulation experiments.

2.3. Experimental Apparatus and Test Procedure

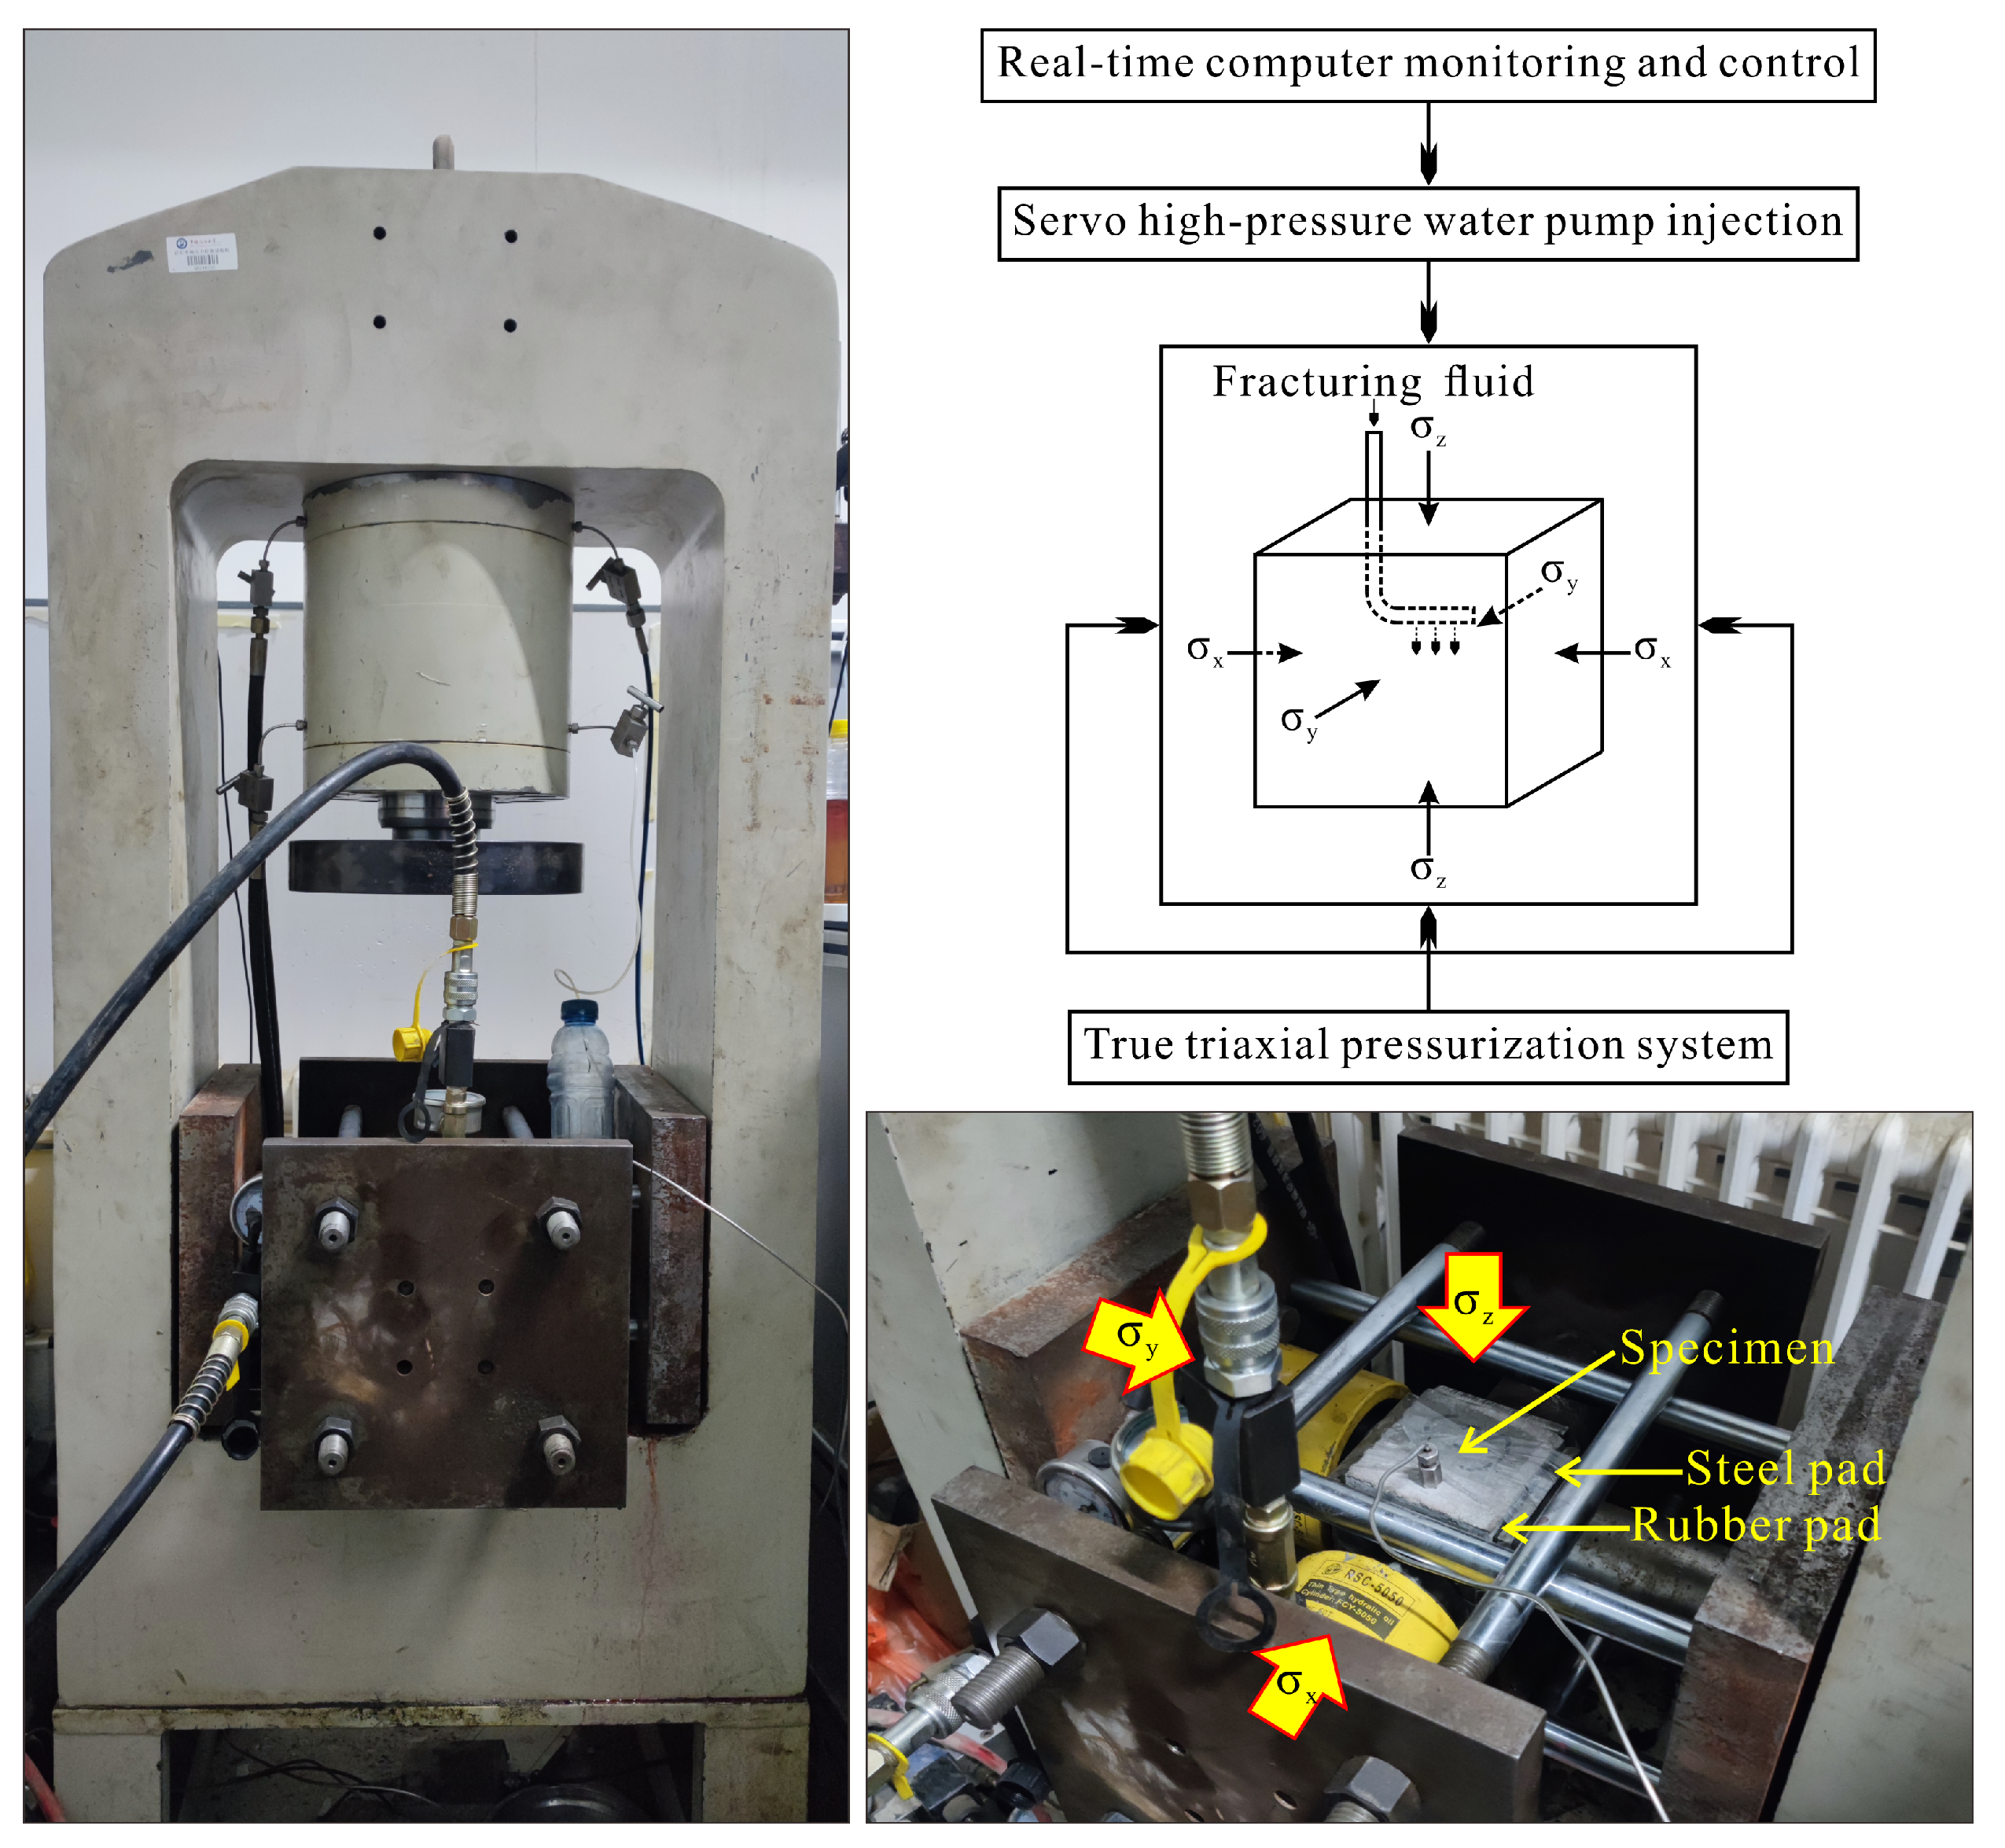
This study utilized a true triaxial hydraulic fracturing physical simulation experiment system for testing (Figure 8). The system is composed of three subsystems (Figure 8): an independent true triaxial pressurization system, a servo high-pressure water pump injection system, and a real-time computer monitoring and controlling system enabling the independent control of triaxial principal stresses and the precise simulation of the fracturing process [34].
At the beginning of the experiment, the cubic specimens (10 cm × 10 cm × 10 cm) were placed in a true triaxial pressure chamber (Figure 8). Three principal stresses were applied in a step-by-step manner to prevent rupture of specimens due to uneven stress loading. The triaxial stresses were set according to the experimental design to simulate three types of in situ stress regimes: the normal fault stress regime (σz > σy > σx), the strike-slip fault stress regime (σy > σz > σx), and the reverse fault stress regime (σy > σx > σz). The loading directions of the stresses σx, σy, and σz are presented in Figure 1 and Figure 8.
The fracturing fluid was pure water containing trace tracers, which was injected into the pre-embedded L-shaped wellbore via a servo high-pressure pump (model: HDB100-60) at a constant flow rate of 2 mL/min. The pumping pressure was continuously monitored by computer systems, and the complete pressure variation curves during fracture initiation and propagation were recorded.
Upon completion of the experiment, the stress was relieved step by step and then the specimens were removed. The fracture morphology was meticulously observed and reconstructed through cutting, photography, and 3D reconstruction techniques to ascertain the fracture orientation, distribution patterns, and layer penetration characteristics. Firstly, fracture development characteristics on different surfaces of post-fracturing specimens were carefully observed and photographed from six viewing perspectives as shown in Figure 1. Afterwards, the specimens were carefully dissected along fracture zones on each surface using tools such as knives, tweezers and hammers. The development and morphological features of hydraulic fractures were identified according to the red tracer dye of the fracturing fluid. Finally, three-dimensional perspective views of hydraulic fractures for different fractured specimens were plotted with three-dimensional drawing software (e.g., CAD).
The injection pressure curve over time during the hydraulic fracturing test, with the evolution of the pressure change rate (dP/dt) recorded synchronously, fully reflects the entire process of the specimen from pressurization, breakdown, to stable fracture propagation. This systematic workflow yielded fracturing response data from 18 specimen sets under varying in situ stress regimes, coal–roof interface strength, and roof mechanical properties, providing a reliable experimental basis for the subsequent analysis of fracture penetration mechanisms.

3. Results

The experiment designed and fabricated 18 specimens to comprehensively incorporate three crucial variables: in situ stress regimes, coal–roof interface strength, and roof mechanical properties. However, during the specimen curing, installation, or fracturing process, some specimens (i.e., Ab2, Ba1, and Bc1) failed to generate valid injection pressure curves or distinct fracture morphology data. The possible causes are that specimens get damaged during stress loading, or the horizontal wellbore becomes detached from the coal-roof rock blocks. Consequently, no pump-pressure response can be observed during fracturing-fluid injection. To guarantee the reliability of the analytical conclusions, this study will focus on presenting and discussing the 15 successful experimental datasets with complete data acquisition. Despite the presence of isolated data gaps, the existing valid datasets demonstrate reasonable variable combinations that sufficiently support the systematic analysis of fracture propagation patterns and produce reliable conclusions.
Subsequently, the experimental results will be classified and comprehensively analyzed according to the combinations of roof types (A and B), coal–roof interface types (a, b, and c), and in situ stress regimes (1, 2, and 3). The factors controlling hydraulic fracture propagation in a horizontal well in the roof of soft and low-permeability coal seams will be analyzed from the following three aspects: the post-fracturing macroscopic fracture morphology, the three-dimensional hydraulic fracture geometry and the corresponding injection pressure together with the pressure change rate (dP/dt) varying with fracturing time.

3.1. Specimens Aa1, Aa2, and Aa3

Material composition parameters of the coal seam roof, coal–roof interface, and coal seam for Specimens Aa1, Aa2, and Aa3 are shown in Table 5, while in situ stress regimes and relevant fracturing results are detailed in Table 7.
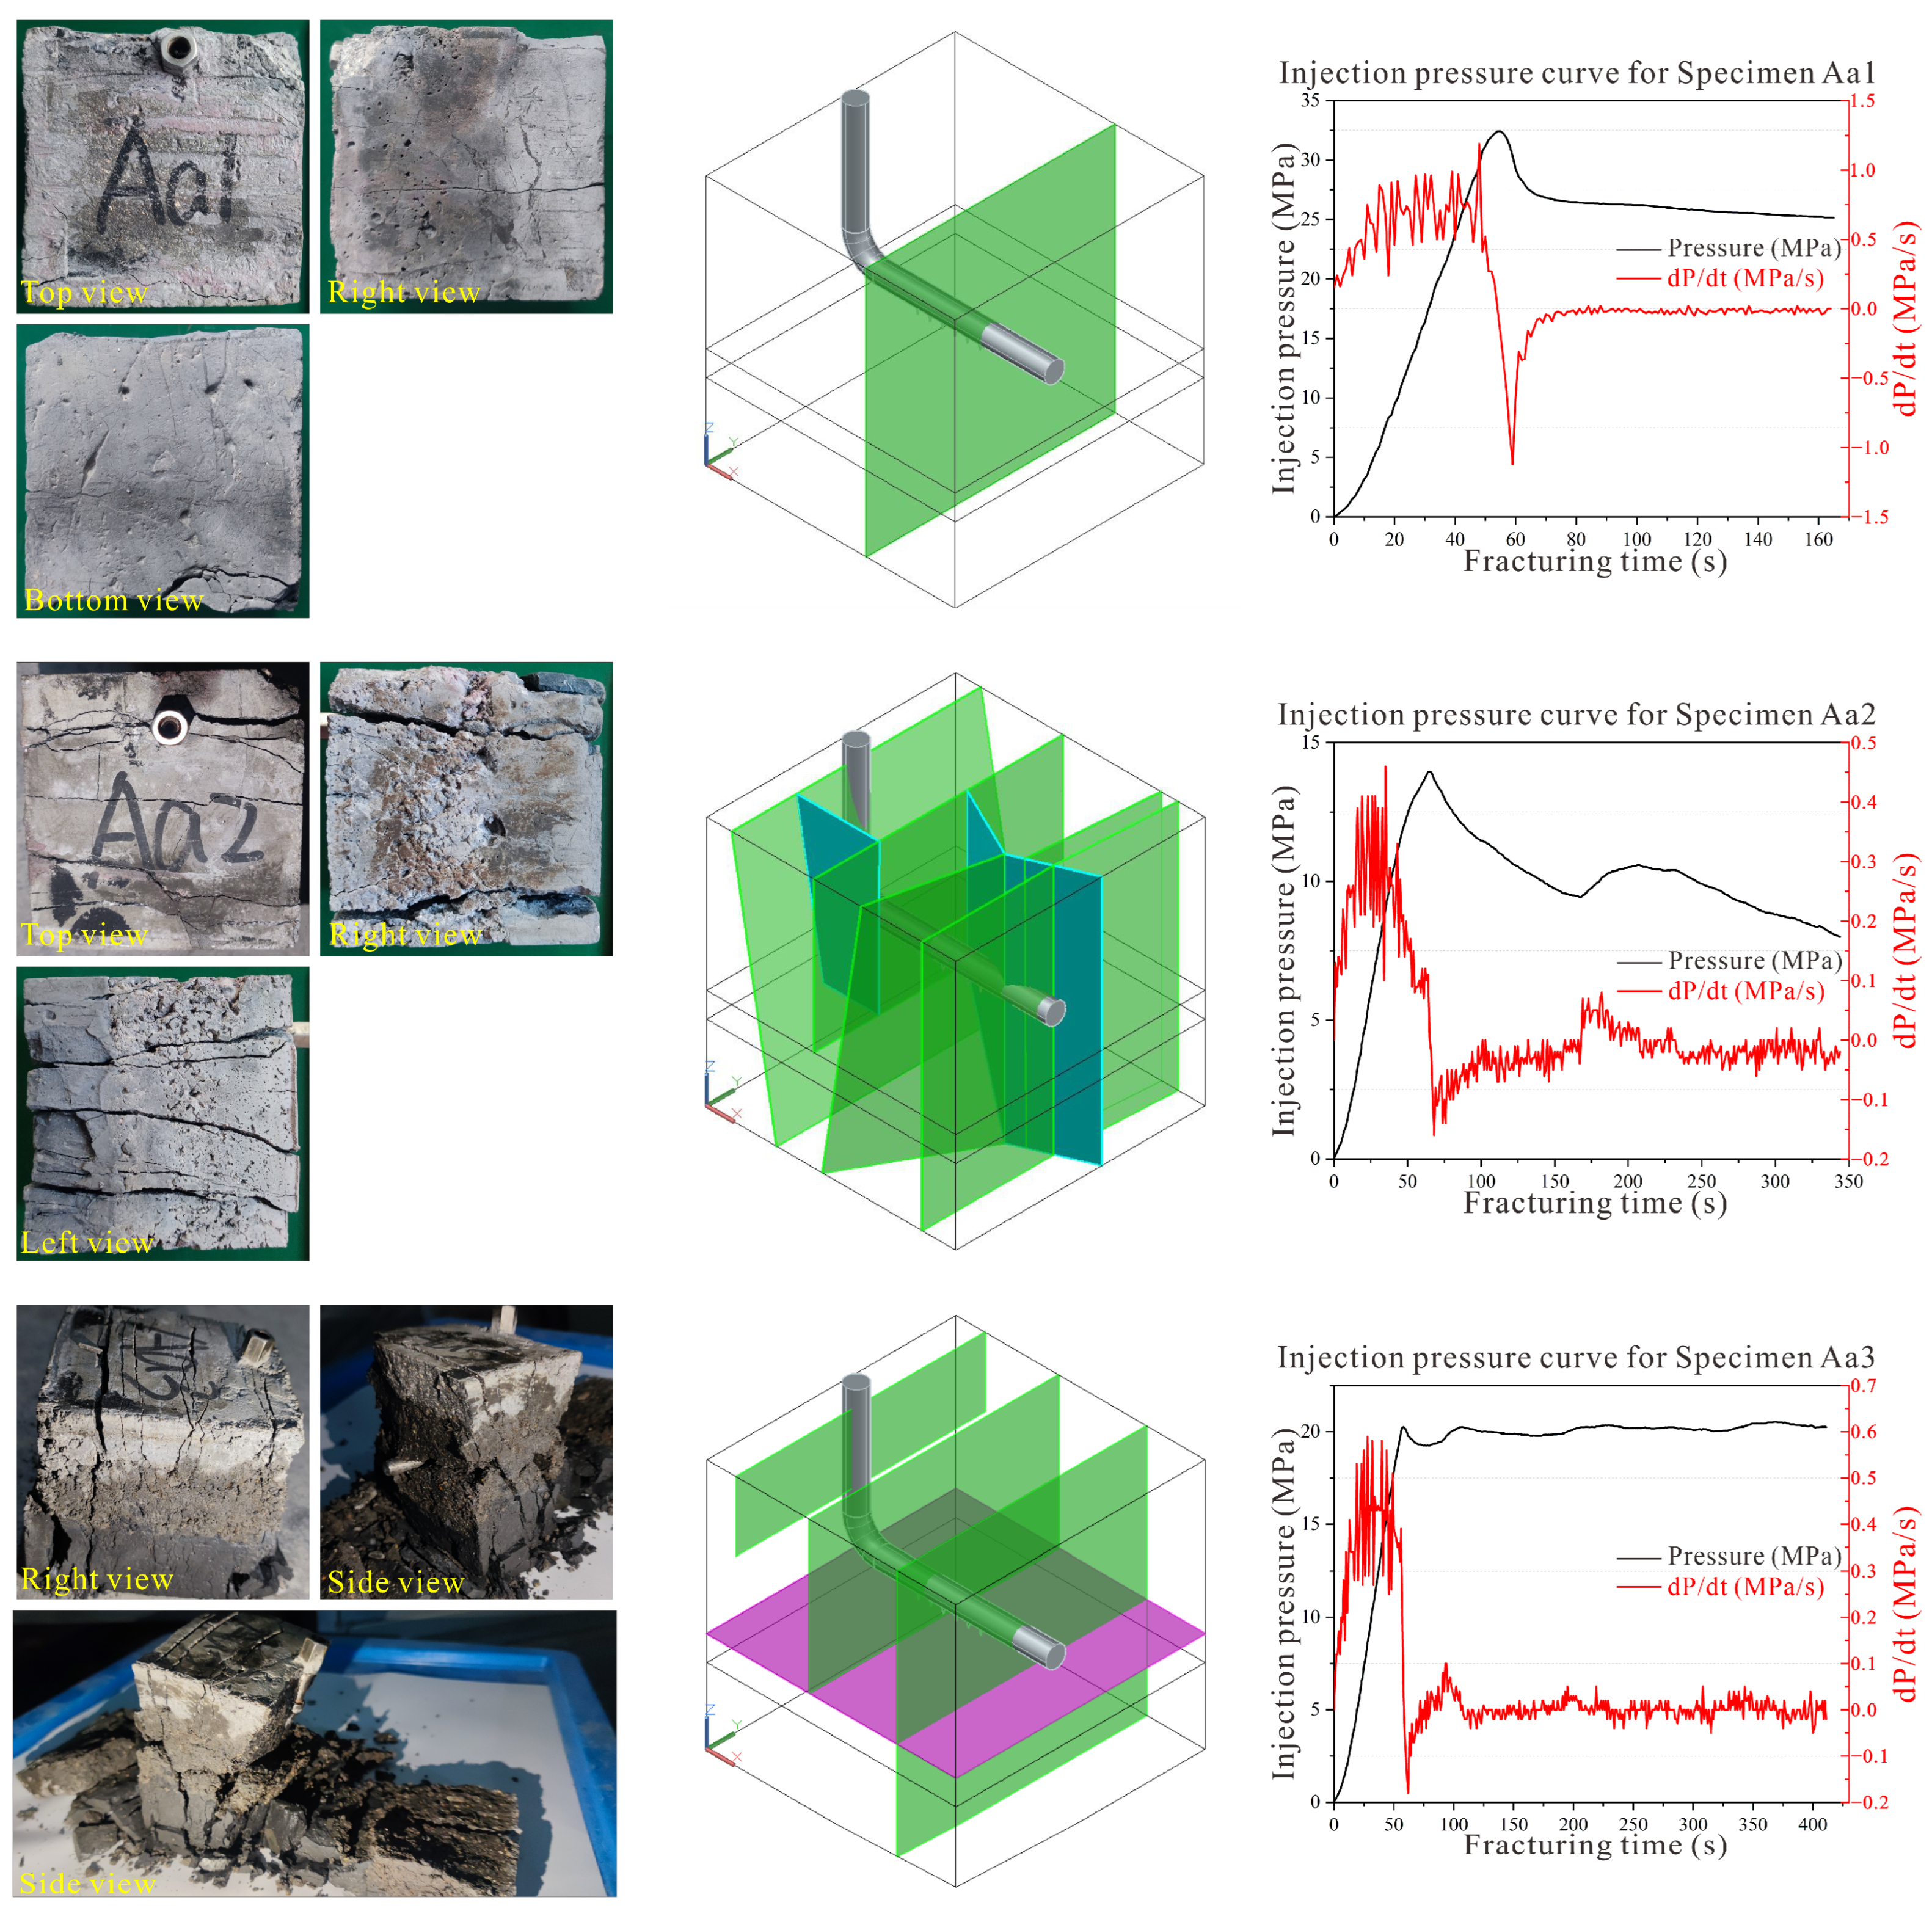
Three photographs of Specimen Aa1 after the hydraulic fracturing test and the reconstructed 3D fracture geometry indicate that a single main fracture developed inside Specimen Aa1, and the specimen maintains its structural integrity as a whole (Figure 9). A transverse fracture propagated perpendicular to the horizontal injection wellbore. The corresponding injection pressure variation characteristics are as follows: the injection pressure increased rapidly and linearly in the early stage, reaching a peak fracture pressure of approximately 32.5 MPa at about 55 s; after rock initiation, the injection pressure dropped rapidly within the interval of 55~60 s; after 60 s, the pressure decline rate slowed down and eventually stabilized around 25 MPa, indicating the stable fracture propagation stage (Figure 9). The pressure change rate (dP/dt) maintained intense positive fluctuations before fracture initiation, dropped sharply to a significant negative valley at the moment of initiation, then gradually recovered and fluctuated slightly around zero during the stable fracture propagation stage (Figure 9).
Post-fracturing Specimen Aa2 contains multiple intersecting fractures, with a significantly increased degree of fracture fragmentation (Figure 9). A fracture network formed by the intersection of multiple horizontal and vertical fractures develops inside the specimen. The corresponding injection pressure curve indicates that during the pressure accumulation stage, the injection pressure increased rapidly to a fracture initiation pressure of approximately 13.75 MPa, then decreased to approximately 9 MPa in the fracture propagation stage (Figure 9). After this stage, the injection pressure rose again to approximately 11 MPa, and eventually decreased gradually to approximately 7.5 MPa. This characteristic pressure variation reflects the process of secondary fracture initiation and propagation. The pressure change rate (dP/dt) presents intense fluctuation characteristics before fracture initiation, and gradually stabilizes after fracture initiation (Figure 9).
Post-fracturing Specimen Aa3 is characterized by a high fragmentation degree and relatively loose internal structure (Figure 9). A composite fracture network, composed of one horizontal fracture and three transverse fractures, developed in this specimen. The injection pressure increased rapidly, reaching a peak value of approximately 20 MPa at approximately 50 s, after which a slight short-term pressure decline was observed. Thereafter, the injection pressure maintained moderate fluctuations and stabilized at around 20 MPa for the remaining stage of the test (Figure 9). Before the fracturing occurred, the pressure change rate (dP/dt) continued to show intense positive fluctuations; when rock fracturing occurred, dP/dt dropped sharply to a deep negative valley, then rose and oscillated slightly around zero during the stable crack propagation stage (Figure 9).

3.2. Specimens Ab1 and Ab3

Material composition parameters of the coal seam roof, coal–roof interface, and coal seam for Specimens Ab1 and Ab3 are listed in Table 5, while in situ stress regimes and relevant fracturing results are presented in Table 8.
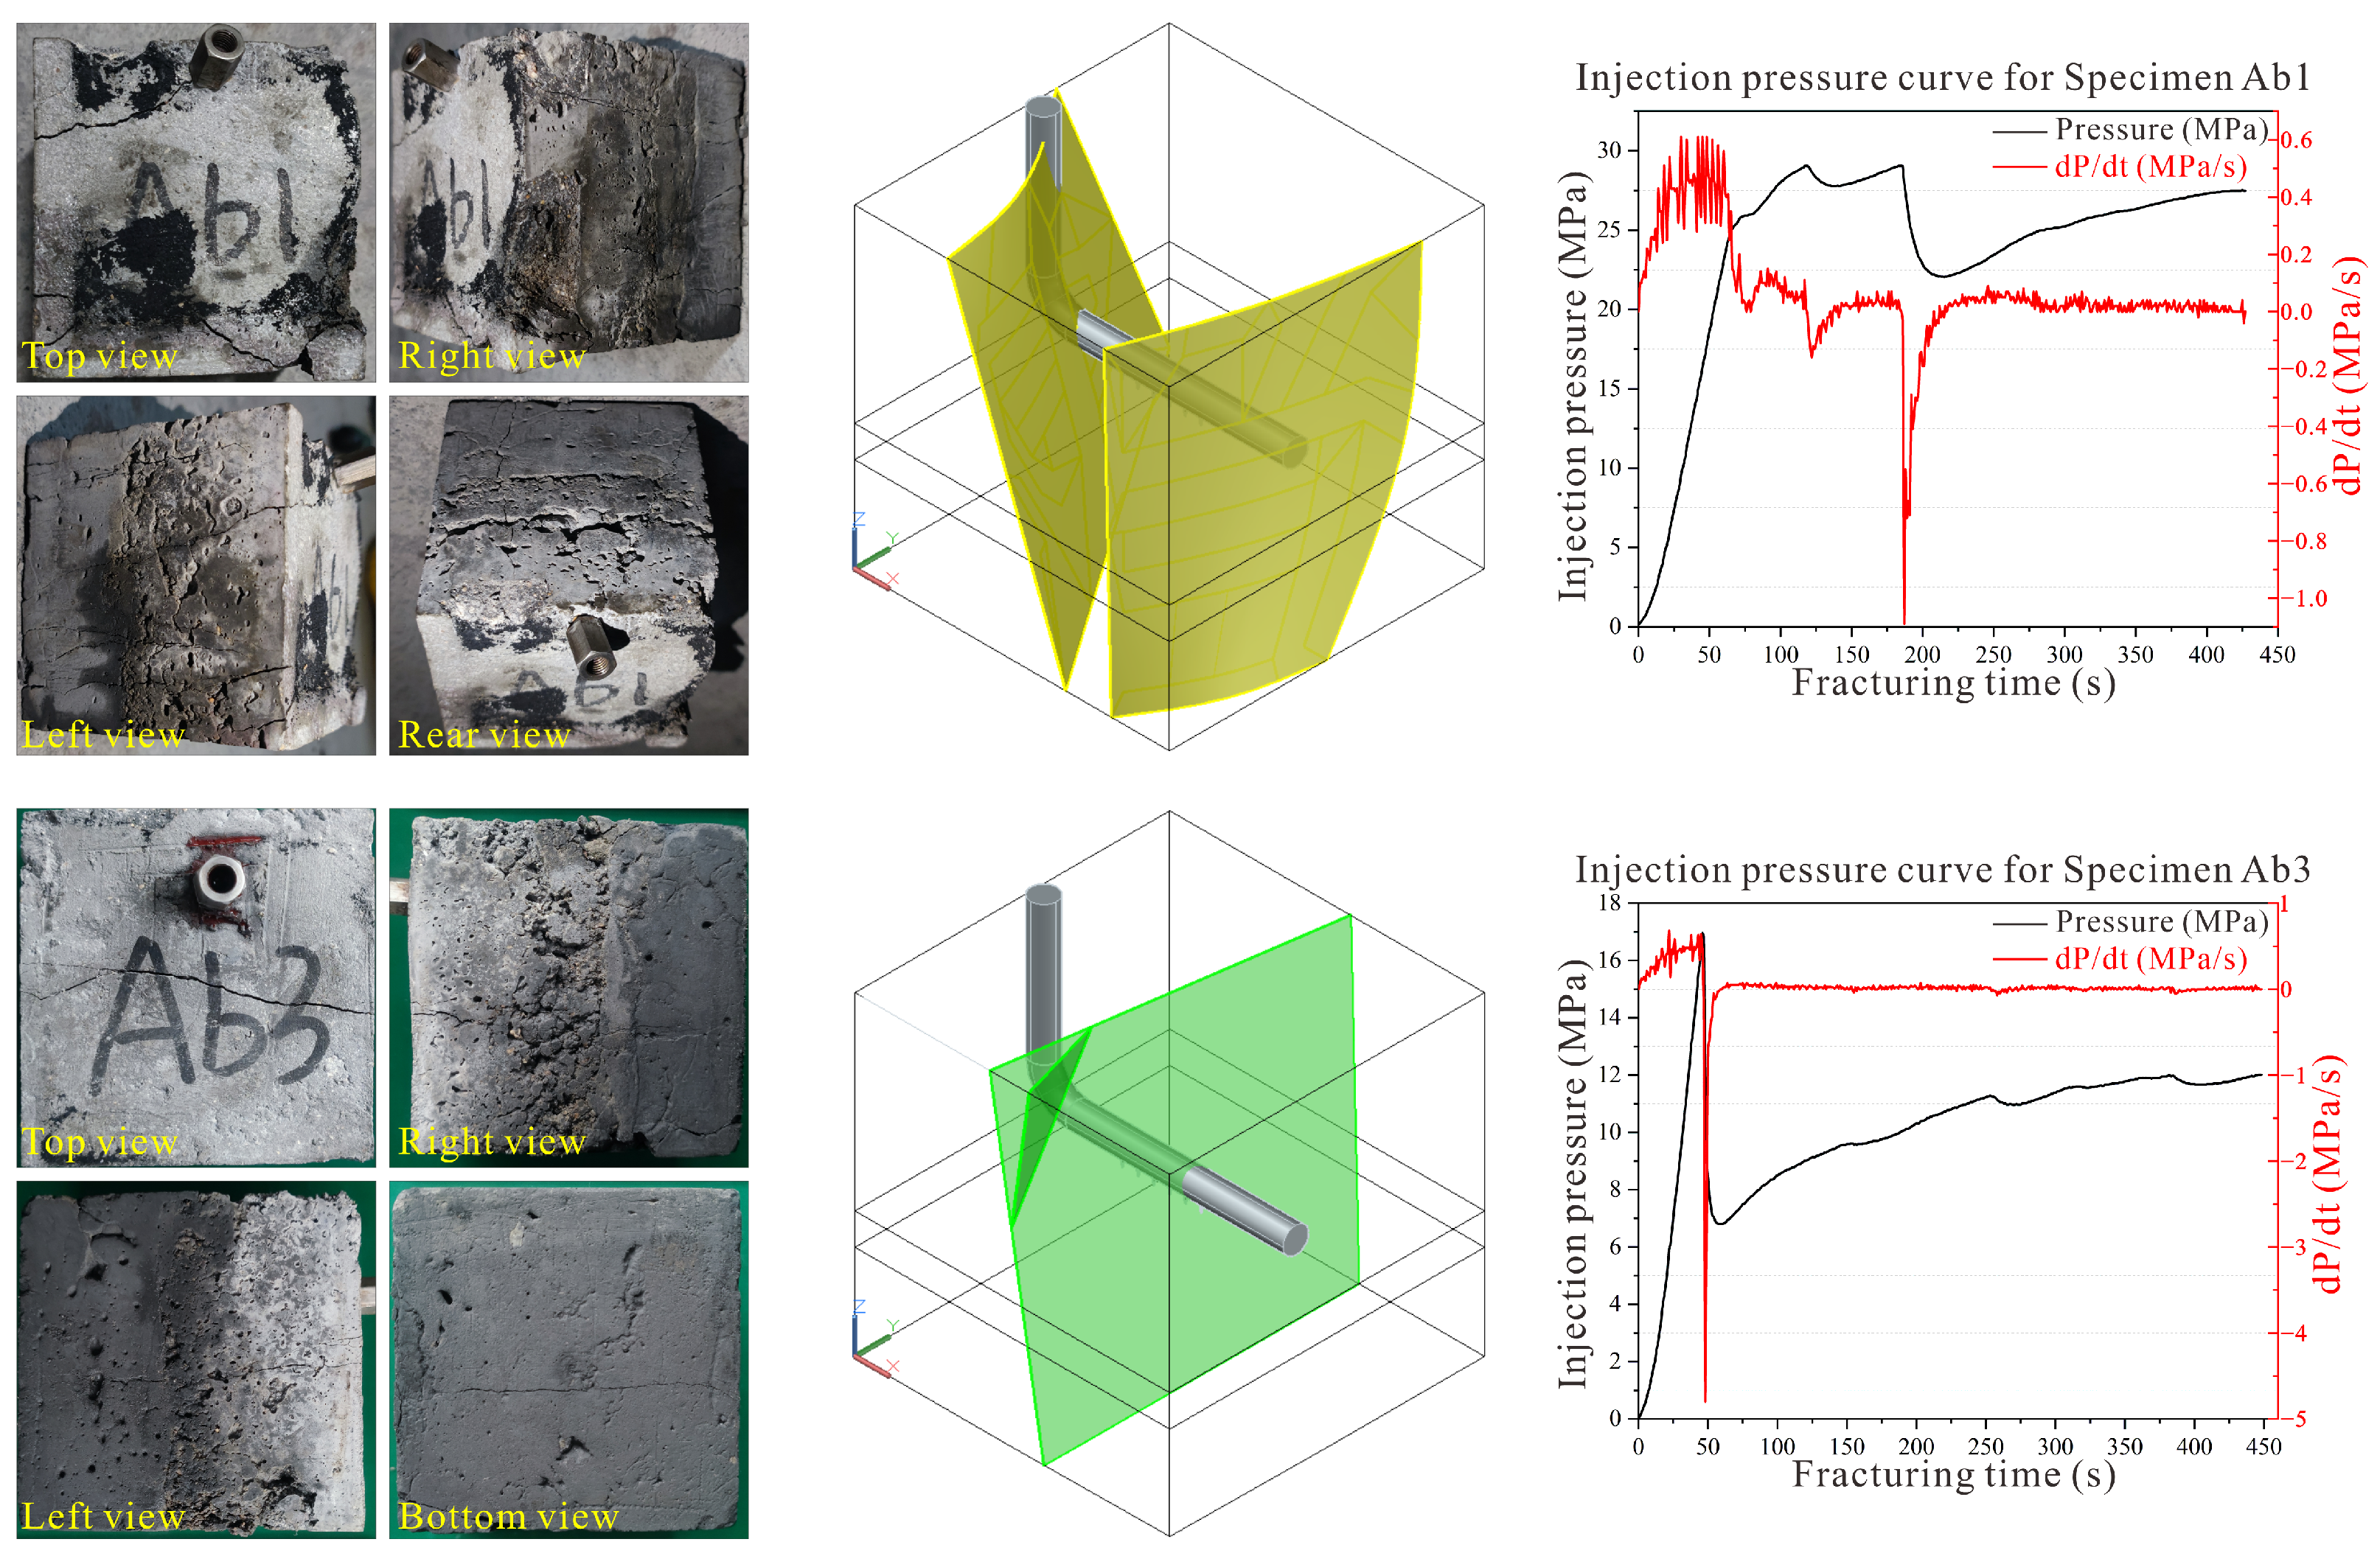
Four post-fracturing photographs of Specimen Ab1 indicate that two distinct fractures developed on the specimen surface (Figure 10). The three-dimensional geometric model of the fracture network illustrates the propagation morphology of the induced hydraulic fractures: two curved, irregular fractures initiated from the borehole and propagated toward the boundaries of the specimen. As observed from the injection pressure and pressure change rate (dP/dt) curves, during the initial fluid injection stage, the injection pressure increased linearly to approximately 25 MPa, then continued to rise to a peak initiation pressure of 29 MPa, accompanied by intense high-amplitude oscillations of the dP/dt (Figure 10). After the fracture initiation, the injection pressure decreased and presented repeated fluctuating characteristics, while dP/dt exhibited multiple abrupt drops, corresponding to the continuous propagation of the second curved fracture. In the late stage of hydraulic fracturing, the injection pressure gradually recovered and increased slowly, while dP/dt tended to be stable, maintaining small-amplitude fluctuations around zero (Figure 10).
A dominant through-going hydraulic fracture initiated from the central injection borehole and penetrated the matrix of Specimen Ab3 after the fracturing test (Figure 10). Correspondingly, the injection pressure curve featured an obvious peak breakdown pressure of approximately 17 MPa within the first 50 s of pumping, and the concurrent sharp negative fluctuation of the pressure change rate (dP/dt) indicated the moment of fracture initiation (Figure 10). After breakdown, the injection pressure fell rapidly before a gradual long-term recovery, which was accompanied by stabilized near-zero fluctuation of dP/dt, demonstrating the stable continuous propagation of the induced hydraulic fracture throughout the later injection period (Figure 10).

3.3. Specimens Ac1, Ac2, and Ac3

Material composition parameters of the coal seam roof, coal–roof interface, and coal seam for Specimens Ac1, Ac2, and Ac3 are shown in Table 5, while in situ stress regimes and relevant fracturing results are listed in Table 9.
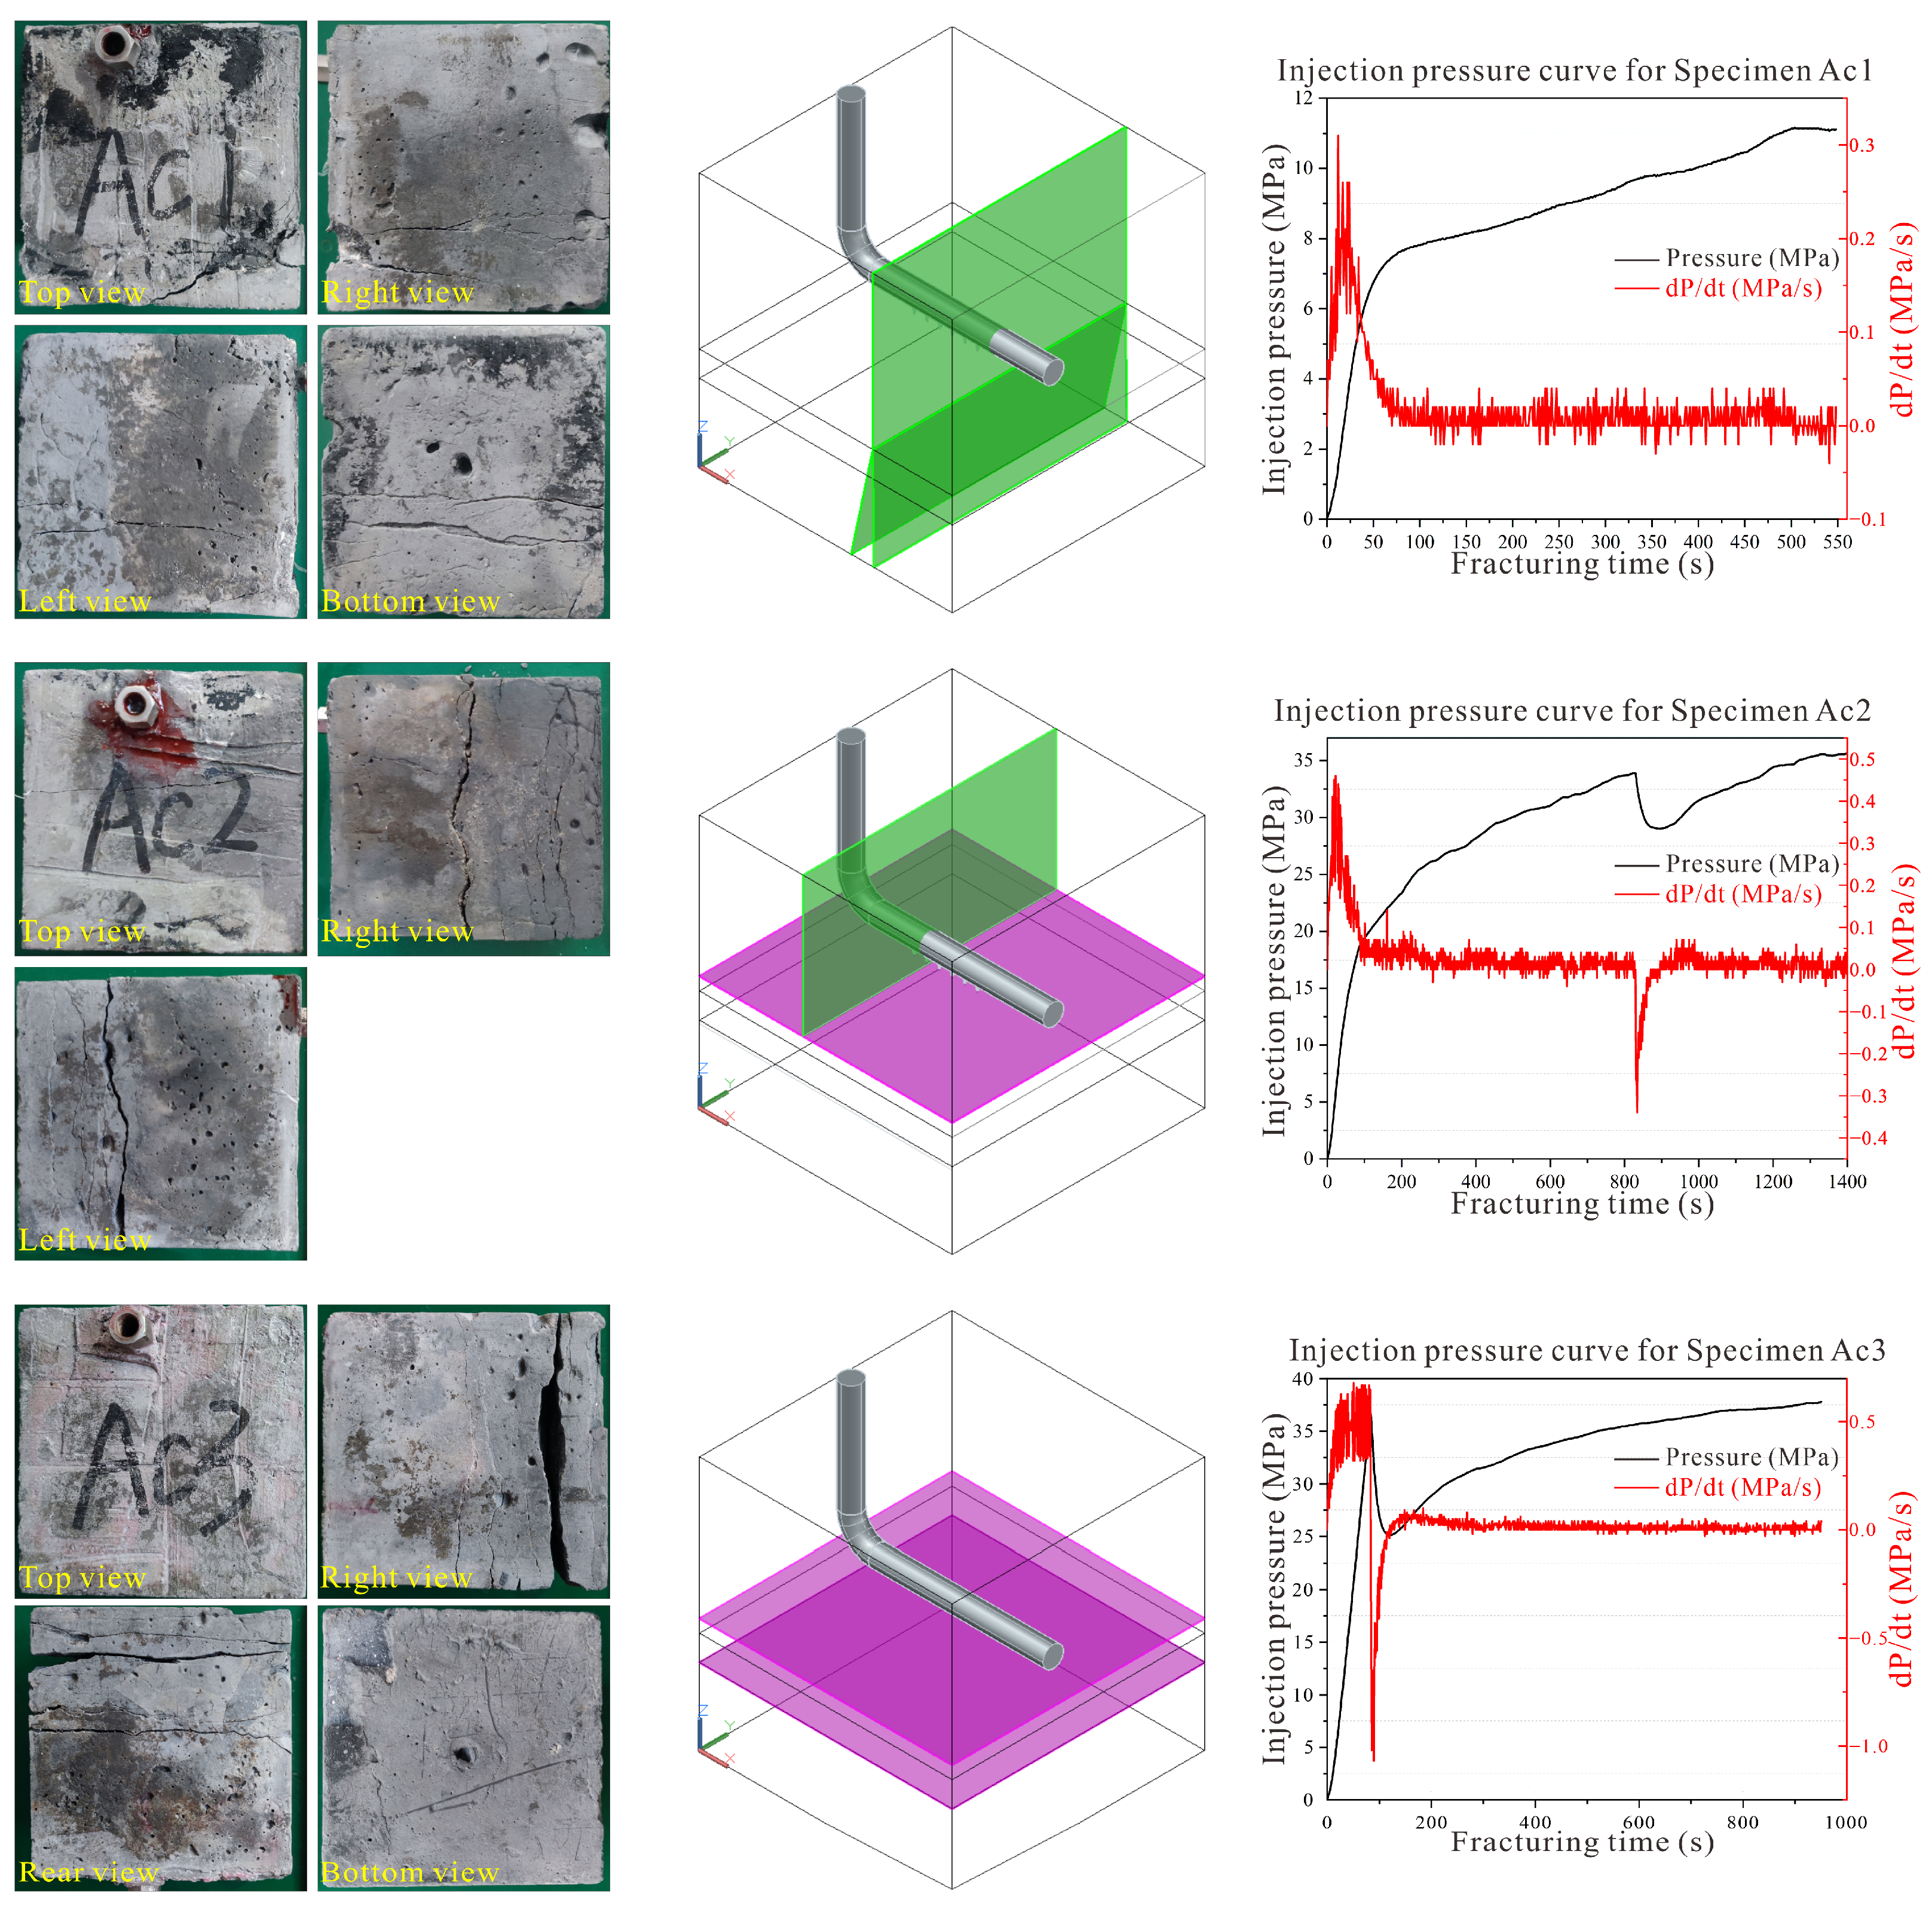
Four photographs of Specimen Ac1 after the hydraulic fracturing test and the reconstructed 3D fracture geometric diagram show that a transverse fracture initiated and propagated from the horizontal wellbore, and bifurcated into two branch fractures at the coal–roof interface (Figure 11). The injection pressure curve of Specimen Ac1 shows that during the initial stage of pumping, the injection pressure rapidly rose to a peak of approximately 8 MPa, accompanied by a significant positive spike in the pressure change rate (dP/dt); after fracture initiation, dP/dt fluctuated around zero, while the injection pressure gradually increased and eventually stabilized at approximately 11 MPa, indicating that the bifurcated fractures were in a stable propagation state (Figure 11).
A transverse fracture originated from the horizontal borehole and then propagated horizontally along the coal–roof interface in the post-fracturing Specimen Ac2 (Figure 11). The corresponding injection pressure curve of Specimen Ac2 shows that injection pressure climbed linearly to 20 MPa in the first 100 s, followed by a gradual increase to 34 MPa (Figure 11). After the sustained slow growth, an evident pressure drop and sharp negative dP/dt trough at ~800 s indicated fracture propagation along the coal–roof interface, after which the injection pressure resumed a gradual rise to 35 MPa (Figure 11).
Two main horizontal fractures developed along the coal–roof interface in the fractured Specimen Ac3 (Figure 11). The injection pressure rapidly rose to a breakdown peak near 37 MPa at about 100 s, then sharply declined to ~25 MPa upon rock fracturing (Figure 11). After breakdown, the pressure slowly and continuously ascended to approximately 38 MPa till the end of testing. The pressure change rate (dP/dt) kept high positive oscillations before rupture, dropped drastically to a negative minimum at fracture initiation, and later stabilized with mild positive fluctuations near zero during stable fracture propagation (Figure 11).

3.4. Specimens Ba2 and Ba3

Material composition parameters of the coal seam roof, coal–roof interface, and coal seam for Specimens Ba2 and Ba3 are shown in Table 5, while in situ stress regimes and relevant fracturing results are detailed in Table 10.
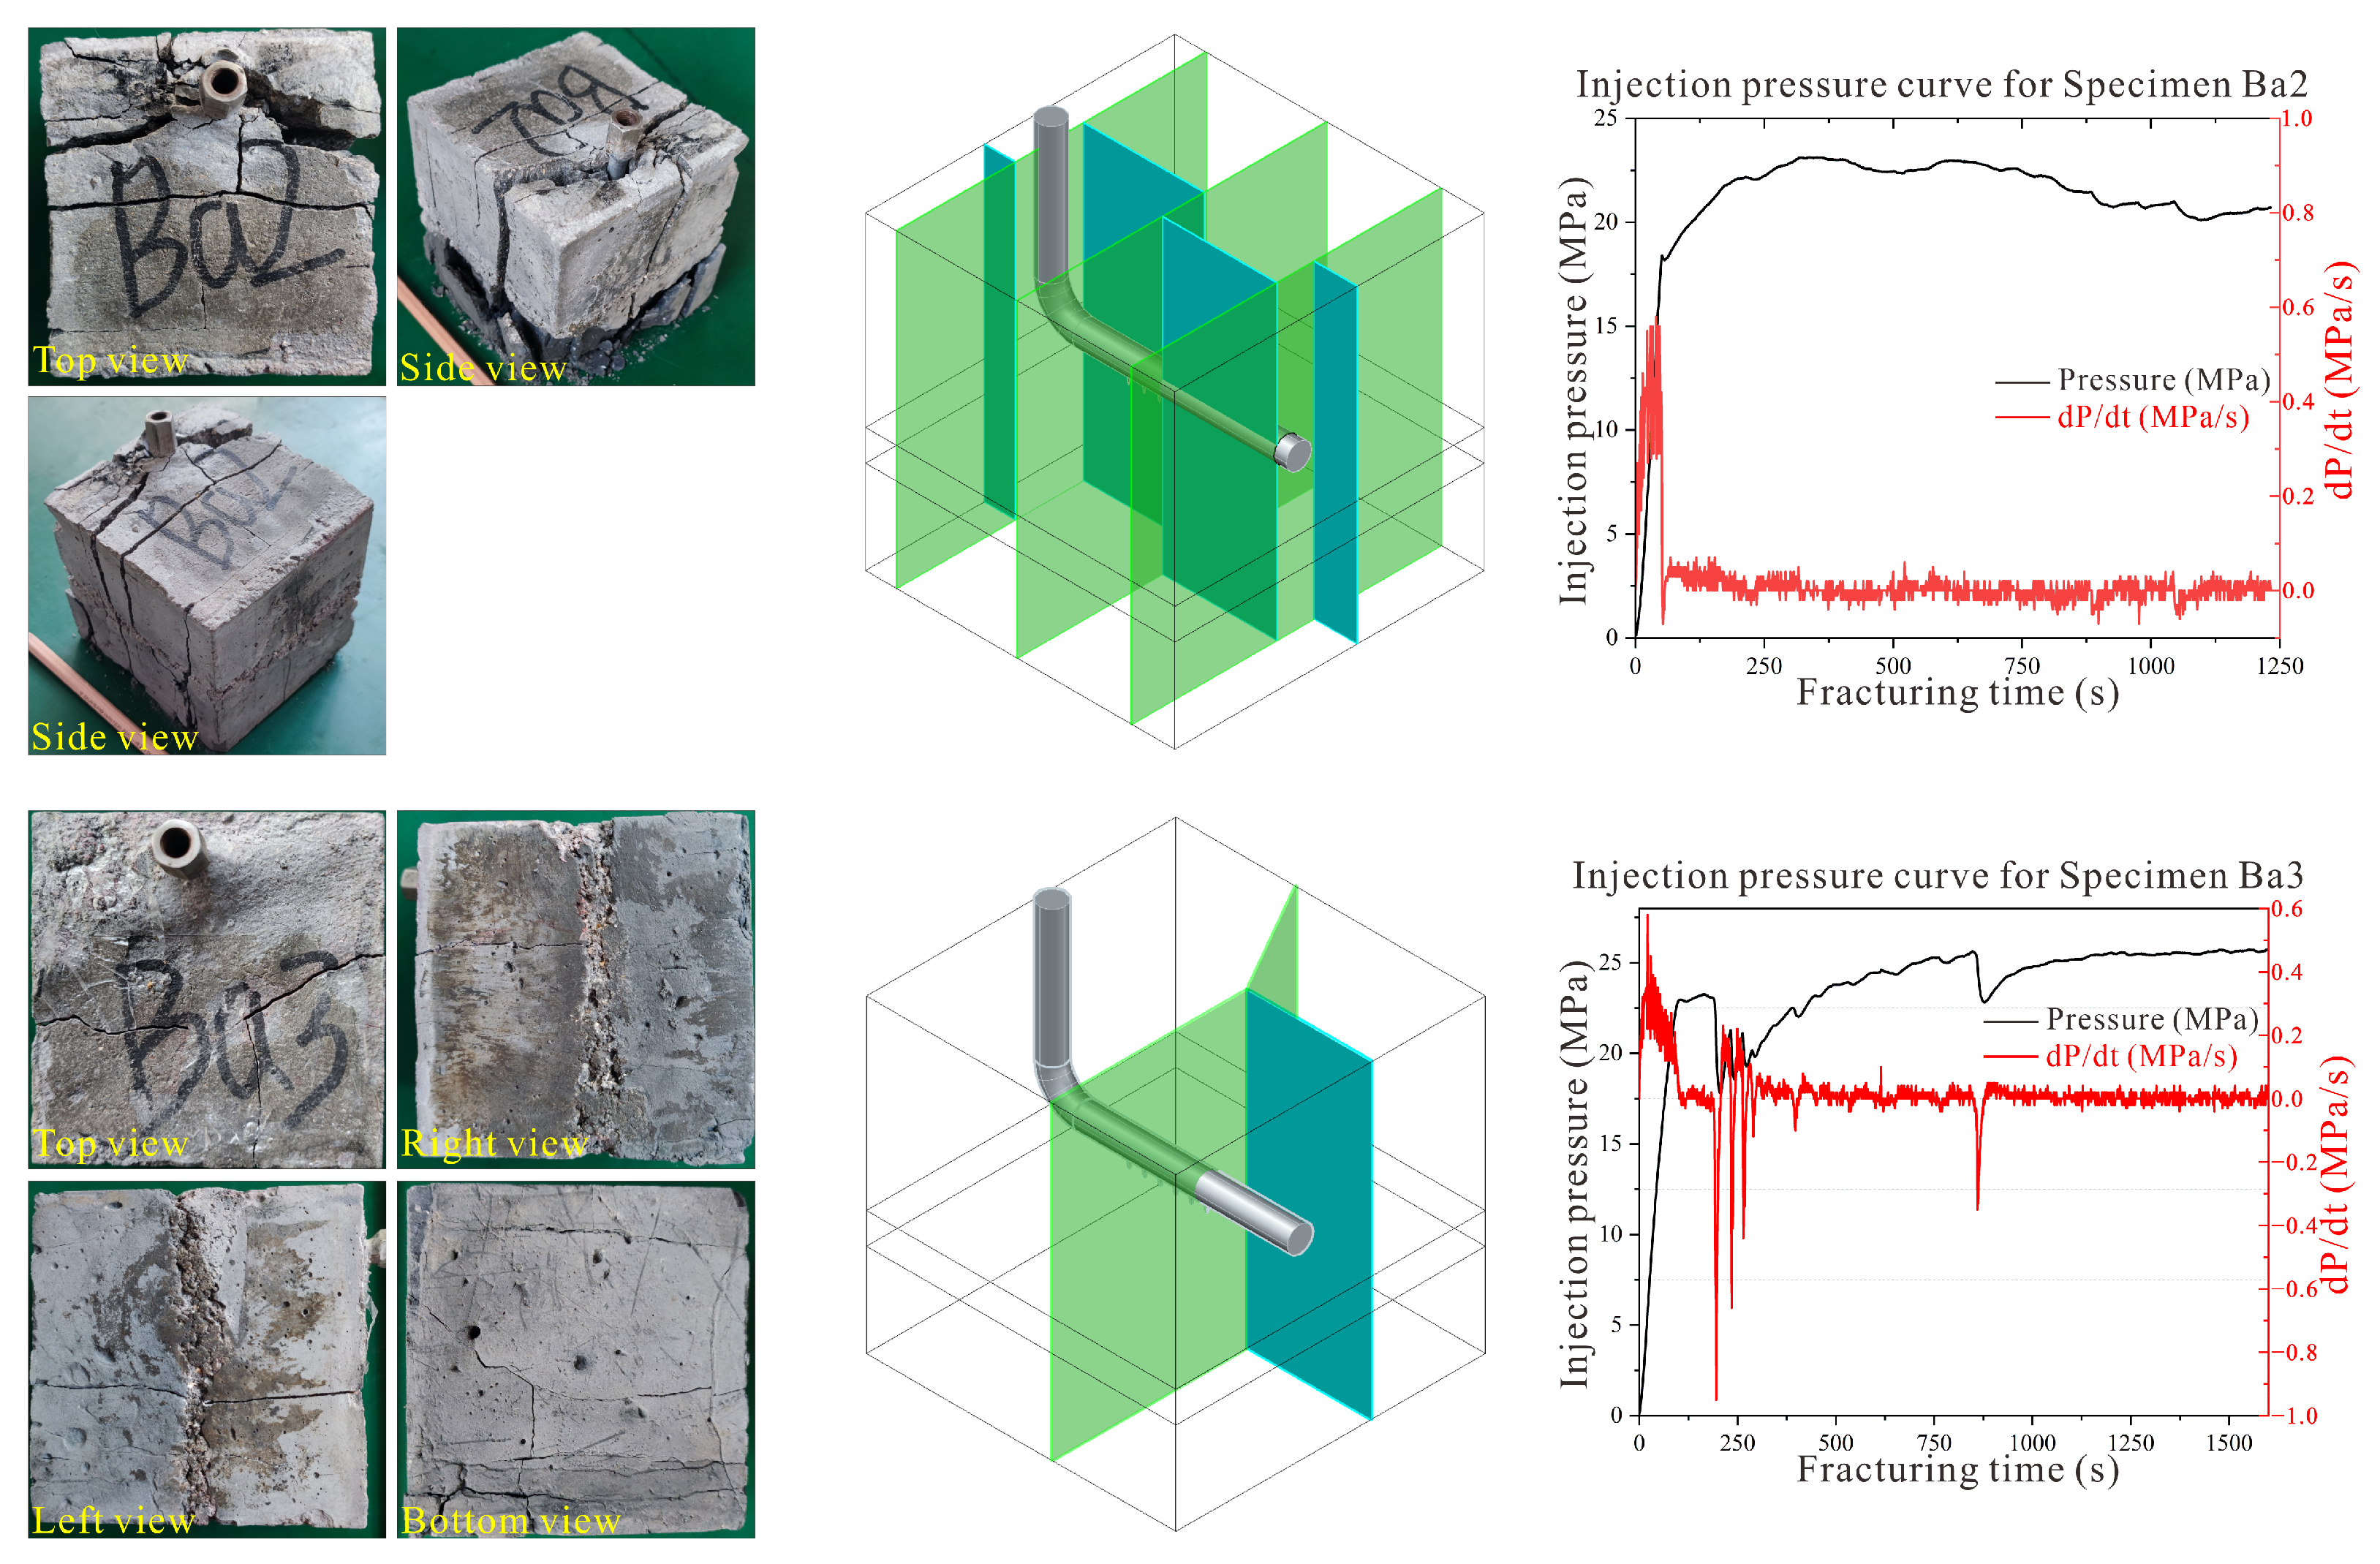
Three photographs of Specimen Ba2 after the hydraulic fracturing test and the reconstructed three-dimensional fracture geometric diagram reveal that a complex fracture network consisting of multiple transverse and longitudinal fractures formed in Specimen Ba2 (Figure 12). Correspondingly, the injection pressure rose linearly to 18 MPa during the initial loading phase (0~100 s), and then attained the maximum peak of nearly 23 MPa at about 300 s (Figure 12). After reaching the peak pressure, the injection pressure did not drop abruptly; instead, it sustained a high-pressure platform with minor cyclic fluctuations and a subtle long-term declining tendency throughout the late stage. After the initial pressurization stage, the pressure change rate (dP/dt) decayed rapidly to a value close to zero, only exhibiting slight noise-like small fluctuations without obvious large oscillations in the subsequent long-term fracturing process, indicating that the pressure variation rate became very gentle during the stage of stable fracture propagation (Figure 12).
A coupled fracture pattern consisting of a transverse and a longitudinal fracture formed in the post-fracturing Specimen Ba3 (Figure 12). The transverse fracture bent to a certain degree during propagation. At the initial injection phase, the injection pressure rose steeply to the first breakdown peak of ca. 23 MPa at about 100 s. Subsequently, repeated abrupt pressure drops occurred at ~200 s and ~800 s, indicating the successive initiation of hydraulic fractures (Figure 12). After each fracture initiation event, the injection pressure gradually rebounded and slowly ascended to around 25 MPa at the terminal test stage. Consistent with pressure variations, the pressure change rate (dP/dt) displayed intense positive oscillation before initial rupture, which was accompanied by several sharp negative spikes synchronously corresponding to each new fracture generation; thereafter, dP/dt stabilized with mild fluctuations around zero during stable fracture extension (Figure 12).

3.5. Specimens Bb1, Bb2, and Bb3

Material composition parameters of the coal seam roof, coal–roof interface, and coal seam for Specimens Bb1, Bb2, and Bb3 are listed in Table 5, while in situ stress regimes and relevant fracturing results are presented in Table 11.
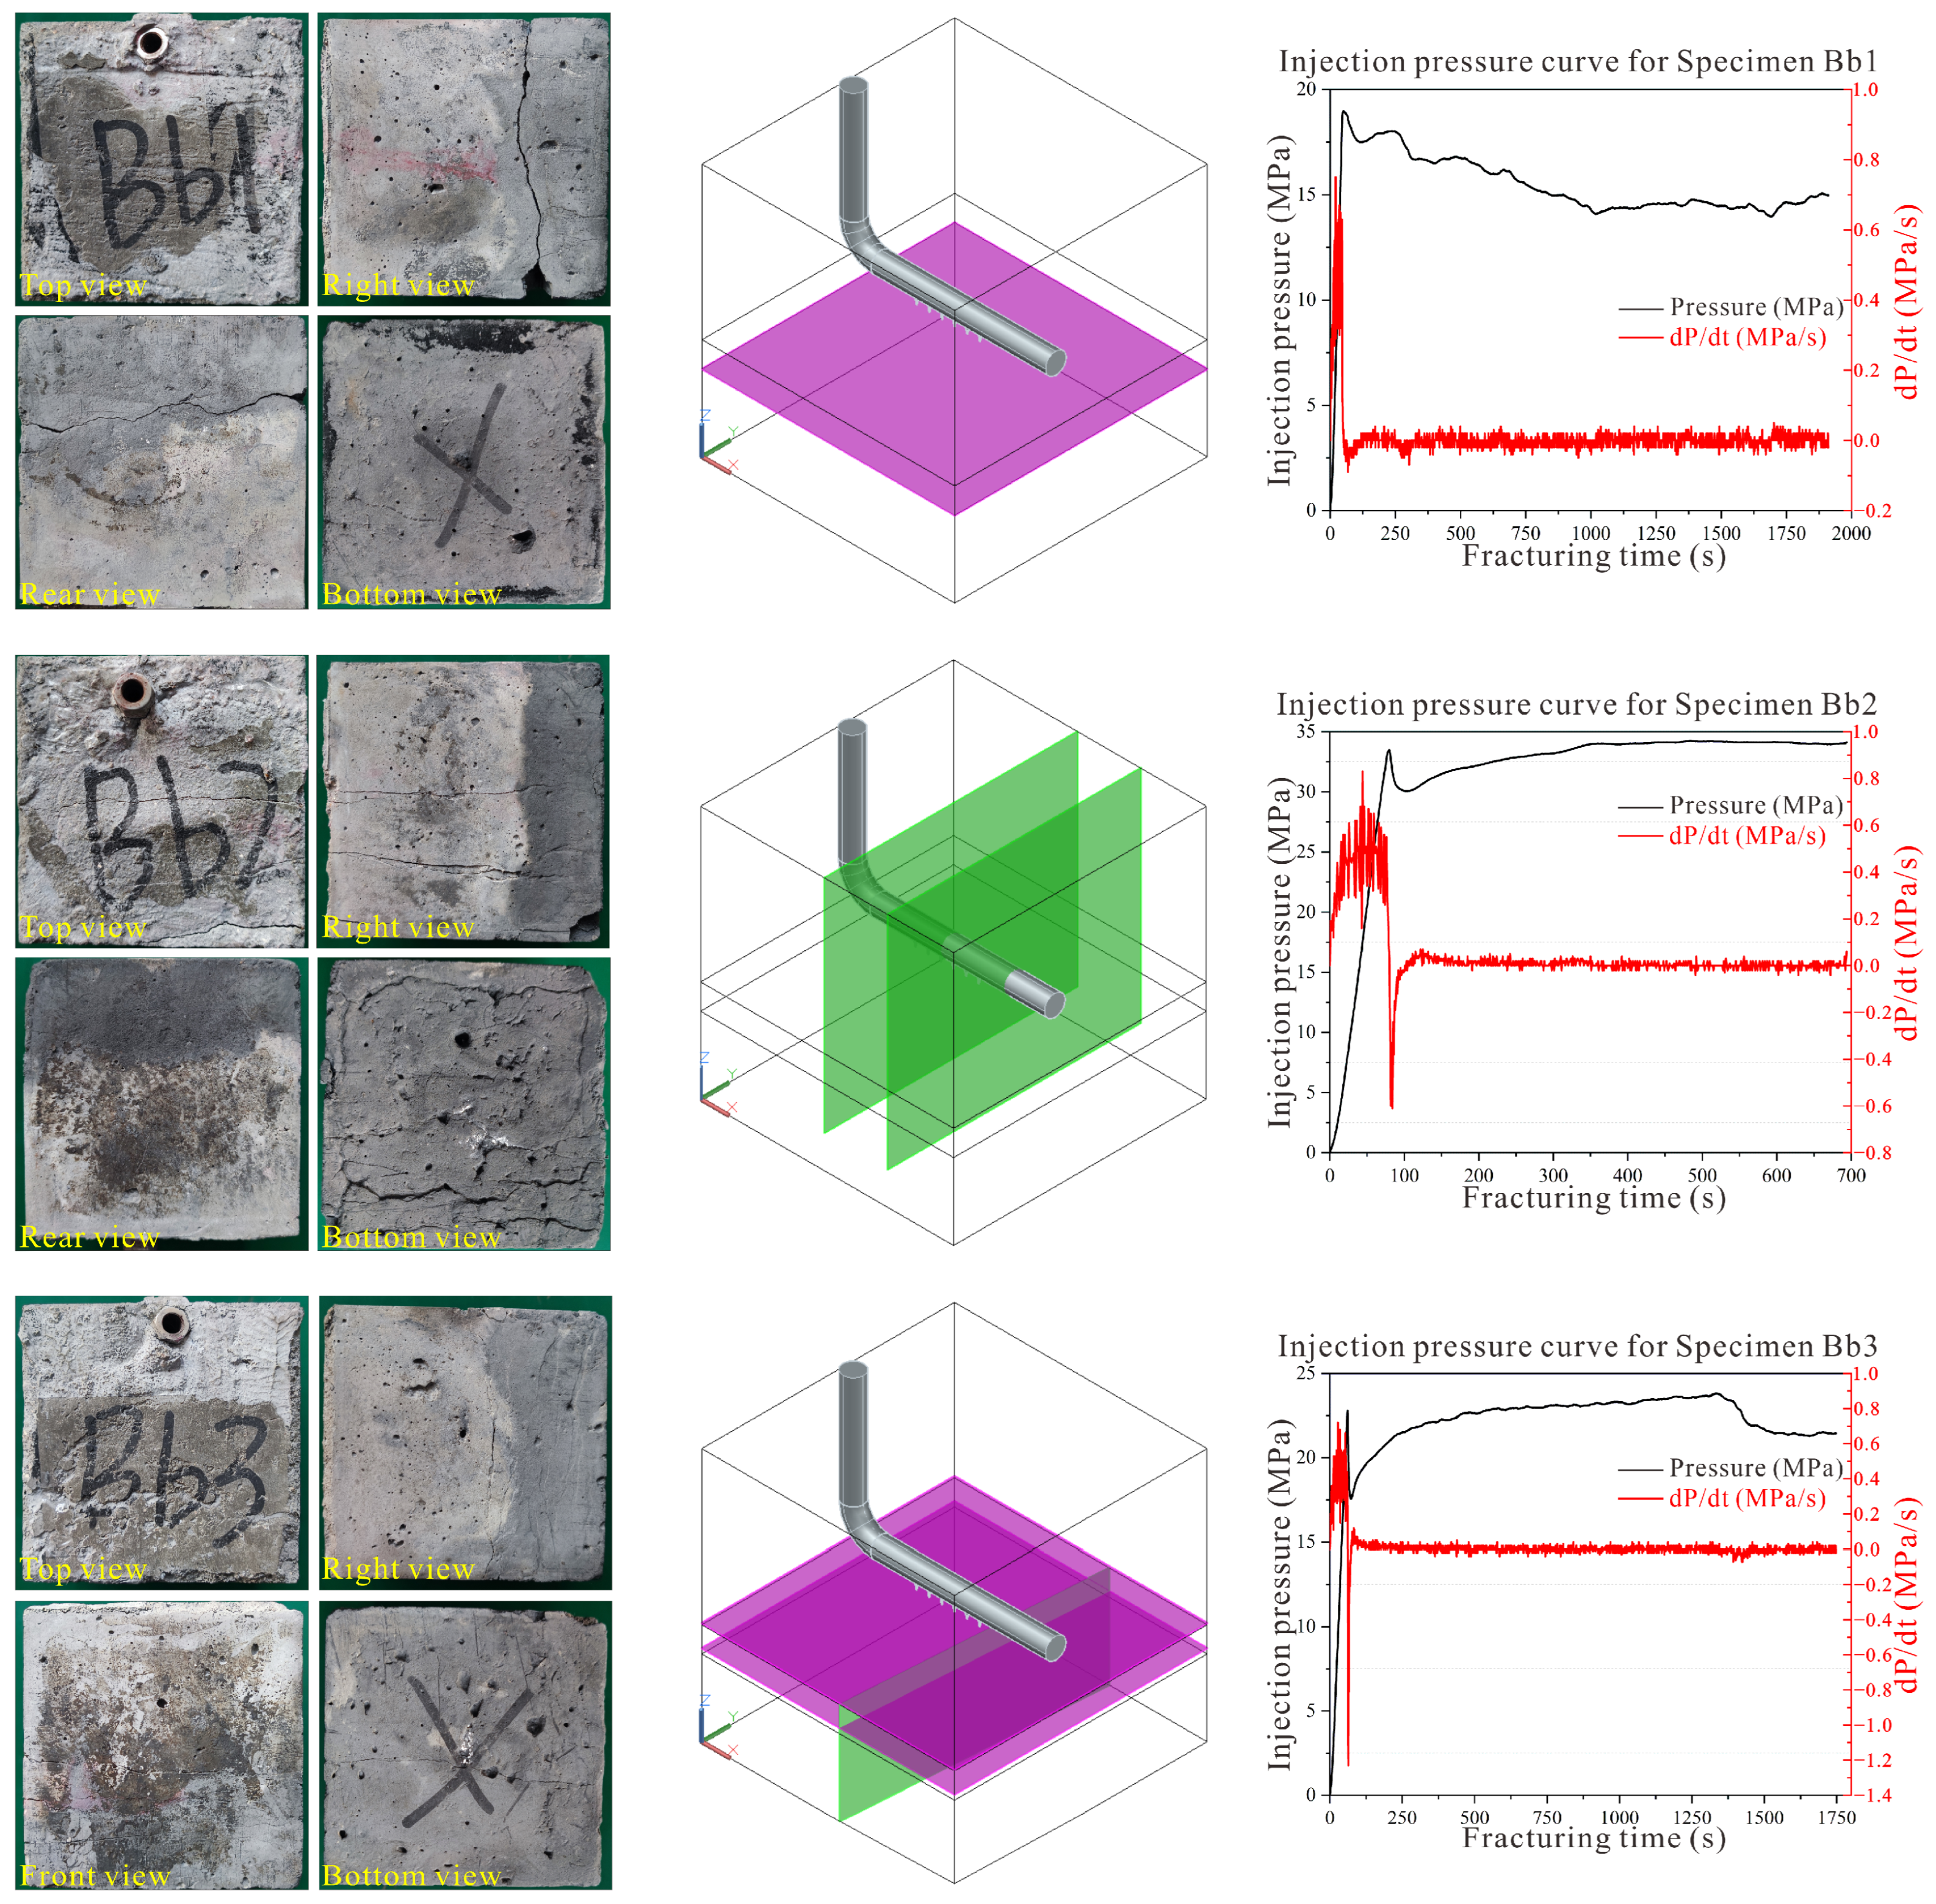
Four photographs of Specimen Bb1 after the hydraulic fracturing test and the reconstructed three-dimensional fracture geometric diagram show that a dominant horizontal hydraulic fracture initiated from the horizontal injection wellbore and propagated along the coal–roof interface in Specimen Bb1 (Figure 13). Accordingly, the injection pressure linearly climbed to a breakdown peak of ~18.75 MPa at the initial injection stage, then gradually declined and fluctuated mildly around 14~15 MPa for the rest of the test (Figure 13). The dP/dt sharply spiked positively before fracture breakdown, fell into negative values instantly upon main fracture initiation, and kept subtle low-amplitude fluctuations near zero during steady fracture expansion (Figure 13).
For post-fracturing Specimen Bb2, two transverse hydraulic fractures initiated and propagated perpendicularly to the horizontal injection wellbore (Figure 13). Prior to approximately 80 s, sustained fluid injection led to a rapid increase in injection pressure, accompanied by prominent positive oscillations of the pressure change rate (dP/dt), corresponding to the pre-breakdown pressurization stage (Figure 13). At the moment of fracture breakdown (approximately 80 s), the injection pressure reached its peak value of approximately 33 MPa before an instantaneous drop. Meanwhile, dP/dt decreased sharply to negative values, marking the initiation of hydraulic fractures. After 100 s, the injection pressure rebounded gradually and stabilized within the range of 33~34 MPa, while dP/dt fluctuated mildly around zero. This pressure response indicated a stage of stable quasi-static propagation of hydraulic fractures (Figure 13).
For the fractured specimen Bb3, two main horizontal hydraulic fractures developed along the coal–roof interface, accompanied by one transverse fracture initiating from the horizontal wellbore and extending downward (Figure 13). Correspondingly, the injection pressure rose sharply to a peak of approximately 22.5 MPa during the initial stage of fluid injection, followed by an immediate pressure drop, corresponding to a significant negative swing in the pressure change rate (dP/dt) (Figure 13). After fracture initiation, the injection pressure increased slowly with minor fluctuations within the range of 75~1375 s, eventually stabilizing at a plateau value of approximately 23 MPa. During this stage, dP/dt fluctuated stably around zero, corresponding to the steady-state propagation process of the fractures. In the final stage of the test (>1375 s), the injection pressure gradually decreased to approximately 21.5 MPa, with dP/dt remaining at a low negative level (Figure 13).

3.6. Specimens Bc2 and Bc3

Material composition parameters of the coal seam roof, coal–roof interface, and coal seam for Specimens Bc2 and Bc3 are shown in Table 5, while in situ stress regimes and relevant fracturing results are listed in Table 12.
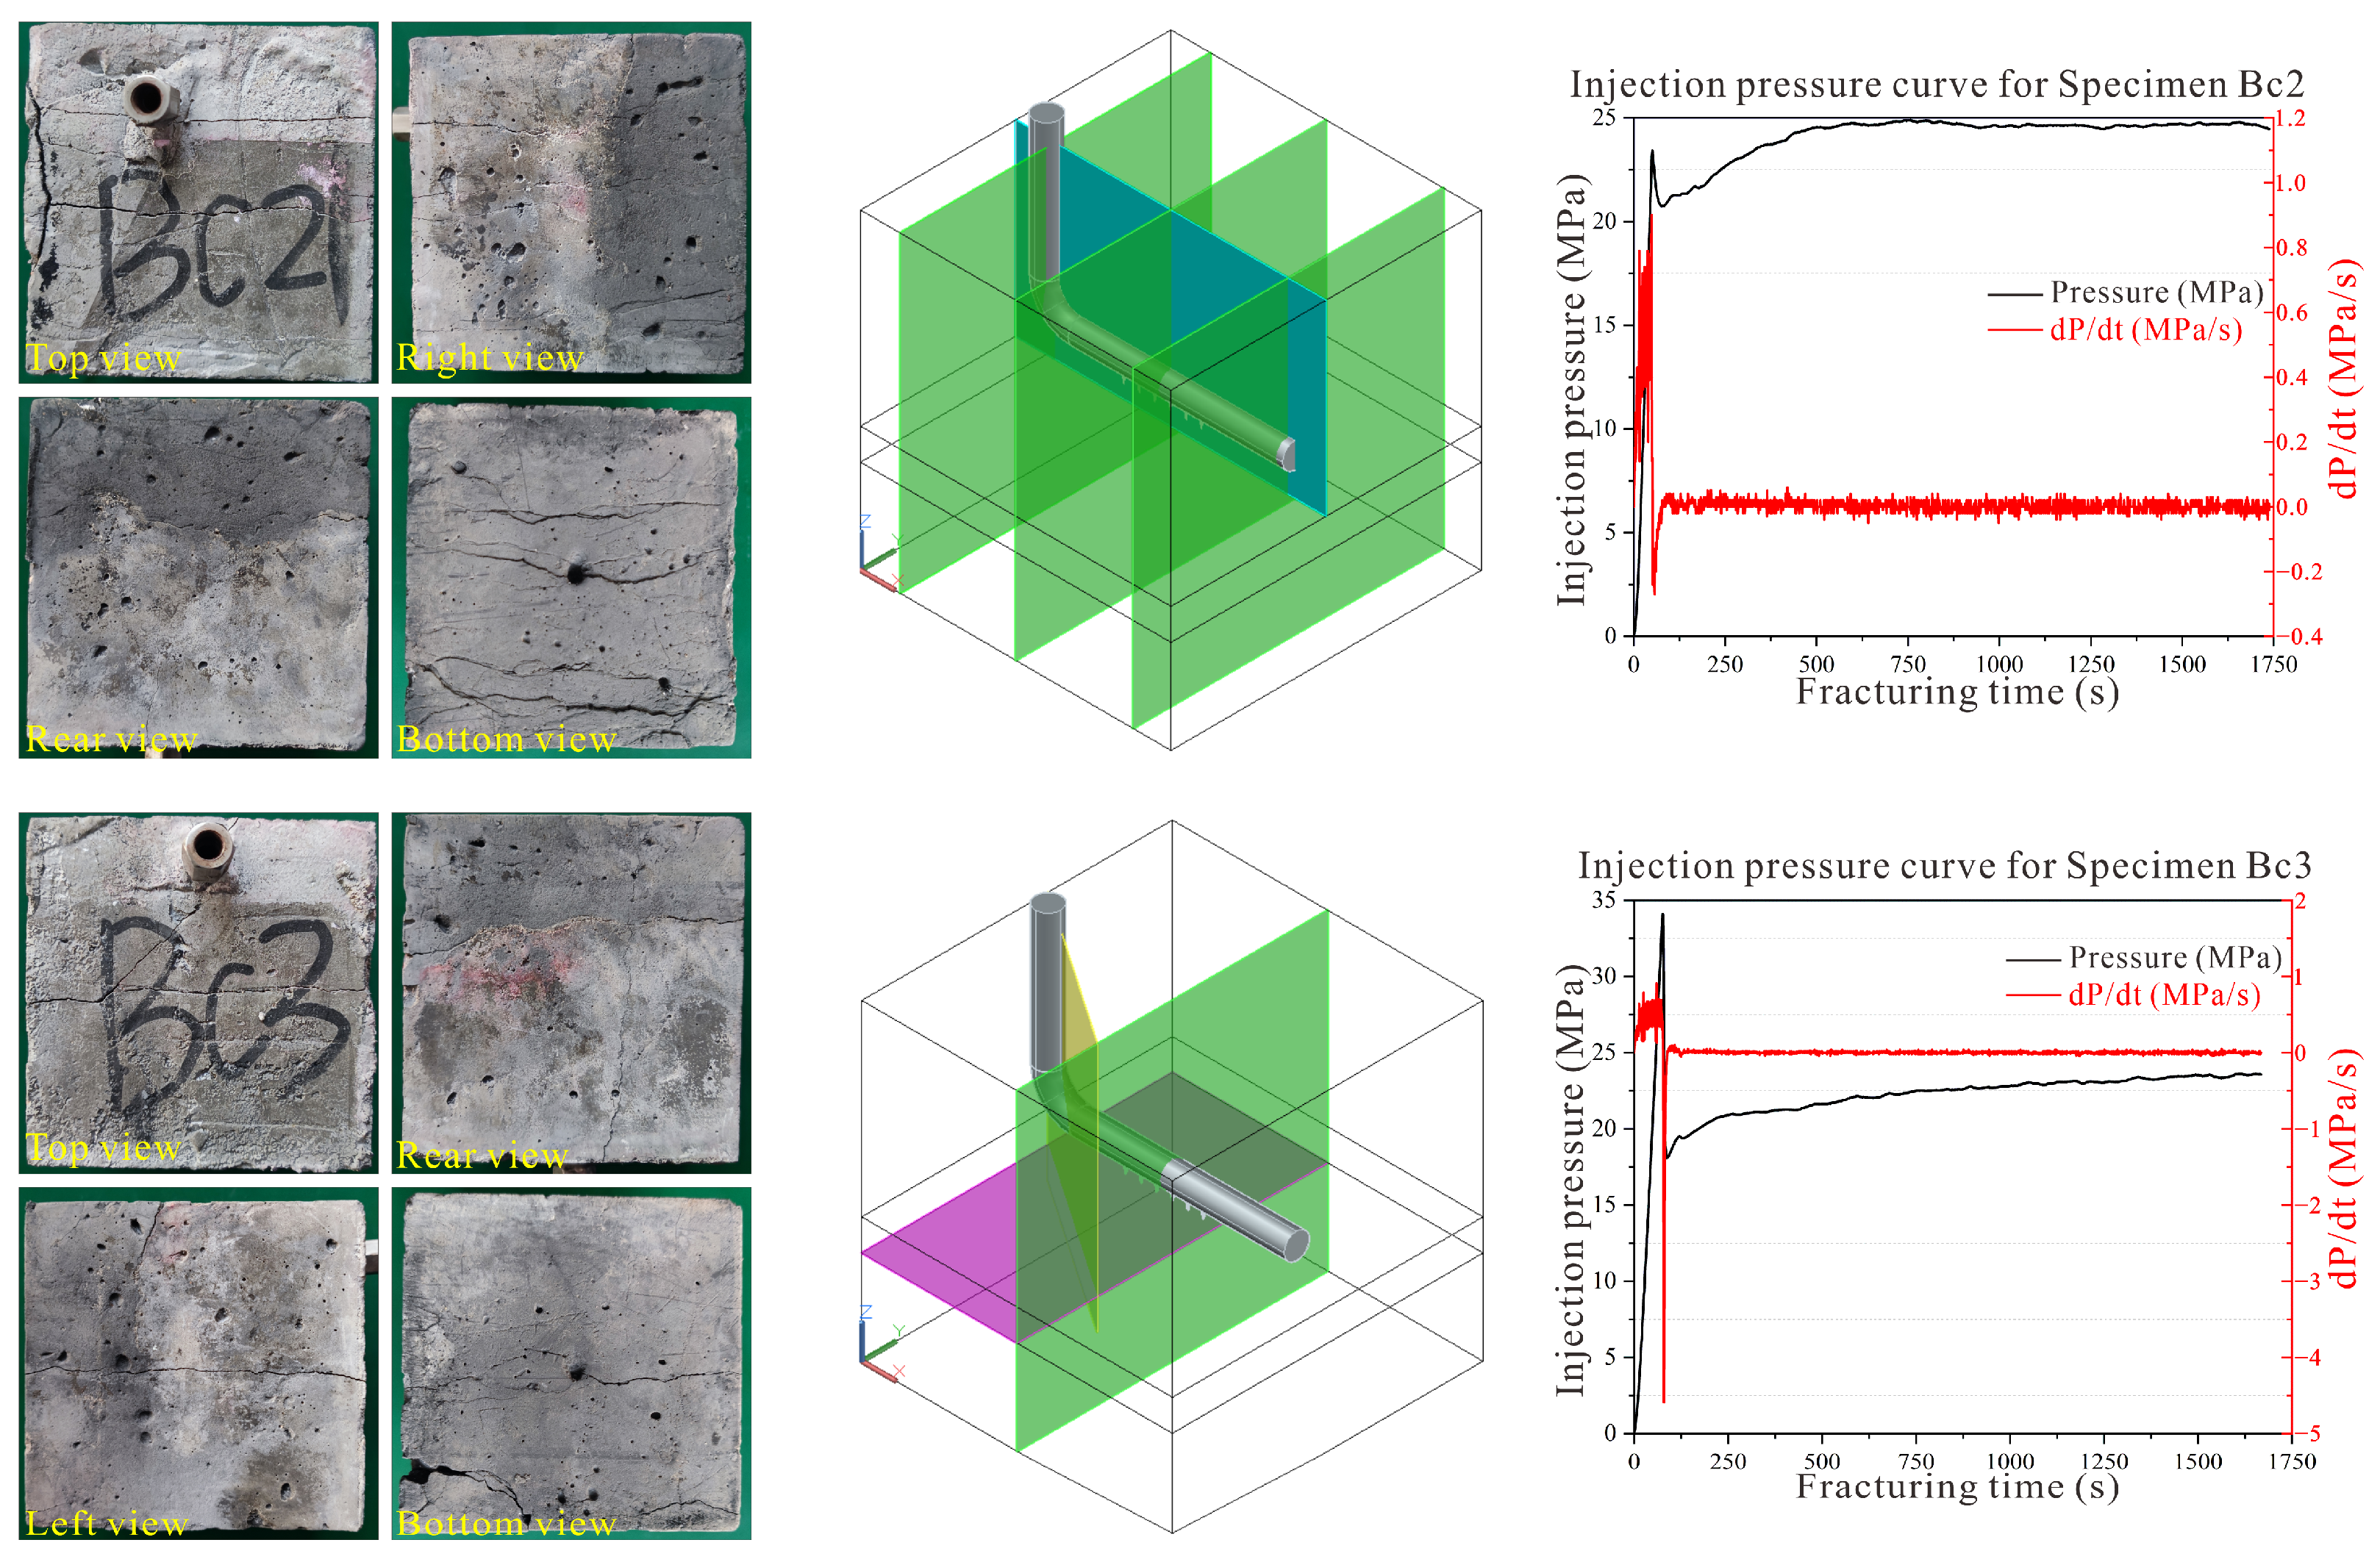
Four photographs of Specimen Bc2 after the hydraulic fracturing test and the reconstructed three-dimensional fracture geometric diagram show that the fractured Specimen Bc2 is dominated by abundant transverse fractures which initiated from the wellbore and propagated toward specimen boundaries (Figure 14). Besides, a minor longitudinal fracture formed along the horizontal wellbore, which is restricted in the roof. Correspondingly, the injection pressure spiked rapidly to a breakdown peak of ~23.5 MPa with a sharp positive dP/dt pulse in the initial stage, and then declined abruptly after specimen fracturing (Figure 14). In the subsequent long stable extension phase, the injection pressure slowly rose and oscillated near 25 MPa, accompanied by mild zero-centered fluctuations of dP/dt, which corresponded to the slow and steady expansion of transverse hydraulic fractures under continuous fluid injection (Figure 14).
The post-fracturing Specimen Bc3 is characterized by a through-going transverse fracture, a horizontal fracture along the coal–roof interface, and an oblique fracture restricted in the roof (Figure 14). At the initial fracturing stage, the injection pressure rapidly rose to a breakdown peak of about 34 MPa accompanied by a sharp spike of dP/dt, and then dropped drastically once the specimen fractured (Figure 14). During the subsequent long-term stable propagation stage, the injection pressure rose slowly and oscillated steadily near 22.5 MPa, with the dP/dt curve maintaining slight small-amplitude fluctuations around zero.

4. Discussion

To systematically clarify the controlling effects of three key factors—specifically in situ stress regimes, coal–roof interface strength, and roof mechanical properties—on the cross-layer propagation behavior of hydraulic fractures, we conducted a statistical analysis of the test data from 15 specimens in this section. In accordance with the specimen coding rules (where roof types are classified as Type A and Type B, coal–roof interface strength as Type a, Type b, and Type c, and in situ stress regimes as Type 1, Type 2, and Type 3, we sorted and classified the cross-layer propagation results of hydraulic fractures, as detailed in Table 13.
In this study, we selected two core indicators—the success rate of fracture cross-layer propagation and the average fracture initiation pressure—to quantitatively characterize the fracture propagation characteristics under different geological conditions. Successful fracture cross-layer propagation is simply defined as a fracture that penetrates the coal-roof interface and extends into the coal seam. We usually determine whether fractures can successfully cross the coal-rock interface into the coal seam by observing the four side views and the bottom view of the specimen after fracturing. We constructed biaxial composite diagrams to quantitatively compare the differences in fracture cross-layer propagation success rates and average fracture initiation pressures corresponding to each of the three factors. This characterization will provide reliable data support for subsequent mechanism analysis and the proposal of engineering application suggestions.

4.1. In Situ Stress Regime

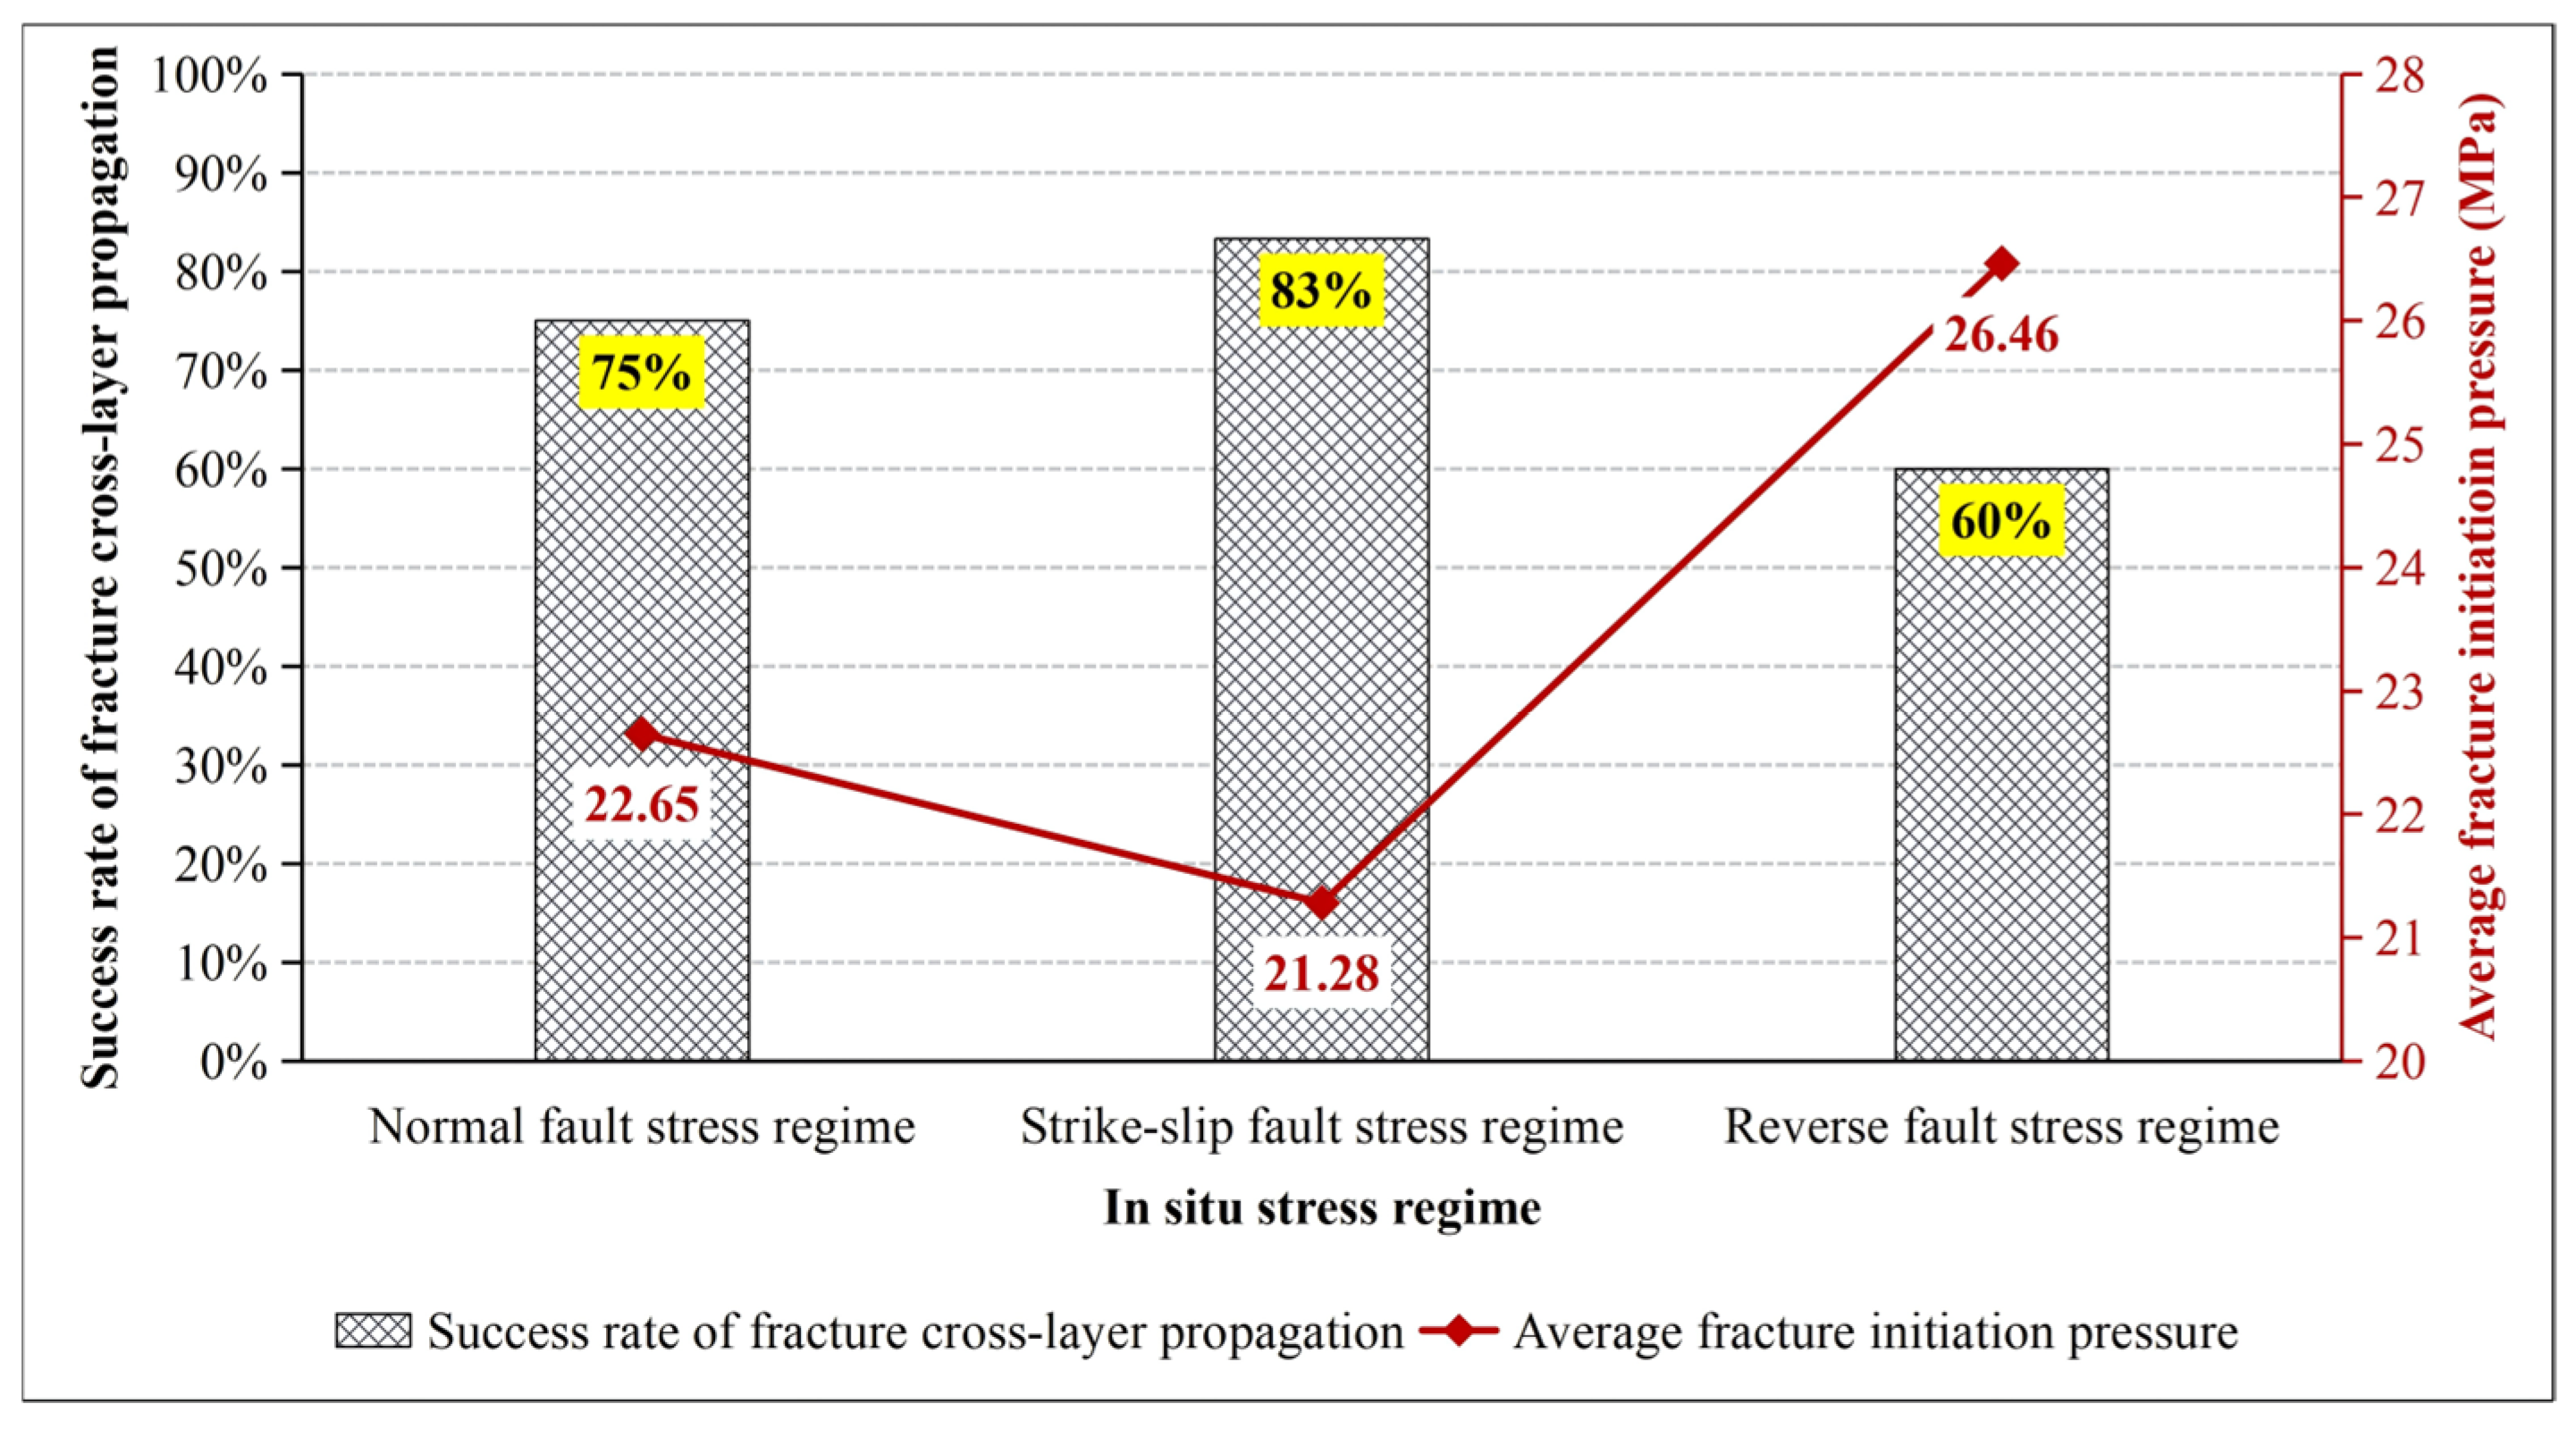
The in situ stress field is the core factor controlling the initial fracture initiation direction and propagation plane of hydraulic fracturing [21,29,30,31,35]. As shown in Figure 15, the success rate of fracture cross-layer propagation and the average initiation pressure are significantly different under three different in situ stress regimes. Under the strike-slip fault stress regime, hydraulic fractures exhibit the maximum cross-layer propagation success rate of 83%, accompanied by the minimum average fracture initiation pressure of 21.28 MPa (Figure 15). For the normal fault stress regime, the fracture cross-layer propagation success rate reaches 75%, with an average initiation pressure of 22.65 MPa (Figure 15). In contrast, the reverse fault stress regime yields the lowest fracture cross-layer breakthrough success rate of 60% and the highest average fracture initiation pressure of 26.46 MPa (Figure 15). Besides, a distinct negative correlation can be identified between cross-layer propagation efficiency and fracture initiation pressure across the three in situ stress regimes: higher probability of fractures penetrating interlayers corresponds to a lower critical pressure required for fracture initiation (Figure 15).
The above rules conform to the basic principles of hydraulic fracturing mechanics: under normal fault and strike-slip fault stress regimes, the directions of the maximum and intermediate principal stresses are both perpendicular to the horizontal wellbore and can provide favorable driving force for fracture propagation in the direction perpendicular to the minimum horizontal principal stress, eventually forming vertical or high-angle transverse fractures, as shown in the post-fracturing Specimens Aa1, Aa2, Ab3, Ac1, Ba2, Bb2, and Bc2. Such fractures are conducive to achieving top-down connectivity between coal roofs and target coal reservoirs.
In contrast, under a reverse fault stress regime, the minimum principal stress manifests as vertical stress, with fractures primarily extending in the horizontal direction to form horizontal fracture planes (as observed in Specimens Aa3, Ac3, Bb3, and Bc3). However, in Specimens Aa3, Bb3, and Bc3, in addition to the horizontal fractures, the transverse fractures perpendicular to the horizontal wellbore are also developed, which can connect coal seams to a certain extent. These transverse fractures are formed mainly because the maximum horizontal principal compressive stress (15 MPa) is markedly larger than the intermediate (8 MPa) and minimum (6 MPa) principal stresses, while the magnitudes of the intermediate and minimum principal stresses are roughly equivalent. Figure 15 demonstrates that the average fracture initiation pressure under the reverse fault stress regime reaches 26.46 MPa, indicating that fracture initiation requires overcoming significantly higher energy barriers. The formation of horizontal fractures under the reverse fault stress regime severely hinders fracture penetration into coal seams, leading to the lowest success rate of fracture cross-layer propagation (Figure 15).
Notably, the results in Figure 15 indicate that the strike-slip fault stress regime exhibits optimal characteristics in both the success rate of fracture cross-layer propagation and the average fracture initiation pressure. This phenomenon is closely related to the moderate stress difference under strike-slip stress conditions. A moderate stress difference can provide sufficient driving force for fracture penetration, while avoiding the problem of inducing single long fractures due to excessive stress difference in the normal fault stress regime; therefore, the strike-slip fault stress regime promotes the formation of complex fracture networks (as demonstrated in Specimens Aa2, Ba2, and Bc2), and achieves better reservoir stimulation effects.
In summary, when designing hydraulic fracturing schemes for horizontal wells in coal seam roofs, comprehensive consideration should be given to three key indicators: the success rate of fracture cross-layer propagation, the average initiation pressure, and the complexity of fracture networks. When evaluating target intervals based on these three aspects, those controlled by the strike-slip fault stress regime should be prioritized first, followed by intervals controlled by the normal fault stress regime, while target intervals controlled by the reverse fault stress regime hold the lowest priority.

4.2. Coal–Roof Interface Strength

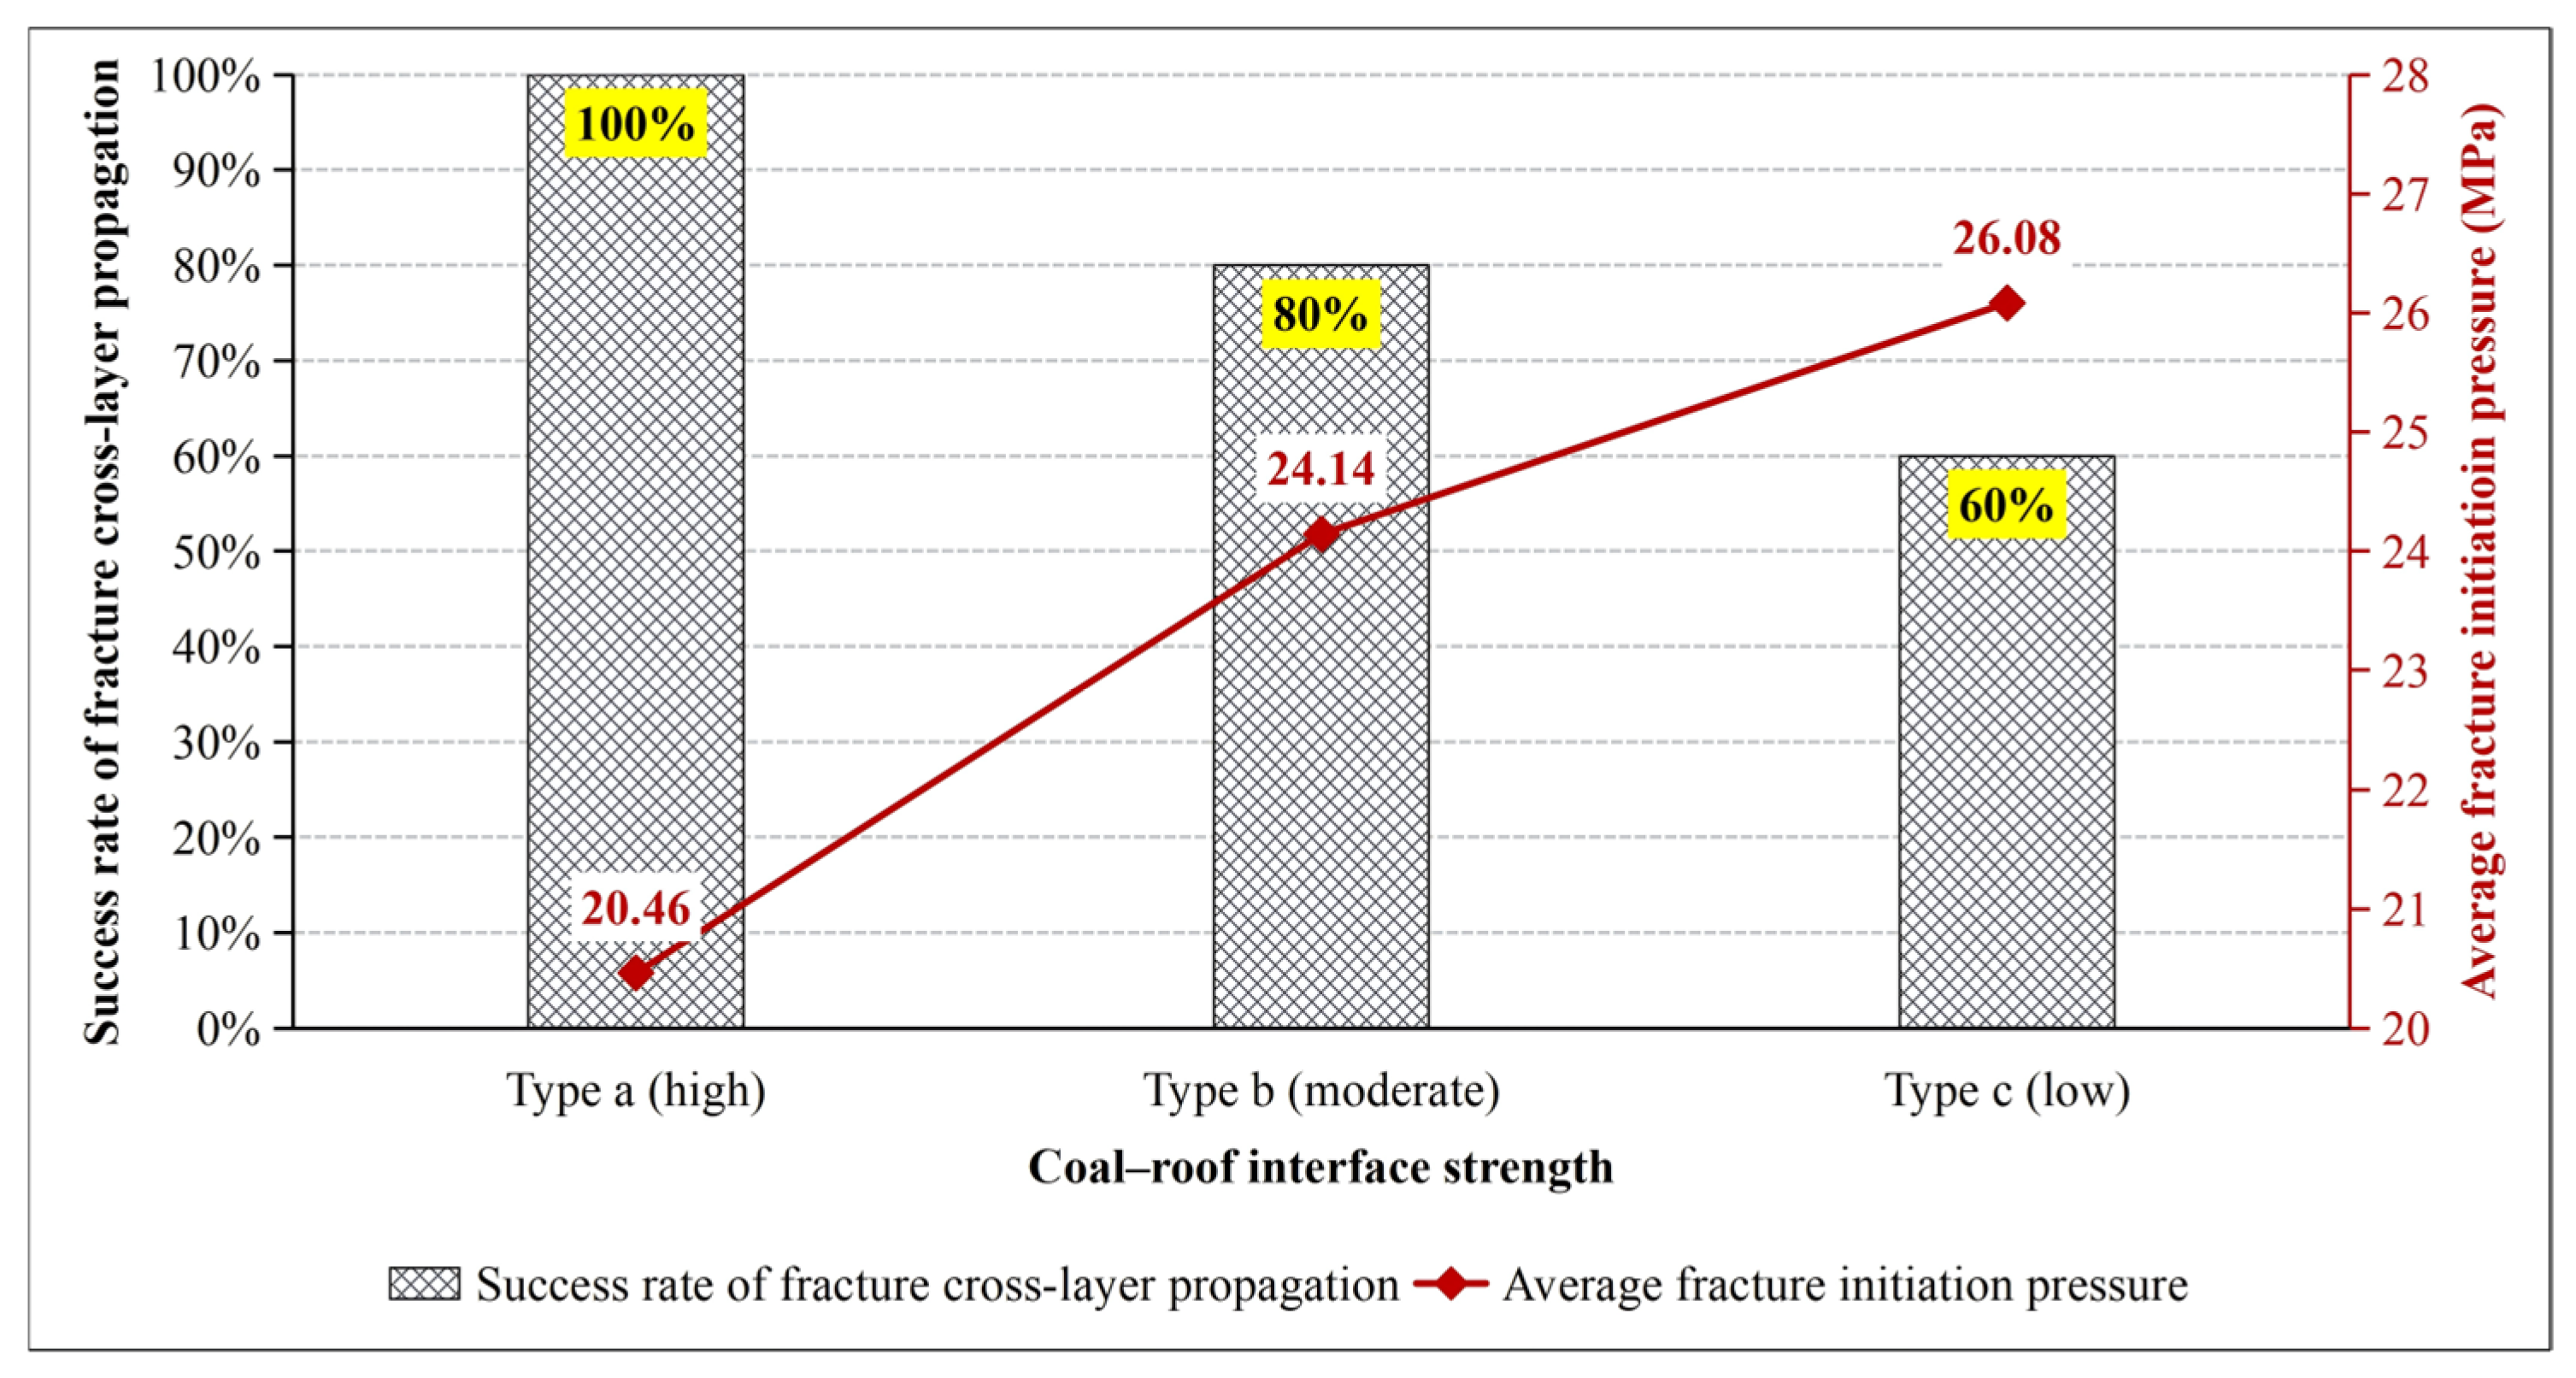
The coal–roof interface constitutes a mechanically weak zone between roof strata and coal seams, and its cementation strength is a critical factor controlling the cross-layer propagation behavior of fractures [30,35,36,37,38]. As illustrated in Figure 16, for coal–roof interfaces with high cementation strength (Type a), the success rate of fracture cross-layer propagation reaches 100%, accompanied by the lowest average fracture initiation pressure of 20.46 MPa. When the interface strength is at a moderate level (Type b), the success rate of cross-layer penetration of hydraulic fractures decreases to 80%, while the average initiation pressure rises to 24.14 MPa (Figure 16). In the case of low-strength coal–roof interfaces (Type c), only 60% of fractures can propagate across the coal–roof interface, and the average initiation pressure reaches the maximum value of 26.08 MPa (Figure 16).
The above analysis reveals the controlling mechanism of coal–roof interface strength on the propagation behavior of hydraulic fractures. A high-strength coal–roof interface possesses strong interfacial cementation and high interfacial tensile strength [36,37]. When hydraulic fractures encounter the interface, the fluid-driven tensile stress is more likely to break through the intact interlayer rock matrix rather than slip along the interface [37]. Thus fractures readily extend across the coal–roof boundary (as shown in Specimens Aa1, Aa2, Aa3, Ba2, and Ba3), leading to a 100% fracture cross-layer success rate for Type a. In contrast, low-strength coal–roof interfaces contain abundant microcracks and weak cementation. Once fracture fluid contacts this weak plane, interfacial slippage and shear debonding occur preferentially before the fracture can penetrate the roof strata, forming a near-horizontal fracture surface. Most fractures are arrested or deflected along the interface instead of propagating vertically across interlayers (as shown in Specimens Ac2 and Ac3), which explains the merely 60% fracture cross-layer success rate of Type c.
A plausible speculation is that high-strength coal–roof interfaces provide tight mineral cementation, which suppresses interfacial shear slippage and fluid leak-off. Hydraulic fractures easily penetrate the interlayer matrix at low initiation pressure, yielding full cross-layer propagation. With the decrease in interfacial bonding strength, weak planes develop along the coal–roof interface. Fractures tend to deflect or be trapped at the interface rather than cross layers, lowering breakthrough efficiency. Meanwhile, severe fluid loss into interfacial microdefects increases the critical pressure needed to drive vertical fracture growth, hence the continuous rise of average fracture initiation pressure.

4.3. Roof Mechanical Properties

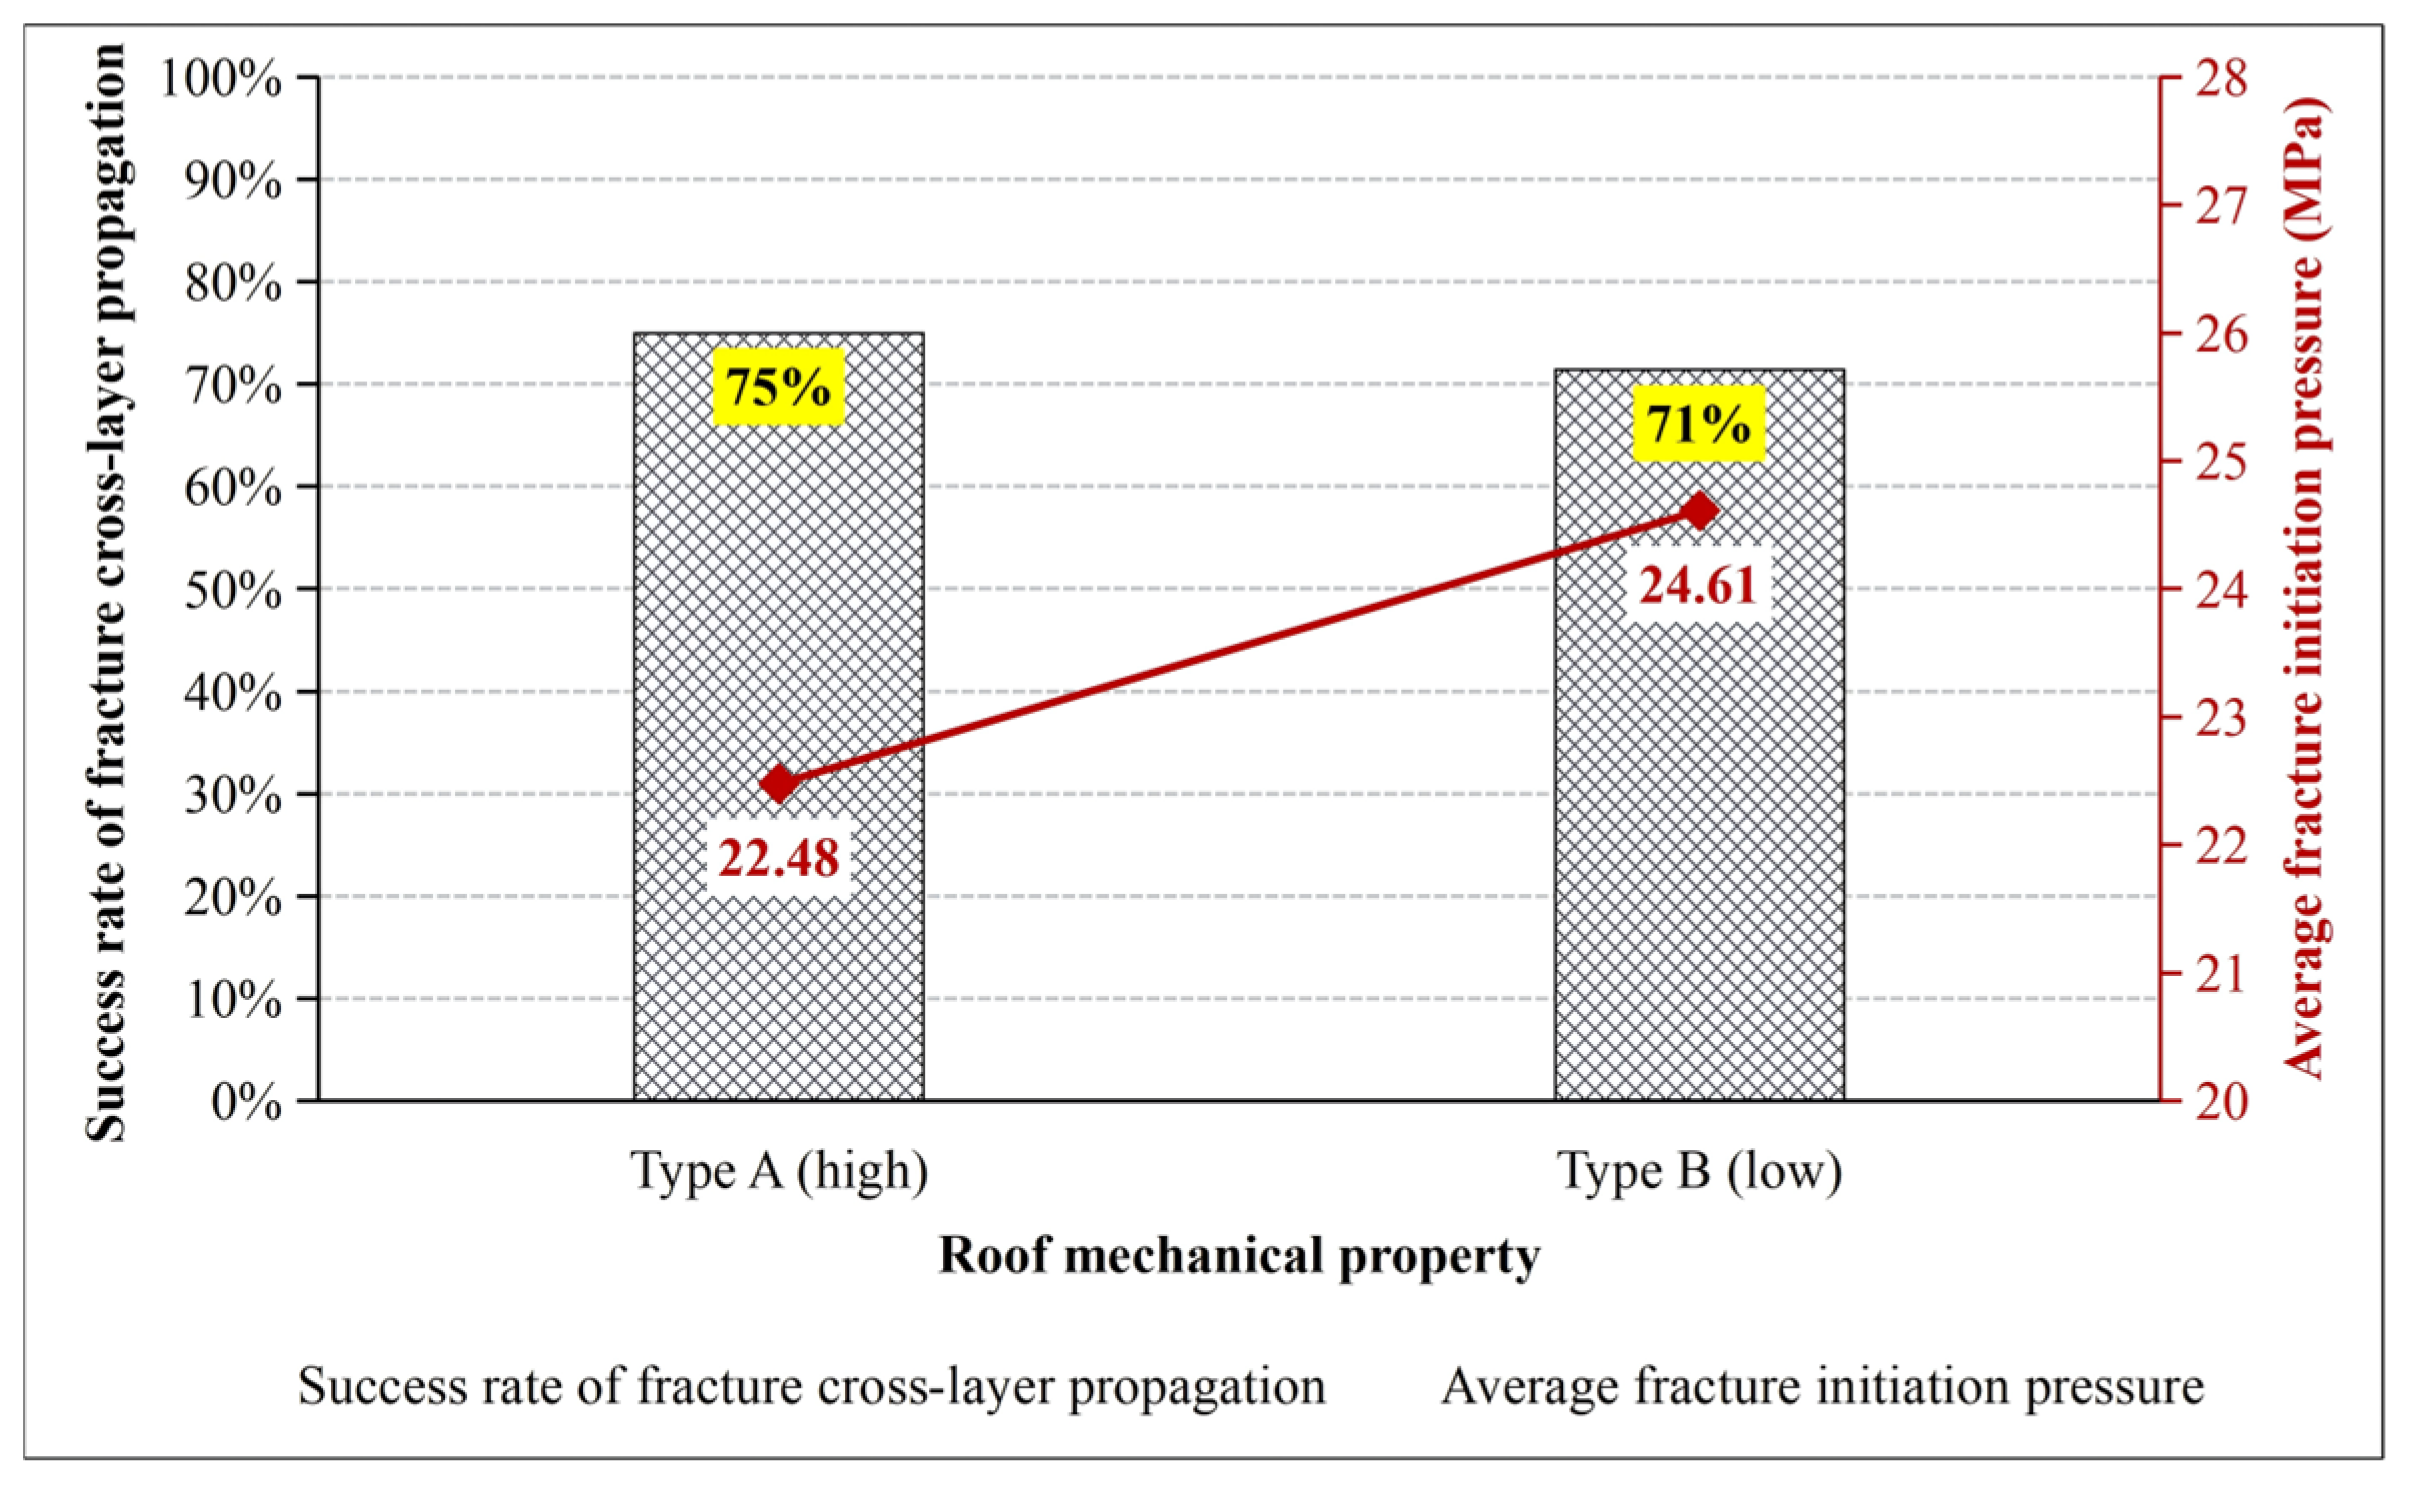
The mechanical properties of roof rocks significantly influence fracture initiation pressure, propagation paths, and final morphology [27,37]. Type A roof has a higher cement content than Type B, which brings greater overall mechanical strength and a denser rock matrix (Table 5). As illustrated in Figure 17, for Type A roof with high-strength mechanical properties, the success rate of fracture cross-layer propagation reaches 75%, coupled with a relatively low average fracture initiation pressure of 22.48 MPa. When the roof rock changes to Type B with low strength, the success rate of fracture cross-layer propagation drops slightly to 71% (Figure 17). Meanwhile, the average fracture initiation pressure increases remarkably to 24.61 MPa (Figure 17).
The difference in the success rate of fracture cross-layer propagation under different types of roof strata can be explained from the perspective of roof mechanical properties. When hydraulic fractures initiate in the roof strata, the compact, high-strength matrix of Type A roof maintains uniform stress transfer. The rock matrix itself bears tensile stress evenly, and there is less obstruction to the formation of penetrating vertical fractures; thus, a higher cross-layer breakthrough success rate (75%) is achieved. For low-strength Type B roof, more inherent microdefects act as natural weak planes. Stress preferentially concentrates on these pores and microcracks after fracturing fluid is injected. Fractures tend to branch, deflect, or terminate along these pre-existing voids rather than propagating vertically through the entire roof layer, which slightly reduces the cross-layer propagation success rate to 71%.
Fracture initiation pressure represents the critical fluid pressure required to overcome rock tensile resistance and drive vertical penetration. The dense, high-strength matrix of Type A roof has continuous load-bearing frameworks with few fluid leakage channels. Less pumping pressure is consumed by fluid leak-off into internal pores, so the average initiation pressure remains at a low level of 22.48 MPa. The porous, weakly bonded matrix of Type B roof provides numerous seepage pathways for fracturing fluid. Substantial fluid loss occurs inside the roof strata during injection, which dissipates pumping energy. Additional fluid pressure must be supplied to compensate for leak-off loss and build sufficient tensile stress to cross the coal–roof interface, leading to a remarkably elevated average fracture initiation pressure of 24.61 MPa.
In summary, roof rocks with higher cement content and high mechanical strength create favorable conditions for fracture vertical propagation with lower critical initiation pressure. Reduced cement content weakens rock matrix integrity, slightly restricts fracture cross-layer growth and significantly raises the pressure threshold for fracture initiation.

4.4. Engineering Implications for Hydraulic Fracturing in Horizontal Wells

Based on the comprehensive analysis of the above experimental results, the ultimate fracture morphology and cross-layer propagation behavior induced by hydraulic fracturing are fundamentally governed by the synergistic coupling of three controlling factors: in situ stress regimes, coal–roof interface strength, and roof mechanical properties. The results presented in Figure 15, Figure 16 and Figure 17 collectively elucidate the framework of multi-factor hierarchical coupled control: in situ stress regimes establish the macroscopic structural basis for hydraulic fracture propagation and define the overall propagation orientation of fractures, i.e., vertical or horizontal fractures; the cementation strength of the coal–roof interface microscopically dominates the selection of fracture propagation pathways at key locations (cross-layer propagation or interface deflection); and the mechanical properties of the roof further modulate the propagation complexity of hydraulic fractures, thereby controlling the development of either simple or complex fracture assemblages.
To achieve efficient stimulation of soft and low-permeability coal seams, it is required to establish optimal coupling conditions in accordance with the aforementioned graphical analysis. The specific conditions are summarized as follows: fracturing operations should be implemented under normal fault or strike-slip fault stress regimes, as the success rate of fracture cross-layer propagation in this context ranges from 75% to 83.3% (Figure 10). When well-cemented high-strength coal–roof interfaces are encountered, the fracture cross-layer propagation success rate of Type A interfaces reaches 100% (Figure 16). For fracturing projects that take fracture penetration as the core objective, roofs with higher mechanical strength are recommended, since Type A roofs exhibit stronger fracture penetration capacity as demonstrated in Figure 17. When the construction target is to generate complex fracture networks, roofs with relatively lower mechanical strength should be selected, as Type B roofs are more favorable for the development of complex fracture systems.

5. Conclusions

Based on true triaxial physical simulation experiments, this paper explores the hydraulic fracture cross-layer propagation law controlled by in situ stress regimes, coal–roof interface strength, and roof mechanical properties. Biaxial composite charts are plotted to compare fracture cross-layer propagation success rates and average initiation pressures, and their multi-factor coupling control mechanisms are summarized:
In situ stress regimes dominate fracture cross-layer propagation behavior and initiation pressure. The strike-slip fault stress regime achieves the optimal effect with an 83% cross-layer success rate and the lowest average initiation pressure, conducive to forming complex fracture networks. The normal fault stress regime presents moderate performance, while the reverse fault stress regime mainly produces horizontal fractures, restricting vertical penetration with the lowest success rate of 60% and the highest average initiation pressure.
Coal–roof interface strength positively affects fracture cross-layer capacity. High-strength coal–roof interfaces realize 100% penetration by suppressing interfacial slippage and fluid leak-off, whereas declining interface strength induces fracture deflection, reducing penetration rates to 80% and 60% for moderate- and low-strength interfaces with rising average initiation pressure.
High-strength roof rocks facilitate vertical fracture growth. High-strength roofs ensure stable vertical fracture propagation with a 75% cross-layer success rate. Low-strength roofs with abundant microdefects slightly reduce penetration efficiency to 71% and significantly increase fluid loss and initiation pressure.
The three factors exert hierarchical coupling control. In situ stress regimes control macroscopic fracture orientation, coal–roof interface strength determines microscopic propagation paths, and roof mechanical properties adjust fracture complexity. Favorable in situ stress conditions, high-strength coal–roof interfaces and matched roof types can effectively guide field fracturing construction.

Author Contributions

Conceptualization, X.C.; methodology, L.S.; software, X.C.; validation, Y.L., Y.C. and X.F.; formal analysis, X.C. and L.S.; investigation, X.C.; resources, L.P. and X.W.; data curation, X.C.; writing—original draft preparation, X.C. and L.S.; writing—review and editing, X.C., Y.L., D.L. and R.L.; supervision, R.L.; funding acquisition, X.C. and R.L. All authors have read and agreed to the published version of the manuscript.

Funding

This research was funded by the Excellent Youth Project of Anhui Provincial Department of Education (Grant No. 2022AH030136), the Doctoral Research Initiation Fund of Suzhou University (Grant No. 2023BSK063), the 2025 Anhui Provincial College Students’ Innovation and Entrepreneurship Training Program (Grant No. S202510379074), and the Geological Survey Foundation of Guizhou Province (Grant No. 52000024P0048BH10174M). The APC was funded by the Excellent Youth Project of the Anhui Provincial Department of Education (Grant No. 2022AH030136).

Data Availability Statement

The original contributions presented in this study are included in the article. Further inquiries can be directed to the corresponding author.

Acknowledgments

The authors would like to sincerely thank the three anonymous reviewers for their valuable comments and constructive suggestions, which greatly improved the quality of this manuscript. We also thank Yu Zhang from the China University of Petroleum for their assistance with specimen preparation and implementation of experimental procedures. During the preparation of this manuscript, the authors adopted WPS for language polishing and grammatical error checking. The authors have reviewed and edited the output and take full responsibility for the content of this publication.

Conflicts of Interest

Authors Lihua Ping and Xiuping Wu were employed by the Jiangsu Bureau of Coal Geology. Authors Yi Chen, Xia Feng and Ruiqin Lin were employed by the Guizhou Engineering Research Institute of Oil & Gas Exploration and Development and the Key Laboratory of Unconventional Natural Gas Evaluation and Development in Complex Tectonic Areas. The remaining authors declare that the research was conducted in the absence of any commercial or financial relationships that could be construed as potential conflicts of interest.

References

  1. Guo, T.; Zhou, Y.; Jin, X.; Gao, X.; Peng, X. Primary geological characteristics, advances in exploration and production, and strategies of coalbed methane in South China. Coal Geol. Explor. 2025, 53, 44−53, (In Chinese with English Abstract). [Google Scholar]
  2. Wang, B.; Hou, E.; Ma, L.; Liu, Z.; Fan, T.; Gong, Z.; Gao, Y.; Du, W.; Liu, Q.; Ma, B. Research on the Law of Layered Fracturing in the Composite Roof Strata of Coal Seams via Hydraulic Fracturing. Energies 2024, 17, 1941. [Google Scholar] [CrossRef] [Scilit]
  3. Cheng, Y.; Lei, Y. Causality between tectonic coal and coal and gas outbursts. J. China Coal Soc. 2021, 46, 180–198, (In Chinese with English Abstract). [Google Scholar]
  4. Zhang, Z.; Ren, J.; Zhao, Y.; Wang, M.; Yang, J.; Zhang, C. Geological Characteristics of Low-Yield and Low-Efficiency CBM Wells and Practical Measures for Production Increase in the Qinshui Basin. ACS Omega 2023, 8, 47530–47539. [Google Scholar] [CrossRef] [Scilit] [PubMed]
  5. Li, L.; Liu, D.; Cai, Y.; Wang, Y.; Jia, Q. Coal Structure and Its Implications for Coalbed Methane Exploitation: A Review. Energy Fuels 2021, 35, 86–110. [Google Scholar] [CrossRef] [Scilit]
  6. Xu, Y. Developing Coalbed Methane in Broken-Soft Coal Seam by Virtual Reservoir Horizontal Wells: A Case Study of Luling Field in Huaibei Mining Area, East China. In Proceedings of the International Field Exploration and Development Conference 2018; Springer: Singapore, 2020. [Google Scholar]
  7. Xu, Y.; Zhu, Y.; Zhang, P. Application of CBM Horizontal Well Development Technology in the Roof Strata Close to Broken-Soft Coal Seams. Nat. Gas Ind. B 2019, 6, 168–174. [Google Scholar] [CrossRef] [Scilit]
  8. Qian, C. Research on Anti-Reflection Technology of Coal Seam by Hydraulic Fracturing. Archit. Eng. Sci. 2025, 6, 194–196. [Google Scholar] [CrossRef] [Scilit]
  9. Yuan, W.; Zheng, X.; Shahani, N.M. Optimization of Indirect Fracturing Process Parameters Based on Mechanical Properties of Fractured and Low-Permeability Coal. Geofluids 2022, 2022, 7436051. [Google Scholar] [CrossRef] [Scilit]
  10. Li, H.; Liang, W.; Jiang, Y.; Wu, P.; Wu, J.; He, W. Numerical Study on the Field-Scale Criterion of Hydraulic Fracture Crossing the Interface Between Roof and Broken Low-Permeability Coal. Rock Mech. Rock Eng. 2021, 54, 4543–4567. [Google Scholar] [CrossRef] [Scilit]
  11. Han, W.; Wang, Y.; Li, Y.; Ni, X.; Wu, X.; Wu, P.; Zhao, S. Recognizing Fracture Distribution within the Coalbed Methane Reservoir and Its Implication for Hydraulic Fracturing: A Method Combining Field Observation, Well Logging, and Micro-Seismic Detection. J. Nat. Gas Sci. Eng. 2021, 92, 103986. [Google Scholar] [CrossRef] [Scilit]
  12. Fu, W.; Deng, Q.; Ge, Z.; Jia, Y.; Ma, Z.; Shang, C.; Zheng, J.; Hou, Y. Numerical Investigation of Tree-Type Hydraulic Fracturing for Balanced Permeability Enhancement of Heterogenous Coal Seams Based on the Finite-Discrete Element Method Model. ACS Omega 2024, 9, 22090–22101. [Google Scholar] [CrossRef] [Scilit] [PubMed]
  13. Shang, Z.; Wang, Z.; Cheng, Z.; Wang, H.; Chen, L.; Li, L.; Fu, J.; Liu, H. Permeability Enhancement Technology for Soft and Low-Permeability Coal Seams Combined with Hydraulic Perforation and Hydraulic Fracturing. Geofluids 2022, 2022, 7958712. [Google Scholar] [CrossRef] [Scilit]
  14. Zhou, A.; He, Y.; Wang, K.; Li, B.; Wang, Y.; Yang, X. Hydraulic fracture propagation in soft coal composite reservoirs: Mechanical responses and energy dissipation mechanisms. Int. J. Min. Sci. Technol. 2025, 35, 573–588. [Google Scholar] [CrossRef] [Scilit]
  15. Zhu, D.; Li, W.; Niu, D.; Xiao, H.; Song, X. Propagation Law of Hydraulic Fracture across the Coal–Rock Interface under the Co-Effect of Natural Fractures and Tectonic Stress. Processes 2023, 11, 1951. [Google Scholar] [CrossRef] [Scilit]
  16. Wu, L.; Zhang, Y.; Di, S.; Tao, Z.; Liu, Z. Study of Fracture Propagation Mechanism of Horizontal Well Fracturing in Roof of Coal Seams. J. Energy Eng. 2024, 150, 04024029. [Google Scholar] [CrossRef] [Scilit]
  17. Huang, L.; Deng, L.; Wu, A.; Du, F.; Wang, X.; Qian, L.; Lu, K. Investigating hydraulic fracture penetration in soft-hard interlayer coal measures with perforated completion. Eng. Fract. Mech. 2025, 327, 111467. [Google Scholar] [CrossRef] [Scilit]
  18. Zhu, S.; Zhou, X.; Zhao, F.; Wu, J.; Han, S.; Zhao, L.; Zhou, P.; Wang, J.; Yang, Z. Effects of Microstructure on Hydraulic Fracturing and Gas–Water Production in Coal Reservoirs: A Case Study of the Dahebian Coalbed Methane Block in Western Guizhou, China. Energy Sci. Eng. 2024, 12, 3110–3125. [Google Scholar] [CrossRef] [Scilit]
  19. Hu, Q.; Liu, L.; Li, Q.; Wu, Y.; Wang, X.; Jiang, Z.; Yan, F.; Xu, Y.; Wu, X. Experimental Investigation on Crack Competitive Extension during Hydraulic Fracturing in Coal Measures Strata. Fuel 2020, 265, 117003. [Google Scholar] [CrossRef] [Scilit]
  20. Lu, C.; Ge, Z.; Deng, Q.; Zhou, Z.; Niu, Z.; Duan, S. Hydraulic fracture propagation in coal-bearing formations: The role of interface friction effects with field data and injection strategy. J. Rock Mech. Geotech. Eng. 2026, in press. [Google Scholar] [CrossRef] [Scilit]
  21. Zhao, H.; Li, P.; Li, X.; Yao, W. Fracture Propagation and Evolution Law of Indirect Fracturing in the Roof of Broken Soft Coal Seams. Int. J. Coal Sci. Technol. 2024, 11, 4. [Google Scholar] [CrossRef] [Scilit]
  22. Lei, Y.; Ju, Y.; Zheng, Y.; Peng, X. A Novel Gas Extraction Technique in Coal Seams Utilizing Hydraulic Fracturing-Dissolution and Analysis of Non-Uniform Propagation of Fracture. Energy Sci. Eng. 2025, 13, 2842–2855. [Google Scholar] [CrossRef] [Scilit]
  23. Li, L.; Ma, S.; Liu, X.; Liu, J.; Lu, Y.; Zhao, P.; Kassabi, N.; Hamdi, E.; Elsworth, D. Coal Measure Gas Resources Matter in China: Review, Challenges, and Perspective. Phys. Fluids 2024, 36, 071301. [Google Scholar] [CrossRef] [Scilit]
  24. Wu, P.; Wang, J.; Luo, X.; Mo, R.; Hu, Y.; He, W. Experimental Investigation on the Propagation of Hydraulic Fractures through Coal-Rock Interfaces. Adv. Mater. Sci. Eng. 2021, 2021, 8504402. [Google Scholar] [CrossRef] [Scilit]
  25. Wu, X.P. Research on Control Mechanism of Fracture Propagation of Multi-stage Hydraulic Fracturing Horizontal Well in Roof of Broken Soft and Low Permeable Coal Seam. Ph.D. Thesis, China Coal Research Institute, Beijing, China, 2017. [Google Scholar]
  26. Li, D.; Zhang, S.; Zhang, S. Expansion Mechanism of through strata fractured cracks in coalbed methane horizontal wells. Coal Sci. Technol. 2016, 44, 84–88, (In Chinese with English Abstract). [Google Scholar]
  27. Li, Y.; Chen, T.; Ma, X.; Wu, X. Extension mechanism and influencing factors of indirect fracturing fractures on coal seam roof. Coal Sci. Technol. 2024, 52, 171–182, (In Chinese with English Abstract). [Google Scholar]
  28. Hao, S.; Zhang, J.; Chen, R.; Jing, Y. Optimization simulation of fracturing parameters under different soft/hard coal + surrounding rocks in Yuwu Mine. Saf. Coal Mines 2025, 56, 34–42, (In Chinese with English Abstract). [Google Scholar]
  29. Tan, P.; Jin, Y.; Han, K.; Zheng, X.; Hou, B.; Gao, J.; Chen, M.; Zhang, Y. Vertical Propagation Behavior of Hydraulic Fractures in Coal Measure Strata Based on True Triaxial Experiment. J. Pet. Sci. Eng. 2017, 158, 398–407. [Google Scholar] [CrossRef] [Scilit]
  30. Jiang, Y.; Lian, H.; Nguyen, V.P.; Liang, W. Propagation behavior of hydraulic fracture across the coal-rock interface under different interfacial friction coefficients and a new prediction model. J. Nat. Gas Sci. Eng. 2019, 68, 102894. [Google Scholar] [CrossRef] [Scilit]
  31. Wan, L.; Hou, B.; Tan, P.; Chang, Z.; Muhadasi, Y. Observing the Effects of Transition Zone Properties on Fracture Vertical Propagation Behavior for Coal Measure Strata. J. Struct. Geol. 2019, 126, 69–82. [Google Scholar] [CrossRef] [Scilit]
  32. Xia, B.; Zhou, Y.; Zhang, X.; Zhou, L.; Ma, Z. Physical and Numerical Investigations of Target Stratum Selection for Ground Hydraulic Fracturing of Multiple Hard Roofs. Int. J. Min. Sci. Technol. 2024, 34, 699–712. [Google Scholar] [CrossRef] [Scilit]
  33. Fu, H.; Huang, L.; Hou, B.; Weng, D.; Guan, B.; Zhong, T.; Zhao, Y. Experimental and Numerical Investigation on Interaction Mechanism Between Hydraulic Fracture and Natural Fracture. Rock Mech. Rock Eng. 2024, 57, 10571–10582. [Google Scholar] [CrossRef] [Scilit]
  34. Cong, R.; Yang, R.; Jing, M.; Li, G.; Huang, Z.; Zhang, B. Experimental Investigation on Hydraulic Fracture Propagation Behaviors of Coal-Measure Thin Interbedded Rocks. Rock Mech. Rock Eng. 2024, 57, 9557–9573. [Google Scholar] [CrossRef] [Scilit]
  35. Tan, P.; Jin, Y.; Xiong, Z.; Mian, C.; Hou, B. Effect of interface property on hydraulic fracture vertical propagation behavior in layered formation based on discrete element modeling. J. Geophys. Eng. 2018, 15, 1542–1550. [Google Scholar] [CrossRef] [Scilit]
  36. Sun, H.; Wang, L.; Zhang, R.; Zhang, X. Criterion for Hydraulic Fracture Propagation Behaviour at Coal Measure Composite Reservoir Interface Based on Energy Release Rate Theory. Geomech. Geophys. Geoenergy Georesour. 2024, 10, 153. [Google Scholar] [CrossRef] [Scilit]
  37. Li, H.; Jiang, Z.; Shu, J.; Fan, Y.; Du, T.L. Numerical simulation of layer-crossing propagation behavior of hydraulic fractures at coal-rock interface. Coal Geol. Explor. 2020, 48, 106–113, (In Chinese with English Abstract). [Google Scholar]
  38. Zhou, L.; Zheng, X.; Lu, Y.; Li, H.; Feng, M. Fracture pattern and caprock integrity analyses via hydraulic fracturing for CO2 enhanced coal bed methane. Eng. Fract. Mech. 2020, 228, 106894. [Google Scholar] [CrossRef] [Scilit]
Figure 1. Three-dimensional perspective illustration of specimens and stress loading orientation, and the six views showing the fracture distribution on specimen surfaces. Three yellow arrows indicate the loading directions of three different in situ stresses.
Processes 14 03198 g001
Figure 2. Photographs of sandstone specimens collected from the roof of No. 82 coal seam in Qidong Coal Mine, northern Anhui Province, before and after rock mechanical tests. Specimens A-1–A-6 were used for triaxial compression tests, specimens B-1 and B-2 for uniaxial compression tests, and specimens B-3 and B-4 for Brazilian splitting tests. The cylindrical specimens are 25 mm in diameter and 50 mm in height. The 2-cm bar in the figure is the scale bar.
Processes 14 03198 g002
Figure 3. Triaxial compression stress–strain curves of sandstone specimens in Figure 2. The deviatoric stress on the ordinate is axial stress minus confining pressure.
Processes 14 03198 g003
Figure 4. Artificial specimens used for triaxial compression tests to characterize the key mechanical parameters of coal roof and coal–roof interface materials. Capital letters A and B indicate different material composition parameters for the coal roof, and lowercase letters a, b, and c indicate different material composition parameters for the coal–roof interface. The 2-cm bar in the figure is the scale bar.
Processes 14 03198 g004
Figure 5. Triaxial compression curves for specimens in Figure 4. The deviatoric stress on the ordinate is axial stress minus confining pressure.
Processes 14 03198 g005
Figure 6. Uniaxial compression (A) and Brazilian splitting (B) stress–strain curves of the coal seam materials in Table 5.
Processes 14 03198 g006
Figure 7. Fracturing specimens with dimensions of 10 cm × 10 cm × 10 cm. These photos correspond to the top view of the 3D schematic diagram in Figure 1. Uppercase and lowercase letters represent the corresponding material ratios for the roof and coal-roof interfaces in Table 5, respectively.
Processes 14 03198 g007
Figure 8. True triaxial hydraulic fracturing physical simulation experiment system and in situ stress loading.
Processes 14 03198 g008
Figure 9. Post-fracturing macroscopic fracture morphology, reconstructed 3D spatial geometry of hydraulic fractures, and temporal curves of injection pressure and dP/dt for Specimens Aa1, Aa2 and Aa3.
Processes 14 03198 g009
Figure 10. Post-fracturing macroscopic fracture morphology, reconstructed 3D spatial geometry of hydraulic fractures, and temporal curves of injection pressure and dP/dt for Specimens Ab1 and Ab3.
Processes 14 03198 g010
Figure 11. Post-fracturing macroscopic fracture morphology, reconstructed 3D spatial geometry of hydraulic fractures, and temporal curves of injection pressure and dP/dt for Specimens Ac1, Ac2, and Ac3.
Processes 14 03198 g011
Figure 12. Post-fracturing macroscopic fracture morphology, reconstructed 3D spatial geometry of hydraulic fractures, and temporal curves of injection pressure and dP/dt for Specimens Ba2 and Ba3.
Processes 14 03198 g012
Figure 13. Post-fracturing macroscopic fracture morphology, reconstructed 3D spatial geometry of hydraulic fractures, and temporal curves of injection pressure and dP/dt for Specimens Bb1, Bb2, and Bb3.
Processes 14 03198 g013
Figure 14. Post-fracturing macroscopic fracture morphology, reconstructed 3D spatial geometry of hydraulic fractures, and temporal curves of injection pressure and dP/dt for Specimens Bc2 and Bc3.
Processes 14 03198 g014
Figure 15. Fracture cross-layer propagation success rate and average fracture initiation pressure under three different in situ stress regimes (normal fault, strike-slip fault and reverse fault stress regimes).
Processes 14 03198 g015
Figure 16. Comparison of the success rate of fracture cross-layer propagation and average fracture initiation pressure under three levels of coal–roof interface strength (Type a: high strength; Type b: moderate strength; Type c: low strength).
Processes 14 03198 g016
Figure 17. Comparison of the success rate of fracture cross-layer propagation and average fracture initiation pressure under two types of roof mechanical properties (Type A: high strength; Type B: low strength).
Processes 14 03198 g017
Table 1. Detailed parameters of physical simulation specimens.
ParameterNumerical Value
Specimen size (cm)10 × 10 × 10
Simulated wellbore diameter (mm)8
Roof thickness (mm)60
Coal–roof interface thickness (mm)10
Coal seam thickness (mm)30
Perforation
parameters
Aperture (mm)1.5
Penetration length (mm)7
Perforation density (number of holes per meter)20
Table 2. Triaxial compression test results of sandstone specimens in Figure 2.
Specimen No.Confining Pressure (MPa)Peak Strength (MPa)Elasticity Modulus (GPa)Poisson’s RatioCohesion (MPa)Internal Friction Angle (°)
A-11066.806.390.3612.0443.12
A-21580.237.360.24
A-32093.997.140.22
A-425108.847.970.20
A-530120.668.360.30
A-635131.658.380.36
Table 3. Uniaxial compression test results of sandstone specimens in Figure 2.
Specimen No.Compressive Strength (MPa)
B-110.34
B-210.57
Table 4. Brazilian tensile strength test results of sandstone specimens in Figure 2.
Specimen No.Maximum Peak Load Pmax (kN)Tensile Strength (MPa)
B-37.043.92
B-48.094.51
Table 5. Material composition parameters of the coal seam roof, the coal–roof interface, and the coal seam.
RoofCoal–Roof InterfaceCoal Seam
Cement: Sand: WaterCement: Sand: WaterCement: Gypsum: Coal Powder: Sand: Water
A:
B:
2.59: 1.8: 0.54
2.25: 1.8: 0.69
a:0.99: 1.08: 0.322: 3: 1.52: 1: 2.67
b:0.88: 1.08: 0.33
c:0.63: 1.08: 0.32
Table 6. Triaxial compression test results of sandstone specimens in Figure 4.
Specimen No. Confining Pressure (MPa)Elastic Modulus (GPa)Average Value (GPa)Poisson’s RatioAverage ValueCohesion (MPa)Internal Friction Angle (°)
A1103.333.280.260.2313.230
A2153.110.23
A3203.400.21
B1102.362.710.250.2210.031
B2152.250.22
B3203.530.20
a1101.881.780.290.264.525
a2151.710.26
a3201.760.24
b1101.601.650.300.273.124
b2151.650.27
b3201.700.25
c1101.071.220.310.291.823
c2151.240.29
c3201.360.26
Table 7. In situ stress regimes and fracturing results of Specimens Aa1, Aa2, and Aa3.
Specimen No.In Situ Stress RegimeFracture Combination TypePenetrate the Coal–Roof InterfaceFracture Initiation Pressure (MPa)
Aa1Normal fault stress regime:
σx = 10 MPa
σy = 11 MPa
σz = 15.6 MPa
1 transverse fractureYes32.5
Aa2Strike-slip fault stress regime:
σx = 6 MPa
σy = 15 MPa
σz = 8 MPa
Multiple transverse and longitudinal fracturesYes13.75, 11
Aa3Reverse fault stress regime:
σx = 8 MPa
σy = 15 MPa
σz = 6 MPa
1 horizontal fracture and multiple transverse fracturesYes20
Table 8. In situ stress regimes and fracturing results of Specimens Ab1 and Ab3.
Specimen No.In Situ Stress RegimeFracture Combination TypePenetrate the Coal–Roof InterfaceFracture Initiation Pressure (MPa)
Ab1Normal fault stress regime:
σx = 6 MPa
σy = 8 MPa
σz = 15 MPa
Curved irregular fracturesYes25, 29
Ab3Strike-slip fault stress regime:
σx = 6 MPa
σy = 15 MPa
σz = 8 MPa
1 transverse fractureYes17
Table 9. In situ stress regimes and fracturing results of Specimens Ac1, Ac2, and Ac3.
Specimen No.In Situ Stress RegimeFracture Combination TypePenetrate the Coal–Roof InterfaceFracture Initiation Pressure (MPa)
Ac1Normal fault stress regime:
σx = 6 MPa
σy = 8 MPa
σz = 15 MPa
1 transverse fractureYes8
Ac2Strike-slip fault stress regime:
σx = 6 MPa
σy = 15 MPa
σz = 8 MPa
1 transverse fracture and a main horizontal fracture along the coal–roof interfaceNo20, 34
Ac3Reverse fault stress regime:
σx = 8 MPa
σy = 15 MPa
σz = 6 MPa
Two horizontal fractures along the coal–roof interfaceNo37
Table 10. In situ stress regimes and fracturing results of Specimens Ba2 and Ba3.
Specimen No.In Situ Stress RegimeFracture Combination TypePenetrate the Coal–Roof InterfaceFracture Initiation Pressure (MPa)
Ba2Strike-slip fault stress regime:
σx = 6 MPa
σy = 15 MPa
σz = 8 MPa
Multiple transverse fractures and longitudinal fracturesYes18
Ba3Reverse fault stress regime:
σx = 8 MPa
σy = 15 MPa
σz = 6 MPa
1 transverse fracture and 1 longitudinal fractureYes23, 25
Table 11. In situ stress regimes and fracturing results of Specimens Bb1, Bb2, and Bb3.
Specimen No.In Situ Stress RegimeFracture Combination TypePenetrate the Coal–Roof InterfaceFracture Initiation Pressure (MPa)
Bb1Normal fault stress regime:
σx = 6 MPa
σy = 8 MPa
σz = 15 MPa
1 horizontal fractureNo18.75
Bb2Strike-slip fault stress regime:
σx = 6 MPa
σy = 15 MPa
σz = 8 MPa
2 transverse fracturesYes33
Bb3Reverse fault stress regime:
σx = 8 MPa
σy = 15 MPa
σz = 6 MPa
2 horizontal fractures and 1 transverse fracture No22.5, 23.75
Table 12. In situ stress regimes and fracturing results of Specimens Bc2 and Bc3.
Specimen No.In Situ Stress RegimeFracture Combination TypePenetrate the Coal–Roof InterfaceFracture Initiation Pressure (MPa)
Bc2Strike-slip fault stress regime:
σx = 6 MPa
σy = 15 MPa
σz = 8 MPa
Transverse fractures and 1 longitudinal fractureYes23.5
Bc3Reverse fault stress regime:
σx = 8 MPa
σy = 15 MPa
σz = 6 MPa
1 transverse fracture, 1 horizontal fracture and 1 oblique fractureYes34
Table 13. Statistical results of fracture propagation under different influencing factors.
Influencing FactorCategorySpecimen No.Number of Specimens with Successful Fracture Cross-Layer PropagationSuccess Rate of Fracture Cross-Layer PropagationAverage Fracture Initiation Pressure (MPa)
In situ stress regimeNormal fault stress regimeAa1, Ab1, Ac1, Bb1375%22.65
Strike-slip fault stress regimeAa2, Ab3, Ac2, Ba2, Bb2, Bc2583%21.28
Reverse fault stress regimeAa3, Ac3, Ba3, Bb3, Bc3360%26.46
Coal–roof interface strengthType a
(High)
Aa1, Aa2, Aa3, Ba2, Ba35100%20.46
Type b (Moderate)Ab1, Ab3, Bb1, Bb2, Bb3480%24.14
Type c
(Low)
Ac1, Ac2, Bc2, Ac3, Bc3360%26.08
Roof mechanical propertiesType A
(High-strength)
Aa1, Aa2, Aa3, Ab1, Ab3, Ac1, Ac2, Ac3675%22.48
Type B
(Low-strength)
Ba2, Ba3, Bb1, Bb2, Bb3, Bc2, Bc3571%24.61
Disclaimer/Publisher’s Note: The statements, opinions and data contained in all publications are solely those of the individual author(s) and contributor(s) and not of MDPI and/or the editor(s). MDPI and/or the editor(s) disclaim responsibility for any injury to people or property resulting from any ideas, methods, instructions or products referred to in the content.