Article

Research on Aerodynamic Noise Optimization of Rear Air Conditioning in New Energy SUVs

1
School of Automobile and Transportation, Tianjin University of Technology and Education, Tianjin 300222, China
2
School of Automotive Business Management, Changchun Technical University of Automobile, Changchun 130013, China
3
China Automotive Engineering Research Institute Co., Ltd., Tianjin 300222, China
*
Author to whom correspondence should be addressed.
Processes 2026, 14(18), 2986; https://doi.org/10.3390/pr14182986 (registering DOI)
Submission received: 24 August 2026 / Revised: 9 September 2026 / Accepted: 17 September 2026 / Published: 19 September 2026

Abstract

The noise generated by the air-conditioning system of new energy sport utility vehicles (SUVs) is a primary sound source that impairs ride comfort. This study addresses the aerodynamic noise issue of the rear air-conditioning system in a new energy SUV under the floor mode. Optimization targets were established through combined experimental measurements and computational fluid dynamics simulations. The blower deflector was slotted on both sides. The air distribution plate was redesigned with an arc-shaped profile to reduce intake pulsation and balance outlet airflow. The floor duct geometry was optimized using a response surface methodology. Key parameters—including the duct inlet-turning radius, clearance groove width, and groove depth—were adjusted to enlarge the inlet cross-section, reduce flow resistance, and lower aerodynamic noise. The experimental results demonstrate that both the blower deflector modification and the duct geometry optimization effectively suppress the peak sound pressure and the low-frequency average sound pressure: the peak sound pressure was reduced by 16.22 dB (blower deflector) and 3.7 dB (duct), while the average sound pressure decreased by 1.8 dB and 3.34 dB, respectively. Finally, the combined optimization of the blower and the duct achieves a 5.79 dB reduction in the rear air-conditioning outlet noise at gear 8. The research provides theoretical and practical guidance for improving the NVH performance of rear air conditioning systems in new-energy SUVs.

1. Introduction

In new energy vehicles (NEVs), the absence of engine noise and vibration masking other sound sources makes the air-conditioning system noise a primary contributor to reduced ride comfort [1]. New energy sport utility vehicles (SUVs) feature large interior space and high sealing requirements, often necessitating a separate rear A/C system. Due to space constraints, the rear A/C duct layout is complex, making noise more noticeable to rear-seat passengers, especially at high blower speeds where aerodynamic noise becomes exceptionally prominent. Therefore, systematic research on aerodynamic noise optimization for rear A/C systems is of practical significance.
Aerodynamic noise (also termed aeroacoustic noise) in automotive A/C systems mainly consists of two components: rotational noise, caused by unsteady pulsations from the blower impeller, and vortex noise, induced by unstable gap flows and vortices inside the ducts [2]. Regarding blower noise control, Li et al. [3] performed finite element simulation on the abnormal noise at 225 Hz under the high-speed conditions of a centrifugal fan. By adding grooves to the flange, they stabilized the airflow around the blades and eliminated the abnormal noise. Wang et al. [1] optimized the hub profile and blade tip curvature of the blower for NEV A/C systems, reducing the 43rd blade-passing frequency noise by about 5 dB. Shu [4] conducted steady and transient noise simulations using STAR-CCM+ and applied groove treatment to the flange, which effectively reduced blower aerodynamic noise. Zhang [5] analyzed the influence mechanism of impeller structure on aerodynamic noise and optimized the blower structure, leading to a noticeable noise reduction by 2.7–5.2 dB. Yang et al. [6] employed response surface methodology to optimize four parameters, including blade outlet angle and volute tongue clearance, achieving an 8 dB reduction in peak noise while maintaining the airflow rate. For duct noise control, Qin [7] carried out flow-field and acoustic-field simulations, along with experimental validation, proposing two optimization strategies—grille thinning and duct smoothing—which effectively improved cabin acoustic comfort. Wang et al. [8] performed numerical and experimental studies on aerodynamic noise in the outlet ducts of automotive A/C systems, identifying bends and abrupt cross-sectional changes as primary sources of vortex noise. Zhen et al. [9] designed and optimized a periodic silencing structure for A/C piping; after optimization, the noise attenuation bandwidth was broadened and the sound pressure level at the duct outlet reduced 7 dB. Wan et al. [10] optimized structural parameters such as the turning radius of the outlet ducts based on experimental and simulation results, achieving increased airflow volume and reduced noise at the outlets. Wang et al. [11] investigated optimization of the defrost duct to address uneven airflow distribution and high noise levels. Experimental validation showed that measures such as reducing bends, enlarging outlets, improving airflow separation, and smoothing vortex transitions can effectively reduce interior noise while ensuring sufficient and uniform airflow distribution at all outlets.
Most existing studies focus on the optimization of aerodynamic noise in automotive air-conditioning systems by addressing either the blower or the duct geometry independently. Ling [12] carried out a collaborative optimization design of aerodynamic noise and airflow rate for an HVAC system, but his work targeted the HVAC assembly of a micro electric vehicle and did not address multi-mode noise optimization for the independent rear A/C system of a new energy SUV. Most existing studies on SUV aerodynamic noise have primarily focused on body panels and have been conducted using wind tunnel testing, as exemplified by the work of Qin et al. [13] and Zhang et al. [14]. However, research specifically dedicated to the air-conditioning system remains relatively scarce. In reality, the blower is the sound source of aerodynamic noise, while the duct constitutes the primary transmission path; therefore, simultaneous control of both components can significantly enhance noise reduction effectiveness. SUV A/C systems are often equipped with multi-zone and multi-mode air supply functions; however, the noise characteristics and optimization strategies under different operational modes remain insufficiently explored in the literature. Moreover, although a considerable number of studies combine experimentation with numerical simulation, the optimization measures are predominantly experience-based, with relatively few investigations employing rigorous algorithms to determine optimal solutions. The response surface methodology, as a modeling approach that balances accuracy and efficiency, has demonstrated good applicability in multi-parameter optimization of engineering structures [15]. To solve the abnormal rear noise issue in the A/C system of a NEV SUV, this paper systematically conducts noise control research by integrating simulation, experimentation, and the response surface methodology, combining blower and duct geometry optimizations.

2. Analysis of Rear Air-Conditioning Noise in the Original Vehicle

The test vehicle used in this study is a new energy SUV with a hybrid extended-range powertrain. When the rear air-conditioning system is switched to the floor mode, severe abnormal noise occurs. Prolonged exposure under this condition has led to customer complaints, and the subjective evaluation of the noise is unacceptable. Therefore, in order to accurately identify the noise sources, it is necessary to conduct noise tests on the rear floor duct of the original vehicle’s A/C system.

2.1. Noise Measurement

The test object is the rear A/C system of the new energy SUV, which mainly consists of the rear blower and the ductwork. The blower is positioned behind the C-pillar, with its inlet oriented toward the exterior body panel. A deflector is installed at the inlet. The blower is of a centrifugal type, featuring axial intake and radial discharge. Air is accelerated by the blower, passes through the A/C filter to remove dust and particulates, and then travels along the outlet duct to the air distribution port. The airflow then enters the floor duct via the floor distribution port. The floor duct is arranged beneath the rear seat and has two outlets. The benchmark vehicle Li L9 is a six-seat long-range electric SUV, and its rear blower duct layout is similar to the test vehicle.
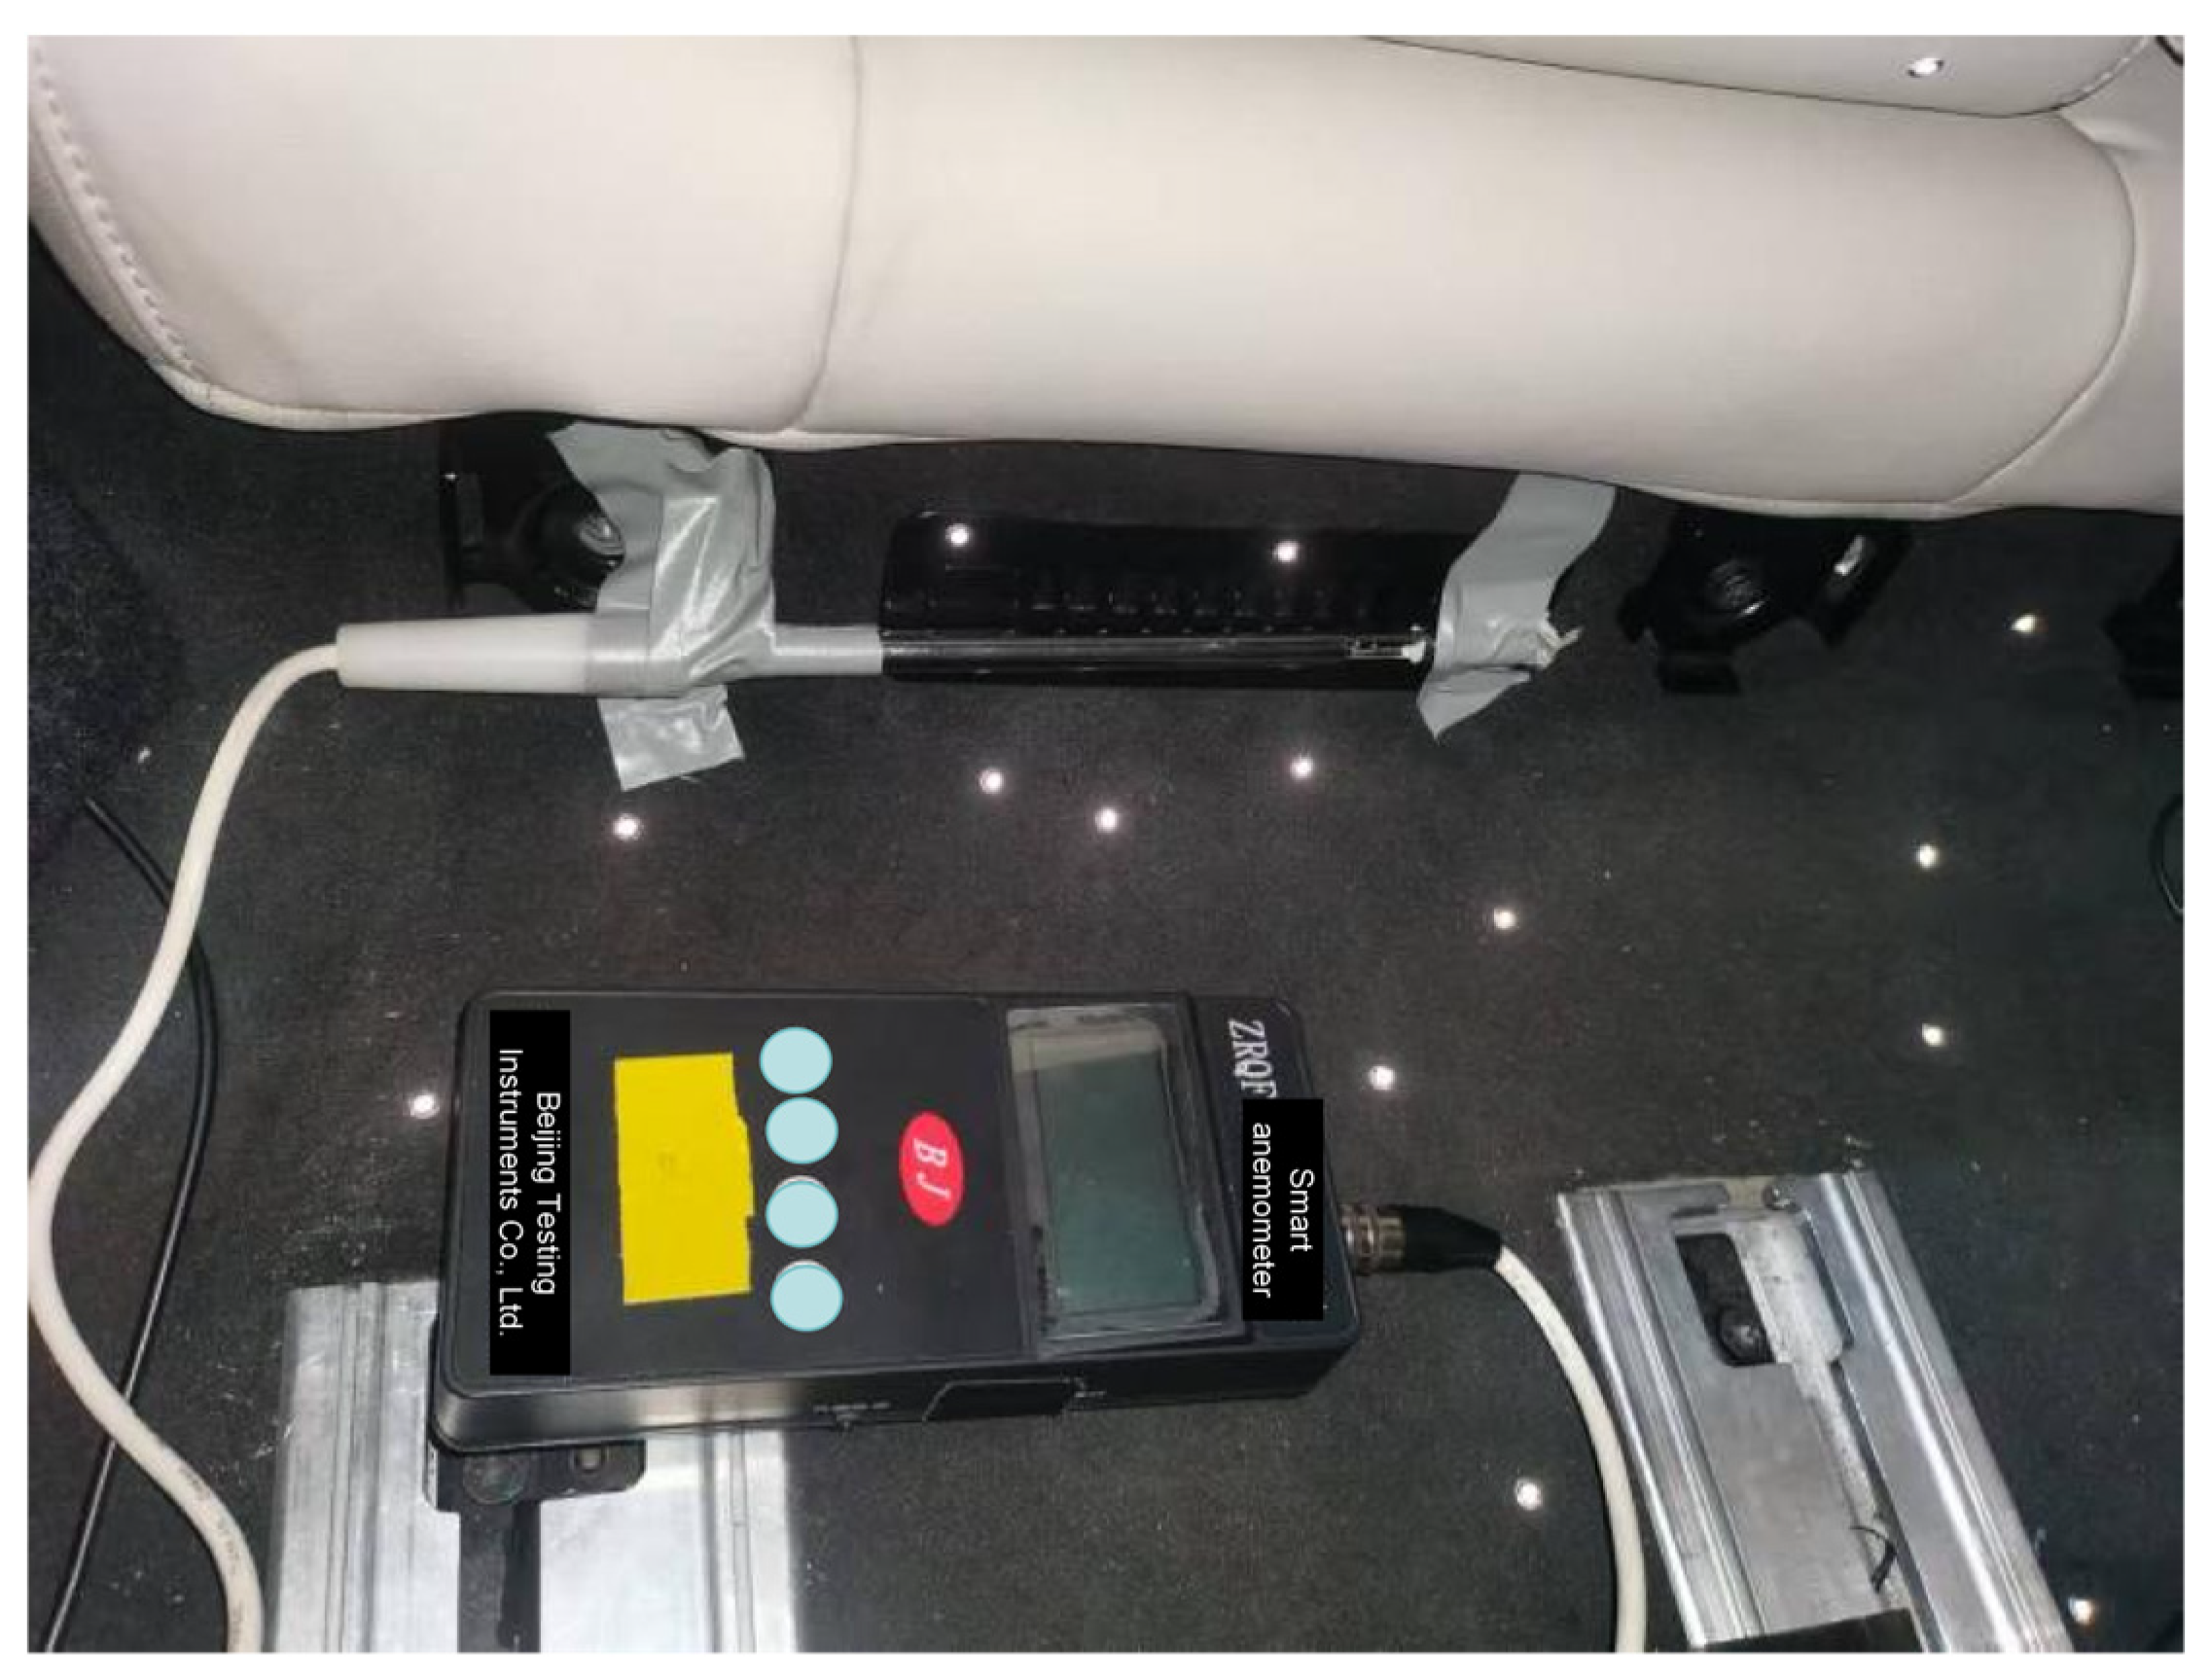
The noise measurement tests are conducted in a full-vehicle semi-anechoic chamber. According to the requirements of GB/T 6882-2016 [16], the background noise level of the semi-anechoic chamber is less than 20 dB(A); thus, no sound pressure level correction is required. Microphones are placed at the left and right ear positions of the right-rear passenger seat to reflect the actual riding experience. The microphones were calibrated before each measurement session using a pistonphone calibrator to ensure measurement accuracy. Each test condition was repeated three times, and the reported sound pressure levels represent the average of the three repeated measurements. The airflow velocities at the floor outlets were measured using a ZRQF-series smart anemometer. The probe was positioned at the center of each floor outlet, as shown in Figure 1, and the measurements were recorded after the airflow had stabilized for at least 30 s at each gear setting. The measurement equipment includes the LMS Test.Lab2019 data acquisition and analysis software, GRAS microphones, and a laptop computer. The specific models, specifications, and quantities are listed in Table 1.
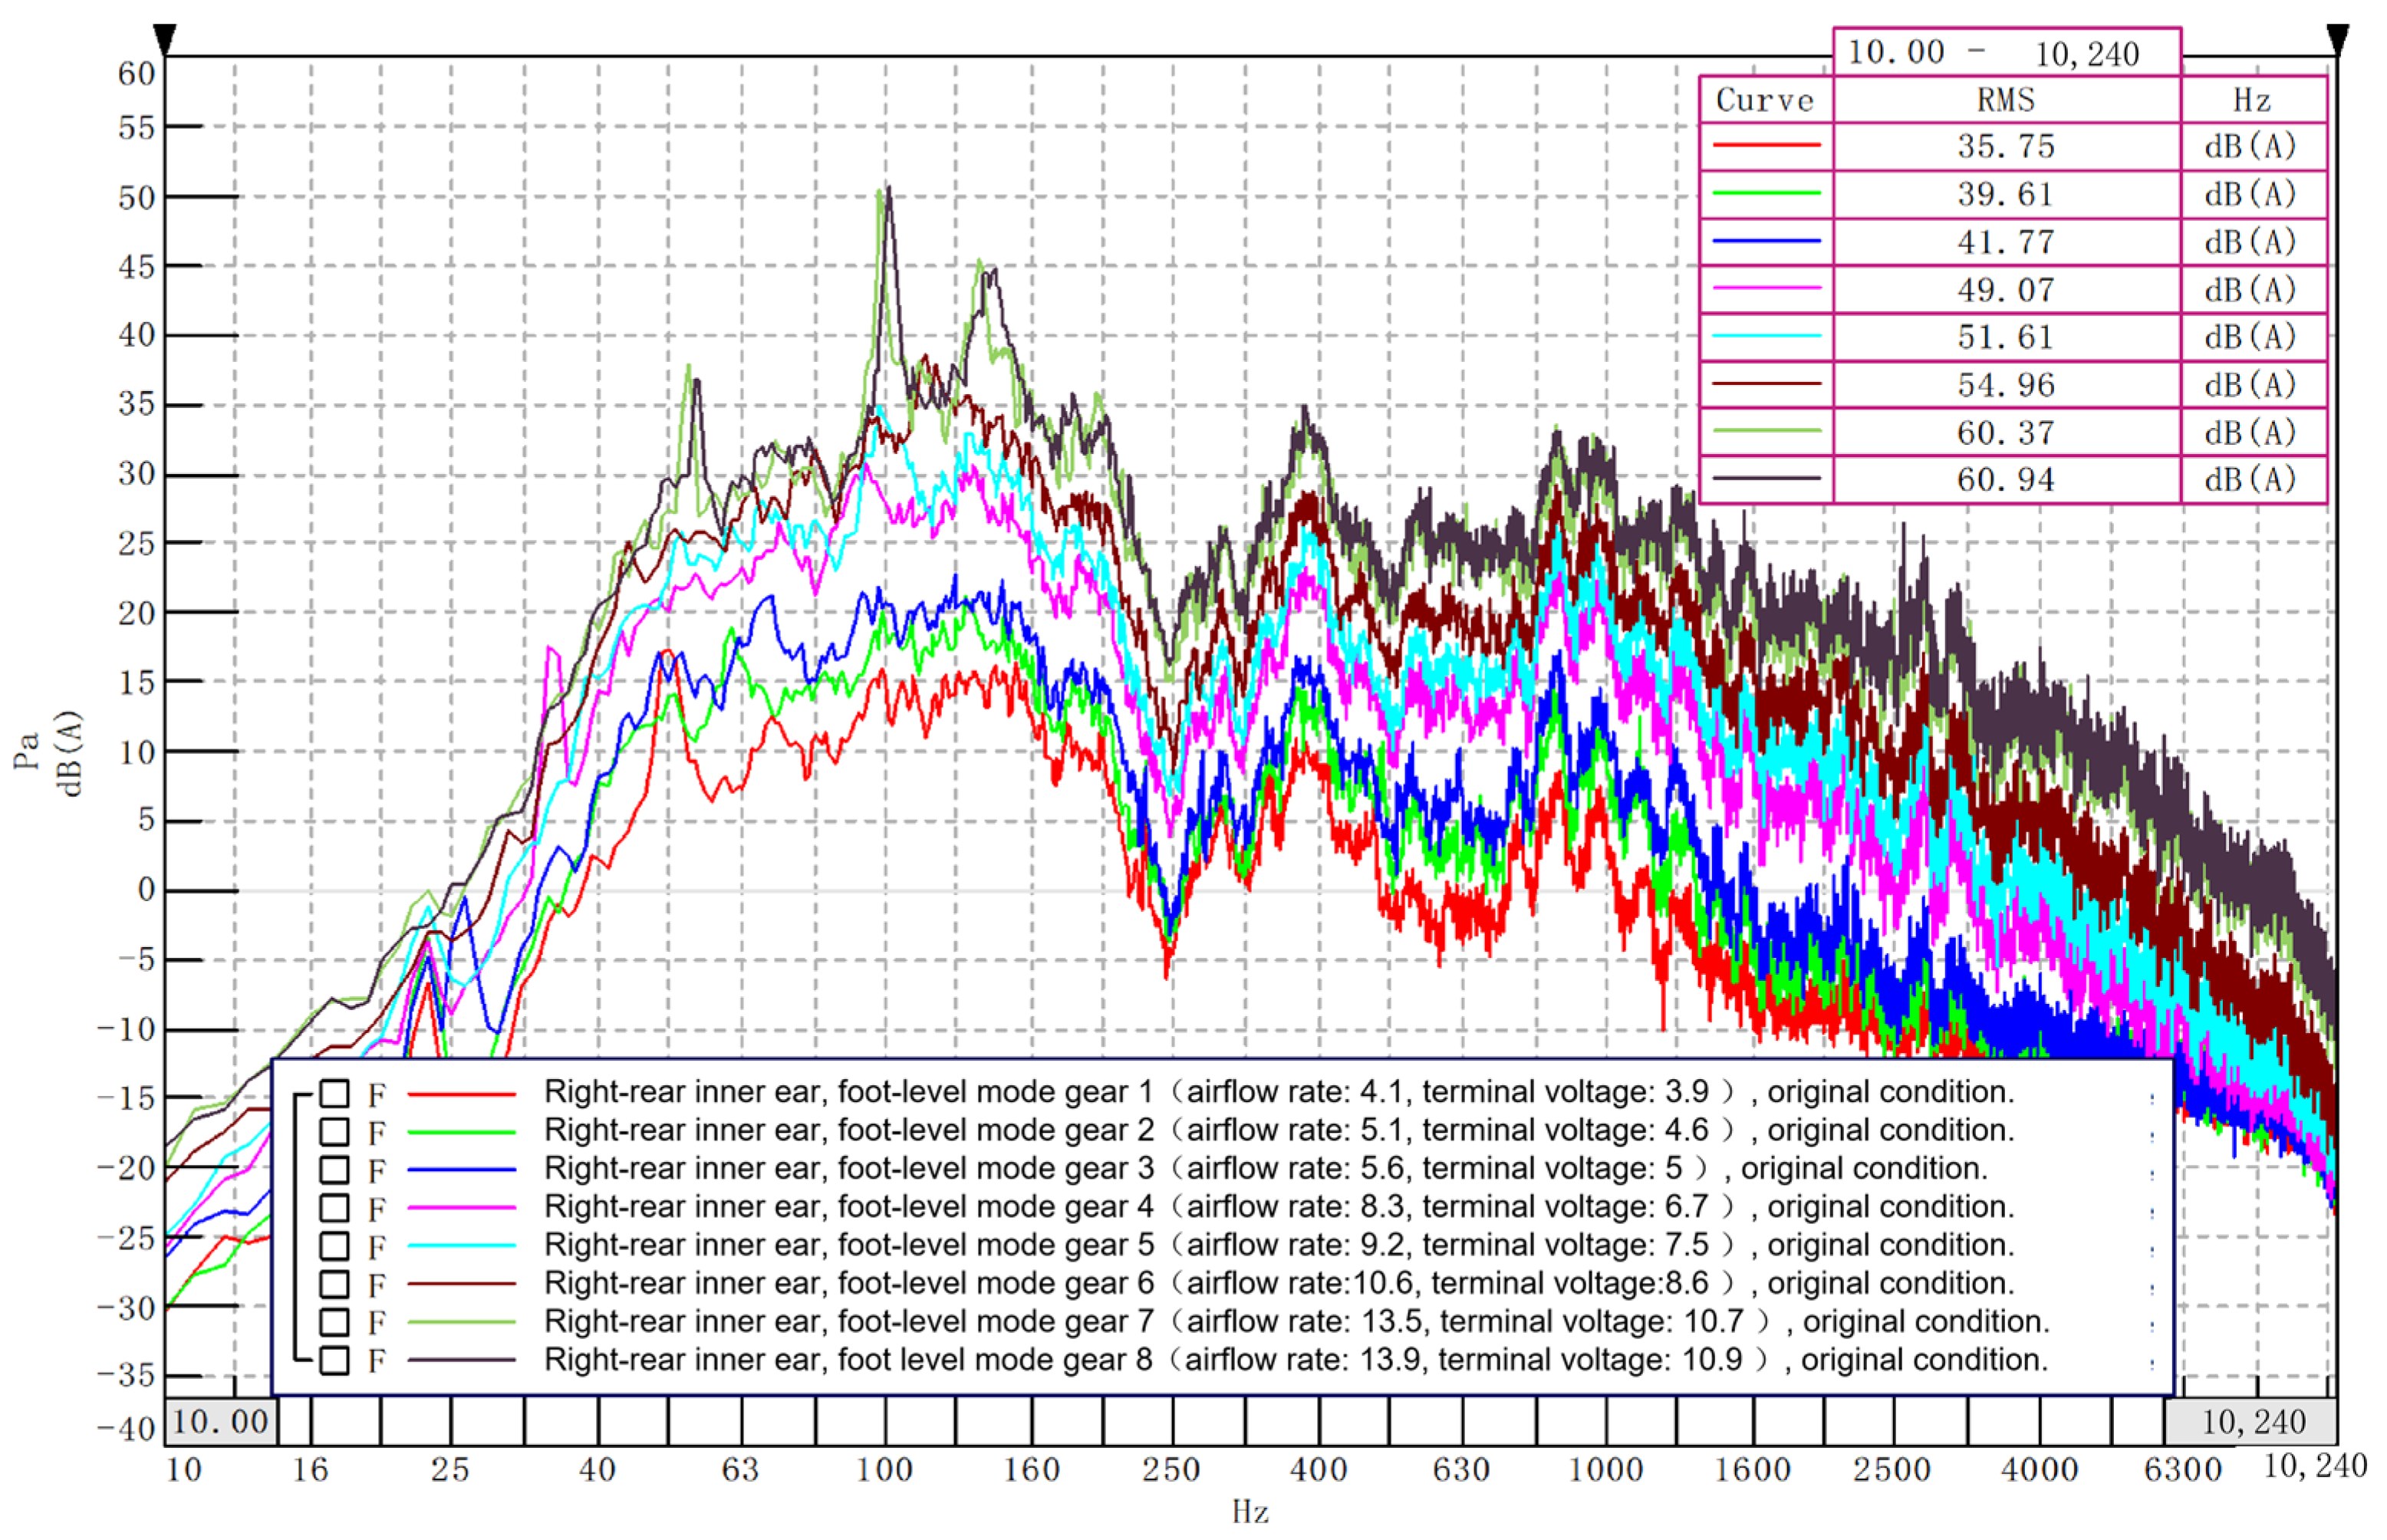
The sound pressure spectra of the rear A/C system in floor mode from gear 1 to gear 8 over the frequency range of 10–10,240 Hz are shown in Figure 2. The spectra reveal that at gears 7 and 8, the sound pressure levels in the 50–250 Hz band are relatively high, with A-weighted peak sound pressure levels of 60.37 dB(A) and 60.94 dB(A), respectively. These values are 13.14 dB(A) and 10.92 dB(A) higher than those of the benchmark vehicle (see Table 2). Humbad et al. [17] demonstrated that aerodynamic noise is a primary contributor to interior noise in vehicles, and that low-frequency rumble noise (20–400 Hz) is the most objectionable noise characteristic, especially when the blower operates at full speed. Consequently, it is necessary to conduct a frequency-domain analysis of the noise sources under the floor mode of the rear A/C system, to identify the frequency bands with elevated sound pressure levels and the primary causes of the peak sound pressure frequencies, and to propose appropriate optimization measures.

2.2. Noise Source Analysis

Aerodynamic noise mainly consists of rotational noise and vortex noise. Rotational noise is directly related to the number of impeller blades and the rotational speed, and manifests as discrete frequency peaks. As the impeller rotates, the blades periodically cut through the surrounding air, generating unsteady pressure fluctuations on the blade surfaces that radiate as rotational noise [2] (p. 7). Rotational noise can be calculated by Equation (1). Vortex noise is caused by turbulent boundary layers, flow separation, and vortex shedding; the high-speed airflow separates from the blade trailing edges and deflector surfaces, forming shear layers that roll up into vortices. These vortices, upon shedding and subsequently breaking down, produce pressure fluctuations that manifest as broadband vortex noise [2] (p. 8). The vortex frequency can be estimated by Equation (2).
f r = n Z 60 · i
In Equation (1), f r represents the rotational frequency of the blower blades; n represents the blower speed in r/min; Z represents the number of impeller blades; and i = 1 , 2 , 3 , represents the harmonic order [2] (pp. 6–9).
f c = K v b i
In Equation (2), f c represents the vortex noise frequency; K represents the Strouhal number, ranging from 0.14 to 0.2; v represents the relative velocity between the gas and the blade in m/s; and b represents the projection of the frontal width of the object onto the plane perpendicular to the velocity direction in meters [2] (pp. 6–9).
For the test vehicle, the blower speed is 3240 r/min at gear 8 and 3180 r/min at gear 7, with the number of blades Z = 43. When i = 1, the shaft frequencies of the blower at gears 7 and 8 are 53 Hz and 54 Hz respectively, and the corresponding blade passing frequencies are 2279 Hz and 2322 Hz. A preliminary comparison with the measured sound pressure spectra indicates that the peak sound pressures at 53 Hz (gear 7) and 54 Hz (gear 8) are generated by the blower rotational noise.
Measurements show that the blower rotor radius of the test vehicle is r = 55 mm, and the projection of the frontal width of a single blade surface onto the plane perpendicular to the velocity direction is b1 = 6.5 mm. According to the formula v = 2πnr/60, the rotational speeds at gears 7 and 8 are converted into relative velocities of v7 = 183.06 m/s and v8 = 186.52 m/s, respectively. Taking i = 1 and the characteristic length b = 0.2795 m, the vortex noise frequency bands for the floor duct at gears 7 and 8 can be preliminarily calculated using Equation (2): the band for gear 7 ranges from 91.69 Hz to 130.99 Hz, and that for gear 8 ranges from 93.43 Hz to 133.47 Hz. The measured peak sound pressures at 100 Hz (gear 7) and 100.21 Hz (gear 8) both fall within the above frequency bands.
The above noise source analysis reveals that both the blower rotational noise and the duct vortex noise are the primary contributors to the low-frequency noise in the 50–250 Hz band. Therefore, aerodynamic noise optimization should be carried out from both the blower and the duct aspects. Regarding the blower, which is a major aerodynamic noise source in the cabin, the noise is mainly induced by hydrodynamic phenomena such as impeller rotation, airflow separation, and vortex shedding. Rotational noise becomes particularly dominant under high-speed or high-load conditions. To effectively control the blower noise source, measures such as optimizing the blower structure and adjusting the terminal voltage can be implemented. Regarding the duct, the uniformity of the internal flow field and local vortices are the primary factors affecting aerodynamic noise. This is because non-uniform flow gives rise to velocity gradients and shear layers, which promote the formation and shedding of vortices. When the airflow encounters abrupt changes in duct cross-section, sharp bends, or obstructions, flow separation occurs, generating intense local vortices and pressure fluctuations. These pressure fluctuations propagate along the duct wall and are radiated from the outlets as noise. Coupled resonance between the blower and the duct can easily induce structural noise. Therefore, airflow noise can be reduced by optimizing the duct geometry through measures such as guide vane adjustment, duct cross-sectional design, and outlet geometry modification. In addition, acoustic package materials can be applied for passive vibration isolation and sound absorption to introduce additional barriers along the noise transmission path and thus attenuate noise propagation.

3. CFD Simulation and Optimization of the Blower and Duct

To reduce the aerodynamic noise of the blower and duct in the rear A/C system, Computational Fluid Dynamics (CFD) numerical simulation is first conducted to analyze the generation and propagation paths of aerodynamic noise; identify regions with turbulent vortex accumulation, significant flow impact, and high sound pressure levels; and thereby enable targeted optimization [18].

3.1. Simulation Model and Boundary Conditions

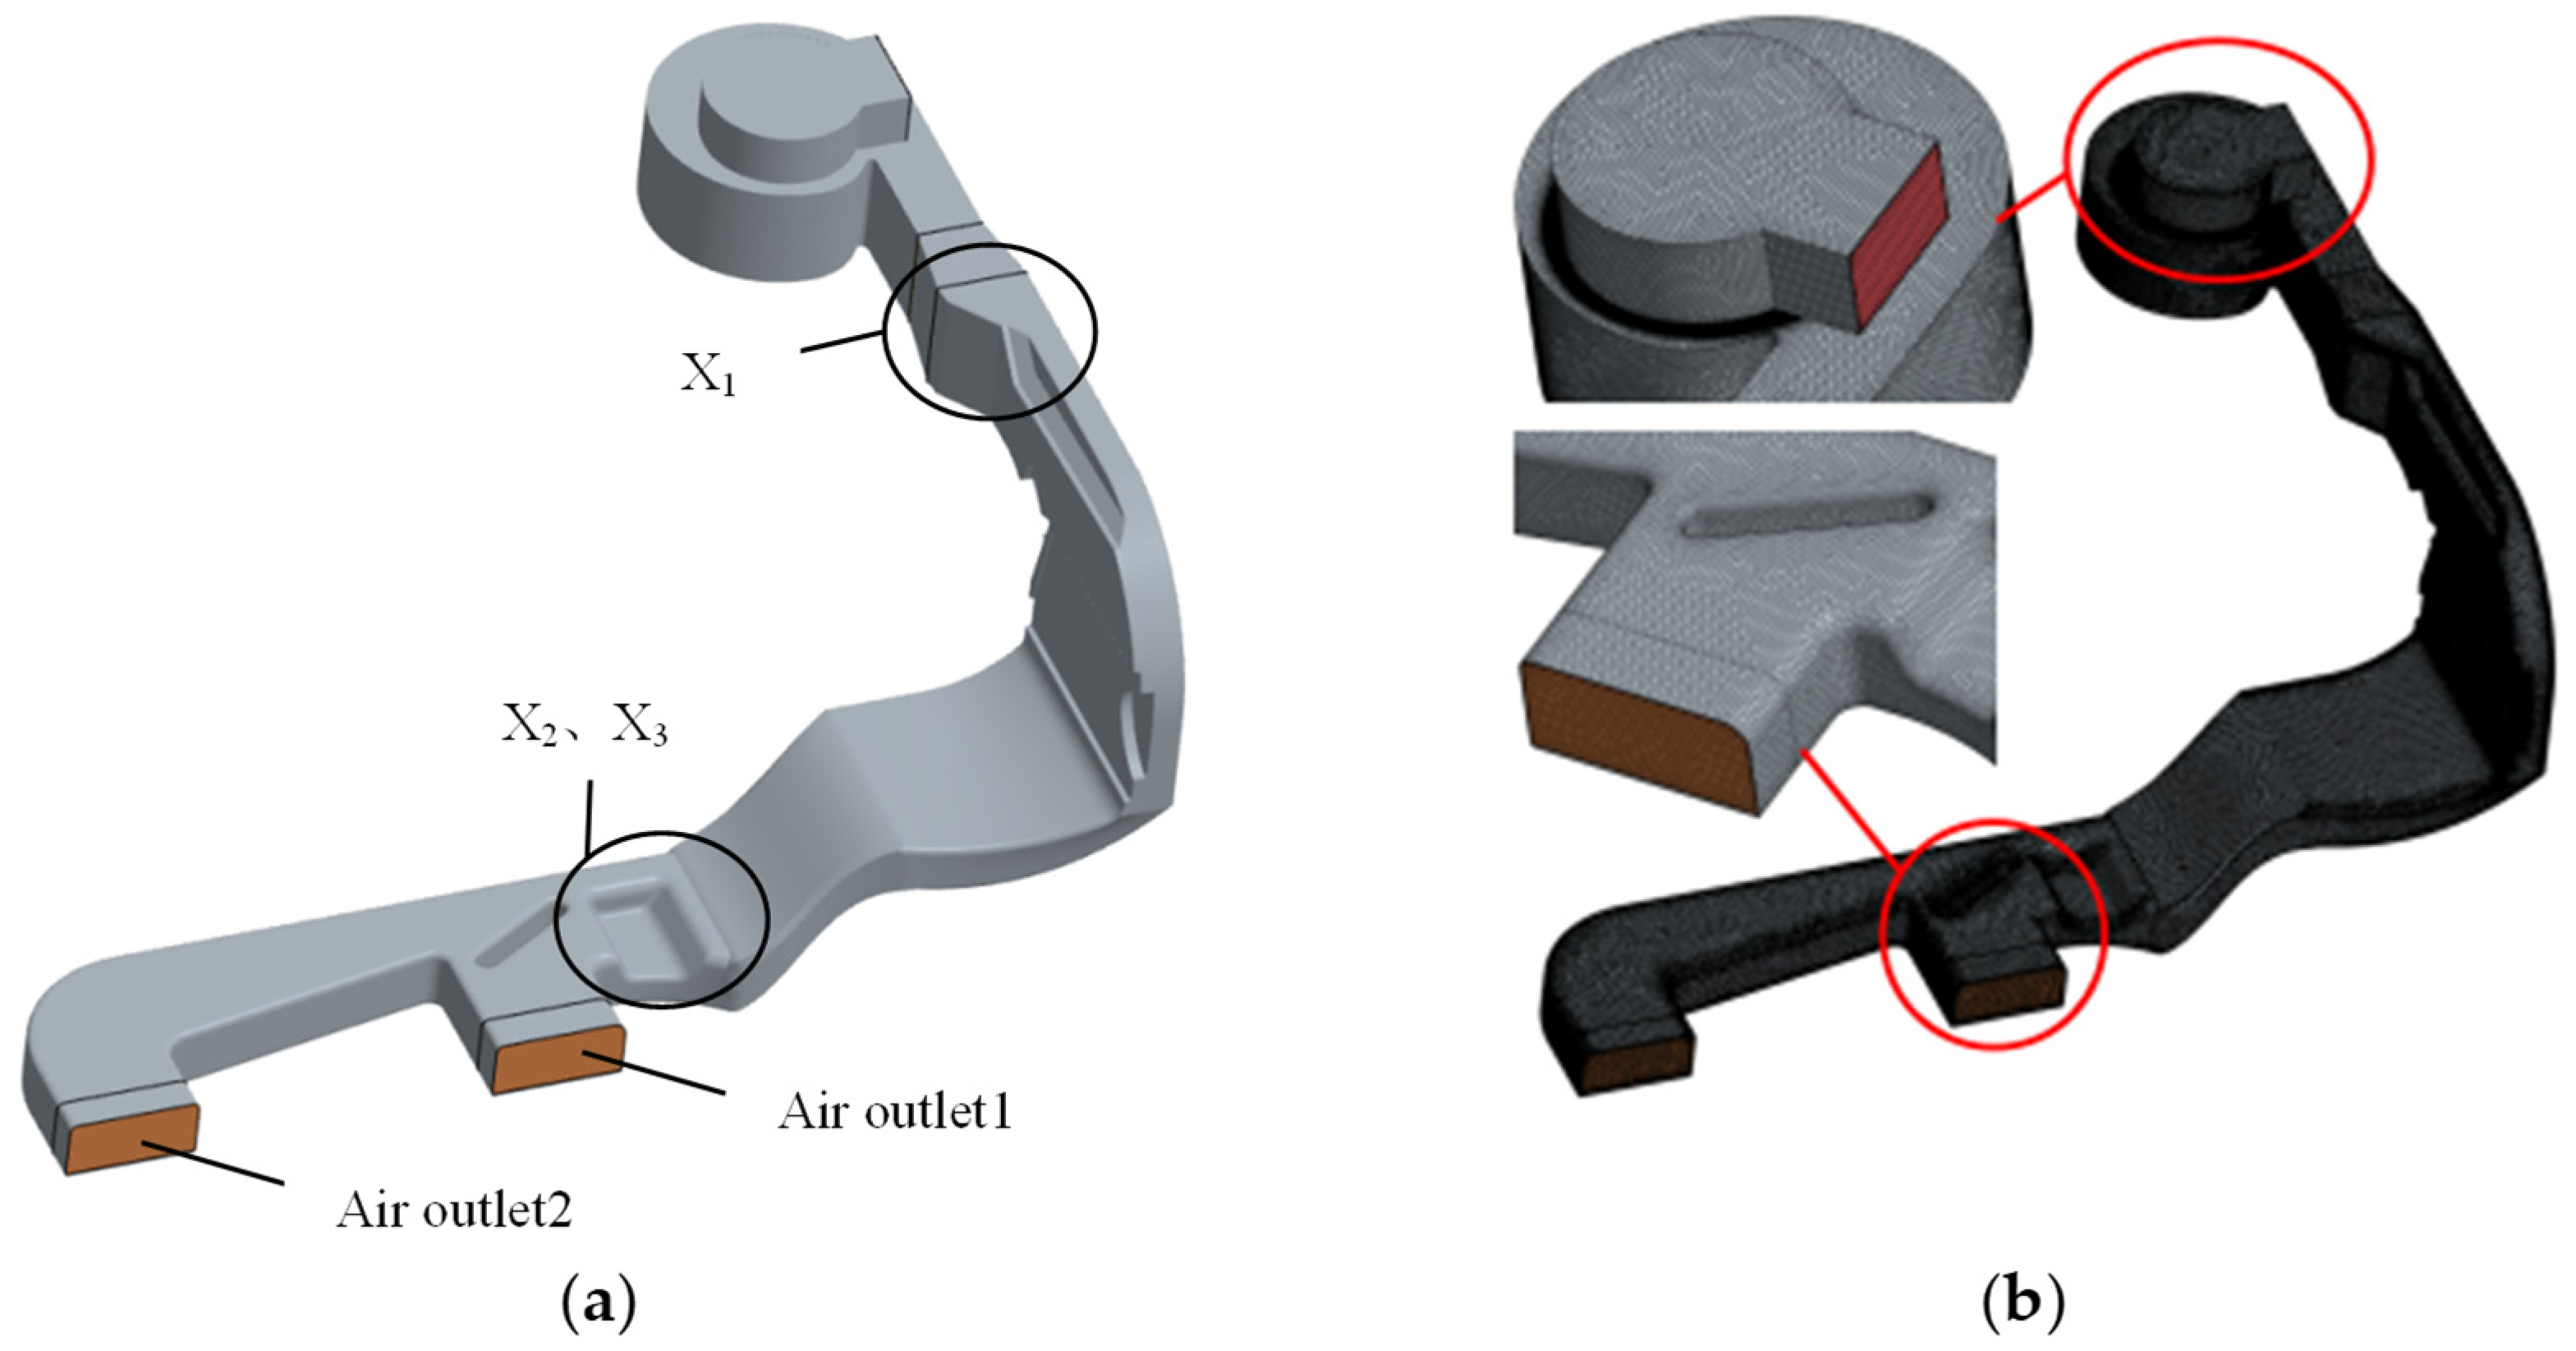
The three-dimensional model of the blower and duct is shown in Figure 3a. To ensure the accuracy of the simulation results, a constant-section stabilization zone of 0.1 m in length is extended at the blower outlet during modeling. The air filter and cooling section between the blower outlet and the duct inlet are modeled as an equivalent porous medium. The internal fluid domain is extracted from the three-dimensional model for meshing, and a grid independence study was conducted to ensure the reliability of the numerical results. Three mesh densities were generated: coarse, medium, and fine. The outlet sound pressure level was monitored for each mesh density. The deviations between the medium and fine meshes were less than 0.3 dB, while the deviations between the coarse and medium meshes were approximately 1.2 dB. Therefore, the medium mesh was selected as the optimal balance between computational accuracy and cost, as shown in Figure 3b. Both the blower and the duct are discretized using polyhedral meshes, with element sizes ranging from 0.3 to 3 mm. The boundary layer consists of eight layers with a total thickness of 1 mm and a growth ratio of 1.5. The meshes at the inlet and outlet grilles are refined to 0.75 mm. The total mesh count for a single model is approximately 3 million. The inlet boundary is set as a velocity inlet, with the velocity converted from the airflow rate at gear 8 to 30 m/s. The outlet boundary is set as a pressure outlet.
As the flow in automotive A/C ducts is predominantly incompressible (Mach number < 0.3) and fully turbulent, the k-ε model has been extensively validated for internal flow applications and offers a good balance between computational accuracy and cost. Thus, the turbulence model is the k-ε model. Two-Layer All y+ Wall Treatment was employed to ensure proper near-wall resolution, with y+ values maintained below 5 for all wall-adjacent cells. The noise model is the broadband noise source model, and the secondary flow corrections are based on the Proudman and Curle formulations. It should be noted that the steady RANS approach combined with the broadband noise source models employed in this study is capable of predicting the spatial distribution of broadband aerodynamic noise sources, but cannot capture discrete-frequency rotational noise. The primary purpose of the steady simulations is to identify regions with intense turbulent vortex accumulation, significant flow impact, and high wall-pressure fluctuations, thereby providing directional guidance for structural optimization.
In addition, the rotation of the blower impeller was modeled using the Multiple Reference Frame (MRF) approach in STAR-CCM+. In this approach, the impeller region was assigned a rotating reference frame with the specified rotational speed, while the stationary components (duct, deflector, etc.) remained in the stationary frame. The MRF method is a steady-state approximation that accounts for the rotational effect on the mean flow field, enabling the identification of flow regions affected by impeller rotation.

3.2. Numerical Simulation and Result Analysis

Aerodynamic noise is generated by non-uniform flow velocity or pressure fluctuations on the fluid surface. CFD simulations of aerodynamic noise in automotive A/C ducts commonly employ acoustic analogy methods, specifically the Ffowcs Williams–Hawkings (FW-H) equation [2,11] (pp. 60–61). For a physical control surface, the differential form of the FW-H equation is expressed as follows:
1 c 2 2 t 2 2 x i 2 p x i , t = ¯ t ρ 0 v n δ f + ¯ x i P i j · n j δ f + ¯ 2 x i y i T i j H f
In Equation (3), 1 c 2 2 t 2 2 x i 2 represents the wave operator; p x i , t represents the sound pressure at time t ; ρ represents the density; v n represents the unit normal vector on the control surface; T i j represents the Lighthill stress tensor; H(f) represents the Heaviside function; and δ(f) is the Dirac function [2] (pp. 60–61).
The three terms on the right-hand side of Equation (3) represent the thickness noise source, the loading noise source, and the quadrupole noise source, respectively. The thickness and loading noise sources are surface sources, whose magnitudes depend on the surface geometry, motion velocity, and unsteady aerodynamic forces. In low-speed flows, surface sources account for the vast majority of the total aerodynamic noise. The quadrupole noise source is a volume source, closely associated with nonlinear flow near the control surface. Quadrupole noise becomes particularly significant when the flow near the control surface reaches transonic or supersonic speeds [2] (pp. 60–61). In automotive A/C ducts, the flow velocity is low, and the acoustic power generated by quadrupole sources is far smaller than that of surface sources and can therefore be neglected. Consequently, the aerodynamic noise in automotive A/C ducts is dominated by surface noise sources [19].
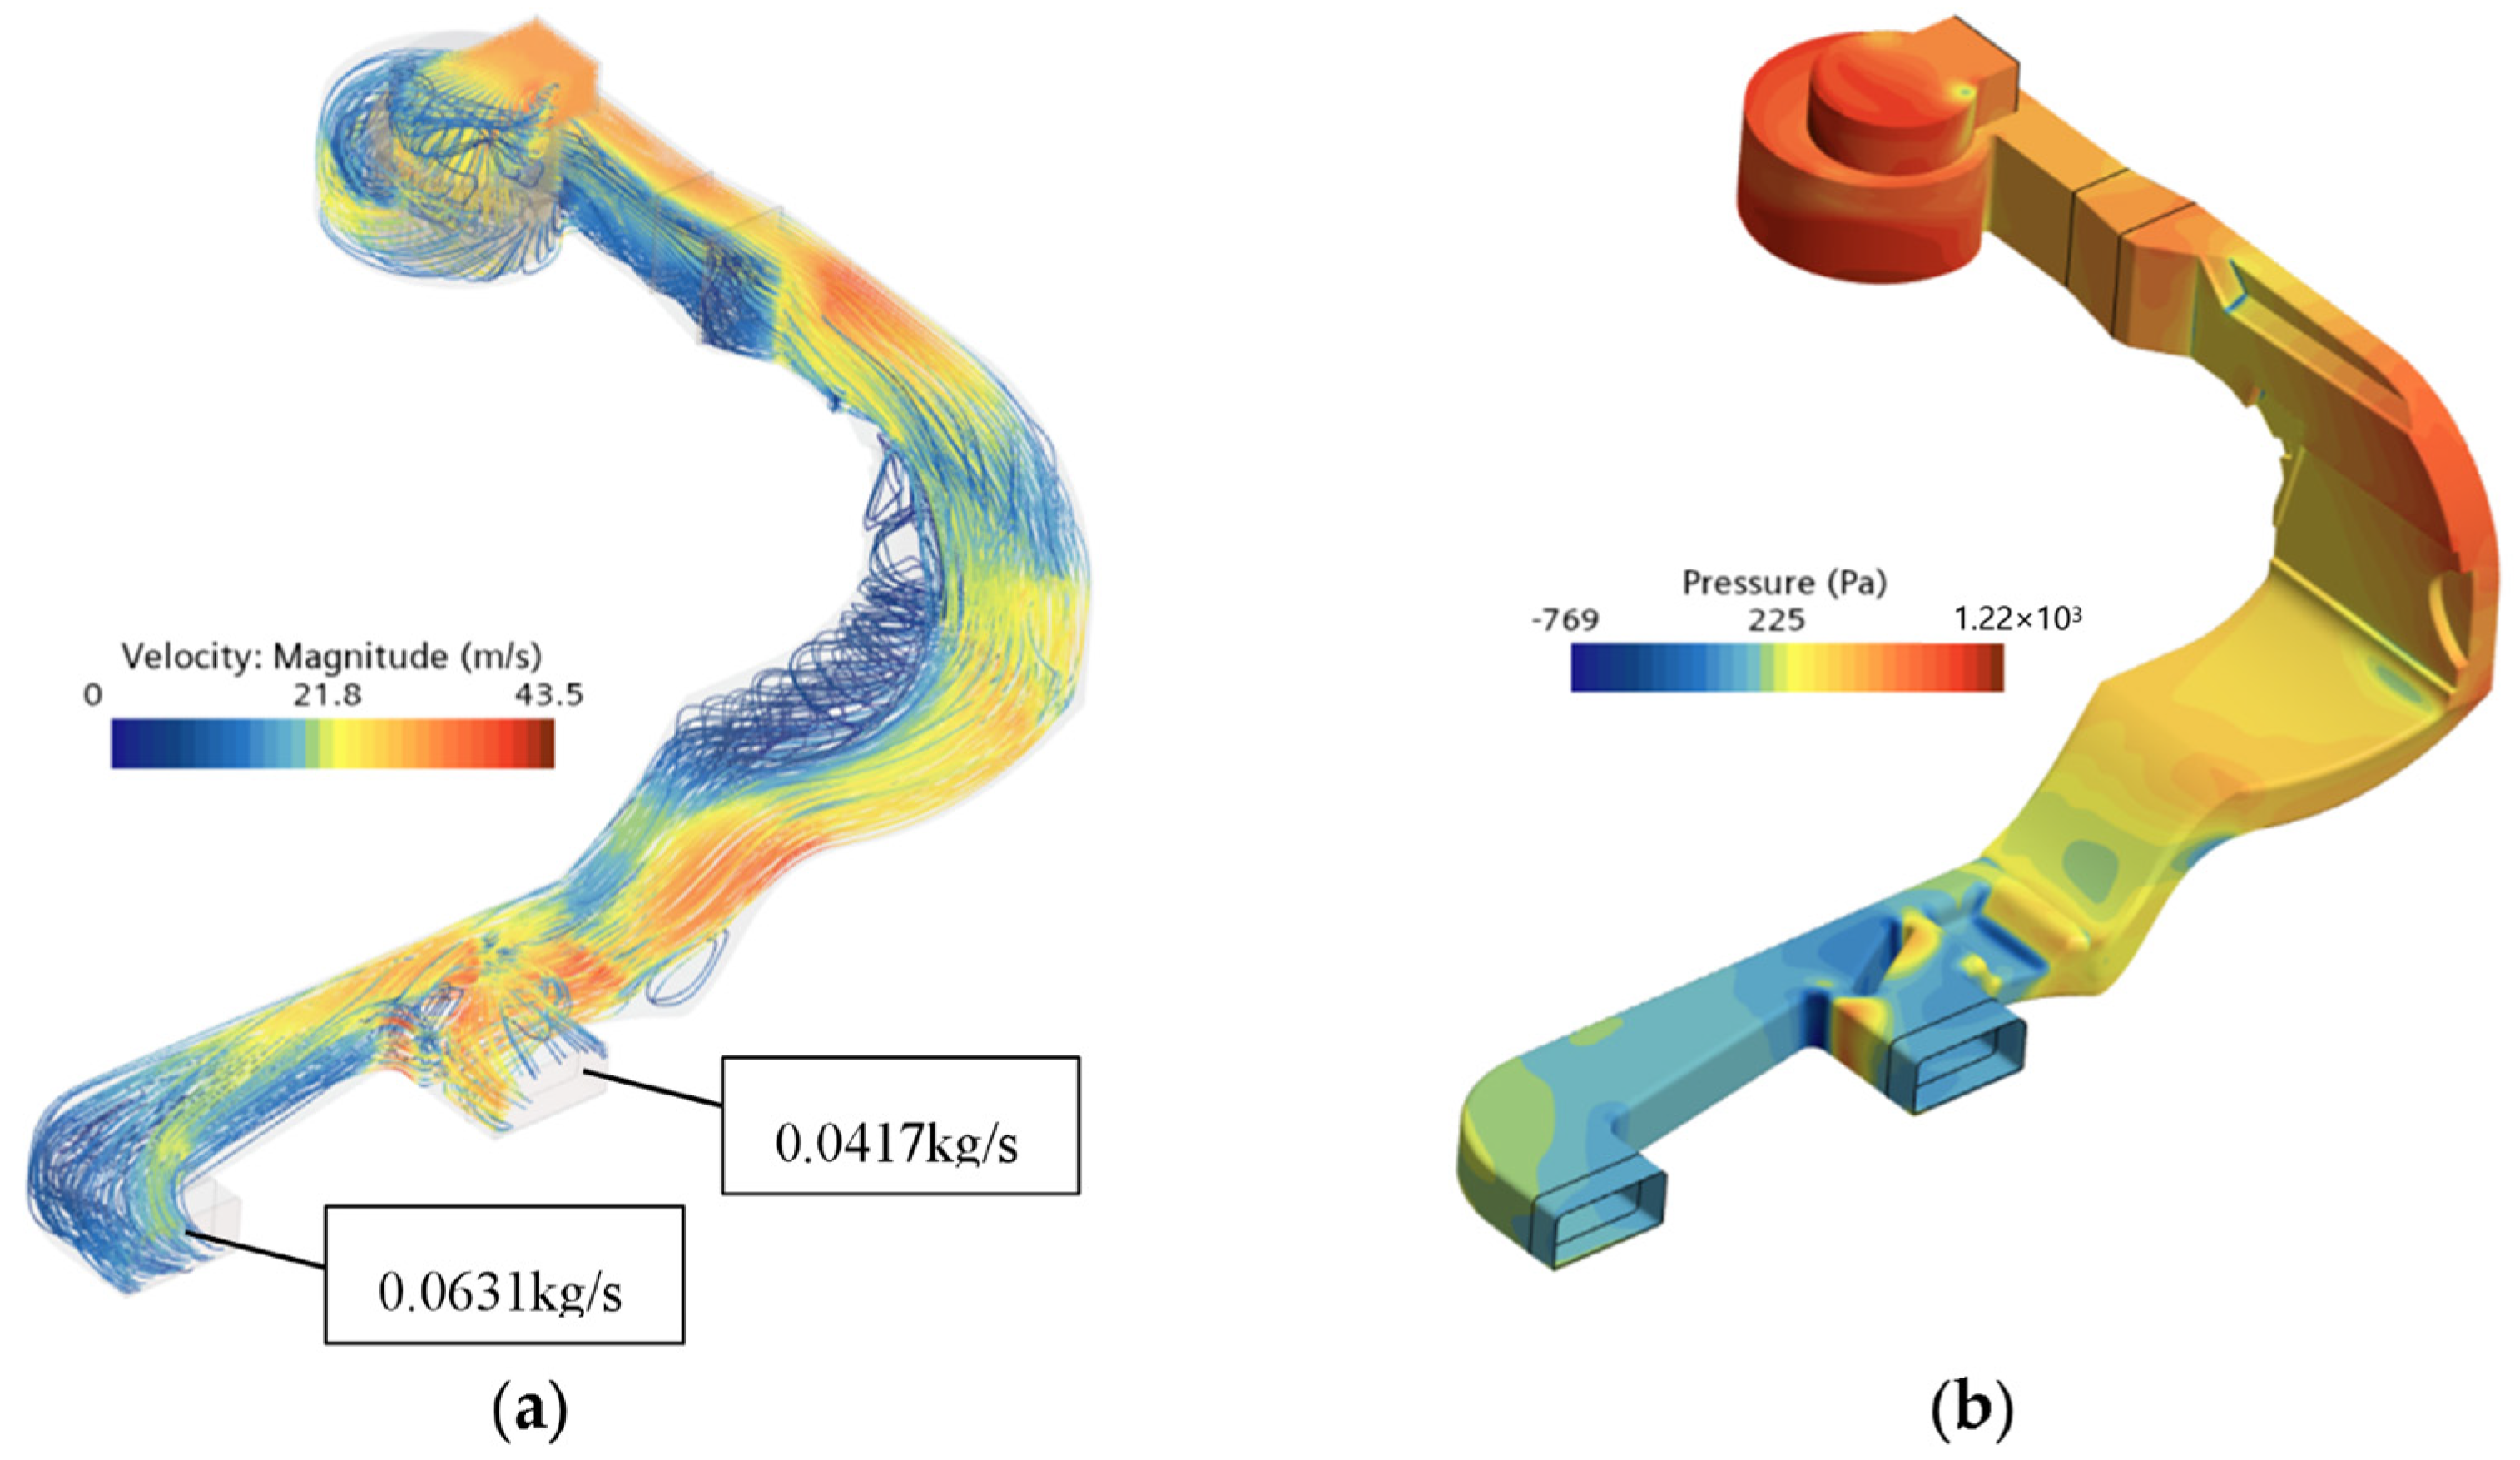
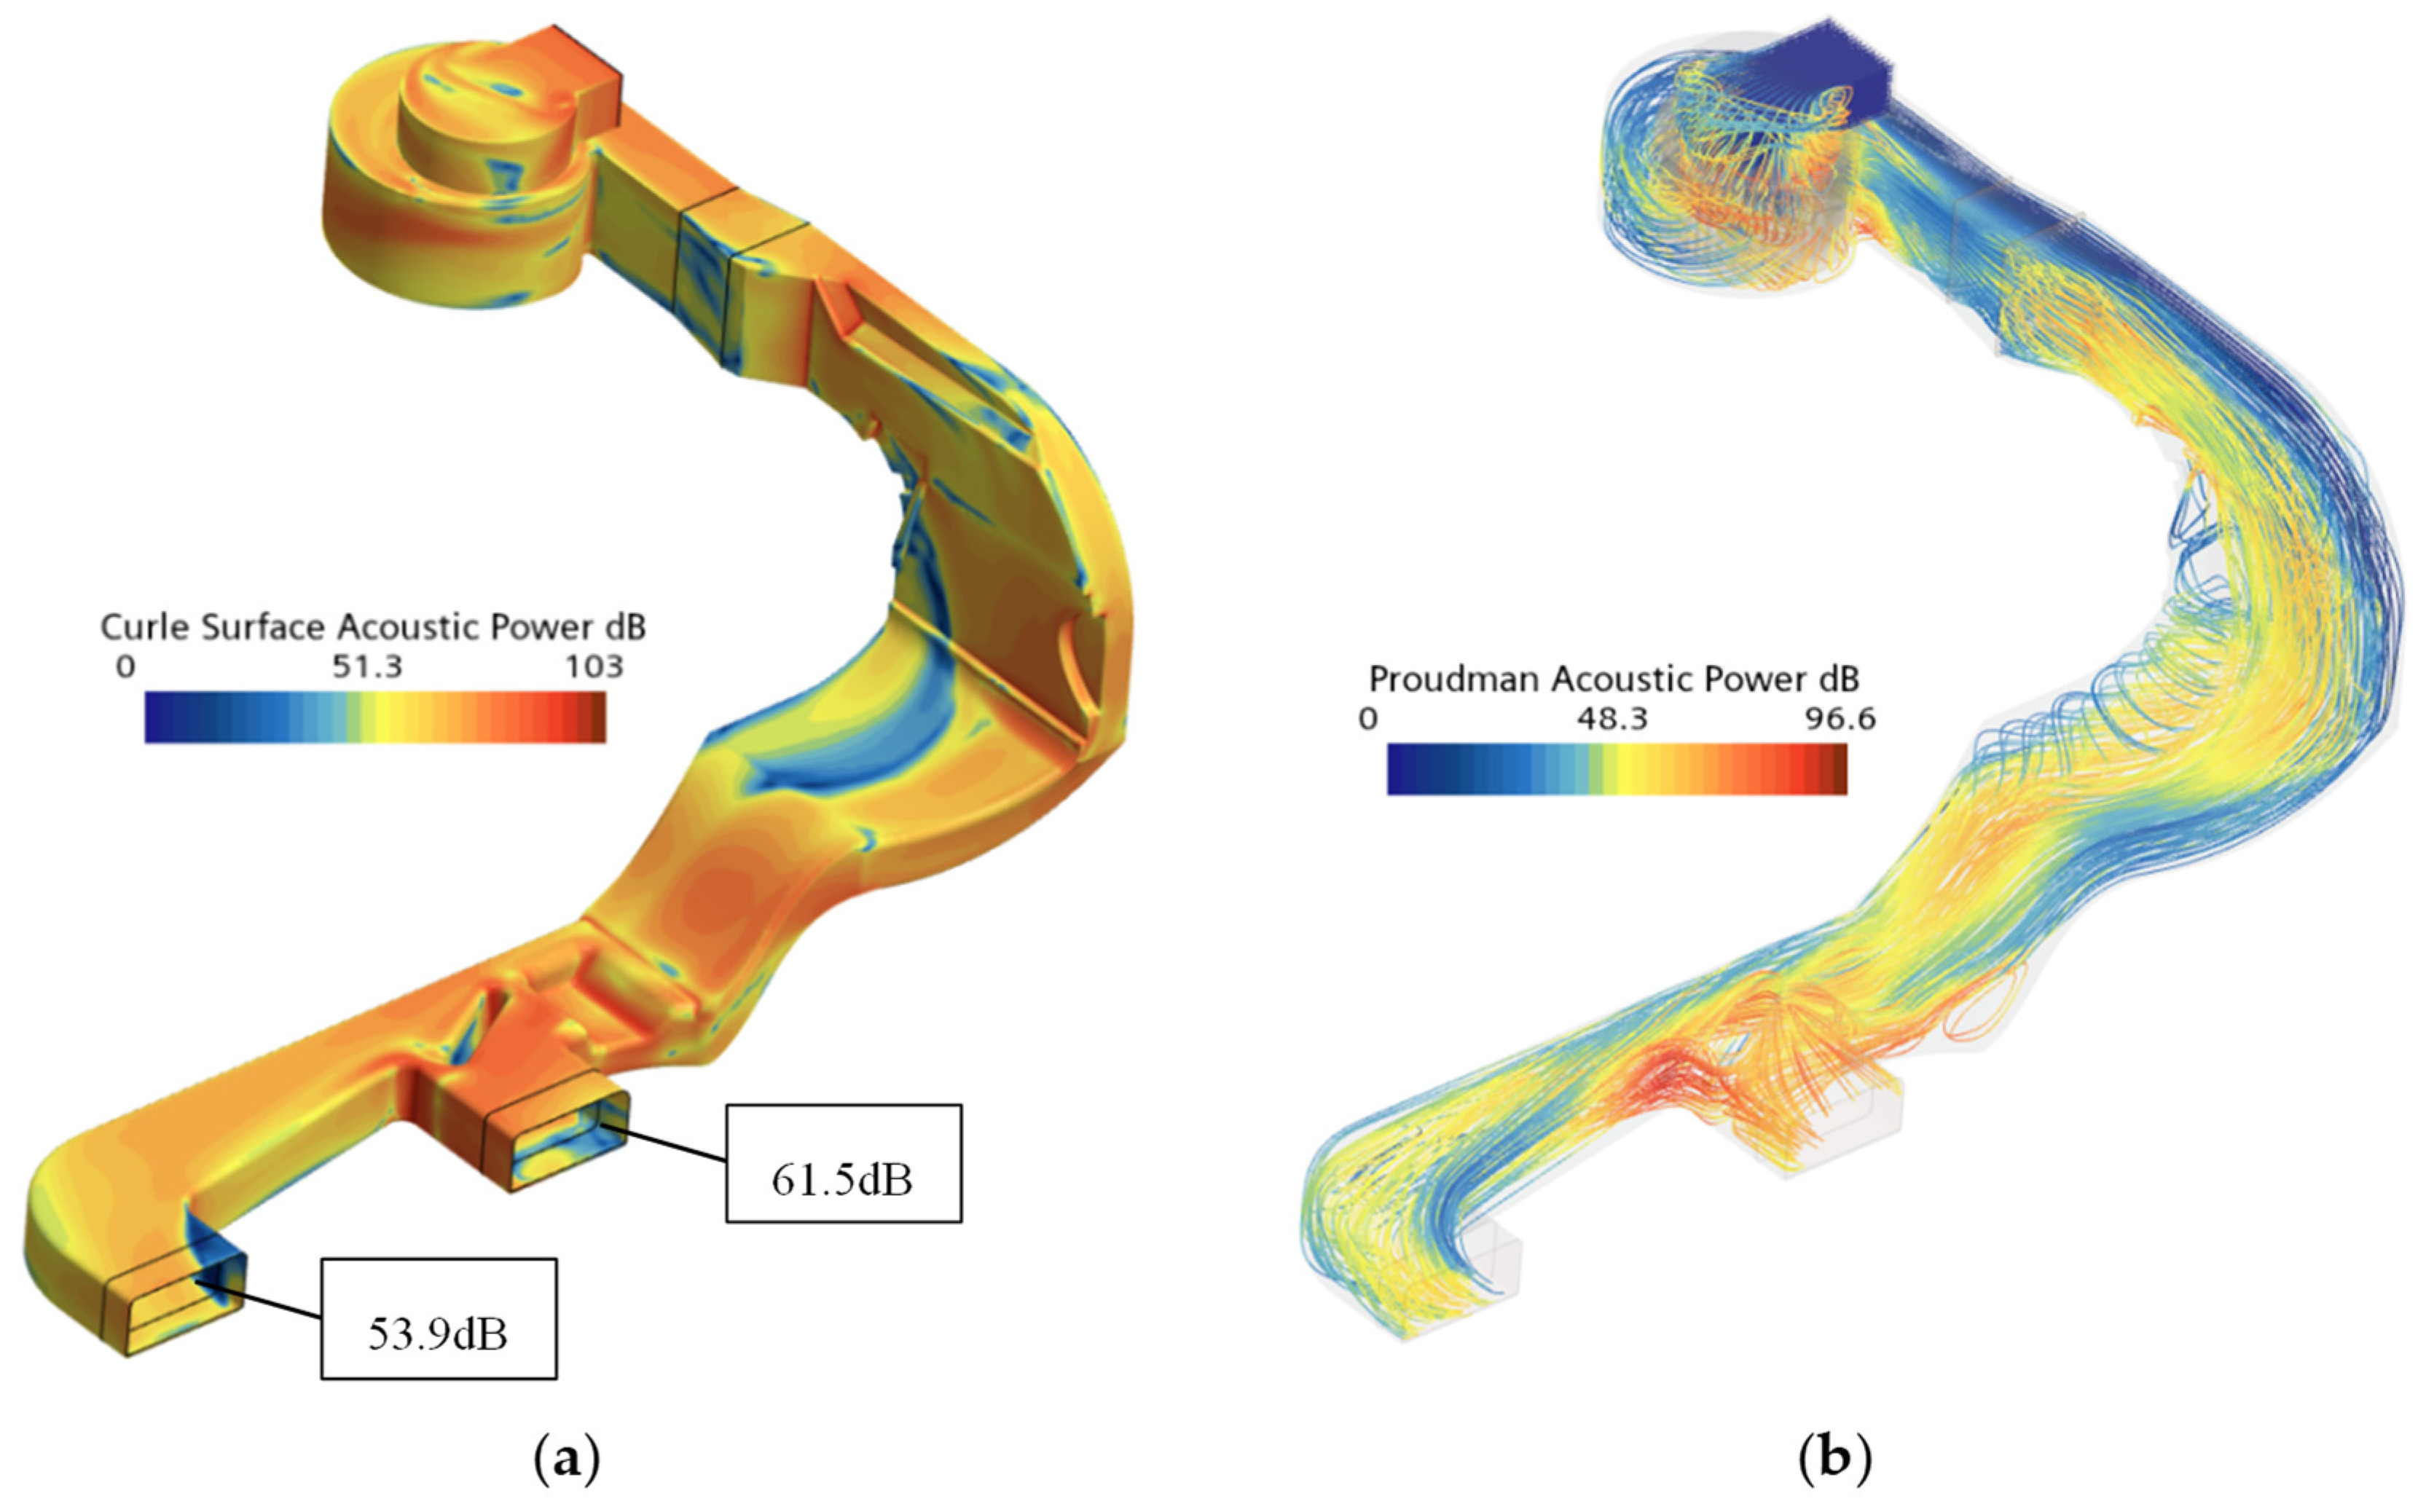
Flow field and acoustic field simulations of the blower-duct assembly are performed using STAR-CCM+ 2602. The flow field results are shown in Figure 4. At four locations—the blower deflector, the duct inlet, the air distribution port, and the narrow sections of the duct—both velocity and pressure are relatively high. The mass flow rates at Outlets 1 and 2 are 0.0417 kg/s and 0.0631 kg/s, respectively, indicating an uneven flow distribution. These findings are consistent with the acoustic field results shown in Figure 5, where the acoustic power levels at the same four locations are also high, with concentrated red regions. The noise levels at Outlets 1 and 2 are 61.5 dB and 53.9 dB, respectively.

3.3. Optimization Strategies for the Blower and Floor Duct

The acoustic field results of the blower-duct assembly in the original vehicle indicate that the aerodynamic noise in the duct is dominated by Curle wall noise, while the Proudman fluid vortex noise suffers substantial radiation loss. The reason is that the Curle wall acoustic power (Figure 5a) at the outlet end faces reaches 61.5 dB, while the Proudman fluid acoustic power (Figure 5b) in the duct is significantly lower. Therefore, the area-averaged Curle acoustic power on the square end faces of the duct outlets is selected as the optimization objective. This location represents the boundary where the airflow separates from the duct and diffuses to the external environment. The wall-turbulence-induced radiation noise at this boundary exhibits a high degree of consistency with the sound pressure variations perceived by the human ear at the outlets, and thus can quantitatively characterize the outlet radiation noise level.
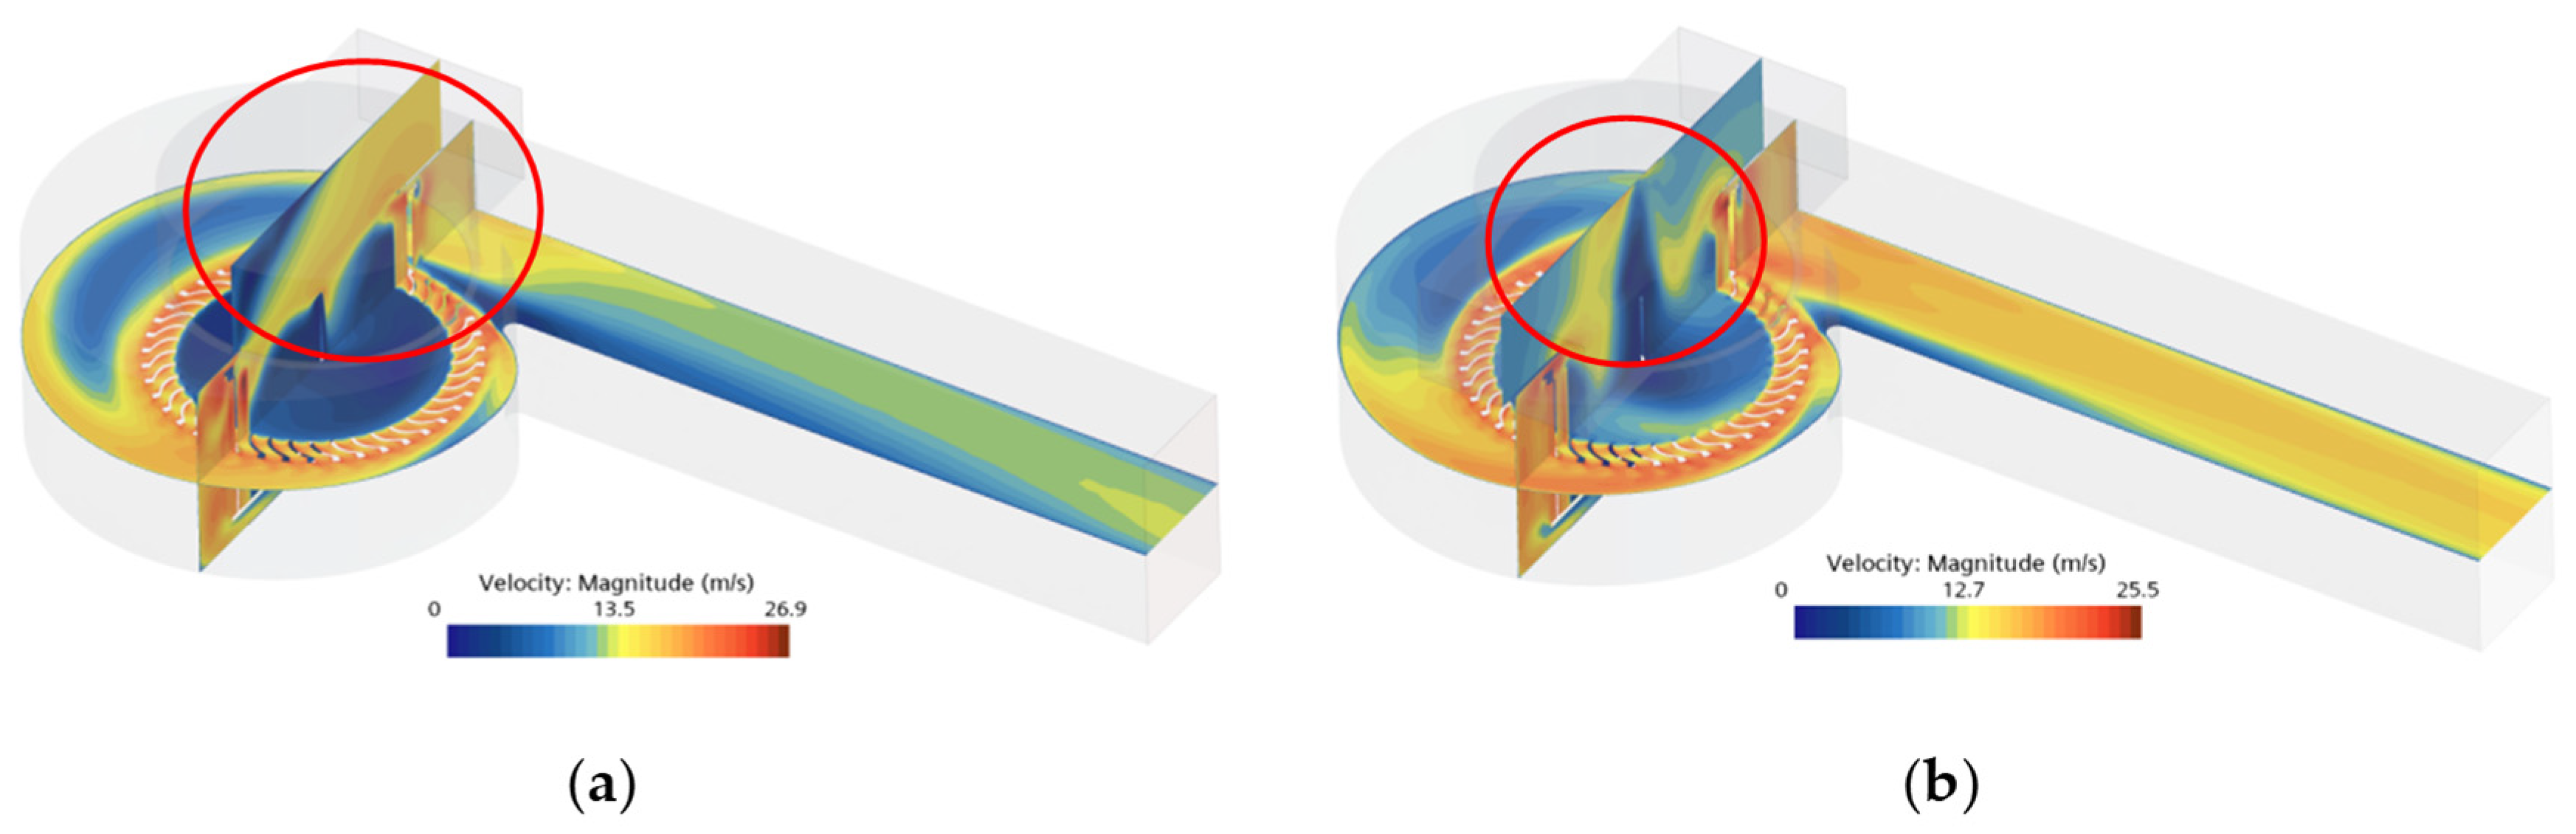
Regarding blower optimization, as shown in Figure 6a, the original blower inlet features a small intake passage, resulting in high intake resistance and relatively low airflow velocity, with a pronounced vortex region formed at the inlet. To reduce the significant vortex and pulsation at the inlet of the blower deflector, and to improve intake smoothness and airflow volume, a double-side slotting optimization design is implemented on the deflector, as illustrated in Figure 6b. After this modification, the intake resistance is reduced, the inlet velocity is lower with a more uniform flow field, and the velocity in the outlet duct is higher and more evenly distributed, with a marked reduction in the vortex region.
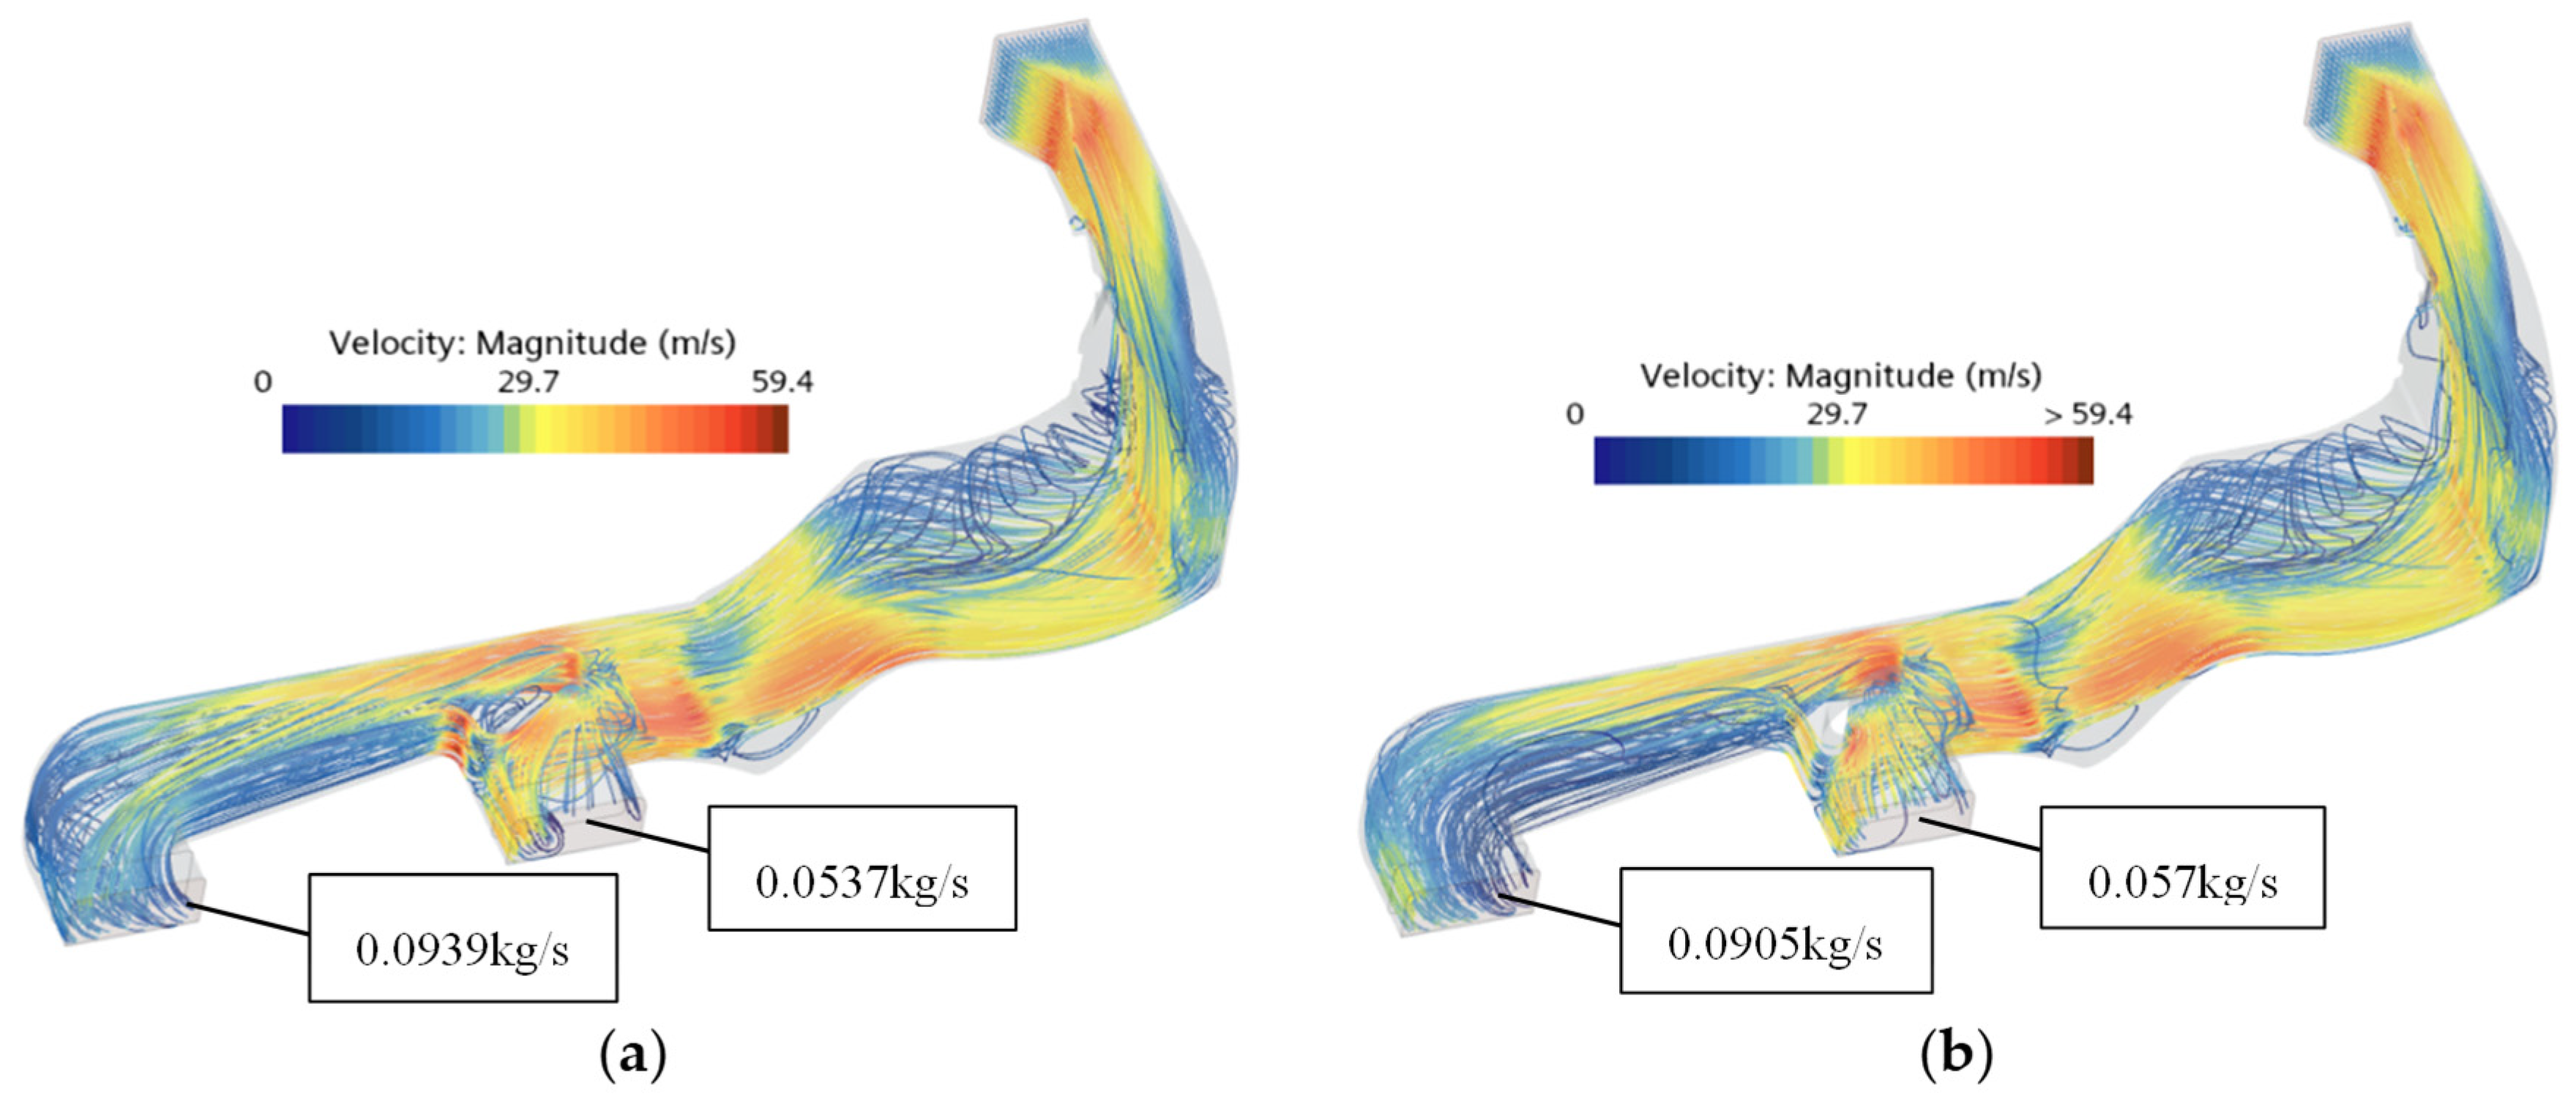
In terms of duct geometry, the air distribution plate in the original vehicle duct is designed with an inclined configuration. As shown in Figure 7a, the streamline separation near the distribution plate is poor, indicating insufficient flow separation effectiveness at this location. After changing the inclined plate to a curved configuration as shown in Figure 7b, the mass flow rates at Outlets 1 and 2 are adjusted from 0.0537 kg/s and 0.0939 kg/s to 0.057 kg/s and 0.0905 kg/s, respectively, resulting in a more reasonable flow distribution. Therefore, the subsequent structural optimization is carried out based on the dual-inlet blower and the curved air distribution plate.
To further reduce the noise at the outlets, it is necessary to optimize the parameters of the duct inlet as well as the width and depth of the clearance groove. The response surface methodology (RSM) is adopted for this optimization, which combines experimental design with mathematical statistics. Based on a well-designed experimental plan, simulations are carried out, and a multivariate quadratic regression equation is established from the simulation data to approximate the functional relationship between the design variables and the optimization objective. Finally, a set of optimal parameters is obtained based on this functional relationship. The second-order polynomial of the response surface is given in Equation (4):
y = β 0 + β 1 x 1 + β 2 x 2 + β 3 x 3 + β 4 x 1 2 + β 5 x 2 2 + β 6 x 3 2 + β 7 x 1 x 2 + β 8 x 1 x 3 + β 9 x 2 x 3
After obtaining the response surface polynomial, the coefficient of determination R2 and the adjusted coefficient of determination Radj2 are used to verify the goodness-of-fit of the regression model. The closer these values are to unity, the better the model fits the data [10].

3.3.1. Selection of Design Variables

The sound pressure level at Outlet 1 is selected as the optimization objective. Three structural parameters that significantly influence the outlet airflow rate and noise are chosen as design variables, as shown in Figure 3a: X1—corner radius at the duct inlet; X2—length of the clearance groove; and X3—depth of the clearance groove. The three design variables were selected based on the following considerations. First, a preliminary sensitivity analysis was conducted by varying each geometric parameter individually while keeping others constant. The results showed that these three parameters had the most significant influence on the outlet sound pressure level among all geometric features of the duct. Second, these parameters are directly related to the key flow features that affect aerodynamic noise: X1 determines the smoothness of the airflow turning at the duct inlet, where flow separation and vortex formation are most likely to occur, and X2 and X3 govern the cross-sectional area and flow passage of the clearance groove, which directly affect the local flow velocity and pressure drop. Third, these parameters are independent of each other, with negligible coupling effects, making them suitable for the response surface methodology. The constraint ranges of the design variables are determined based on the duct structural characteristics, and the factor levels are detailed in Table 3.

3.3.2. Response Surface Model Fitting

The factor levels of the three design variables are input into the Box–Behnken module of Design-Expert software, generating 15 experimental sample sets. For each set, the corresponding three-dimensional geometric model is created in CATIA, and meshing is performed sequentially. The mesh models are then imported into STAR-CCM+ 2602, and the sound pressure level at Outlet 1 is computed for each of the 15 sample sets. By fitting the 15 sets of design variables and corresponding sound pressure values, the response surface equation is obtained as follows:
Outlet 1 = 71.81 − 0.18X1 − 0.09X2 − 1.64X3 − 5.33 × 10−4X1X2 + 2.29 × 10−3X1X3 + 1.9 × 10−3X2X3 + 2.84 × 10−3X12 + 1.22 × 10−3X22 + 0.06X32
The coefficient of determination R2 and the adjusted coefficient of determination Radj2 of this fitted equation are 0.9804 and 0.945, respectively: both greater than 0.9 and close to unity. The predicted coefficient of determination Rpred2 is 0.8185, and the difference between Rpred2 and Radj2 is less than 0.2, indicating a good model fit and suitability for further prediction and optimization analysis.
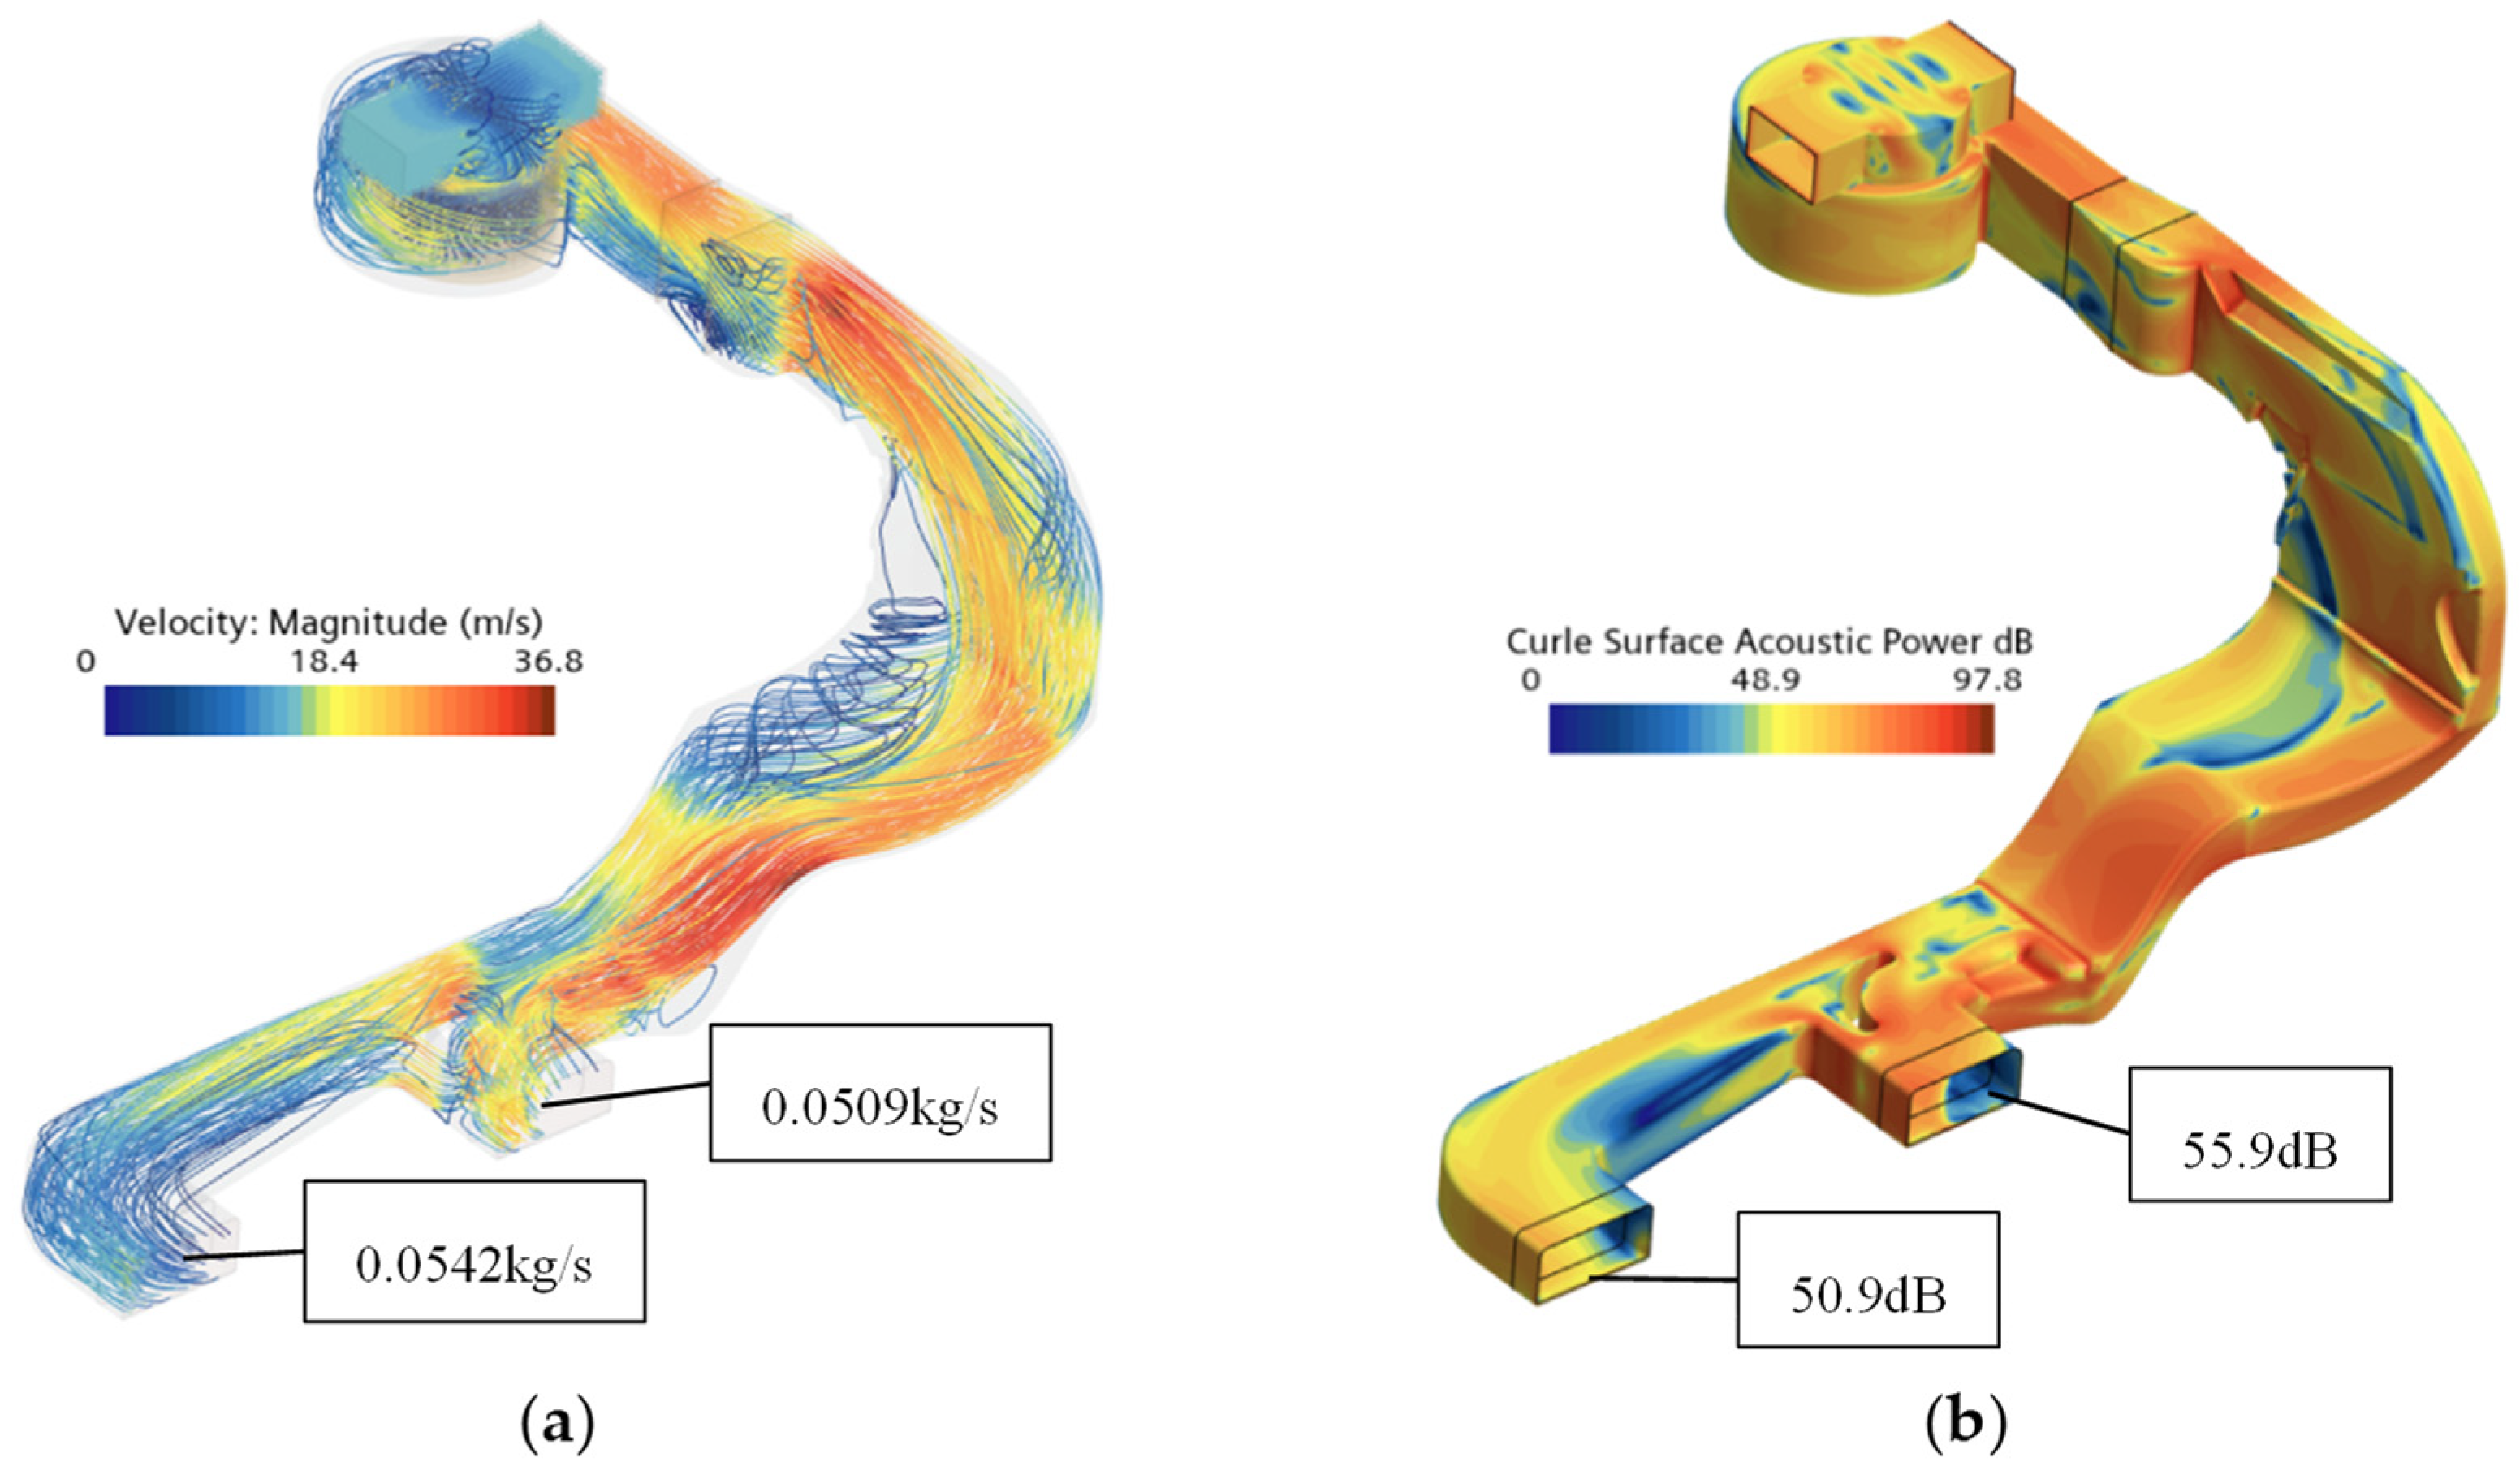
In the numerical optimization module of the response surface, the minimization of Outlet 1 is set as the optimization objective. Within the specified constraint ranges, the optimal solution is obtained as X1 = 28.93 mm, X2 = 34.38 mm, and X3 = 13.7 mm, yielding a minimum predicted value of Outlet 1 = 56.37 dB, with a desirability of 0.978. A simulation is then conducted under these optimal conditions, and the results are shown in Figure 8. The sound pressure level at Outlet 1 is 55.9 dB, with a deviation of only 0.47 dB from the predicted value. In addition, the mass flow rates at Outlets 1 and 2 are 0.0509 kg/s and 0.0542 kg/s, respectively, indicating a more balanced flow distribution, which can be further validated through experimentation.

4. Experimental Validation

4.1. Experimental Setup

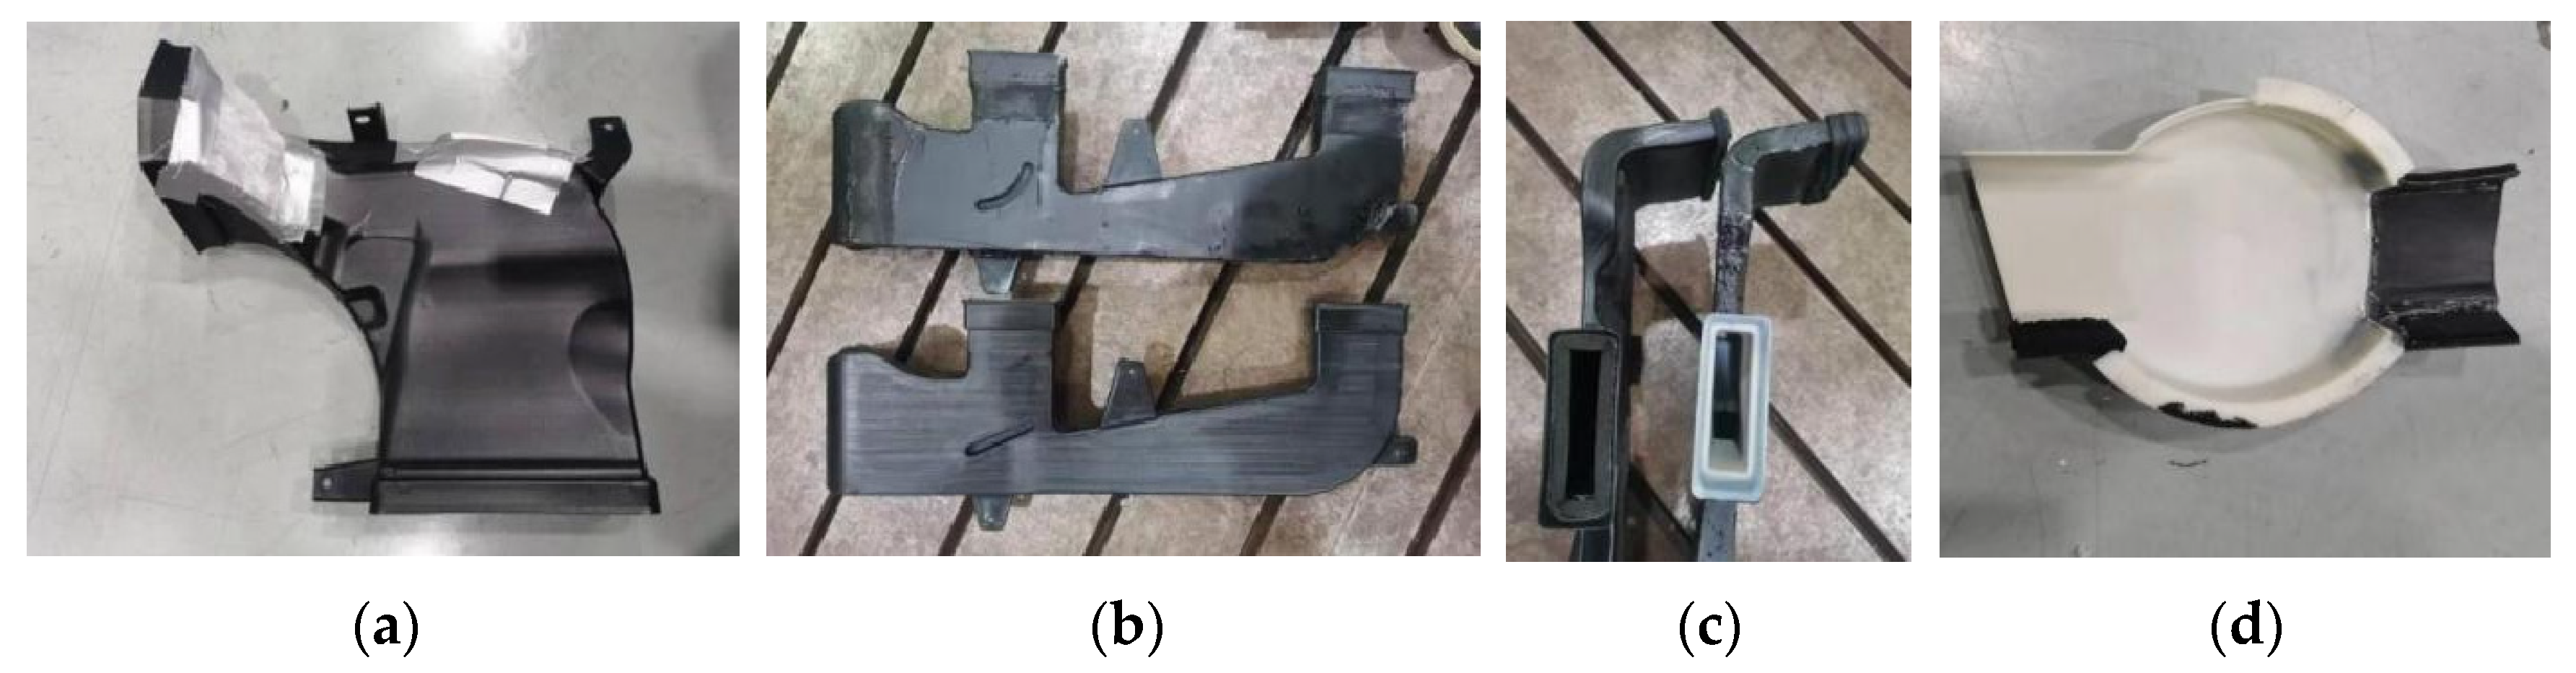
To validate the optimization effects of the rear floor duct and the blower deflector in the test vehicle, the optimized components are fabricated using 3D-printing technology, as shown in Figure 9. Noise experiments are conducted separately on the floor duct (components a, b, and c in Figure 9) and the modified blower deflector (component d in Figure 9). Additionally, acoustic package materials such as sound-absorbing cotton are applied at the pipe connections for passive vibration isolation and sound absorption. The experiments are carried out in the same full-vehicle semi-anechoic chamber, using the same instrumentation and under the same test conditions as described in Section 2.1.

4.2. Experimental Results

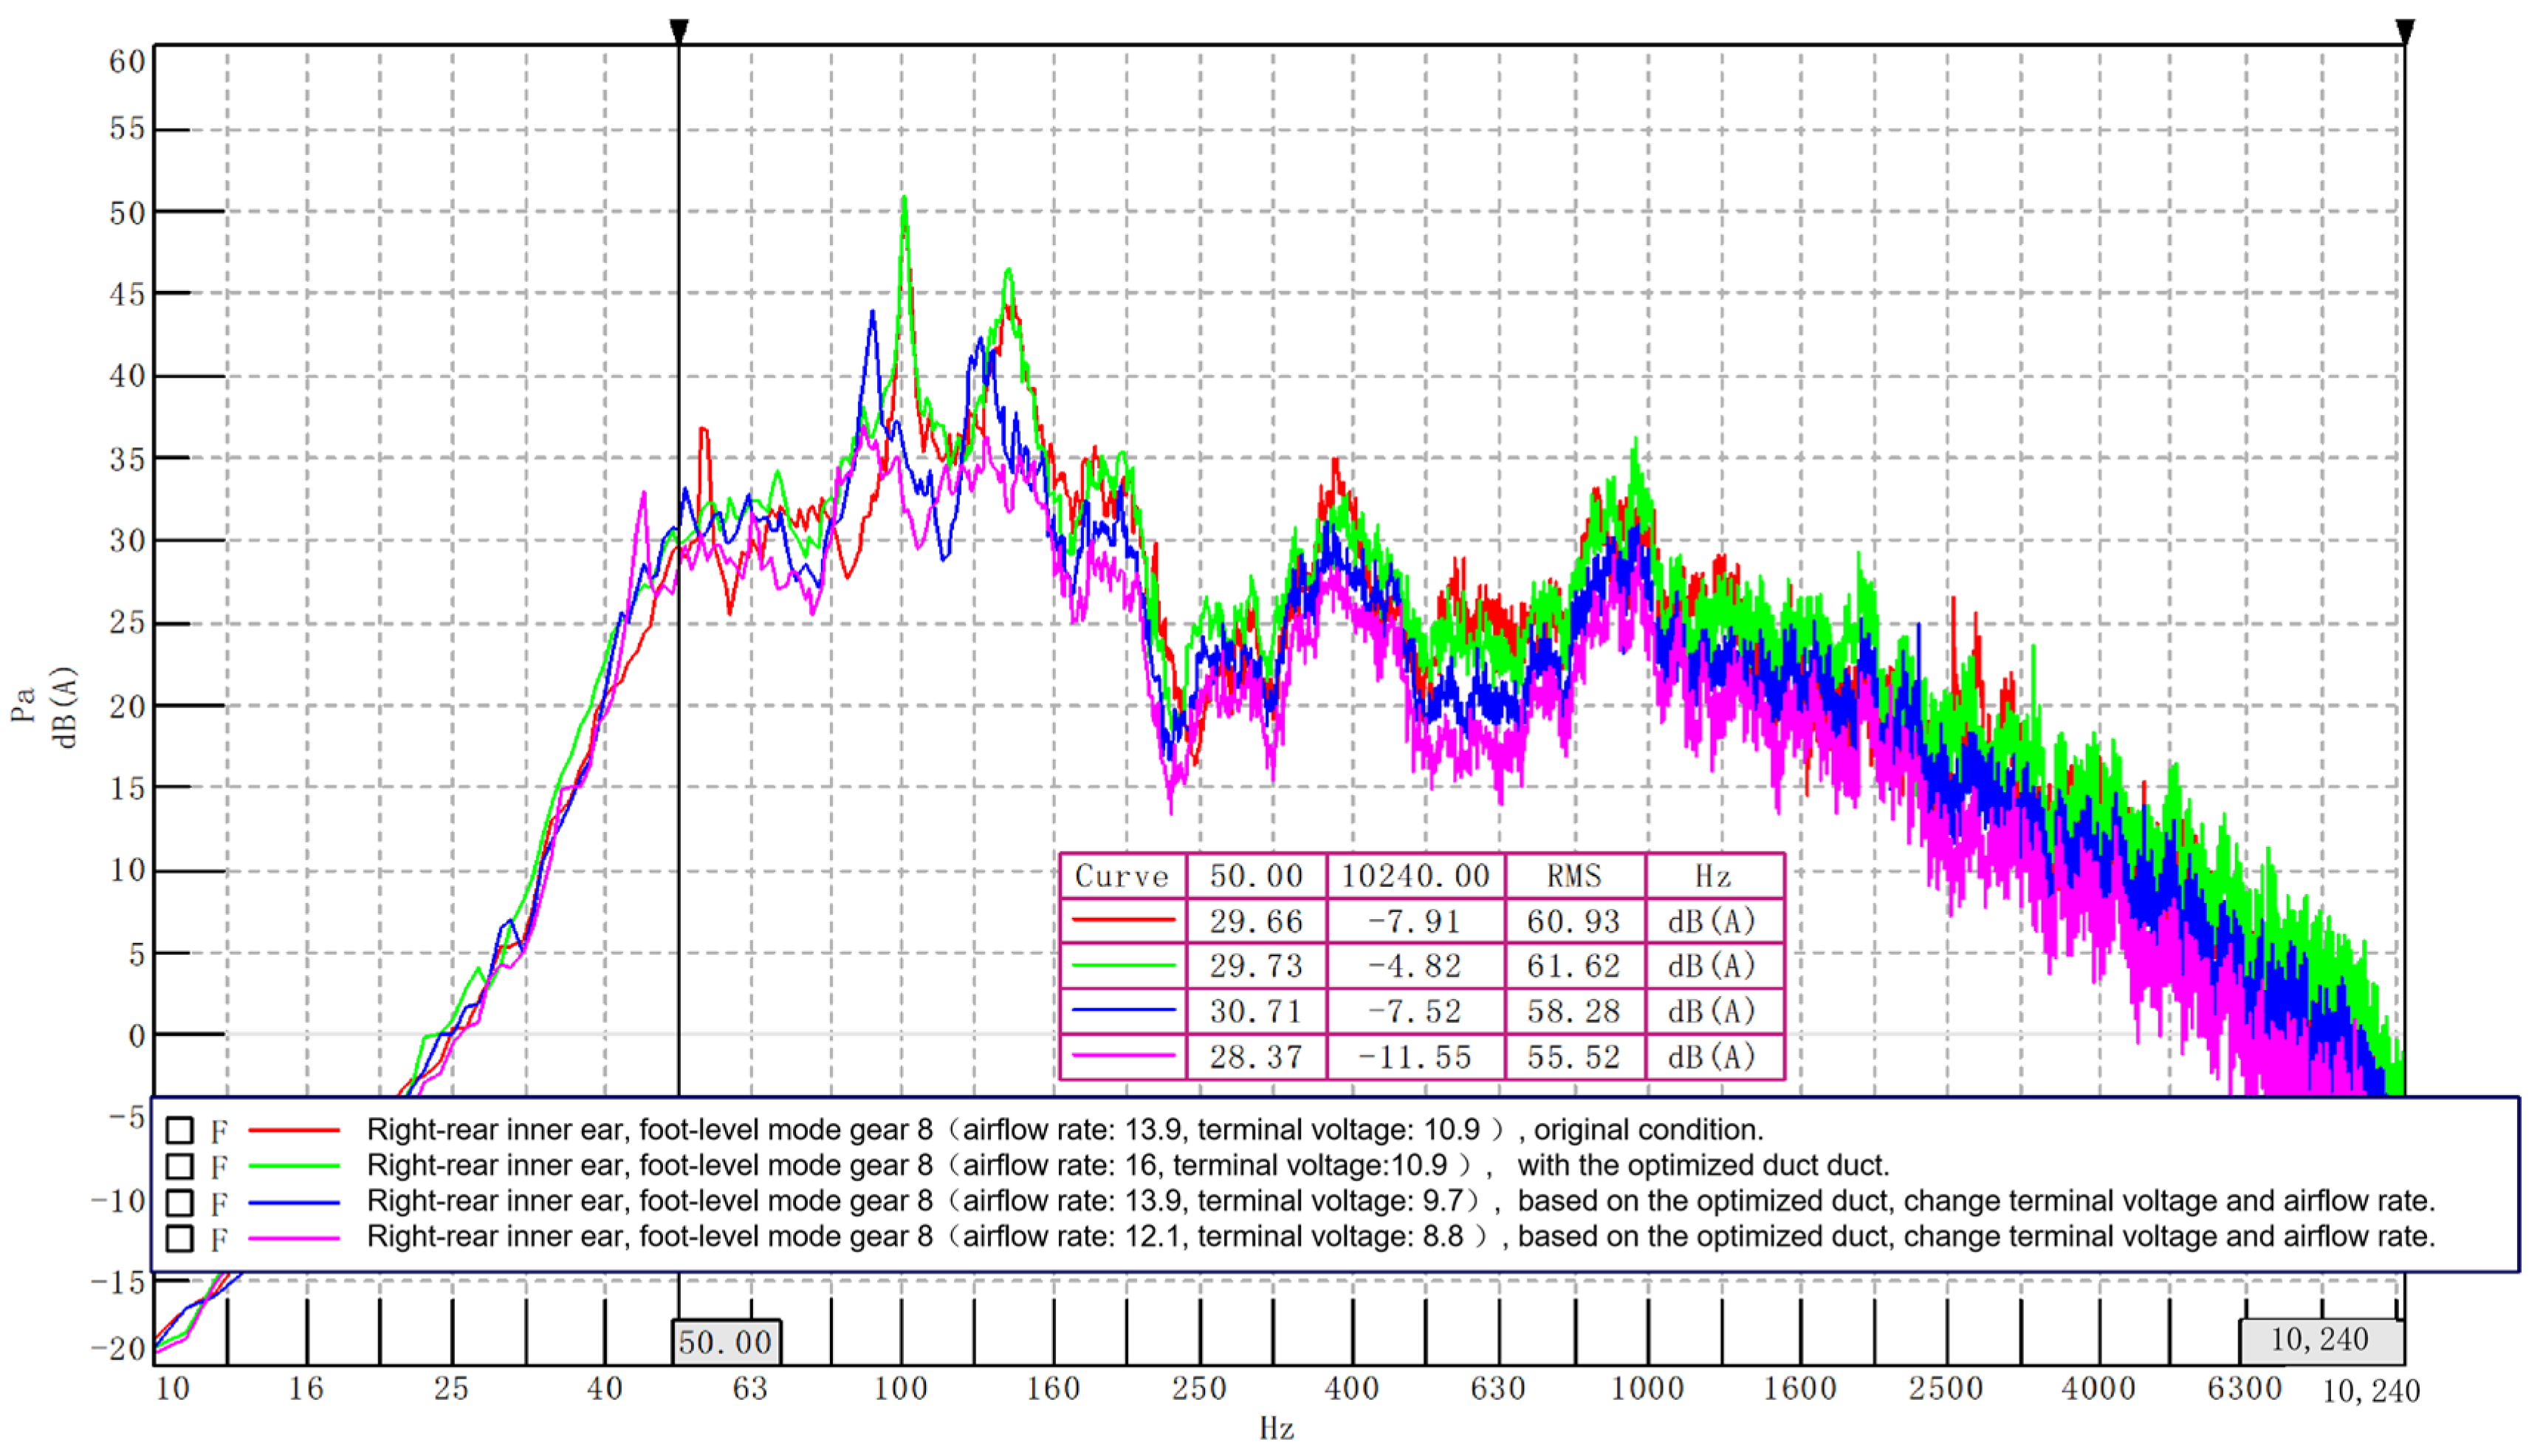
The noise measurement results after separately replacing the optimized floor duct are shown in Figure 10. Compared with the original vehicle configuration, the airflow rate increased with the optimized duct, but the low-frequency rumble noise inside the cabin remained noticeable. Therefore, in order to enhance the comparability and fairness of the experimental results, the blower terminal voltage is adjusted to 9.7 V, using a regulated power supply to maintain the same airflow rate (13.9 m/s) as the original configuration. Under this condition, the low-frequency rumble noise is significantly reduced: the peak sound pressure decreases from 47.8 dB to 44.1 dB, representing a reduction of 3.7 dB, while the RMS sound pressure level over the 50–10,240 Hz frequency band decreases from 61.62 dB to 58.28 dB, corresponding to a reduction of 3.34 dB in the average sound pressure. Similarly, by further reducing the terminal voltage to 8.8 V, the blower can be operated as gear 7.
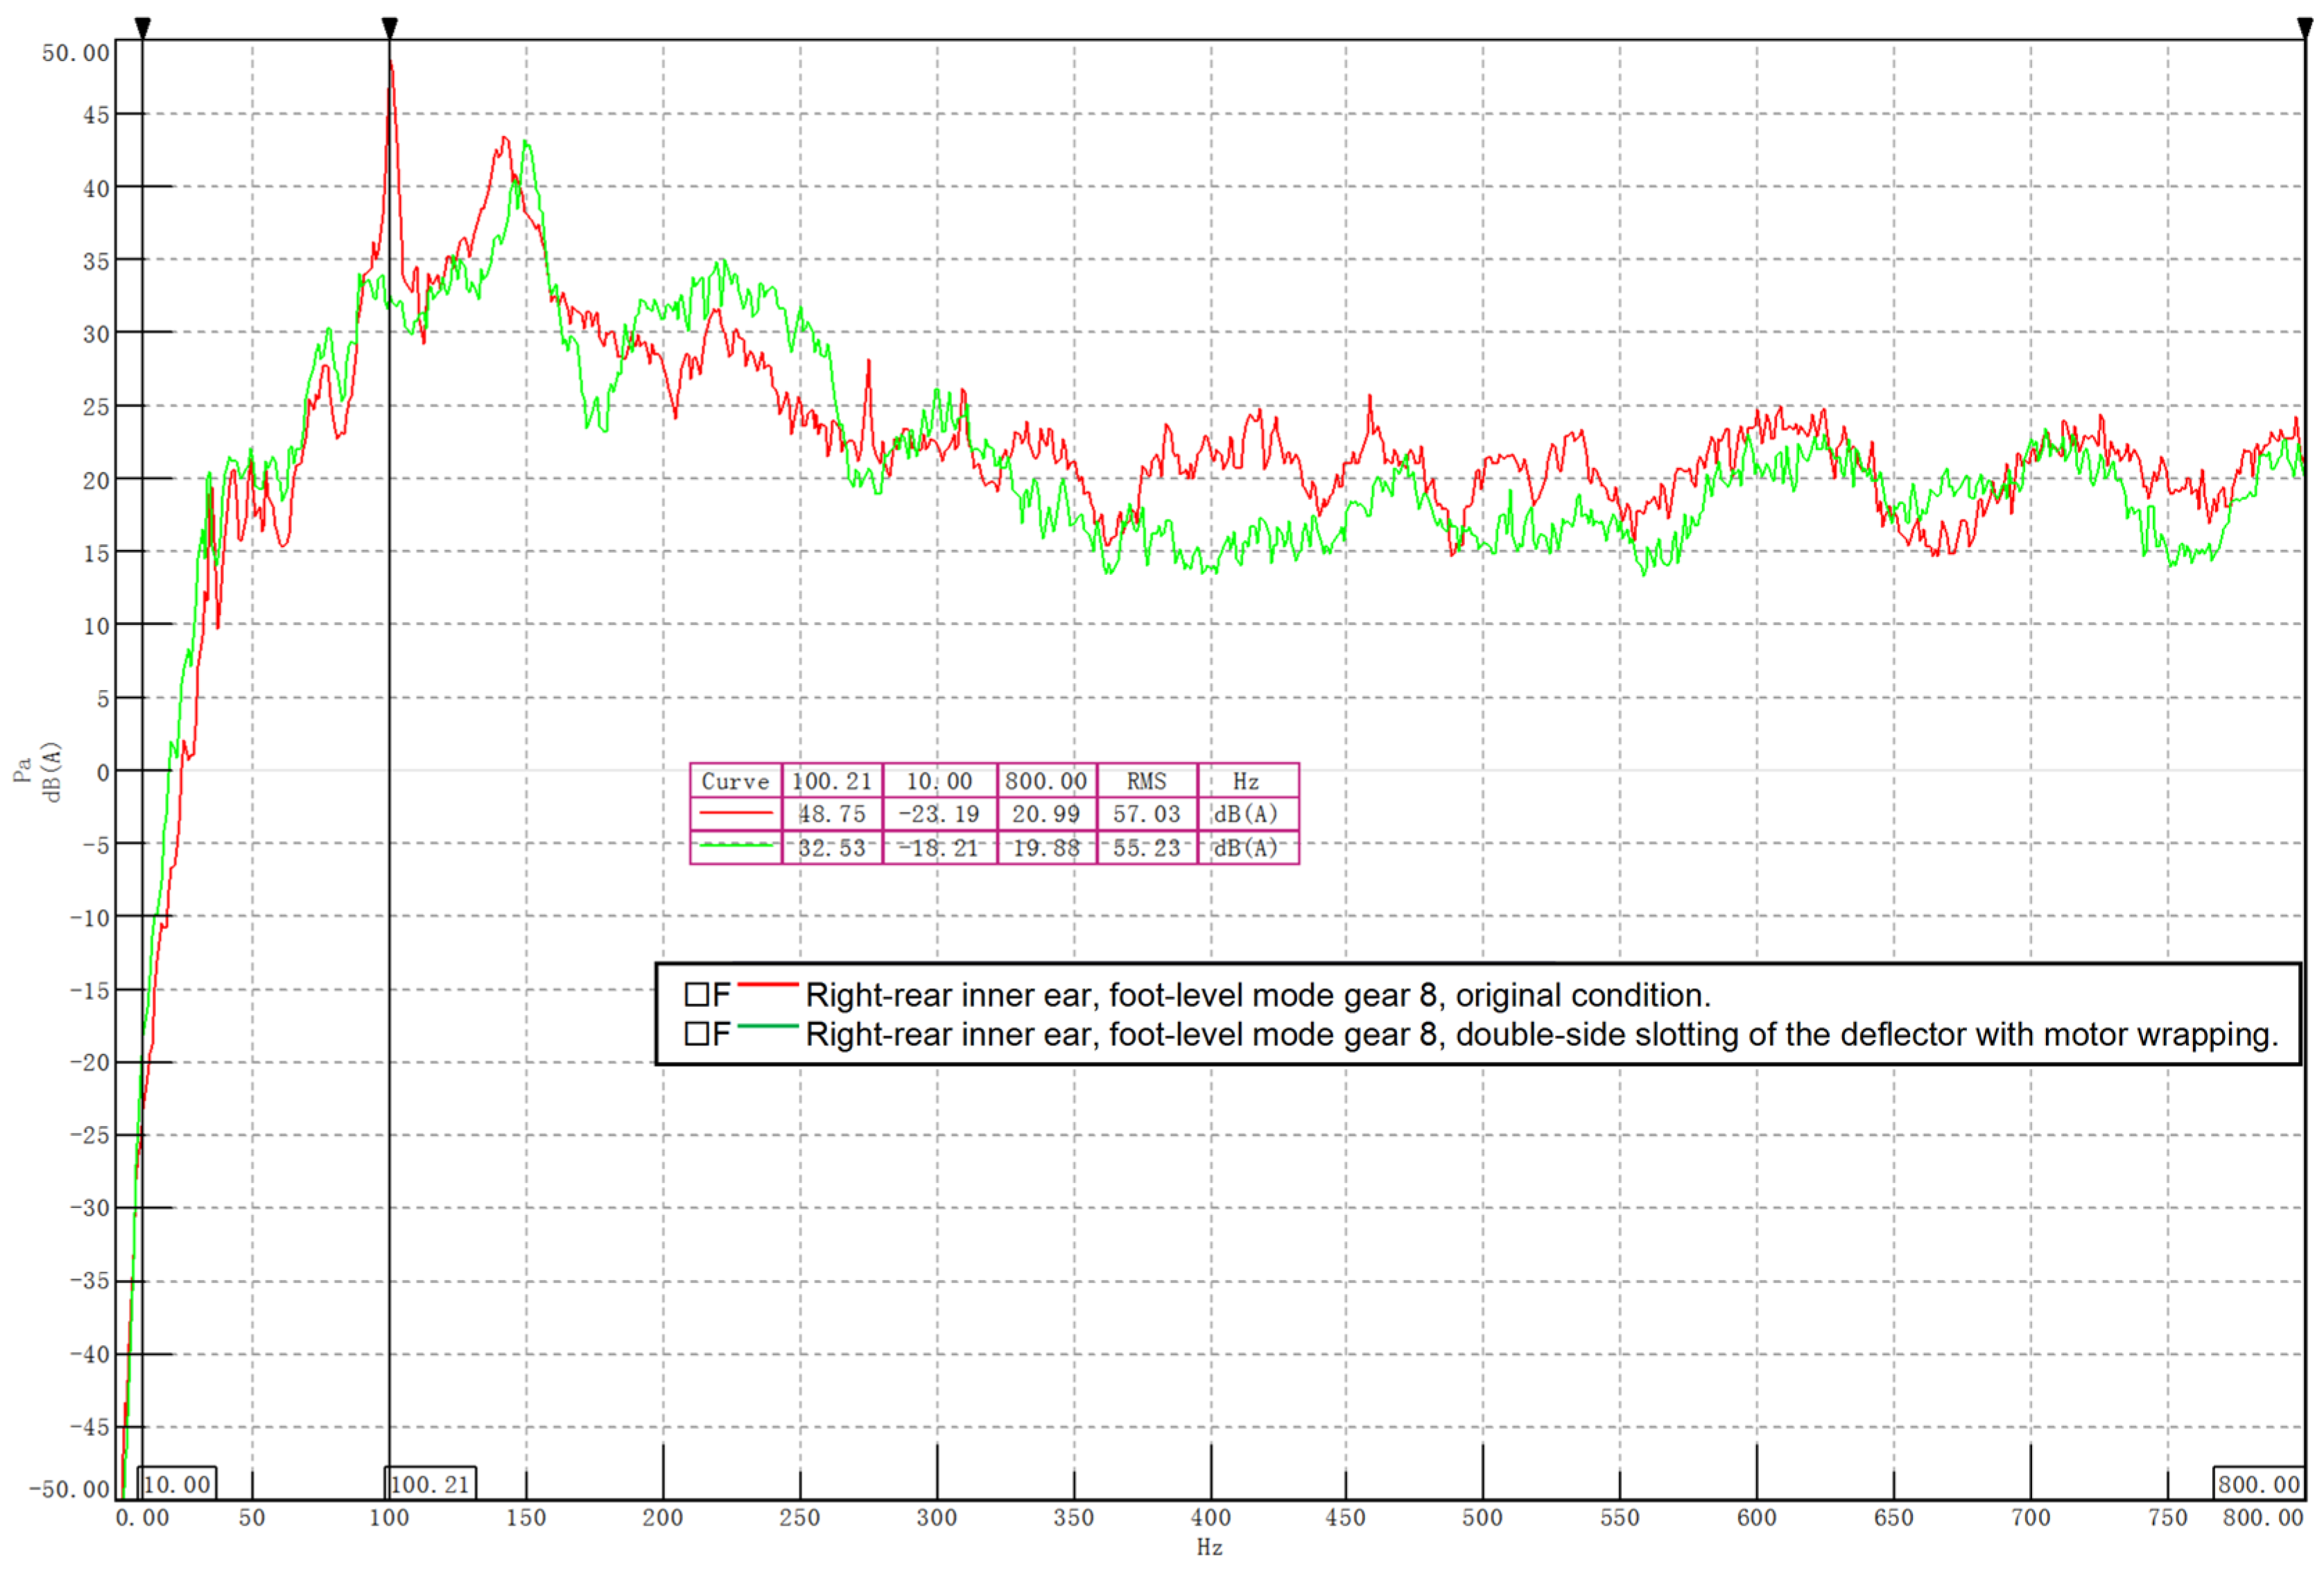
In a separate test, the optimized blower deflector is replaced independently, and the noise measurement results are shown in Figure 11. Under the same airflow rate condition, compared with the original vehicle, the double-side slotting design of the deflector significantly reduces the low-frequency noise. The peak sound pressure decreases from 48.75 dB to 32.53 dB, representing a reduction of 16.22 dB. The RMS sound pressure level over the 50–800 Hz frequency band decreases from 57.03 dB to 55.23 dB, corresponding to a reduction of 1.8 dB in the average sound pressure. Here, it is worth noting that for the floor duct optimization experiment, the peak sound pressure of the original vehicle configuration was 47.8 dB at the dominant frequency; as the blower deflector optimization experiment was conducted separately under identical test conditions, the peak sound pressure of the original vehicle configuration was 48.75 dB.
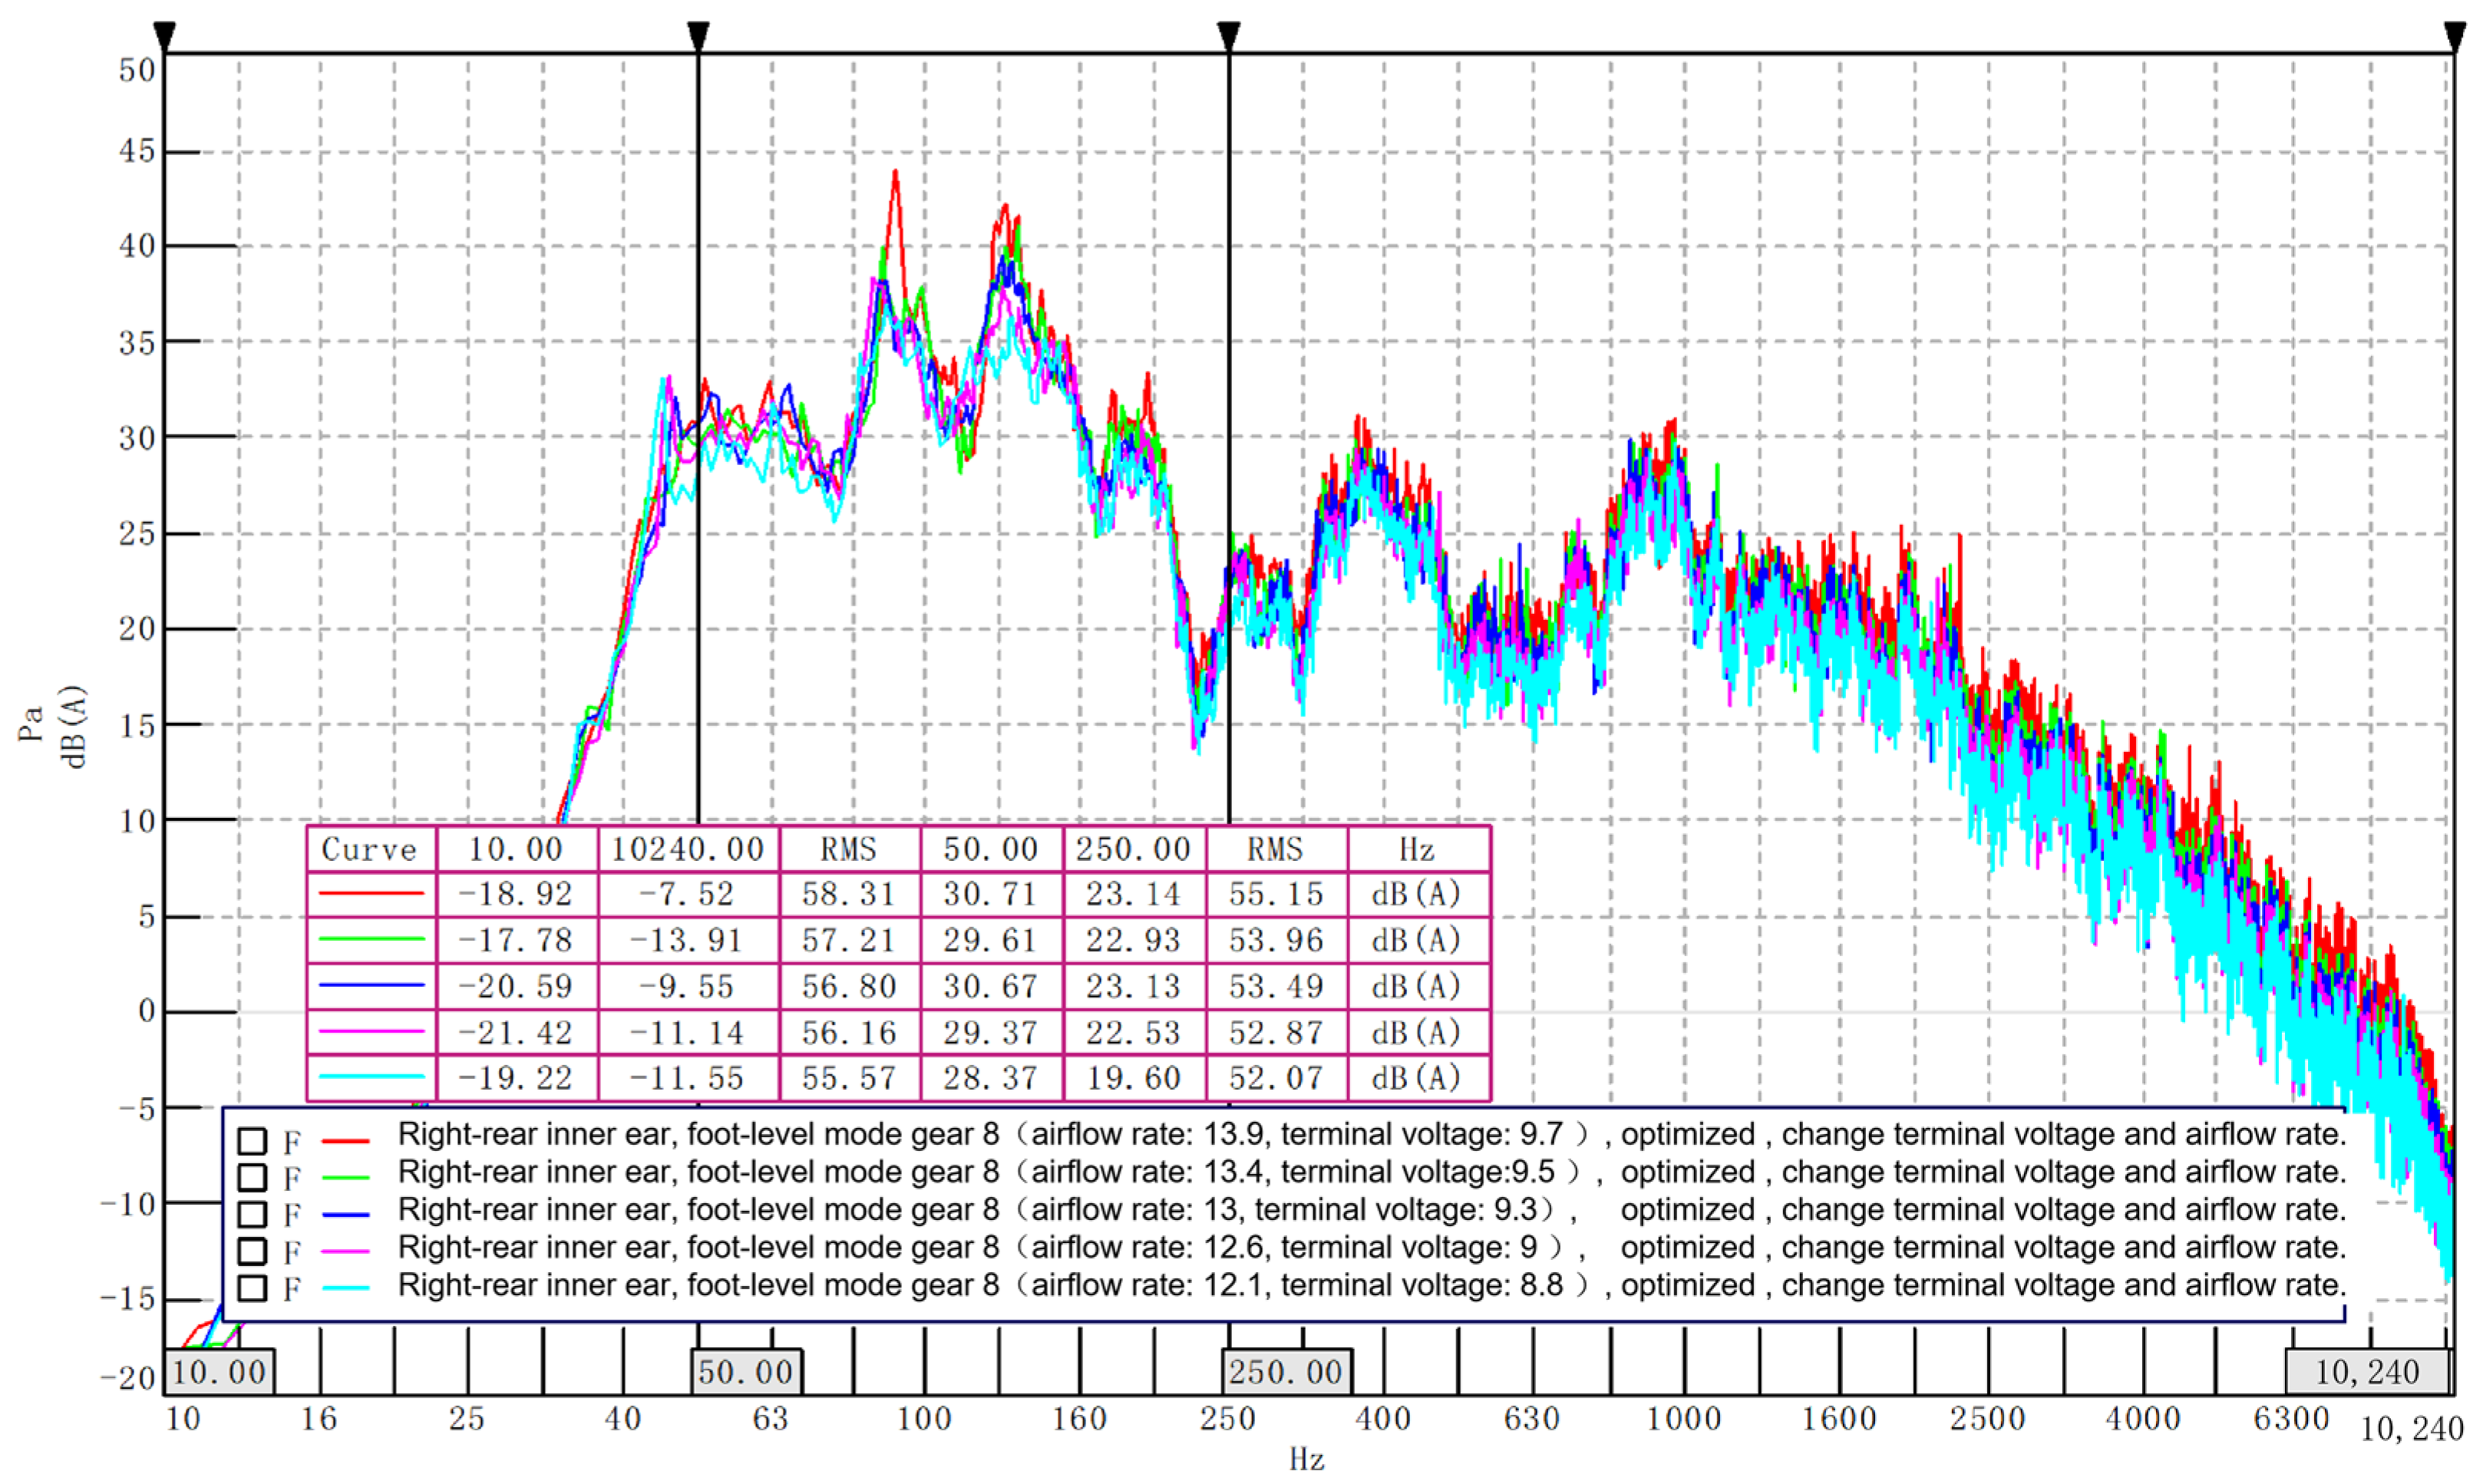
The optimized duct and blower deflector are replaced simultaneously, and the blower terminal voltage is controlled within the range of 9.7 V to 8.8 V using a regulated power supply. The sweep frequency test results are shown in Figure 12. The RMS sound pressure level over the 50–250 Hz frequency band decreases from 55.15 dB to 52.07 dB, corresponding to a reduction of 3.08 dB in the average sound pressure. Further reduction in the outlet sound pressure level could be achieved by adjusting the blower terminal voltage; however, this would decrease the airflow rate at the floor outlets and compromise the A/C performance. Thus, a trade-off between noise reduction and cooling performance must be carefully balanced.
In conclusion, when the optimized blower deflector and floor duct are replaced individually, both the peak sound pressure and the average sound pressure are significantly reduced. The peak sound pressure reductions are 16.22 dB and 3.7 dB, respectively, while the average sound pressure reductions are 1.8 dB and 3.34 dB, respectively. These results demonstrate that the structural optimizations of both the duct and the blower deflector are effective. With simultaneous optimization of the blower deflector and the duct geometry, under the same airflow rate condition (the blower terminal voltage is 9.7 V), the measured RMS sound pressure level in the 50–250 Hz band is 55.15 dB and the outlet noise at gear 8 is reduced by 5.79 dB. The simulation results exhibit the same trend of noise reduction, and the optimized duct geometry was validated through experimental measurements. The close qualitative agreement between the simulation and experiment confirms the effectiveness of the response surface optimization methodology in identifying optimal structural parameters.
Overall, the structural optimizations of the rear blower and the floor duct in the test vehicle are validated by both the simulation and experiment. After optimization, the low-frequency noise gap between the test vehicle and the benchmark vehicle is substantially narrowed under high-speed operation in floor mode, and the subjective comfort evaluation becomes acceptable.

5. Conclusions

A systematic collaborative optimization study of the blower and duct geometry was conducted to address the aerodynamic noise issue in the floor mode of the rear A/C system in a new energy SUV through experimental testing, CFD numerical simulation, response surface optimization, and vehicle-level validation. The main conclusions are as follows:
(1) The low-frequency noise in the 50–250 Hz band of the rear A/C system is attributed to the coupled superposition of blower rotational noise and floor duct vortex noise. Based on the CFD simulation results of the acoustic and flow fields, the irregular regions of the blower deflector and the floor duct geometry are identified as the primary optimization targets.
(2) The implementation of double-side slotting on the blower deflector and the design of a curved air distribution plate can effectively reduce inlet flow pulsation and optimize the flow distribution at the outlets. Furthermore, the response surface methodology-based optimization of the corner radius at the duct inlet, as well as the width and depth of the clearance groove, enlarges the inlet cross-sectional area of the floor duct, reduces airflow resistance, and lowers aerodynamic noise.
(3) Simultaneous optimization of the blower and duct yields a 5.79 dB reduction in the outlet noise at gear 8. The proposed combined strategy—incorporating structural improvement of the blower deflector and RSM-based geometric optimization of the duct—offers a theoretical basis and design reference for the forward development and engineering enhancement of NVH (noise, vibration, and harshness) performance in NEV A/C systems.

Author Contributions

Conceptualization, L.Z. and L.L.; methodology, L.L. and J.L.; software, L.L.; validation, L.L. and J.L.; formal analysis, L.L.; investigation, L.L. and J.L.; resources, J.L.; data curation, L.L.; writing—original draft preparation, L.L.; writing—review and editing, L.Z.; visualization, L.L.; supervision, L.Z.; project administration, L.Z.; funding acquisition, L.Z. All authors have read and agreed to the published version of the manuscript.

Funding

This research was supported by the Tianjin Science and Technology Bureau Project “Robust Optimization Design of Electric Vehicles Based on Uncertain Factors” (Grant No. 20YDTPJC01840).

Data Availability Statement

The original contributions presented in this study are included in the article. Further inquiries can be directed to the corresponding author.

Acknowledgments

The authors would like to express their sincere gratitude to all the teachers who participated in the research. Their support and cooperation made this study possible. The authors also thank colleagues and reviewers for their valuable comments and suggestions, which helped improve the manuscript.

Conflicts of Interest

Author Jia Liu was employed by the company China Automotive Engineering Research Institute Co., Ltd. The remaining authors declare that the research was conducted in the absence of any commercial or financial relationships that could be construed as potential conflicts of interest.

References

  1. Wang, J.-J.; Huang, Y.; Zhang, F.; Wang, H.-Q.; Tan, Q.-K.; Dong, D.-W. Analysis and optimization of aerodynamic noise characteristics of air conditioning blowers for new energy-source vehicles. Noise Vib. Control 2022, 42, 134–142. [Google Scholar]
  2. Li, H.-B.; Zhou, J.-W.; Sun, Z.-L. Noise and Vibration Mechanism and Control of Automotive Turbochargers; China Machine Press: Beijing, China, 2012; pp. 6–9, 57–61. [Google Scholar]
  3. Li, M.; Hou, G.-L.; Shu, L.; Wei, C.-H.; Ma, C.-Q. Detection and optimization of vibration noise of centrifugal fan for automotive air conditioning. Fluid Mach. 2021, 49, 86–94. [Google Scholar]
  4. Shu, L. Optimization Design of Vibration and Noise for Automotive Blower. Master’s Thesis, Jilin University, Jilin, China, 29 November 2019. [Google Scholar] [CrossRef]
  5. Zhang, F. Analysis of Aerodynamic Noise Transmission Characteristics and Noise Reduction Optimization of Automotive Air Conditioning Blower. Master’s Thesis, Southwest Jiaotong University, Chengdu, China, 19 May 2019. [Google Scholar]
  6. Yang, Z.-D.; Gu, Z.-Q.; Wang, Y.-P.; Yan, J.-R.; Yang, X.-T. Prediction and optimization of aerodynamic noise in an automotive air conditioning centrifugal fan. J. Cent. South Univ. 2013, 20, 1245–1253. [Google Scholar] [CrossRef] [Scilit]
  7. Qin, Y.-L. Air Conditioning Noise Analysis and Optimization for Cabin Comfort. Master’s Thesis, Shijiazhuang Tiedao University, Shijiazhuang, China, June 2025. [Google Scholar]
  8. Wang, Y.-P.; Gu, Z.-Q.; Yang, X.; Li, W.-P.; Lin, X.-H.; Lu, K.-L. Analysis and control of aerodynamic noise in automotive air conditioning outlet ducts. J. Hunan Univ. (Nat. Sci.) 2010, 37, 24–28. [Google Scholar]
  9. Zhen, D.; Wang, Z.-Y.; Liu, X.-A.; Wang, X.-L.; Duan, Y.-L. Numerical analysis and optimization of aerodynamic noise of automotive air conditioning duct. J. Vib. Meas. Diagn. 2024, 44, 1234–1241+1253. [Google Scholar] [CrossRef]
  10. Wan, L.-X.; Min, H.-J.; Liu, X.-A.; Wang, X.-L. Analysis and optimization of aerodynamic noise in automotive air conditioning fluid pipelines. Mach. Des. Manuf. 2024, 269–272. [Google Scholar] [CrossRef]
  11. Wang, H.-W.; Zhu, S.; Wang, B.; Hu, L. Research on air distribution and aerodynamic noise optimization of automotive air conditioning duct. Mach. Des. Manuf. 2024, 398, 346–350. [Google Scholar]
  12. Ling, Z.-W. Collaborative Optimization Design of Aerodynamic Noise and Airflow Rate for Automotive HVAC System. Master’s Thesis, Chongqing University of Technology, Chongqing, China, 20 March 2021. [Google Scholar] [CrossRef]
  13. Qin, L.; Du, X.-J.; Feng, J.-Y.; Huang, S.-Q.; Duan, M.-H.; Wang, Q.-Y. Study on aerodynamic noise characteristics of SUV hollow roof spoiler. Automot. Eng. 2023, 45, 879–887. [Google Scholar] [CrossRef]
  14. Zhang, F.-L.; Zhang, R.-R.; Luo, Q.-L.; Zhang, Y.-D.; Li, B.; Guo, H. Research on the aerodynamic noise mechanism and noise reduction of SUV roof hollow spoiler. J. Mech. Eng. 2024, 60, 398–408. [Google Scholar] [CrossRef] [Scilit]
  15. Jia, Z.-J.; Wang, X.-K.; Yuan, W.-W.; Yang, F.; Wu, W.J. Structural optimization design of jet element based on response surface methodology. J. Drain. Irrig. Mach. Eng. 2026, 44, 92–99+108. [Google Scholar]
  16. GB/T 6882-2016; Precision Methods for Anechoic and Semi-Anechoic Chambers. Standards Press of China: Beijing, China, 2016.
  17. Humbad, N.G.; Hall, T.J.; Terry, J.; Hess, G.; Sohaney, R.C. Case study on reducing automotive blower rumble noise. In Proceedings of the ASME 1996 International Mechanical Engineering Congress and Exposition; American Society of Mechanical Engineers: Atlanta, GA, USA, 1996; pp. 233–242. [Google Scholar] [CrossRef] [Scilit]
  18. Qin, W.; Wang, W.-J.; Long, S.-C.; Li, Z.; Chang, J.-J.; Dai, W.-H. Numerical simulation of aerodynamic noise characteristics of automotive air conditioning systems. Appl. Acoust. 2026. Advance online publication. [Google Scholar]
  19. Jiang, W.-K.; Wu, H.-J.; Huang, Y.; Zhao, M.; Zhou, H.-T.; Zhu, B.-L. Mechanical Vibration and Noise, 2nd ed.; Science Press: Beijing, China, 2020; pp. 170–174. [Google Scholar]
Figure 1. Layout of the anemometer.
Processes 14 02986 g001
Figure 2. Sound pressure spectra of the original vehicle’s floor outlet (gear 1–8).
Processes 14 02986 g002
Figure 3. Three-dimensional model (a) and mesh generation (b) of the rear blower and floor duct in the original vehicle.
Processes 14 02986 g003
Figure 4. Flow field simulation results of the blower-duct assembly in the original vehicle. (a) Velocity streamline and (b) surface pressure contour map.
Processes 14 02986 g004
Figure 5. Acoustic power contours of the blower-duct assembly in the original vehicle. (a) Curle wall acoustic power (surface source) and (b) Proudman fluid acoustic power (quadrupole source).
Processes 14 02986 g005
Figure 6. Velocity contours before and after modification of the deflector. (a) Single-side slotting and (b) double-side slotting.
Processes 14 02986 g006
Figure 7. Streamline plots before and after modification of the air distribution port structure. (a) Inclined air distribution plate and (b) curved air distribution plate.
Processes 14 02986 g007
Figure 8. Flow field and acoustic field simulation results of the optimized blower-duct assembly. (a) Velocity streamline and (b) Curle wall acoustic power.
Processes 14 02986 g008
Figure 9. Photographs of the modified floor duct and blower deflector components. (a) Modified duct inlet; (b) modified air distribution duct; (c) modified clearance groove; (d) modified deflector.
Processes 14 02986 g009
Figure 10. Comparison of sound pressure levels before and after optimization of the floor duct.
Processes 14 02986 g010
Figure 11. Comparison of sound pressure levels before and after optimization of the blower deflector.
Processes 14 02986 g011
Figure 12. Noise test results after simultaneous optimization of the blower and duct assembly.
Processes 14 02986 g012
Table 1. Main equipment models and specifications.
NameModelSpecificationsQuantity
24-channel data acquisition softwareLMS Test.Lab2019Sampling frequency 204.8 kHz/channel, dynamic range 150 dB1 unit
1/2-inch microphoneGRAS-46AESensitivity 50 mV/Pa, frequency range 0–10 kHz2 units
Smart anemometerZRQF seriesAir velocity range 0.05–30 m/s, resolution 0.01 m/s1 unit
Table 2. Experimental values under floor mode.
Measurement IndexVehicle TypeGear 1Gear 2Gear 3Gear 4Gear 5Gear 6Gear 7Gear 8
A-weighted sound pressure level—dB(A)Benchmark vehicle31.4635.5638.2741.5543.5945.8447.2350.02
Test vehicle35.7539.6141.7749.0751.6154.9660.3760.94
Air velocity—m/sTest vehicle4.15.15.68.39.210.613.513.9
Table 3. Factor levels and coding.
Design VariableRange (mm)Level
−101
X 15–5553055
X 230–60304560
X 310–171013.517
Disclaimer/Publisher’s Note: The statements, opinions and data contained in all publications are solely those of the individual author(s) and contributor(s) and not of MDPI and/or the editor(s). MDPI and/or the editor(s) disclaim responsibility for any injury to people or property resulting from any ideas, methods, instructions or products referred to in the content.