Article

Machine-Learning-Based Analysis of Printing-Parameter Effects on Surface Roughness in FDM-Printed ULTEM 1010 Parts


School of Engineering, University of North Florida, Jacksonville, FL 32224, USA
*
Author to whom correspondence should be addressed.
Processes 2026, 14(18), 2985; https://doi.org/10.3390/pr14182985 (registering DOI)
Submission received: 20 August 2026 / Revised: 11 September 2026 / Accepted: 15 September 2026 / Published: 19 September 2026

Abstract

This study combines replicated experimentation and machine learning to characterize how user-controllable fused deposition modeling (FDM) parameters relate to local surface quality in complex ULTEM 1010 components. A surgical guide geometry was evaluated across 18 printing conditions incorporating the infill pattern, infill density, body thickness, raster angle, part orientation, and annealing. Three independently printed specimens per condition were measured at two locations, yielding 108 observations across five areal roughness metrics: Sa, Sz, Sq, Ssk, and Sku. An exploratory analysis of variance with false discovery rate correction identified orientation associations with Sa, Sq, Ssk, and Sku, and a body thickness association with Ssk in the cleaned measurements. Descriptive results associated the −XY orientation with a lower Sa and Sq at the measured regions, identifying a candidate placement for subsequent process trials. Evaluating multiple roughness metrics captured both the surface height magnitude and height distribution, providing a broader characterization than average roughness alone. Artificial neural network, random forest, and Gaussian process regression models were assessed using condition-grouped validation, which kept all replicates and paired measurement sites together and showed a limited generalization to unseen printing conditions. The study provides replicated evidence connecting industrially accessible printing settings with local areal surface characteristics. Its findings support prioritizing the orientation in process refinement, assessing the surface quality at functionally relevant locations, and validating predictive models on independent printing conditions before using them for parameter selection.

1. Introduction

Surface quality and mechanical performance are central concerns in additive manufacturing (AM). In fused deposition modeling (FDM), also known as fused filament fabrication (FFF), variables such as part orientation and printing speed can influence the mechanical strength and surface quality of printed parts. Recent work has therefore applied experimental analysis and machine learning to identify relationships between printing parameters and part-level responses.
The FDM process involves depositing extruded material onto a build platform layer by layer. This process allows for interfacial bonding to occur between layers of the model material but causes material anisotropy due to the directional nature of the deposition and adhesion between layers. Separately, the finite layer height creates a stair-stepping effect on inclined surfaces and contributes to the roughness of the as-printed part [1,2,3]. Surface roughness influences the geometric accuracy, functional performance, and mechanical properties of 3D-printed parts. The surface finish is a crucial parameter in high-precision and low-tolerance industries, like biomedical and aerospace, further driving the need for an understanding of the complex relationships between printing parameters and part quality.
Surface quality is particularly difficult to generalize for complex geometries because local surface orientation, build sequence, and support-material contact can vary across a single component. Consequently, a measurement obtained from one location on a simplified coupon may not represent the surface conditions of an application-relevant part. A site-resolved assessment is therefore needed to connect printing parameters with localized surface-quality behavior.
A literature review by Aktepe et al. found that the most common printing parameters assessed by current ML research are layer thickness, nozzle temperature, print speed, and infill density [4]. Researchers have highlighted the relationship between infill density and surface roughness, presenting that higher infill densities lead to smoother surfaces [5,6]. Body thickness, also referred to as wall thickness or contour width, causes a poor surface finish when made thinner [7]. The raster angle refers to the angle at which the material is placed on the build plate. Angles of 0/90 have been identified as parameters that decrease the surface roughness overall [8,9]. Orientation refers to the placing of the part on the build plate. Generally, orientations are suggested to stay within the XY and XZ planes, ensuring the widest section of the part is parallel to the build plate.
With the wide array of printing parameters that can affect part quality, researchers are turning towards machine learning (ML) to understand complex nonlinear relationships [10]. Studies using neural networks, regression, and ensemble methods have related printing parameters to mechanical responses in several polymers [11,12,13,14,15,16]. These applications establish the usefulness of the model comparison, but mechanical property predictions do not directly establish the accuracy for localized surface roughness.
Studies using several classification and regression algorithms have also examined the surface quality in FDM parts [17,18,19,20,21]. The classification accuracy for discrete surface quality categories and regression accuracy for continuous roughness values answer different questions; their performance measures should not be compared directly.
Regression models estimate continuous responses from process inputs [22,23]. Artificial neural networks (ANNs), random forests (RFs), and Gaussian process regression (GPR) are frequently used for surface roughness prediction. Table 1 summarizes relevant applications and their reported results.
ANN models have been applied to surface roughness across several materials and experimental designs [24,25,26,27,28,29,30,31,32,33]. Reported R2 values range from 0.875 for the ANN of Chinchanikar et al. [29] to approximately 0.99 in several studies [26,31,32,33]. Flexible network architectures can fit nonlinear relationships, but their apparent accuracy depends on the number of distinct process conditions, the response range, and the separation of model selection from testing. High scores in one material and geometry cannot establish the generalization to another.
RF models provide an alternative based on ensembles of regression trees. Comparative studies reported a performance ranging from R2 = 0.71 [34] to 0.9962 [33], with the results also depending on the polishing, material, and hybrid modeling strategy [28,32,35,36]. Their ability to fit small datasets does not remove the need to hold replicated experimental conditions together during testing.
GPR represents a distribution over functions through a covariance kernel. Surface related applications reported R2 values of 0.84 for ABS/graphene composites [37], 0.8783 for printed dosage forms [38], and 0.9965 in a comparative FDM study [33]. Related applications address the dimensional accuracy, machining roughness, and mechanical properties [28,39,40,41,42,43,44]. Kernel selection and validation design, therefore, matter as much as the algorithm name when interpreting published scores.
Recent high-temperature polymer studies address a different experimental space. Vidakis et al. used a Taguchi L25 design for PEI, including the layer height and infill density, and evaluated the roughness using ANOVA and regression [45]. Halevi et al. investigated the thermal processing of ULTEM 1010 using an open FDM system [46]. Petousis et al. studied a different thermoplastic polyimide using 16 settings, five specimens per setting, five variable process parameters, polynomial regression, and two confirmation runs [47]. Jonckers et al. compared the atmospheric and low-pressure manufacture of four high-temperature polymers, including ULTEM 1010, through mechanical and structural characterization [48]. These studies inform material and process interpretation, but their validation tasks and responses are not direct benchmarks for predicting five local areal roughness metrics on unseen ULTEM 1010 conditions.
The literature reveals a specific application gap: replicated, site-resolved areal measurements of complex ULTEM 1010 parts remain limited, particularly for parameters accessible within industrial printer material profiles. Previous prediction scores also do not establish the performance on entirely unseen parameter combinations. To address these gaps, this study uses 18 distinct parameter combinations and 3 independently printed specimens per condition. Five printer-accessible parameters and annealing are evaluated using five areal roughness metrics at two sites on a complex surgical-guide geometry. The objective is the experimental characterization and comparison of ANN, RF, and GPR predictions; it is not a search for a globally optimal printing condition.
Table 1. Studies using machine learning to evaluate printing-parameter effects on surface roughness.
Ref.MaterialPrinting ParametersModels TestedModel PerformanceSurface Roughness Findings
Kandananond [24]PLABed temp
Layer height
Print speed
ANN; two resilient backpropagation methodsANN with GCRB, MSE = 0.147N/A
Kaplan et al. [25]TPUInfill pattern
Layer height
Nozzle temp
ANN; BiLSTM; BiLSTM with Bayesian optimizationANN:
R2 = 0.6078
MAPE = 10.3351%
BiLSTM-BO:
R2 = 0.9983
MAPE = 0.6292%
Layer thickness: p < 0.001; F = 1196.86.
Ulkir et al. [26]PLA
PETG
Infill density
Infill pattern
Layer height
Material type
Wall thickness
ANN; Levenberg–Marquardt trainingR2 = 0.9923ANOVA: Layer thickness and material type (p-val < 0.001)
Sharma et al. [27]PLAInfill density
Extrusion temp
Number of layers
Raster angle
ANN; Box–Behnken designR2 = 0.9225
Error percentage = 0.83% to 1.04%
0 or 90 deg raster angle best for SR. Higher infill density.
Ozer et al. [28]PLABuild angle
Post-print polishing
ANN; RF; GPRANN: R2 = 0.9425; MAPE = 9.753%. RF: R2 = 0.7864; MAPE = 24.85%. GPR: R2 = 0.931; MAPE = 9.997%.N/A
Chinchanikar et al. [29]ABSInfill density
Layer height
Print speed
Nozzle temperature
ANN; two hidden layersANN: R2 = 0.875Higher infill density improves SR.
Savran et al. [30]PLABuild orientation
Infill pattern
Layer height
Extrusion temp
Stepwise nonlinear ANN regressionSNAR-TON: R2 = 0.98ANOVA: Build orientation p-val = 0.037. Combined effects found with layer thickness and orientation (p = 0.002)
Malleswari et al. [31]PLABed temp
Layer thickness
Print speed
Raster angle
ANN; response surface methodologyANN: R2 = 0.99353, RMSE = 0.25753 and MAE = 0.14574.
RSM: R2 = 0.99272, RMSE = 0.27385, MAE = 0.22093.
N/A
Ulkir et al. [32]PA12-CFInfill density
Infill pattern
Layer height
Nozzle temp
Print speed
ANN; RFANN: R2 = 0.9912; MAPE = 11.35%; MAE = 2.658. RF: R2 = 0.9862; MAPE = 23.49%; MAE = 3.957.Layer thickness
Ulkir et al. [33]ABS
PLA
PLA-CF
Infill density
Infill pattern
Layer height
Print speed
ANN; RF; GPRANN: R2 = 0.9972. RF: R2 = 0.9962. GPR: R2 = 0.9965.ANOVA: Layer thickness, print speed, then infill pattern.
Tran et al. [34]ABS
PLA
Bed temp
Fan speed
Infill density
Infill pattern
Layer height
Material type
Nozzle temp
Print speed
Wall thickness
Linear regression; RF; stacked regressionRF: R2 = 0.71, MAPE = 15.28%, MSE = 1358.35ANOVA: Layer height, material type
Gao et al. [35]PLABed temp
Extrusion temp
Flow rate
Infill density
Layer height
RF; quadratic polynomial regressionRF: R2 = 0.9583ANOVA: Infill density, extrusion rate, bed temp
Mishra et al. [36]PLABed temp
Fan speed
Infill density
Infill pattern
Nozzle temp
Print speed
Wall thickness
Genetic algorithm with GBR, DT, RF, or ANNGA-RF: R2 = 0.8987. GA-ANN: R2 = −0.2966; MSE = 1.786.Correlation matrix: Layer height (+), wall thickness (=), print speed (−), infill density (−)
Liu et al. [37]ABS/
graphene
Extrusion temp
Layer height
Print speed
GPR; Matérn kernel; Bayesian optimizationR2 = 0.84
MAPE = 0.13
RMSE = 2.66
ANOVA:
Layer height, print speed, extrusion temp
Chitnis et al. [38]PLA
PVA
TPU
Extrusion temp
Flow rate
Infill density
Print speed
GPR; squared exponential kernelR2 = 0.8783
N/A: not available in the cited study.

2. Experimental Methods

2.1. Material and Part Fabrication

The experiment used a replicated Taguchi L18 array with six factors. The array comprised 18 distinct factor combinations, each printed as three replicate specimens. Five printing factors, namely, the infill pattern, infill density, body thickness, raster angle, and orientation, were evaluated at three levels. Annealing was the sixth factor and was evaluated at two levels. The factors and coded levels are summarized in Table 2.
Polyetherimide (PEI) is a thermoplastic resin with mechanical, thermal, and chemical properties suited to engineering applications [49]. ULTEM 1010 is an amorphous PEI used for high-temperature FDM applications. The manufacturer describes a high tensile strength, chemical resistance, and thermal stability; these properties depend on the processing and build orientation [50]. Printing parameters have been studied for their effects on the ULTEM 1010 part quality. Pandelidi et al. examined the variations in air gap, raster angle, layer height, and build direction and the effects on the mechanical properties of ULTEM 1010 specimens [51]. Specifically, the researchers noted that the raster angle influenced Young’s modulus when increased from ±45° to 0°/90°. An increase in the layer height generally improved the material ductility. Vidakis et al. investigated six printing parameters with an L25 Taguchi array of extruded powder-to-filament polyetherimide [45]. The surface roughness of PEI parts was observed with optical microscopy and measurements were analyzed using ANOVA and three regression models. The researchers identified that the infill density and layer height had the strongest effects on the Ra and Rz roughness responses. Furthermore, all three regression models achieved R2 values greater than 0.80 for Ra and Rz.
In this study, the density and body thickness levels were selected to represent the maximum, intermediate, and minimum settings available in GrabCAD Print (version 1.105.10.58253) for each infill pattern. The corresponding settings are listed in Table 3. The ranges were constrained by the selected ULTEM 1010 material profile. Raster angles of 15°, 45°, and 75° sample three directions, and the three orientations compare the available placements of this geometry. Density codes therefore denote relative settings within each pattern, not equal physical densities across patterns. In particular, all three solid infill density codes correspond to 100%. Density and body thickness effects must consequently be interpreted within this pattern-dependent design, rather than as universal changes per percentage point or unit thickness.
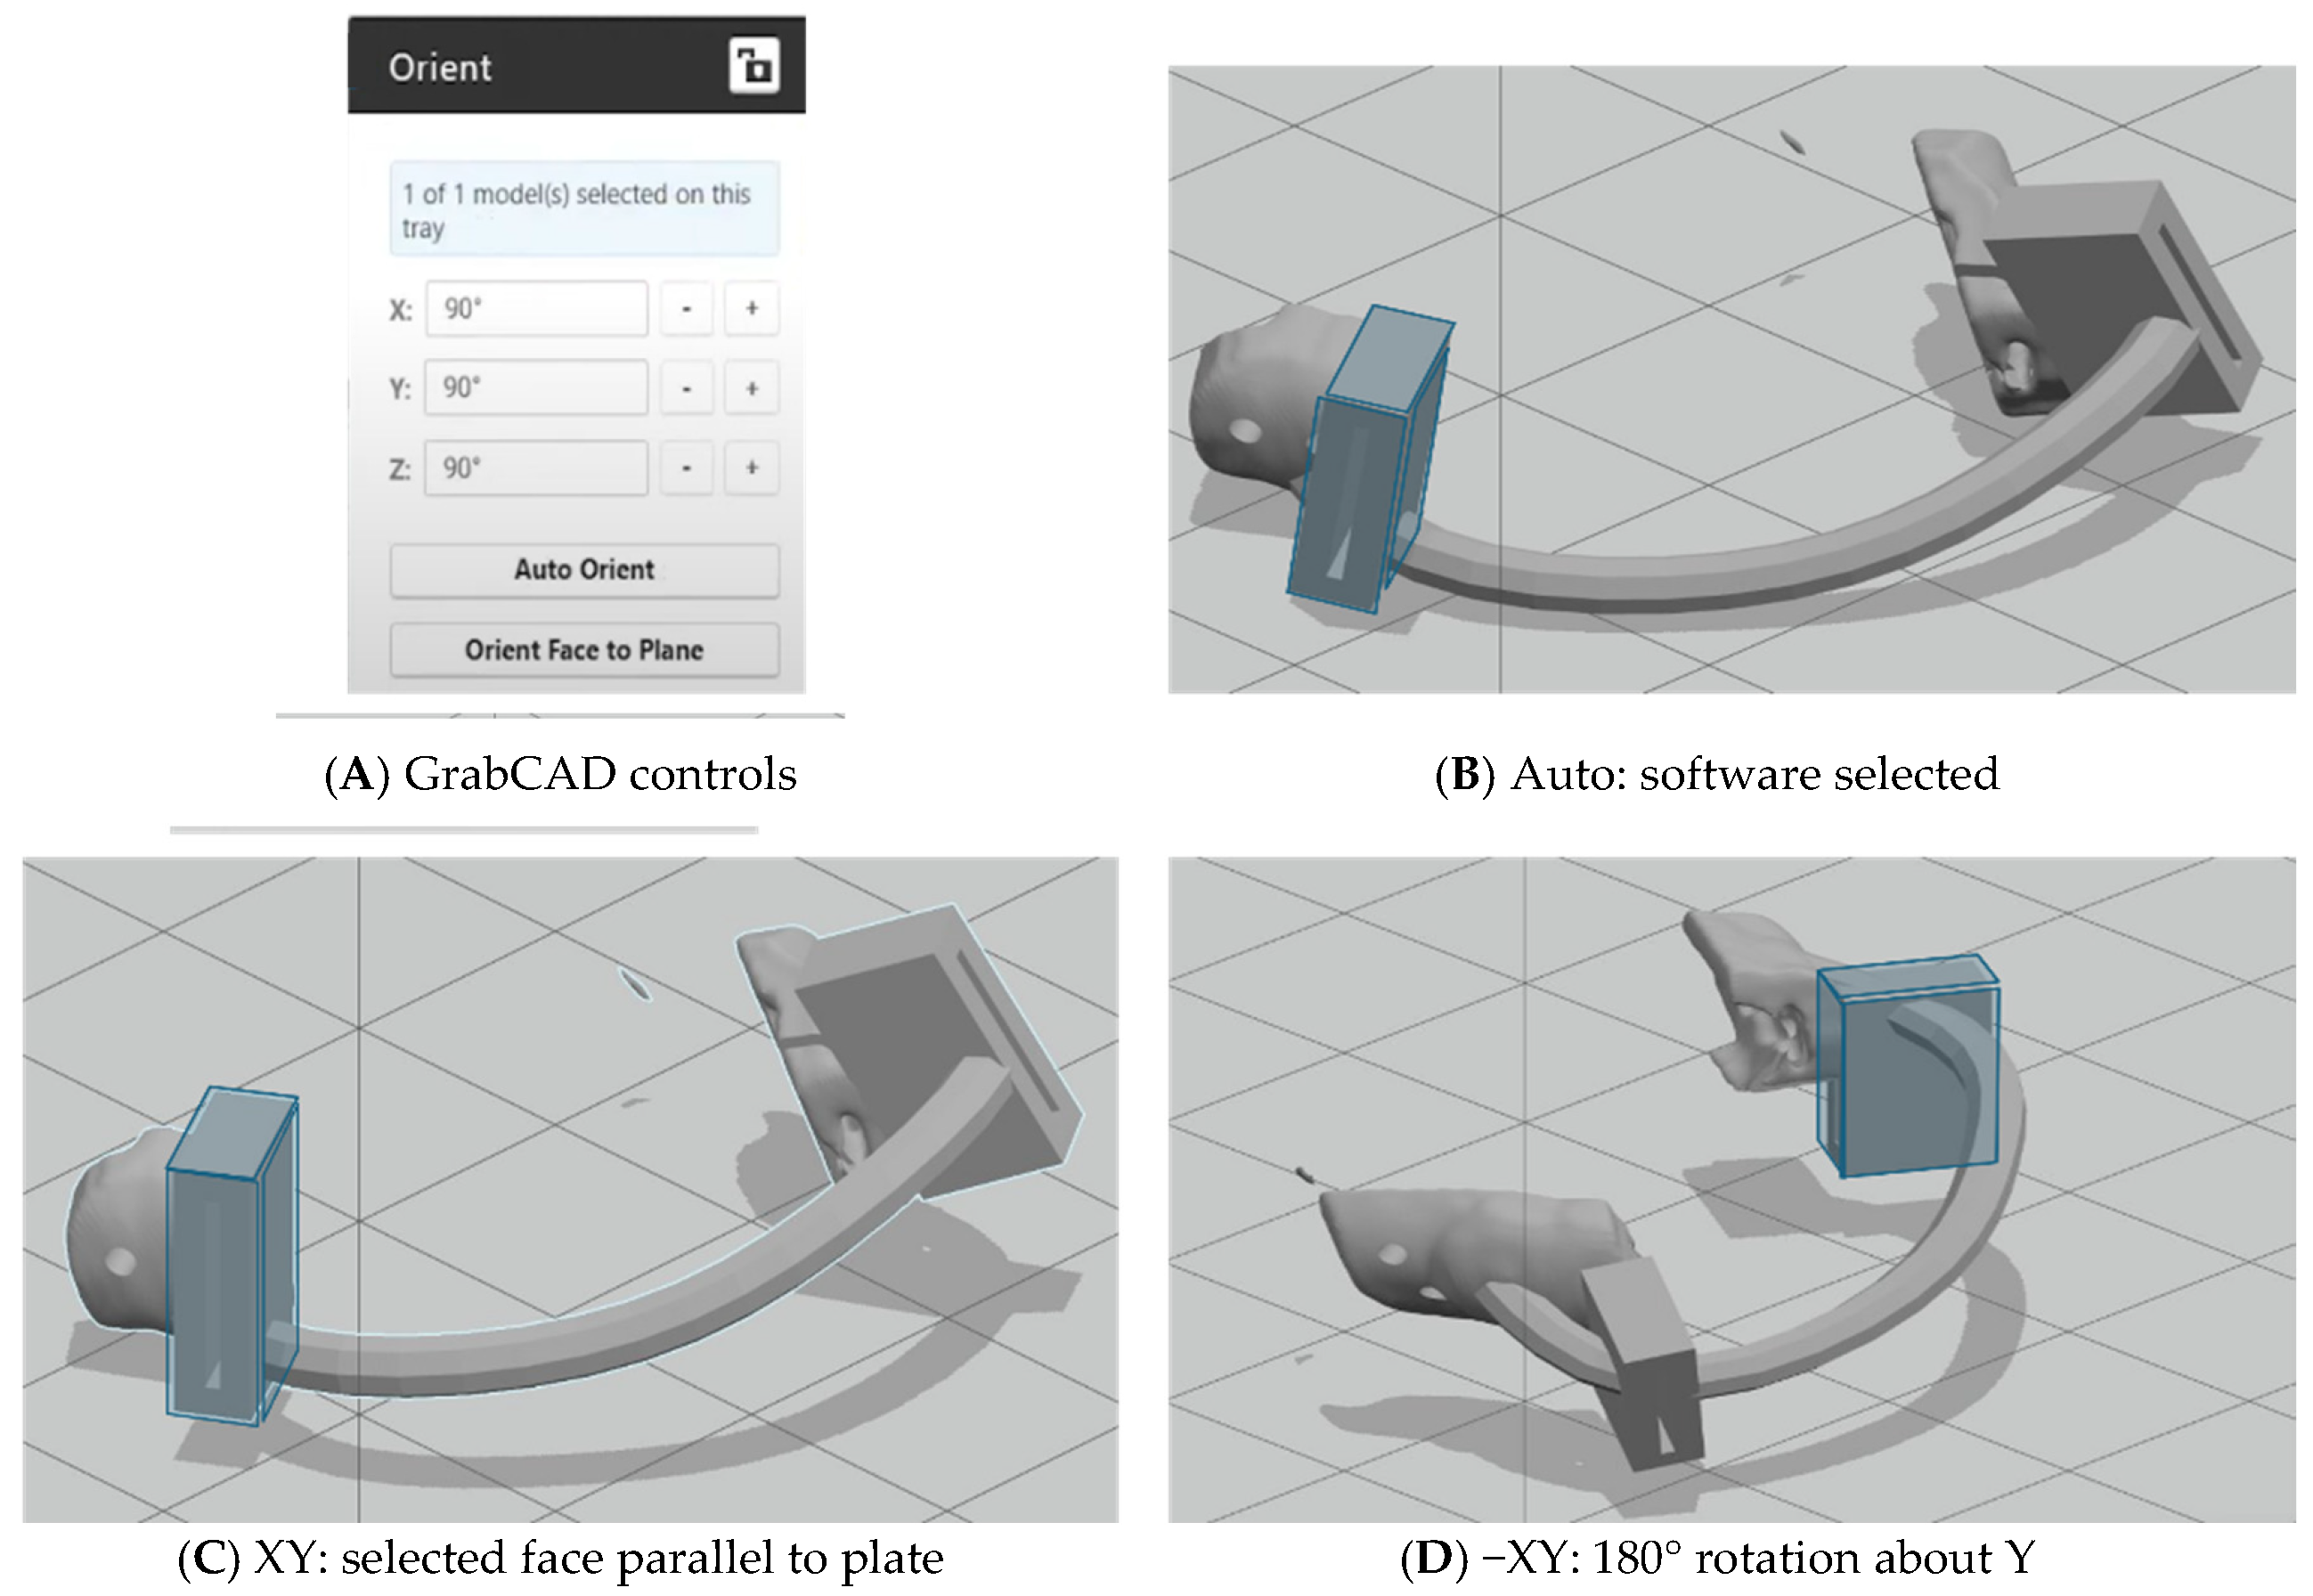
Specimens were fabricated on a Stratasys Fortus 450MC(Stratasys, Eden Prairie, MN, USA) using ULTEM 1010 model material and SUP9000B breakaway support (both from Stratasys, Minnetonka, MN, USA). A T14 model tip and T16 support tip were used with the 0.254 mm layer height specified for this material and tip combination [50]. The part geometry was selected as a surgical guide. The part was printed along three orientations: Auto, XY, and −XY. The Auto orientation is automatically chosen by the GrabCAD software from the part geometry. The XY orientation uses a planar feature of the print to be parallel to the build plate. The −XY orientation rotates the build part 180° about the Y-axis, building the part upside-down. The orientations of the part can be seen in Figure 1 [52].
The layer height, nozzle temperature, and printing speed were held by the selected Fortus 450MC material profile and were not varied in this experiment. The study therefore examines user accessible settings within that profile. Their influence cannot be separated from the fixed thermal and deposition conditions, and the results should not be transferred directly to other profiles or printers.
Thermal annealing can improve interlayer adhesion in PEI, but its effect on surface roughness depends on the material grade and treatment conditions. In-oven post-processing exposes printed parts to a heated environment with the aim of improving interlayer adhesion and reducing internal stresses, thus optimizing mechanical properties like tensile strength [53]. Yilmaz et al. investigated the effects of annealing ULTEM at various temperatures and found an optimal annealing temperature of 225 °C [54]. When exposing ULTEM 1010 parts to 225 °C for 3 h, the researchers noted a 10% increase in tensile strength and a 5% increase in flexural strength. The current ULTEM 1010 datasheet reports a glass transition inflection temperature of 209.4 °C [50]. Exposure to 225 °C can increase molecular mobility and allow interlayer diffusion and stress relaxation. ULTEM 1010 is amorphous, so this mechanism should not be described as the formation of a more stable crystalline structure. Halevi et al. also annealed ULTEM 1010 specimens at 225 °C, finding the interlayer adhesion, tensile strength, and more mechanical properties improved [46]. Chueca de Bruijin et al. investigated the effects of thermal annealing and isostatic pressure on ULTEM 9085 printed parts [55]. Annealed specimens had a lower surface roughness than non-annealed specimens, and improved even further in a pressurized environment. In addition, mechanical properties of the pressurized-annealed specimens improved in flexural strength and flexural modulus. Butt et al. also investigated the effects of thermal annealing on ULTEM 9085 parts, noting that heating specimens at 200 °C for 3 h showed a 43.6% reduction in surface roughness compared to non-annealed specimens [56]. However, the specimens were flat dog-bone specimens, sandwiched in between metal plates, during annealing, and specimens annealed without the exact layout may not achieve the same level of performance. Nguyen et al. researched the effects of an in situ thermal annealing process of PEI parts, reporting that the tensile strength and elongation at break significantly improved [57]. The fracture surface of the printed parts showed more cohesive interlayer bonding and smaller interfacial voids. These observations concern the fracture morphology and do not directly quantify the external areal roughness. Ouassil et al. investigated the printing speed, nozzle temperature, and annealing effects on the mechanical properties of ULTEM 1010 parts [58]. The researchers annealed specimens at 230 °C for 24 h. The choice for 230 °C was based on the desire to improve internal defects and reduce internal voids. However, they found that there were no statistically significant changes in mechanical properties in relation to annealing.
The breakaway support material was removed before post-processing. Half of the specimens were annealed in a Lab Companion ON-11E oven (JEIO TECH, Daejeon, Republic of Korea) at 225 °C using a 30 min ramp, a 3 h dwell, and a 30 min cool-down, for a total oven cycle of 4 h.

2.2. Surface Roughness Analysis

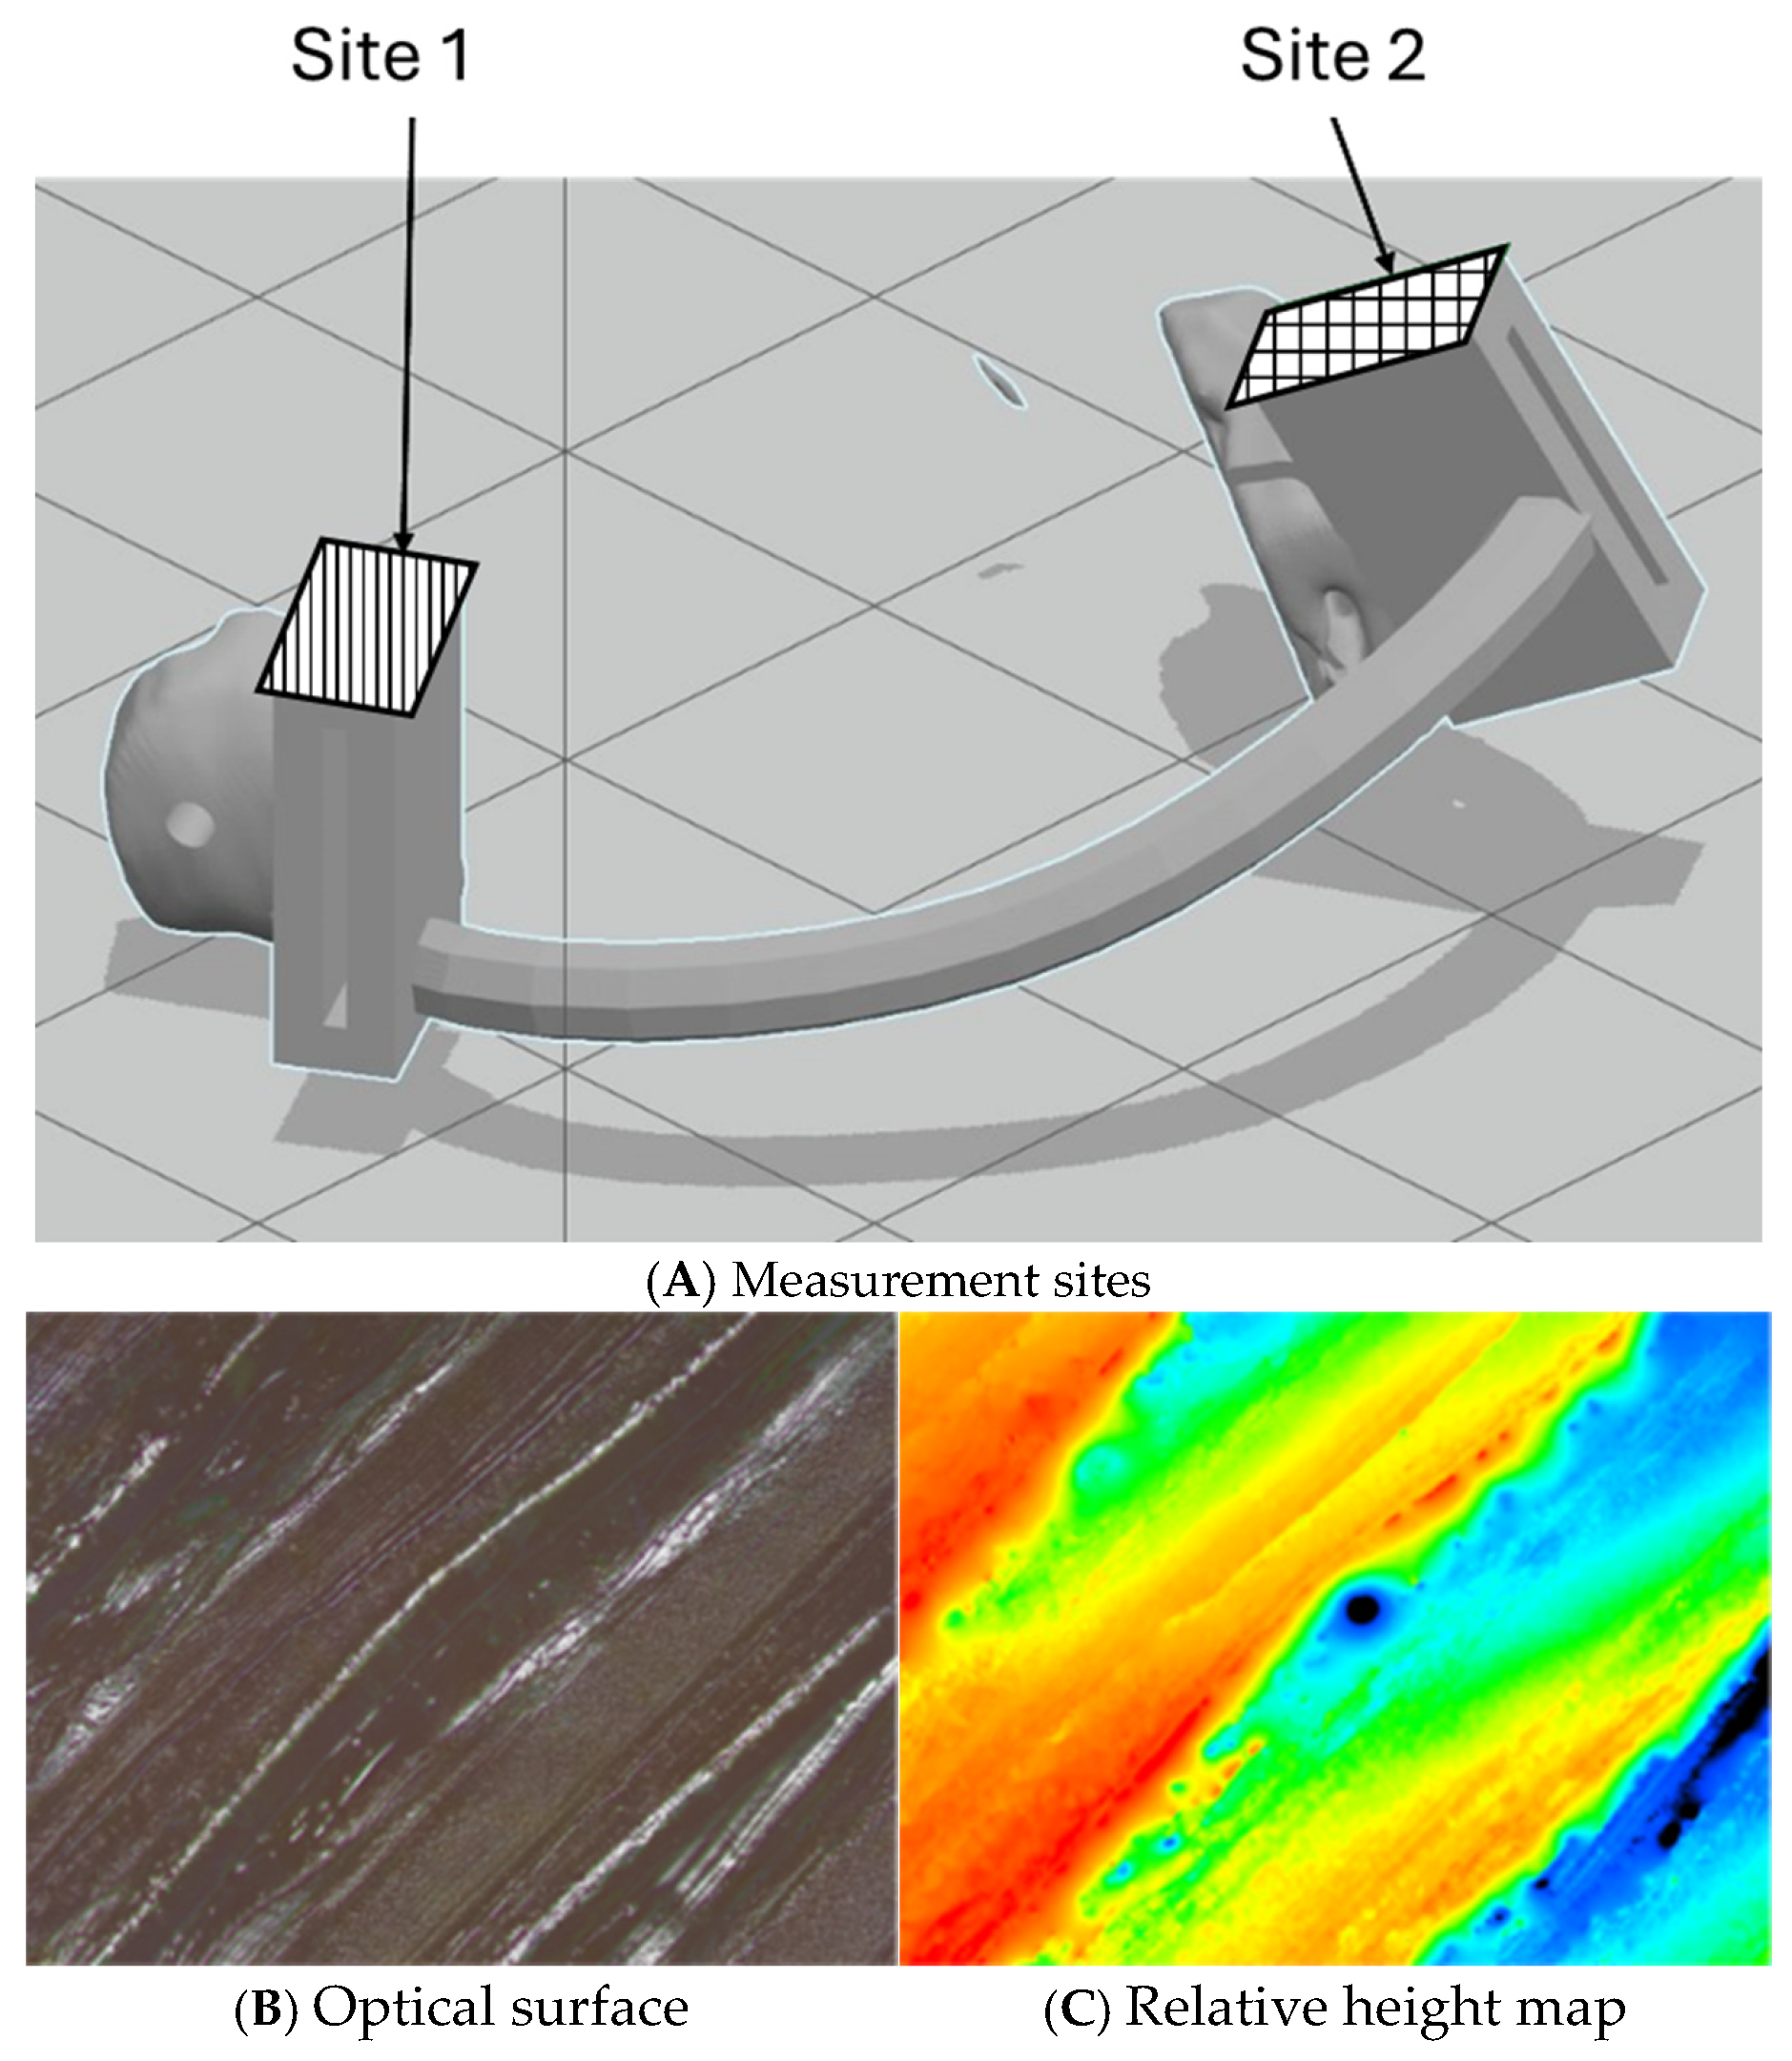
Surface roughness was measured with a VK-X1000 optical laser confocal microscope (KEYENCE Corporation, Osaka, Japan) at 5× magnification at two planar locations on each specimen (Site 1 and Site 2; Figure 2). The central measurement field at each site covered approximately 5.82 mm2. The measured areal parameters were arithmetical mean height (Sa), maximum height (Sz), root mean square height (Sq), skewness (Ssk), and kurtosis (Sku). Sa is the mean absolute height relative to the mean plane; Sz is the sum of the highest peak and deepest valley; and Sq is the root mean square height. Positive Ssk indicates a peak-dominated height distribution, whereas negative Ssk indicates a valley-dominated distribution. Sku describes the peakedness of the height distribution; values above three indicate a more outlier-prone or sharply peaked distribution, and values below three indicate a flatter distribution.
Measurements were collected in two sessions using the same acquisition settings for annealed and nonannealed specimens. Each specimen was placed on a holder and leveled so that the measured face was parallel to the measurement plane. An overview image was used to center the face and check alignment before collecting the central measurement field. These procedures held acquisition conditions consistent across specimens; they do not constitute a quantitative repeatability test.
The two sites were selected as accessible planar regions on distinct features of the guide, enabling measurements at corresponding locations across all specimens. They sample local surface conditions, not the entire component or its curved edges. Numerical aperture, lateral and vertical sampling, and filter and cutoff settings were not available for this analysis. The dataset does not include repeated scans of the same field; instrument repeatability and uncertainty, therefore, cannot be separated from specimen variability.

2.3. Machine-Learning Algorithms

Two site measurements were collected for each of the 54 specimens. The specimens represented 18 distinct parameter conditions, with three replicate specimens per condition, yielding 108 measurement rows. The supplementary dataset is provided in File S1. The original model comparison used an archived 102-row subset after six exclusions. Before encoding, the analysis table contained seven original predictors and five responses (twelve columns). Annealing, infill pattern, infill density, body thickness, raster angle, orientation, and site were one-hot-encoded, producing 19 model inputs. The original measurement rows were randomly divided into 80% training and 20% test sets. StandardScaler was fitted to the training features and responses and then applied to the test data. The original MSE and MAE values are, therefore, dimensionless. MAPE was not interpreted because standardized responses include values at or near zero. The split was performed at the measurement-row level rather than by specimen or replicated condition; paired site measurements and replicate specimens from the same condition could, therefore, occur in both sets. These original metrics are retained as a comparison and do not assess unseen printing conditions. All original models were developed in Google Colab.
Grouped model evaluation uses all 108 measurements as the primary dataset and the unchanged 102-row subset as a sensitivity analysis. A single global |z| > 3 rule did not reproduce the archived six exclusions, so this rule is not used to remove observations from the primary model evaluation. All six exclusions were from Site 1; condition 14 lost two observations, and conditions 6–9 each lost one. Removal was, therefore, not balanced across sites or conditions. The exploratory ANOVA uses the available cleaned values separately for each response: 103 observations for Sa, Sz, Sq, and Ssk, and 102 for Sku.
Fivefold GroupKFold evaluation assigned each complete printing condition to one fold, keeping both sites and all three replicate specimens together. The complete dataset had 14 or 15 training conditions and 4 or 3 test conditions per fold. GroupKFold was applied separately to the complete and cleaned datasets; differences between them, therefore, include changes in fold allocation as well as retained measurements. ANN leave-one-condition-out (LOCO) evaluation was additionally trained on 17 conditions and tested on the remaining condition for both datasets.
Outer test folds were used for performance assessment. ANN architecture and RF settings were fixed for grouped evaluation. GPR kernel selection used threefold row-based cross-validation within each outer training set. Its encoder and scalers were fitted on the outer training partition before this inner search, rather than refitted inside each inner fold. Thus, outer testing was condition-independent, but inner model selection was not fully grouped. Predictions were evaluated in original response units using R2, root mean squared error (RMSE), and mean absolute error (MAE). Sa, Sz, and Sq errors are in µm; Ssk and Sku errors are dimensionless. Fold variability is reported using sample standard deviations for ANN and GPR and population standard deviations for RF, as calculated in their respective evaluations. These are not confidence intervals.

2.3.1. Artificial Neural Network

The ANN was implemented with TensorFlow (version 2.19.0) and the Keras (version 3.13.2) Functional API. One-hot encoding was selected to provide consistent preprocessing across models. The model received 19 encoded inputs. The evaluated architecture contained two dense hidden layers with 10 and 8 neurons, respectively, and ReLU activation. The output layer contained five neurons with linear activation. The model used the Adam optimizer and mean squared error loss.
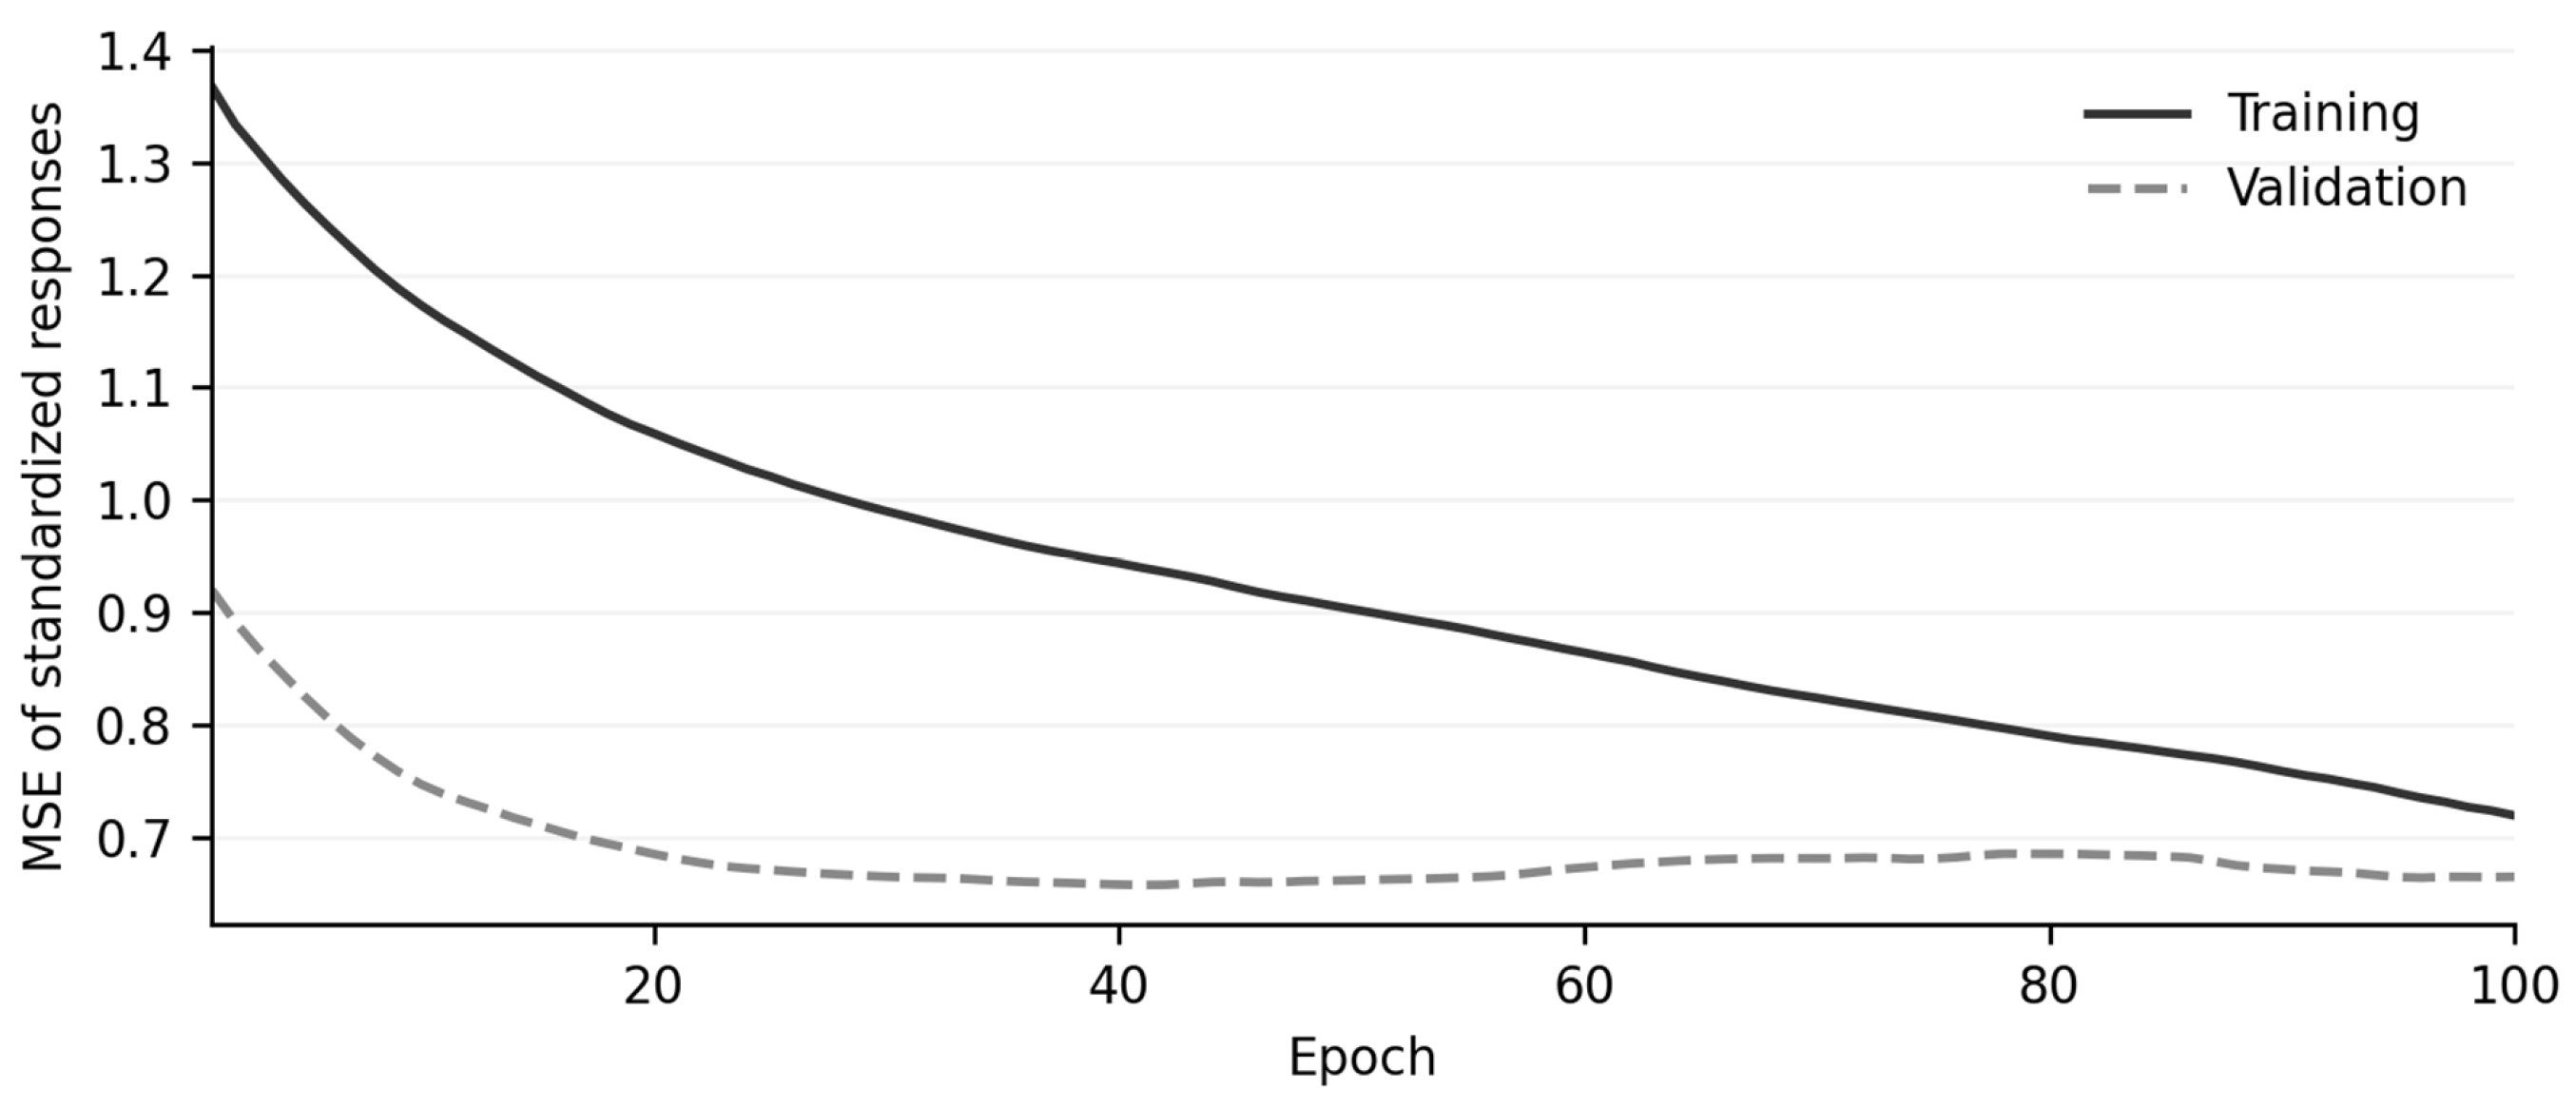
The network contains 333 trainable parameters: (19 + 1) × 10 + (10 + 1) × 8 + (8 + 1) × 5. It is used as a comparative nonlinear model, rather than assuming that 18 distinct conditions are sufficient for generalizable ANN training. The original fit used 100 epochs, batch size 32, and a 15% validation split within its 81 training rows, leaving 68 fitting rows, 13 validation rows, and 21 test rows. The recorded training and validation losses are shown in Figure A1.
Grouped ANN fits retained the same architecture and Adam optimizer, with the default learning rate of 0.001, 100 epochs, and batch size 8. Early stopping, dropout, and weight regularization were not used. Grouped testing evaluates the resulting overfitting risk; it does not itself prevent overfitting. No inner ANN hyperparameter search was performed, and the grouped results represent single stochastic fits per fold. The original validation curve is a training diagnostic, not evidence of condition-independent validation.

2.3.2. Random Forest

The RF analysis used the same 80/20 row split and one-hot-encoded predictors. A scikit-learn (version 1.6.1) RandomForestRegressor was fitted separately for each response with 100 trees and random_state = 42. Fivefold cross-validation was used in the assessment of each target variable. Feature scaling was retained for preprocessing consistency, although it does not affect tree-based splits.
Grouped RF evaluation fitted a separate 100-tree model for each response, with random_state = 42 and, otherwise, default regression tree settings. The same fixed settings were used for both datasets, and the outer test folds were not used for tuning.

2.3.3. Gaussian Process Regression

GPR models were implemented with scikit-learn’s gaussian_process module. GridSearchCV used fivefold cross-validation to compare kernels constructed from the radial basis function, ConstantKernel, Matern, WhiteKernel, DotProduct, RationalQuadratic, Exponentiation, and ExpSineSquared options. The selected form was ConstantKernel × DotProduct. The model used alpha = 1.0 × 10⁻⁵, and the selected DotProduct kernel had a reported σ0 value of 4.82 × 10⁻⁵.
For grouped GPR, nine kernel candidates were evaluated separately for each response: a constant multiplier combined with RBF, Matérn (ν = 0.5, 1.5, or 2.5), white noise, dot product, rational quadratic, squared rational quadratic, or periodic covariance. GridSearchCV selected the kernel using threefold cross-validation and negative mean squared error within the outer training partition. Each fit used alpha = 10−5, 20 optimizer restarts, and random_state = 42. One-hot encoding and feature and response standardization were fitted on each outer training partition. The selected kernel could differ by response and outer fold.

2.4. Statistical Analysis and Model Interpretation

Exploratory one-way ANOVA evaluated each of the six experimental factors and measurement site separately for each roughness response. Missing cleaned values were omitted separately for each response, giving 103 observations for Sa, Sz, Sq, and Ssk, and 102 for Sku. Benjamini–Hochberg correction controlled the false discovery rate across the family of 35 tests, with an adjusted p threshold of 0.05. These analyses neither jointly estimate all factors nor model the dependence between the two sites on a specimen. Consequently, the adjusted results are exploratory associations, not confirmatory evidence of independent parameter effects. Multiplicity correction does not resolve the paired measurement limitation.
Permutation importance was evaluated for a separate RF model predicting Sa from the cleaned measurements with available Sa values (n = 103). The seven categorical predictors were encoded using one omitted reference level per factor, producing 12 binary inputs. An 80/20 random row split with random_state = 42 provided 82 training and 21 test observations. The RF used 100 trees and random_state = 42. Each encoded input was permuted separately 10 times on the test set, and importance was the mean decrease in test R2. This analysis describes reliance on individual encoded levels for that fitted model; it does not establish condition-independent importance or causal effects. Permuting individual levels can also create combinations inconsistent with the original categorical encoding.

3. Results

3.1. Exploratory Printing Parameter Associations

Five associations remained below an adjusted p value of 0.05 after false discovery rate correction: orientation with Sa, Sq, Ssk, and Sku, and body thickness with Ssk (Table 4). The nominal association between infill density and Sz did not survive correction (unadjusted p = 0.0189; adjusted p = 0.1102). Table A1 reports all 35 adjusted values. Because these one-way tests do not account for paired measurements or jointly estimate the experimental factors, the findings identify relationships for further investigation rather than establish independent effects.

3.2. Model Performances

3.2.1. ANN Results

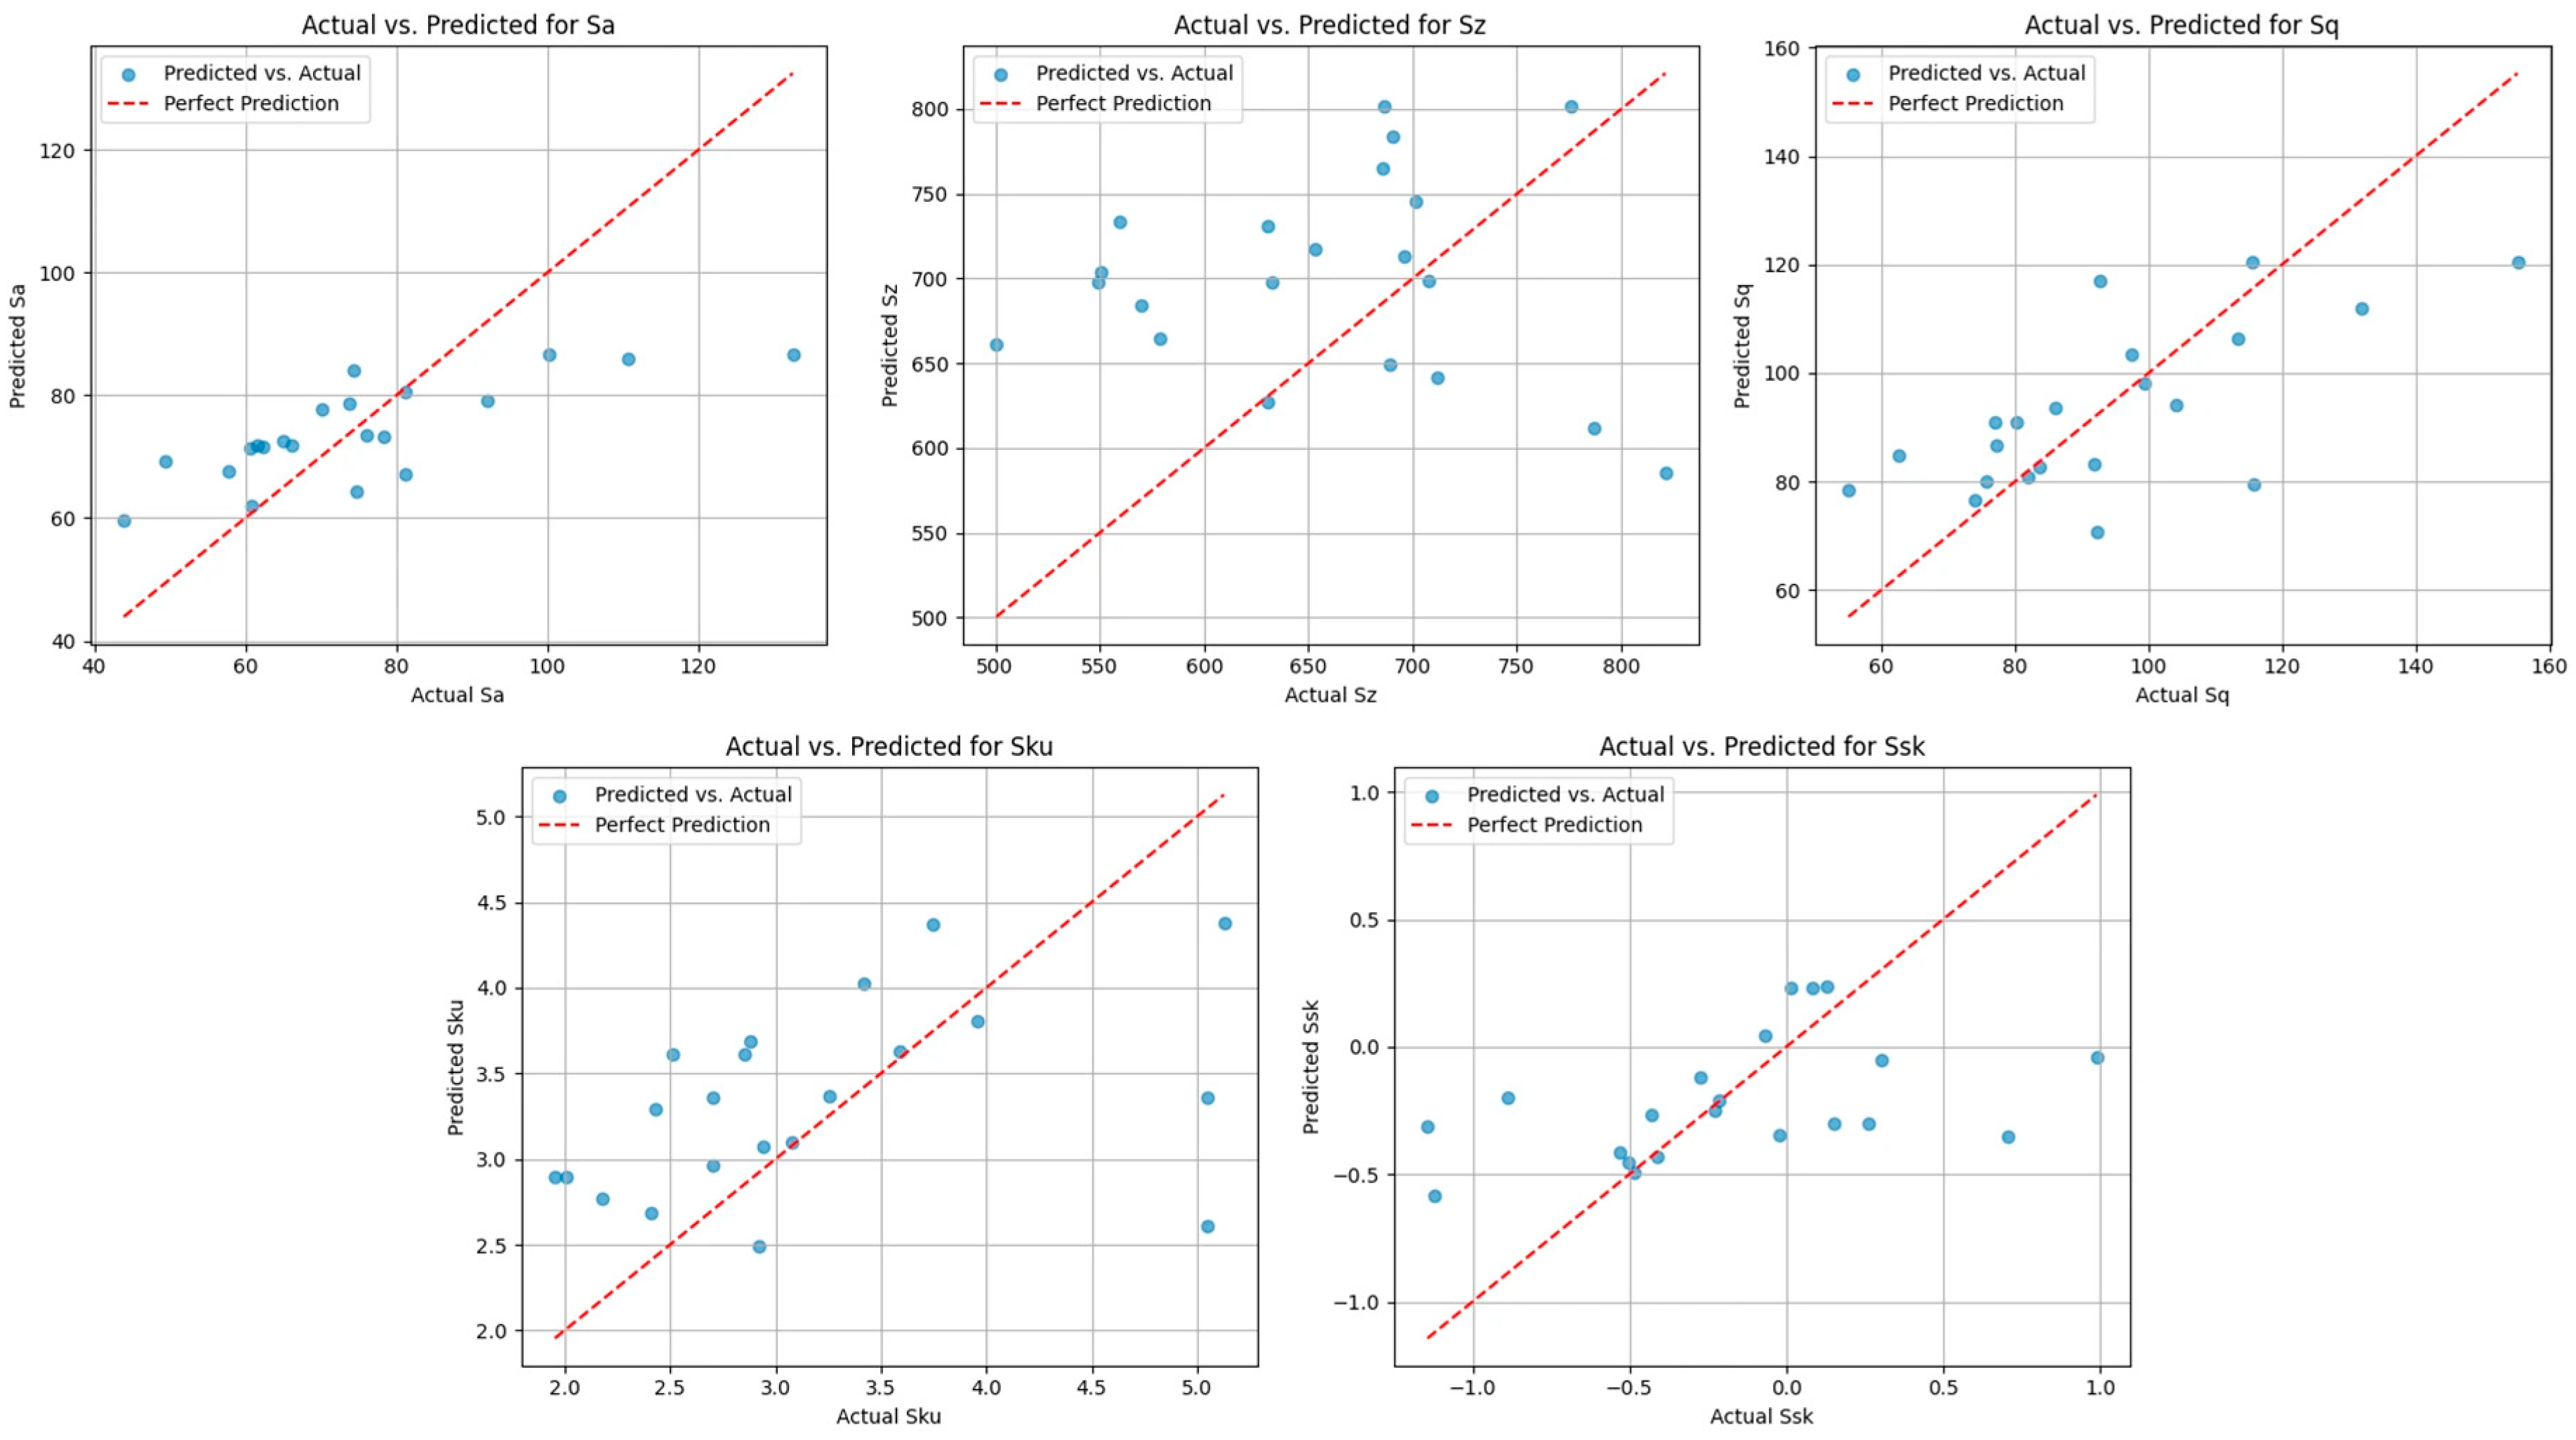
The ANN produced an overall standardized MSE of 0.5853 and standardized MAE of 0.5831. Target-specific test metrics are shown in Table 5. Sa and Sq had the highest R2 values (0.4419 and 0.4702, respectively), whereas Sz had a negative R2. Figure 3 compares the actual and predicted responses on the row-level test set. These results indicate a modest within-dataset predictive performance.
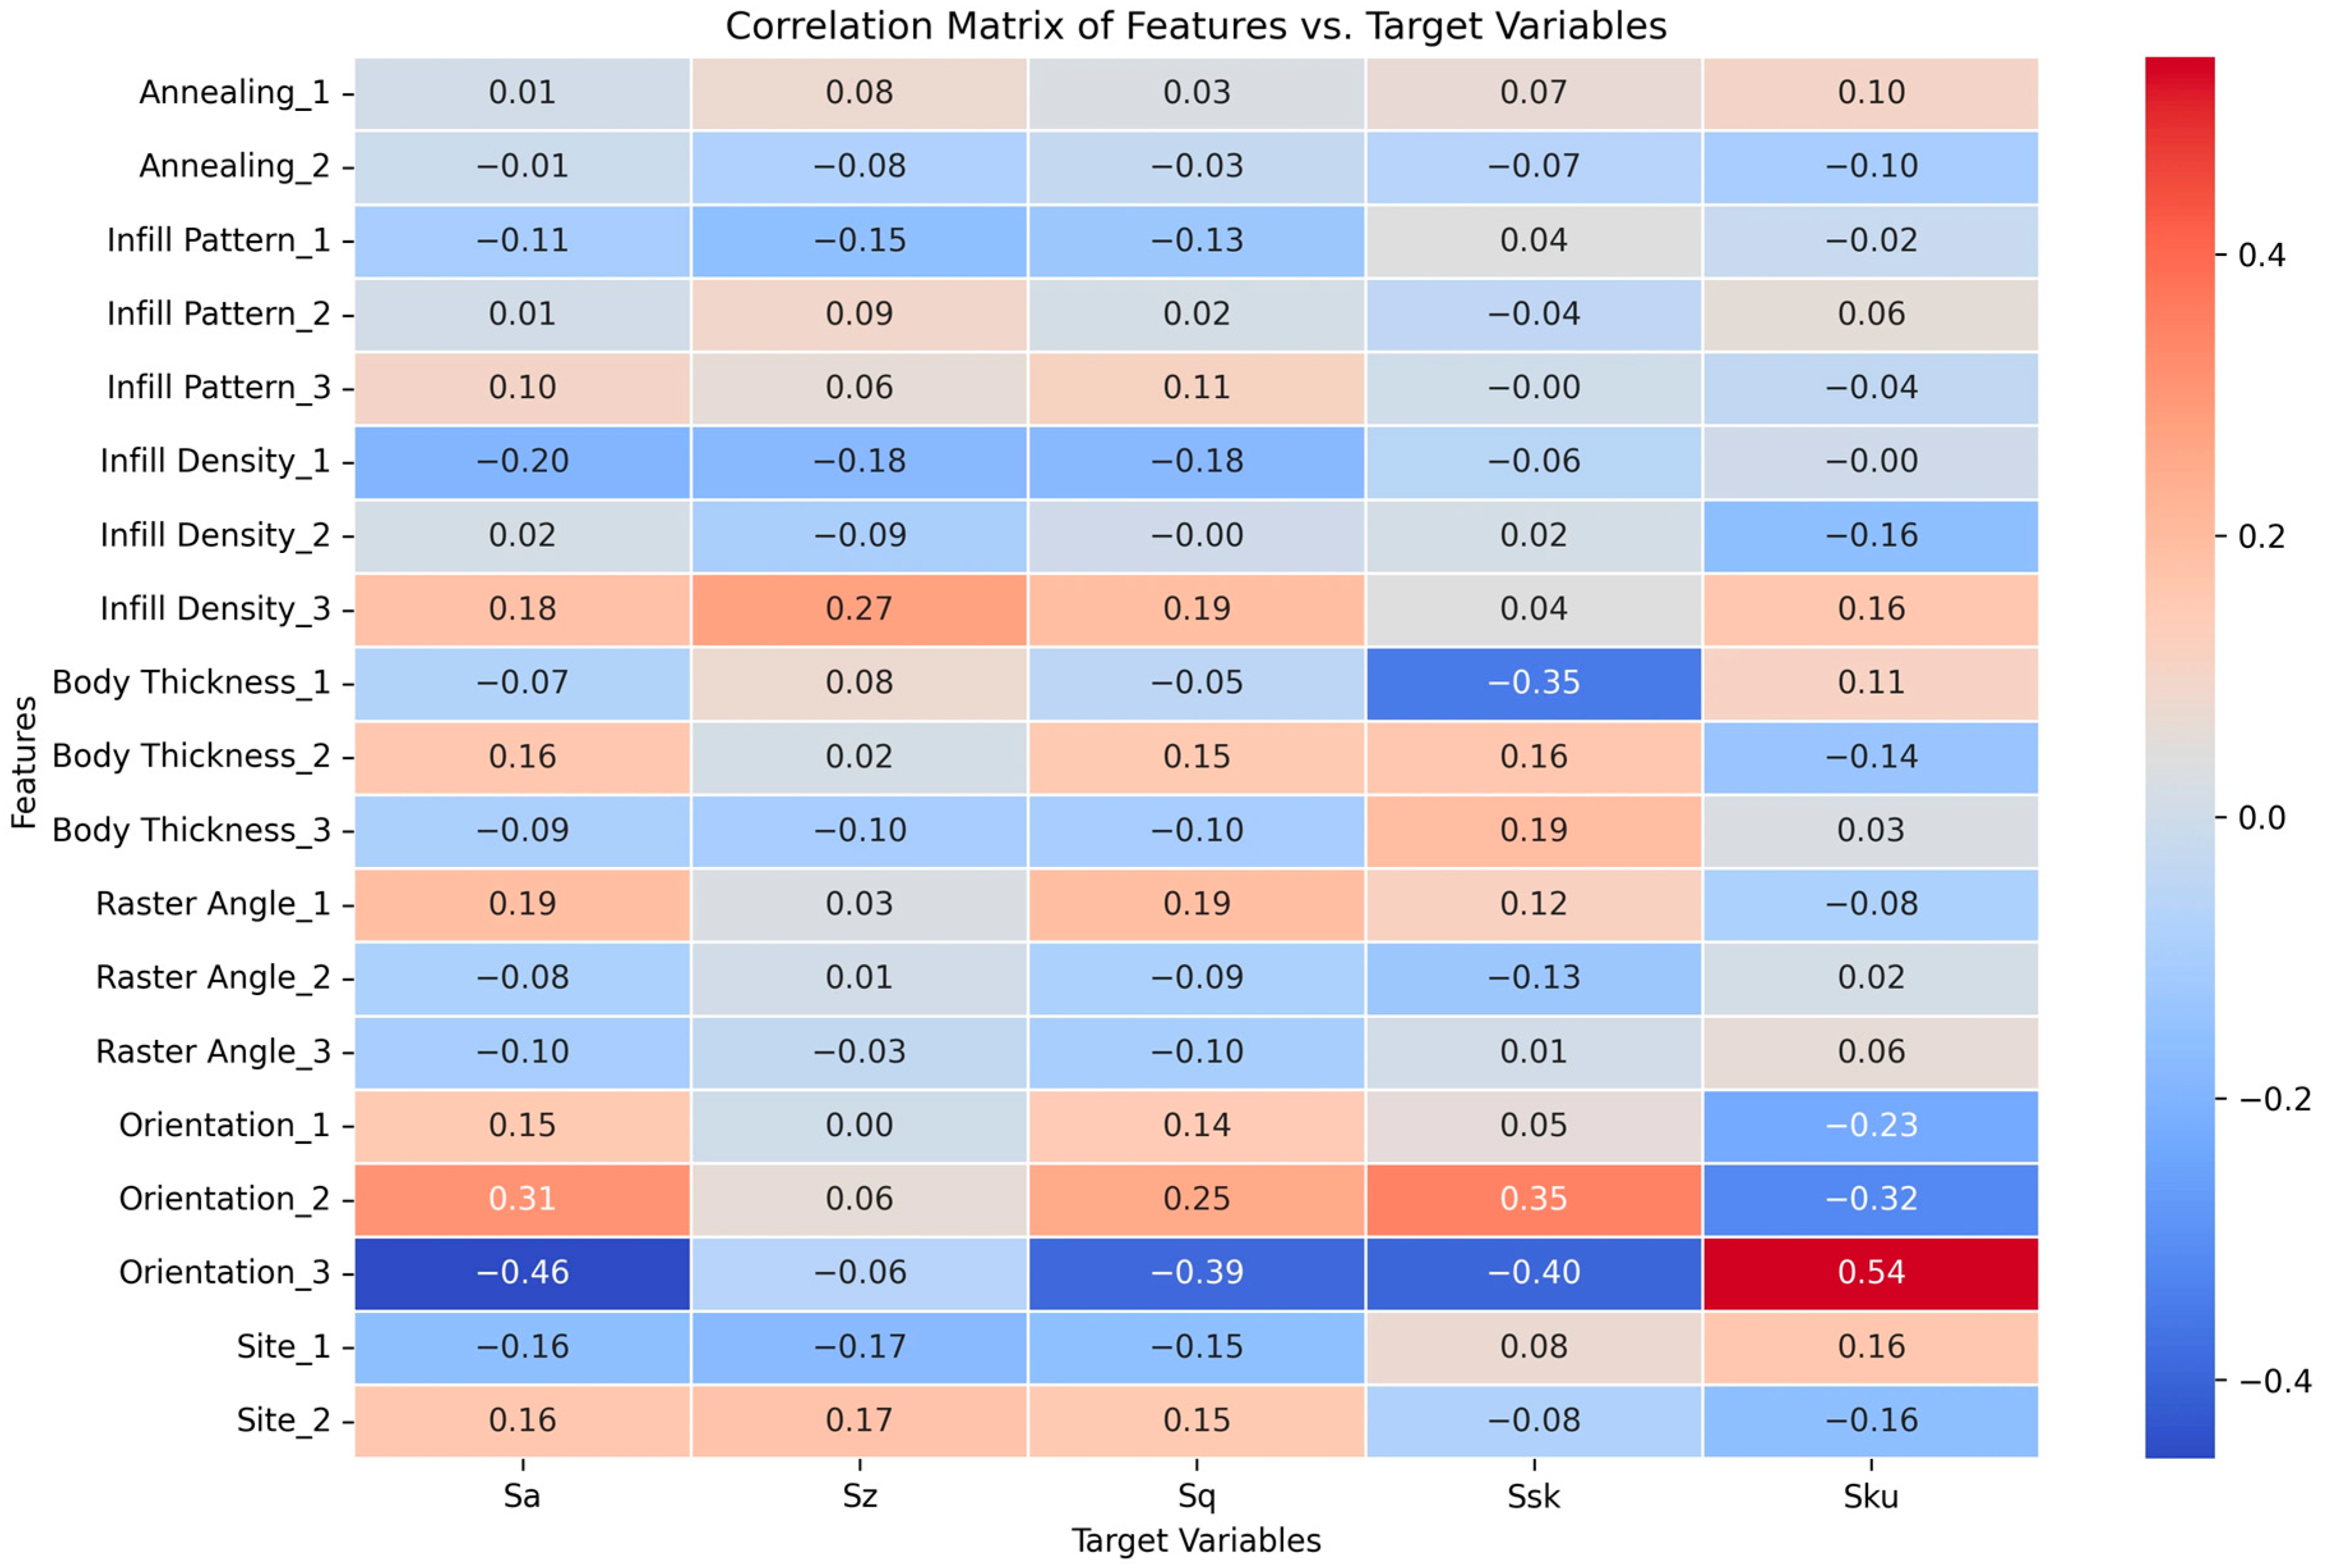
Figure 4 presents Pearson correlations between the one-hot-encoded predictors and the measured responses; these correlations are descriptive associations, not intrinsic ANN feature importances. Orientation_2, Raster_Angle_1, and Infill_Density_3 were positively associated with Sa and Sq, whereas Orientation_3, Infill_Density_1, and Site_1 were negatively associated. After standardization, the absence of a one-hot level is represented by a negative standardized value, but this does not reverse the category’s meaning. The sign instead reflects the difference between rows with and without that level.
Orientation_2 placed the specimens upright, with the measurement sites fabricated later in the build, whereas Orientation_3 placed the sites toward the build plate. Infill_Density_1 represented the maximum density available for each pattern, and Infill_Density_3 represented the minimum. The observed correlations were consistent with a higher Sa and Sq at a lower infill density and with lower values at Site 1. These associations do not, by themselves, establish causal effects.

3.2.2. RF Results

The original RF model used the same one-hot-encoded rows. All responses except Sz had positive R2 values (Table 6). Sku had the highest R2 (0.5006), followed by Ssk (0.3596) and Sa (0.3535).
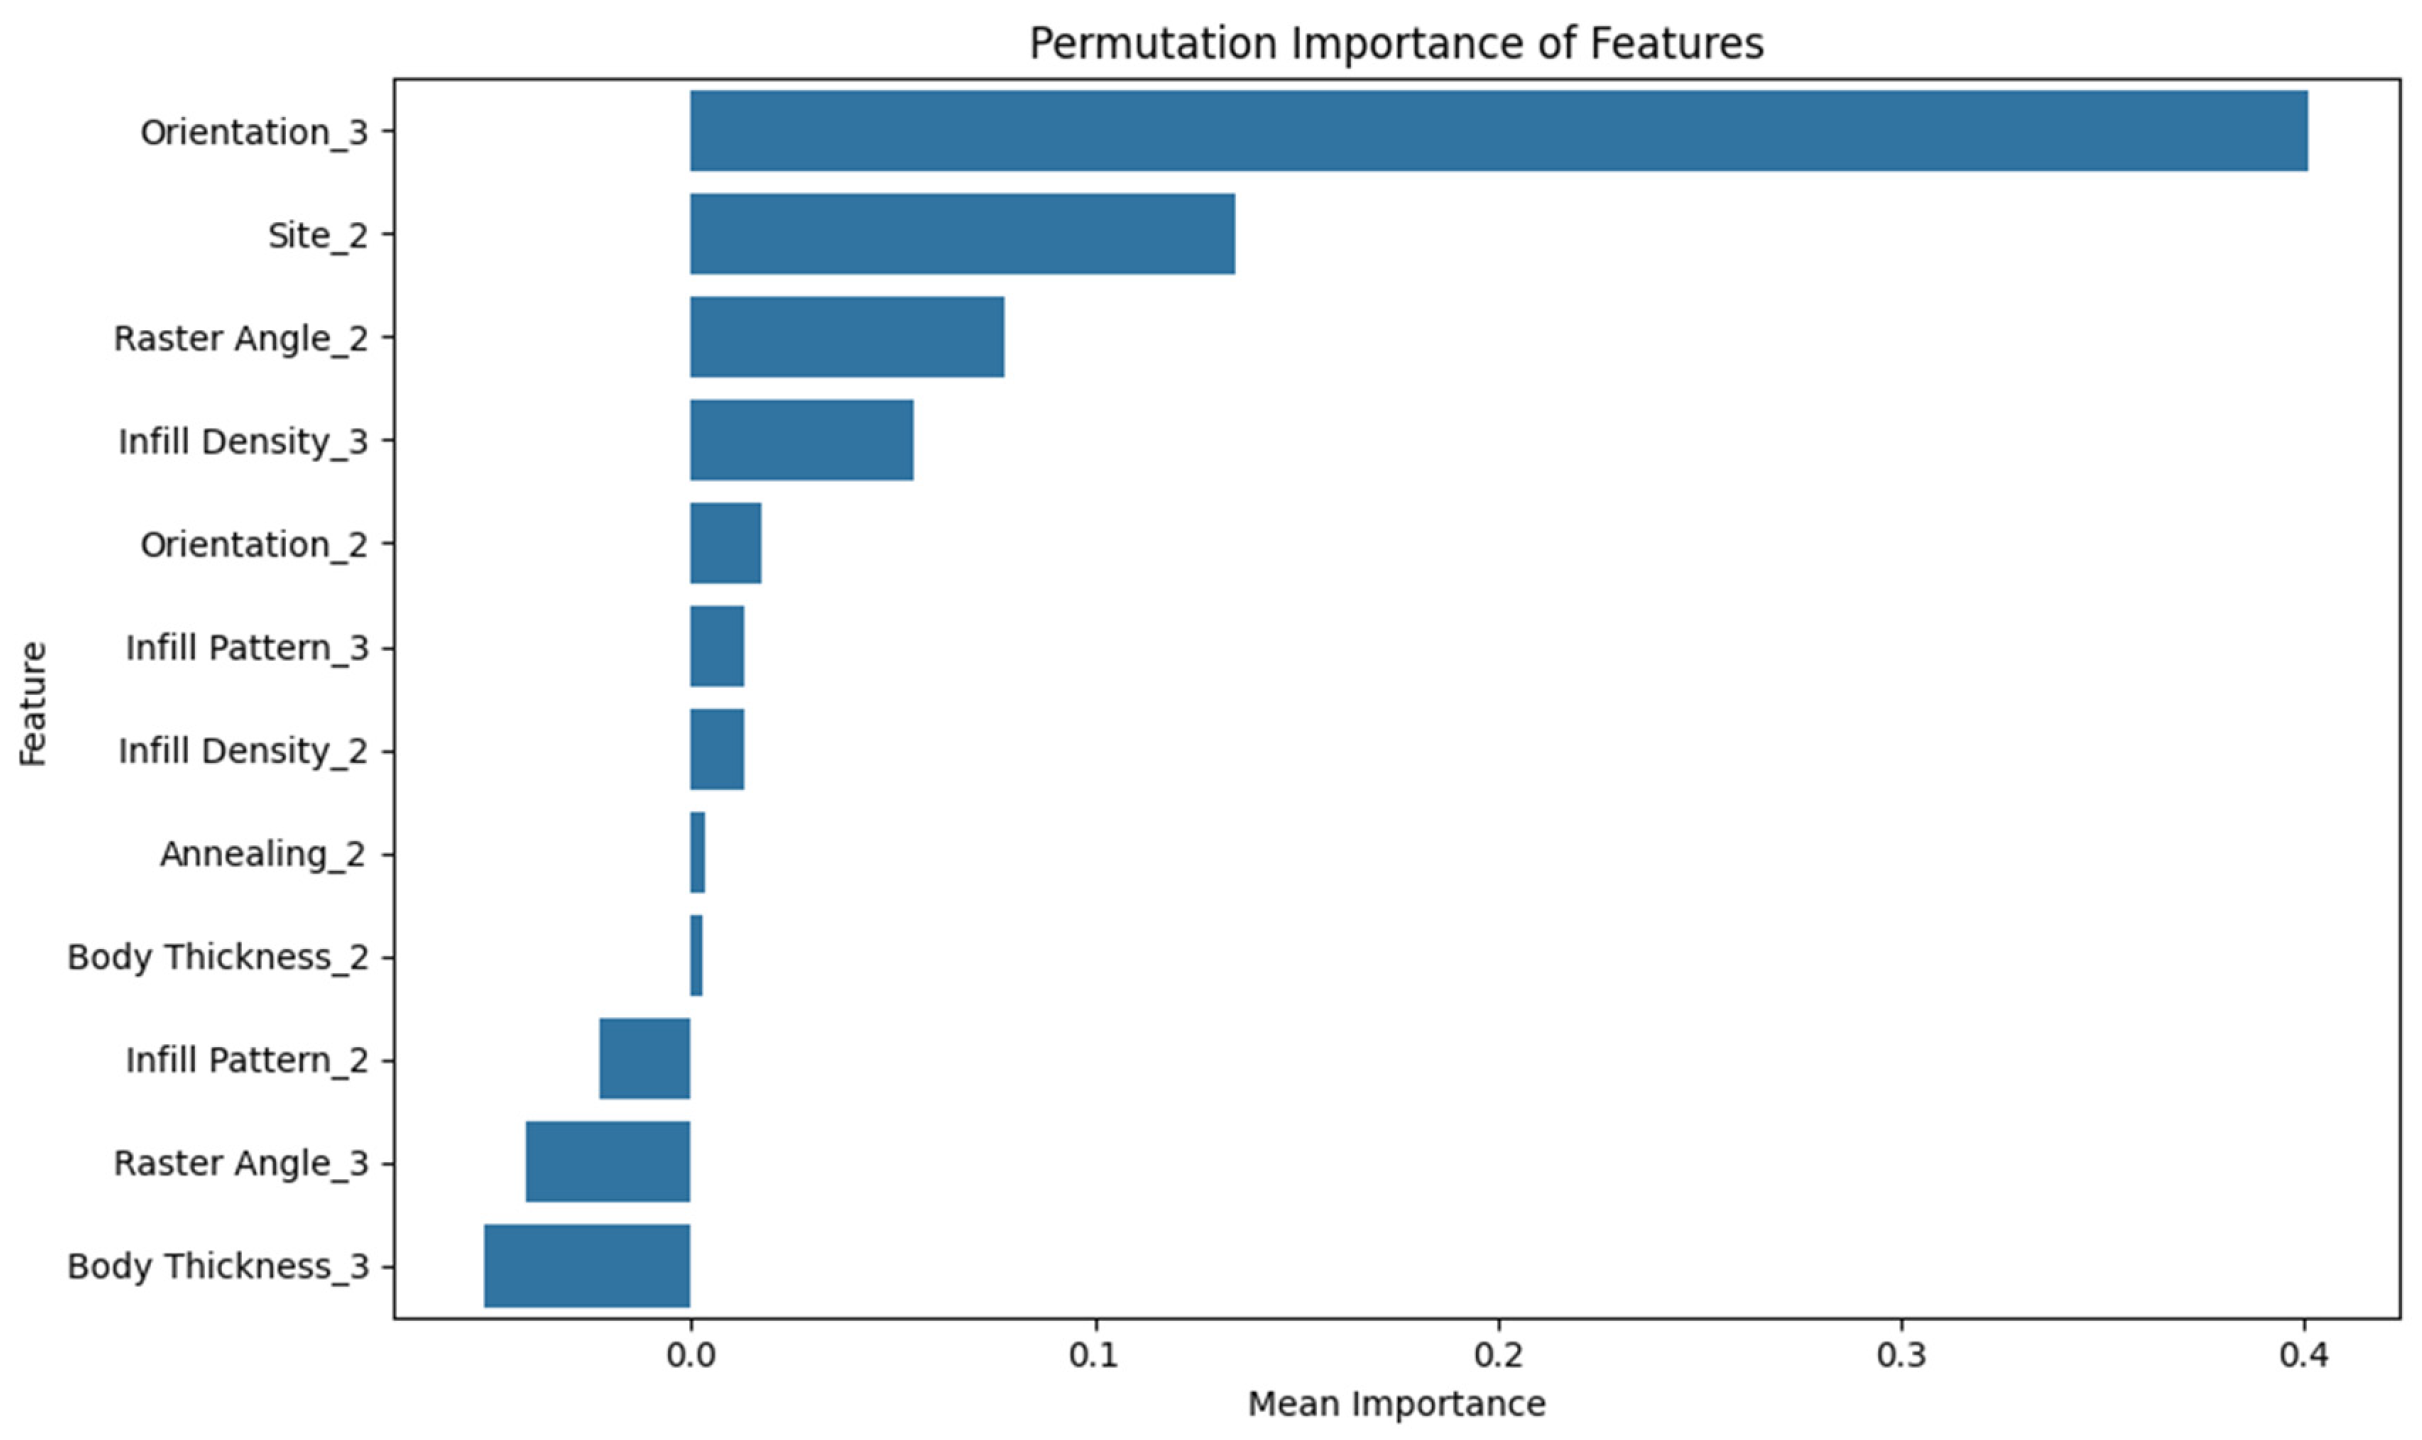
Figure 5 presents the permutation importance for the separate Sa RF model evaluated on a random row test set. Orientation_3 had the largest mean decrease in test R2 (0.401), followed by Site_2 (0.135) and Raster Angle_2 (0.077). Negative values indicate that permutation improved the model score. These scores describe this fitted model and split; they do not establish a causal ranking or validate the prediction of unseen printing conditions. Impurity-based importances from the original RF models are shown separately for Sku, Ssk, and Sa.
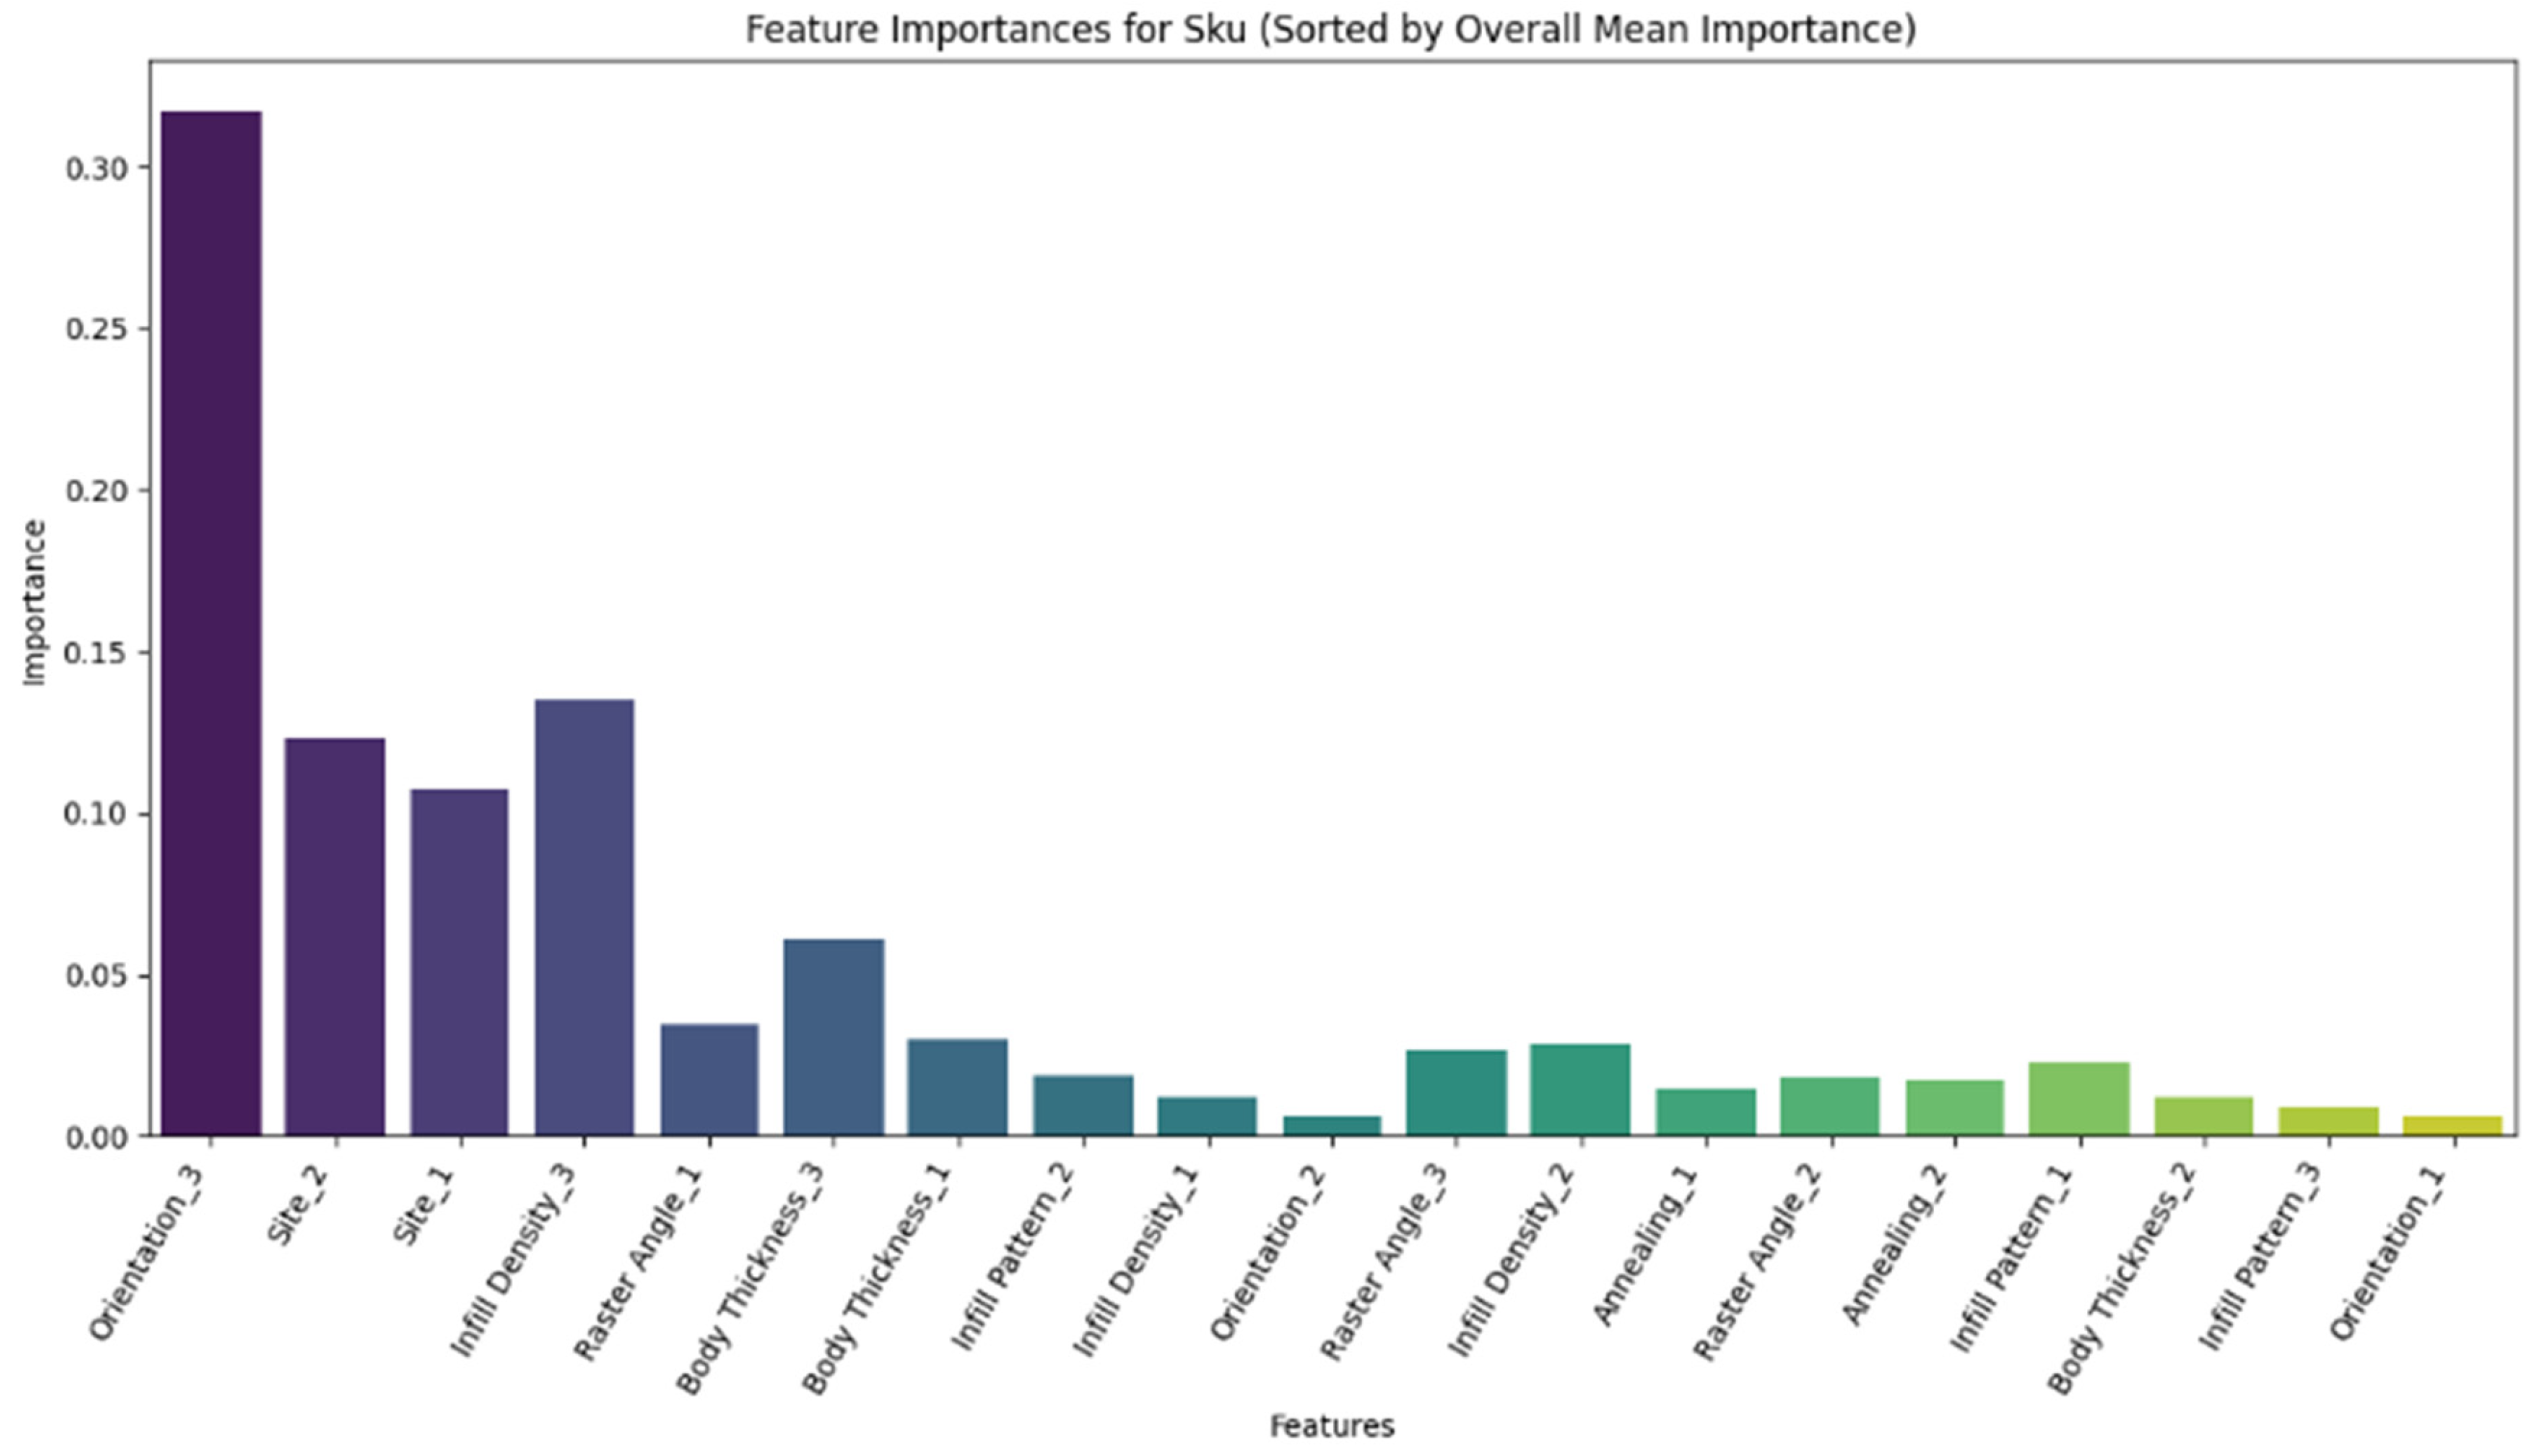
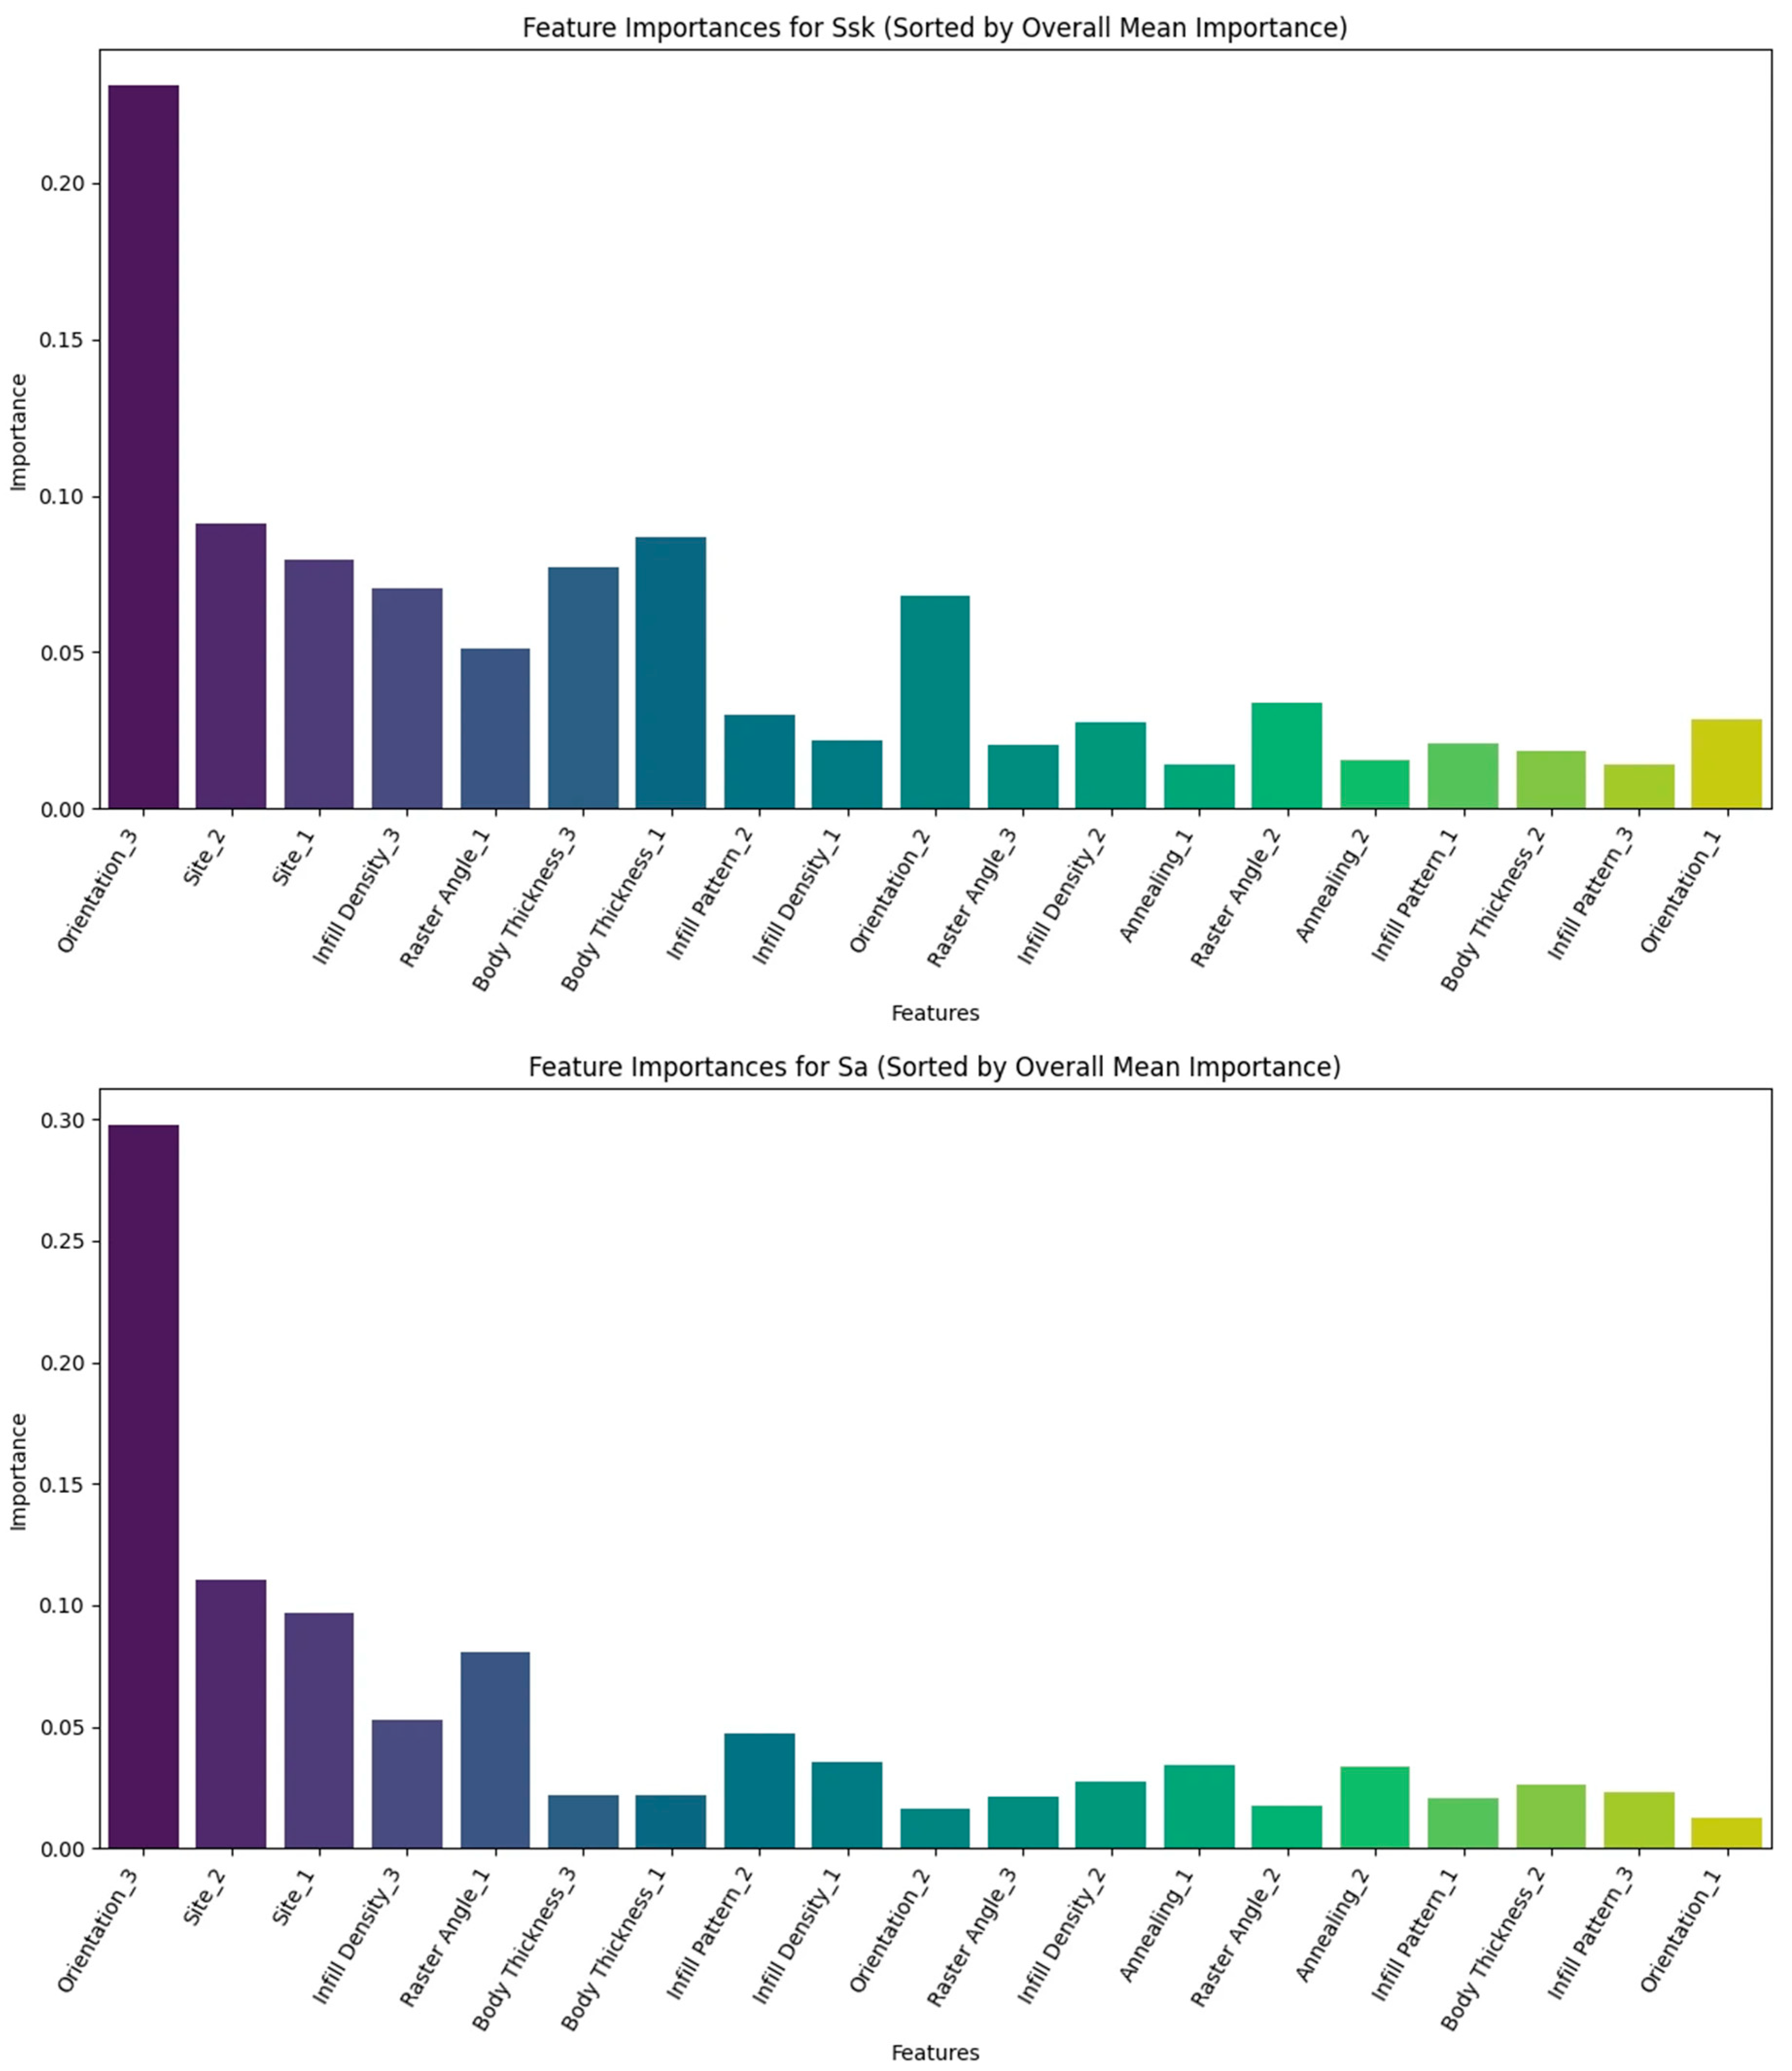
Orientation_3 had the largest impurity-based importance for the Sa, Ssk, and Sku RF models. For Sku (Figure 6), Infill_Density_3 and Site_1 were also prominent. For Ssk and Sa (Figure 7), body-thickness and site levels contributed to tree-split error reduction. Because impurity-based importance can be distributed among correlated one-hot predictors, the rankings should be interpreted comparatively rather than causally.

3.2.3. GPR Results

The original GPR models generally performed below the ANN and RF models (Table 7). Sz and Ssk had negative R2 values. Sku had the highest GPR R2 (0.4159), followed by Sa (0.2922) and Sq (0.1348).
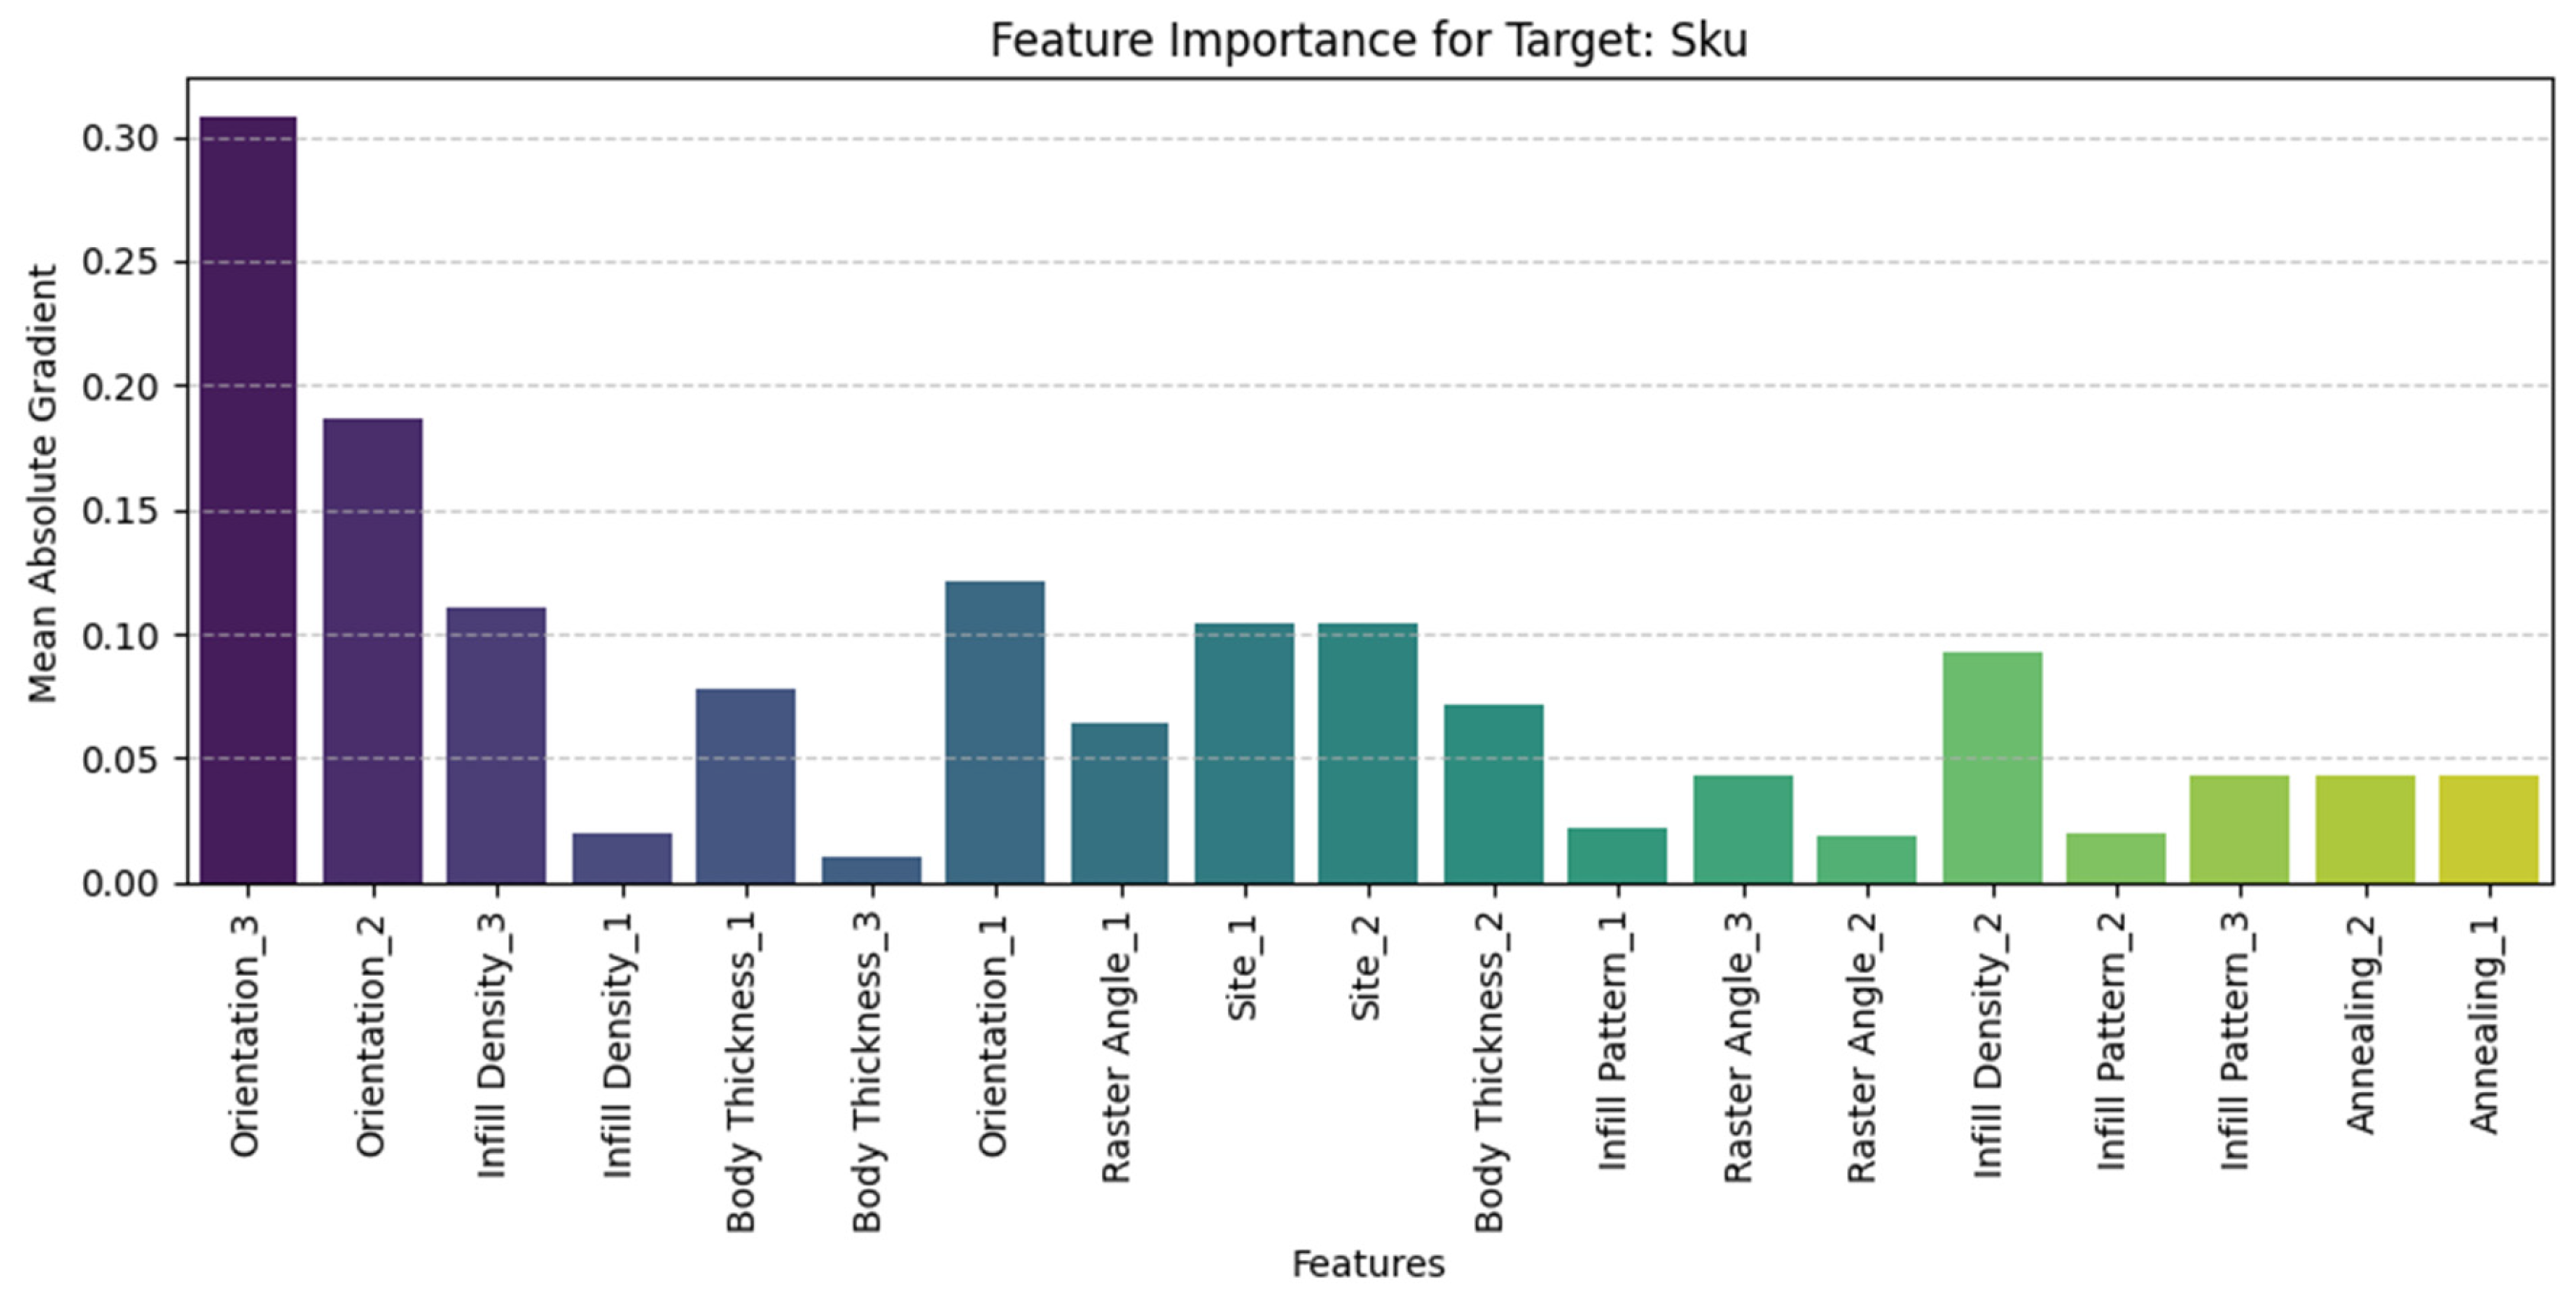
Figure 8 shows post hoc mean-absolute-gradient sensitivity scores for the encoded inputs and Sku, the best-performing GPR response. Orientation levels ranked most highly, followed by Infill_Density_3 and Raster_Angle_1. These scores are descriptive local-sensitivity measures; they are not intrinsic GPR feature importances and do not establish causal effects.

3.2.4. Condition Grouped Validation and Sensitivity Analysis

Table 8 reports the grouped test results on the complete dataset. All RF and GPR mean R2 values were negative. The ANN produced a small positive mean R2 for Sku (0.069), with a standard deviation of 0.228; its other mean R2 values were negative. Thus, the original RF result for Sku (R2 = 0.5006) did not translate into a reliable prediction for unseen printing conditions.
The 102 row sensitivity results are reported in Table A2. Table A3 identifies the omitted observations and their printing conditions. Error magnitudes and rankings changed with the retained observations, but this subset also did not support reliable unseen condition prediction. Under LOCO, all ANN mean R2 values were negative for both datasets (Table A4). Each LOCO test fold contains only four to six observations, so its R2 is sensitive to small within the condition response variation and is not directly comparable to the fivefold mean. Table A5 shows the training and test R2 gap.

4. Discussion

The principal contribution of this study is the replicated characterization of the local surface quality in a complex ULTEM 1010 part. The exploratory ANOVA identified orientation associations with four responses and a body thickness association with Ssk after the false discovery rate correction. Neither the infill density nor measurement site remained significant after correction. These findings require a cautious interpretation because the tests do not model paired specimen measurements or jointly estimate all factors. The descriptive correlations and model summaries complement these tests, but do not remove this limitation. Evaluating both the height magnitude and distribution shape provides a broader account of the surface quality than a single average roughness measurement.
The original row-level results were below many values reported in the literature (Table 5, Table 6 and Table 7), and condition-grouped testing further reduced the performance (Table 8). Published R2 values above 0.99 were obtained for different materials, geometries, process ranges, response definitions, and validation tasks [26,31,32,33]. They are therefore not transferable accuracy targets for this dataset. There are only 18 unique printing conditions, irrespective of the 54 specimens or 108 measurements. Replication estimates the local variability but does not expand the coverage of parameter combinations. The 333-parameter ANN can overfit this limited space, while RF cannot infer an unseen combination merely from repeated measurements of familiar conditions.
Sz had negative R2 values in the original comparisons and in the grouped evaluation. As an extreme height measure, Sz can be dominated by an isolated peak, valley, support removal mark, or optical measurement artifact that is not described by the six process factors. The local surface normal, support contact area, bead and seam placement, thermal history, and moisture were not explicit model inputs. Fixed layer height, nozzle temperature, and speed further limit the investigated process space. These are plausible sources of unexplained variation, rather than mechanisms directly measured by this experiment.
Orientation_3 (−XY) was prominent in the descriptive correlations and model summaries. This orientation placed the measurement sites near the build plate and in greater contact with breakaway support, providing a plausible mechanism for local roughness differences. Site 2 remained angled relative to the build plate, whereas Site 1 could be parallel in two orientations. Orientation changes the local build direction, layer steps, deposition sequence, and support contact simultaneously. Support can stabilize a downward-facing surface during deposition and can also leave marks when removed; its independent contribution was not isolated here. The associations therefore do not establish that a greater or reduced support contact alone improves the surface quality.
A higher infill density can provide a more continuous substrate for deposited surface beads, reducing unsupported spans and local sagging. Body thickness changes the contour and internal support beneath those beads. These mechanisms are consistent with some observed associations, but density levels are pattern-dependent, and the adjusted density tests were not significant. The evidence supports orientation as a consistent factor in this experiment, with more limited claims for infill density.
Annealing showed no association below the adjusted significance threshold in the exploratory tests. Earlier studies examined different PEI grades, restrained or pressure-assisted treatments, mechanical properties, or qualitative fracture morphology [46,54,55,56,57,58]. Improved interlayer bonding does not necessarily reduce the external areal roughness. For amorphous ULTEM 1010, heating above the glass transition region increases the chain mobility and can relax stresses or change interfacial voids, but it does not necessarily erase the bead boundaries or layer steps. Only one temperature and dwell combination was tested here. The nonsignificant result therefore does not exclude smaller or condition-dependent effects, and no formal power analysis was performed.
Body thickness and raster angle levels also appeared in the descriptive correlations and RF rankings, although their order varied by response and algorithm. The evidence is insufficient to conclude that one body thickness level universally improves the surface roughness. No raster angle association remained significant after false discovery rate correction.
For engineering use, orientation should be evaluated in relation to the surface requiring the closest finish. The negative Sa and Sq correlations for Orientation_3 (−XY) identify this placement as a candidate for confirmation on the measured regions. They do not establish a universally preferred orientation or an optimal combination of infill, thickness, raster angle, and annealing. The weak grouped predictions do not support model-based optimization. Confirmation measurements are required before recommending a complete parameter combination for production.

5. Conclusions

This study provides a replicated, site-resolved evaluation of user-controllable printing parameters and areal surface roughness in industrially printed ULTEM 1010 components. A complex surgical guide geometry, two measurement locations, five roughness responses, and three machine-learning approaches extend the characterization beyond a single average surface metric. The exploratory ANOVA with false discovery rate correction identified orientation associations with Sa, Sq, Ssk, and Sku, and a body thickness association with Ssk. These associations require confirmation using an analysis that accounts for paired specimen measurements. Descriptive results identify −XY as a candidate orientation for local surface evaluation, without establishing an optimal printing condition.
The condition-grouped evaluation kept paired sites and all replicates of each printing condition together. The predominantly negative test R2 values show that the current ANN, RF, and GPR models do not provide reliable predictions for unseen conditions. This conclusion held when the archived six exclusions were retained or restored, although numerical errors and rankings changed. The results support experimental characterization and model comparison, not a deployable predictor or a confirmed global optimum.
Transferable process guidance requires more unique printing conditions, additional geometries and measurement sites, quantified instrument repeatability, and explicit local geometry and support descriptors. The present findings apply to the fixed Fortus 450MC material profile and the two measured regions of this component.

Supplementary Materials

The following supporting information can be downloaded at: https://www.mdpi.com/article/10.3390/pr14182985/s1. File S1: processes-14-02985_Supplementary_Dataset.xlsx, containing the original and processed measurements, coded model inputs, original analysis summaries, and Site 1 instrument exports.

Author Contributions

Conceptualization, A.P., G.M. and J.S.; methodology, A.P., G.M. and J.S.; software, A.P.; validation, A.P.; formal analysis, A.P.; investigation, A.P., G.M. and J.S.; resources, G.M. and J.S.; data curation, A.P.; writing—original draft, A.P., G.M. and J.S.; writing—review and editing, A.P., G.M. and J.S.; visualization, A.P.; supervision, G.M. and J.S.; project administration, G.M. and J.S.; funding acquisition, G.M. and J.S. All authors have read and agreed to the published version of the manuscript.

Funding

This work was funded by the University of North Florida Foundation.

Data Availability Statement

The data supporting the findings of this study are included in the article and its Supplementary Material. Further inquiries can be directed to the corresponding author.

Conflicts of Interest

The authors declare that they have no known competing financial interests or personal relationships that could have appeared to influence the work reported in this paper.

Appendix A. Validation and Sensitivity Results

Table A1. Benjamini–Hochberg adjusted p values for all 35 exploratory one-way ANOVA tests. The cleaned response specific sample sizes are 103 for Sa, Sz, Sq, and Ssk, and 102 for Sku. The tests do not account for paired specimen measurements.
nFactorSaSzSqSskSku
103/102Annealing0.93400.67280.93400.73860.6261
103/102Infill Pattern0.78270.62610.68510.93400.9340
103/102Infill Density0.29770.11020.29770.93400.4919
103/102Body Thickness0.64530.75270.64530.01050.6453
103/102Raster Angle0.61450.93400.61450.64530.8530
103/102Orientation<0.00010.92610.00110.0004<0.0001
103/102Site0.29770.29770.31400.68510.3145
Table A2. Condition-grouped test performance for the archived 102-row subset. Values are means ± standard deviations across five outer folds; ANN and GPR use sample standard deviations and RF uses population standard deviations. Units follow Table 8. Fold allocation was performed separately for this subset.
ModelResponseTest R2RMSEMAE
ANNSa−0.614 ± 0.15024.489 ± 2.99219.037 ± 2.201
ANNSz−0.790 ± 0.730147.338 ± 26.543124.209 ± 25.963
ANNSq−0.453 ± 0.27329.224 ± 4.40623.281 ± 3.402
ANNSsk−1.033 ± 1.1680.669 ± 0.1020.528 ± 0.089
ANNSku−0.804 ± 1.2981.133 ± 0.3650.843 ± 0.185
RFSa−0.335 ± 0.48221.725 ± 3.09618.569 ± 2.800
RFSz−0.448 ± 0.262137.322 ± 26.830114.883 ± 28.075
RFSq−0.494 ± 0.64928.572 ± 2.55324.811 ± 3.272
RFSsk−0.308 ± 0.5640.549 ± 0.1170.436 ± 0.093
RFSku−0.167 ± 0.3280.983 ± 0.3570.784 ± 0.289
GPRSa−0.608 ± 0.86223.737 ± 5.13219.246 ± 5.220
GPRSz−0.143 ± 0.148121.771 ± 21.62299.077 ± 24.805
GPRSq−0.591 ± 0.89129.354 ± 4.42023.879 ± 5.253
GPRSsk−0.588 ± 1.1090.579 ± 0.1010.482 ± 0.082
GPRSku−0.666 ± 1.3311.080 ± 0.3780.824 ± 0.156
Table A3. The six observations omitted from the archived modeling subset. Factor codes follow Table 2 and Table 3 in the order annealing, infill pattern, density, body thickness, raster angle, and orientation. All observations remain in the primary 108-row model evaluation.
ObservationConditionSix Factor CodesRows Retained in Condition (of 6)
ULTEM_S16_SITE161, 2, 3, 3, 1, 15
ULTEM_S20_SITE171, 3, 1, 2, 1, 35
ULTEM_S22_SITE181, 3, 2, 3, 2, 15
ULTEM_S26_SITE191, 3, 3, 1, 3, 25
ULTEM_S40_SITE1142, 2, 2, 3, 1, 24
ULTEM_S42_SITE1142, 2, 2, 3, 1, 24
Table A4. ANN leave-one-condition-out test performance, reported as mean ± standard deviation across 18 folds. Units follow Table 8.
DatasetResponseTest R2RMSEMAE
108Sa−3.198 ± 4.92033.129 ± 14.27726.847 ± 10.858
108Sz−1.675 ± 2.073167.311 ± 67.883137.975 ± 51.532
108Sq−4.167 ± 7.63240.658 ± 16.83532.869 ± 12.997
108Ssk−1.684 ± 2.8600.550 ± 0.2920.464 ± 0.263
108Sku−2.268 ± 3.7341.119 ± 0.6650.925 ± 0.534
102Sa−1.813 ± 3.72621.180 ± 6.74318.111 ± 6.778
102Sz−1.311 ± 3.491117.883 ± 29.24399.057 ± 25.892
102Sq−1.128 ± 2.60625.644 ± 8.40221.941 ± 8.035
102Ssk−2.264 ± 4.2260.534 ± 0.2230.450 ± 0.216
102Sku−4.072 ± 8.4950.997 ± 0.5370.832 ± 0.459
Table A5. ANN training and outer test R2 during grouped evaluation. The five responses receive equal weights within each fold; entries are means ± sample standard deviations across five folds.
ModelDatasetTraining R2Outer Test R2
ANN1080.462 ± 0.023−0.253 ± 0.306
ANN1020.464 ± 0.051−0.739 ± 0.505
Figure A1. Recorded training and validation MSE for the original 100-epoch ANN fit on standardized responses. The 15% validation partition was taken from the original training rows. These curves describe optimization of that fit; the condition-grouped results in Table 8 provide the independent condition assessment.
Processes 14 02985 g0a1

References

  1. Ahn, S.H.; Montero, M.; Odell, D.; Roundy, S.; Wright, P.K. Anisotropic material properties of fused deposition modeling ABS. Rapid Prototyp. J. 2002, 8, 248–257. [Google Scholar] [CrossRef] [Scilit]
  2. Nelson, J.W.; Atkins, D.; Gottstine, M.L.; Yang, J.; Garapic, G.; Jaminion, S.; Nelson, A.; Wilson, K. Generalized models for unidirectional anisotropic properties of 3D printed polymers. Rapid Prototyp. J. 2020, 26, 1453–1462. [Google Scholar] [CrossRef] [Scilit]
  3. Zou, R.; Xia, Y.; Liu, S.; Hu, P.; Hou, W.; Hu, Q.; Shan, C. Isotropic and anisotropic elasticity and yielding of 3D printed material. Compos. Part B Eng. 2016, 99, 506–513. [Google Scholar] [CrossRef] [Scilit]
  4. Aktepe, E.; Ergün, U. Machine learning approaches for FDM-based 3D printing: A literature review. Appl. Sci. 2025, 15, 10001. [Google Scholar] [CrossRef] [Scilit]
  5. Jakupi, K.; Dukovski, V.; Hodolli, G. Surface roughness modeling of material extrusion PLA flat surfaces. Int. J. Polym. Sci. 2023, 2023, 8844626. [Google Scholar] [CrossRef] [Scilit]
  6. Sherif, M.; Mekhiel, S.; Elmesalamy, A.S.; Mahmoud, H. Investigation of FDM process parameters and their interactions on surface roughness of PLA 3D printed parts. J. Phys. Conf. Ser. 2025, 3058, 012017. [Google Scholar] [CrossRef] [Scilit]
  7. Yuan, Q.; Kim, M.; Tien, T.T.; Fang, Y.; Duan, Z.; Zhang, Y.; Suhr, J. Investigation of contour-related parameters’ effects on anisotropic mechanical properties and surface roughness of FDM-printed parts. Int. J. Adv. Manuf. Technol. 2025, 137, 381–395. [Google Scholar] [CrossRef] [Scilit]
  8. Amiri, A.; Zolfaghari, A.; Shakeri, M. 3D printing of glass fiber reinforced acrylonitrile butadiene styrene and investigation of tensile, flexural, warpage and roughness properties. Polym. Compos. 2022, 43, 6287–6299. [Google Scholar] [CrossRef] [Scilit]
  9. Raffic, N.M.; Babu, K.G.; Kumar, S.D.; Parrthipan, B.K. Surface roughness and printing time minimization in 3D printed aramid fiber reinforced polyamide parts through Taguchi-CoCoSo-Machine learning techniques. J. Mater. Eng. Perform. 2025, 34, 9654–9680. [Google Scholar] [CrossRef] [Scilit]
  10. Ukwaththa, J.; Herath, S.; Meddage, D.P.P. A review of machine learning (ML) and explainable artificial intelligence (XAI) methods in additive manufacturing (3D Printing). Mater. Today Commun. 2024, 41, 110294. [Google Scholar] [CrossRef] [Scilit]
  11. Dong, H.; Gao, X.; Wei, M. Quality prediction of fused deposition molding parts based on improved deep belief network. Comput. Intell. Neurosci. 2021, 2021, 8100371. [Google Scholar] [CrossRef] [Scilit] [PubMed]
  12. Panico, A.; Corvi, A.; Collini, L.; Sciancalepore, C. Multi objective optimization of FDM 3D printing parameters set via design of experiments and machine learning algorithms. Sci. Rep. 2025, 15, 16753. [Google Scholar] [CrossRef] [Scilit] [PubMed]
  13. Ulkir, O.; Ersoy, S. Hybrid experimental–machine learning study on the mechanical behavior of polymer composite structures fabricated via FDM. Polymers 2025, 17, 2012. [Google Scholar] [CrossRef] [Scilit] [PubMed]
  14. Vyavahare, S.; Teraiya, S.; Kumar, S. FDM manufactured auxetic structures: An investigation of mechanical properties using machine learning techniques. Int. J. Solids Struct. 2023, 265, 112126. [Google Scholar] [CrossRef] [Scilit]
  15. Seid Ahmed, Y.; Hassanin, H.; Nazir, A.; Khan, S. A machine learning–integrated framework for mechanical property prediction of FDM–printed PLA. Int. J. Adv. Manuf. Technol. 2025, 139, 5791–5817. [Google Scholar] [CrossRef] [Scilit]
  16. Khan, I.; Al Rashid, A.; Koç, M. Machine Learning Prediction of Raster Angle Effects on Mechanical Properties of Extrusion-Based Additively Manufactured Conductive Thermoplastic Polyurethane Composites. Macromol. Mater. Eng. 2026, 311, e00248. [Google Scholar] [CrossRef] [Scilit]
  17. Özkül, M.; Kuncan, F.; Ulkir, O. Predicting mechanical properties of FDM-produced parts using machine learning approaches. J. Appl. Polym. Sci. 2025, 142, e56899. [Google Scholar] [CrossRef] [Scilit]
  18. Cerro, A.; Romero, P.E.; Yiğit, O.; Bustillo, A. Use of machine learning algorithms for surface roughness prediction of printed parts in polyvinyl butyral via fused deposition modeling. Int. J. Adv. Manuf. Technol. 2021, 115, 2465–2475. [Google Scholar] [CrossRef] [Scilit]
  19. Molero, E.; Fernández, J.J.; Rodríguez-Alabanda, O.; Guerrero-Vaca, G.; Romero, P.E. Use of data mining techniques for the prediction of surface roughness of printed parts in polylactic acid (PLA) by fused deposition modeling (FDM): A practical application in frame glasses manufacturing. Polymers 2020, 12, 840. [Google Scholar] [CrossRef] [Scilit] [PubMed]
  20. Soundararajan, R.; Sathishkumar, A.; Aathil, S.A.; Chandran, N.G. Evaluating machine learning methods for predicting surface roughness of FDM printed parts using PLA plus material. Int. J. Interact. Des. Manuf. (IJIDeM) 2025, 20, 5299–5312. [Google Scholar] [CrossRef] [Scilit]
  21. Huang, M.; Jin, S.; Tang, Z.; Chen, Y.; Qin, Y. A method for predicting surface finish of polylactic acid parts printed using fused deposition modeling. Processes 2023, 11, 1820. [Google Scholar] [CrossRef] [Scilit]
  22. Qin, J.; Hu, F.; Liu, Y.; Witherell, P.; Wang, C.C.L.; Rosen, D.W.; Simpson, T.W.; Lu, Y.; Tang, Q. Research and application of machine learning for additive manufacturing. Addit. Manuf. 2022, 52, 102691. [Google Scholar] [CrossRef] [Scilit]
  23. Deokar, S.; Kumar, N.; Singh, R.P. A comprehensive review on smart manufacturing using machine learning applicable to fused deposition modeling. Results Eng. 2025, 26, 104941. [Google Scholar] [CrossRef] [Scilit]
  24. Kandananond, K. Surface roughness prediction of FFF-fabricated workpieces by artificial neural network and Box–Behnken method. Int. J. Metrol. Qual. Eng. 2021, 12, 17. [Google Scholar] [CrossRef] [Scilit]
  25. Kaplan, K.; Ulkir, O.; Kuncan, F. Optimization and prediction of mechanical properties of TPU-Based wrist hand orthosis using Bayesian and machine learning models. Measurement 2025, 252, 117405. [Google Scholar] [CrossRef] [Scilit]
  26. Ulkir, O.; Bayraklılar, M.S.; Kuncan, M. Taguchi-ANN Hybrid Approach for Evaluating Unsupported Overhang Structures in FDM-Printed Polymers. J. Polym. Sci. 2025, 63, 5185–5207. [Google Scholar] [CrossRef] [Scilit]
  27. Sharma, V.; Singh, J.; Sharma, R.C.; Singh, A. Machine learning-based prediction and optimization of surface roughness in FDM-printed PLA using ANN and box-behnken design. Mater. Sci. Technol. 2025, 41, 1153–1173. [Google Scholar] [CrossRef] [Scilit]
  28. Özer, M. Surface Roughness Prediction of Laser-Polished 3D-Printed Polylactic Acid Parts: A Combined Experimental and Machine Learning Approach. Colloids Surf. A Physicochem. Eng. Asp. 2025, 729, 138916. [Google Scholar] [CrossRef] [Scilit]
  29. Chinchanikar, S.; Shinde, S.; Gaikwad, V.; Shaikh, A.; Rondhe, M.; Naik, M. ANN modelling of surface roughness of FDM parts considering the effect of hidden layers, neurons, and process parameters. Adv. Mater. Process. Technol. 2024, 10, 22–32. [Google Scholar] [CrossRef] [Scilit]
  30. Savran, M. Experimental analysis and a novel stepwise nonlinear hybrid ANN-based machine learning approach for optimizing the mechanical and surface performance of 3D-printed PLA. Measurement 2025, 259, 119648. [Google Scholar] [CrossRef] [Scilit]
  31. Malleswari, V.N.; Manaswy, G.K.; Pragvamsa, P.G. Prediction of surface roughness for fused deposition in fabricated work pieces by RSM and ANN technique. Mater. Today Proc. 2023. [Google Scholar] [CrossRef] [Scilit]
  32. Ulkir, O.; Kuncan, F.; Alay, F.D. Experimental study and ANN development for modeling tensile and surface quality of fiber-reinforced nylon composites. Polymers 2025, 17, 1528. [Google Scholar] [CrossRef] [Scilit] [PubMed]
  33. Ulkir, O.; Karadağ, A. Sustainable additive manufacturing with FDM: Taguchi-based parameter optimization and AI-driven prediction of mechanical and environmental metrics. J. Thermoplast. Compos. Mater. 2026, 39, 08927057261415795. [Google Scholar] [CrossRef] [Scilit]
  34. Tran, N.H.; Phan, N.D.M. Analyzing the impact of process parameters on surface roughness and mechanical properties in FDM 3D printing using machine learning. Int. J. Interact. Des. Manuf. (IJIDeM) 2025, 19, 8709–8728. [Google Scholar] [CrossRef] [Scilit]
  35. Gao, J.; Huang, S.; Zhang, T.; Zhou, X.; Liu, F. FDM 3D printing surface quality optimisation: Multi-objective parameter control based on hybrid machine learning and response surface methodology. Nondestruct. Test. Eval. 2025, 1–38. [Google Scholar] [CrossRef] [Scilit]
  36. Mishra, A.; Jatti, V.S. Novel coupled genetic algorithm–machine learning approach for predicting surface roughness in fused deposition modeling of polylactic acid specimens. J. Mater. Eng. Perform. 2024, 33, 6136–6145. [Google Scholar] [CrossRef] [Scilit]
  37. Liu, J.; Ye, J.; Momin, F.; Zhang, X.; Li, A. Nonparametric bayesian framework for material and process optimization with nanocomposite fused filament fabrication. Addit. Manuf. 2022, 54, 102765. [Google Scholar] [CrossRef] [Scilit]
  38. Chitnis, K.; Lu, Y.; Rhoads, B.; Chakka, L.R.J.; Choudhury, S.; Maniruzzaman, M. Optimization of print parameters for batch and continuous manufacturing of three-dimensional (3D) printed dosage forms using artificial intelligence and machine learning. Drug Deliv. Transl. Res. 2026, 16, 2073–2088. [Google Scholar] [CrossRef] [Scilit] [PubMed]
  39. Min, K.E.; Jang, J.W.; Shin, J.; Kim, C.; Yi, S. Development of Prediction Method for Dimensional Stability of 3D-Printed Objects. Appl. Sci. 2023, 13, 11027. [Google Scholar] [CrossRef] [Scilit]
  40. Lu, J.; Zhang, Z.; Yuan, X.; Ma, J.; Hu, S.; Xue, B.; Liao, X. Effect of machining parameters on surface roughness for compacted graphite cast iron by analyzing covariance function of Gaussian process regression. Measurement 2020, 157, 107578. [Google Scholar] [CrossRef] [Scilit]
  41. Nagarjun, J.; Saravanakumar, N.; Thirumalai Kumaran, S.; Anto Dilip, A.; Balasuadhakar, A. Empirical study and machine learning prediction of tensile strength in 3D printed eco-friendly polylactic acid. Prog. Rubber Plast. Recycl. Technol. 2026, 42, 234–256. [Google Scholar] [CrossRef] [Scilit]
  42. Nasrin, T.; Pourali, M.; Pourkamali-Anaraki, F.; Peterson, A.M. Active learning for prediction of tensile properties for material extrusion additive manufacturing. Sci. Rep. 2023, 13, 11460. [Google Scholar] [CrossRef] [Scilit] [PubMed]
  43. Alsakarneh, A.; Obaidat, S.; Mumani, A.A.; Tamimi, M.F. Predicting the dynamic tensile response of FDM materials using machine learning. Discov. Appl. Sci. 2026, 8, 51. [Google Scholar] [CrossRef] [Scilit]
  44. Qayyum, H.; Saqib, K.; Hussain, G.; Alkahtani, M. Predicting flexural properties of 3D-printed composites: A small dataset analysis using multiple machine learning models. Mater. Today Commun. 2025, 42, 111135. [Google Scholar] [CrossRef] [Scilit]
  45. Vidakis, N.; Petousis, M.; David, C.; Nasikas, N.K.; Sagris, D.; Mountakis, N.; Spiridaki, M.; Moutsopoulou, A.; Stratakis, E. Critical quality indicators of high-performance polyetherimide (ULTEM) over the MEX 3D printing key generic control parameters: Prospects for personalized equipment in the defense industry. Def. Technol. 2025, 43, 150–167. [Google Scholar] [CrossRef] [Scilit]
  46. Halevi, S.; Tulpan, I.; Shirizly, A.; Katarivas Levy, G. A design framework for multi-thermal optimization of ULTEM 1010 using open-source FDM: Unlocking its additive manufacturing potential. Mater. Des. 2025, 257, 114407. [Google Scholar] [CrossRef] [Scilit]
  47. Petousis, M.; David, C.; Sagris, D.; Spyridaki, M.; Mountakis, N.; Stratakis, E.; Vidakis, N. Interpreting the effect of critical control settings on the quality metrics of thermoplastic polyimide in extrusion based additive manufacturing. Int. J. Adv. Manuf. Technol. 2026, 142, 5827–5846. [Google Scholar] [CrossRef] [Scilit]
  48. Jonckers, D.; Gundlach, C.; Hartwig, S.; Thakur, A. Characterisation of high-performance polymer parts produced by low-pressure additive manufacturing. CEAS Space J. 2026, 18, 849–869. [Google Scholar] [CrossRef] [Scilit]
  49. Vakharia, V.S.; Leonard, H.; Singh, M.; Halbig, M.C. Multi-material additive manufacturing of high temperature polyetherimide (PEI)–based polymer systems for lightweight aerospace applications. Polymers 2023, 15, 561. [Google Scholar] [CrossRef] [Scilit] [PubMed]
  50. Stratasys. ULTEM™ 1010 Resin: Material Data Sheet; Stratasys: Minnetonka, MN, USA, 2025; Available online: https://www.stratasys.com/contentassets/cf5233651e104c96a9298560bc831e5a/mds_fdm_ultem-1010-resin_0625a.pdf (accessed on 10 September 2026).
  51. Pandelidi, C.; Maconachie, T.; Bateman, S.; Kelbassa, I.; Piegert, S.; Leary, M.; Brandt, M. Parametric study on tensile and flexural properties of ULTEM 1010 specimens fabricated via FDM. Rapid Prototyp. J. 2021, 27, 429–451. [Google Scholar] [CrossRef] [Scilit]
  52. Pressly, A.; Simsiriwong, J.; May, G. Machine learning based evaluation of surface roughness of additively manufactured Nylon 12 surgical guides. In Proceedings of the 36th Annual International Solid Freeform Fabrication Symposium, Austin, TX, USA, 10–13 August 2025. [Google Scholar]
  53. Omer, M.A.; Shaban, I.A.; Mourad, A.H.; Hegab, H. Advances in interlayer bonding in fused deposition modelling: A comprehensive review. Virtual Phys. Prototyp. 2025, 20, e2522951. [Google Scholar] [CrossRef] [Scilit]
  54. Yilmaz, M.; Yilmaz, N.F.; Kalkan, M.F. Rheology, crystallinity, and mechanical investigation of interlayer adhesion strength by thermal annealing of polyetherimide (PEI/ULTEM 1010) parts produced by 3D printing. J. Mater. Eng. Perform. 2022, 31, 9900–9909. [Google Scholar] [CrossRef] [Scilit]
  55. de Bruijn, A.C.; Gómez-Gras, G.; Fernández-Ruano, L.; Farràs-Tasias, L.; Pérez, M.A. Optimization of a combined thermal annealing and isostatic pressing process for mechanical and surface enhancement of Ultem FDM parts using Doehlert experimental designs. J. Manuf. Processes 2023, 85, 1096–1115. [Google Scholar] [CrossRef] [Scilit]
  56. Butt, J.; Afsharnia, H.; Khan, M.A.A.; Mohaghegh, V. Effect of different annealing methods on ULTEM 9085 parts manufactured by material extrusion. J. Manuf. Mater. Process. 2024, 8, 258. [Google Scholar] [CrossRef] [Scilit]
  57. Nguyen, K.Q.; Vuillaume, P.Y.; Hu, L.; Vachon, A.; Diouf-Lewis, A.; Marcoux, P.L.; Robert, M.; Elkoun, S. Effect of in situ thermal treatment on interlayer adhesion of 3D printed polyetherimide (PEI) parts produced by fused deposition modeling (FDM). Mater. Today Commun. 2024, 39, 108588. [Google Scholar] [CrossRef] [Scilit]
  58. Ouassil, S.E.; El Magri, A.; Vanaei, H.R.; Vaudreuil, S. Investigating the effect of printing conditions and annealing on the porosity and tensile behavior of 3D-printed polyetherimide material in Z-direction. J. Appl. Polym. Sci. 2023, 140, e53353. [Google Scholar] [CrossRef] [Scilit]
Figure 1. (A) Orientation controls in GrabCAD; (B) Auto; (C) XY; and (D) −XY orientation [52]. The blue boxes highlight the same part feature across the three orientations.
Processes 14 02985 g001
Figure 2. Surface-roughness measurement sites on the surgical guide: (A) Site 1 (single-line region, left) and Site 2 (cross-hatched region, right); (B) representative optical surface image and, (C) relative height map for ULTEM_S01_SITE1: Sa = 62.41 µm, Sz = 711.78 µm, Sq = 77.23 µm, Ssk = −0.214, and Sku = 2.704. The colors in (C) represent variations in relative surface height within the approximately 5.82 mm² measurement field.
Processes 14 02985 g002
Figure 3. Actual and predicted responses for the ANN on the row-level test set. Sa, Sz, and Sq are shown in µm; Ssk and Sku are dimensionless.
Processes 14 02985 g003
Figure 4. Pearson correlations between one-hot-encoded predictors and measured responses.
Processes 14 02985 g004
Figure 5. RF permutation importance for Sa using the 103 observations with retained Sa values and an 80/20 random row split. Bars show the mean decrease in test R2 over 10 permutations of each encoded predictor on 21 test observations. One reference level per factor was omitted. Positive values indicate model reliance; negative values indicate improved predictions after permutation.
Processes 14 02985 g005
Figure 6. RF impurity-based feature importances for Sku.
Processes 14 02985 g006
Figure 7. RF impurity-based feature importances for Ssk and Sa.
Processes 14 02985 g007
Figure 8. Post hoc mean-absolute-gradient sensitivity scores for Sku; these are not intrinsic GPR feature importances.
Processes 14 02985 g008
Table 2. Taguchi L18 experimental factors and coded levels.
ParametersLevel Values
123
Infill PatternSolidHexagonalCross (thick)
Infill DensityMaxMeanMin
Body ThicknessMaxMeanMin
Raster Angle154575
Print OrientationAutoXY−XY
AnnealingYesNo
Table 3. GrabCAD settings corresponding to the L18 factor levels.
Infill PatternInfill DensityBody Thickness
Maximum1Maximum1
Mean2Mean2
Minimum3Minimum3
Solid1 Solid Solid
100%10.181
100%20.102
100%30.023
Hexagonal2HexagonalHexagonal
60%10.181
53%20.122
46%30.063
Cross-thick3CrossCross
80%10.181
54%20.122
28%30.063
Table 4. Exploratory one-way ANOVA associations with nominal p < 0.05. Benjamini–Hochberg correction includes all 35 tests. Sample sizes are 103 for Sa, Sz, Sq, and Ssk, and 102 for Sku; paired specimen dependence is not modeled.
FactorResponseFUnadjusted pAdjusted pn
Infill DensitySz4.13100.01890.1102103
Body ThicknessSsk6.94210.00150.0105103
OrientationSa14.6292<0.0001<0.0001103
OrientationSq9.89030.00010.0011103
OrientationSsk11.4039<0.00010.0004103
OrientationSku20.6377<0.0001<0.0001102
Table 5. Row-level test metrics for the ANN models.
ResponseStandardized MSEStandardized MAER2
Sa 0.41420.49510.4419
Sz0.80290.7511−0.8464
Sq0.32610.44430.4702
Ssk0.78440.63060.2006
Sku0.59880.59430.1111
Table 6. Row-level test metrics for the RF models.
ResponseStandardized MSEStandardized MAER2
Sa0.47980.56170.3535
Sz0.92150.8064−1.1190
Sq0.53530.58030.1302
Ssk0.62840.49460.3596
Sku0.33640.46740.5006
Table 7. Row-level test metrics for the GPR models.
ResponseStandardized MSEStandardized MAER2
Sa0.52540.59180.2922
Sz0.73910.7423−0.6995
Sq0.53250.61250.1348
Ssk0.98400.7043−0.0027
Sku0.39350.53880.4159
Table 8. Condition-grouped test performance on all 108 observations. Values are means ± standard deviations across five outer folds. ANN and GPR use sample standard deviations; RF uses population standard deviations. RMSE and MAE are in µm for Sa, Sz, and Sq, and dimensionless for Ssk and Sku.
ModelResponseTest R2RMSEMAE
ANNSa−0.272 ± 0.64930.080 ± 2.31422.625 ± 1.821
ANNSz−0.572 ± 0.533180.774 ± 28.131139.614 ± 14.428
ANNSq−0.213 ± 0.55136.638 ± 5.83229.708 ± 5.074
ANNSsk−0.278 ± 0.5880.622 ± 0.1850.502 ± 0.136
ANNSku0.069 ± 0.2281.125 ± 0.1750.806 ± 0.058
RFSa−0.136 ± 0.62028.349 ± 3.77021.380 ± 1.273
RFSz−0.288 ± 0.352164.098 ± 23.458126.057 ± 17.145
RFSq−0.100 ± 0.46234.654 ± 2.92027.206 ± 2.979
RFSsk−0.053 ± 0.1550.573 ± 0.0990.465 ± 0.089
RFSku−0.222 ± 0.5521.231 ± 0.1070.914 ± 0.082
GPRSa−0.105 ± 0.16430.402 ± 8.78121.888 ± 3.280
GPRSz−0.119 ± 0.203157.772 ± 40.328118.185 ± 26.422
GPRSq−0.085 ± 0.13036.702 ± 9.36027.091 ± 4.330
GPRSsk−0.023 ± 0.0200.562 ± 0.0770.445 ± 0.079
GPRSku−0.005 ± 0.0681.192 ± 0.2450.875 ± 0.149
Disclaimer/Publisher’s Note: The statements, opinions and data contained in all publications are solely those of the individual author(s) and contributor(s) and not of MDPI and/or the editor(s). MDPI and/or the editor(s) disclaim responsibility for any injury to people or property resulting from any ideas, methods, instructions or products referred to in the content.