Article

Intensified Preparation of Spherical Calcium Carbonate Particles in a CMC-Na-Thickened Precipitation System Using an Annular Swirling Flow Reactor

State Key Laboratory of Chemical Engineering and Low-Carbon Technology, School of Chemical Engineering, East China University of Science and Technology, Shanghai 200237, China
*
Author to whom correspondence should be addressed.
Processes 2026, 14(18), 2946; https://doi.org/10.3390/pr14182946
Submission received: 21 August 2026 / Revised: 11 September 2026 / Accepted: 14 September 2026 / Published: 16 September 2026
(This article belongs to the Section Chemical Processes and Systems)

Abstract

Sodium carboxymethyl cellulose (CMC-Na) can regulate CaCO3 crystal growth and promote the formation of spherical particles. However, the accompanying increase in solution viscosity can impair micromixing and mass transfer during precipitation. To address this limitation, an annular swirling flow reactor was employed to intensify the reactive crystallization of Na2CO3 and CaCl2 in a CMC-Na-thickened system, with conventional stirring serving as a reference. Particle image velocimetry (PIV) and computational fluid dynamics (CFD) simulations were conducted to characterize the reactor hydrodynamics. The results demonstrated that the mean residence times were less than 2.5 s under all investigated conditions, while the residence time distributions exhibited near plug flow characteristics, confirming its suitability for rapid precipitation processes. Increasing solution viscosity had little influence on the overall flow field structure but reduced the local velocity gradient, vorticity, and secondary flow intensity. In contrast, increasing the inlet flow rate enhanced mass transfer and alleviated swirl attenuation caused by viscous dissipation. At a relatively high flow rate (Q = 6 m3·h−1), the reactor maintained stable hydrodynamic performance despite viscosity variations. Compared with conventional stirring, the annular swirling flow reactor produced CaCO3 particles with better roundness, smoother surfaces, and narrower particle size distributions under thickened conditions. Calcite remained the predominant crystalline phase under all investigated conditions. Overall, the intensified swirling motion and secondary flows effectively compensated for viscosity-induced mixing deterioration, providing an efficient strategy for the continuous and controlled synthesis of spherical CaCO3 particles in CMC-Na thickened liquid–liquid precipitation systems.

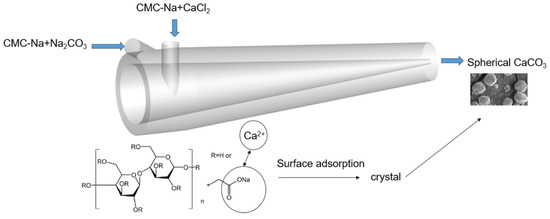
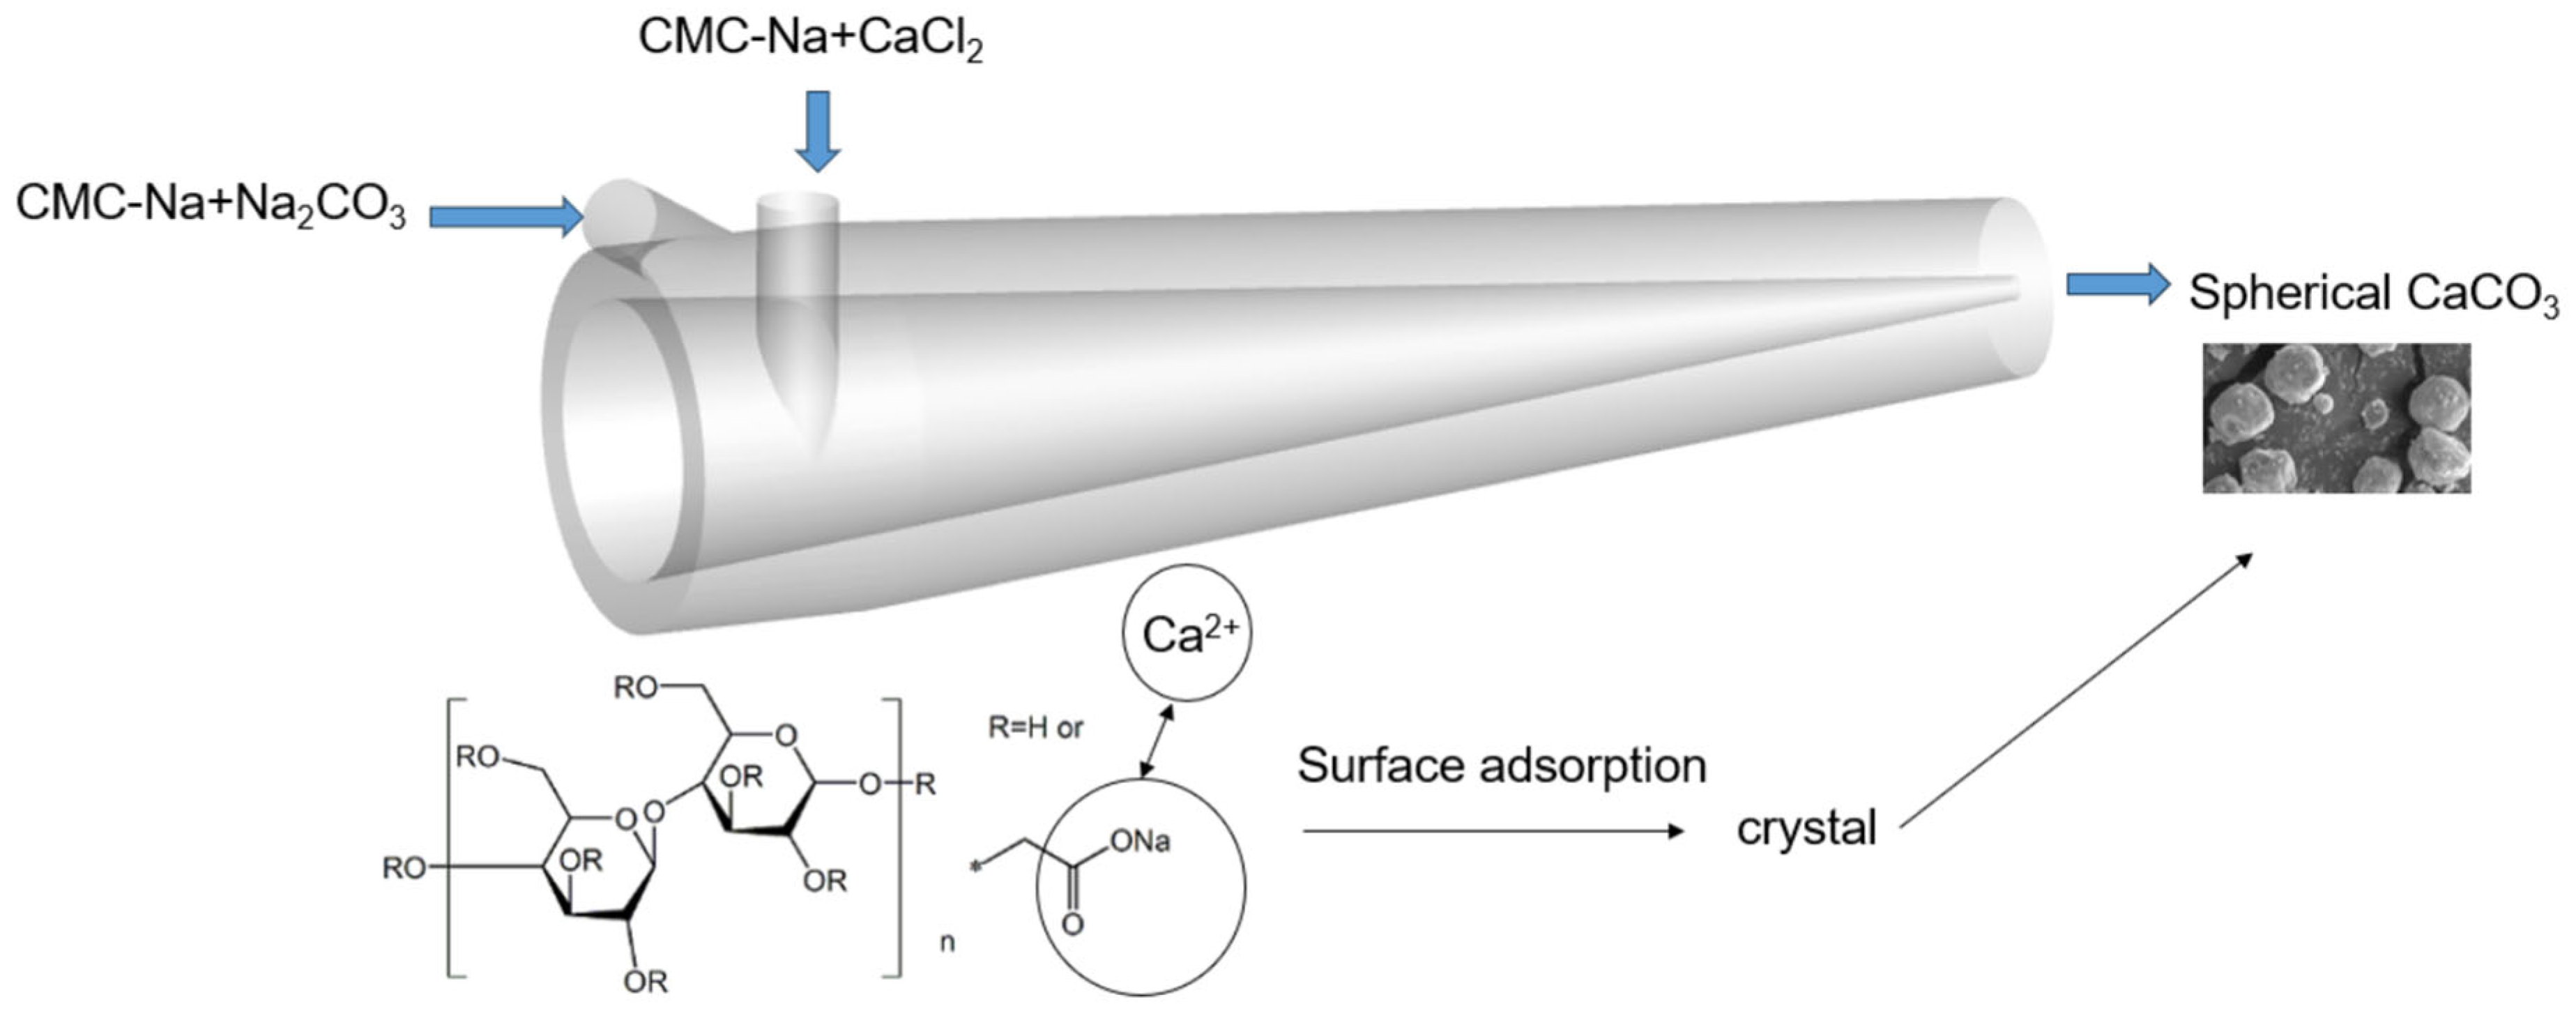
Graphical Abstract

1. Introduction

Calcium carbonate (CaCO3) is one of the most widely used inorganic particulate materials in industries including plastics, rubber, papermaking, and coatings [1,2,3]. In addition to purity and crystalline phase, particle morphology, size, surface characteristics, and size distribution also affect its flowability, dispersibility, filling performance, and interfacial bonding properties [4]. In particular, particle morphology plays a crucial role in determining powder flow behavior, dispersion, and the mechanical performance of polymer composites [5]. Compared with particles exhibiting pronounced edges and directional features, spherical particles have lower geometric anisotropy and show greater processing potential in certain conveying, dispersion, and filling systems [6]. Therefore, developing CaCO3 particles with smooth surfaces and narrow particle size distributions is of considerable importance for improving material performance and expanding high-value industrial applications.
Liquid-phase precipitation is commonly used for calcium carbonate preparation because it involves mild operating conditions, a relatively simple process, and flexible control of particle properties through changes in reaction conditions [7,8]. In the Na2CO3–CaCl2 reaction system, rapid mixing of the two reactants produces a supersaturated environment, followed by nucleation, crystal growth, and particle aggregation. In rapid precipitation systems, the local mixing state of the reactants directly affects the development of supersaturation and is ultimately reflected in particle morphology and size distribution [9,10]. Previous studies have mainly tailored CaCO3 morphology by adjusting reactant concentration, temperature, pH, feeding mode, and organic additives [11,12]. Water-soluble polymers interact with Ca2+ ions and adsorb onto crystal surfaces, thereby modifying crystal face growth rates and particle aggregation behavior [7]. Sodium carboxymethyl cellulose (CMC-Na) is an anionic polymer. In precipitation systems, CMC-Na may interact with Ca2+ through its carboxylate groups and associate with the CaCO3 crystal surface, thereby regulating crystal growth and particle aggregation and favoring the formation of spherical particles [13]. However, besides regulating crystallization, CMC-Na also increases solution viscosity and consequently alters the hydrodynamic conditions during precipitation. As the CMC-Na concentration increases, the solution viscosity rises, suppressing momentum transfer and turbulent fluctuations within the fluid and potentially reducing the dispersion rate and mixing efficiency of the two reactant streams [14]. This effect is more pronounced in conventional stirred equipment. Because energy is inherently distributed nonuniformly in stirred vessels, low-velocity regions and local concentration differences can readily develop. Although increasing the stirring speed improves bulk circulation, it cannot completely eliminate local micromixing heterogeneity [15]. Consequently, devices such as microchannels, impinging flow reactors, rotating packed beds, and vortex flow reactors are frequently used in inorganic particle precipitation processes to improve mixing under rapid reaction conditions [16,17,18].
A swirling flow reactor imparts substantial tangential momentum to the fluid through tangential feeding, thereby generating a rotating primary flow within a confined channel. During axial transport, radial motion, secondary flows, and local vortices may also develop, continuously stretching, entraining, and renewing the contact interface between the two reactant streams and thereby enhancing cross-sectional momentum transfer and mass exchange [10,19,20]. Compared with stirred equipment, a swirling flow reactor achieves continuous mixing mainly through the momentum of the inlet streams and a fixed flow channel configuration, without requiring mechanically moving components in the reaction zone. It therefore features a relatively simple structure and is suitable for continuous operation [21,22]. In previous work, our group employed an annular swirling flow reactor to prepare cubic CaCO3 particles with favorable surface morphology and a relatively narrow particle size distribution [23]. The annular swirling flow reactor consisted of a cylindrical section followed by a conical section, with two tangential inlets symmetrically arranged on the cylindrical section. The two reactant streams entered the reactor tangentially through the two inlets, generating a swirling flow in the cylindrical section before flowing downstream into the conical section. On this basis, the swirling flow reactor was applied to the preparation of spherical CaCO3 in the presence of CMC-Na, combining the morphology-regulating effect of the additive with the mixing-intensification effect of swirling flow.
Based on the hydrodynamic advantages of the annular swirling flow reactor for rapid liquid–liquid mixing and its potential application in inorganic salt particle preparation, this study investigated the liquid-phase precipitation of Na2CO3 and CaCl2. CMC-Na was used to adjust the viscosity of either one or both reactant streams, and the formation of CaCO3 particles under different flow conditions was examined by varying the inlet flow rate. Conventional stirring was used as a reference, and the morphology, particle size distribution, and crystal structure of the products obtained using the two mixing methods were compared to evaluate the applicability of the swirling flow reactor to thickened precipitation systems. Furthermore, particle image velocimetry and computational fluid dynamics simulations were employed to analyze the velocity distribution, vortex structures, secondary flows, and residence time distribution within the reactor and to establish the relationship between hydrodynamic behavior and particle properties. The objective of this study was to elucidate the coupled effects of viscosity and flow rate on reactor hydrodynamics, mixing behavior, and CaCO3 particle formation, thereby providing guidance for the design and operation of continuous reactive crystallization processes in thickened liquid–liquid systems.

2. Materials and Methods

2.1. PIV Measurement of the Flow Field

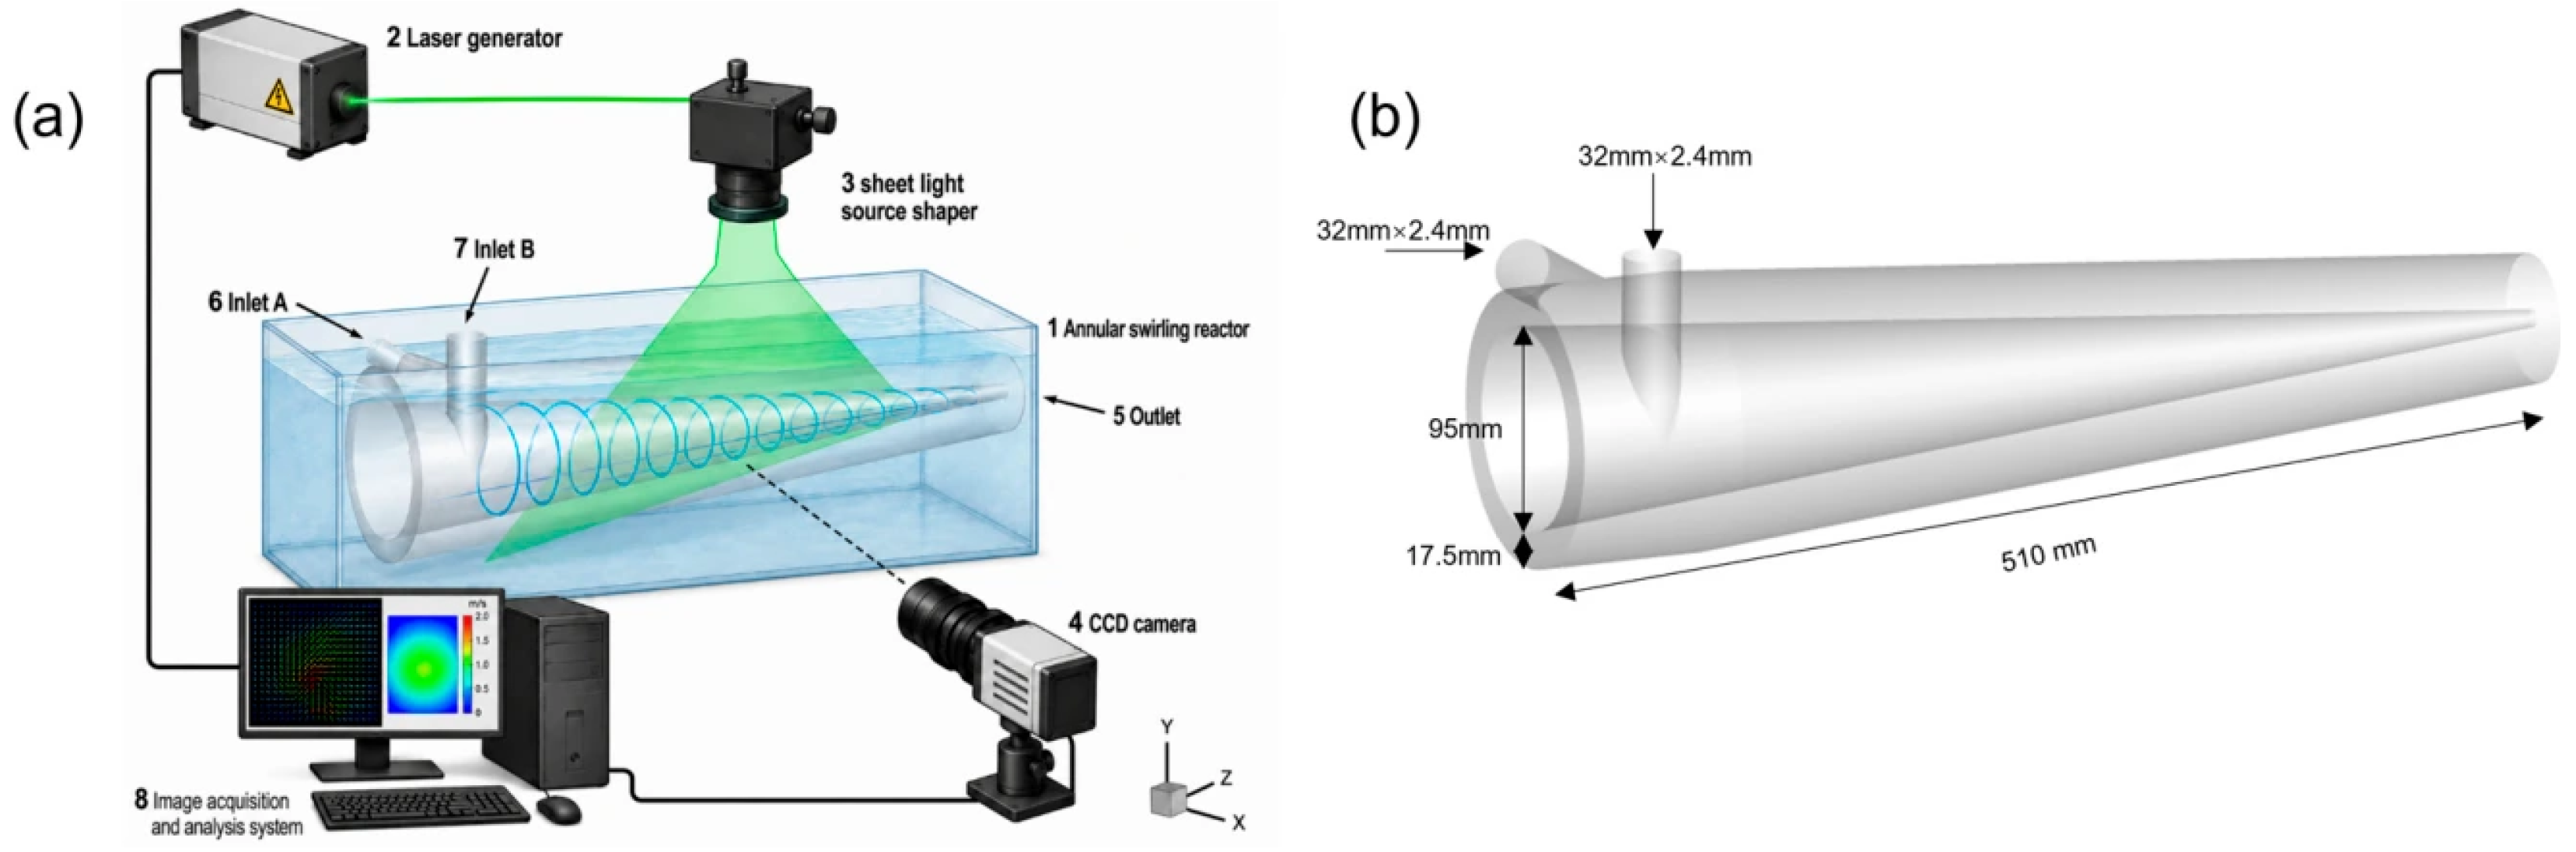
Particle image velocimetry (PIV) was used to measure the flow field within the annular swirling flow reactor. The PIV system consisted of a dual pulse Nd:YAG laser (B-145-15, Litron, Rugby, UK), a CCD camera (Imager SX 6M, LaVision, Göttingen, Germany), a synchronization controller, and DaVis software (10.1) for image acquisition and processing. The laser generated pulsed light at a wavelength of 532 nm, which was expanded into a laser sheet using light sheet optics and introduced through the axial central plane of the reactor. The CCD camera was positioned perpendicular to the light sheet plane to record the displacement of tracer particles between two consecutive laser pulses. The swirling flow reactor consisted of two inlets and two sections: a cylindrical section and a conical section. Each inlet tube had an inner diameter of 27.2 mm, and the axial length of the reactor (z) was 510 mm. The fluid flowed through the annular gap in the conical section, and the reactor was fabricated from a transparent material. To minimize refraction and image distortion caused by the curved wall, the reactor was placed in a water-filled rectangular calibration tank. The experimental setup is shown in Figure 1.
Hollow glass microspheres with particle sizes of 9–13 μm were used as tracer particles in the PIV experiments at a seeding concentration of 12 mg·L−1. Before each experiment, the tracer particles were uniformly dispersed in the working fluid, which was then circulated through the apparatus. Non-reactive fluids with viscosities matched to those of the reaction systems were used for the flow-field measurements, and the fluid viscosity was adjusted by adding CMC-Na. Taking the viscosity of water at room temperature (μ0) as the reference viscosity, the relative viscosity, μ/μ0, was set to 1, 3, and 6, while the inlet volumetric flow rate was set to 3 and 6 m3·h−1. These conditions were used to investigate the effects of flow rate and viscosity on the internal flow structure of the reactor. Image acquisition was initiated after the flow reached a steady state. The camera and laser were triggered using a synchronization control system. The time interval between two consecutive frames was adjusted according to the flow rate to maintain an average tracer particle displacement of approximately 5–10 pixels. For each operating condition, 60 double-frame image pairs were acquired consecutively. The images were processed in DaVis using a cross-correlation algorithm, and the instantaneous velocity fields were statistically averaged to obtain the time-averaged velocity fields and streamline distributions under different flow rate and viscosity conditions.

2.2. CFD Simulation

To investigate the effects of flow rate and fluid viscosity on the flow characteristics within the swirling flow reactor, computational fluid dynamics (CFD) was employed to simulate the three-dimensional flow field inside the reactor. The geometric model of the reactor was constructed in SolidWorks (2022) according to the actual dimensions of the experimental apparatus, and a structured mesh was generated using ICEM CFD (2022 R1). The geometric model, mesh generation strategy, and basic numerical methods were consistent with those used in our previous study [23]. Mesh independence analysis had been performed in the previous work, and the results indicated that further mesh refinement had a negligible effect on the main flow parameters when the mesh number reached approximately 1.6 million. Therefore, the same mesh scheme was adopted in the present study. The reactor geometry and numerical settings were kept unchanged, while the inlet flow rate and fluid viscosity were varied to analyze the flow characteristics under different operating conditions.
The numerical simulations were performed using ANSYS Fluent (2022 R1). A pressure-based solver was employed, and the governing equations were discretized using the finite volume method. The working fluid was assumed to be an incompressible, isothermal, single-phase fluid. Only the fluid flow was considered in the simulations, while the calcium carbonate precipitation reaction and particle motion were not included. The reactor exhibited pronounced swirling motion, streamline curvature, strong shear, and secondary flow structures, resulting in highly anisotropic turbulent fluctuations. Therefore, the Reynolds stress model (RSM) was adopted in this study. Unlike conventional two-equation turbulence models, the RSM directly solves the transport equations of Reynolds stresses and can better predict complex flow features associated with strong swirling motion and secondary flows [24,25,26].
The same flow boundary condition was applied to both inlets, and the inlet flow rates of the two streams were maintained at identical values. The flow rate at each inlet was set to 3 or 6 m3·h−1. The outlet was specified as a pressure outlet at atmospheric pressure, and a no-slip boundary condition was applied to the reactor walls. Using the viscosity of water at room temperature, μ0, as the reference, the relative viscosity of the working fluid, μ/μ0, was set to 1, 3, and 6 to simulate the change in fluid viscosity resulting from the addition of CMC-Na.

2.3. Preparation of Calcium Carbonate Particles

Calcium carbonate particles were prepared through liquid–liquid precipitation between Na2CO3 and CaCl2. Na2CO3 and CaCl2 solutions were separately prepared at a concentration of 0.1 mol·L−1, and their viscosities were adjusted using CMC-Na. Taking the viscosity of water at room temperature, μ0, as the reference, the relative viscosity of the solutions, μ/μ0, was set to 1, 3, and 6, where μ/μ0 = 1 represented the absence of sodium carboxymethyl cellulose. The viscosities of the prepared solutions were measured using an Ubbelohde viscometer at room temperature. In the single-component thickening experiments, only the viscosity of the Na2CO3 solution was adjusted, while the CaCl2 solution was maintained at its original viscosity. In the two-component thickening experiments, the relative viscosities of both reactant solutions were simultaneously adjusted to 3 or 6. The Na2CO3 and CaCl2 solutions were continuously introduced into the annular swirling flow reactor through two separate inlets. The two streams had identical volumetric flow rates, which were set to 3 or 6 m3·h−1. After the flow reached a steady state, the resulting CaCO3 suspension was collected at the reactor outlet. For comparison, calcium carbonate particles were prepared at room temperature using a magnetic stirrer. The two reactant solutions were also mixed at a volume ratio of 1:1, and the stirring speeds were set to 400 and 1800 rpm, while all other conditions were identical to those used in the swirling flow experiments. After separation, the resulting solids were washed twice with deionized water and once with absolute ethanol, followed by drying at 100 °C for 30 min. The dried samples were used for characterization of morphology, particle size distribution, and crystal structure. The particle morphology was examined using scanning electron microscopy (SEM), the particle size distribution was measured using a laser particle size analyzer, and the crystal structure and phase composition were identified by X-ray diffraction (XRD). The particle size distribution was characterized using D10, D50,and D90, which correspond to the particle sizes below which 10%, 50%, and 90% of the particles are distributed. The width of the particle size distribution was further quantified by the “Span”, defined as (D90 − D10)/D50.

3. Results

3.1. Flow Characteristics of a Swirl Reactor

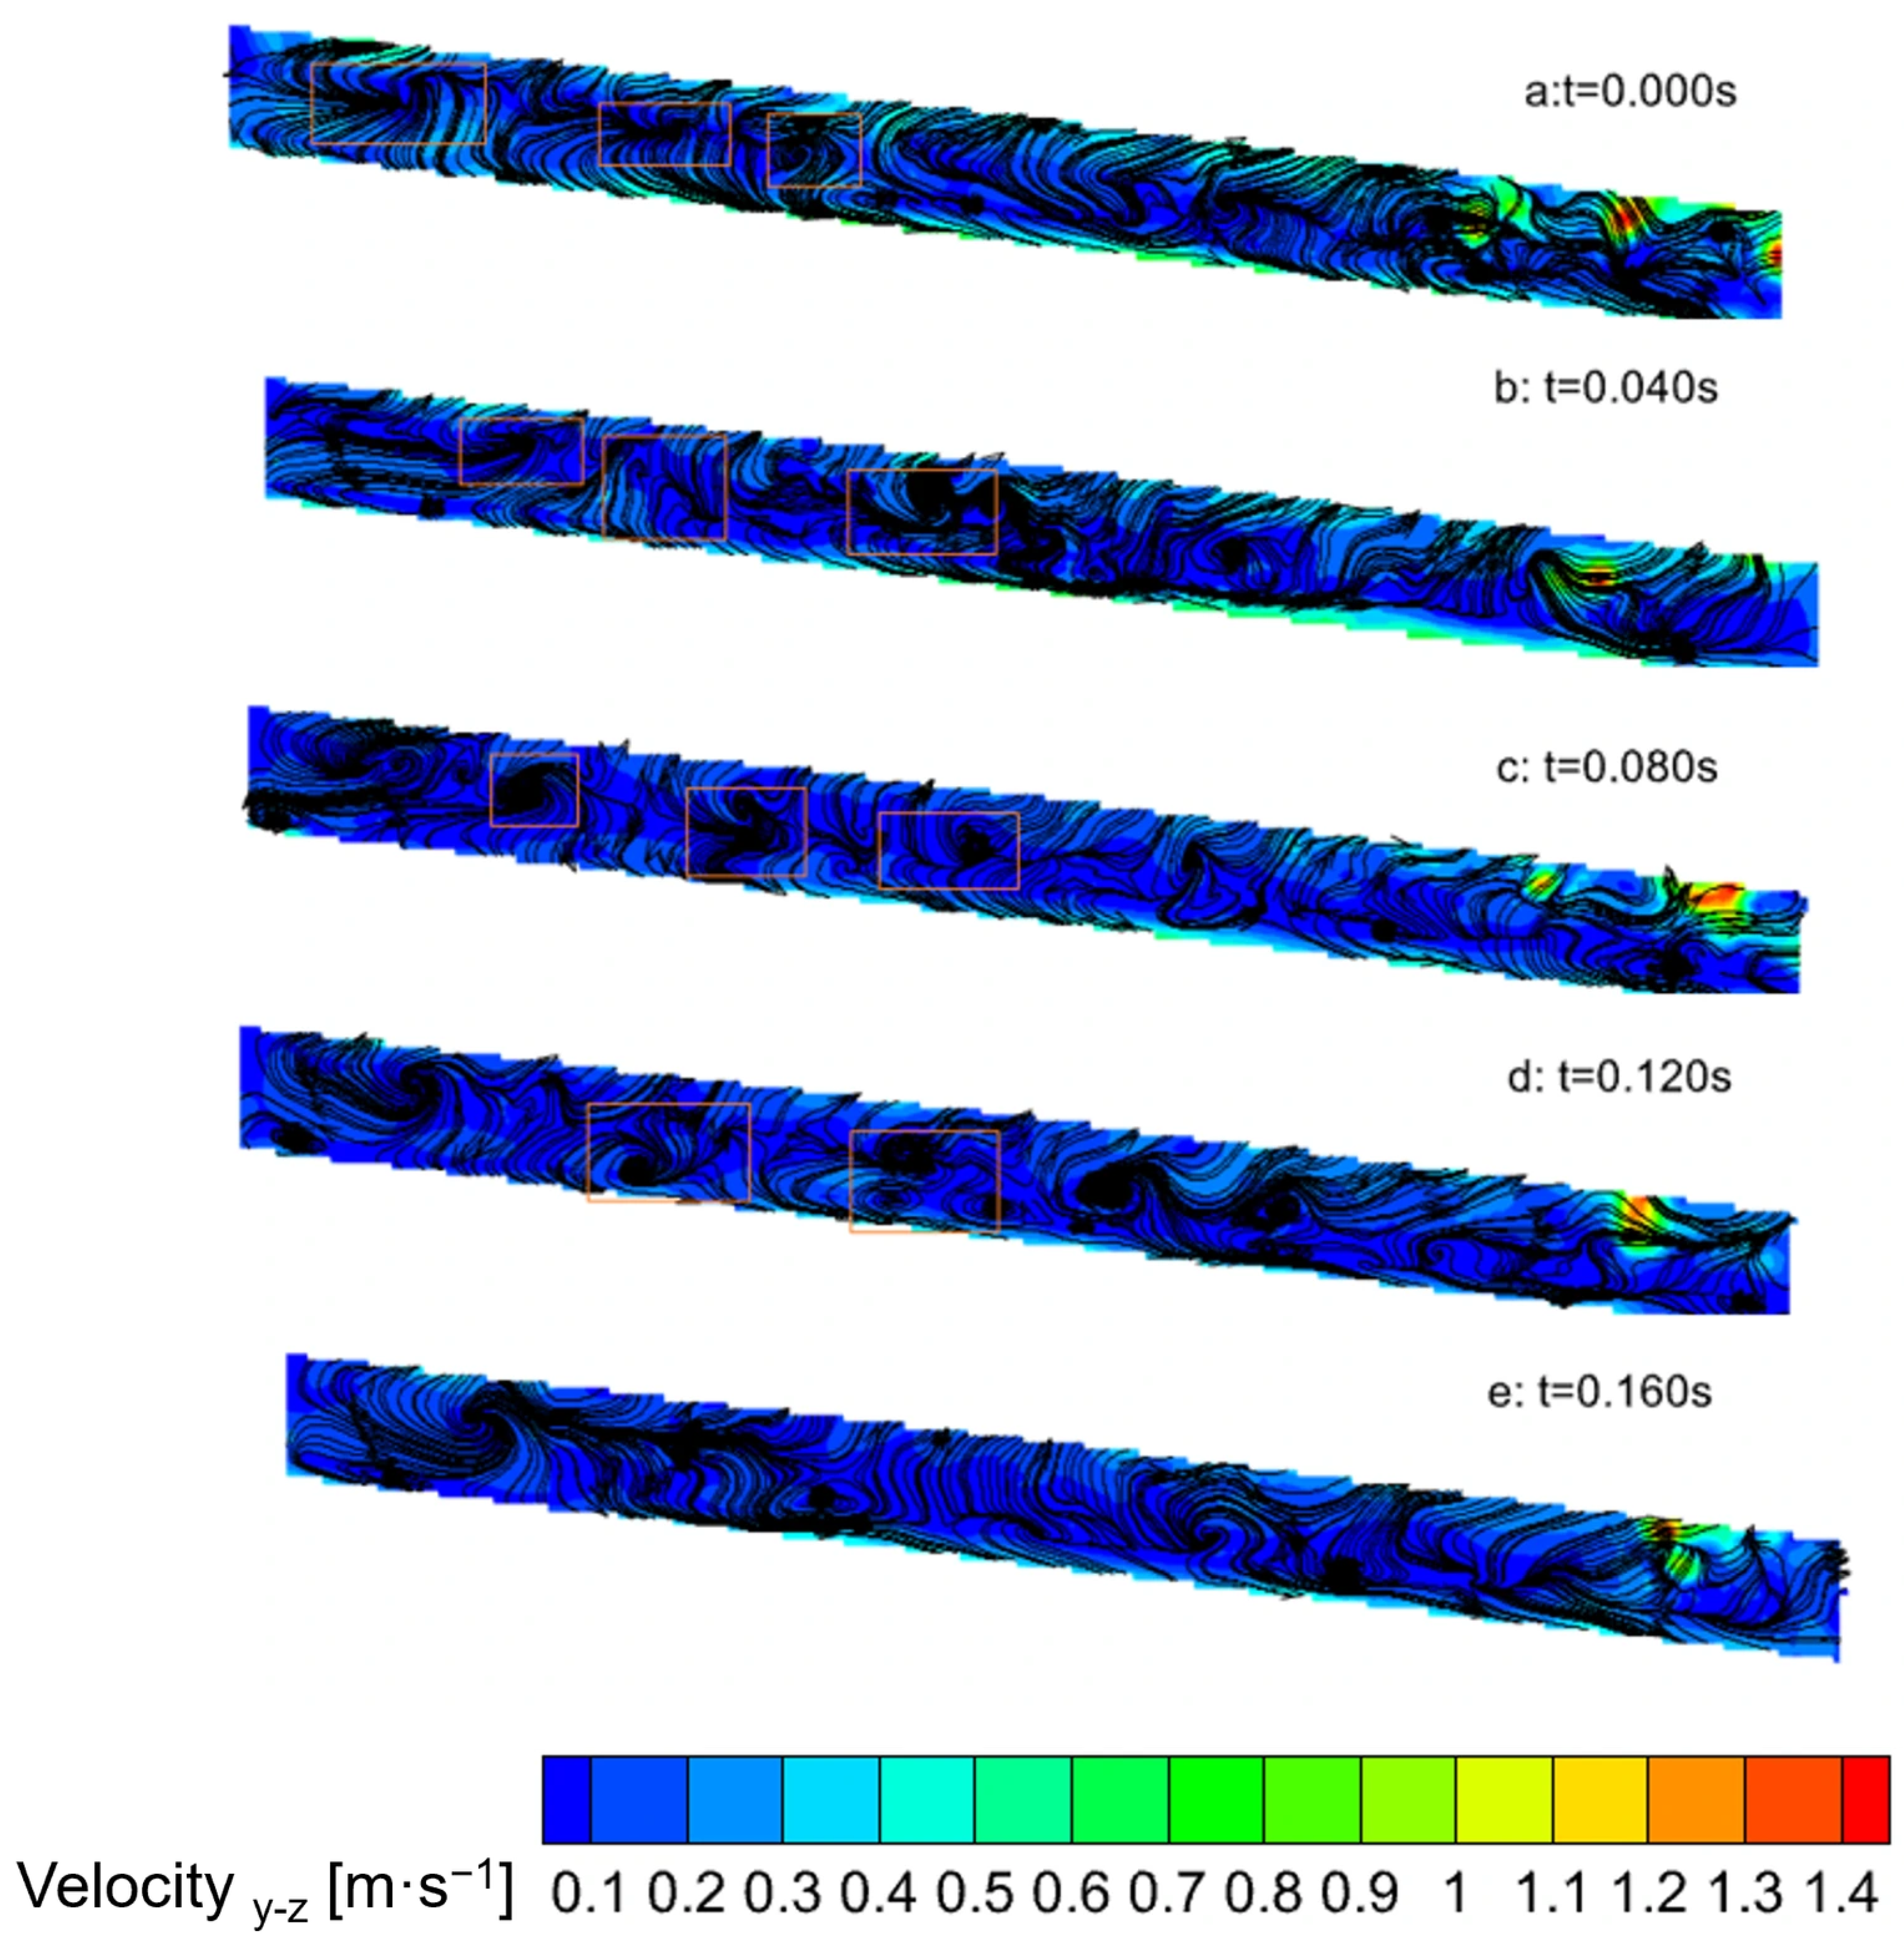
Particle image velocimetry (PIV) was used to record the streamline distributions of the instantaneous velocity field in the upper half of the measurement region over a continuous period of 0.160 s at a flow rate of 6 m3·h−1, as shown in Figure 2.
The boxed regions highlight representative vortical structures and their temporal evolution. Vortices with different characteristic scales were observed throughout the measurement period, while their positions, shapes, and spatial extents continuously changed with time. The flow field therefore exhibited a highly dynamic process involving vortex generation, migration, stretching, merging, and dissipation. At the initial time, several adjacent vortical structures had already developed within the reactor, accompanied by strongly curved streamlines and pronounced entrainment. This behavior indicates strong coupling between the primary swirling motion and axial transport. As the flow evolved, individual vortices migrated downstream and underwent continuous stretching and deformation under the combined effects of local velocity gradients and contraction of the flow passage. Strong interactions between neighboring vortices were also observed. Some small-scale vortices merged into larger structures, whereas larger vortices subsequently fragmented under the influence of shear. Such continuous restructuring demonstrates that the swirling flow was not characterized by a stationary vortex pattern but by a dynamically evolving multiscale flow field. The repeated generation, deformation, and breakdown of vortices are particularly relevant to rapid liquid–liquid precipitation. These processes continuously renew the interfaces between the two reactant streams and promote transverse fluid exchange, thereby reducing local concentration gradients and facilitating a more homogeneous supersaturation field. Meanwhile, the shear and entrainment effects within the flow field may also reduce the prolonged residence of particles in localized high-concentration regions, which may suppress excessive particle growth and agglomeration. Thus, the instantaneous PIV results demonstrate that the annular swirling flow configuration generates a dynamically renewing flow environment favorable for rapid reactive precipitation.
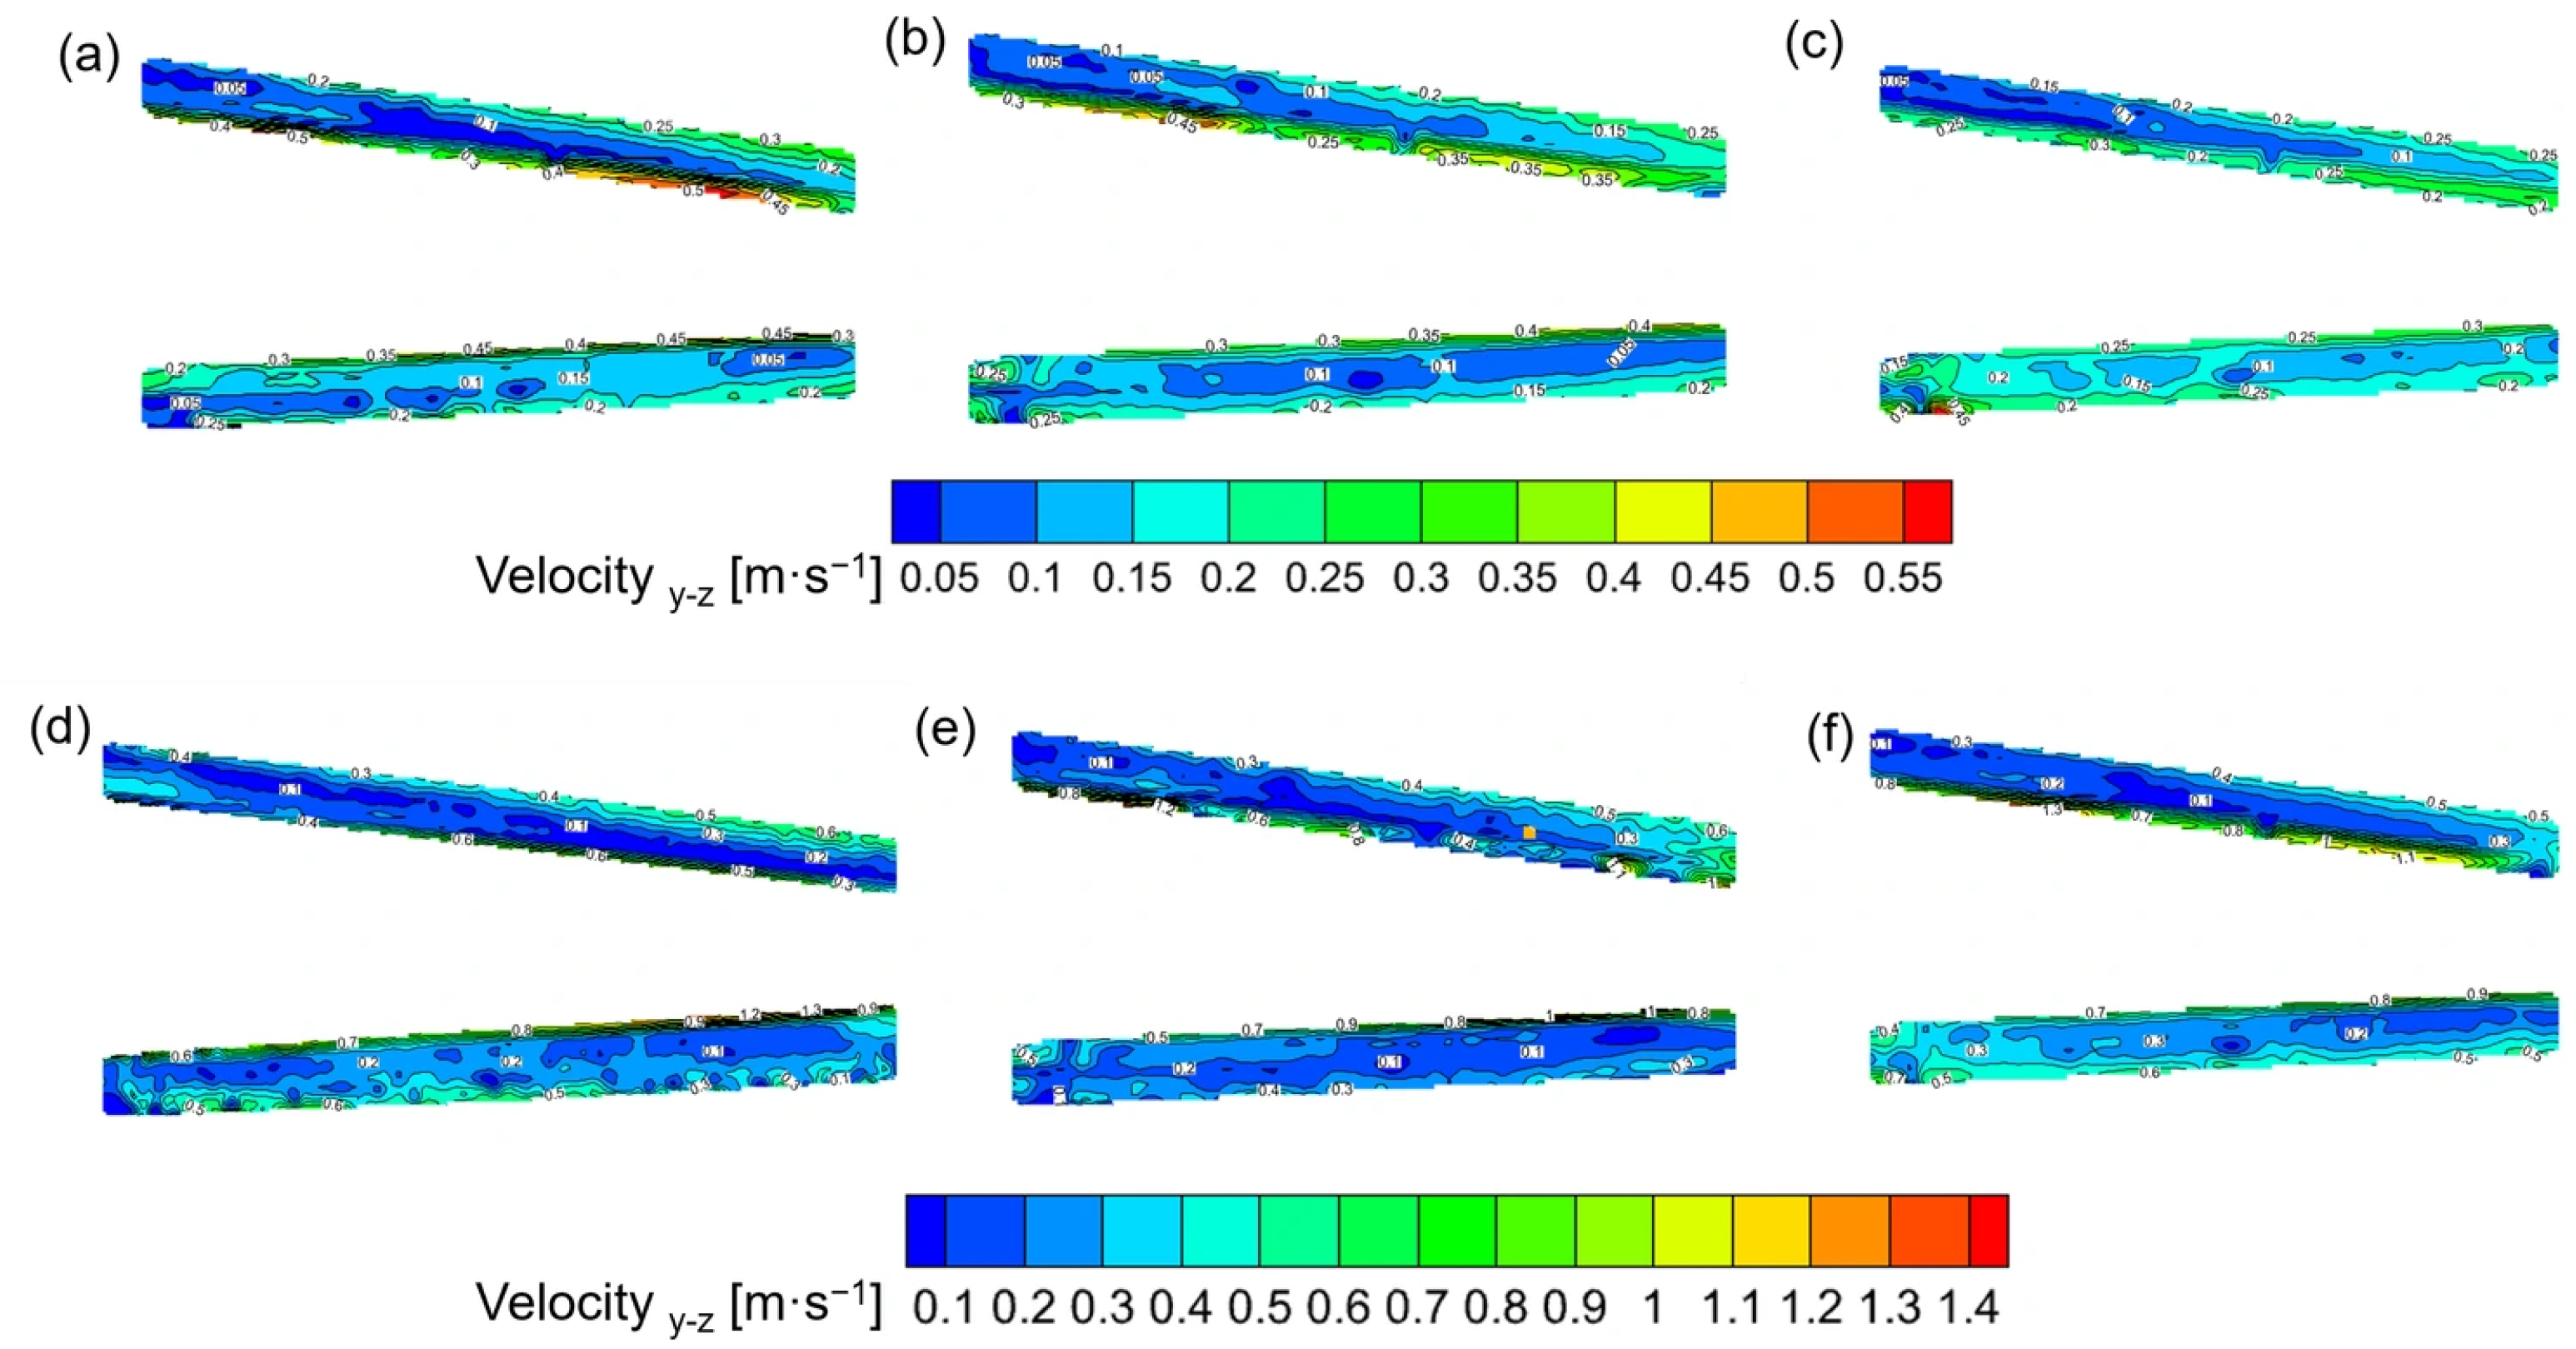
Figure 3 presents the velocity distributions in the axial section (y-z plane) of the swirling flow reactor at different flow rates and relative viscosities.
Because the PIV measurements were performed on the y-z plane, the measured velocity represents the two-dimensional velocity vector within this plane, which is composed of the yand z-direction velocity components. Despite substantial changes in fluid viscosity and flow rate, the overall spatial structure of the velocity field remained similar, and the velocity near the central conical wall was markedly higher than that in the middle of the annular gap. As the viscosity increased, the velocity near the central wall decreased slightly, while the overall distribution pattern remained stable. The effect of flow rate became particularly evident at Q = 6 m3 h−1, where the velocity distributions obtained at different viscosities were similar. This observation indicates that increasing the flow rate increased the inertial contribution sufficiently to compensate, at least partially, for the momentum attenuation associated with viscous dissipation. The velocity was relatively low in the middle of the annular gap between the central conical wall and the outer wall, and regions with velocities approaching zero were even observed. This indicates that the fluid velocity in these regions was directed perpendicular to the y-z plane, corresponding to the circumferential flow around the cone. Consequently, the axially flowing fluid near the central conical wall intersected with the fluid in the middle of the annular gap in a cross flow manner, generating numerous vortices and substantially enhancing the mass transfer process near the conical wall.
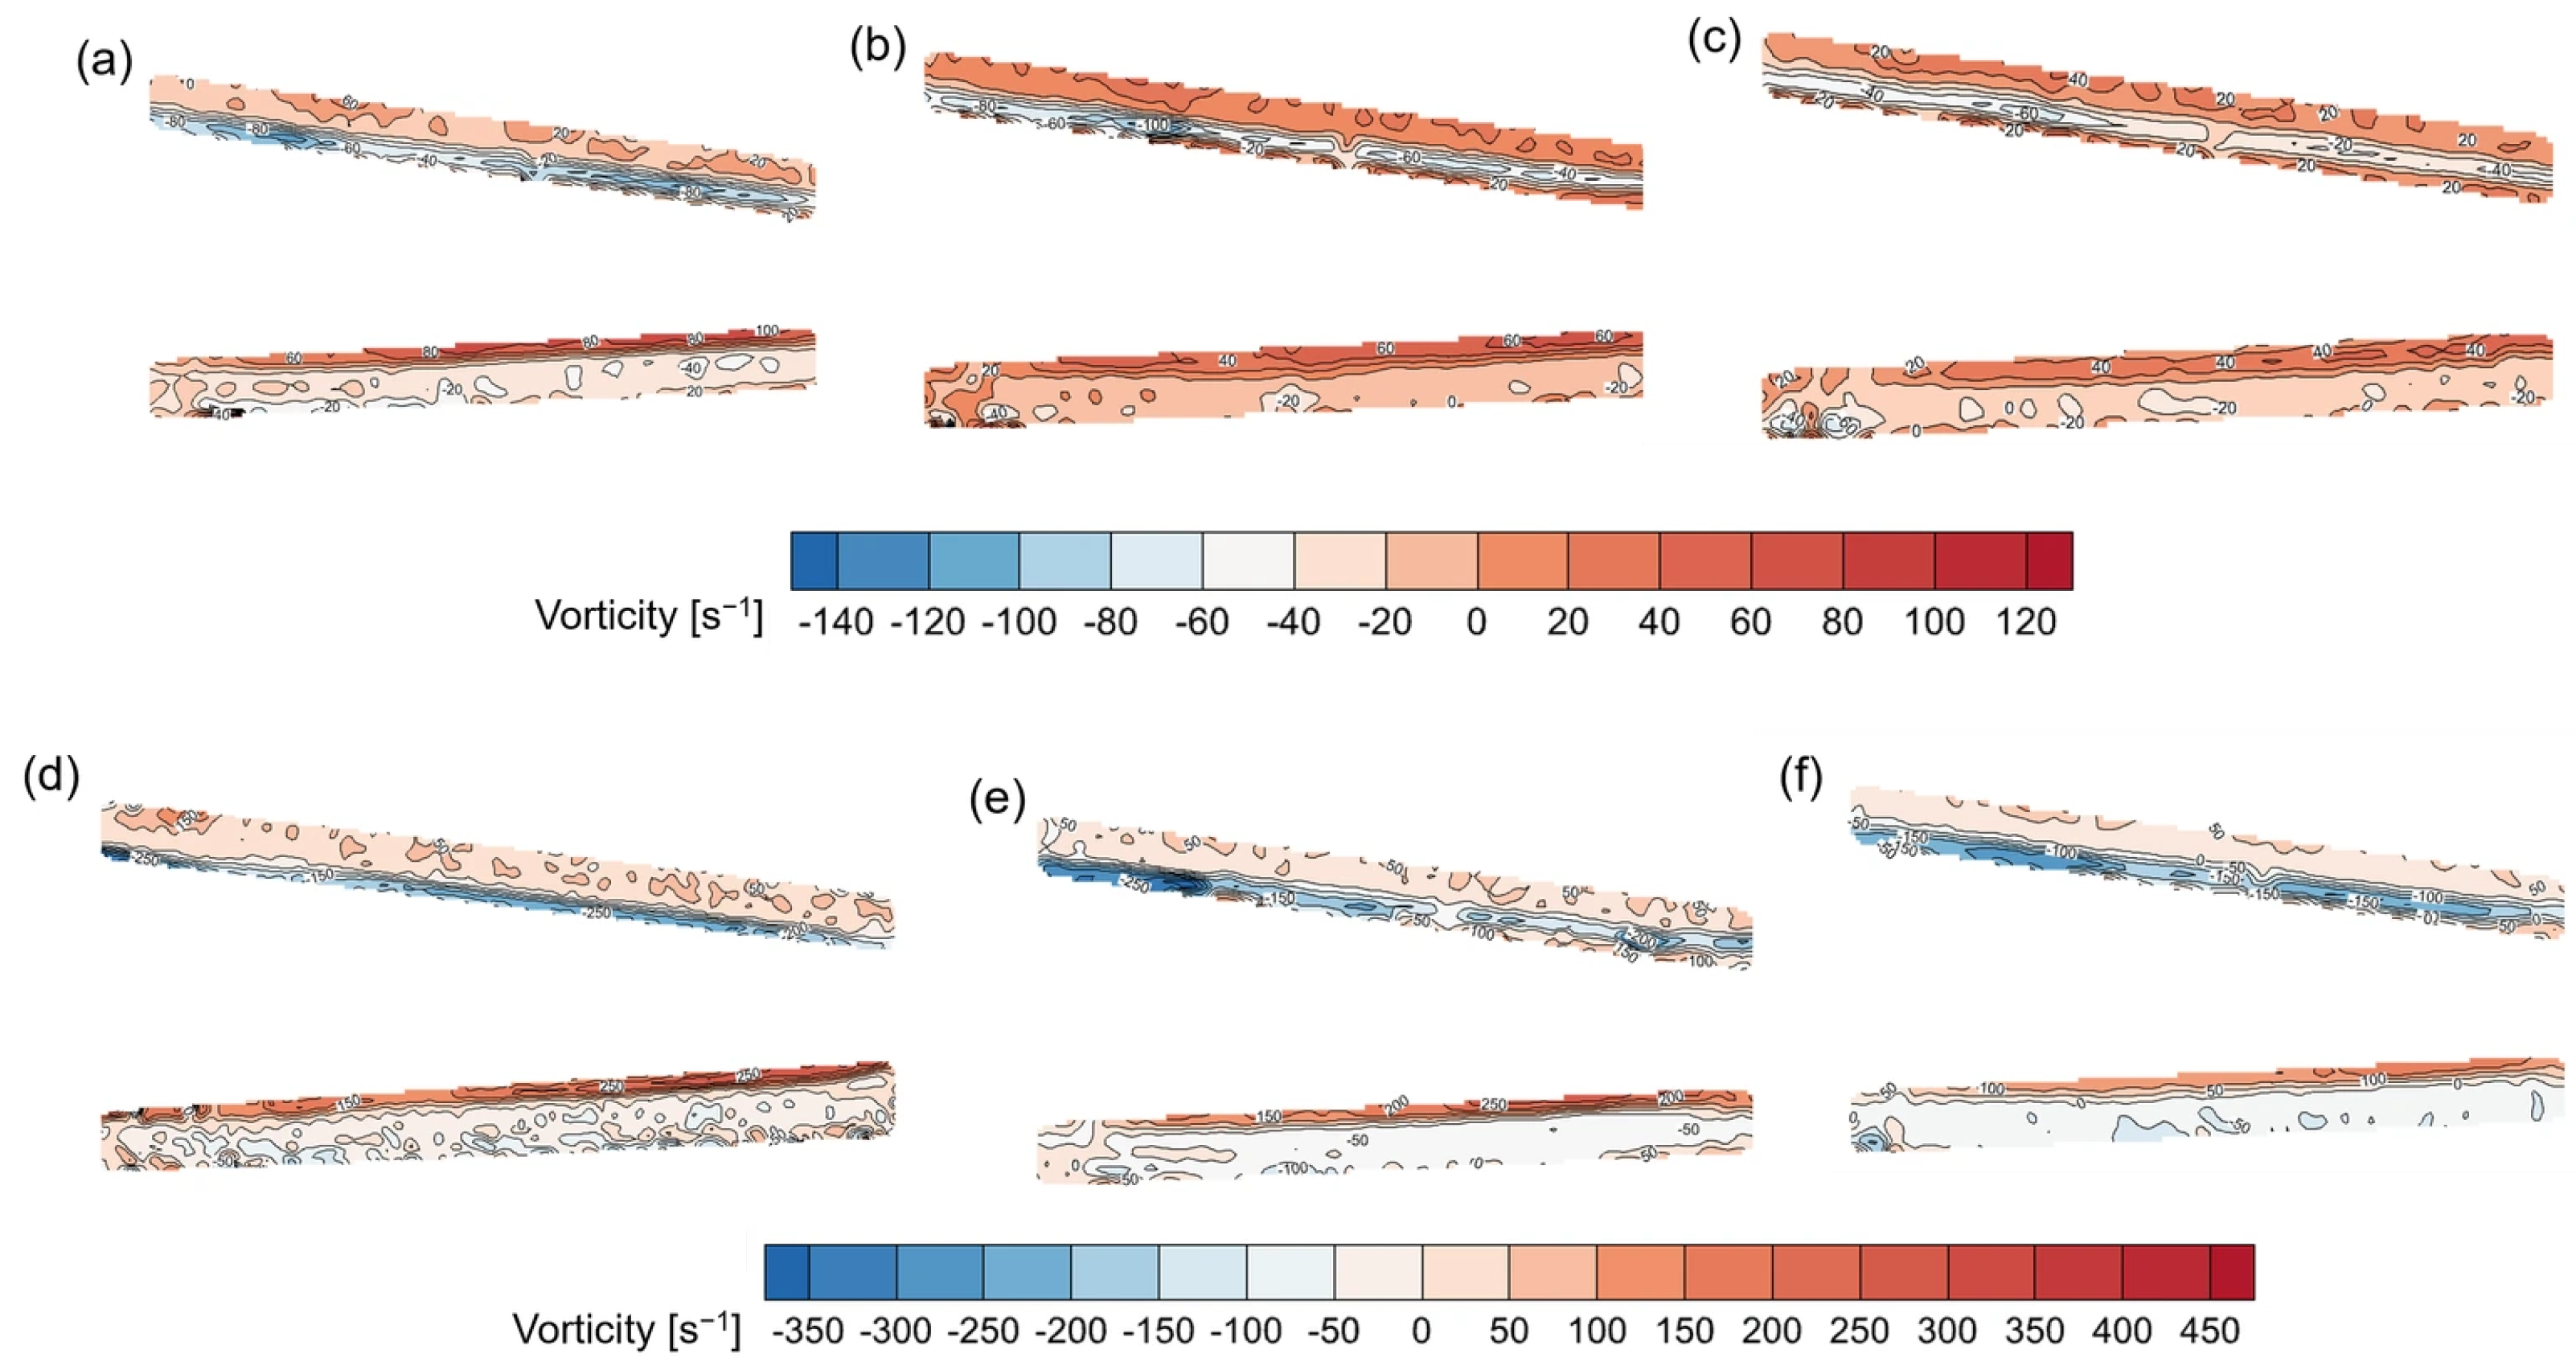
Figure 4 presents the vorticity distributions in the axial section of the swirling flow reactor at different relative viscosities and inlet flow rates.
The high-vorticity regions were concentrated near the central axis, indicating strong velocity shear and momentum exchange in this region, which is important for maintaining the swirling structure and promoting mass transfer. An overall comparison shows that the flow rate was the primary operating parameter governing the vorticity magnitude, whereas the viscosity mainly controlled the degree of decay of the swirling structure. Increasing the inlet flow rate enhanced the velocity gradient near the central axis, thereby increasing the vorticity near the central axis, whereas increasing the viscosity intensified viscous dissipation, causing the high-vorticity regions to gradually weaken and contract. Although viscous suppression became pronounced as the viscosity increased, increasing the flow rate could still effectively mitigate vorticity decay. Therefore, a high flow rate improved the ability of the swirling flow reactor to accommodate thickened systems and provided more favorable flow conditions for interfacial stretching, transverse momentum exchange, and local mixing between the two reactant streams.
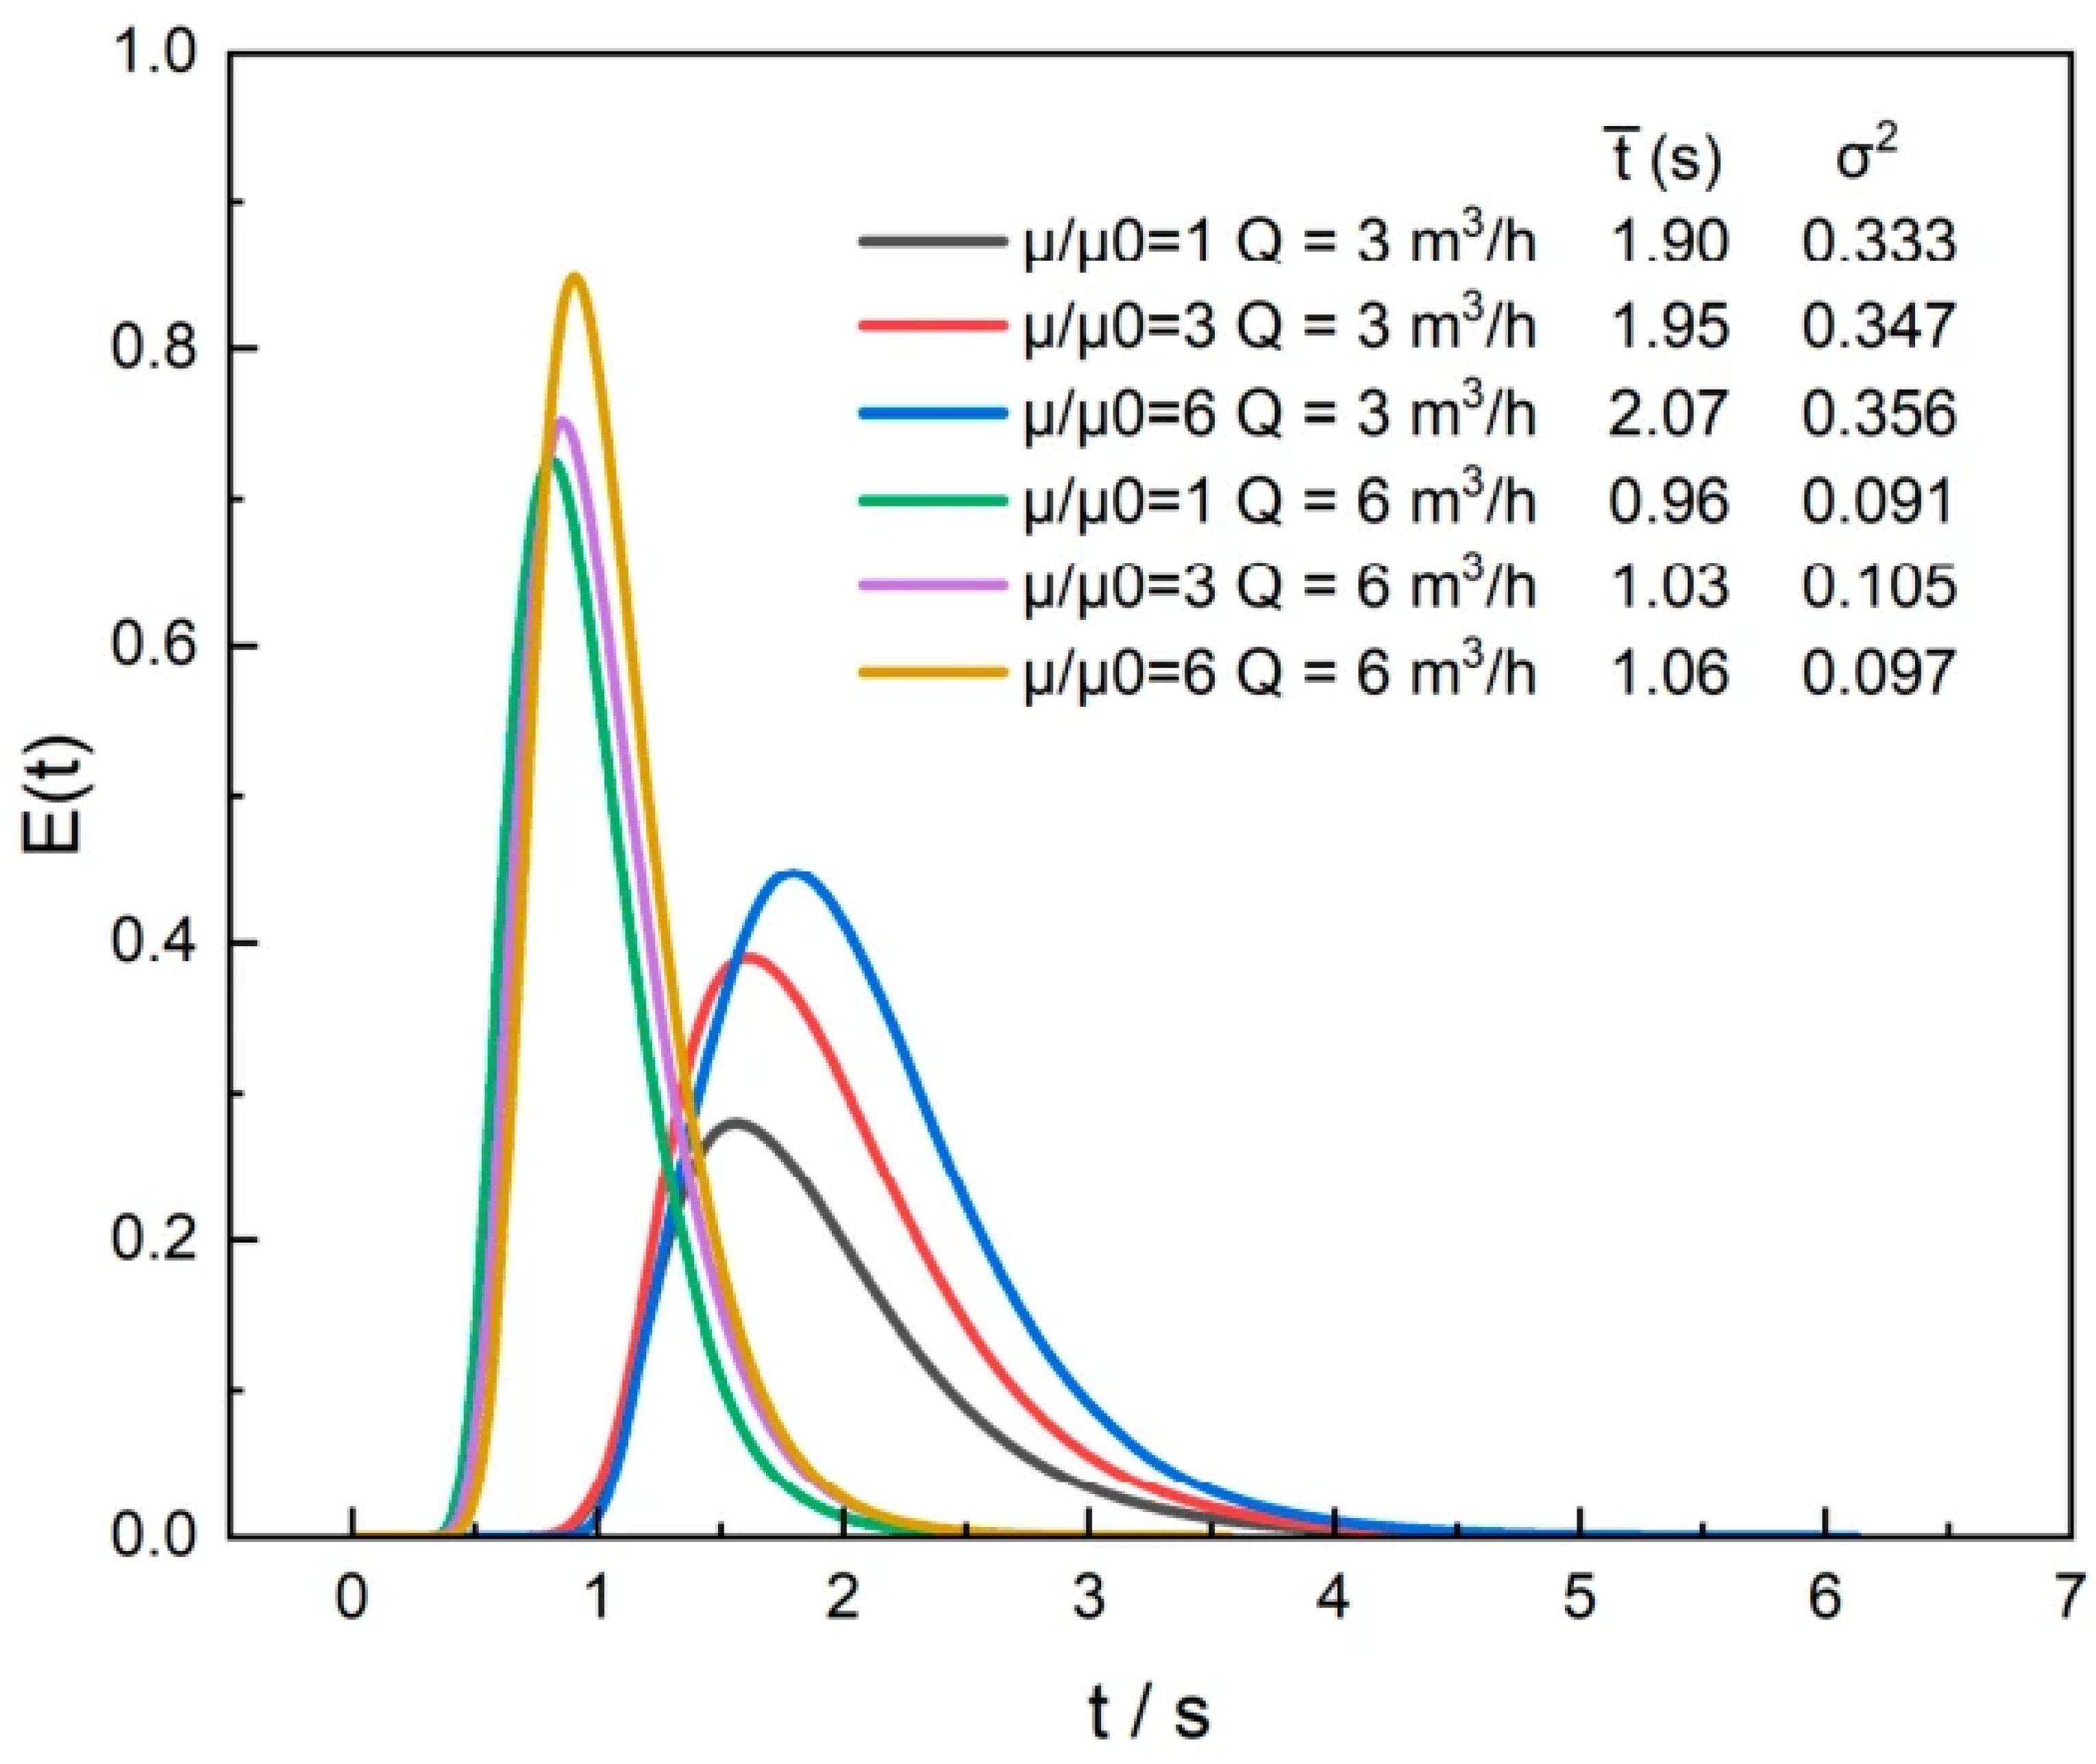
The effects of viscosity and flow rate on the residence time characteristics were further evaluated using CFD-derived residence time distributions (RTDs), as shown in Figure 5.
The RTD curves under all operating conditions exhibited a single-peak distribution with relatively concentrated peak profiles. No pronounced multiple peaks, premature breakthrough, or prolonged retention were observed, indicating the absence of significant short-circuiting and dead zones within the reactor. Although some curves exhibited a certain degree of tailing, the overall extent of back mixing was low, and the flow behavior was close to plug flow. As the flow rate increased from 3 to 6 m3·h−1, the RTD curves shifted toward shorter residence times, accompanied by a marked reduction in peak width and a shorter tail. These changes indicate that the high flow rate enhanced axial fluid transport and reduced the differences in residence time among individual fluid elements. At Q = 3 m3·h−1, increasing the relative viscosity gradually shifted the curve peak toward longer residence times and broadened the distribution, indicating that the increase in viscosity increased the dispersion of residence times. This may be associated with enhanced viscous dissipation and weakened axial transport. In contrast, at Q = 6 m3·h−1, the RTD curves obtained at different viscosities were relatively similar, with only minor variations in the mean residence time and curve shape. This indicates that a high flow rate reduced the influence of increasing viscosity on the flow distribution, allowing the reactor to maintain relatively stable residence time characteristics in the thickened system.
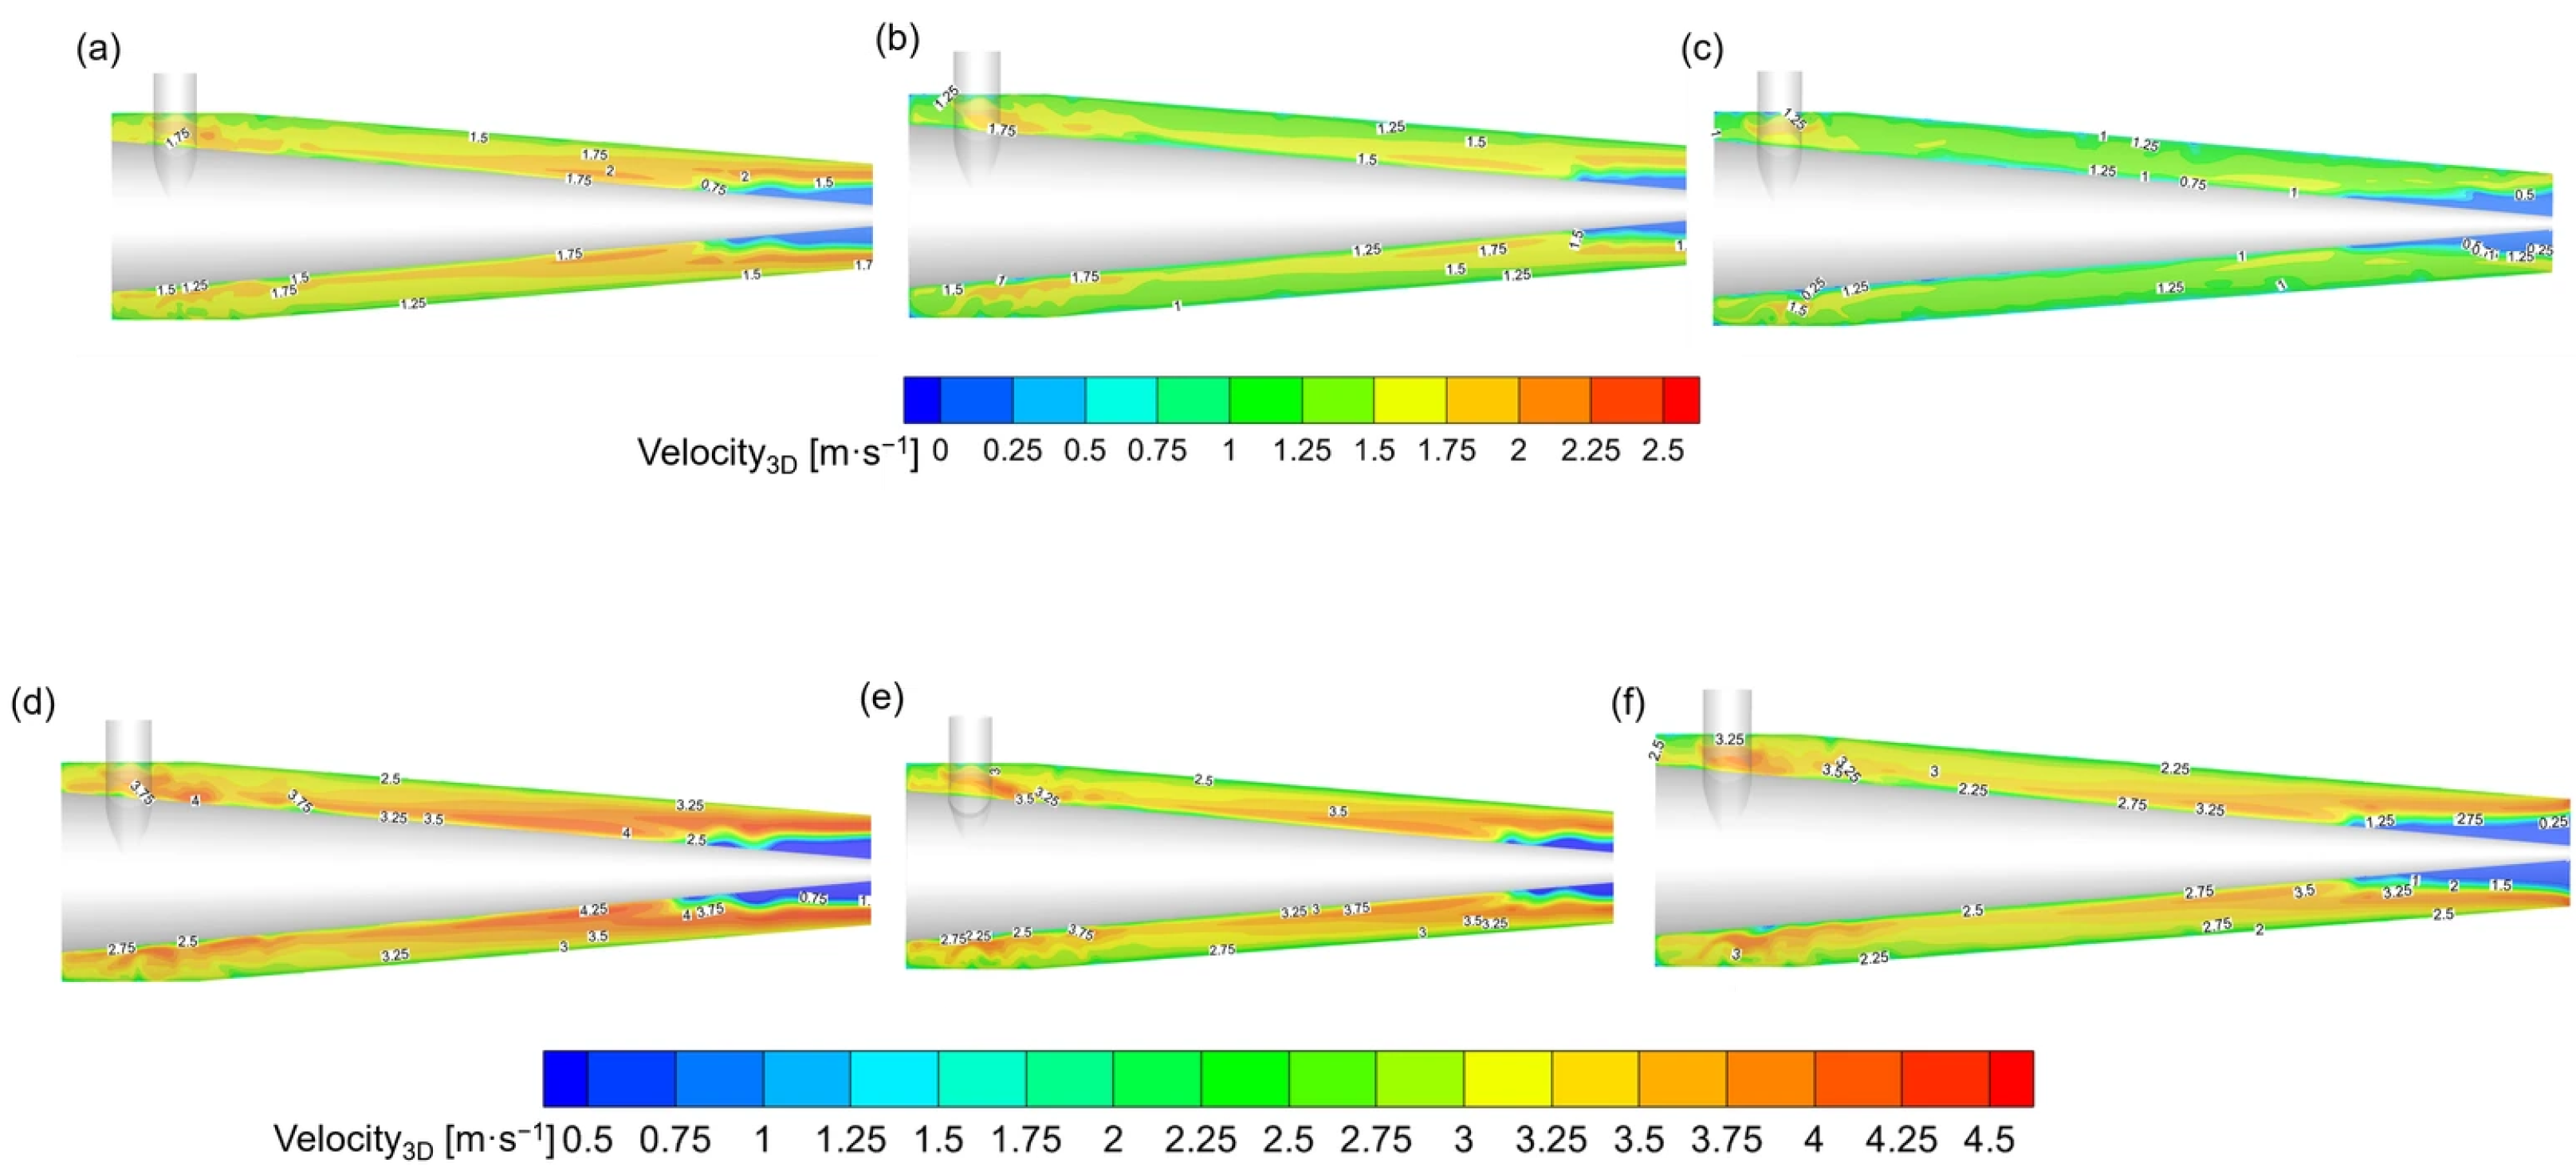
Figure 6 presents the three-dimensional velocity fields obtained from CFD, which include the circumferential velocity component and therefore provide additional insight into the spatial flow structures that cannot be fully resolved by the two-dimensional PIV measurements.
The velocity distributions under different operating conditions exhibited similar spatial characteristics. In the cylindrical inlet region, the two reactant streams converged and redistributed their momentum, resulting in pronounced local velocity variations. After entering the conical section, the fluid accelerated as the flow passage progressively contracted, producing a continuous high-velocity region near the end of the swirling section and toward the outlet. Relatively high velocities and velocity gradients were observed in the inlet convergence region, the near-wall region of the central component, and the vicinity of the outlet, indicating strong momentum exchange at these locations, which favored renewal of the interface between the reactant solutions and local mass transfer.
At the same inlet flow rate, increasing the relative viscosity did not cause any significant change in the flow field structure, consistent with the trend observed in the PIV results. As the viscosity increased, the velocity in the local high-velocity regions decreased slightly, indicating that viscous dissipation accelerated the decay of fluid momentum. This change was more pronounced at Q = 3 m3·h−1. In contrast, at Q = 6 m3·h−1, the velocity distributions under different viscosity conditions remained relatively similar, and continuous high-velocity flow was maintained near the central axis and in the outlet section. Consequently, the reactor retained strong swirling and axial transport capabilities at the high flow rate, demonstrating good adaptability to changes in viscosity.
The dimensionless secondary flow intensity, Se, was defined as the dimensionless form of the cross-sectionally averaged absolute axial vorticity [27,28]:
S e = ρ d h 2 μ A A ω z d A
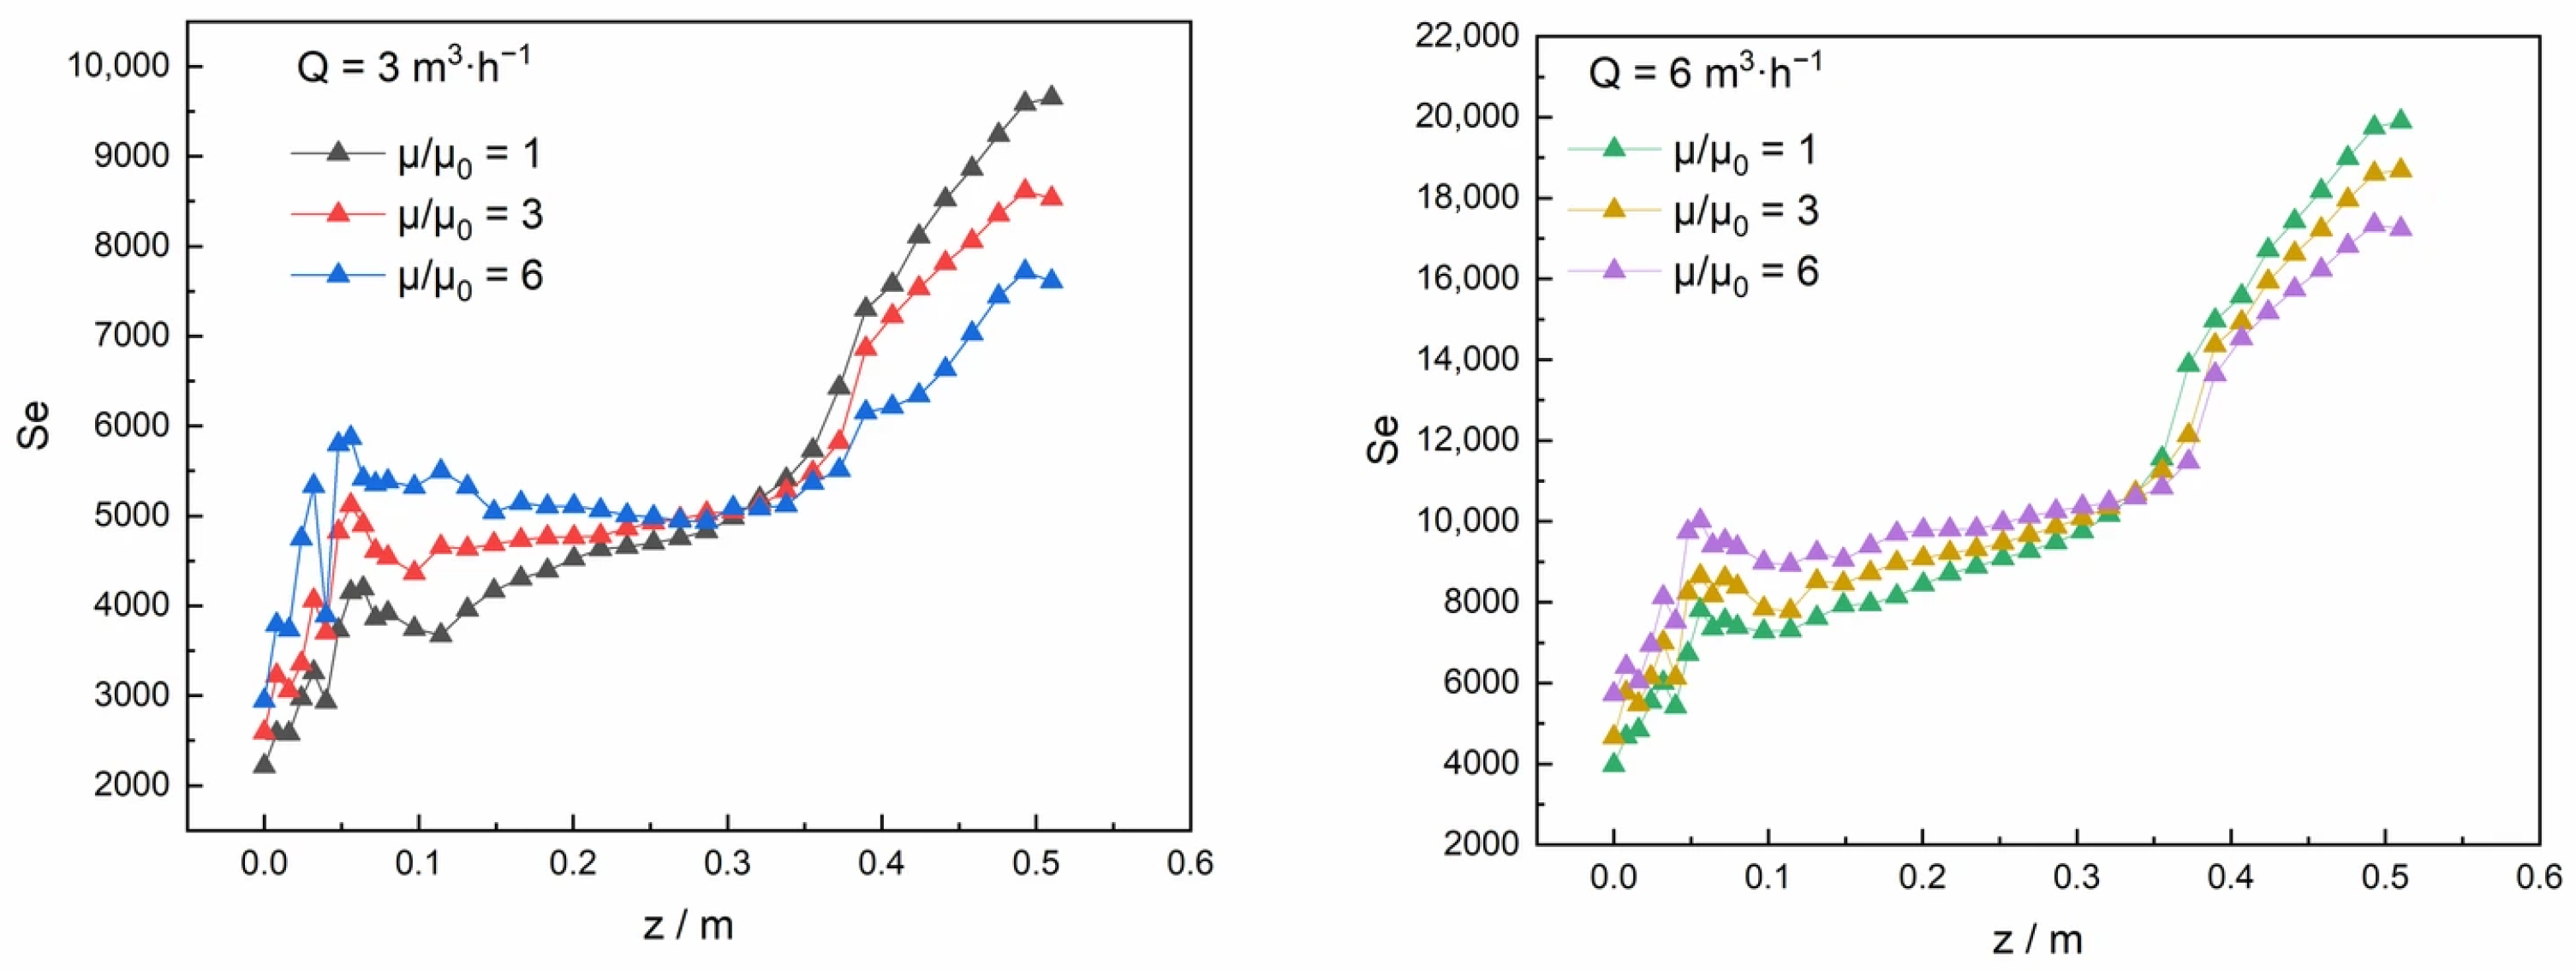
where ρ is the fluid density, dh is the hydraulic diameter, μ is the dynamic viscosity, A is the cross-sectional area, and ωz is the z-direction component of vorticity. Se is a dimensionless parameter used to characterize the intensity of secondary flow. A larger Se indicates stronger transverse circulation and secondary flow within the cross-section. Figure 7 shows the variation in Se along the axial distance, z, of the reactor at different inlet flow rates and relative viscosities.
At both flow rates, Se exhibited a characteristic axial evolution, consisting of fluctuations in the inlet region, gradual growth in the middle section, and a pronounced increase toward the outlet. After entering the reactor, the two fluid streams converge, while the swirling structure is still developing; consequently, Se exhibits pronounced fluctuations along the axial direction. In the middle section of the reactor, the inlet disturbances gradually diminish, and a relatively stable balance is established between rotational momentum transport and viscous dissipation. The swirling flow therefore becomes relatively stable, and Se increases almost linearly with axial distance. In the downstream region, the secondary flow intensity increased more rapidly, consistent with the progressive contraction of the flow passage and the resulting acceleration of the fluid.
In the upstream section of the reactor, Se was generally higher under the high-viscosity conditions than under the low-viscosity conditions at the same flow rate. This region primarily corresponds to the convergence of the inlet streams and the initial development of the swirling flow. Increasing the viscosity may enhance the transverse diffusion of tangential momentum across the cross-section, allowing rotational motion to propagate from the local region near the inlet to the surrounding fluid. Meanwhile, the stronger viscous effect may suppress the rapid breakup of small-scale vortical structures, thereby favoring the maintenance of larger and more spatially continuous swirling structures. However, this trend was reversed in the middle and downstream sections. As the flow became increasingly governed by channel contraction and axial acceleration, the lower-viscosity fluid experienced weaker viscous damping and therefore retained greater rotational momentum and stronger cross-sectional circulation. At the same relative viscosity, increasing the inlet flow rate from 3 to 6 m3·h−1 resulted in a substantial increase in Se throughout the axial range, indicating that a high flow rate effectively intensified the swirling motion and transverse transport within the reactor cross-section. At the relatively high inlet flow rate, the fluid retained more rotational momentum and developed a higher tangential velocity and a greater increase in axial vorticity as the radius of rotation decreased, leading to a rapid increase in Se. In contrast, under the low flow rate conditions, the fluid inertia was weaker, and the rotational momentum was more susceptible to wall shear and internal viscous dissipation. Consequently, both the axial development of the secondary flow and its downstream intensification were relatively limited.
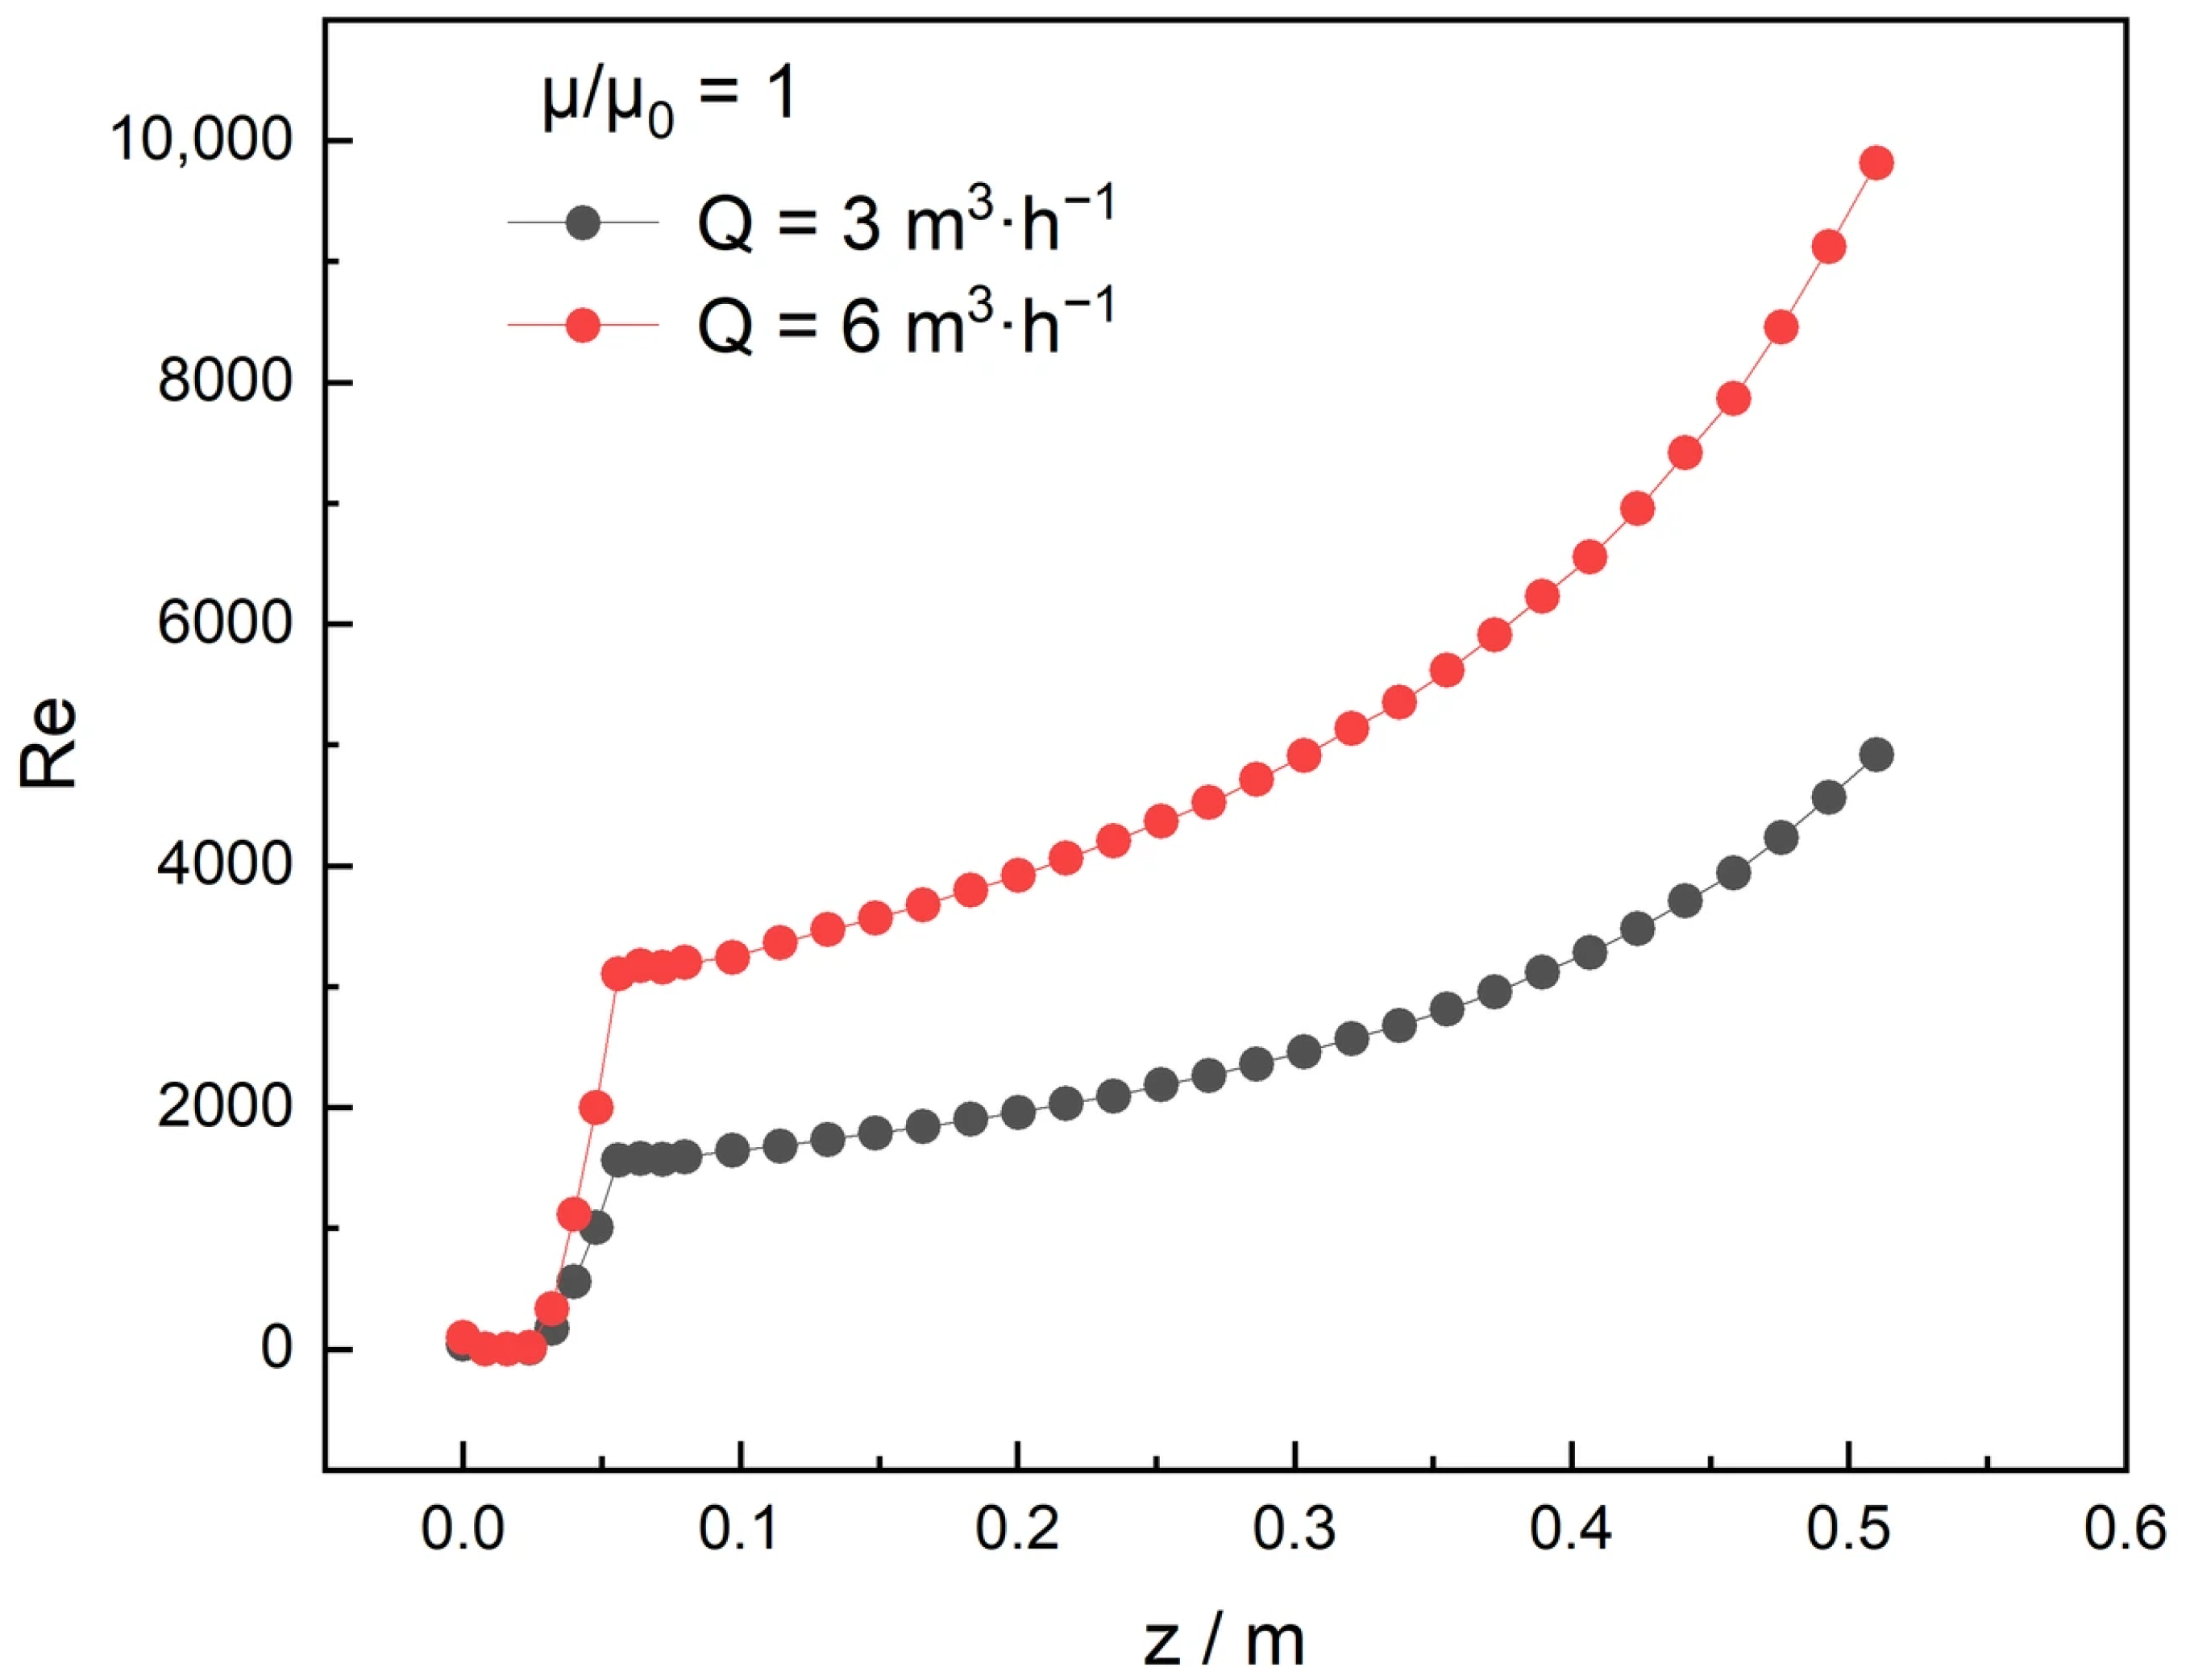
Figure 8 presents the axial distribution of the dimensionless Reynolds number at different inlet flow rates for (μ/μ0 = 1). Considering the variable annular geometry of the swirling flow reactor, the hydraulic diameter and flow characteristics vary along the axial direction. Therefore, a local Reynolds number was employed to characterize the flow conditions at different axial positions and was defined as:
Re = ρ u z ¯ d h z μ
where ρ is the fluid density, μ is the dynamic viscosity, dh is the local hydraulic diameter, and u z ¯ is the area-weighted average axial velocity at the corresponding axial position.
As shown in Figure 8, after the inlet region, the local Reynolds number generally increased along the axial direction. This variation is associated with the changing annular geometry and the corresponding evolution of the axial velocity. Increasing the inlet flow rate from 3 to 6 m3·h−1 resulted in substantially higher Reynolds numbers, indicating a greater relative contribution of inertial effects compared with viscous effects at the higher flow rate. For a given flow rate and reactor geometry, increasing the fluid viscosity decreases the Reynolds number. Since the Reynolds-number profiles at higher relative viscosities exhibit a similar axial trend with lower magnitudes, only the results at μ/μ0 = 1 are presented in Figure 8 for clarity.

3.2. Preparation Results of Calcium Carbonate Particles

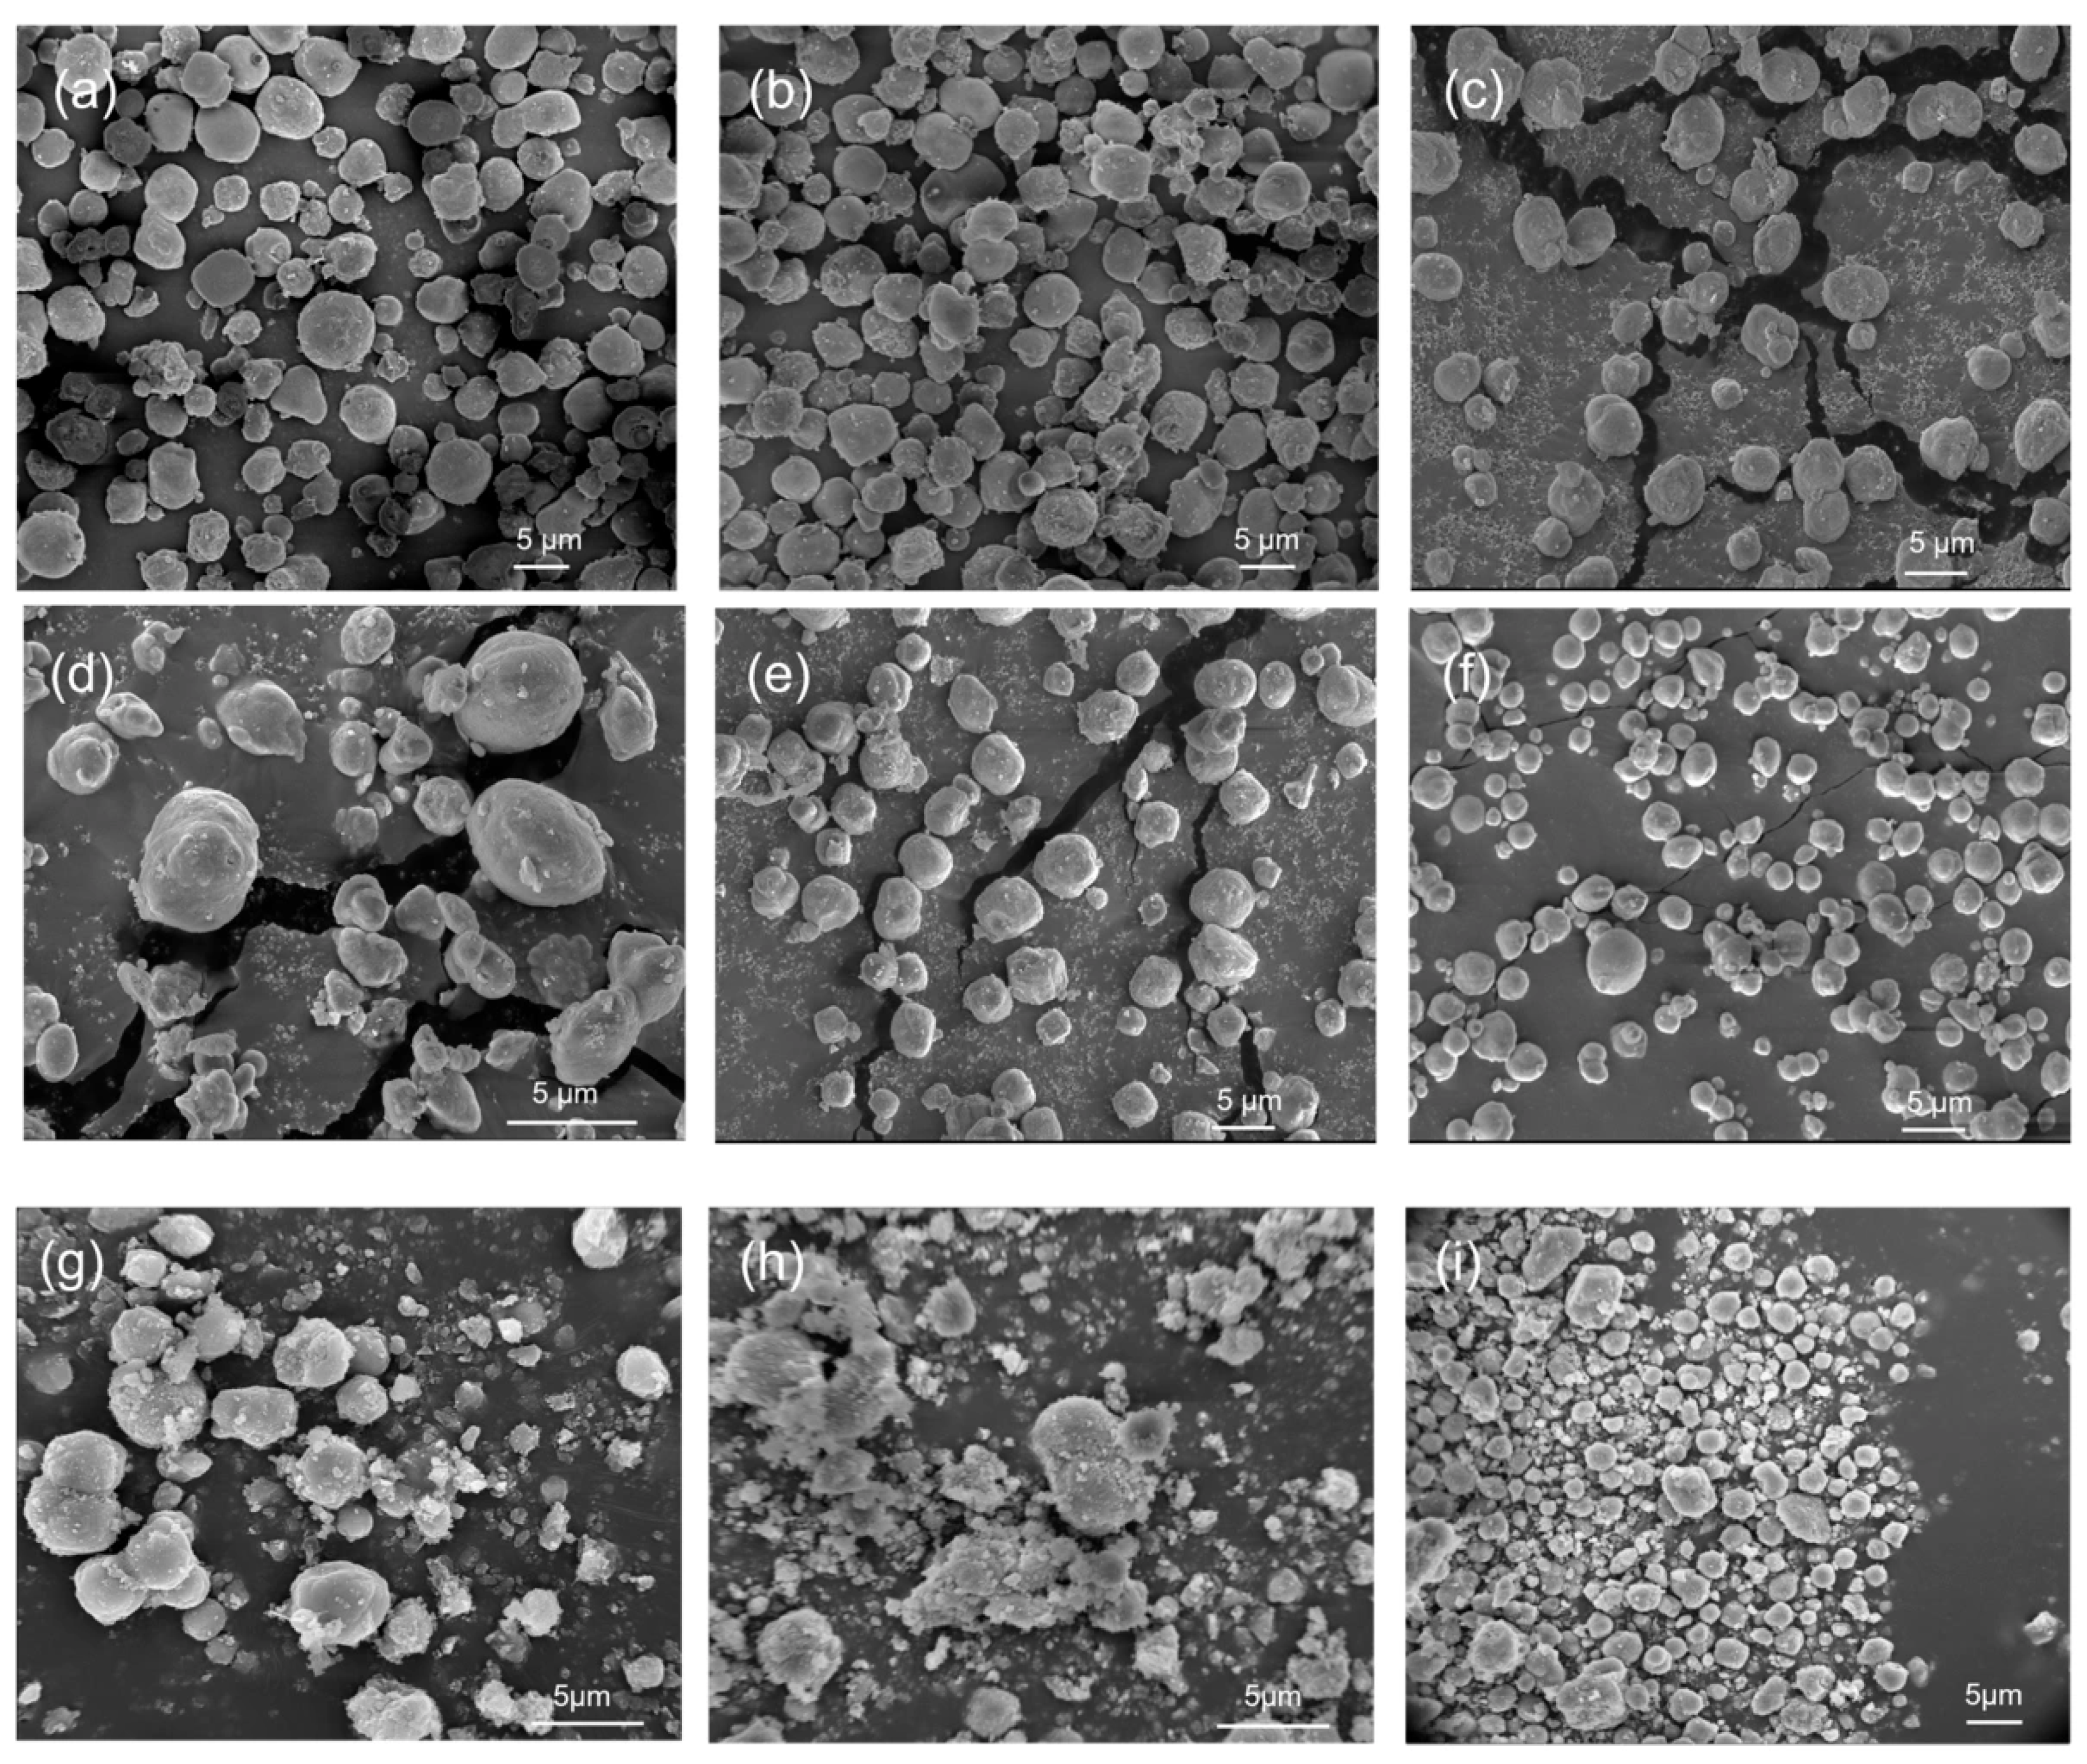
Figure 9 presents SEM images of CaCO3 particles prepared under different operating conditions. In this precipitation system, CMC-Na may interact with Ca2+ through its carboxylate groups and associate with the CaCO3 crystal surface, thereby regulating crystal growth and particle aggregation and favoring the formation of spherical particles.
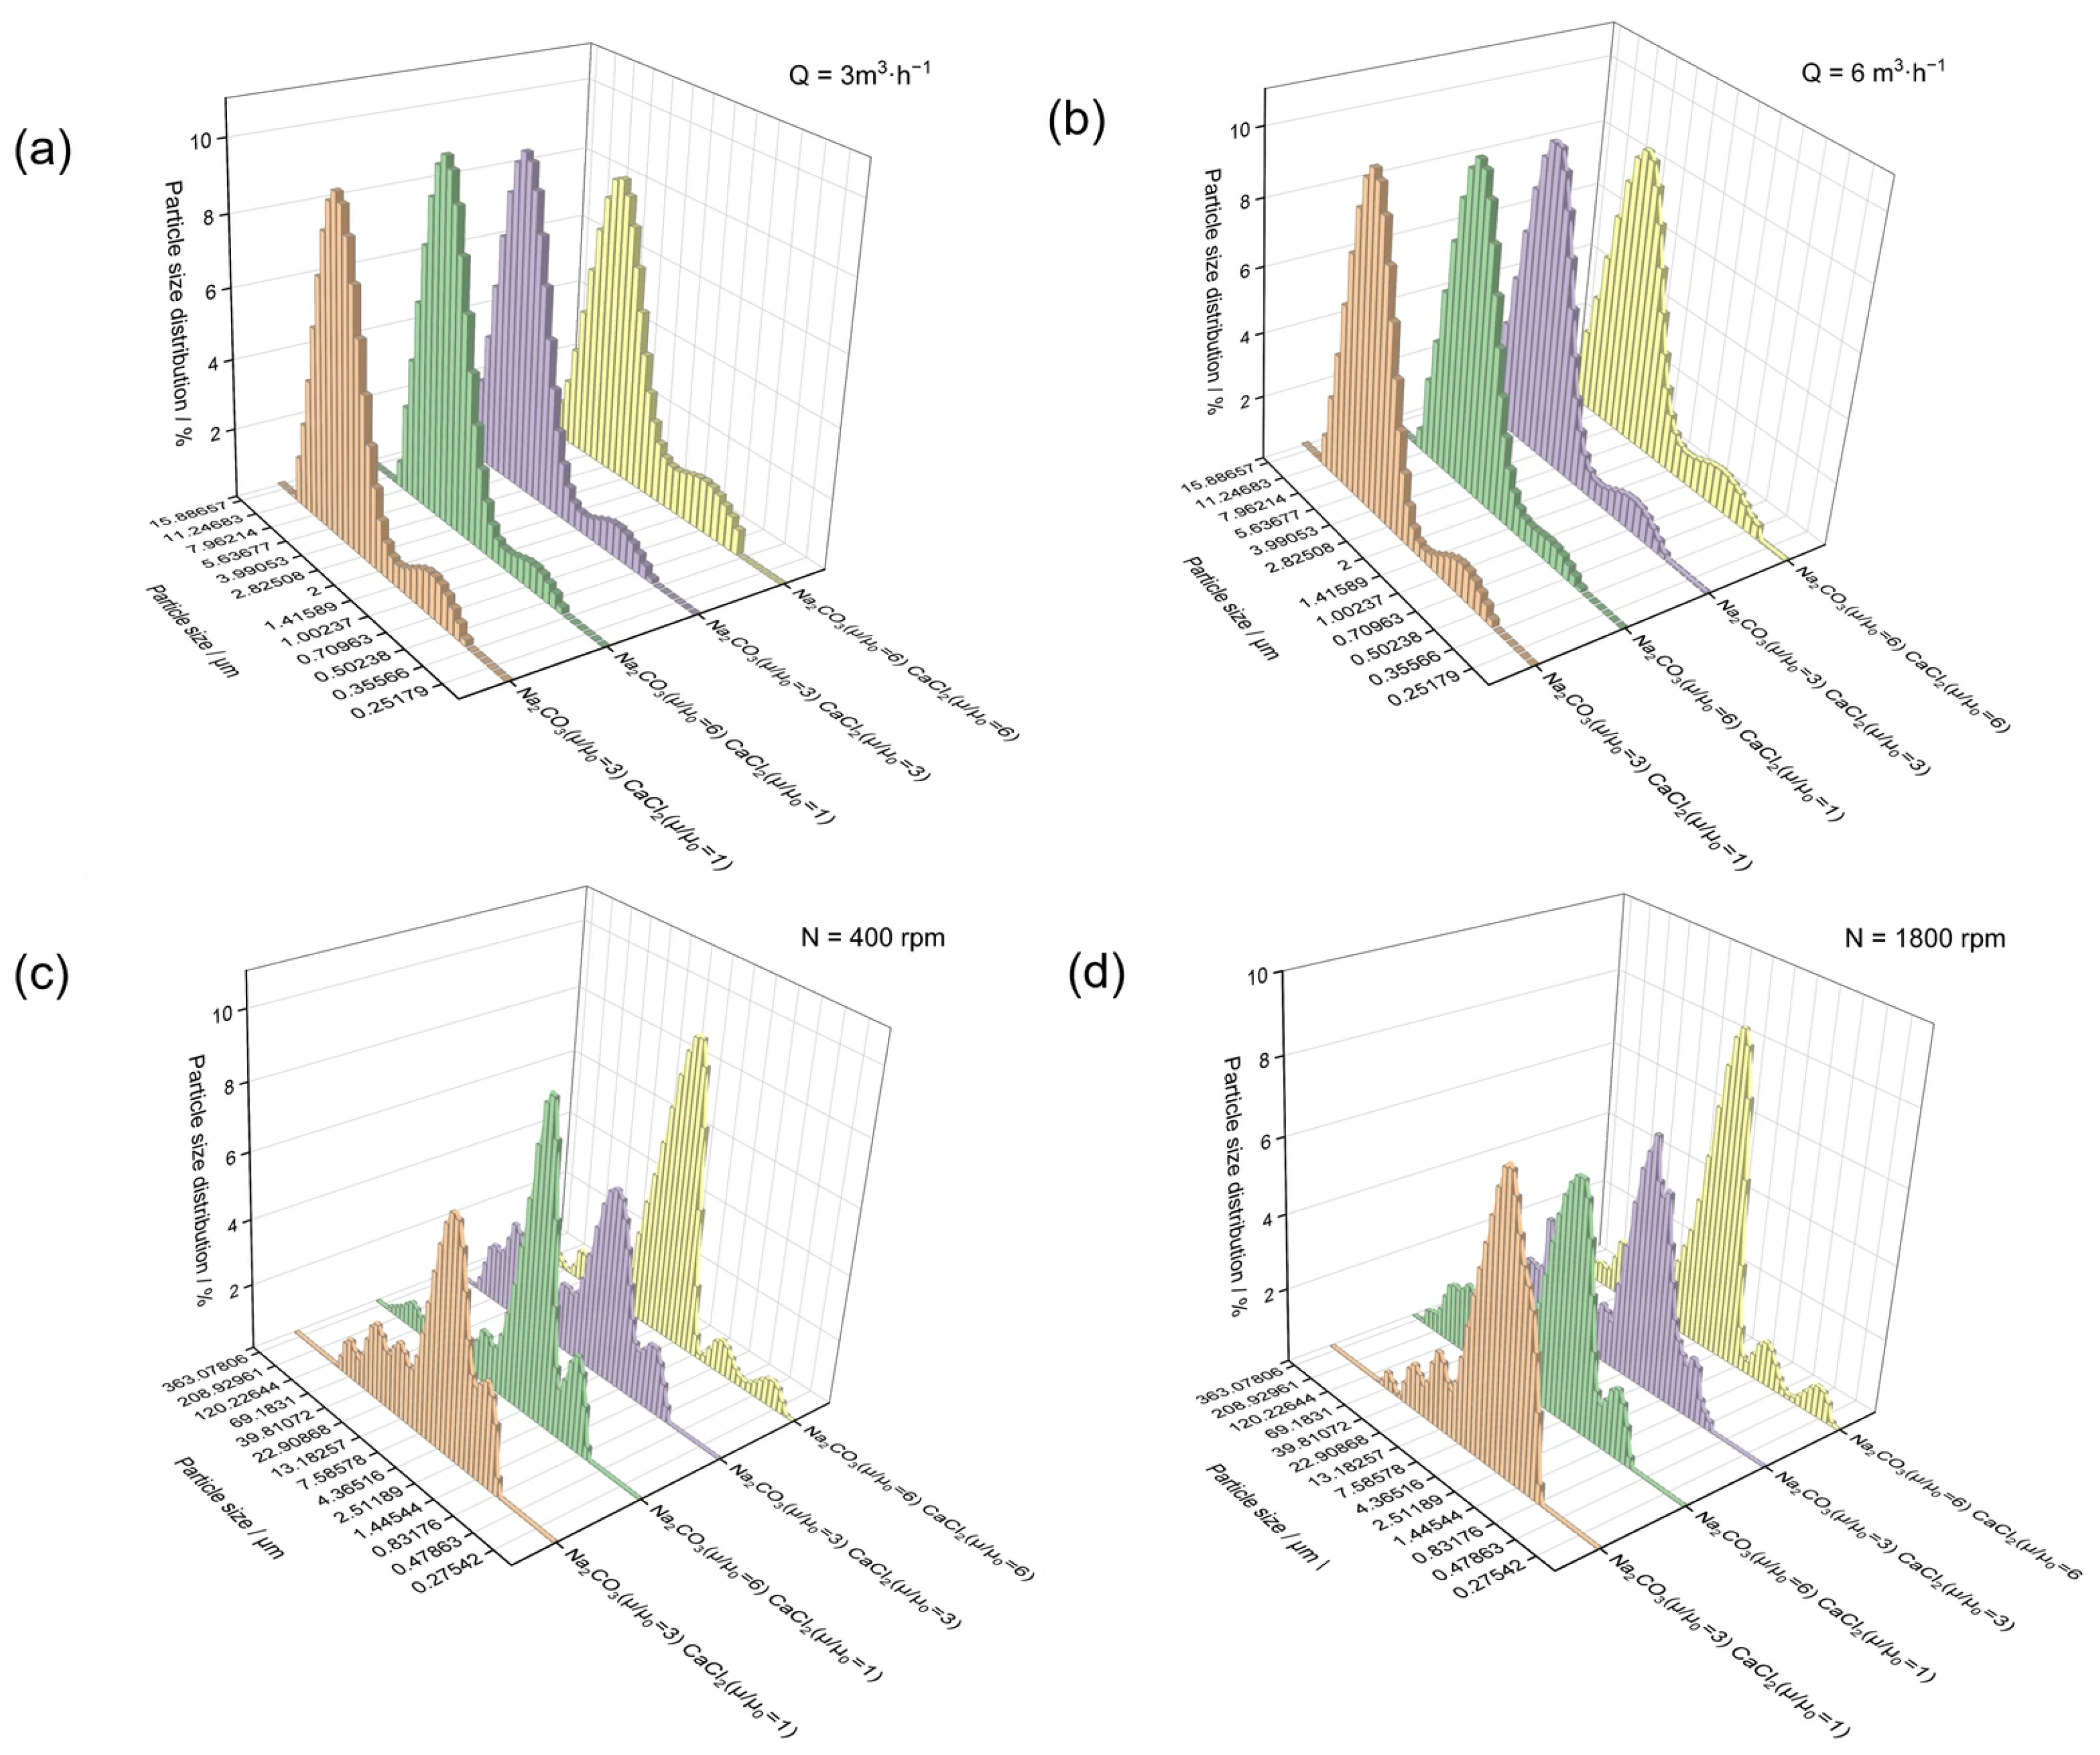
When only the Na2CO3 solution was thickened, the particles prepared at Q = 3 m3·h−1 and Q = 6 m3·h−1 were predominantly spherical. As the flow rate increased from 3 to 6 m3·h−1, the number of large irregular particles and localized aggregates decreased, while the particle sphericity and size uniformity improved slightly. This observation is consistent with the particle size distribution results in Figure 10 and the quantitative parameters in Table 1. The Span values remained relatively low under these conditions, indicating that the particles produced in the swirling flow reactor maintained relatively narrow size distributions. The increase in flow rate enhanced the mixing performance and mass transfer capability of the swirling flow reactor. When both the Na2CO3 and CaCl2 solutions were thickened, the effect of flow rate on particle morphology became more pronounced. When the relative viscosities of both solutions were 3, increasing the flow rate resulted in a more regular particle morphology. When the relative viscosities of both solutions were further increased to 6, rough spherical particles with considerable size differences were formed at Q = 3 m3·h−1, together with smaller particles and irregular aggregates, indicating that the increase in viscosity weakened the mixing and mass transfer processes at this flow rate. In contrast, the particles obtained at Q = 6 m3·h−1 were smaller, more spherical, and smoother, with markedly reduced size differences among the particles. The corresponding particle size distributions in Figure 10 also remained relatively concentrated, as the flow rate increased from 3 to 6 m3·h−1, consistent with the improved particle size uniformity observed in the SEM images. This improvement can be directly related to the hydrodynamic results discussed above. The inertial effects, swirling intensity, and secondary flow generated at the high flow rate effectively compensated for the viscous dissipation caused by the increase in viscosity, thereby potentially reducing local variations in supersaturation. Meanwhile, the lower mean residence time and variance at the high flow rate reduced differences in the residence histories of fluid elements, which may have contributed to the more uniform particle sizes.
At the same viscosity, particles produced in the stirred system exhibited more pronounced agglomeration and greater size heterogeneity than those obtained in the swirling flow reactor. In particular, at μ/μ0 = 3 and N = 400 rpm, numerous fine particles coexisted with loosely packed aggregates. When the stirring speed was increased to 1800 rpm, the number of large aggregates decreased, and the number of discrete spherical particles increased; however, the coexistence of fine particles and larger particles remained evident. This morphological observation is consistent with the quantitative particle size results. The particles prepared in the swirling flow reactor exhibited relatively narrow and concentrated size distributions, whereas those obtained in the stirred system showed broader and more variable distributions. In particular, the larger D90 values observed under some stirred conditions indicate a more pronounced coarse-particle tail, consistent with the large aggregates observed in the SEM images. This suggests that increasing the conventional stirring speed may have been insufficient to eliminate local mixing heterogeneity within the stirred apparatus.
Figure 10 presents the particle size distributions of CaCO3 particles prepared under different operating conditions, while the corresponding D10, D50, D90, and Span values are summarized in Table 1.
Under all conditions, the particles prepared in the annular swirling flow reactor exhibited relatively concentrated particle size distributions dominated by a single peak. Only slight shoulder peaks in the small-particle-size region or tailing were observed under some thickened conditions. As shown in Table 1, the particles prepared in the swirling flow reactor exhibited Span values ranging from 1.207 to 1.611, indicating relatively narrow particle size distributions under the investigated conditions. As the flow rate increased, the position of the main peak changed only slightly, whereas the overall distribution became narrower. Increasing the flow rate therefore mainly improved particle size uniformity. This result can be attributed to the enhanced fluid inertia, swirling intensity, and secondary flow at high flow rates, which promoted rapid and uniform mixing of the reactants and reduced fluctuations in local supersaturation.
In contrast, the particle size distributions obtained in the stirred system were markedly broader than those obtained in the swirling flow system, with multiple peaks and pronounced coarse-particle tailing. The D90 values of the stirred samples were substantially higher and showed greater variation than those obtained in the swirling flow reactor. Correspondingly, the Span values were also higher and more variable, indicating broader particle size distributions. When the stirring speed was increased from 400 to 1800 rpm, the coarse-particle fraction decreased under some viscosity conditions; however, the particle size distributions remained broad and multimodal. Increasing the stirring speed improved macroscopic dispersion; however, the particle size distributions remained relatively broad. Overall, the combined SEM and particle size results indicate that the annular swirling flow reactor was more effective in maintaining particle size uniformity and limiting the formation of large aggregates under the investigated conditions.
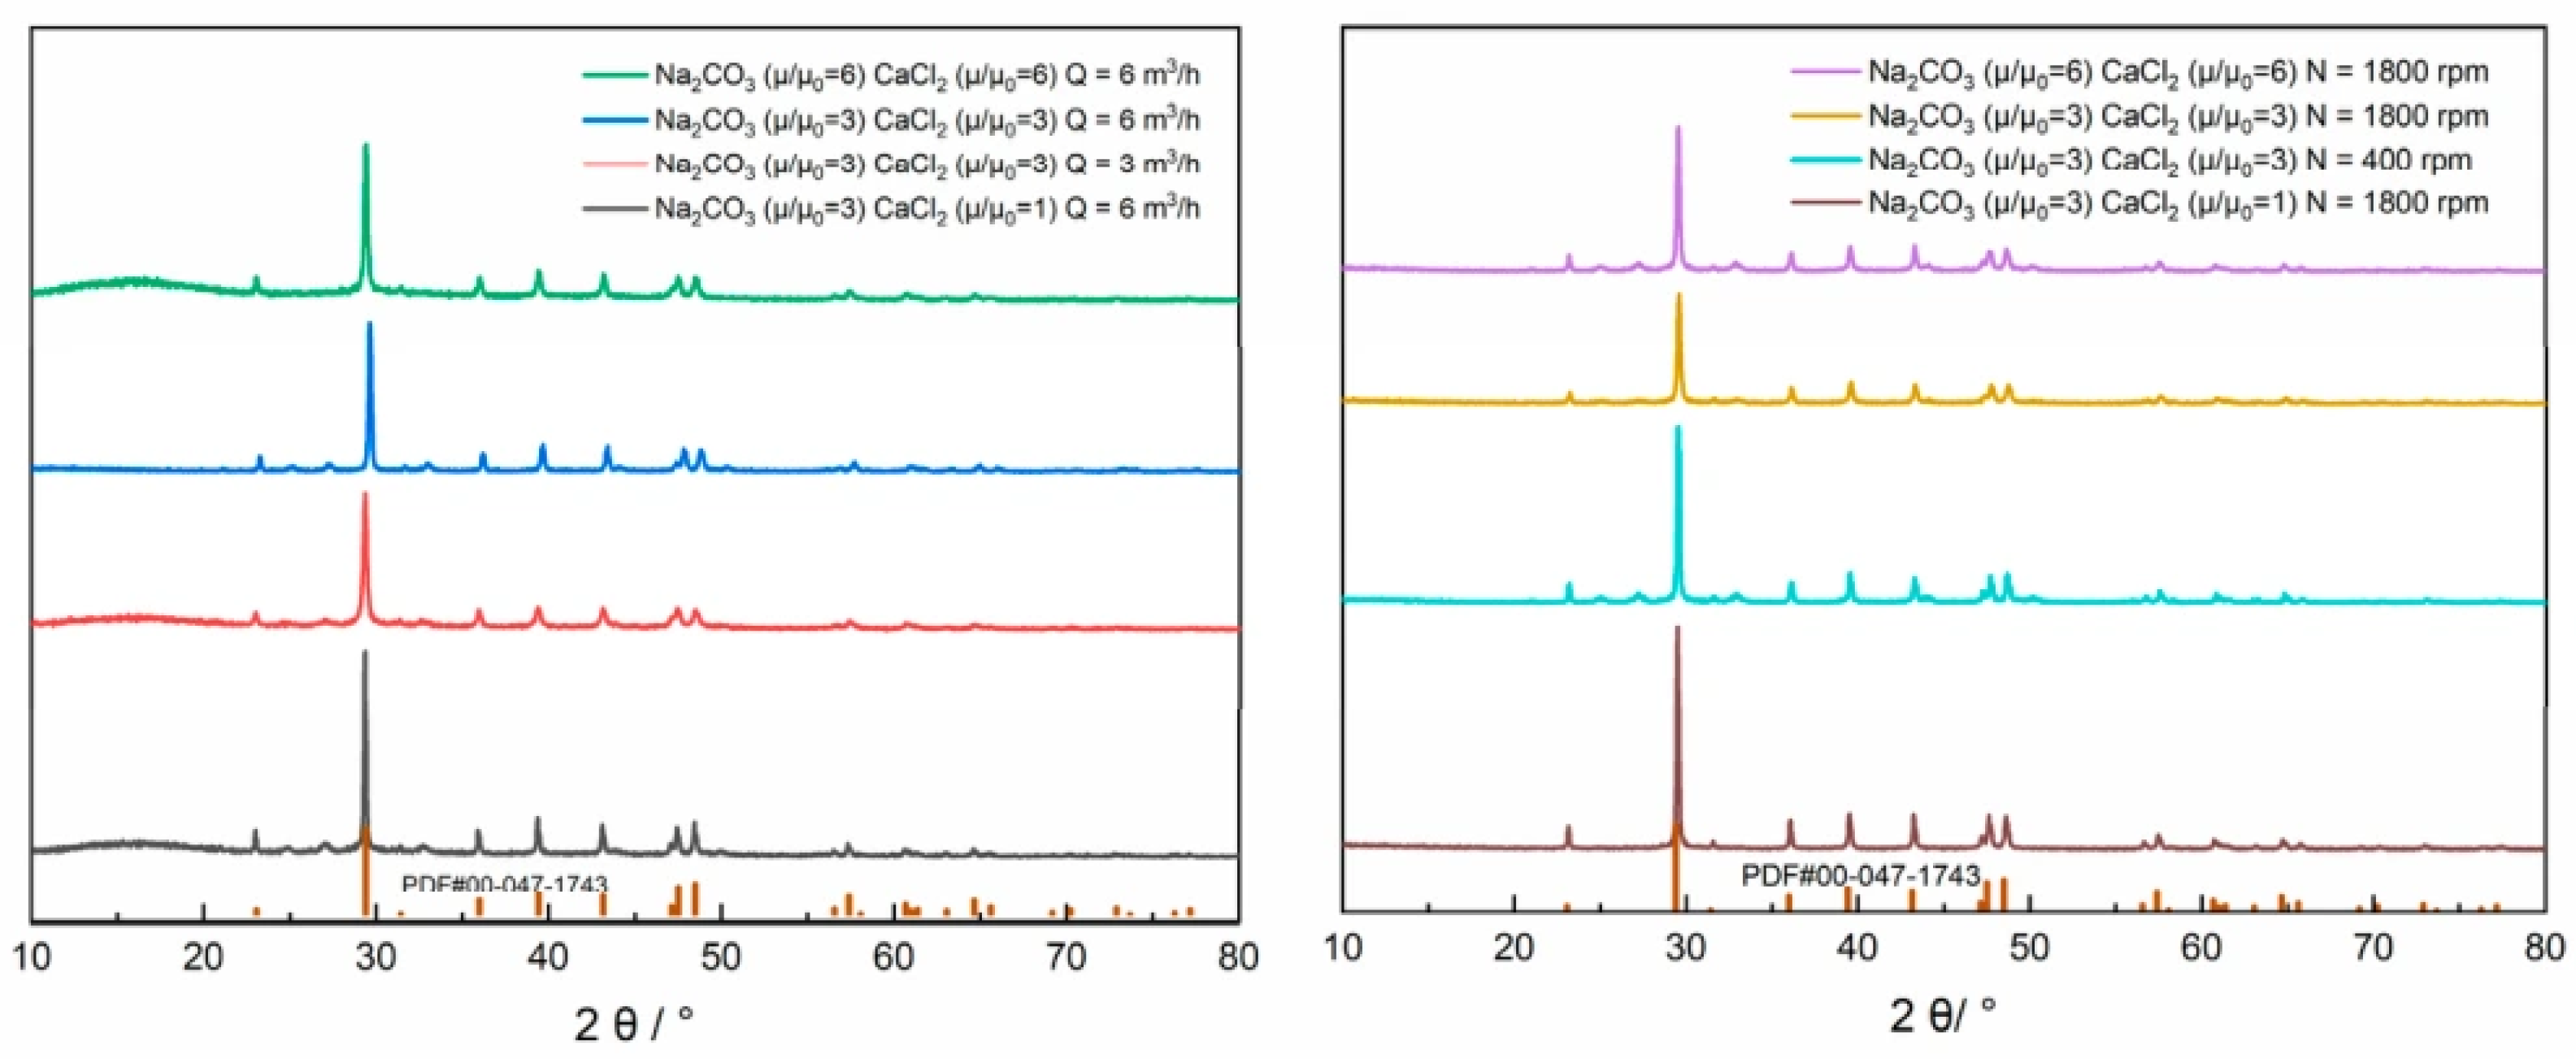
Figure 11 presents the XRD patterns of the CaCO3 particles obtained under different feed viscosities and hydrodynamic conditions.
The characteristic diffraction peaks of the samples were assigned to the (012), (104), (110), (113), (202), and (018) crystal planes of calcite CaCO3, consistent with the results reported in the literature [13]. Among these peaks, the (104) reflection located at approximately 29.4° exhibited the highest intensity, indicating that calcite was the predominant crystalline phase of the products obtained under all conditions. Therefore, the CaCO3 particles prepared at different feed viscosities and using different preparation methods (swirling flow and stirring) all existed in the calcite form.


4. Conclusions

In this study, an annular swirling flow reactor was developed for the continuous precipitation of CaCO3 from Na2CO3 and CaCl2 solutions with different viscosities. The residence time distribution exhibited a concentrated single-peak profile with limited tailing and no pronounced short-circuiting or dead zones, demonstrating predominantly plug flow characteristics. Such a residence time distribution is particularly favorable for rapid precipitation reactions, as it can reduce the variation in reaction time among fluid elements and provide a relatively uniform reaction environment. PIV and CFD analyses further revealed the evolution of the velocity and vorticity fields within the reactor. The strong swirling motion, velocity gradients, and secondary flow structures generated in the reactor provided effective transverse fluid transport and intensive interfacial renewal, indicating a high mass-transfer capability. Increasing the inlet flow rate further strengthened the inertial and swirling effects and effectively compensated for the attenuation of flow structures caused by increased viscosity.
The enhanced hydrodynamic and mass transfer performance was directly reflected in the properties of the precipitated CaCO3 particles. Under high-viscosity conditions, increasing the flow rate reduced particle agglomeration and improved particle sphericity, surface regularity, and size uniformity. Compared with conventional stirred mixing, the annular swirling flow reactor produced CaCO3 particles with more regular morphologies and narrower particle size distributions, demonstrating its clear advantages in maintaining efficient mixing and uniform precipitation in thickened systems. More importantly, the reactor exhibited a strong capacity for continuous high-throughput operation. At an inlet flow rate of 6 m3 h−1 for each reactant stream and a reactant concentration of 0.1 mol·L−1, the theoretical CaCO3 production capacity reached approximately 1.00 kg·min−1 under complete conversion, corresponding to approximately 60 kg·h−1. The high throughput was achieved while maintaining favorable residence time characteristics and particle quality, demonstrating that the swirling flow configuration can simultaneously accommodate rapid precipitation kinetics and continuous reactant processing. Unlike conventional batch or mechanically stirred systems, the annular swirling flow reactor provides continuous feeding, rapid mixing, and continuous product discharge within a compact flow path, which is advantageous for intensifying precipitation processes and increasing production efficiency, highlighting its potential for process intensification in continuous reactive crystallization.

Author Contributions

C.F.: Writing—original draft, Visualization, Validation, Software, Project administration, Methodology, Investigation, Formal analysis, Writing—review and editing. J.Z.: Validation, Investigation, Formal analysis. S.D.: Validation, Investigation, Formal analysis. W.W.: Validation, Conceptualization, Methodology. Z.H.: Supervision, Methodology, Conceptualization. Z.C.: Writing—review and editing, Supervision, Resources, Methodology, Funding acquisition, Conceptualization. All authors have read and agreed to the published version of the manuscript.

Funding

This research was funded by the China Chemical Education Association under grant No. 2024kc-01.

Data Availability Statement

The dataset is available upon request from the authors.

Acknowledgments

During the preparation of this manuscript, the authors used ChatGPT (OpenAI, 5.5) for generating the schematic illustration of the experimental setup shown in Figure 1a. The AI-generated illustration was subsequently reviewed and edited by the authors to ensure consistency with the actual experimental configuration. The authors take full responsibility for the content of this publication.

Conflicts of Interest

The authors declare no conflicts of interest.

Symbols

Q Flow rate N Stirring speed μ0 Viscosity of water at room temperature μ Fluid viscosity E(t) Residence time distribution function z Axial distance Se Secondary flow intensity Re Reynolds number dh Hydraulic diameter A Cross-sectional area ρ Fluid density ωz Z-direction component of vorticity σ2 Variance u z ¯ Area-weighted average velocity over the cross section D10 Particle diameter below which 10% of the cumulative particle volume is distributed D50 Particle diameter below which 50% of the cumulative particle volume is distributed D90 Particle diameter below which 90% of the cumulative particle volume is distributed Span Particle size distribution width t Residence time t ¯ Average residence time.

References

  1. El Mogy, S.A.; Darwish, N.A.; Awad, A. Comparative Study of the Cure Characteristics and Mechanical Properties of Natural Rubber Filled With Different Calcium Carbonate Resources. J. Vinyl Addit. Technol. 2020, 26, 309–315. [Google Scholar] [CrossRef] [Scilit]
  2. Jung, W.-M.; Hoon Kang, S.; Kim, K.-S.; Kim, W.-S.; Kyun Choi, C. Precipitation of calcium carbonate particles by gas–liquid reaction: Morphology and size distribution of particles in Couette-Taylor and stirred tank reactors. J. Cryst. Growth 2010, 312, 3331–3339. [Google Scholar] [CrossRef] [Scilit]
  3. Barhoum, A.; Rahier, H.; Abou-Zaied, R.E.; Rehan, M.; Dufour, T.; Hill, G.; Dufresne, A. Effect of Cationic and Anionic Surfactants on the Application of Calcium Carbonate Nanoparticles in Paper Coating. ACS Appl. Mater. Interfaces 2014, 6, 2734–2744. [Google Scholar] [CrossRef] [Scilit] [PubMed]
  4. Lam, T.D.; Hoang, T.V.; Quang, D.T.; Kim, J.S. Effect of nanosized and surface-modified precipitated calcium carbonate on properties of CaCO3/polypropylene nanocomposites. Mater. Sci. Eng. A 2009, 501, 87–93. [Google Scholar] [CrossRef] [Scilit]
  5. Zhu, Y.D.; Allen, G.C.; Jones, P.G.; Adams, J.M.; Gittins, D.I.; Heard, P.J.; Skuse, D.R. Dispersion characterisation of CaCO3 particles in PP/CaCO3 composites. Compos. Part A Appl. Sci. Manuf. 2014, 60, 38–43. [Google Scholar] [CrossRef] [Scilit]
  6. Luo, S.; Pan, S.; Chang, H.; Zhang, M.; Yu, W.; Lai, Z. Influence mechanism of mechanical properties and crack formation of CaCO3/PVC composites based on cohesion model. Mater. Today Commun. 2022, 31, 103747. [Google Scholar] [CrossRef] [Scilit]
  7. Niu, Y.-Q.; Liu, J.-H.; Aymonier, C.; Fermani, S.; Kralj, D.; Falini, G.; Zhou, C.-H. Calcium carbonate: Controlled synthesis, surface functionalization, and nanostructured materials. Chem. Soc. Rev. 2022, 51, 7883–7943. [Google Scholar] [CrossRef] [Scilit] [PubMed]
  8. Yang, A.; Huang, Z.; Zhu, Y.; Han, Y.; Tong, Z. Preparation of nano-sized calcium carbonate in solution mixing process. J. Cryst. Growth 2021, 571, 126247. [Google Scholar] [CrossRef] [Scilit]
  9. Pei, W.; Li, X.; Li, W.; Chi, R.; Long, B.; Guo, J.; Zhang, J. Influence of micromixing and shear on precipitation process in the jet-flow high shear reactors. Chem. Eng. Sci. 2024, 300, 120640. [Google Scholar] [CrossRef] [Scilit]
  10. Liu, L.; Yang, X.; Guo, Y.; Li, B.; Wang, L.-P. Reactive mixing performance for a nanoparticle precipitation in a swirling vortex flow reactor. Ultrason. Sonochem. 2023, 94, 106332. [Google Scholar] [CrossRef] [Scilit] [PubMed]
  11. Feng, B.; Yong, A.K.; An, H. Effect of various factors on the particle size of calcium carbonate formed in a precipitation process. Mater. Sci. Eng. A 2007, 445–446, 170–179. [Google Scholar] [CrossRef] [Scilit]
  12. Minkowicz, L.; Dagan, A.; Uvarov, V.; Benny, O. Controlling Calcium Carbonate Particle Morphology, Size, and Molecular Order Using Silicate. Materials 2021, 14, 3525. [Google Scholar] [CrossRef] [Scilit] [PubMed]
  13. Liu, H.; Zhao, Y.; Peng, C.; Song, S.; López–Valdivieso, A. Lime mortars—The role of carboxymethyl cellulose on the crystallization of calcium carbonate. Constr. Build. Mater. 2018, 168, 169–177. [Google Scholar] [CrossRef] [Scilit]
  14. Lopez, C.G.; Richtering, W. Oscillatory rheology of carboxymethyl cellulose gels: Influence of concentration and pH. Carbohydr. Polym. 2021, 267, 118117. [Google Scholar] [CrossRef] [Scilit] [PubMed]
  15. Kang, Q.; Liu, J.; Feng, X.; Yang, C.; Wang, J. Isolated mixing regions and mixing enhancement in a high-viscosity laminar stirred tank. Chin. J. Chem. Eng. 2022, 41, 176–192. [Google Scholar] [CrossRef] [Scilit]
  16. Hakke, V.; Sonawane, S.; Anandan, S.; Sonawane, S.; Ashokkumar, M. Process Intensification Approach Using Microreactors for Synthesizing Nanomaterials—A Critical Review. Nanomaterials 2021, 11, 98. [Google Scholar] [CrossRef] [Scilit] [PubMed]
  17. Adavi, K.; Molaei Dehkordi, A. Synthesis and polymorph controlling of calcite and aragonite calcium carbonate nanoparticles in a confined impinging-jets reactor. Chem. Eng. Process.-Process Intensif. 2021, 159, 108239. [Google Scholar] [CrossRef] [Scilit]
  18. Liu, L. Model of reactive precipitation process of preparation nano-ZnO in rotating packed bed: Contribution ratio. Adv. Powder Technol. 2022, 33, 103637. [Google Scholar] [CrossRef] [Scilit]
  19. Li, C.; Wu, B.; Zhang, J.; Luo, P. Effect of swirling addition on the liquid mixing performance in a T-jets mixer. Chin. J. Chem. Eng. 2022, 50, 108–116. [Google Scholar] [CrossRef] [Scilit]
  20. Adeyemi, I.; Kharoua, N.; Khezzar, L.; Meribout, M.; AlHammadi, K. Review of confined swirling flows and bluff body impacts on flow and heat transfer characteristics. Chem. Eng. Res. Des. 2022, 187, 359–386. [Google Scholar] [CrossRef] [Scilit]
  21. Yang, Z.; Holemans, T.; Lagrain, B.; Sels, B.; Vanierschot, M. A solid-liquid mixing reactor based on swirling flow technology. Chem. Eng. Sci. 2023, 280, 119054. [Google Scholar] [CrossRef] [Scilit]
  22. Yang, Z.; Holemans, T.; Lagrain, B.; Sels, B.; Vanierschot, M. A draft tube to improve mixing in swirling flow-based solid–liquid mixing reactors. Chem. Eng. Res. Des. 2024, 206, 226–241. [Google Scholar] [CrossRef] [Scilit]
  23. Wang, W.-W.; Xiao, W.-Z.; Li, X.; Luo, G.; Tang, Y.-L.; Huang, Z.-B.; Cheng, Z.-M. Preparation of inorganic salt particles by reactive crystallization in an annular swirling flow reactor. Chem. Eng. J. 2024, 492, 152266. [Google Scholar] [CrossRef] [Scilit]
  24. Bumrungthaichaichan, E. A note of caution on numerical scheme selection: Evidence from cyclone separator CFD simulations with appropriate near-wall grid sizes. Powder Technol. 2023, 427, 118713. [Google Scholar] [CrossRef] [Scilit]
  25. Jawarneh, A.M.; Vatistas, G.H. Reynolds Stress Model in the Prediction of Confined Turbulent Swirling Flows. J. Fluids Eng. 2006, 128, 1377–1382. [Google Scholar] [CrossRef] [Scilit]
  26. Liu, Z.; Wijeyakulasuriya, S.; Mashayekh, A.; Chai, X. Investigation of Reynolds Stress Model for Complex Flow Using CONVERGE. In Proceedings of the WCX SAE World Congress Experience, Detroit, MI, USA, 21–23 April 2020. [Google Scholar] [CrossRef] [Scilit]
  27. Song, K.; Wang, L. The Effectiveness of Secondary Flow Produced by Vortex Generators Mounted on Both Surfaces of the Fin to Enhance Heat Transfer in a Flat Tube Bank Fin Heat Exchanger. J. Heat Transf. 2013, 135, 041902. [Google Scholar] [CrossRef] [Scilit]
  28. Song, K.; Hu, W.; Liu, S.; Wang, L. Quantitative relationship between secondary flow intensity and heat transfer intensity in flat-tube-and-fin air heat exchanger with vortex generators. Appl. Therm. Eng. 2016, 103, 1064–1070. [Google Scholar] [CrossRef] [Scilit]
Figure 1. (a) Schematic diagram of the experimental setup. (b) Diagram of the swirling flow reactor structure.
Processes 14 02946 g001
Figure 2. Streamlines of the instantaneous velocity field measured by PIV at successive time instants in the upper region of the swirling flow reactor. The red boxes indicate the evolution of the vortex structures and are shown in red for visual clarity only.
Processes 14 02946 g002
Figure 3. Velocity y-z distributions in the axial section (y-z plane) of the swirling flow reactor measured by PIV under different conditions: (a) μ/μ0 = 1 Q = 3 m3·h−1; (b) μ/μ0 = 3 Q = 3 m3·h−1; (c) μ/μ0 = 6 Q = 3 m3·h−1; (d) μ/μ0 = 1 Q = 6 m3·h−1; (e) μ/μ0 = 3 Q = 6 m3·h−1; (f) μ/μ0 = 6 Q = 6 m3·h−1.
Processes 14 02946 g003
Figure 4. Vorticity fields in the axial section (y-z plane) of the swirling flow reactor measured by PIV under different conditions: (a) μ/μ0 = 1 Q = 3 m3·h−1; (b) μ/μ0 = 3 Q = 3 m3·h−1; (c) μ/μ0 = 6 Q = 3 m3·h−1; (d) μ/μ0 = 1 Q = 6 m3·h−1; (e) μ/μ0 = 3 Q = 6 m3·h−1; (f) μ/μ0 = 6 Q = 6 m3·h−1.
Processes 14 02946 g004
Figure 5. Residence time distribution curves of the swirling flow reactor obtained by CFD under different conditions.
Processes 14 02946 g005
Figure 6. Velocity3D fields in the axial section (y-z plane) obtained by CFD under different conditions: (a) μ/μ0 = 1 Q = 3 m3·h−1; (b) μ/μ0 = 3 Q = 3 m3·h−1; (c) μ/μ0 = 6 Q = 3 m3·h−1; (d) μ/μ0 = 1 Q = 6 m3·h−1; (e) μ/μ0 = 3 Q = 6 m3·h−1; (f) μ/μ0 = 6 Q = 6 m3·h−1.
Processes 14 02946 g006
Figure 7. Distributions of the dimensionless secondary flow intensity under different conditions.
Processes 14 02946 g007
Figure 8. Distributions of the dimensionless Reynolds number at different flow rates.
Processes 14 02946 g008
Figure 9. SEM images of CaCO3 particles prepared at different feed viscosities and operating conditions. Swirling flow: (a) Na2CO3 (μ/μ0 = 3), CaCl2 (μ/μ0 = 1), Q = 3 m3·h−1; (b) Na2CO3 (μ/μ0 = 3), CaCl2 (μ/μ0 = 1), Q = 6 m3·h−1; (c) Na2CO3 (μ/μ0 = 3), CaCl2 (μ/μ0 = 3), Q = 3 m3·h−1; (d) Na2CO3 (μ/μ0 = 6), CaCl2 (μ/μ0 = 6), Q = 3 m3·h−1; (e) Na2CO3 (μ/μ0 = 3), CaCl2 (μ/μ0 = 3), Q = 6 m3·h−1; (f) Na2CO3 (μ/μ0 = 6), CaCl2 (μ/μ0 = 6), Q = 6 m3·h−1. Stirring: (g) Na2CO3 (μ/μ0 = 3), CaCl2 (μ/μ0 = 3), N = 400 rpm; (h) Na2CO3 (μ/μ0 = 6), CaCl2 (μ/μ0 = 6), N = 400 rpm; (i) Na2CO3 (μ/μ0 = 6), CaCl2 (μ/μ0 = 6), N = 1800 rpm.
Processes 14 02946 g009
Figure 10. Particle size distributions of CaCO3 particles prepared under different operating conditions: (a) Q = 3 m3·h−1; (b) Q = 6 m3·h−1;(c) N = 400 rpm; (d) N = 1800 rpm.
Processes 14 02946 g010
Figure 11. XRD patterns of CaCO3 particles prepared under different conditions.
Processes 14 02946 g011
Table 1. Particle size distribution parameters of CaCO3 particles under different experimental conditions.
ConditionQ/ND10/μmD50/μmD90/μmSpan
Na2CO3 (μ/μ0 = 3), CaCl2 (μ/μ0 = 1)Q = 3 m3·h−11.474.287.571.425
Q = 6 m3·h−11.954.367.511.275
N = 400 rpm1.364.1328.626.600
N = 1800 rpm1.222.8713.562.300
Na2CO3 (μ/μ0 = 6), CaCl2 (μ/μ0 = 1)Q = 3 m3·h−11.703.505.981.223
Q = 6 m3·h−11.653.535.911.207
N = 400 rpm1.293.7032.578.454
N = 1800 rpm1.875.4779.0414.108
Na2CO3 (μ/μ0 = 3), CaCl2 (μ/μ0 = 3)Q = 3 m3·h−11.884.317.621.332
Q = 6 m3·h−11.804.167.301.322
N = 400 rpm1.625.9371.6811.824
N = 1800 rpm1.203.5731.898.597
Na2CO3 (μ/μ0 = 6), CaCl2 (μ/μ0 = 6)Q = 3 m3·h−10.903.426.411.611
Q = 6 m3·h−10.973.326.061.533
N = 400 rpm2.026.0974.15511.845
N = 1800 rpm2.285.6544.397.453
Disclaimer/Publisher’s Note: The statements, opinions and data contained in all publications are solely those of the individual author(s) and contributor(s) and not of MDPI and/or the editor(s). MDPI and/or the editor(s) disclaim responsibility for any injury to people or property resulting from any ideas, methods, instructions or products referred to in the content.