1. Introduction
In Block A of the East China oil region, the reservoirs are deeply buried, exhibiting strong heterogeneity and water sensitivity. The porosity ranges from 5.2% to 24.2% (averaging 11.2%), permeability from 0.58 to 132.71 mD (averaging 54.56 mD), and the original oil saturation between 40% and 65%. Due to the high water sensitivity of the formations, water injection encounters high and unstable pressures, leading to a low injection-production ratio and poor effectiveness of water flooding. Gas flooding is commonly employed for low-permeability, ultra-low-permeability, and tight oil reservoirs because the injected gas offers superior diffusivity and injectability compared to water, and it avoids the continuous introduction of external water and therefore reduces further disturbance of water-sensitive formations, although it cannot eliminate the effects of residual water or pre-existing water-sensitive damage. Among various gas injection media, CO
2 flooding demonstrates the most remarkable performance and provides a potentially effective option for improving injectivity and oil recovery in water-sensitive, low-permeability reservoirs [
1]. Carbon-dioxide-enhanced oil recovery (CO
2-EOR) has been widely applied due to its capability to effectively enhance oil recovery while simultaneously reducing greenhouse gas emissions [
2,
3,
4]. As a tertiary recovery technique, it has garnered significant attention driven by global warming concerns and the demand for greenhouse gas storage [
5,
6]. Additionally, CO
2 flooding has the twin advantages of permanent CO
2 sequestration and economic benefits, while also cutting greenhouse gas emissions [
7,
8,
9].
Abedini and Torabi investigated CO
2 sequestration under different pressure scenarios via CO
2 horizontal displacement experiments, concluding that near miscible conditions were optimal for CO
2 sequestration and EOR when gravity was neglected [
10]. Thus far, most studies on CO
2/oil flow behavior have focused on the core scale [
11,
12]. These efforts have been crucial for analyzing the multiphase seepage characteristics of oil and CO
2 in reservoir rocks (such as the reduction in oil-effective permeability) and for revealing the phase behavior of CO
2–oil mixtures [
13]. Jin et al. [
14] also discovered that CO
2, when it comes into contact with oil, combines with the oil’s light components, rendering them soluble, and subsequently permeates the oil. This interaction results in decreased oil viscosity and surface tension, improved oil flowability, and, ultimately, an increased recovery rate. Behnoud et al. [
15] noted that upon CO
2 injection into the reservoir, gaseous CO
2 comes into contact with liquid oil, forming a contact surface that generates a gas drive effect, thereby propelling the oil toward the production well. Ma et al. [
16] noted that for immiscible and near-miscible flooding, optimizing the CO
2 injection velocity is key. High velocity can accelerate oil recovery without reducing immiscible flooding efficiency, and low velocity can boost recovery under near-miscible conditions. Chen et al. [
17] noted that gravity segregation impacts CO
2 sequestration and oil production differently across flooding conditions, with significant effects under immiscible conditions but minimal influence under miscible conditions. Wang et al. [
18] noted that CO
2 miscible flooding reduces residual oil saturation to half of immiscible flooding through pre-breakthrough preferential displacement paths and post-breakthrough miscible zone expansion, and optimized WAG injection can elevate immiscible recovery to miscible levels. Su et al. [
19] proposed that in tight or low-permeability cores, CO
2–oil IFT reduction and CO
2 extraction play the most important role in CO
2 immiscible flooding.
Beyond conventional CO
2 flooding, CO
2-based technologies have also been investigated for other subsurface energy-extraction and reservoir-stimulation applications. In gas-hydrate reservoirs, CO
2 replacement can combine methane production with carbon sequestration, although its feasibility depends strongly on the bottom-hole temperature–pressure operating window and hydrate phase-equilibrium conditions [
20]. CO
2 fracturing represents another reservoir-stimulation approach for which the transport and sedimentation stability of solid particles are governed by fluid viscosity, flow conditions, reservoir temperature and pressure, and fracture-surface properties [
21]. These studies highlight the importance of reservoir-specific thermodynamic and transport conditions in CO
2-assisted subsurface energy recovery.
Although there have been some achievements in CO2 flooding, comprehensive quantitative research under diverse physical and geological conditions is still insufficient, and most existing studies are limited in scope. For special reservoirs like water-sensitive low permeability ones, the potential of CO2 flooding has not been fully explored. Most studies focus on single conditions like temperature and pressure, lacking analysis of various influencing factors and mechanism exploration, so they fail to reveal the dynamic phase evolution and stage-dominant mechanisms of CO2 flooding under multi-field coupling.
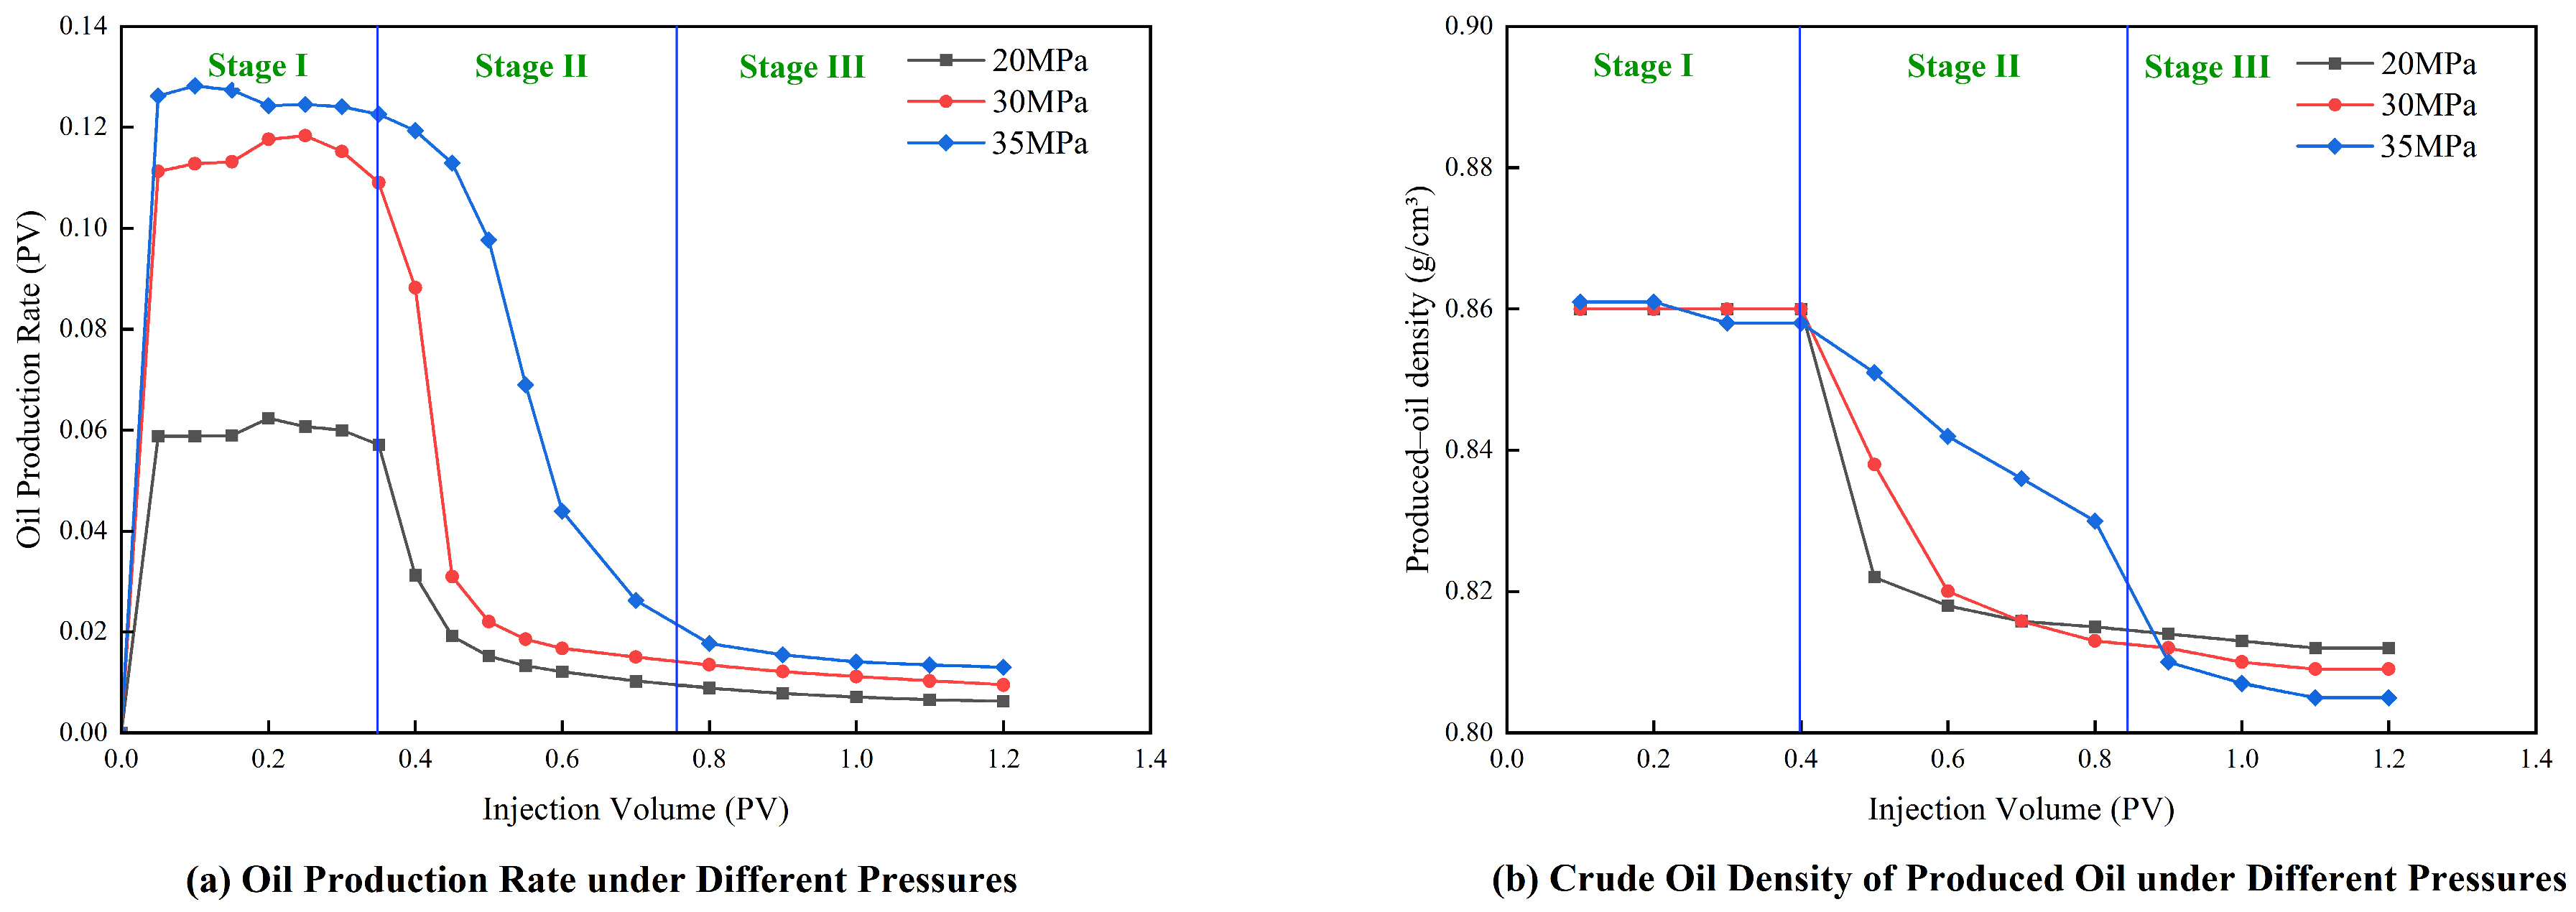
To address these problems, this study first investigated the pressure-dependent CO
2-flooding characteristics in Block A of eastern China and divided the displacement process into three stages. Single-factor experiments were then conducted to evaluate the key factors influencing CO
2 flooding in highly water-sensitive, low-permeability oil reservoirs, focusing on CO
2 injection pressure, initial water saturation, absolute permeability, and reservoir heterogeneity represented by the permeability ratio. Additionally, response surface methodology (RSM) was employed to quantify the interaction effects among these factors and determine the optimal combination of displacement parameters. This provides a mechanistic understanding and a benchmark for scheme design in CO
2-enhanced oil recovery (EOR) for similar reservoirs. RSM collects data based on the concept of Design of Experiments (DoE), identifies the factors and their interactions that significantly impact the process response, and constructs mathematical models that capture the causal relationships between factors and response variables. The method optimizes the causal model as the objective function, aiming to determine the optimal combination of factor levels within the planned range of experimental design through analysis of the regression equations [
22,
23]. This method has demonstrated significant effectiveness across various disciplines, including chemistry, biosciences, and food science [
24,
25]. In recent years, RSM has gradually gained favor in the field of oil and gas field development [
26].
2. Materials and Methods
The experimental program combined mineralogical and microscopic characterization, evaluation of water-sensitive permeability damage, high-temperature and high-pressure CO2 displacement tests, and response-surface optimization. Mineralogical composition was determined by X-ray diffraction (XRD) using a [DX-2700] diffractometer (Dandong Haoyuan Instrument Co., Ltd., Dandong, China). Pore morphology was examined by scanning electron microscopy (SEM) using a [KYKY-EM6200] microscope (KYKY Technology Co., Ltd., Beijing, China). These analyses characterized the mineralogical and pore-structural features associated with water sensitivity.
Water-sensitive permeability damage was evaluated using an [LD-3] core-flow testing apparatus (Haian Huada Petroleum Instrument Co., Ltd., Haian, China). The test quantified the hydraulic impairment caused by water–rock interaction. CO2 displacement tests were conducted on assembled long-core models under reservoir-representative temperature and pressure. A [DQ-1] core-flooding apparatus (Jiangsu Huaan Scientific Instrument Co., Ltd., Haian, China) was used for these tests.
Response-surface optimization was performed using Design-Expert version 8.0.6 (Stat-Ease, Inc., Minneapolis, MN, USA).
2.1. Reservoir Fluids and Core Samples
The experimental fluids and core models were selected according to the reservoir conditions of Block A in eastern China. The formation-water salinity is approximately 25,000 mg/L, the initial reservoir pressure is 36.8 MPa, and the reservoir temperature is 121.6 °C. The surface crude-oil density is 0.8550 g/cm3. At 50 °C, the crude-oil viscosity ranges from 12.10 to 38.74 mPa·s, with an average value of 21.5 mPa·s. The initial boiling point ranges from 115.3 to 167.7 °C and averages 143.6 °C. Formation water was used for core saturation and initial-water-saturation preparation, whereas commercially supplied CO2 was used as the displacement gas.
The CO
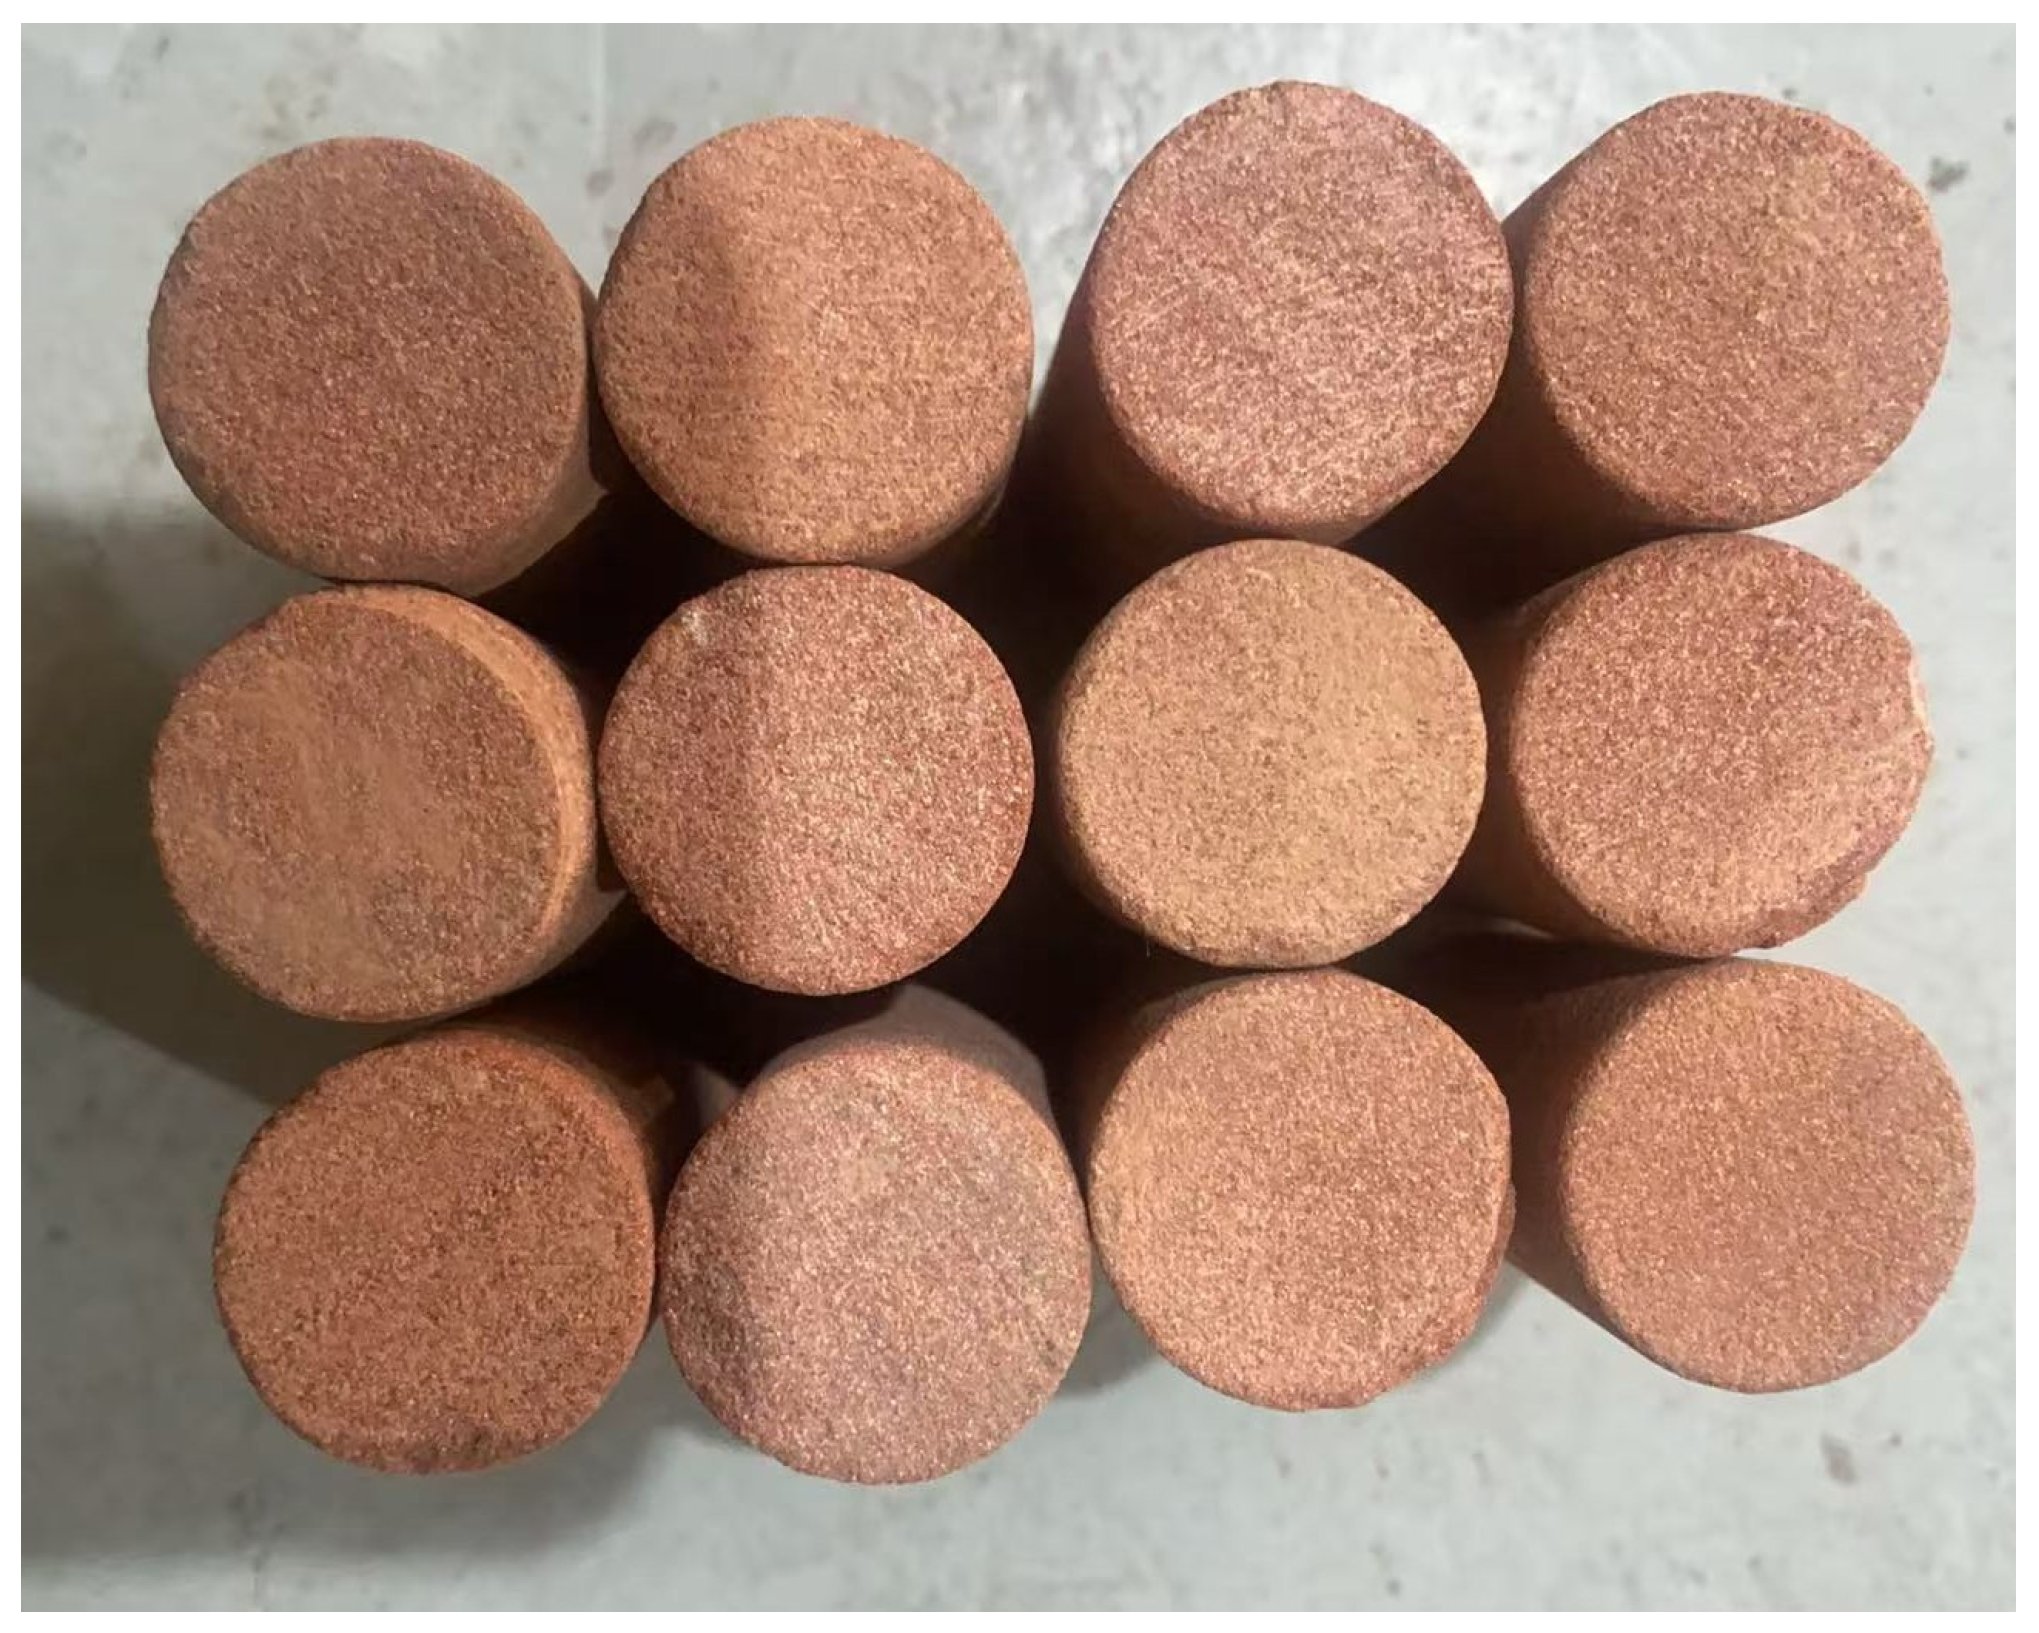
2-flooding models were assembled from four cylindrical short cores, each approximately 25 cm long, to produce a composite core approximately 100 cm in length and 4 cm in diameter. Homogeneous models were assembled from short cores with similar permeability, whereas heterogeneous models were assembled from two permeability classes. The permeability ratio was defined as the ratio of the higher permeability to the lower permeability in the composite model. Representative companion specimens from the same core-material batch were used for XRD, SEM, and water-sensitivity testing so that the mineralogical, microscopic, and displacement measurements described the same reservoir-rock system. Representative core segments used to assemble the long-core models are shown in
Figure 1.
2.2. Methods for Water-Sensitivity Characterization and Permeability-Damage Evaluation
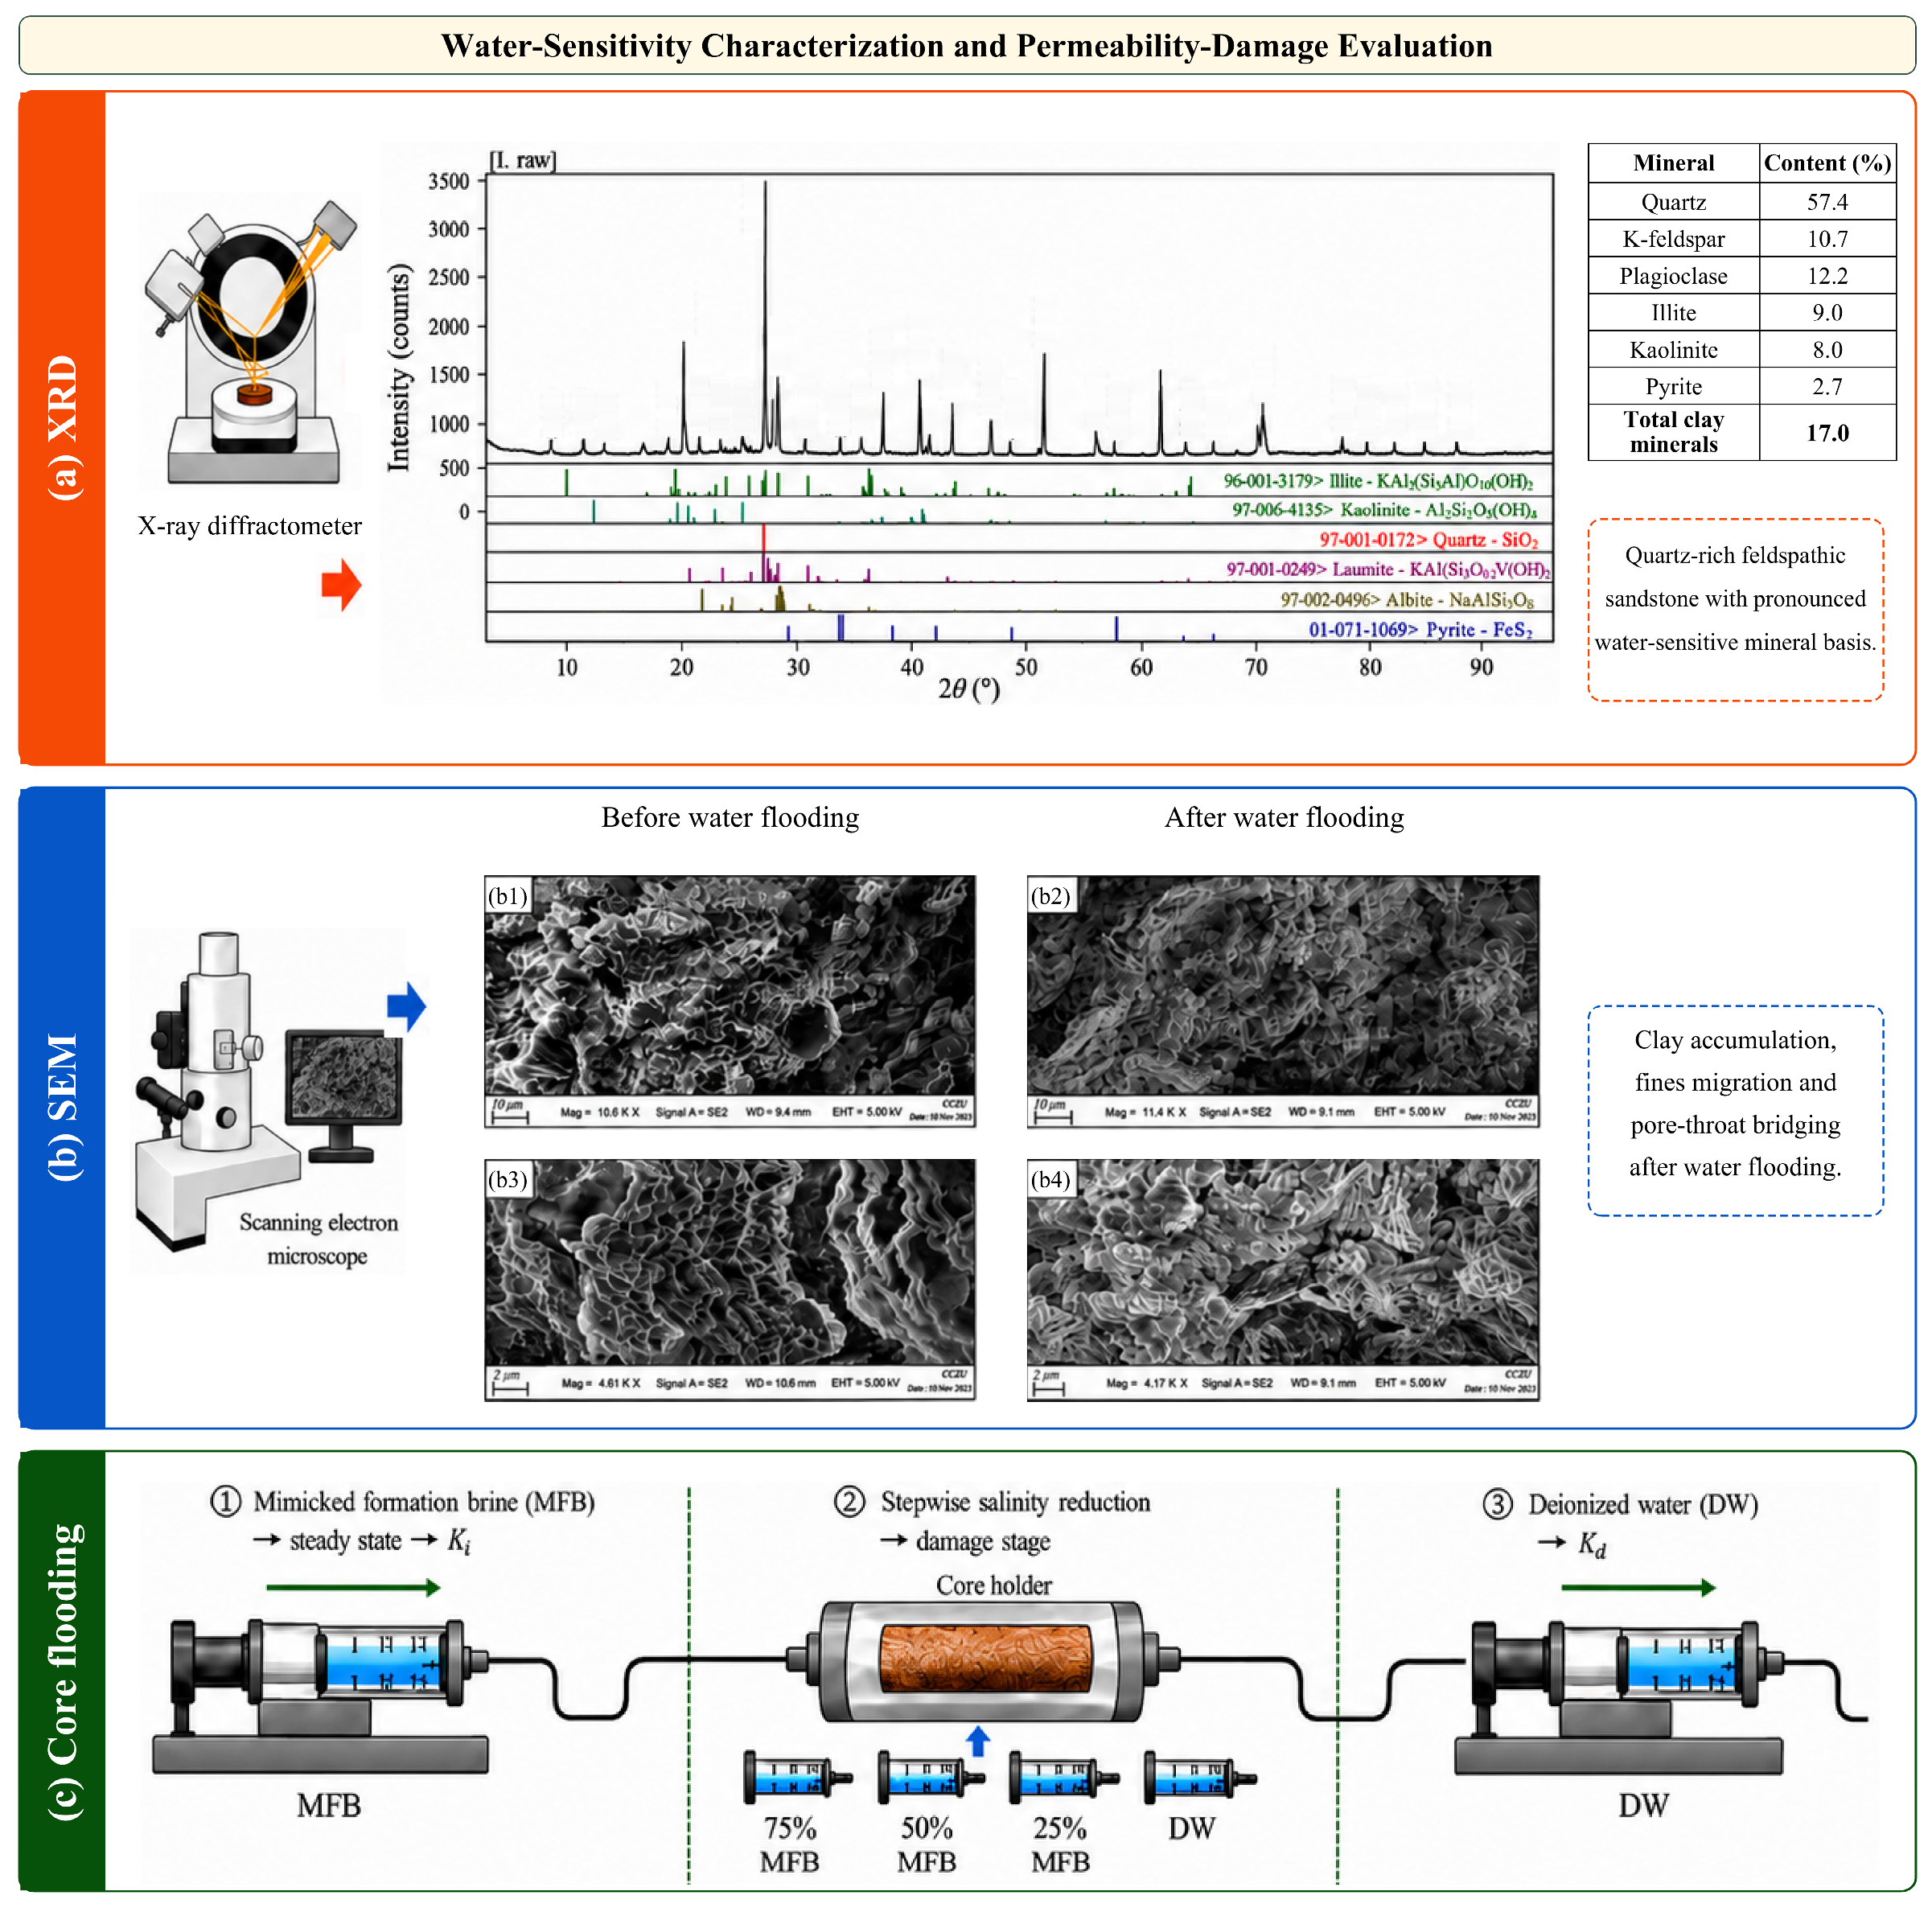
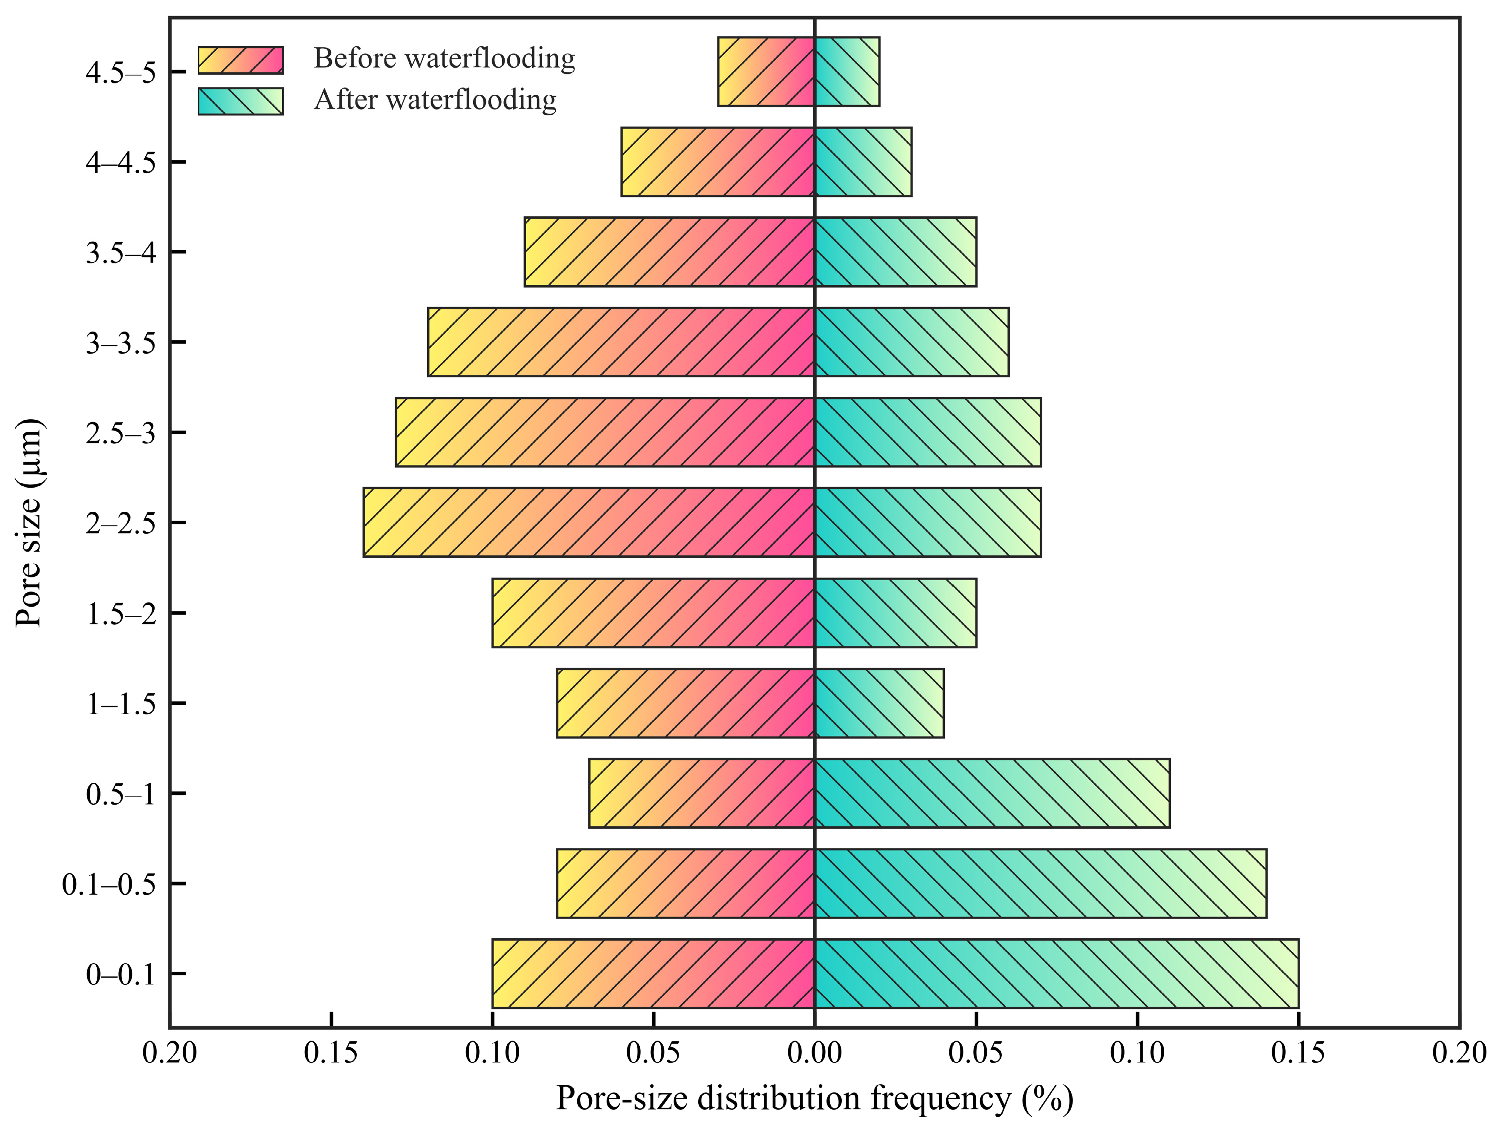
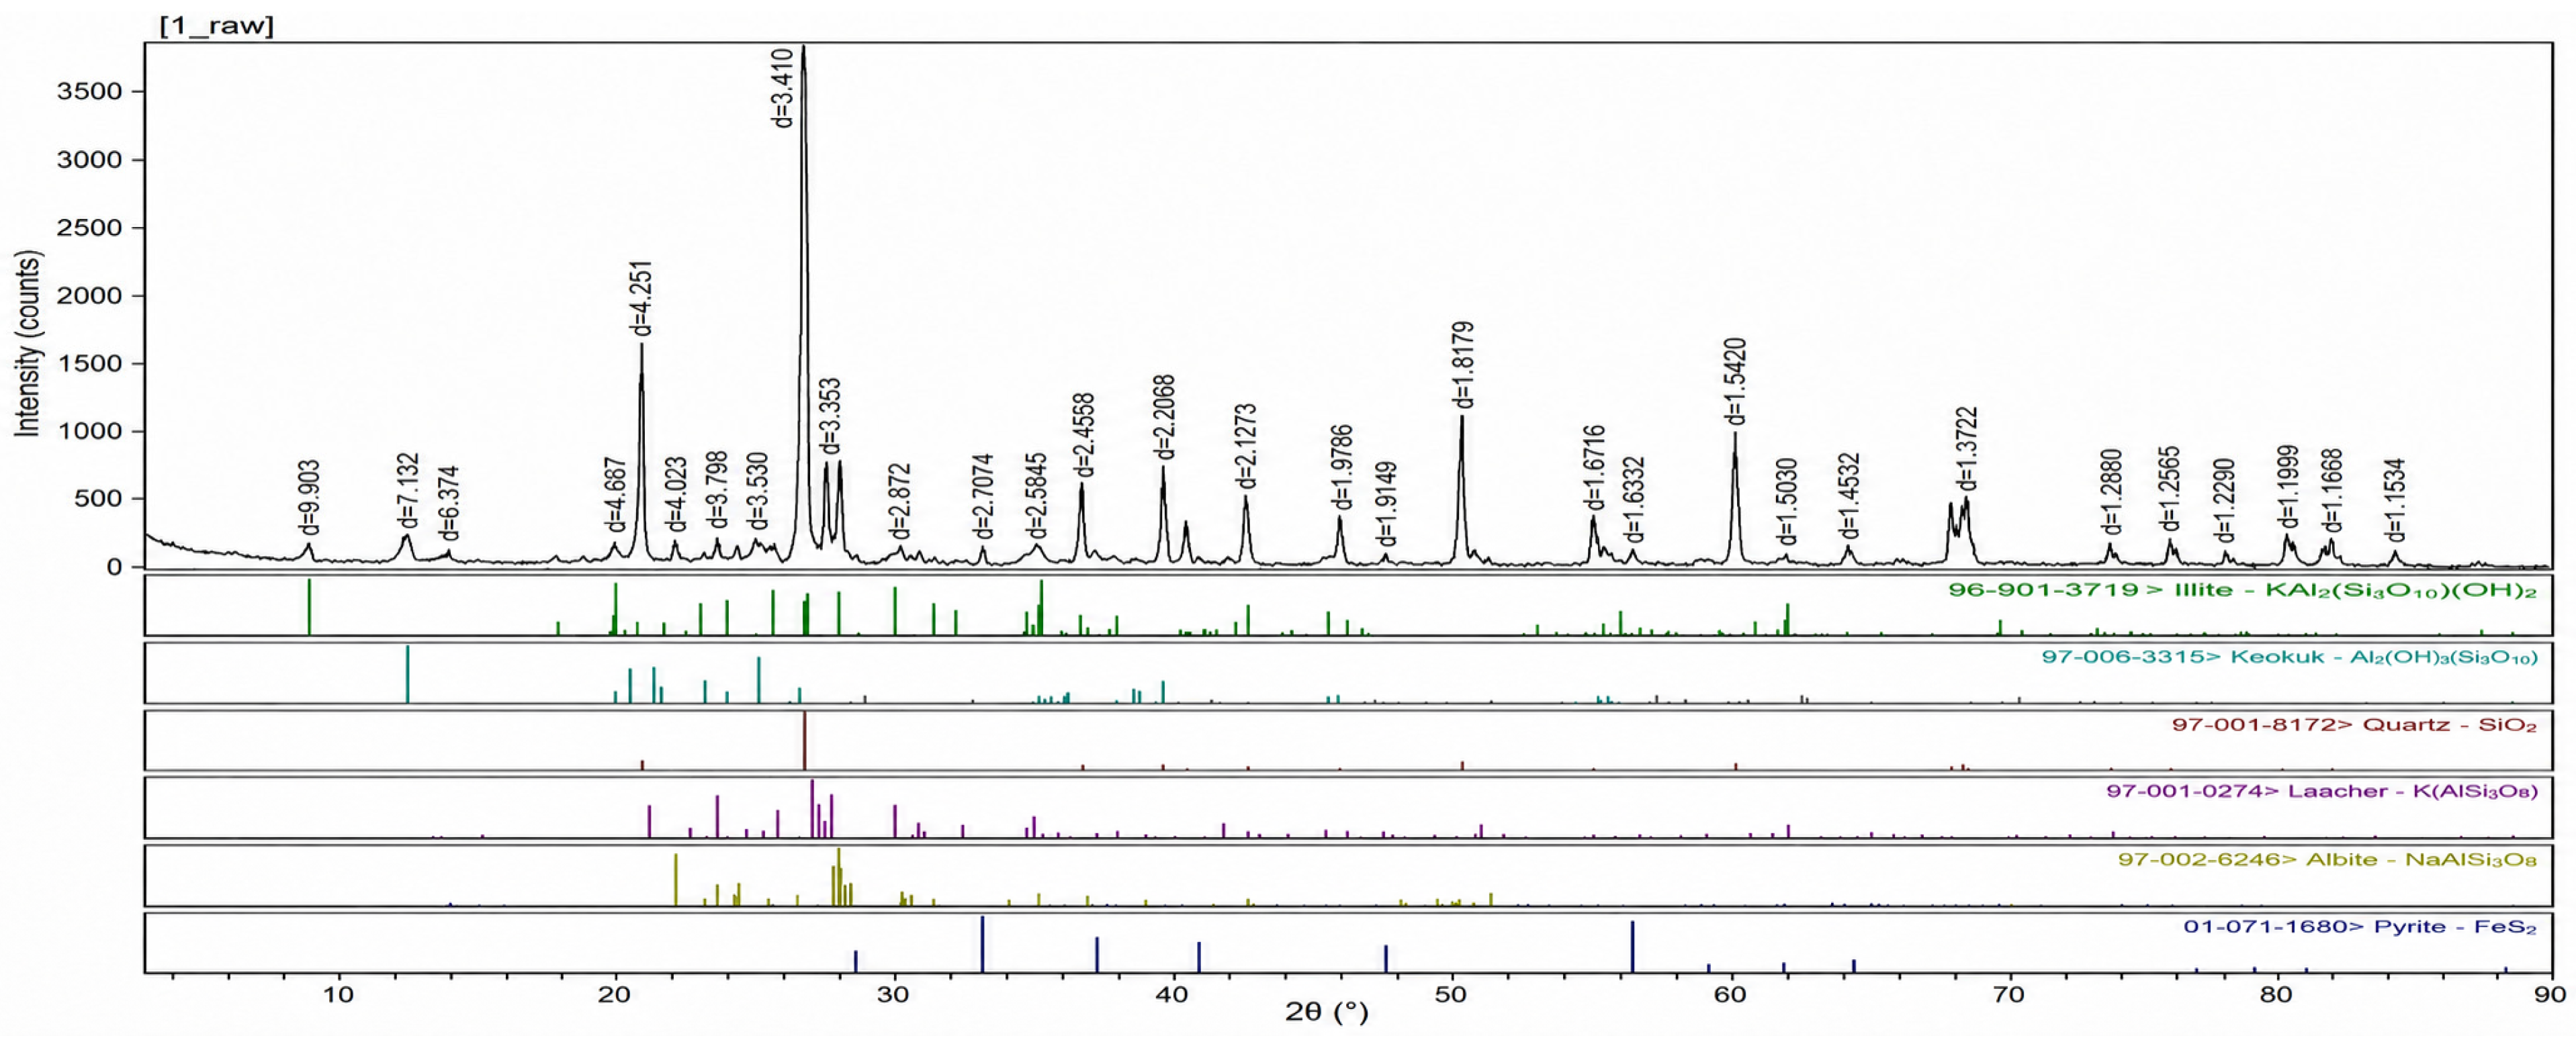
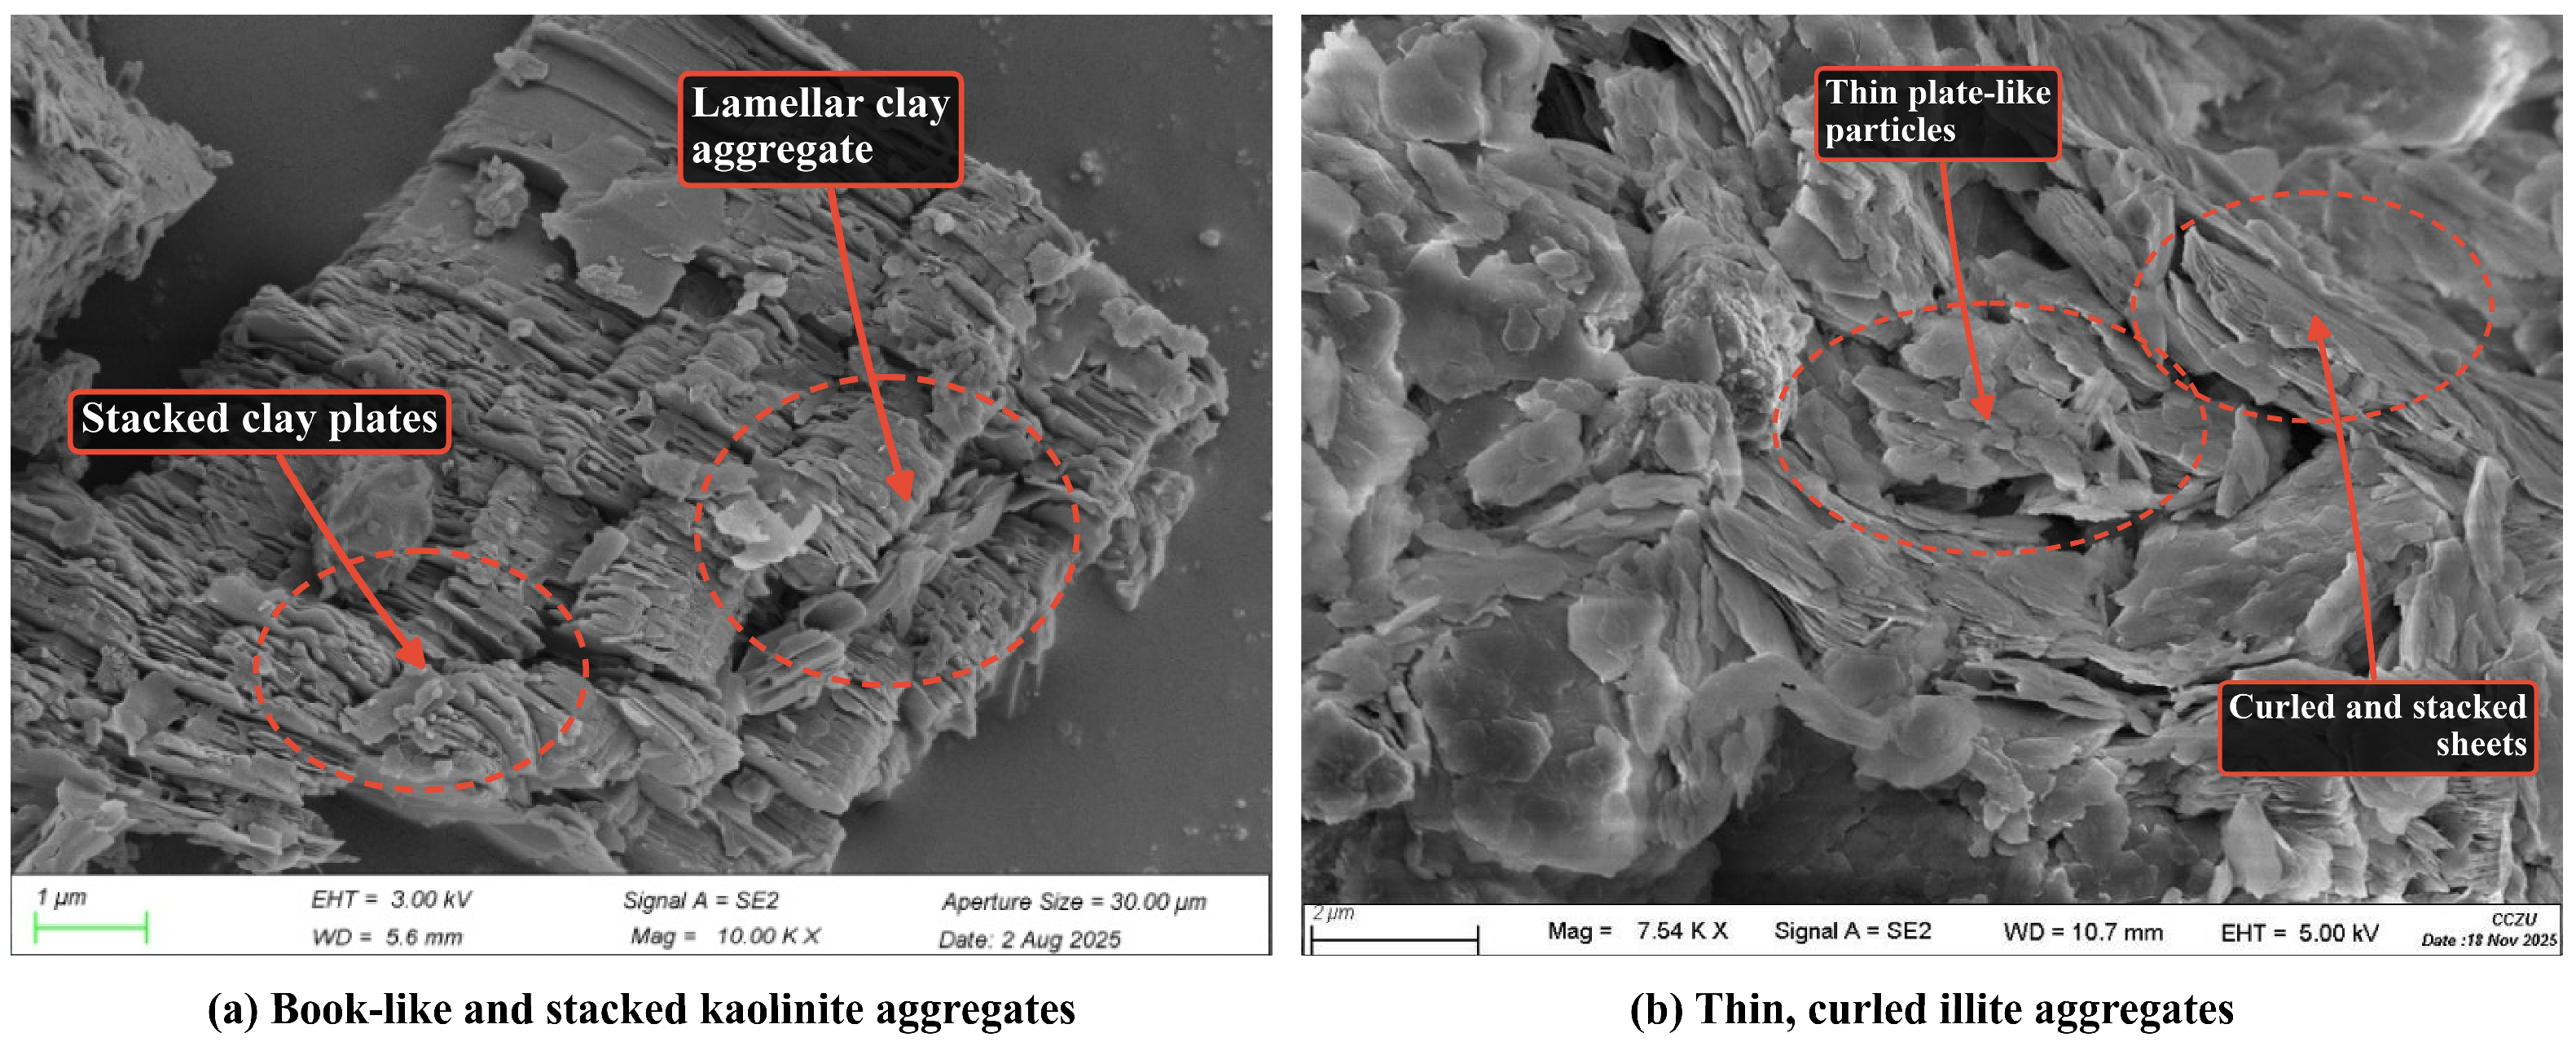
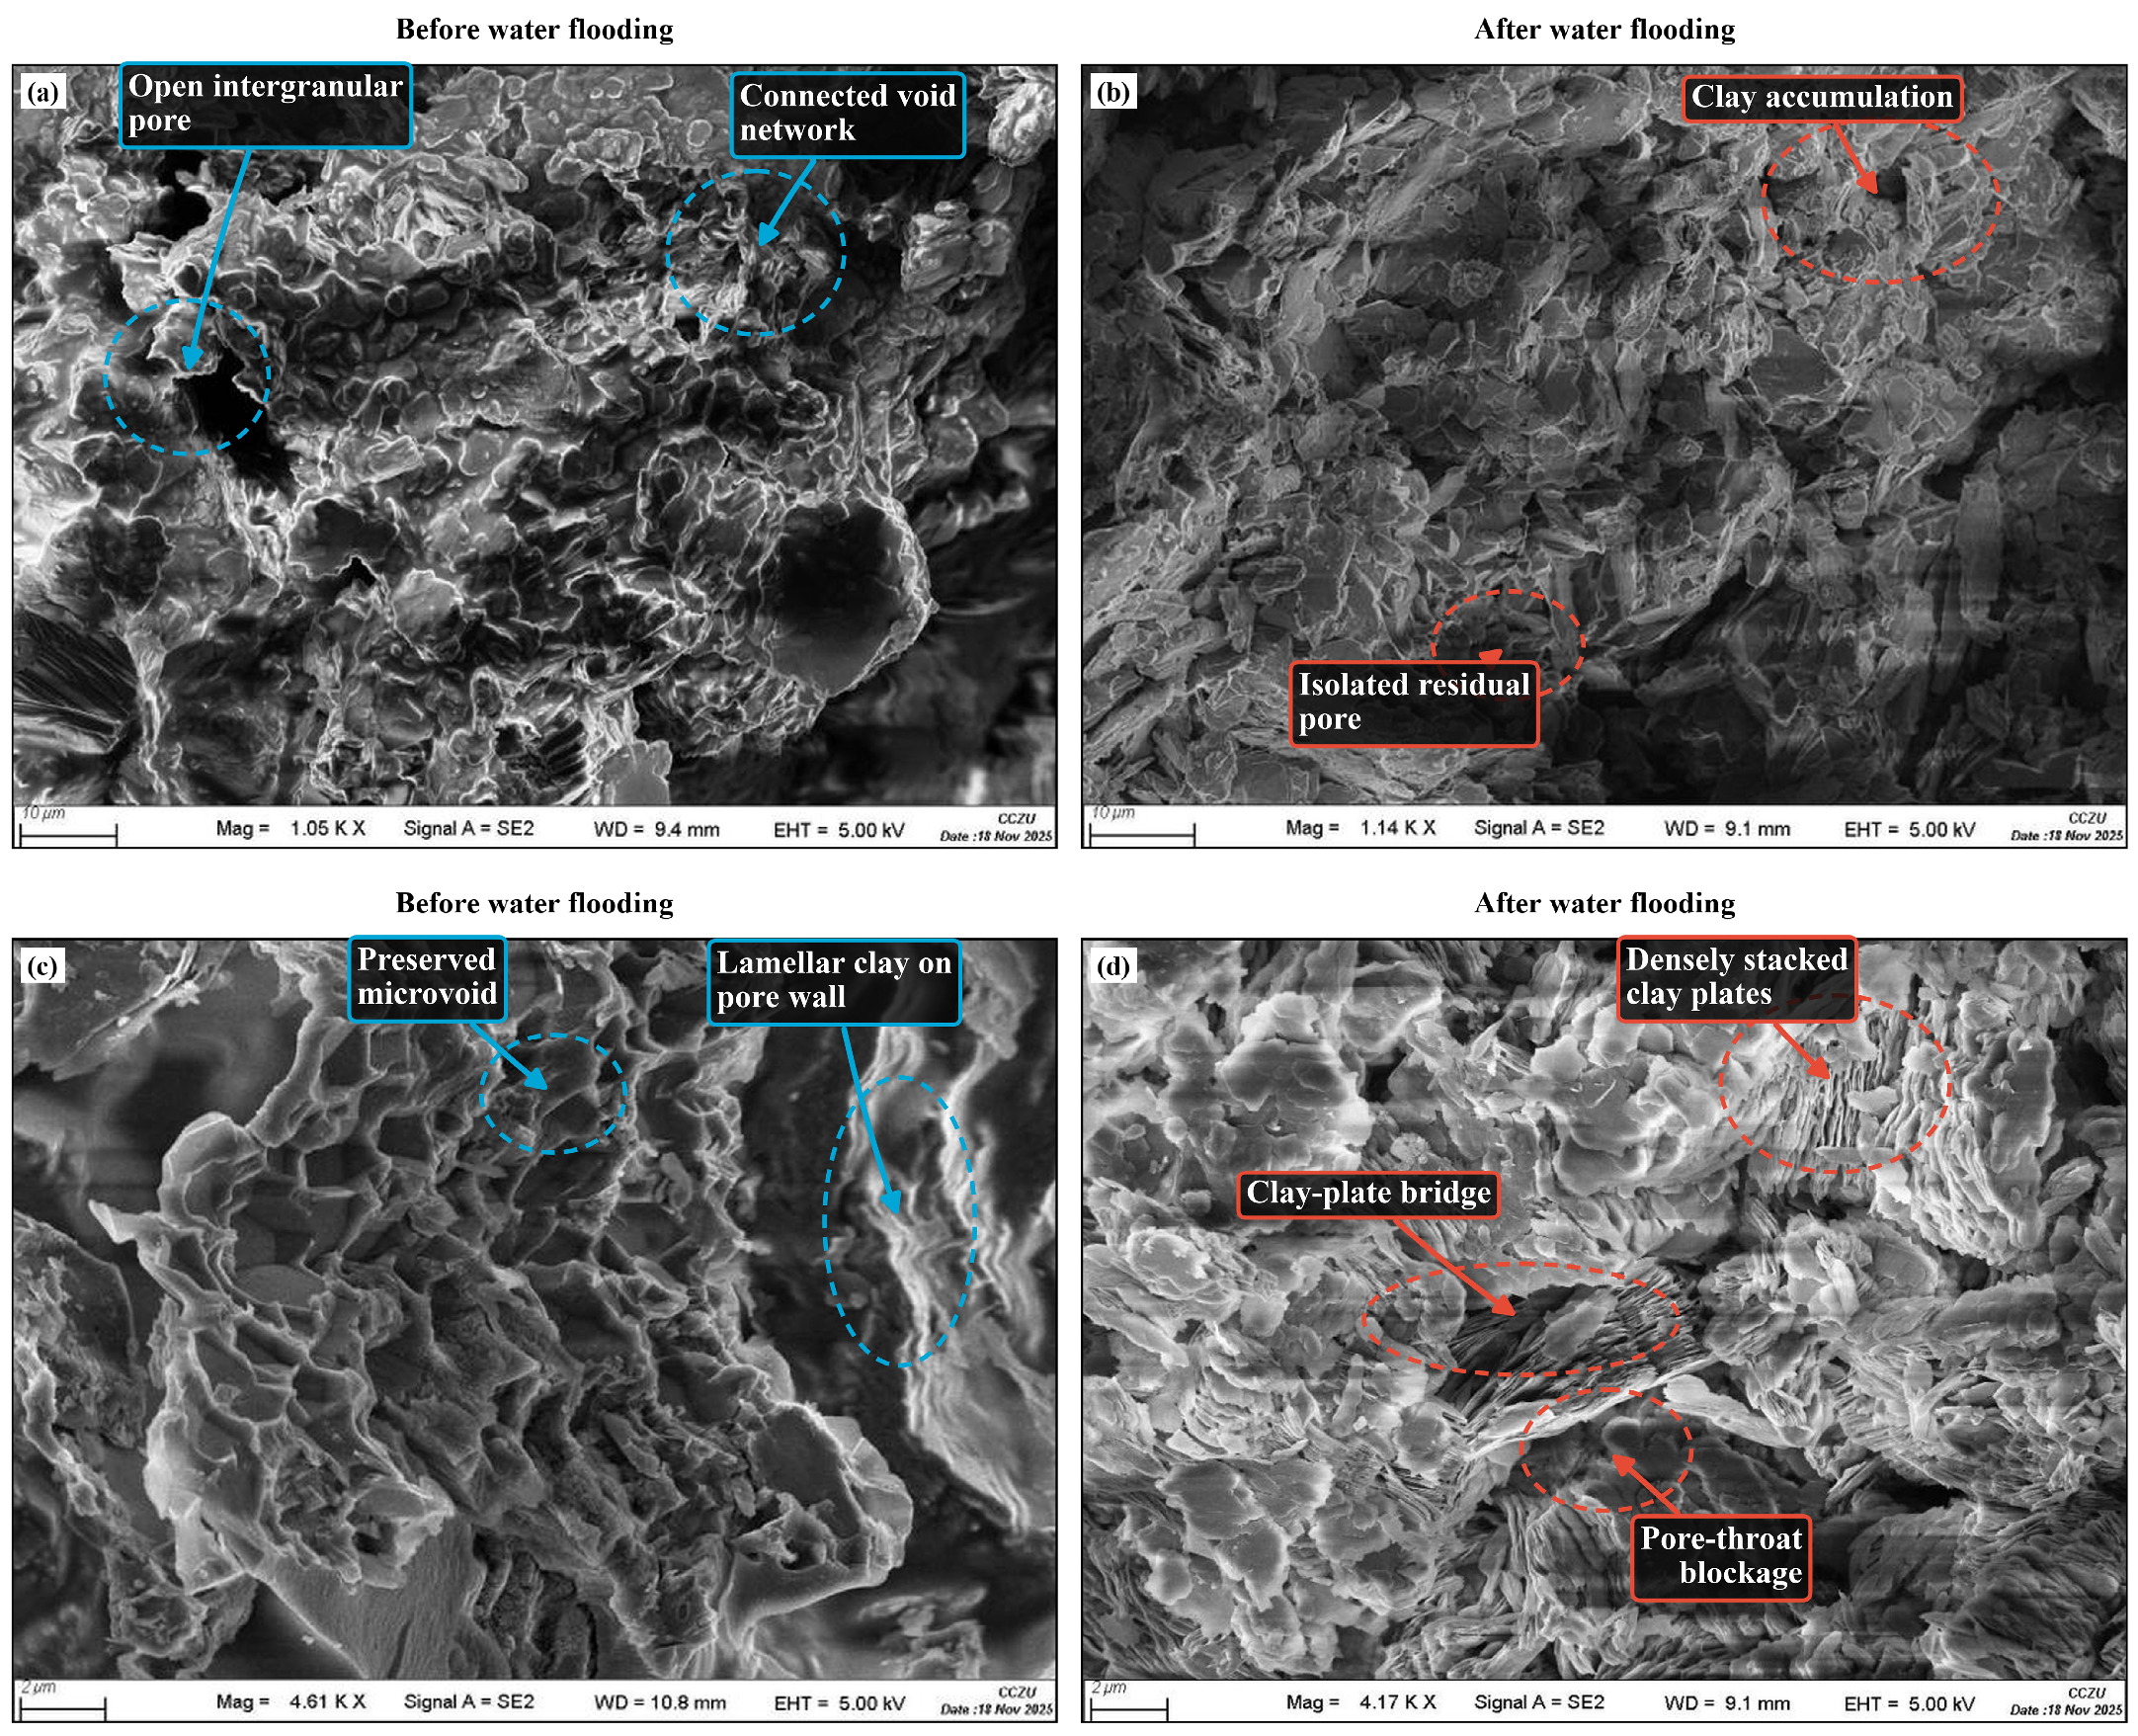
Water-sensitivity damage fundamentally arises from a sequence of clay hydration, dispersion, detachment, and migration upon contact with injected water, followed by particle retention, bridging, and plugging within micron-scale pore throats. The type and abundance of clay minerals, their modes of occurrence, and pore-throat connectivity are the key factors governing fines release and transport and the subsequent deterioration of seepage capacity. Quantitative mineralogical analysis by X-ray diffraction (XRD), comparative scanning electron microscopy (SEM) observations before and after water flooding, and pore-size redistribution analysis were therefore combined to reveal the mineralogical basis and pore-structural evolution of water-sensitivity damage. These observations were further integrated with permeability data to clarify how pore-scale throat plugging translates into a macroscopic loss of flow capacity [
27,
28,
29]. The overall experimental workflow is summarized in
Figure 2.
2.2.1. Mineralogical Characterization by X-Ray Diffraction (XRD)
Representative untreated core fragments were dried at 60 °C for 24 h and then crushed and ground to a particle size below 40 μm. The powdered sample was packed into a flat sample holder to minimize preferred orientation and was analyzed by powder XRD. Mineral phases were identified by matching the measured diffraction-peak positions with standard reference patterns. The relative contents of quartz, feldspars, clay minerals, and accessory minerals were calculated from the integrated diffraction intensities using the quantitative phase-analysis program of the diffractometer. Particular attention was given to illite and kaolinite because their hydration, detachment, and migration directly control water-sensitive pore-throat damage in low-permeability sandstone.
2.2.2. Scanning Electron Microscopy (SEM) Characterization of Pore Structure
Paired companion fragments were prepared from the untreated core material and from the core after the water-sensitivity flooding test. The specimens were dried at 60 °C to constant mass, gently fractured to expose fresh surfaces, mounted on conductive stubs, and coated with a thin conductive layer before observation. Secondary electron images were acquired at an accelerating voltage of 3–5 kV and a working distance of approximately 8–11 mm. Low- and high-magnification fields were selected at comparable observation scales to characterize grain contacts, intergranular pores, clay coatings, lamellar aggregates, fine-particle detachment, bridging, and pore-throat filling.
2.2.3. Water-Sensitivity Permeability-Damage Test
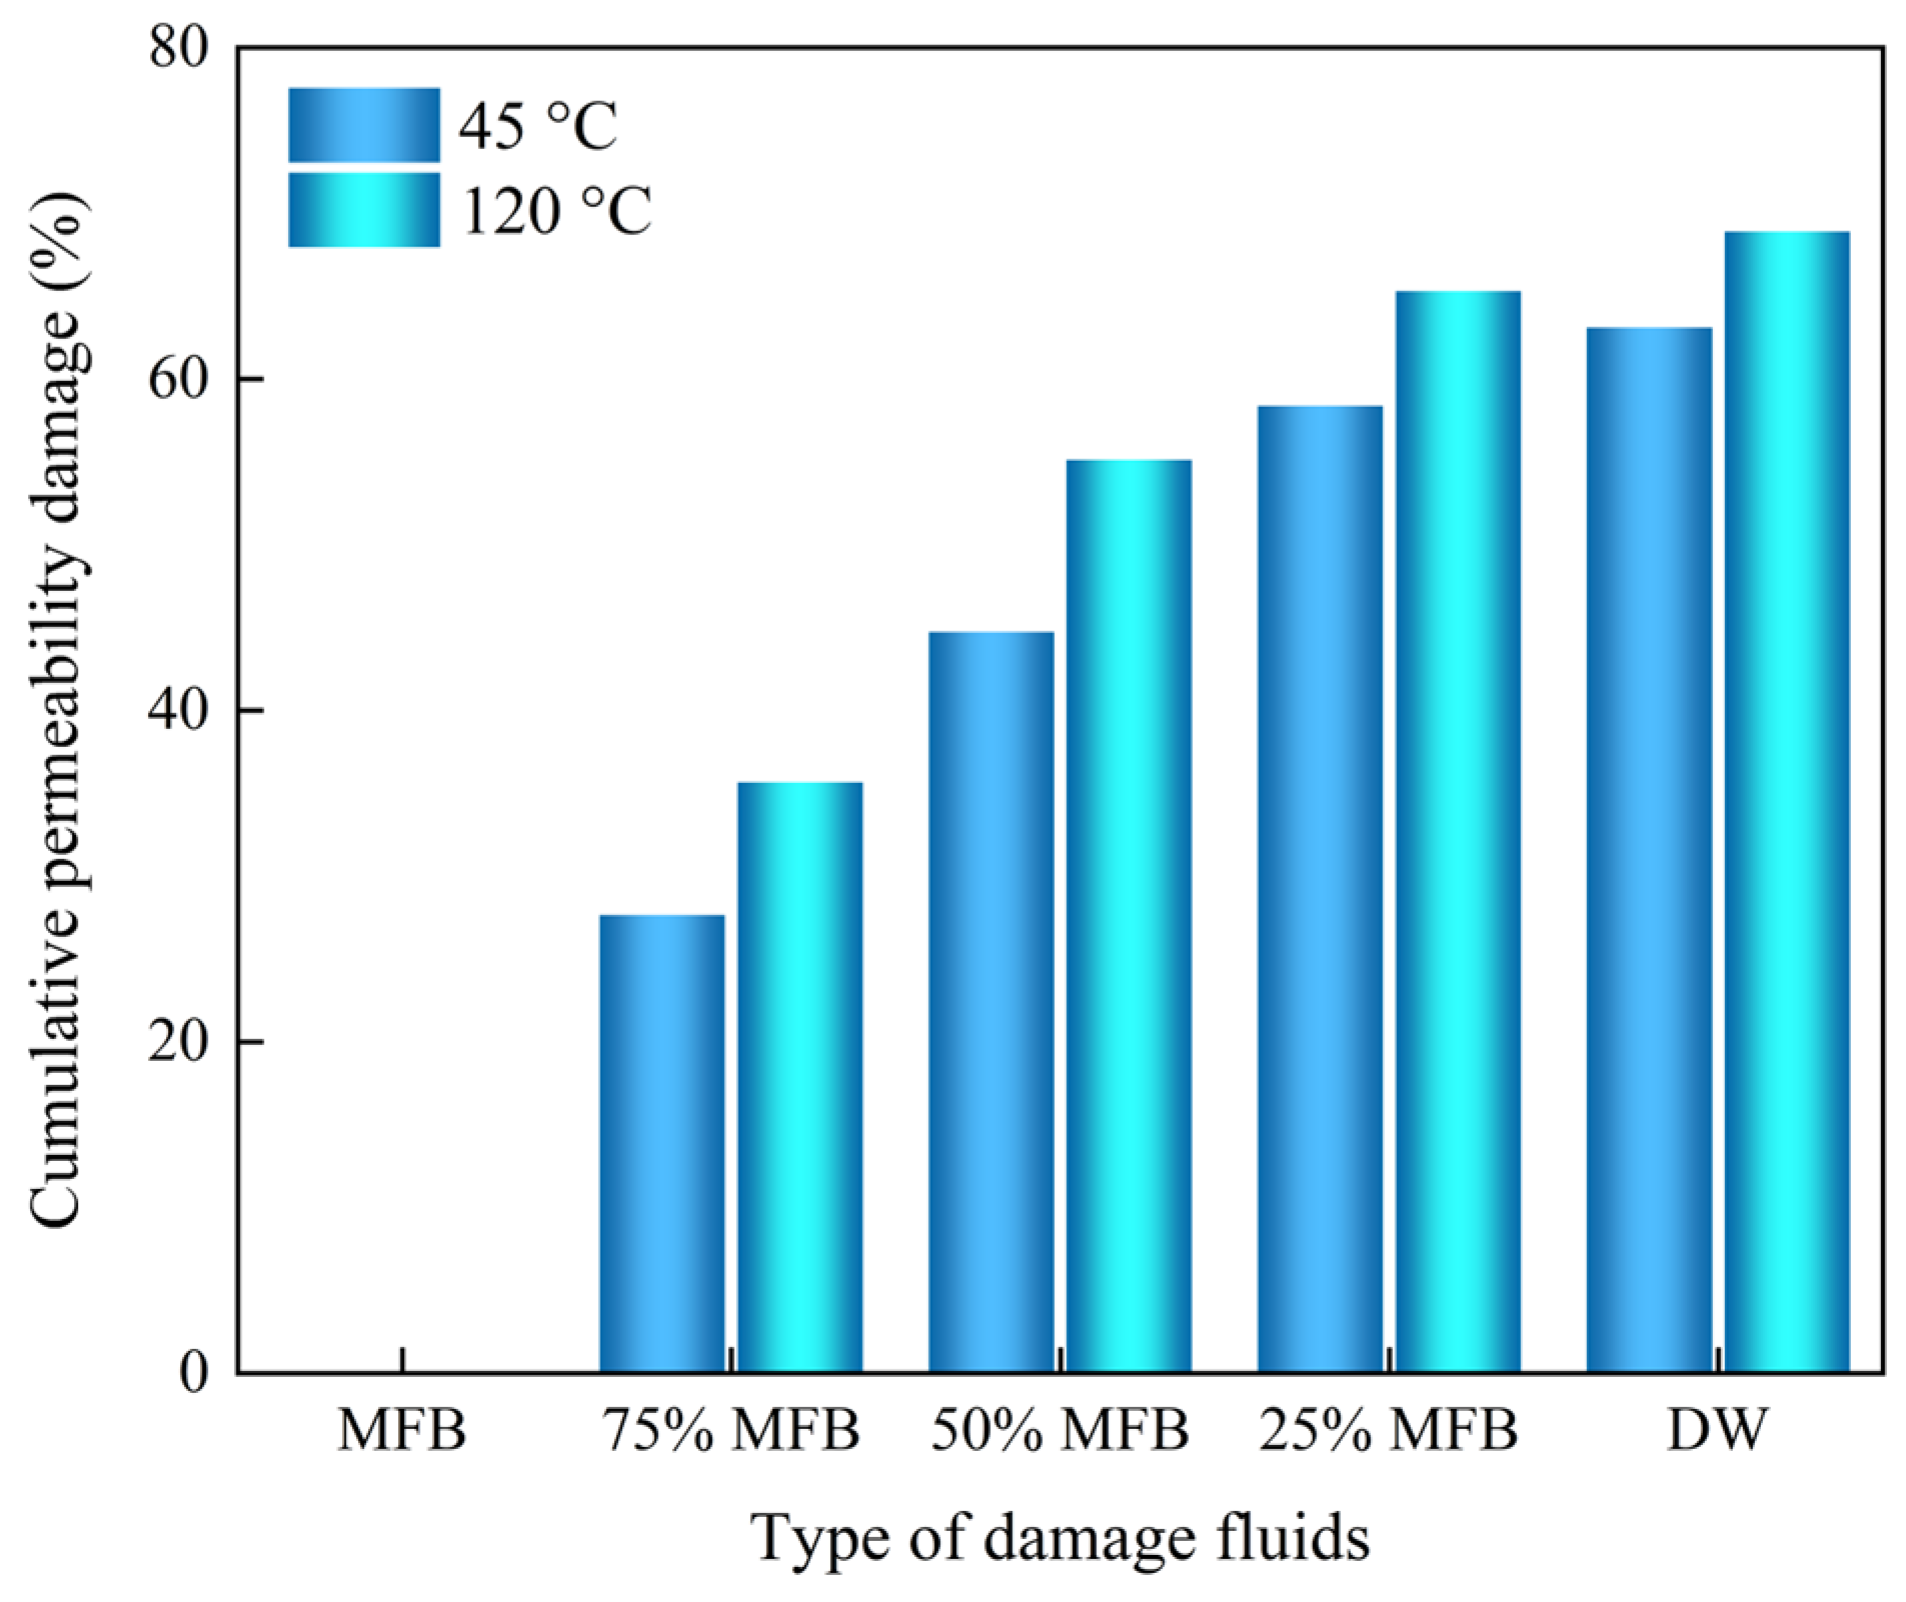
Independent natural core plugs were used for the water-sensitivity tests at 45 and 120 °C. After solvent cleaning, drying at 60 °C, and dimensional measurement, each core plug was mounted in a core holder, evacuated for 5 h, and fully saturated with mimicked formation brine (MFB) with a salinity of approximately 25,000 mg/L. The core holder was then maintained at the target test temperature until thermal equilibrium was reached. Under both temperature conditions, the confining pressure was maintained at least 3 MPa above the inlet pressure, and the MFB was initially injected at a constant flow rate of 0.15 mL/min until the pressure drop across the core varied by less than 1% over a continuous 30 min period. The initial water-phase permeability, Ki, was calculated from the stabilized pressure drop. Subsequently, under the same temperature, confining-pressure, and flow-rate conditions, the injected-fluid salinity was reduced stepwise following the sequence MFB, 75% MFB, 50% MFB, 25% MFB, deionized water (
). At each salinity stage, injection was continued until the pressure drop restabilized, after which the corresponding water-phase permeability,
, was calculated. The final stabilized permeability measured during DW injection was defined as the damaged permeability,
. The inlet pressure, outlet pressure, and pressure drop across the core were continuously monitored and recorded throughout the experiment [
30].
where
is the water permeability (mD),
is the fluid viscosity (mPa·s),
is the volumetric flow rate (mL/min),
is the core length (cm),
is the core cross-sectional area (cm
2), and
is the stabilized pressure difference across the core (MPa). The water-sensitivity permeability-damage degree was calculated as follows:
where
is the permeability-damage degree (%),
is the initial permeability measured with MFB, and
is the stabilized permeability measured during the final DW stage. The fluid viscosity corresponding to each injection stage was used in Equation (1); therefore, the calculated permeability change primarily reflects the reduction in core flow capacity caused by clay hydration, fines migration, and pore-throat blockage.
2.3. CO2-Flooding Apparatus and Experimental Conditions
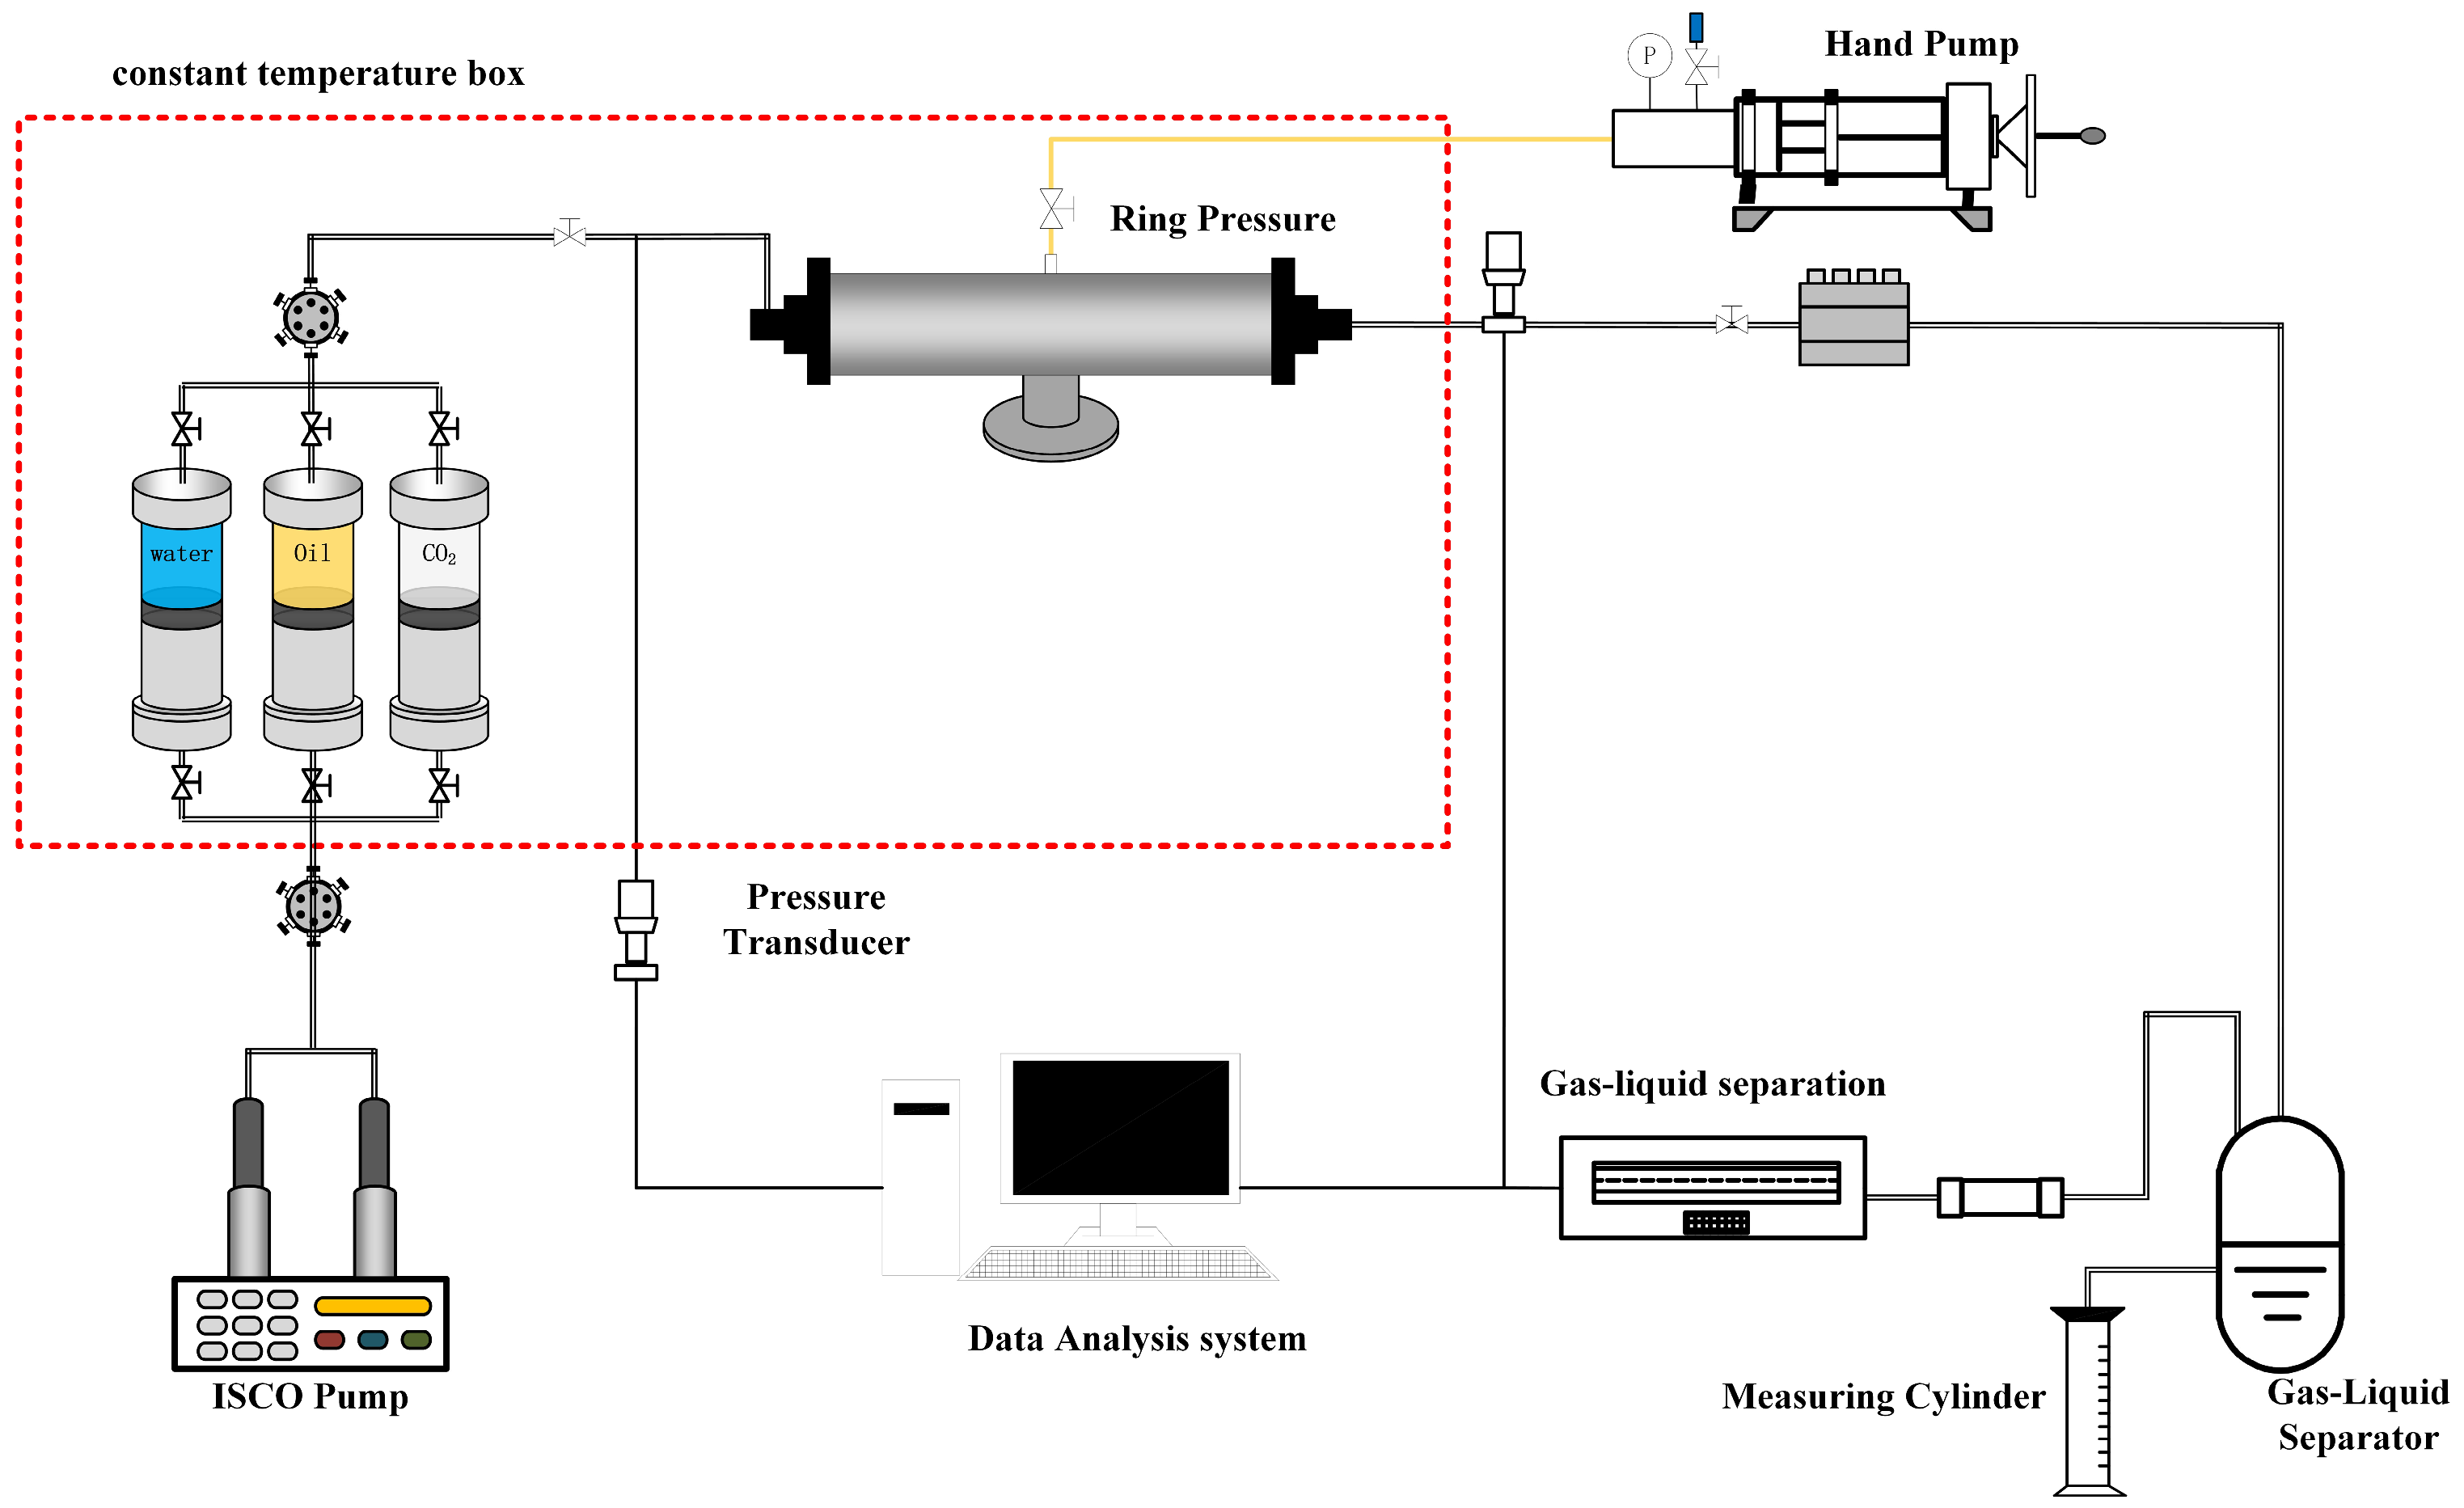
The high-temperature and high-pressure CO
2-flooding system consisted of an injection unit, a long-core displacement unit, a backpressure-control unit, a pressure-monitoring unit, a gas-acquisition unit, and a temperature-control unit (
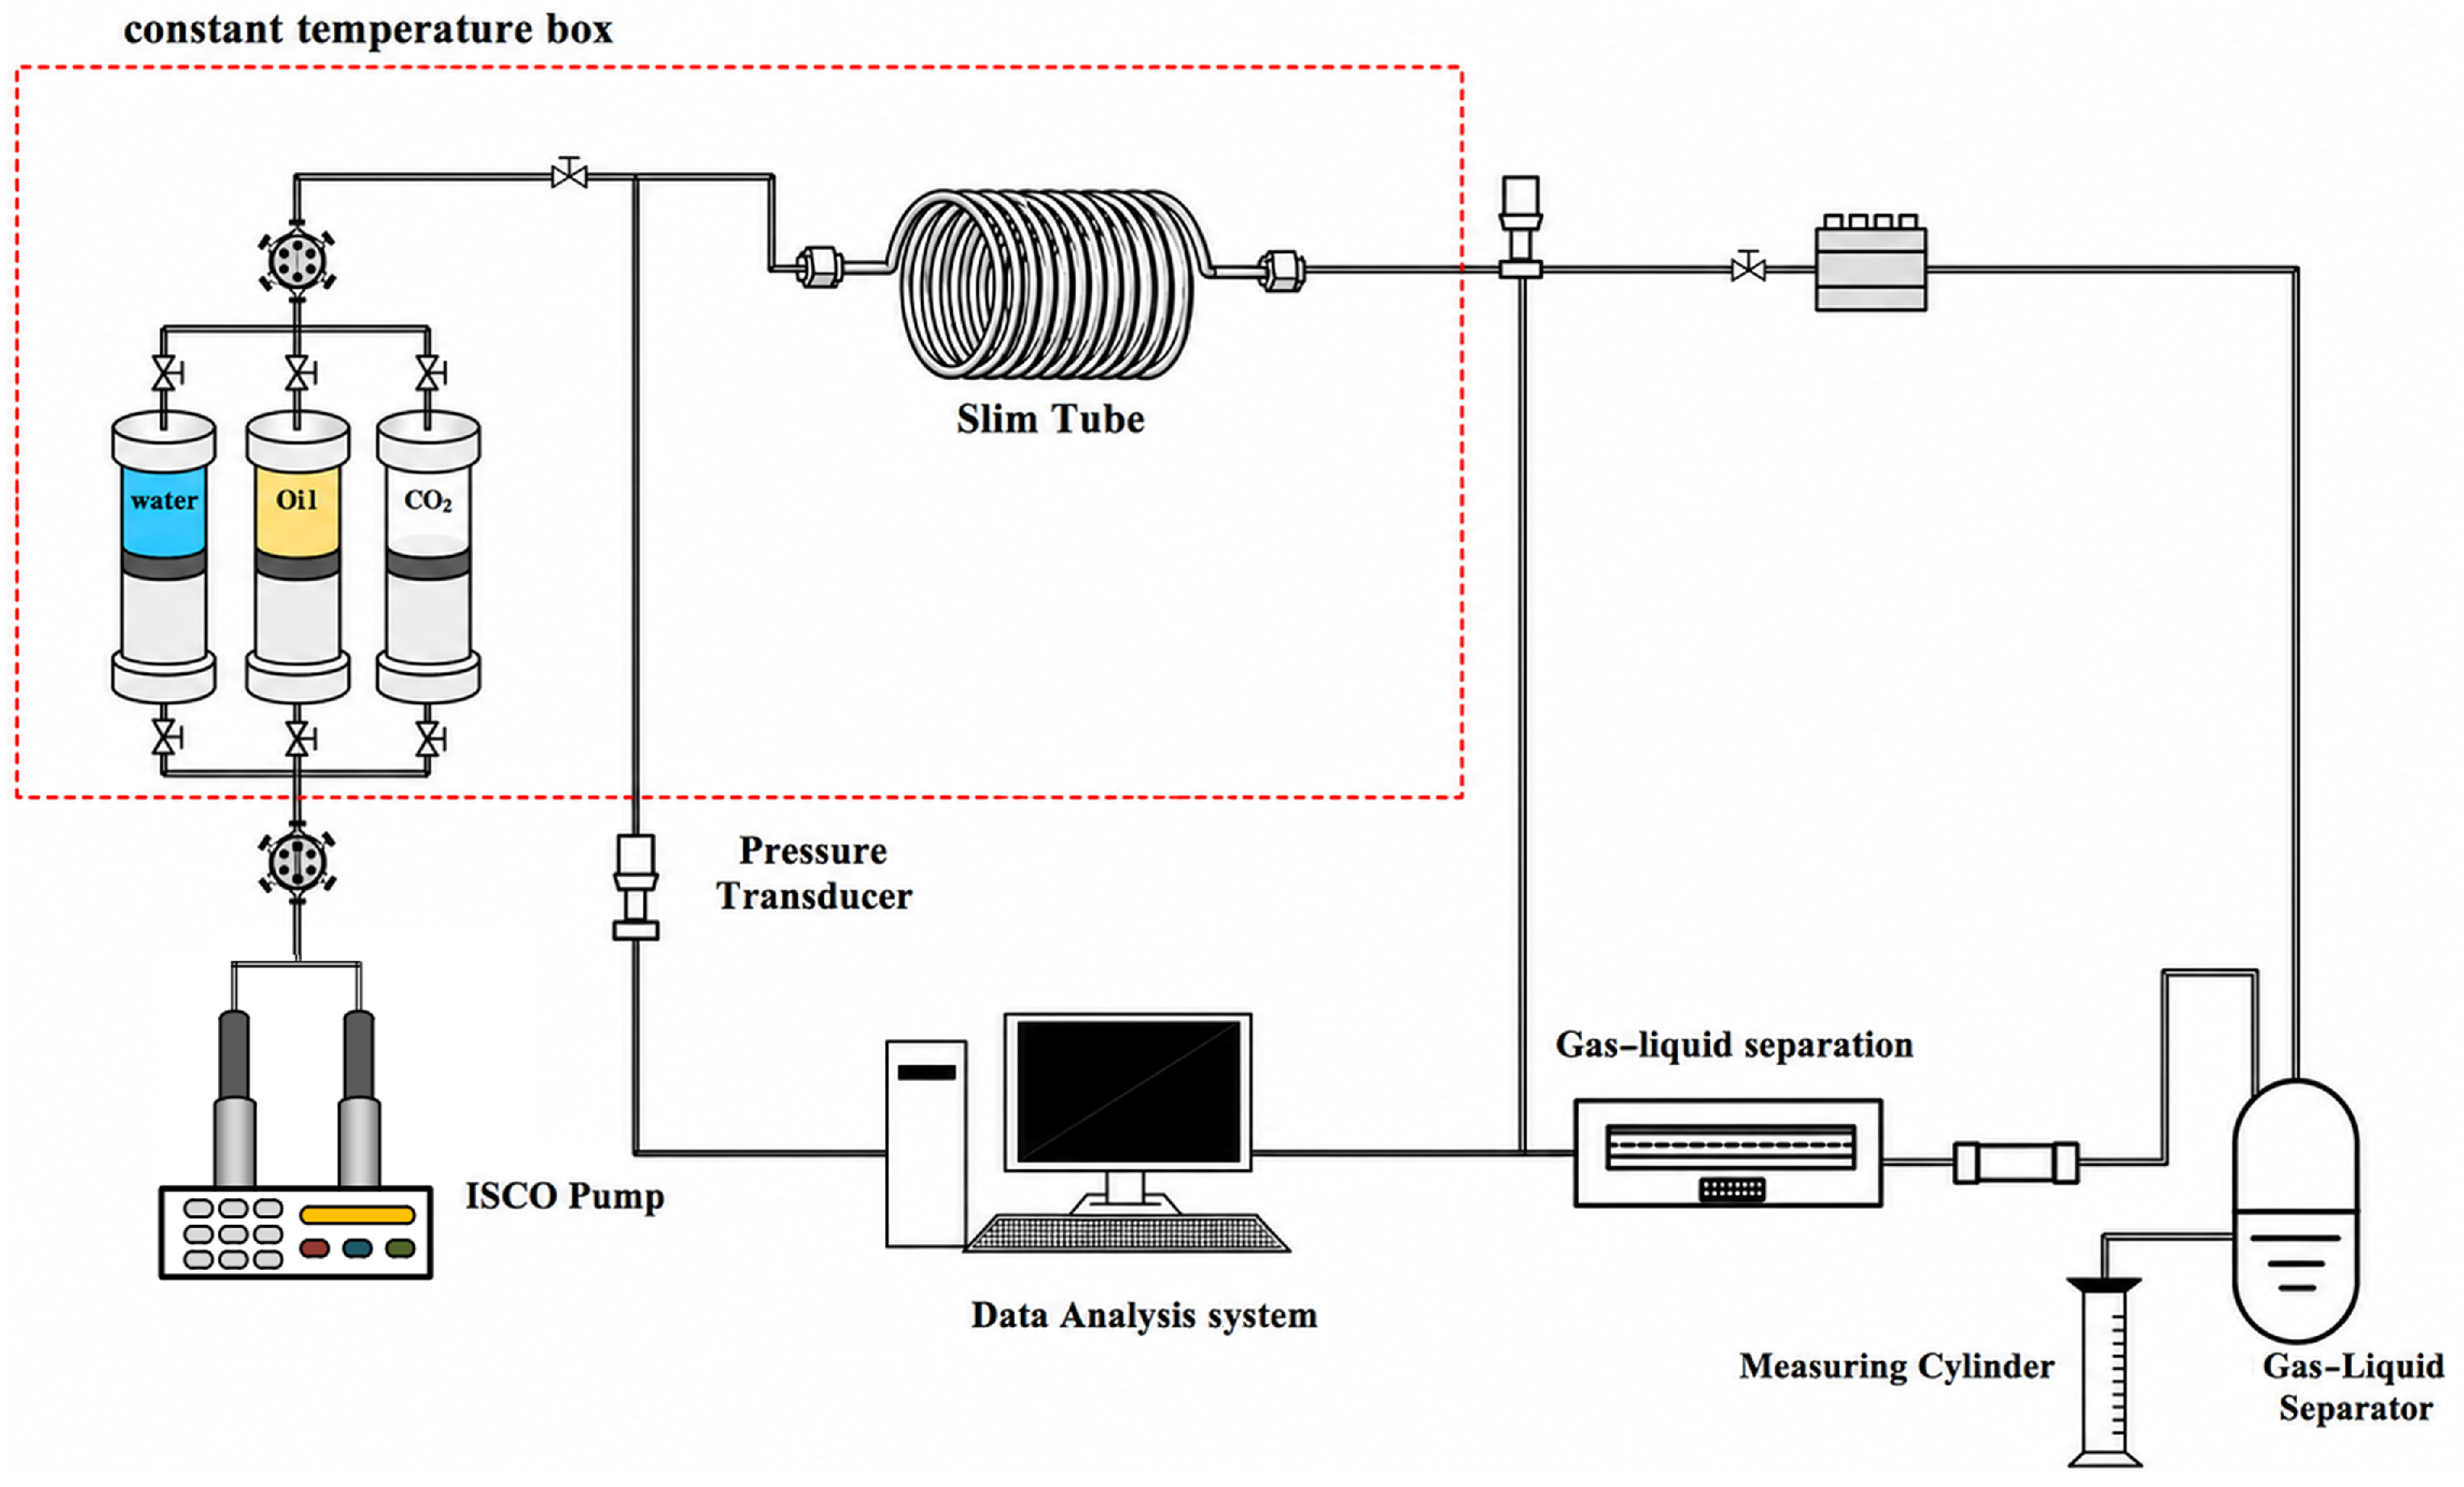
Figure 3). The injection unit comprised an ISCO pump and intermediate fluid containers. The pump provided a flow-rate resolution of 0.01 mL/min and a maximum working pressure of 120 MPa. The long-core holder was rated to 200 °C and 60 MPa. The outlet pressure was controlled using a backpressure valve, and the inlet pressure, outlet pressure, and core differential pressure were recorded continuously by pressure transducers connected to the data-acquisition system. The produced fluids were separated in a gas–liquid separator; the liquid volume, gas volume, gas–oil ratio, and produced-oil density were measured during displacement. The core holder and fluid containers were maintained in a constant-temperature oven.
2.4. CO2-Flooding Experimental Procedures
2.4.1. Baseline CO2-Flooding Experiment
- (1)
Four 25 cm short cores were assembled into a composite long core of approximately 100 cm. The length and cross-sectional area were measured, and the apparent core volume was calculated. The assembled model was installed in the core holder and evacuated for 5 h.
- (2)
Formation water was introduced under vacuum until the core was fully saturated. The pore volume was determined from the saturated-water volume, and the absolute permeability was measured under steady flow. Crude oil was then injected at 1.0 mL/min to displace formation water. Oil injection was continued until the produced water volume reached the value required for the target initial water saturation and no further water was produced. The initial oil saturation was calculated from the pore volume and the retained water volume.
- (3)
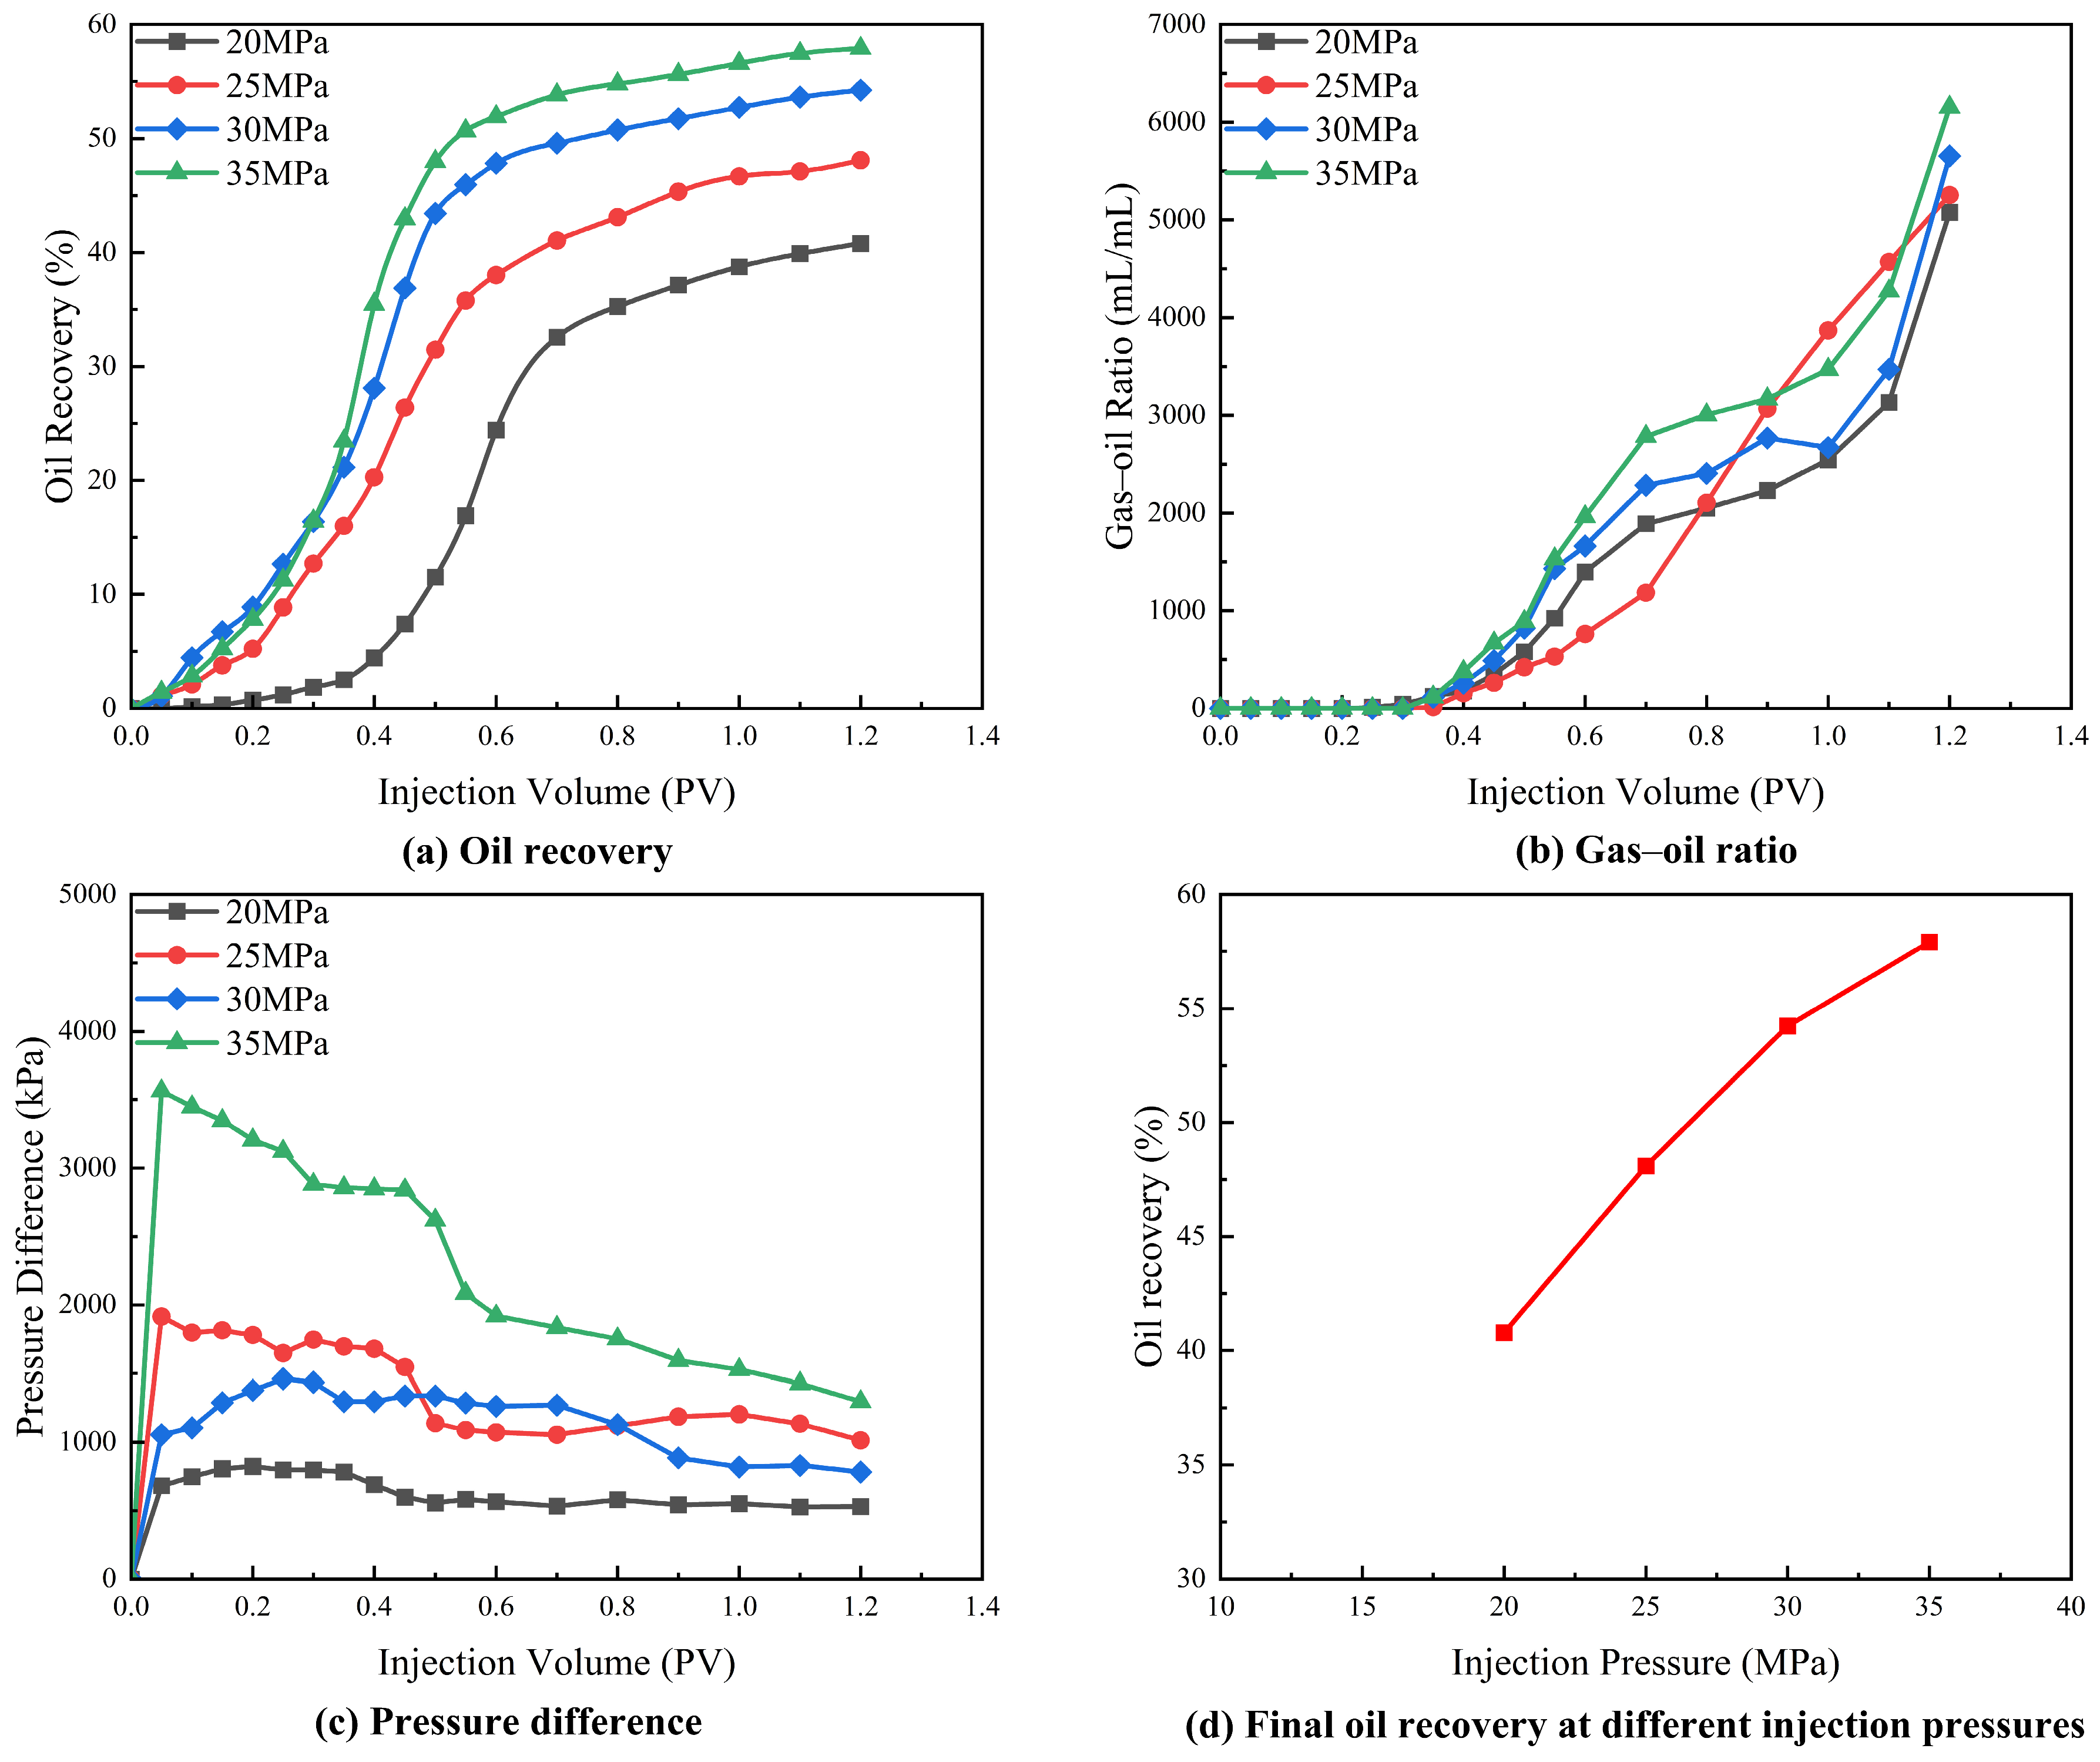
The core holder was heated to 120 °C and maintained at this temperature until thermal equilibrium was reached. To investigate the effect of pressure on CO2 flooding performance, the system displacement pressure was set to 20, 25, 30, and 35 MPa by adjusting the outlet backpressure valve. After pressure stabilization, CO2 was injected at 0.5 mL/min. The injected pore volume, oil production, gas production, pump reading, inlet pressure, outlet pressure, differential pressure, gas–oil ratio, and produced-oil density were recorded at every 0.1 PV of cumulative CO2 injection.
- (4)
The experiment was terminated when the produced gas–oil ratio exceeded 5000 mL/mL, cumulative oil production exceeded 90%, or no additional oil was produced. The apparatus was then depressurized, cleaned, and prepared for the next run.
The cumulative oil-recovery factor was calculated from the produced oil volume and the initial oil volume in the core:
where
is the cumulative oil-recovery factor (%),
is the cumulative produced-oil volume (mL),
is the pore volume of the long-core model (mL), and
is the initial oil saturation.
2.4.2. Single-Factor Comparative CO2-Flooding Experiments
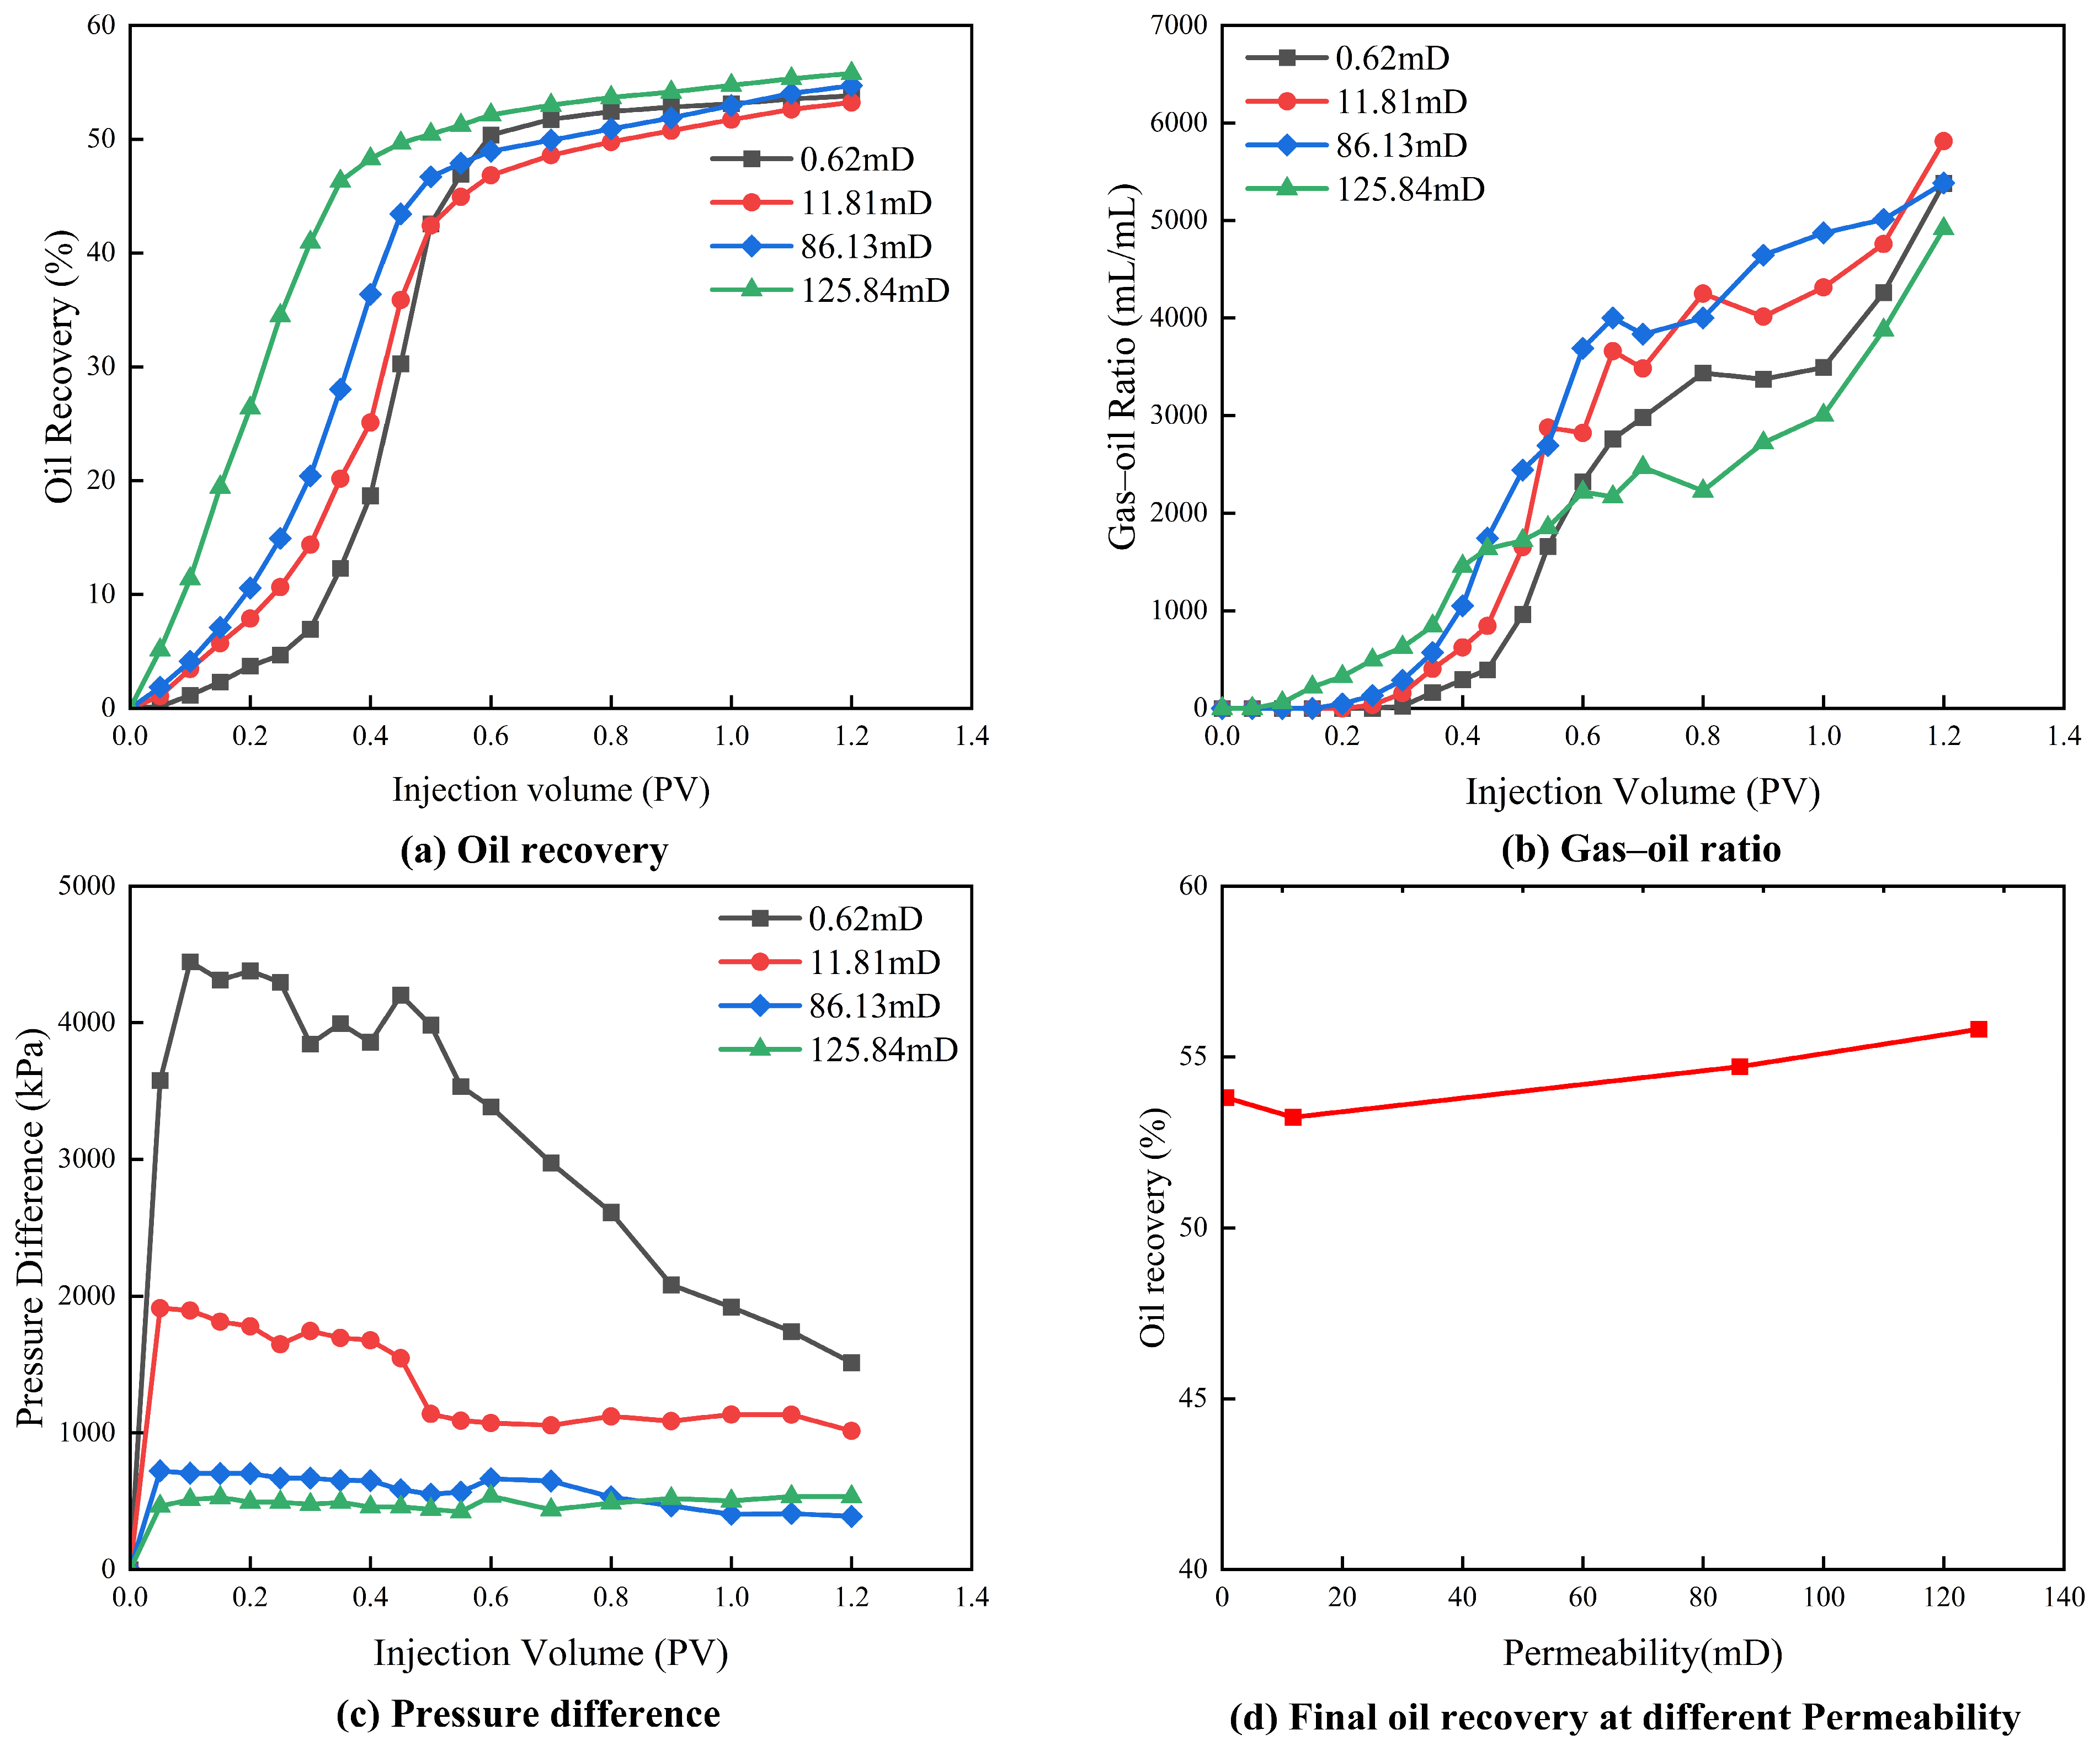
Four single-factor comparative series were conducted to investigate the effects of injection pressure, initial water saturation, permeability, and permeability ratio. Different natural long-core models were used in the four single-factor series, and the model assignments and initial properties for individual tests are summarized in
Table 1. Within each series, the target factor was systematically varied, while the experimental temperature, CO
2 injection rate, fluid-preparation procedure, measurement interval, and termination criteria were maintained consistently. Oil recovery and cumulative CO
2 injection were normalized by the original oil in place and pore volume, respectively, and residual differences in the non-target core properties were considered when interpreting the results of each experimental series.
- (1)
Injection-pressure series: The displacement pressure was set to 20, 25, 30, and 35 MPa. The mean core permeability was approximately 4.30 mD, and the CO2 injection rate was 0.5 mL/min.
- (2)
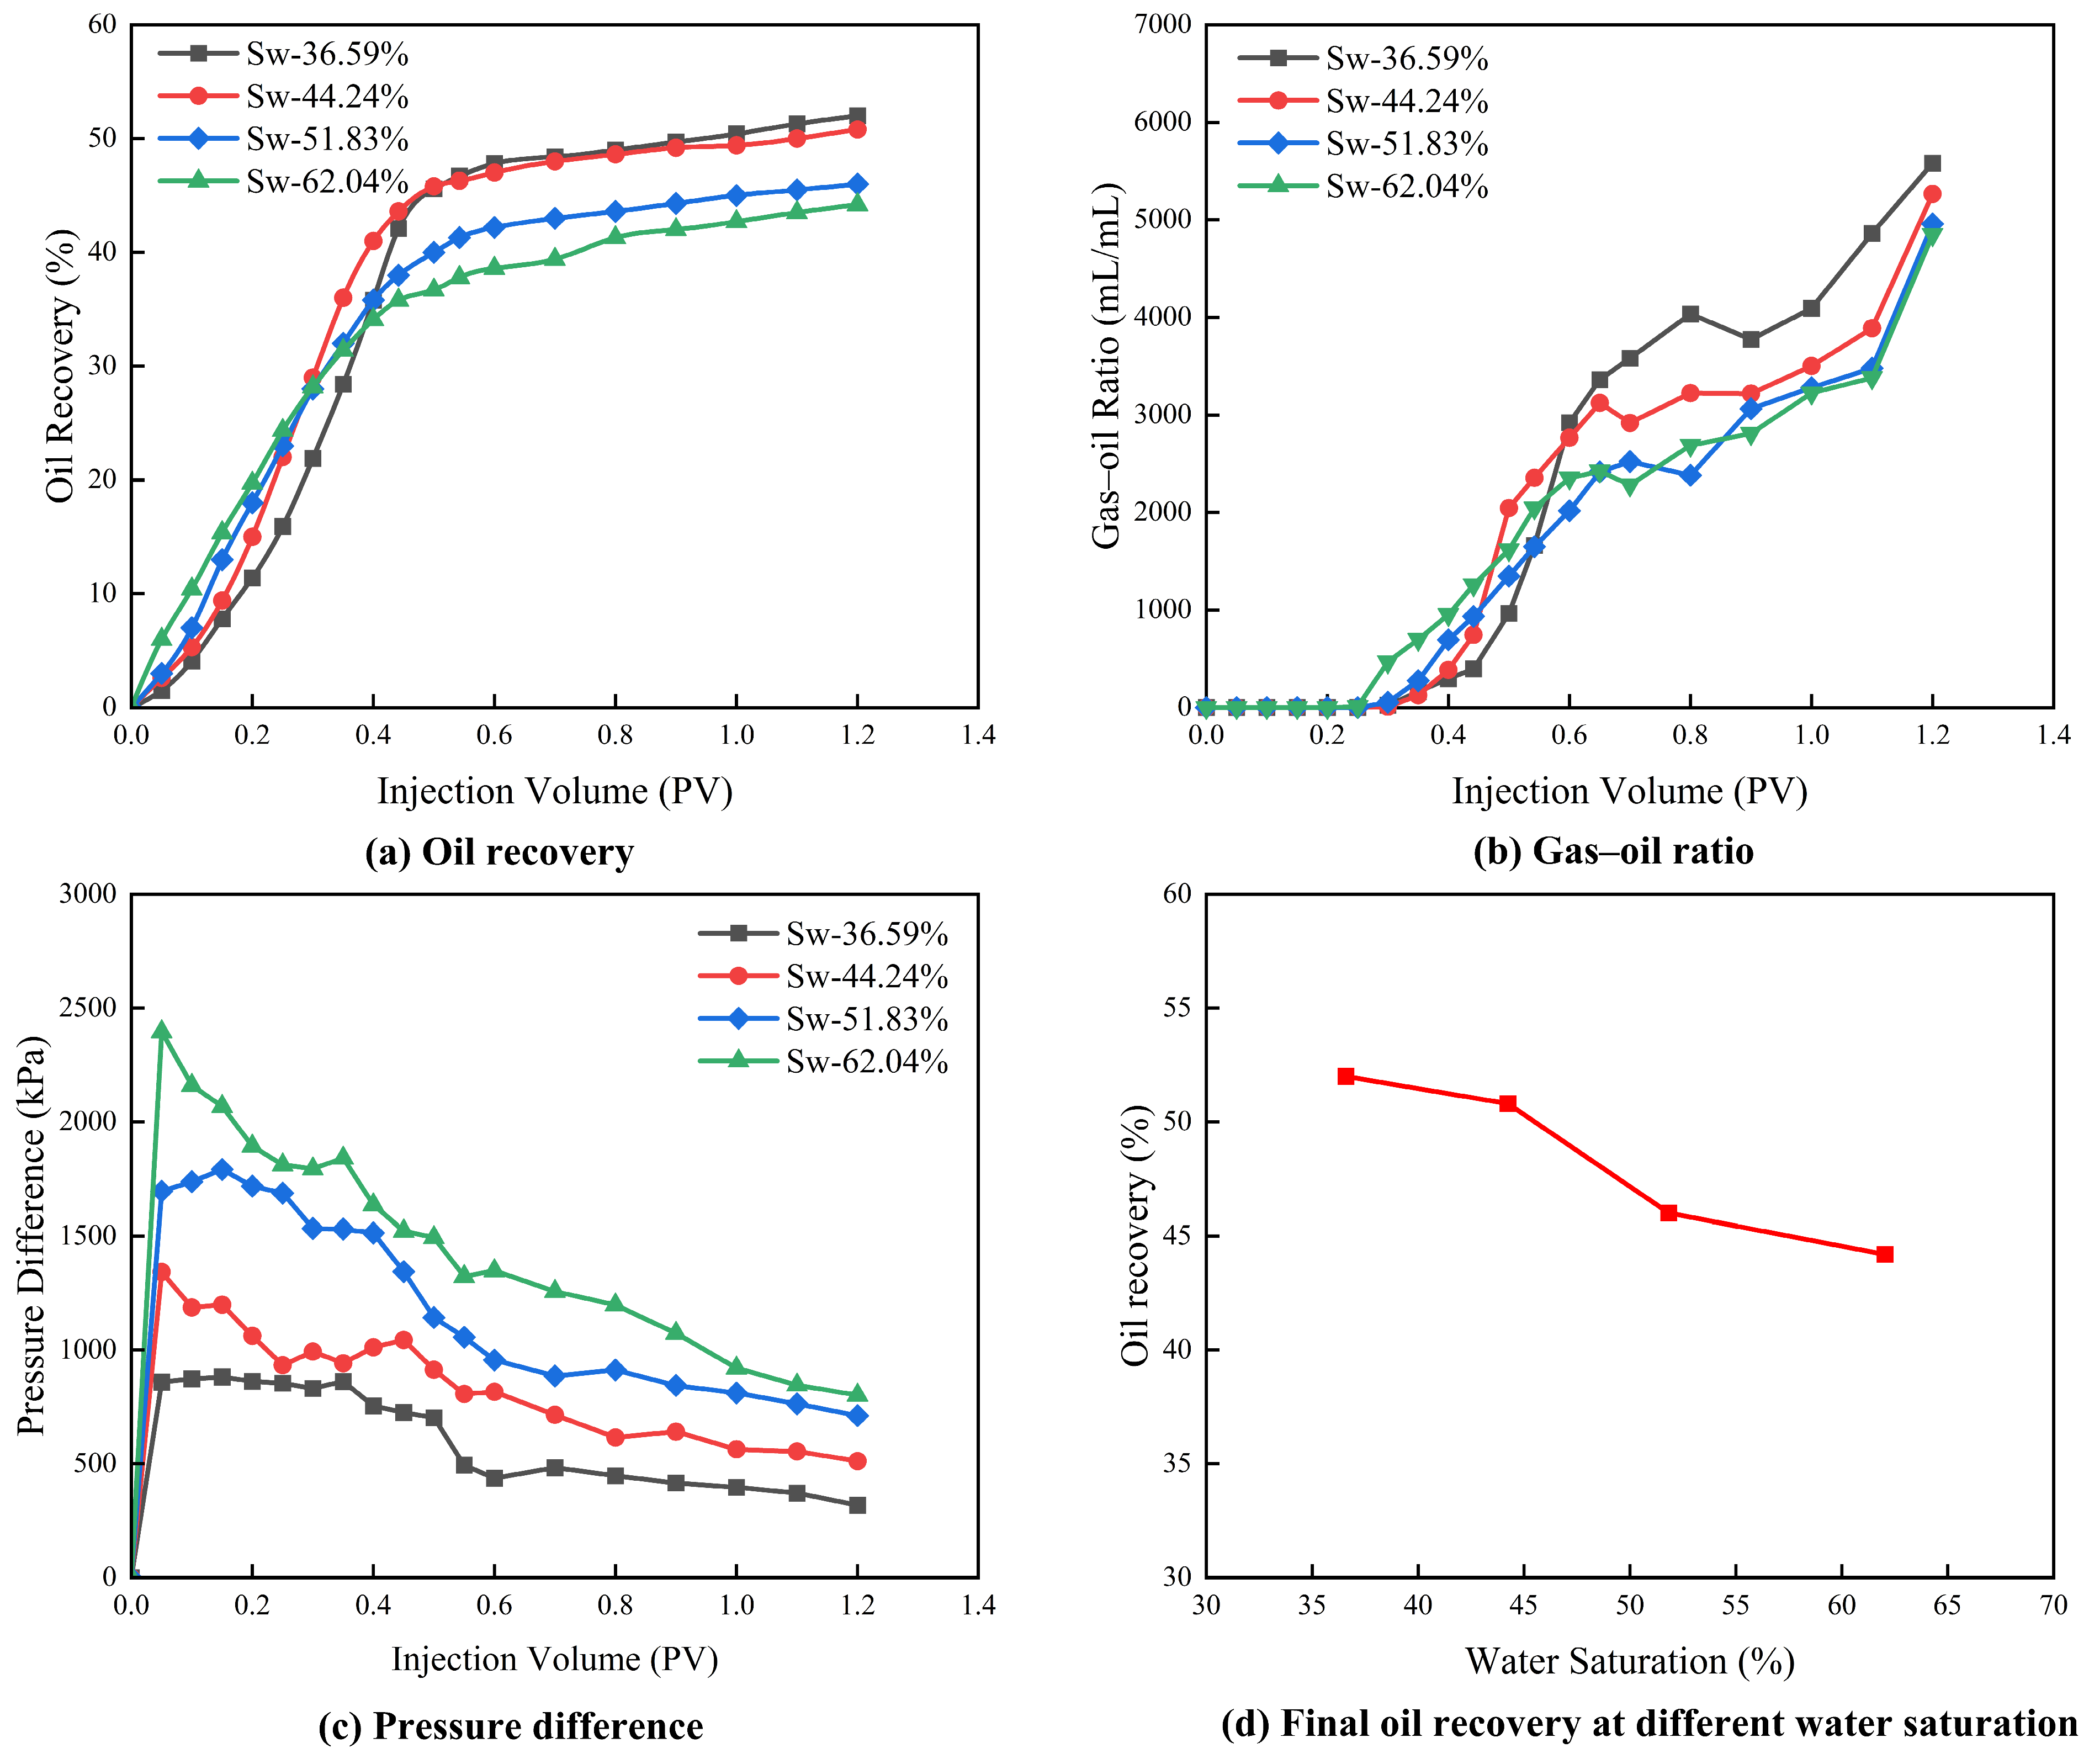
Initial-water-saturation series: The CO2 injection pressure was maintained at 25 MPa, the CO2 injection rate was 0.5 mL/min, and the mean core permeability was approximately 4.02 mD. The target initial water saturations were 36.59, 44.24, 51.83, and 62.04%. These saturations were established by controlling the volume of formation water displaced during the oil-saturation step.
- (3)
Permeability series: The CO2 injection pressure was maintained at 25 MPa, and the CO2 injection rate was 0.5 mL/min. Long-core models with permeabilities of 0.62, 11.81, 86.13, and 125.84 mD were tested.
- (4)
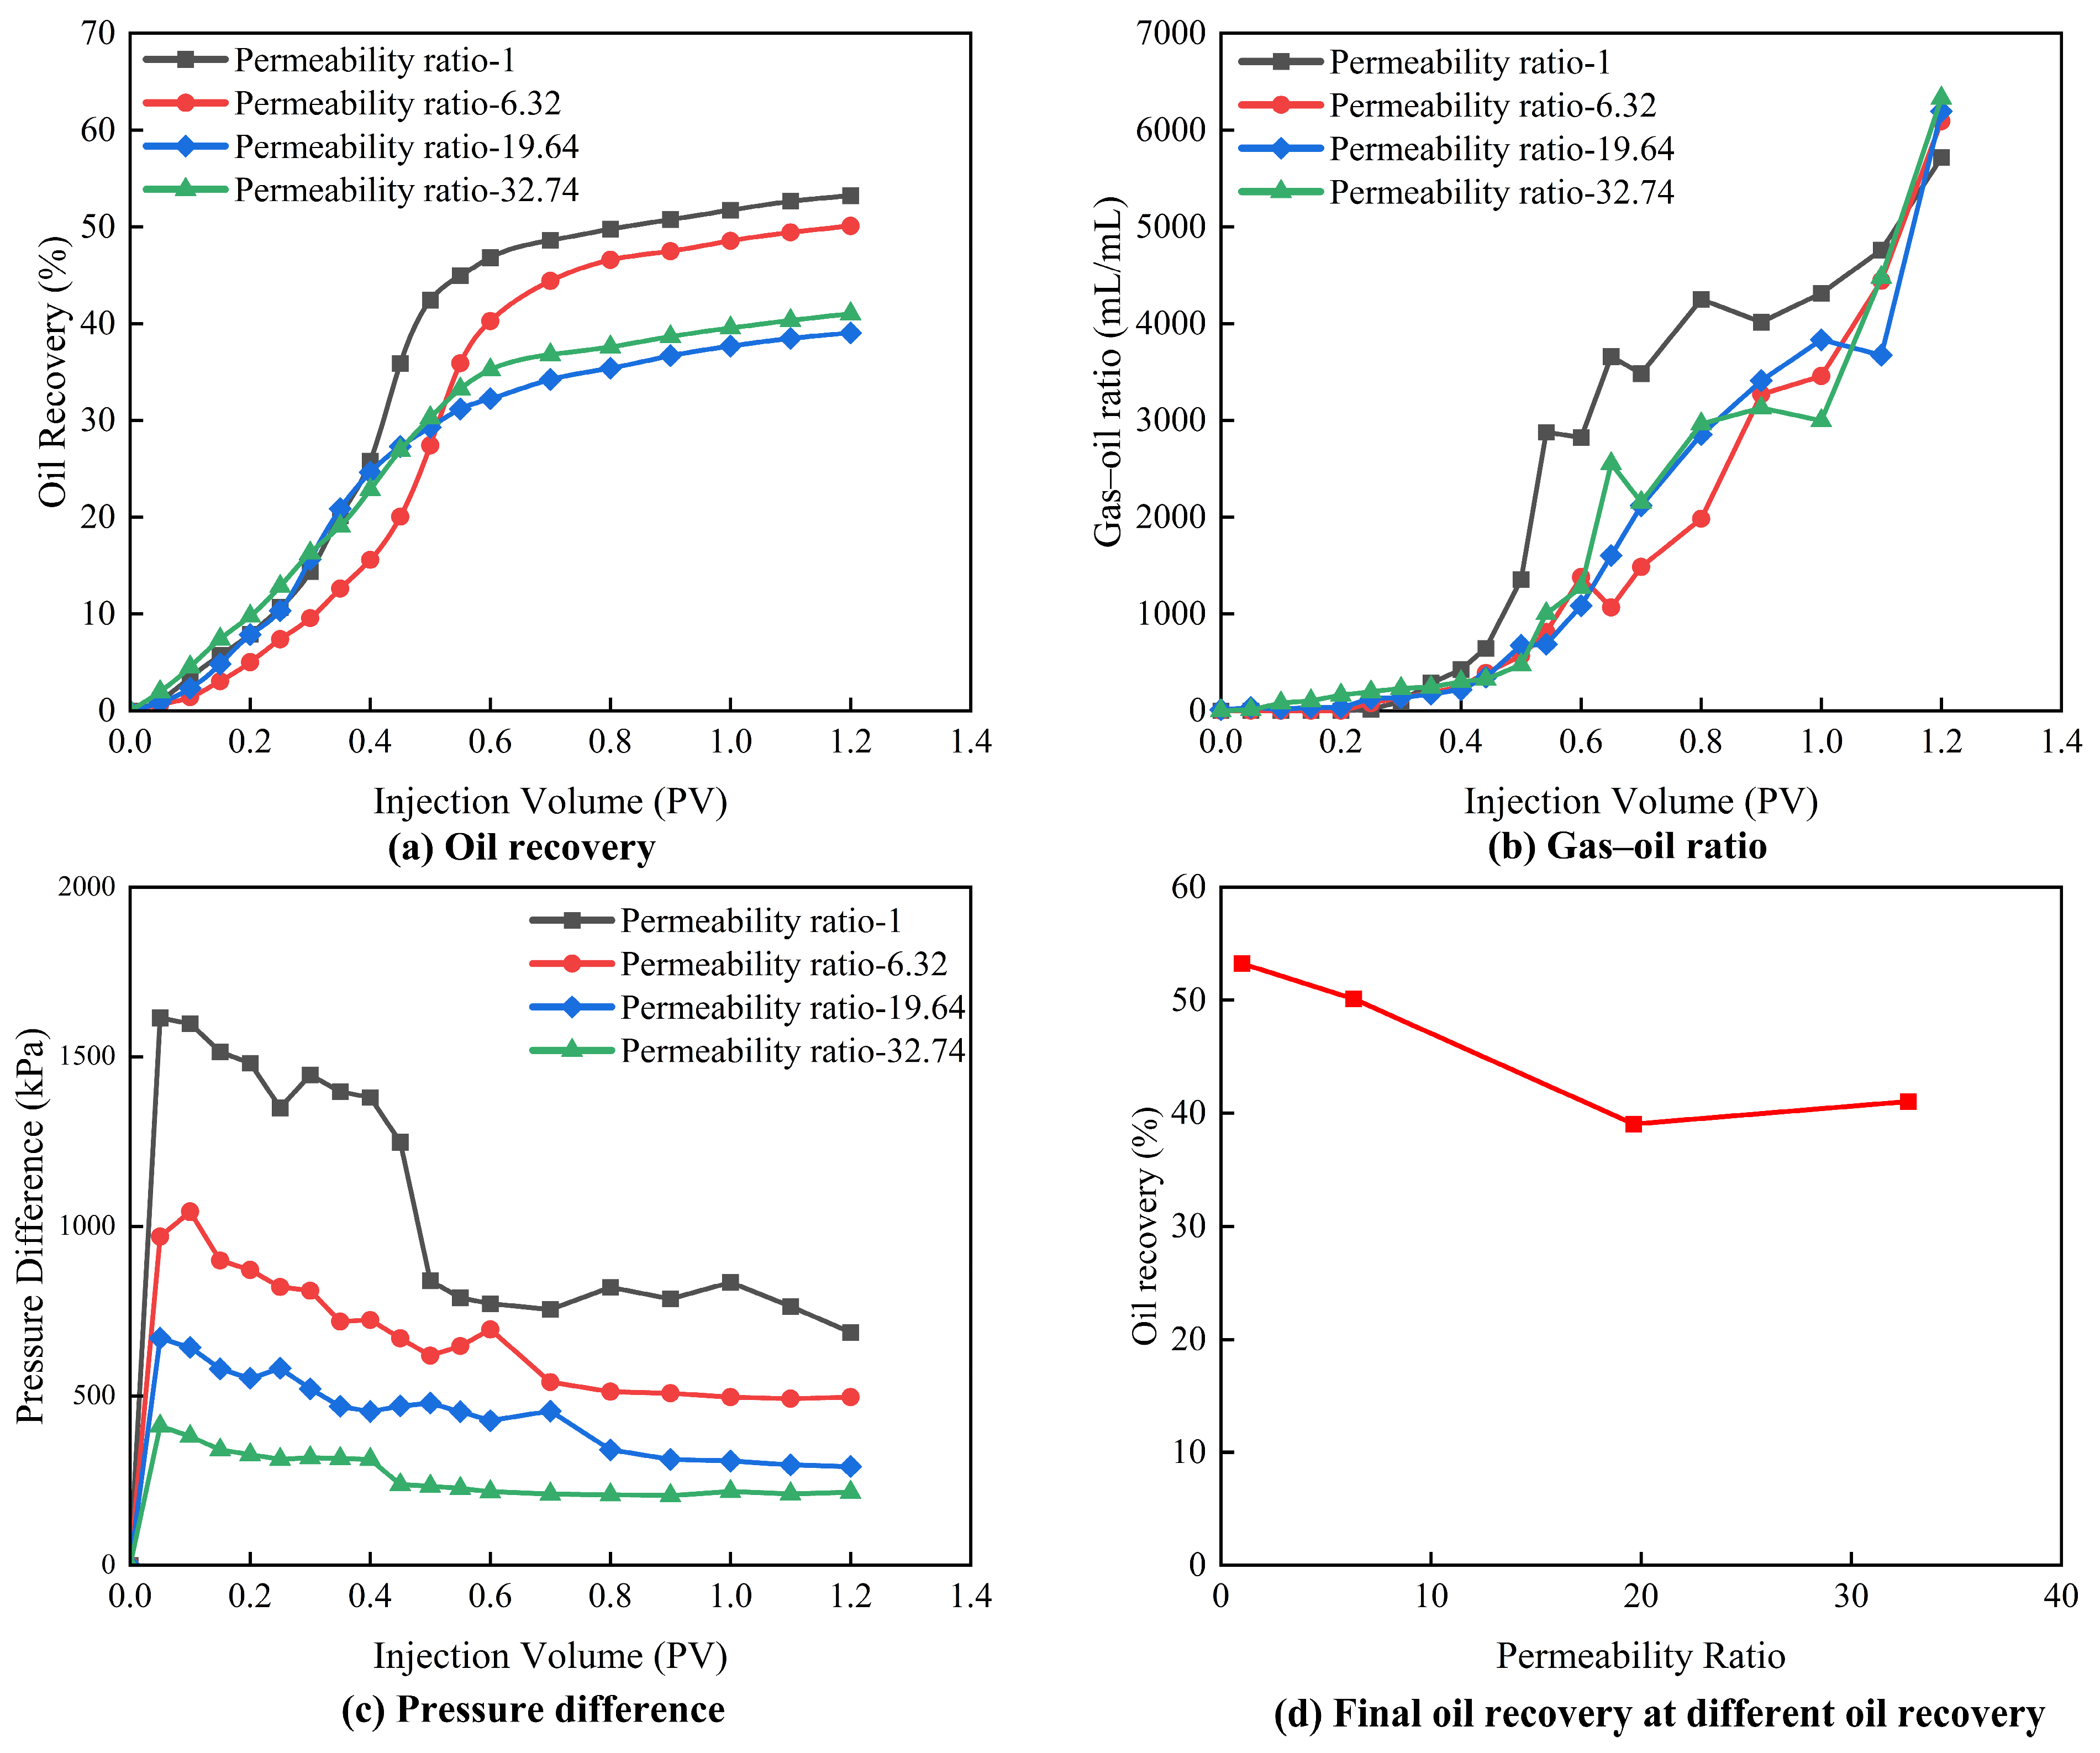
Heterogeneity series: Homogeneous and heterogeneous long-core models with permeability ratios of 1.00, 6.32, 19.64, and 32.74 were tested at a CO2 injection pressure of 25 MPa and a CO2 injection rate of 0.5 mL/min. The permeability ratio was calculated as kmax/kmin for the two permeability classes used in each heterogeneous model.
2.4.3. Slim-Tube MMP Experiment
Before interpreting the long-core displacement results, high-pressure slim-tube displacement experiments were conducted to independently determine the miscibility conditions between CO
2 and crude oil. The experimental temperature was 120 °C, close to the reservoir temperature of 121.6 °C. CO
2 was used as the injection medium, and the crude oil used in the slim-tube experiment was obtained from the same target subarea as that used in the long-core flooding experiments. The experiments were conducted in accordance with SY/T 6573-2016, Test Method for Minimum Miscibility Pressure-Slim Tube Method. The experimental apparatus is shown in
Figure 4, and the main test parameters are summarized in
Table 2.
- (1)
Before each experiment, the slim-tube model and connecting lines were flushed with petroleum ether until no visible crude oil was present in the effluent; the system was then dried with nitrogen and pressure-tested for leaks.
- (2)
The model temperature was maintained at 120 °C, and the model was saturated with the selected crude oil from Block A. Crude-oil injection was continued beyond 2 PV until no detectable difference remained between the properties of the effluent and those of the injected crude oil. The system was then adjusted to the target pressure and maintained until temperature and pressure equilibrium was reached.
- (3)
CO2 was injected using a high-pressure ISCO pump at a rate of 0.5 mL/min. Oil production was recorded at intervals of 0.1 PV. Each experiment was terminated when the cumulative CO2 injection reached 1.2 PV. After completing one pressure point, the model and lines were cleaned and resaturated before the next pressure-point experiment.
- (4)
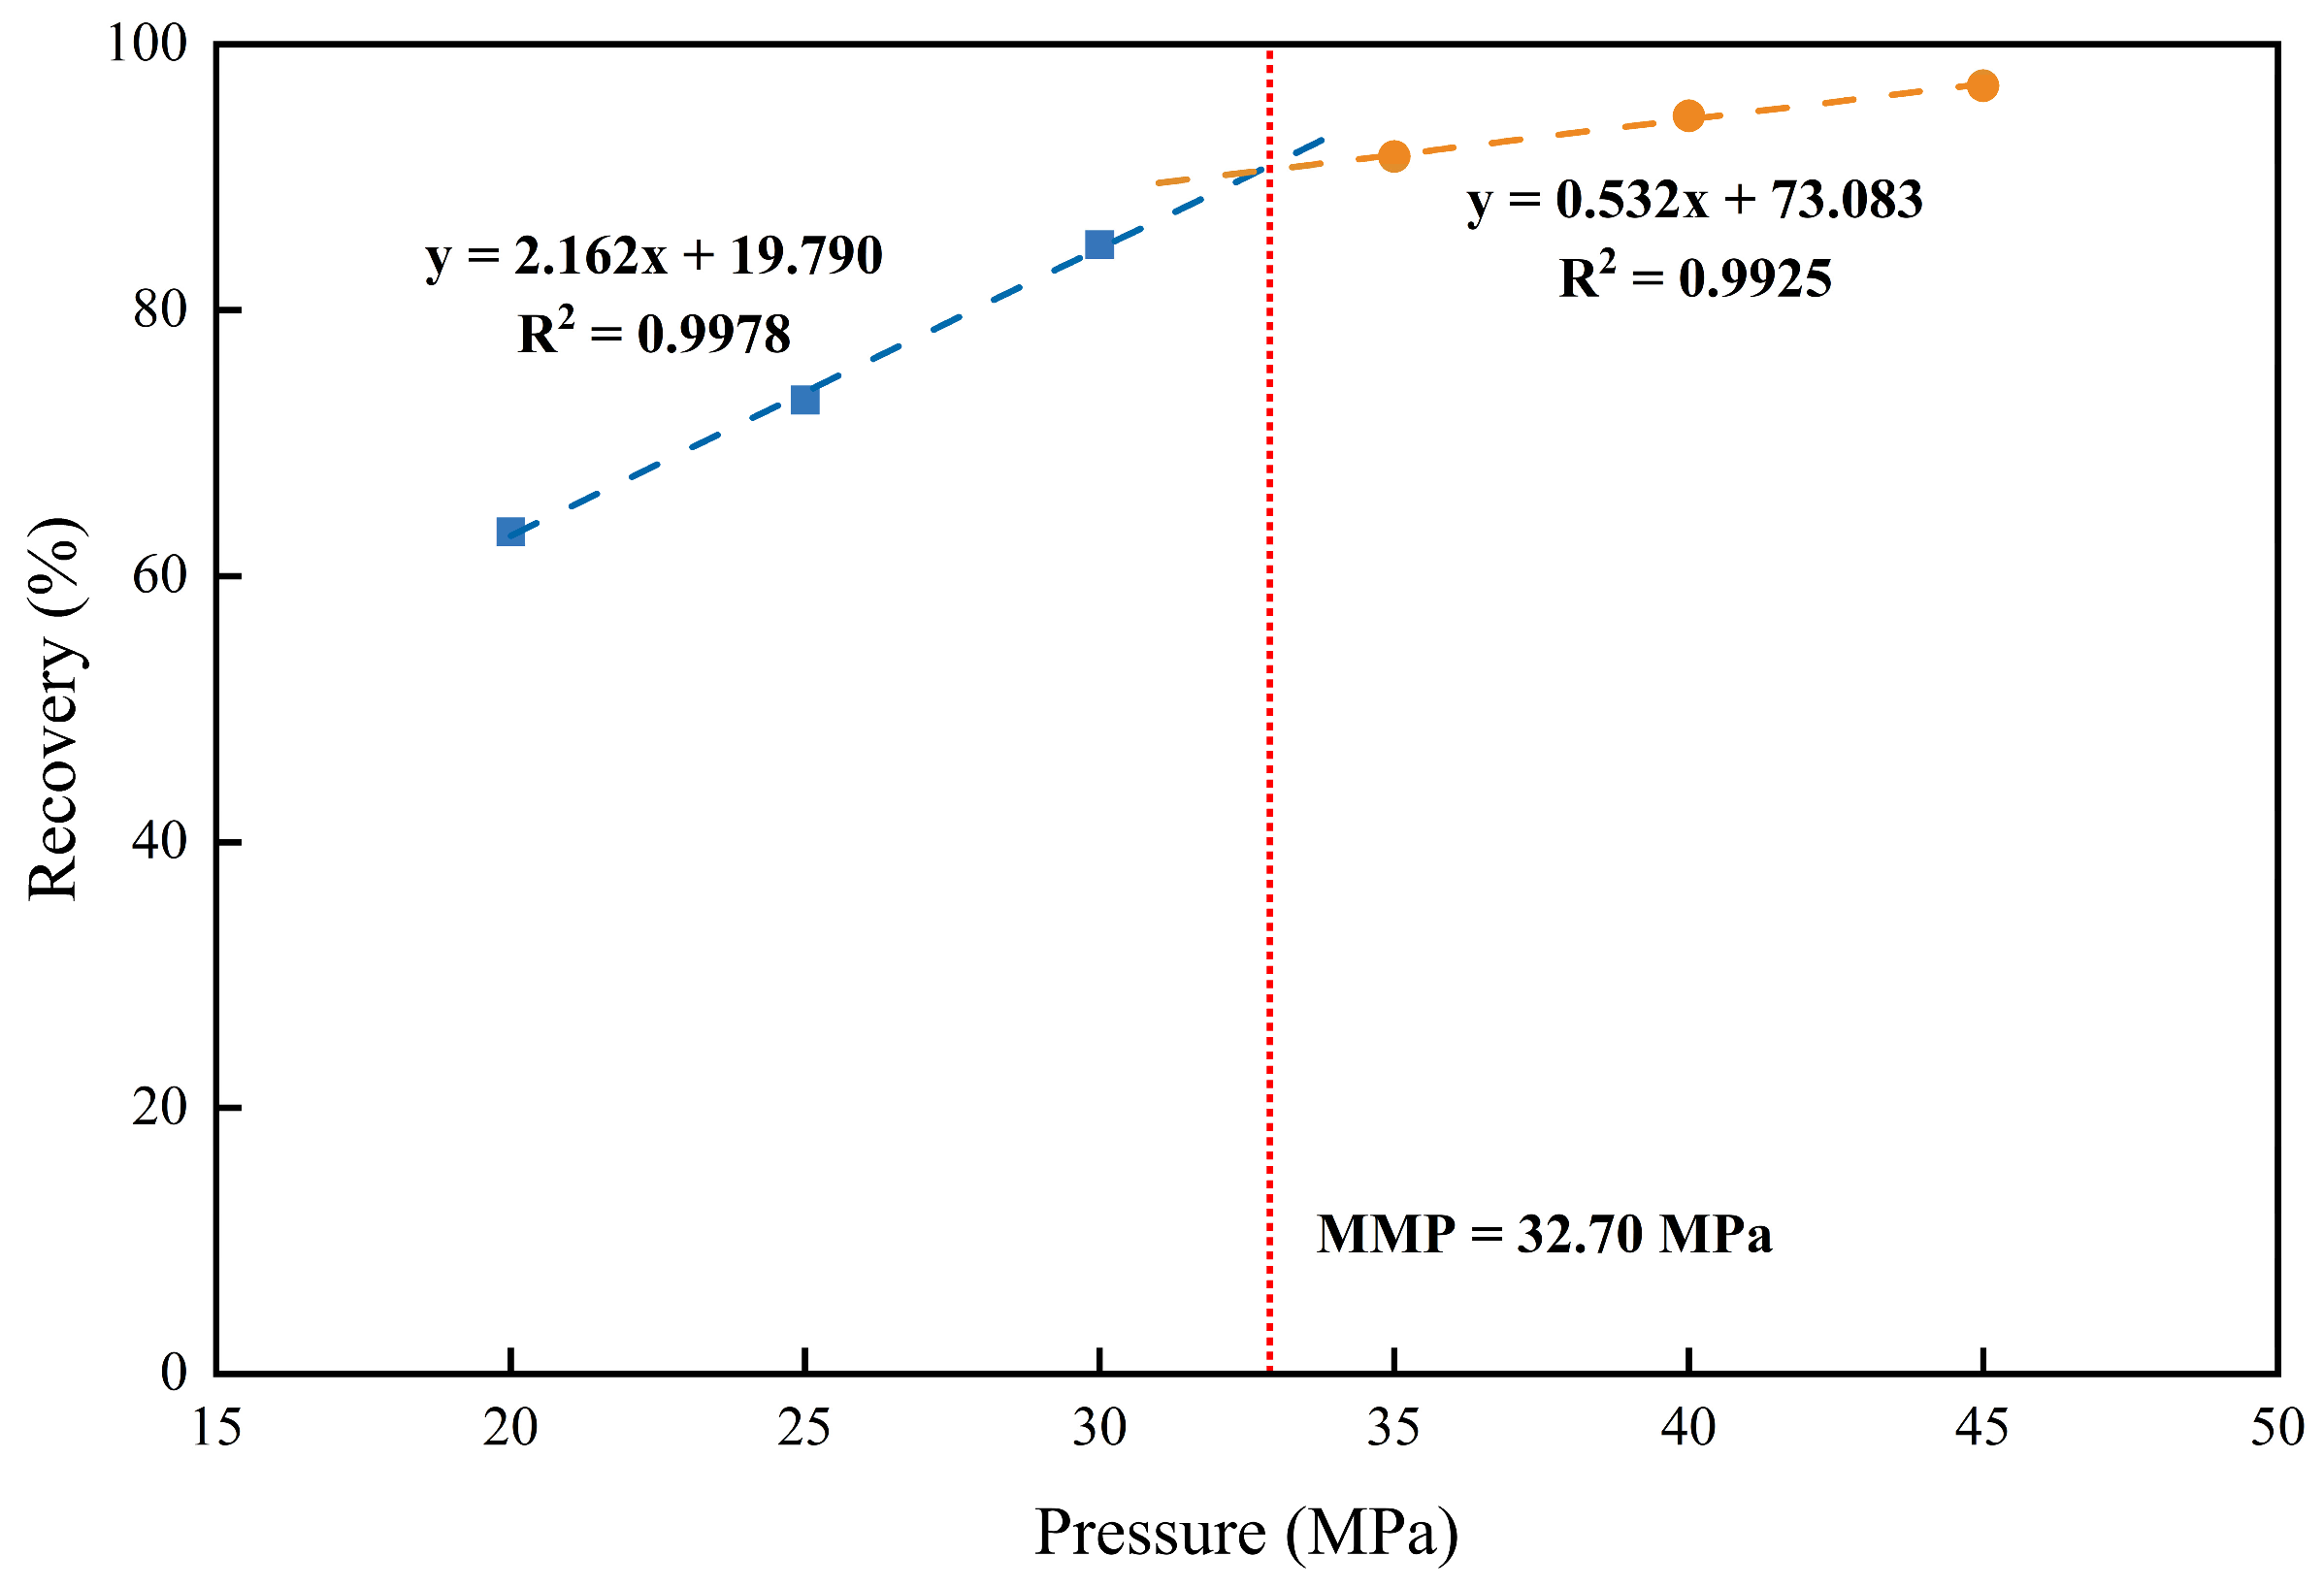
The experiment was repeated at 20, 25, 30, 35, 40, and 45 MPa. The relationship between oil recovery and pressure at an injection volume of 1.2 PV was plotted. According to the slim-tube criterion, the data below and above 90% oil recovery were separately subjected to least-squares linear fitting, and the intersection of the two fitted straight lines was determined as the MMP.
The relationship between oil recovery and CO
2 injection pressure for the selected Block A crude oil, together with the piecewise linear determination of the MMP, is shown in
Figure 5.
2.5. Response Surface Experimental Design and Statistical Analysis
2.5.1. Box–Behnken Experimental Design
A four-factor, three-level Box–Behnken design was used to quantify the combined effects of injection pressure (A), initial water saturation (B), permeability (C), and permeability ratio (D) on the CO
2-flooding oil-recovery factor. The low, center, and high levels were selected from the ranges covered by the single-factor experiments (
Table 3). The design contained 29 runs, including five replicated center points used to estimate the experimental error. The measured cumulative oil-recovery factor was selected as the response variable Y.
2.5.2. Regression Analysis and Model Validation
The Box–Behnken data were fitted using a second-order polynomial model containing linear, quadratic, and two-factor interaction terms:
where
is the predicted oil-recovery factor,
is the intercept,
is the linear coefficient,
is the quadratic coefficient,
is the interaction coefficient, and
and
are the coded independent variables. Analysis of variance was used to evaluate model and term significance through the F-value and
p-value. Terms with
p < 0.05 were considered statistically significant. The model fit was assessed using the coefficient of determination (R
2) and adjusted R
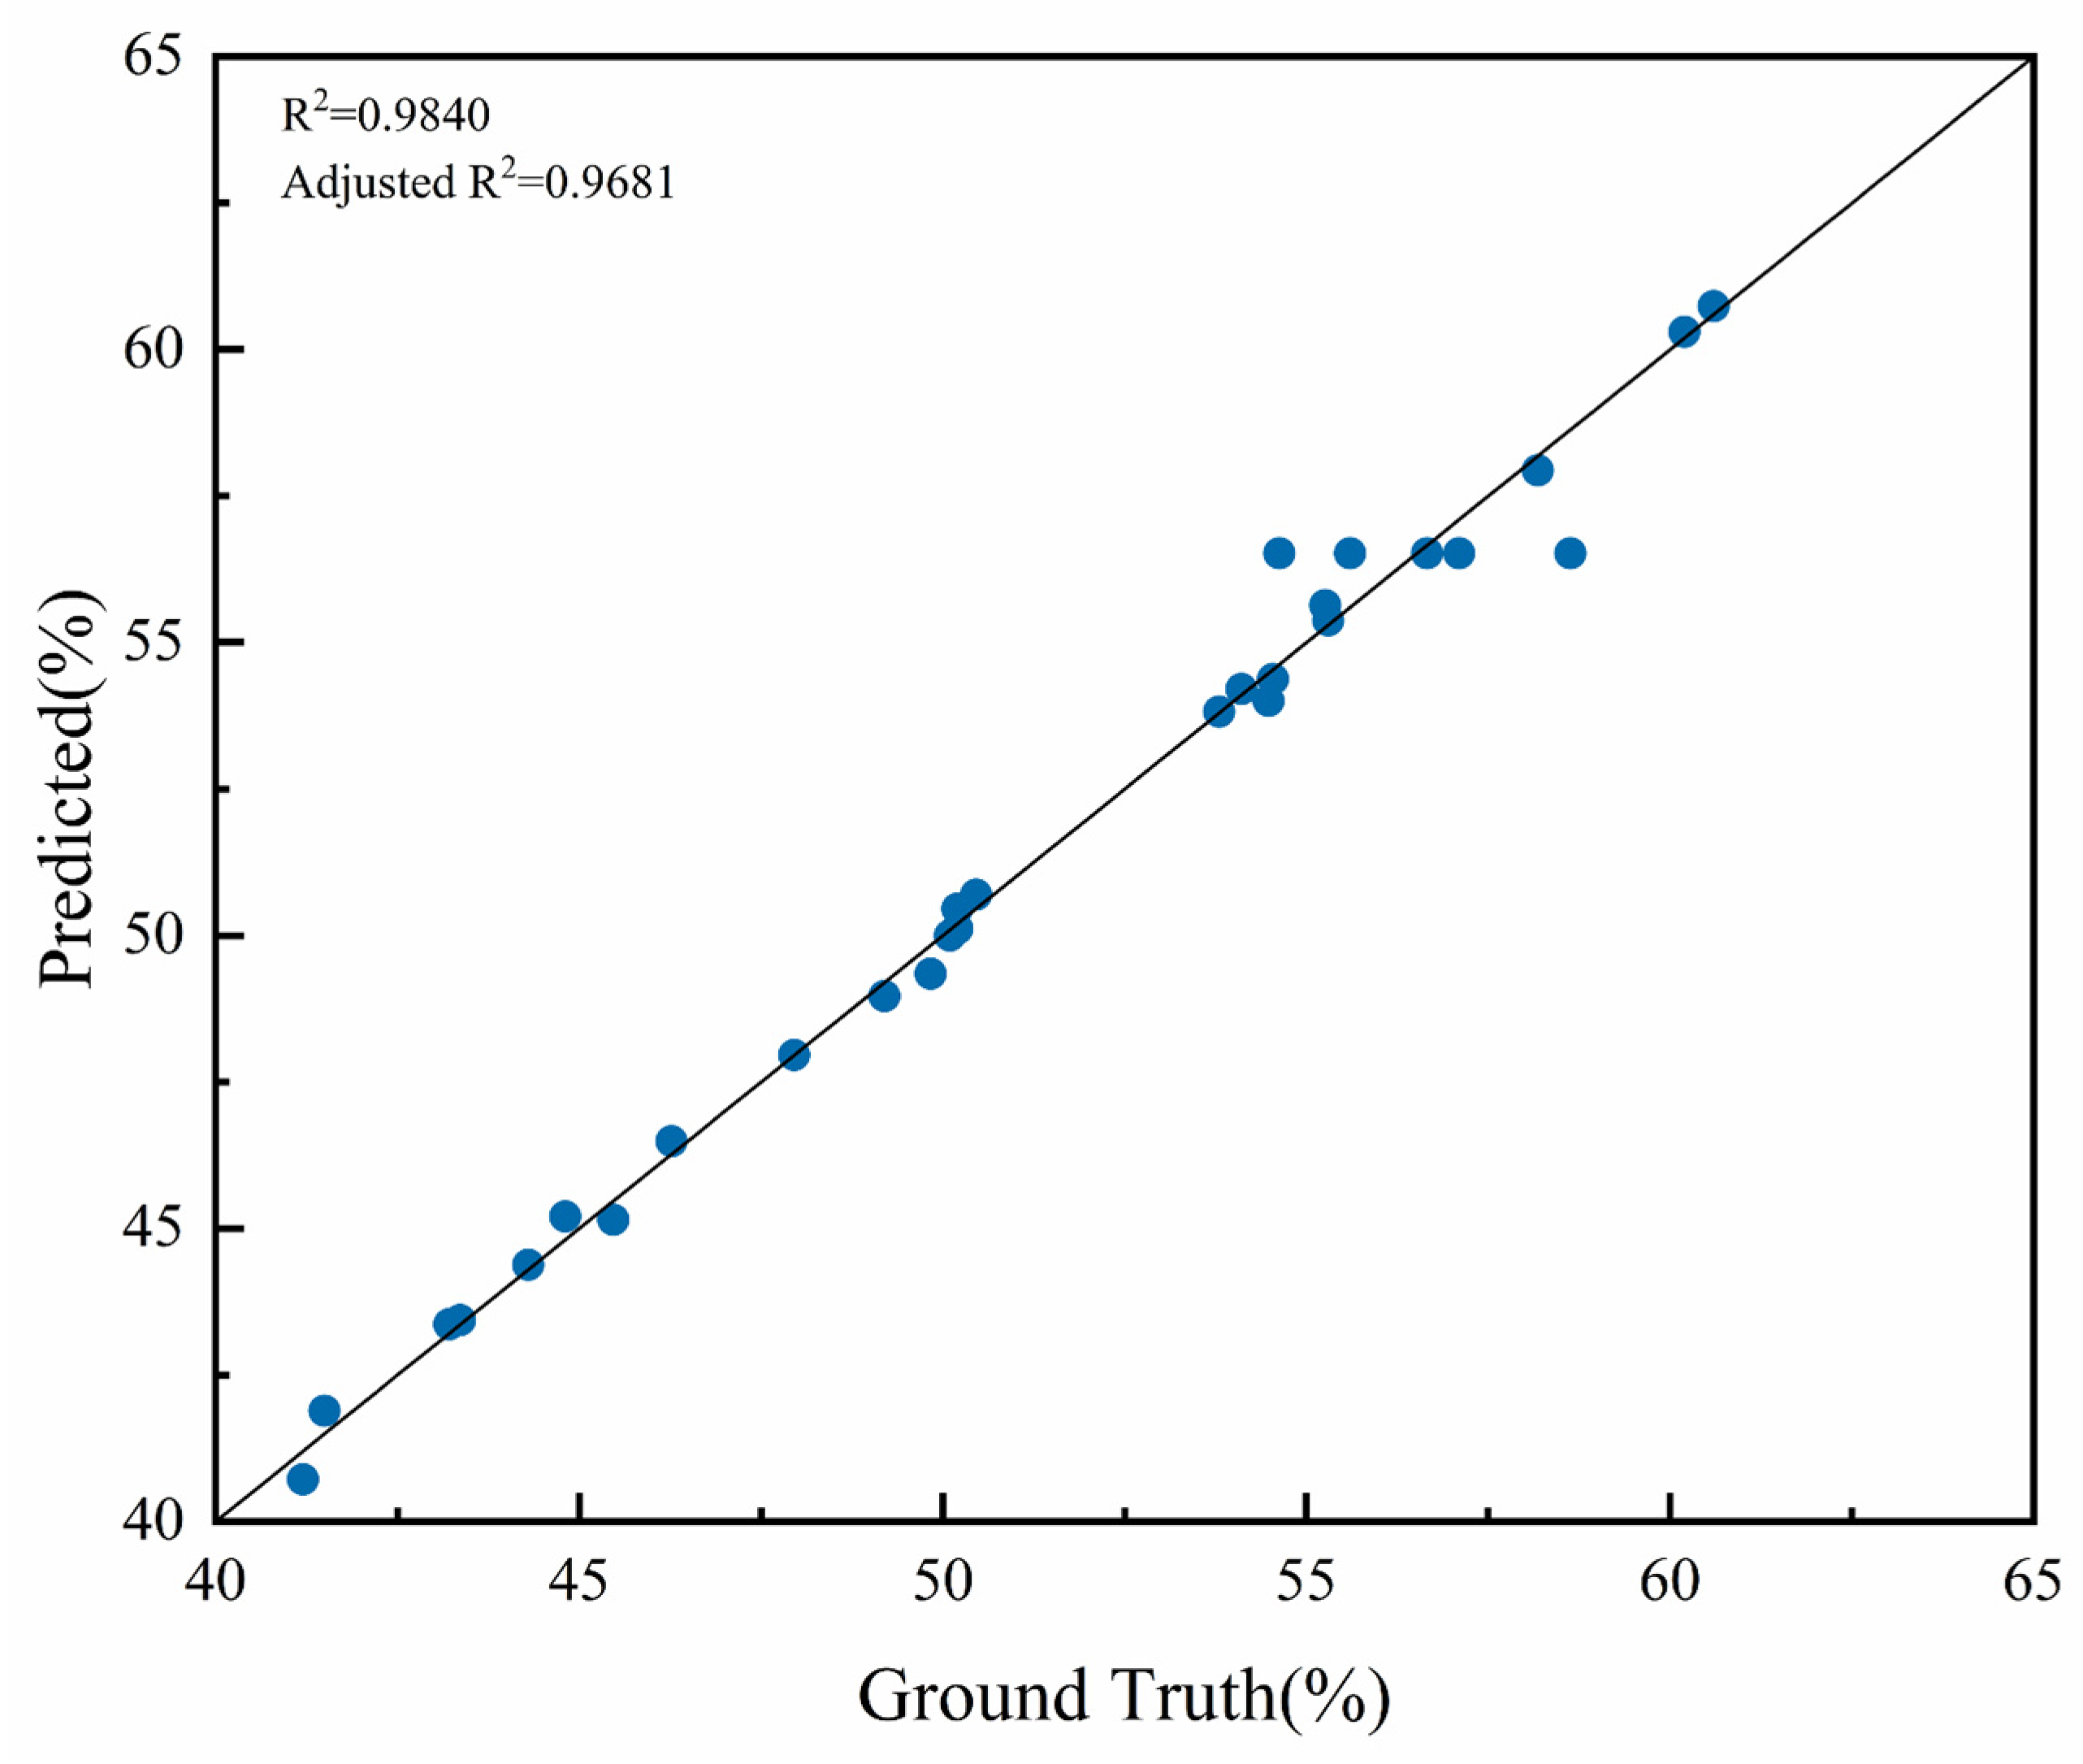
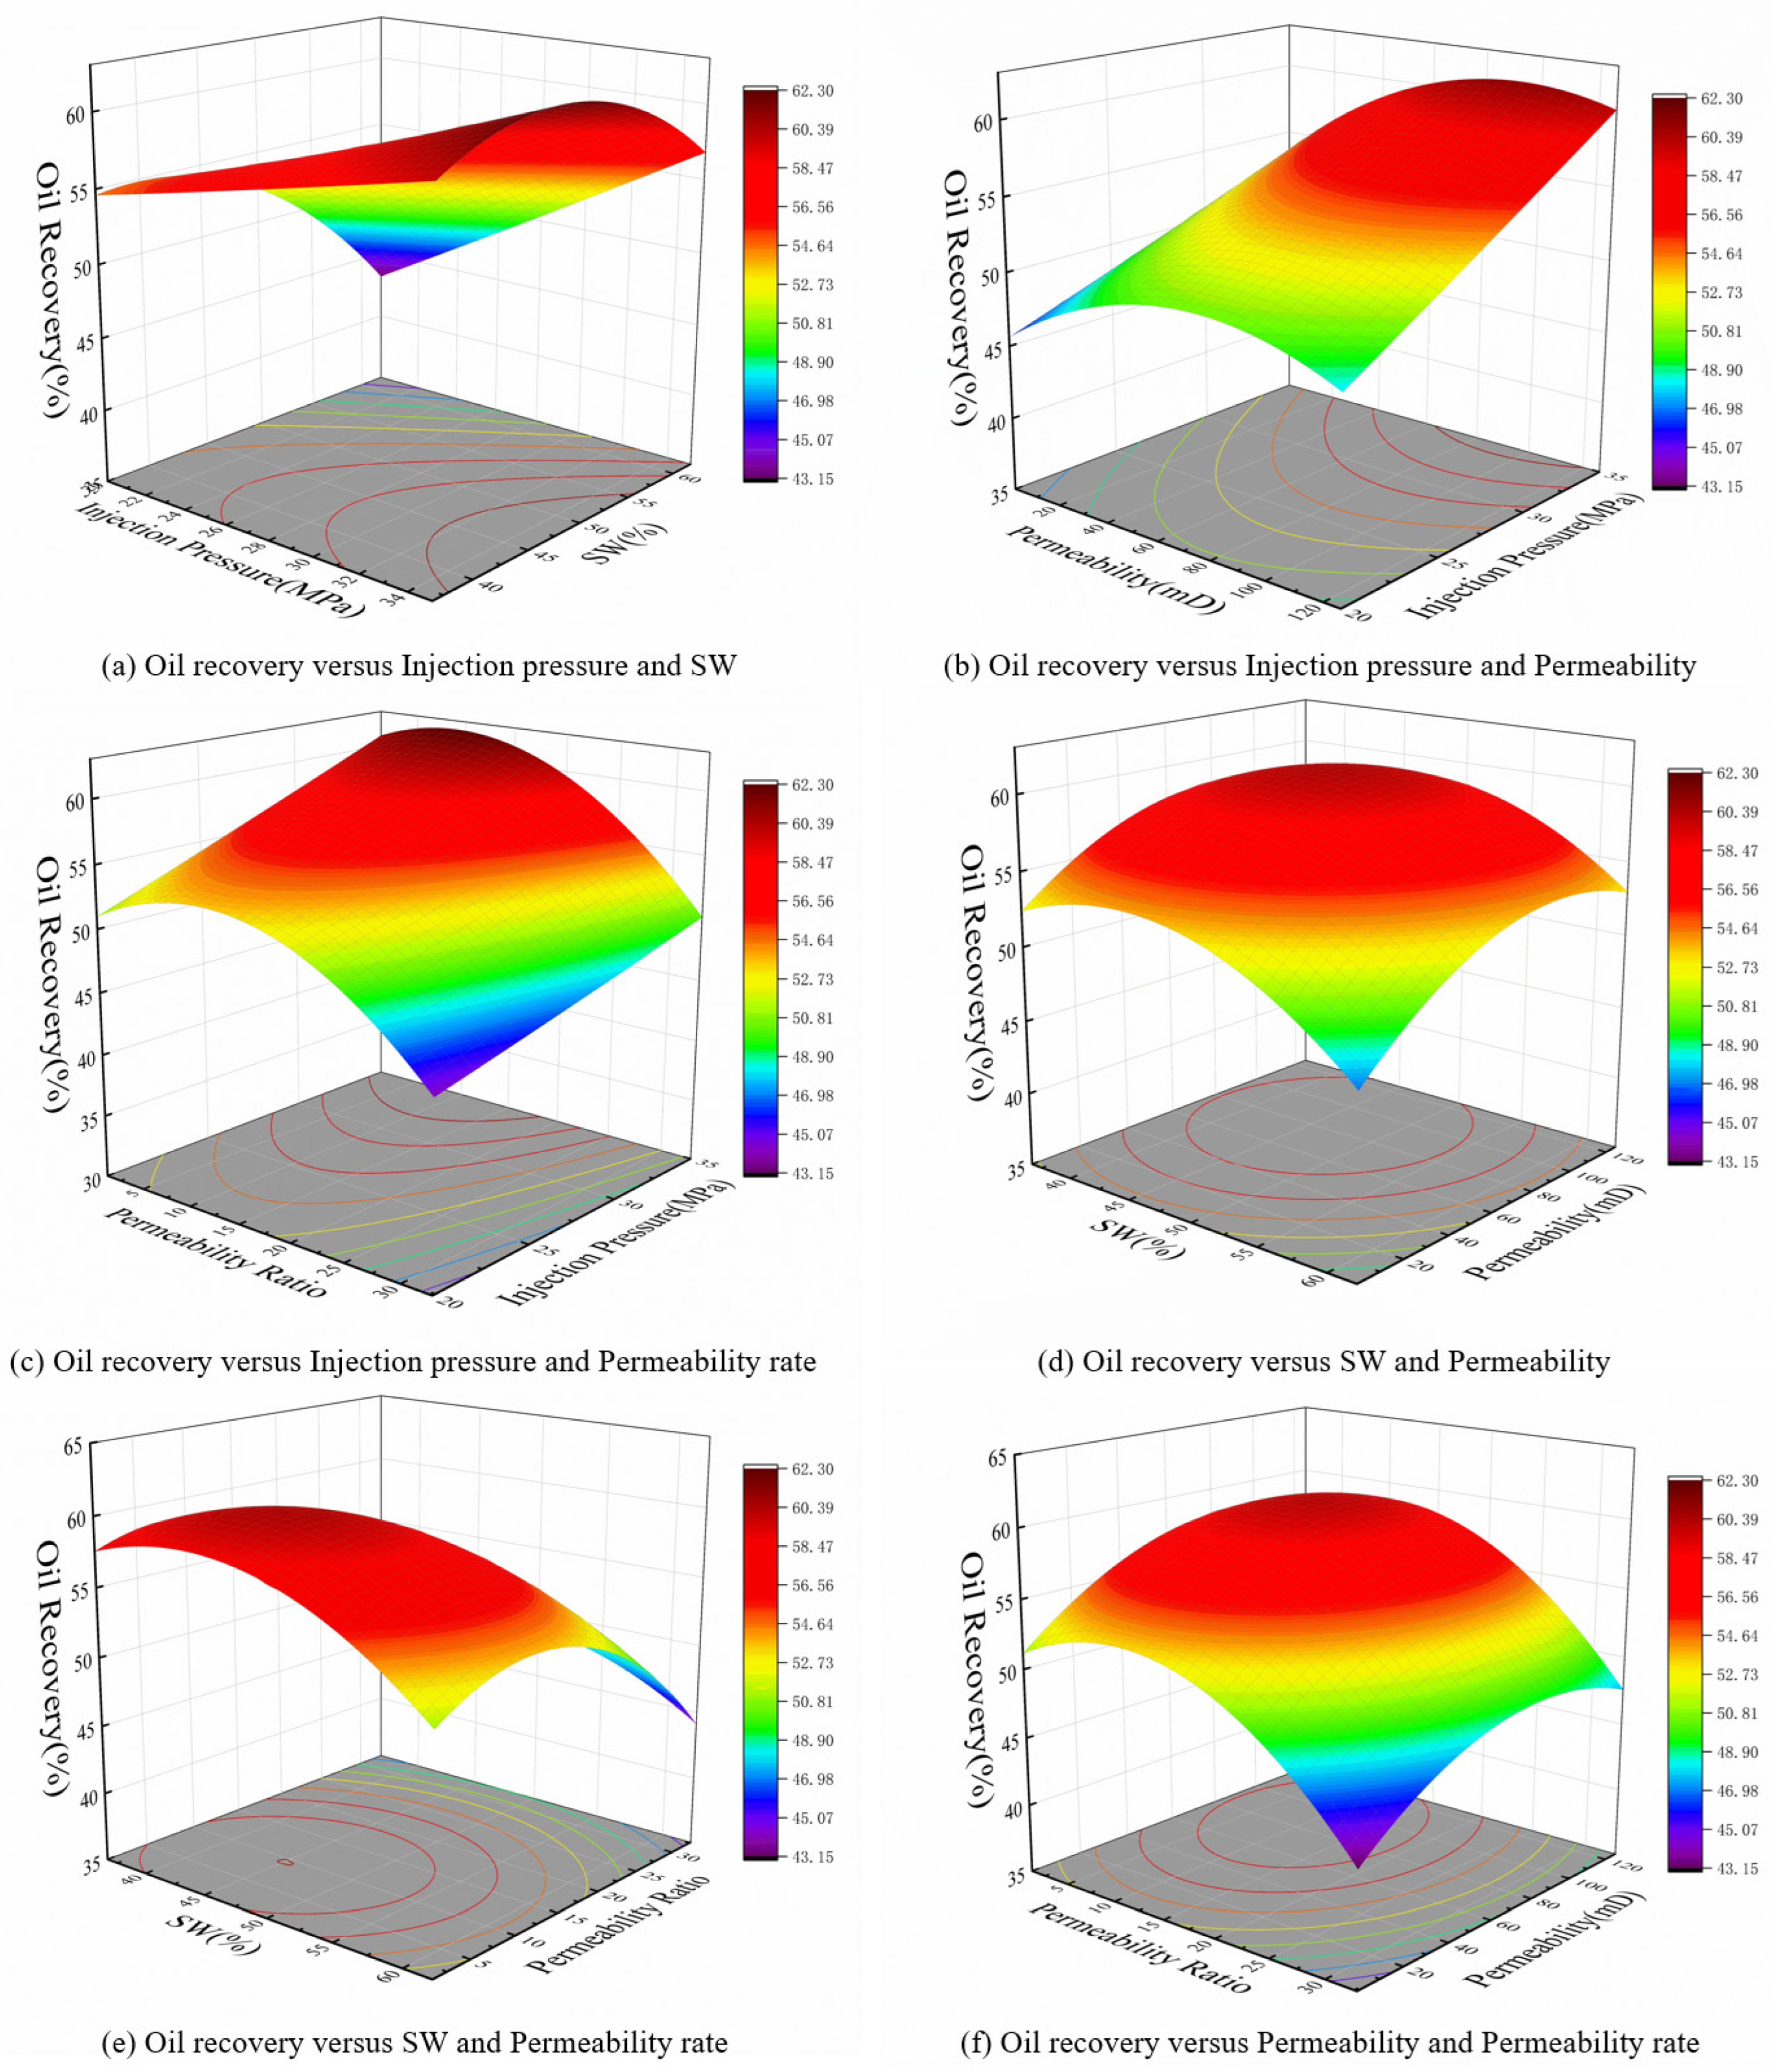
2. Agreement between the measured and predicted recovery factors was evaluated using a parity plot. The validated regression equation was then used to construct response surfaces and to determine the factor combination that maximized the predicted CO
2-flooding recovery.




 ,
,