1. Introduction
In recent years, driven by the “dual-carbon” goals and the adjustment of the energy structure, unconventional natural gas resources have become an important direction for increasing natural gas reserves and production in China. Coalbed methane (CBM) is not only abundant and widely distributed, but also plays an important role in ensuring energy security and promoting clean and low-carbon development. With the increasing development of shallow CBM resources, CBM exploration and development are gradually extending toward greater depths. CBM reservoirs with burial depths exceeding 1500 m are generally defined as deep CBM reservoirs, which are typically characterized by high in situ stress, high reservoir pressure, and high gas content, indicating considerable development potential [
1]. As an important area for deep CBM development in the eastern margin of the Ordos Basin, the Yan’an Gas Field has achieved a series of exploration breakthroughs in recent years. The Yan’an Gas Field contains abundant deep CBM resources with high gas saturation and is an important target area for deep CBM development in the Ordos Basin. The No. 8 coal seam of the Benxi Formation is the primary production interval, with a relatively thin thickness of generally 2–6 m and reservoir pressure of approximately 25–28 MPa. Compared with conventional deep CBM reservoirs, the thin coal seam characteristics further increase the difficulty of hydraulic stimulation and efficient gas recovery. Among its target formations, the No. 8 coal seam of the Benxi Formation has become a key development interval owing to its stable burial conditions and high gas content [
2]. However, deep coal reservoirs are also characterized by low porosity, low permeability, strong heterogeneity, well-developed natural cleats, and the coexistence of adsorbed and free gas [
3,
4]. Conventional development methods are therefore insufficient for effectively mobilizing these reservoirs. Consequently, hydraulic fracturing to construct highly conductive artificial fracture networks and enhance reservoir stimulation coverage and fracture connectivity has become a key approach for achieving large-scale and efficient development of deep CBM reservoirs [
5].
The propagation of hydraulic fractures in CBM reservoirs is jointly controlled by in situ stress conditions, natural fracture distribution, fracturing parameters, and coal mechanical properties, resulting in propagation behavior that differs significantly from that observed in conventional tight sandstone reservoirs [
6,
7]. Extensive research has been conducted worldwide to investigate the formation mechanisms of complex fracture networks. Current studies mainly focus on two aspects: physical experimental investigations and numerical simulations [
8,
9,
10,
11]. In experimental studies, true triaxial hydraulic fracturing tests, acoustic emission monitoring, CT scanning, and fracture visualization techniques have been widely employed to simulate hydraulic fracturing in coal under different in situ stress conditions, rock mechanical properties, cleat development characteristics, and lithological combinations. These experimental approaches have been used to investigate the characteristics of fracture initiation pressure, propagation paths, and deflection behavior. In numerical simulation studies, various methods, including the finite element method (FEM) [
12,
13], extended finite element method (XFEM) [
14], finite-discrete element method (FDEM) [
15,
16], discrete element method (DEM) [
17,
18], and boundary element method (BEM) [
19,
20] have been widely employed to investigate fracture initiation, propagation, and the formation of complex fracture networks during hydraulic fracturing in coal seams. Tian et al. [
21] established a two-dimensional fully coupled hydro-mechanical finite element model using ABAQUS that incorporated a natural cleat network to simulate hydraulic fracture propagation in deep coal seams with coal-mudstone interbedding. The results demonstrated that the inclination and density of natural cleats, the proportion of coal and mudstone, and the injection rate significantly affect the propagation path and complexity of hydraulic fractures. Xia et al. [
22] developed a multi-cluster hydraulic fracturing model for heterogeneous coal reservoirs based on FDEM, and found that appropriately reducing the injection rate and increasing the cluster spacing can improve the propagation performance of multi-cluster fractures. Wang et al. [
23] established a three-dimensional hydraulic fracturing model for CBM reservoirs using the continuum-discontinuum element method (CDEM), and found that the development of natural fractures and fracturing-fluid properties significantly affect the complexity of the resulting fracture network. Gao et al. [
24] established a hydraulic fracturing model for layered coal seams based on the block discrete element method, and analyzed the effects of coal seam thickness, injection rate, and fracturing-fluid viscosity on the vertical propagation behavior of hydraulic fractures across coal seams. Although considerable progress has been made in existing studies, most investigations have focused on shallow CBM reservoirs, while the understanding of hydraulic fracture propagation mechanisms in deep CBM reservoirs, particularly under the complex geological conditions of the Yan’an Gas Field, remains limited. The high in situ stress, complex natural cleat systems, and distinct fluid migration behaviors of deep coal seams differ significantly from those of shallow reservoirs, making it difficult for existing knowledge to fully elucidate fracture–cleat interactions, fracture network evolution, and the controlling mechanisms of hydraulic fracture propagation. These uncertainties further constrain the optimization of field-scale fracturing designs and their practical effectiveness.
In this study, the numerical simulation approach employed for hydraulic fracture propagation is based on the boundary element method (BEM), which provides an efficient solution for engineering-scale fracture propagation analysis. Well JY1 in the No. 8 coal seam of the Benxi Formation in Block N of the Yan’an Gas Field was selected as the study object. An integrated numerical simulation framework incorporating a structural model, reservoir property model, geomechanical model, and fracture propagation model was established using well logging data and field treatment data. On this basis, the effects of key fracturing parameters, including injection rate, fluid volume per stage, and proppant volume per stage, on fracture propagation morphology, fracture width distribution, and the transport and placement characteristics of different proppant sizes under different operating conditions were systematically investigated. The interaction mechanisms between main fractures and natural cleats were also examined. The results provide a theoretical basis for the optimization of fracturing parameters and efficient development of deep CBM reservoirs in the Yan’an Gas Field.
2. Numerical Model Establishment
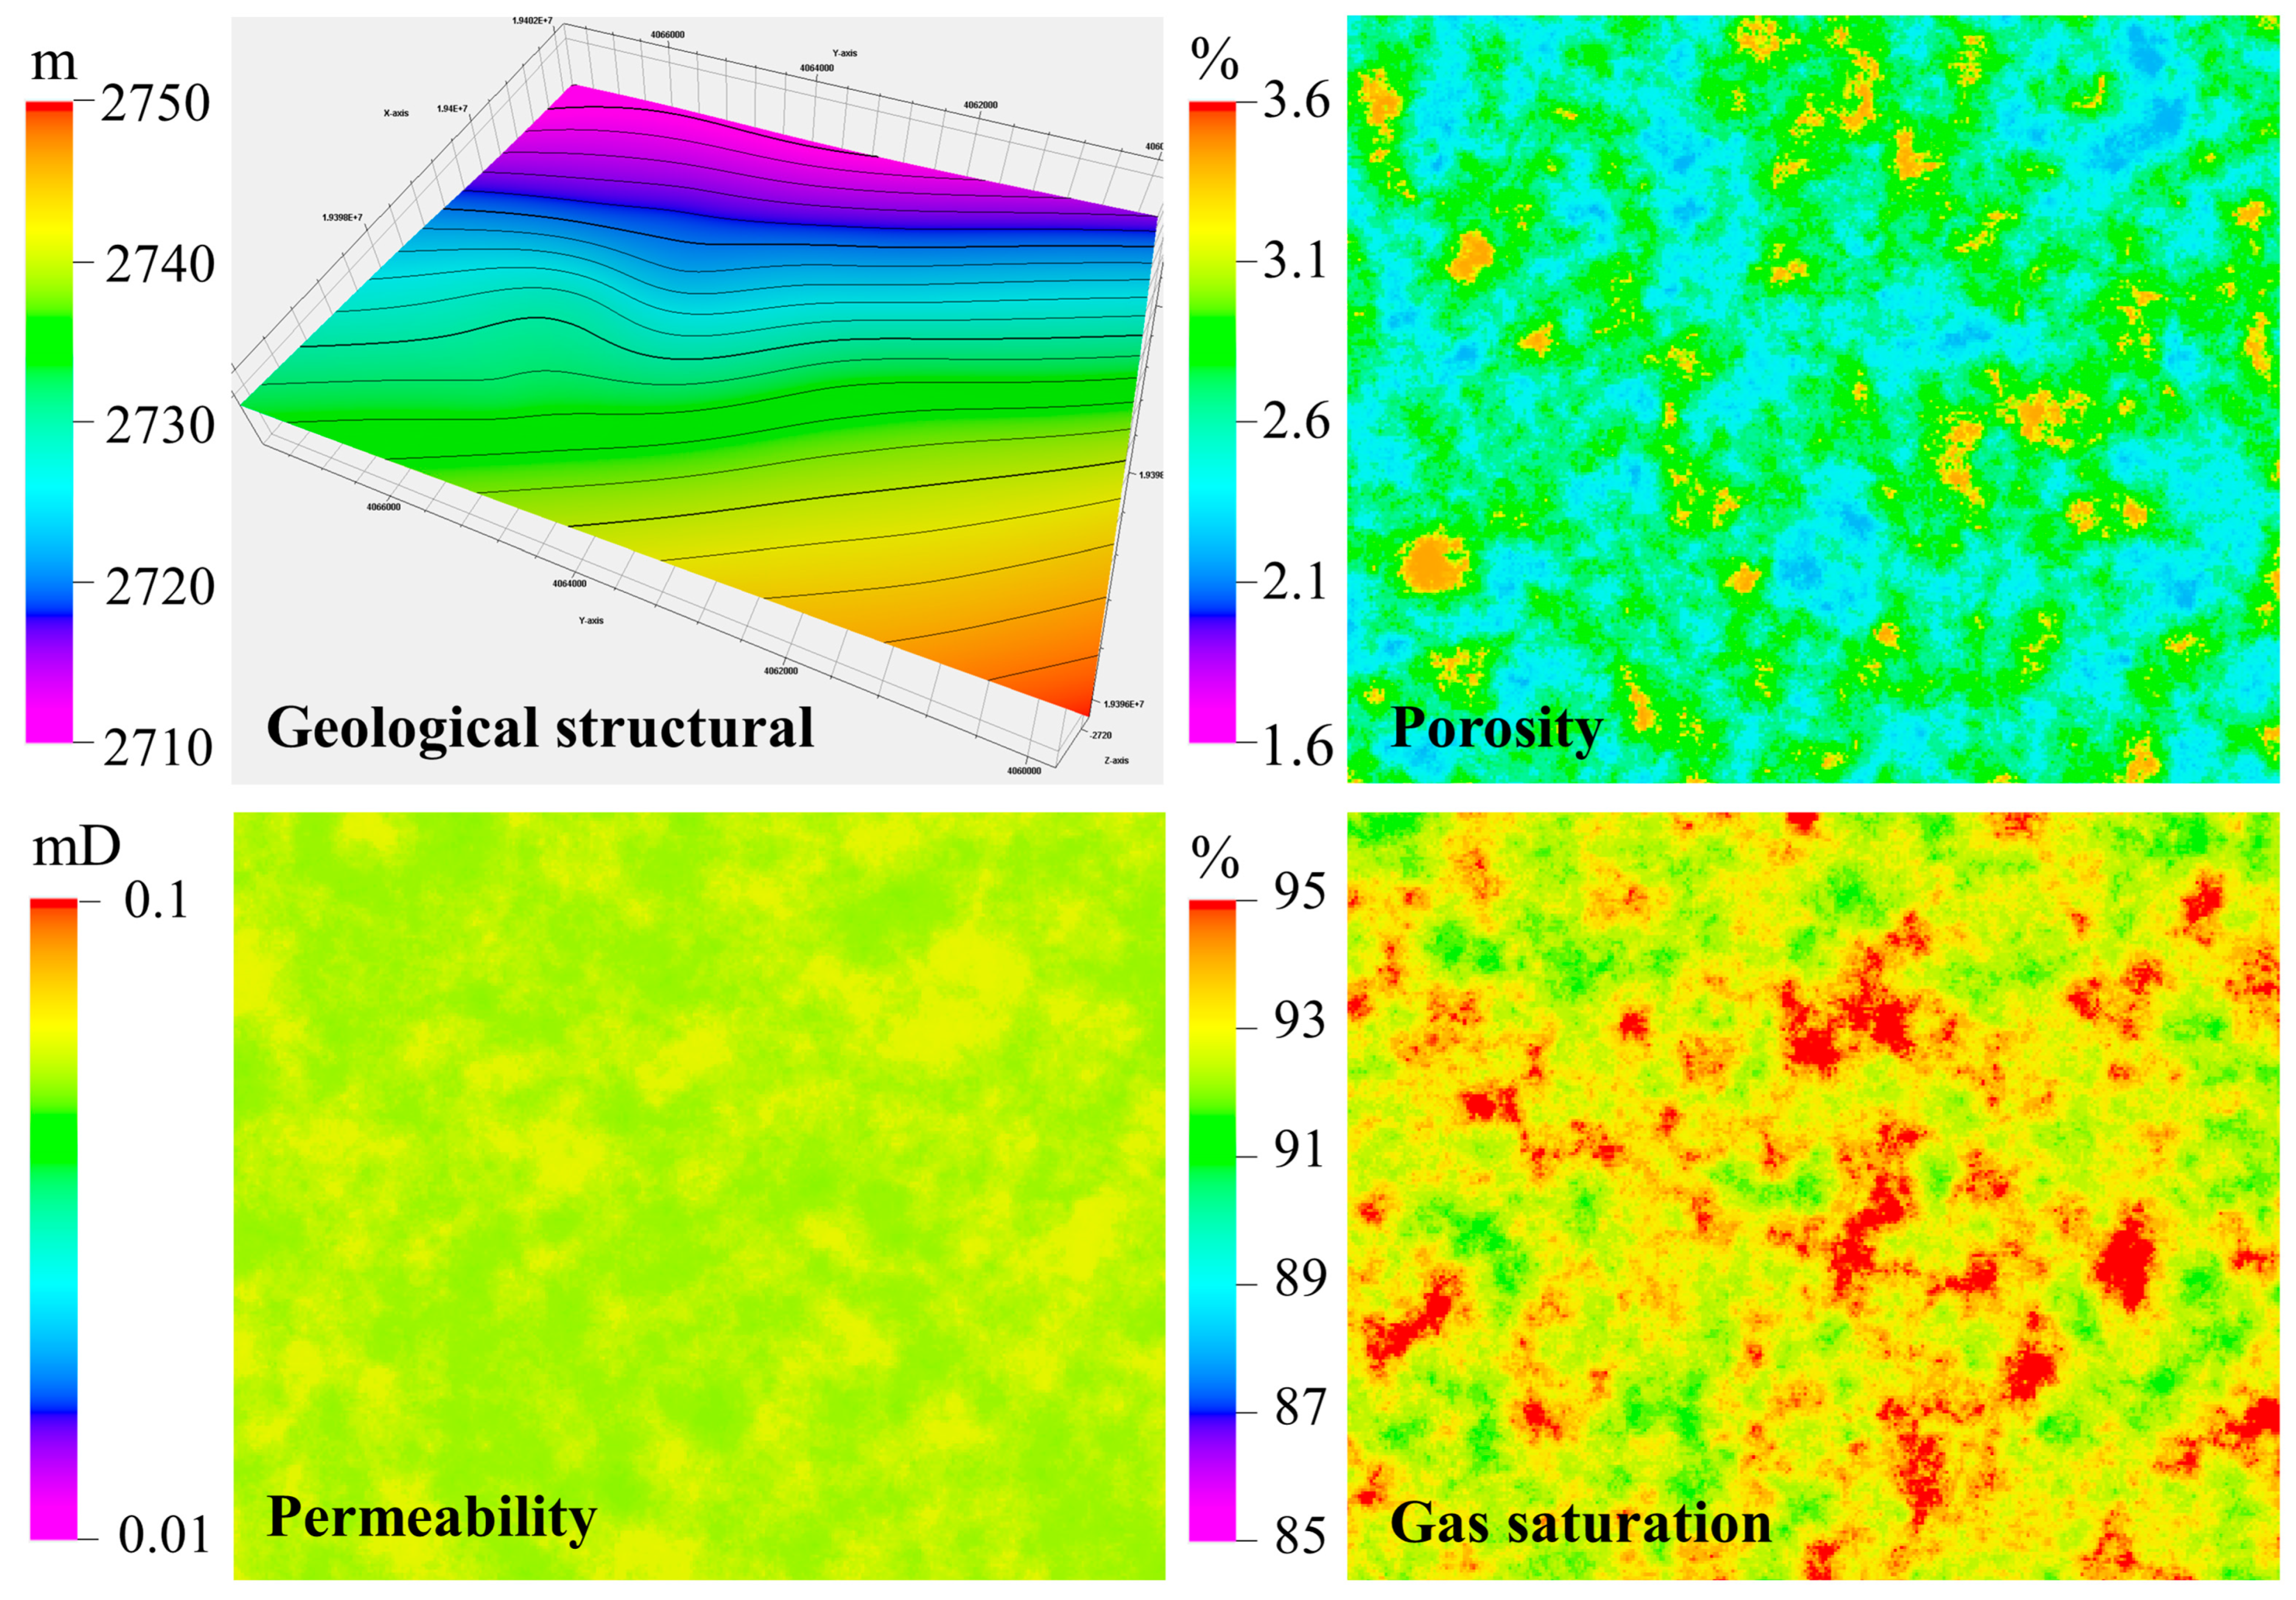
The eastern margin of the Ordos Basin contains abundant deep resources in the Yan’an Gas Field. The No. 8 coal seam of the Benxi Formation, which serves as the primary target reservoir, is characterized by a high gas content and exhibits strong representativeness and considerable exploration and development potential within the region. In this study, the No. 8 coal seam of the Benxi Formation in the N block of the Yan’an Gas Field was selected as the research target. The coal seam has an approximate thickness of 5 m, with limestone as the roof lithology and mudstone as the floor lithology. A three-dimensional structural model and reservoir property model were established, as shown in
Figure 1. First, well location coordinates, well deviation data, and stratigraphic subdivision data from a total of nine target and adjacent wells were collected, and the structural model was constructed based on the characteristics of stratigraphic interfaces. Subsequently, the study area was gridded, and well log interpretation data, including porosity, permeability, and gas saturation, were compiled for all wells. Sequential Gaussian simulation was then employed to perform spatial interpolation of various reservoir parameters, and a three-dimensional reservoir property model was established to provide fundamental data support for subsequent in situ stress field simulations and fracture propagation simulations. The structural and property models covered an area of 6.4 × 7.8 km, with a horizontal grid size of 20 × 20 m. The model consisted of 7 layers and 134,810 grid cells in total. Reservoir properties were distributed using sequential Gaussian simulation constrained by well logging interpretation data. The spatial correlation characteristics derived from well data were considered during the geostatistical modeling process to characterize inter-well heterogeneity. The porosity of the study area ranges from 2.02% to 3.42%, the permeability ranges from 0.040 mD to 0.071 mD, and the free gas saturation exceeds 90%.
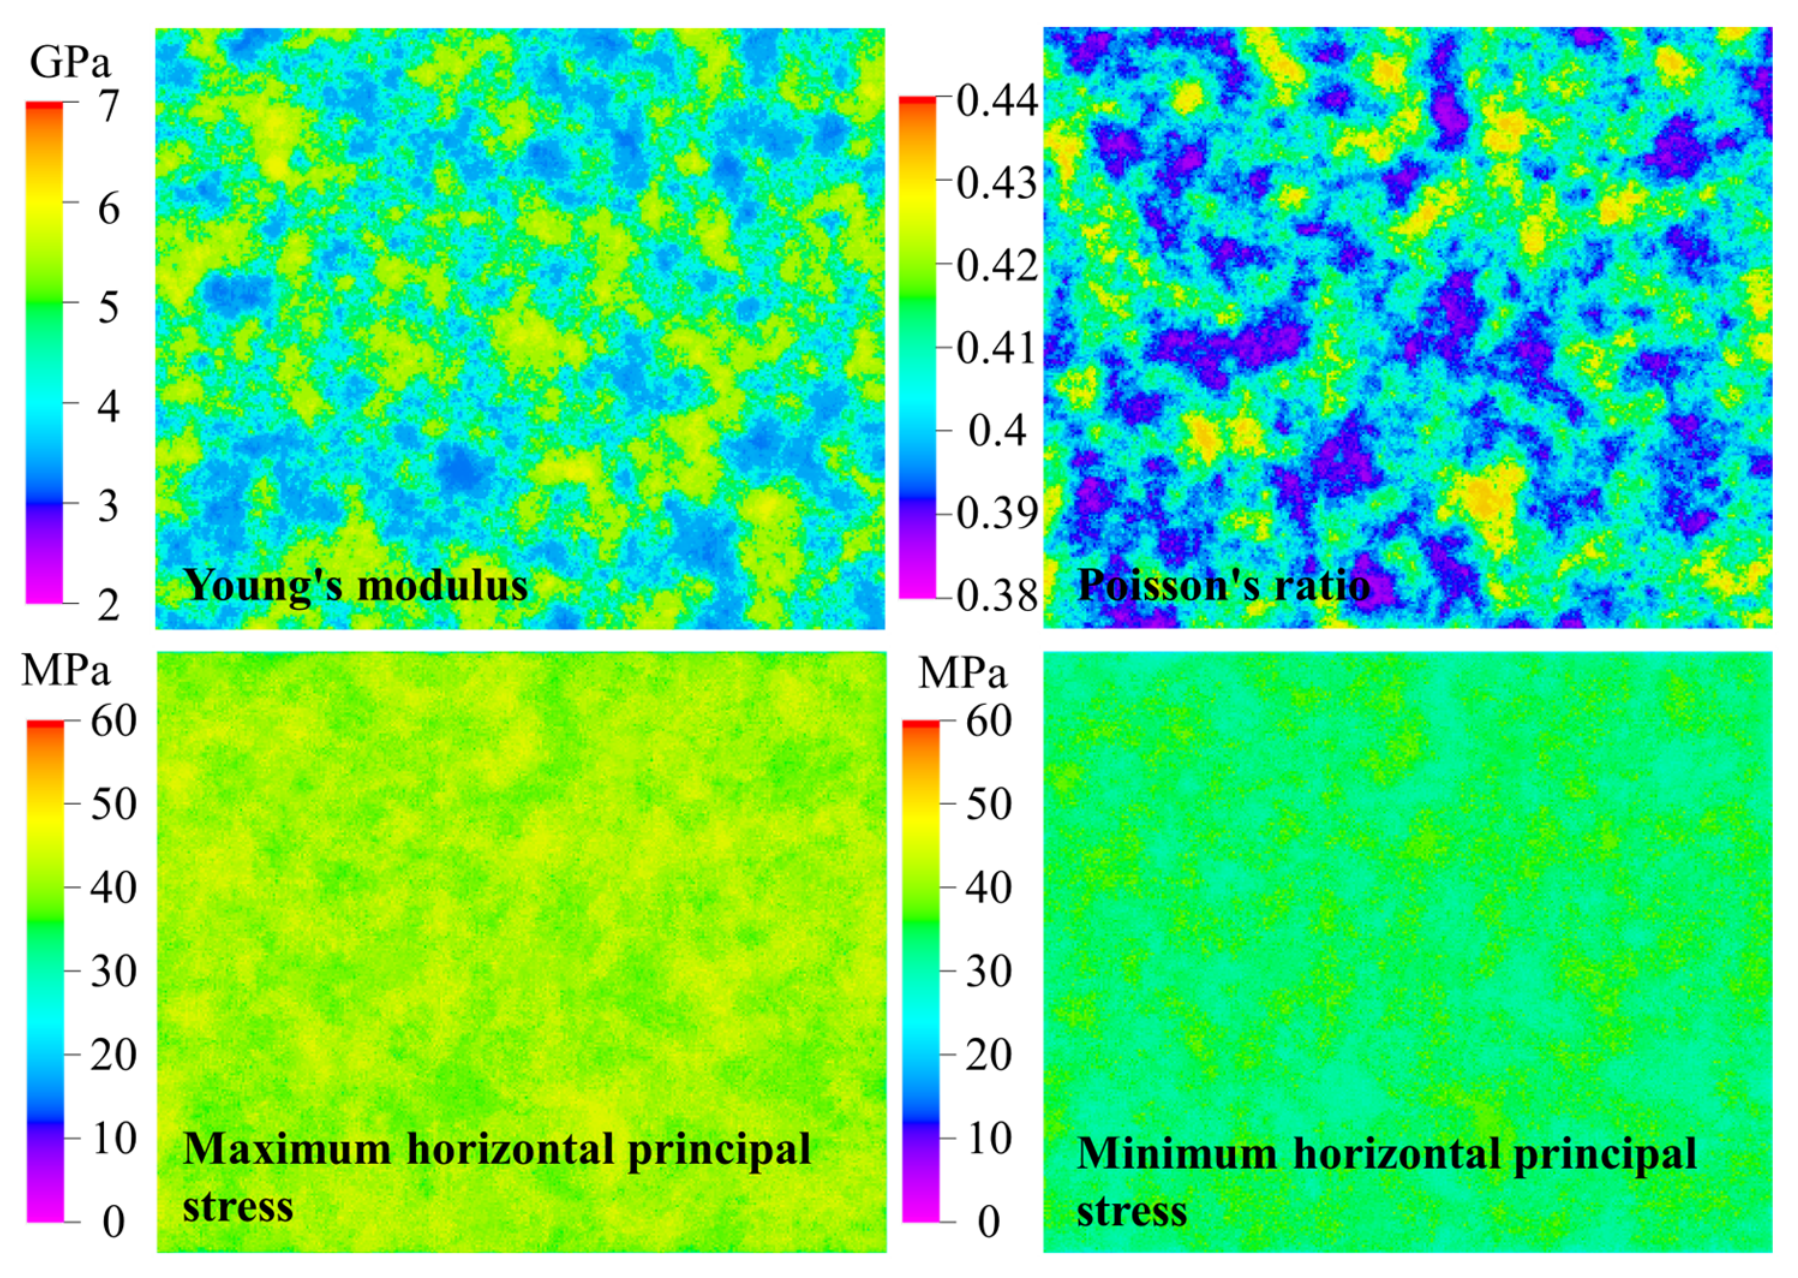
The geomechanical model provides an essential basis for hydraulic fracture propagation simulation, and its accuracy directly determines the reliability of the predicted in situ stress distribution and fracture propagation behavior. In this study, a three-dimensional geomechanical model of the study area was established based on the three-dimensional reservoir property model and well logging data, as shown in
Figure 2. First, static rock mechanical parameters, including Young’s modulus and Poisson’s ratio, were calculated through inversion using well logging data, including natural gamma ray, acoustic transit time, and density, in combination with empirical rock mechanics models. Subsequently, the sequential Gaussian simulation method was employed to establish a three-dimensional rock mechanical model for the study area, enabling detailed spatial characterization of elastic parameters. On this basis, the three-dimensional in situ stress field model was constructed, taking into account factors such as formation burial depth, boundary conditions, and rock mechanical properties. Finally, key model parameters were calibrated according to laboratory rock mechanics experimental results to ensure the accuracy and reliability of the simulation results. In the study area, Young’s modulus ranges from 2.48 GPa to 6.34 GPa, the Poisson’s ratio ranges from 0.39 to 0.43, the maximum horizontal principal stress ranges from 36.58 MPa to 48.34 MPa, and the minimum horizontal principal stress ranges from 30.51 MPa to 44.91 MPa, the vertical stress ranges from 57 to 63 MPa, and the pore pressure ranges from 26.3 to 26.7 MPa. The minimum horizontal principal stress is oriented along the wellbore direction, resulting in stress anisotropy that controls the preferential propagation direction of hydraulic fractures.
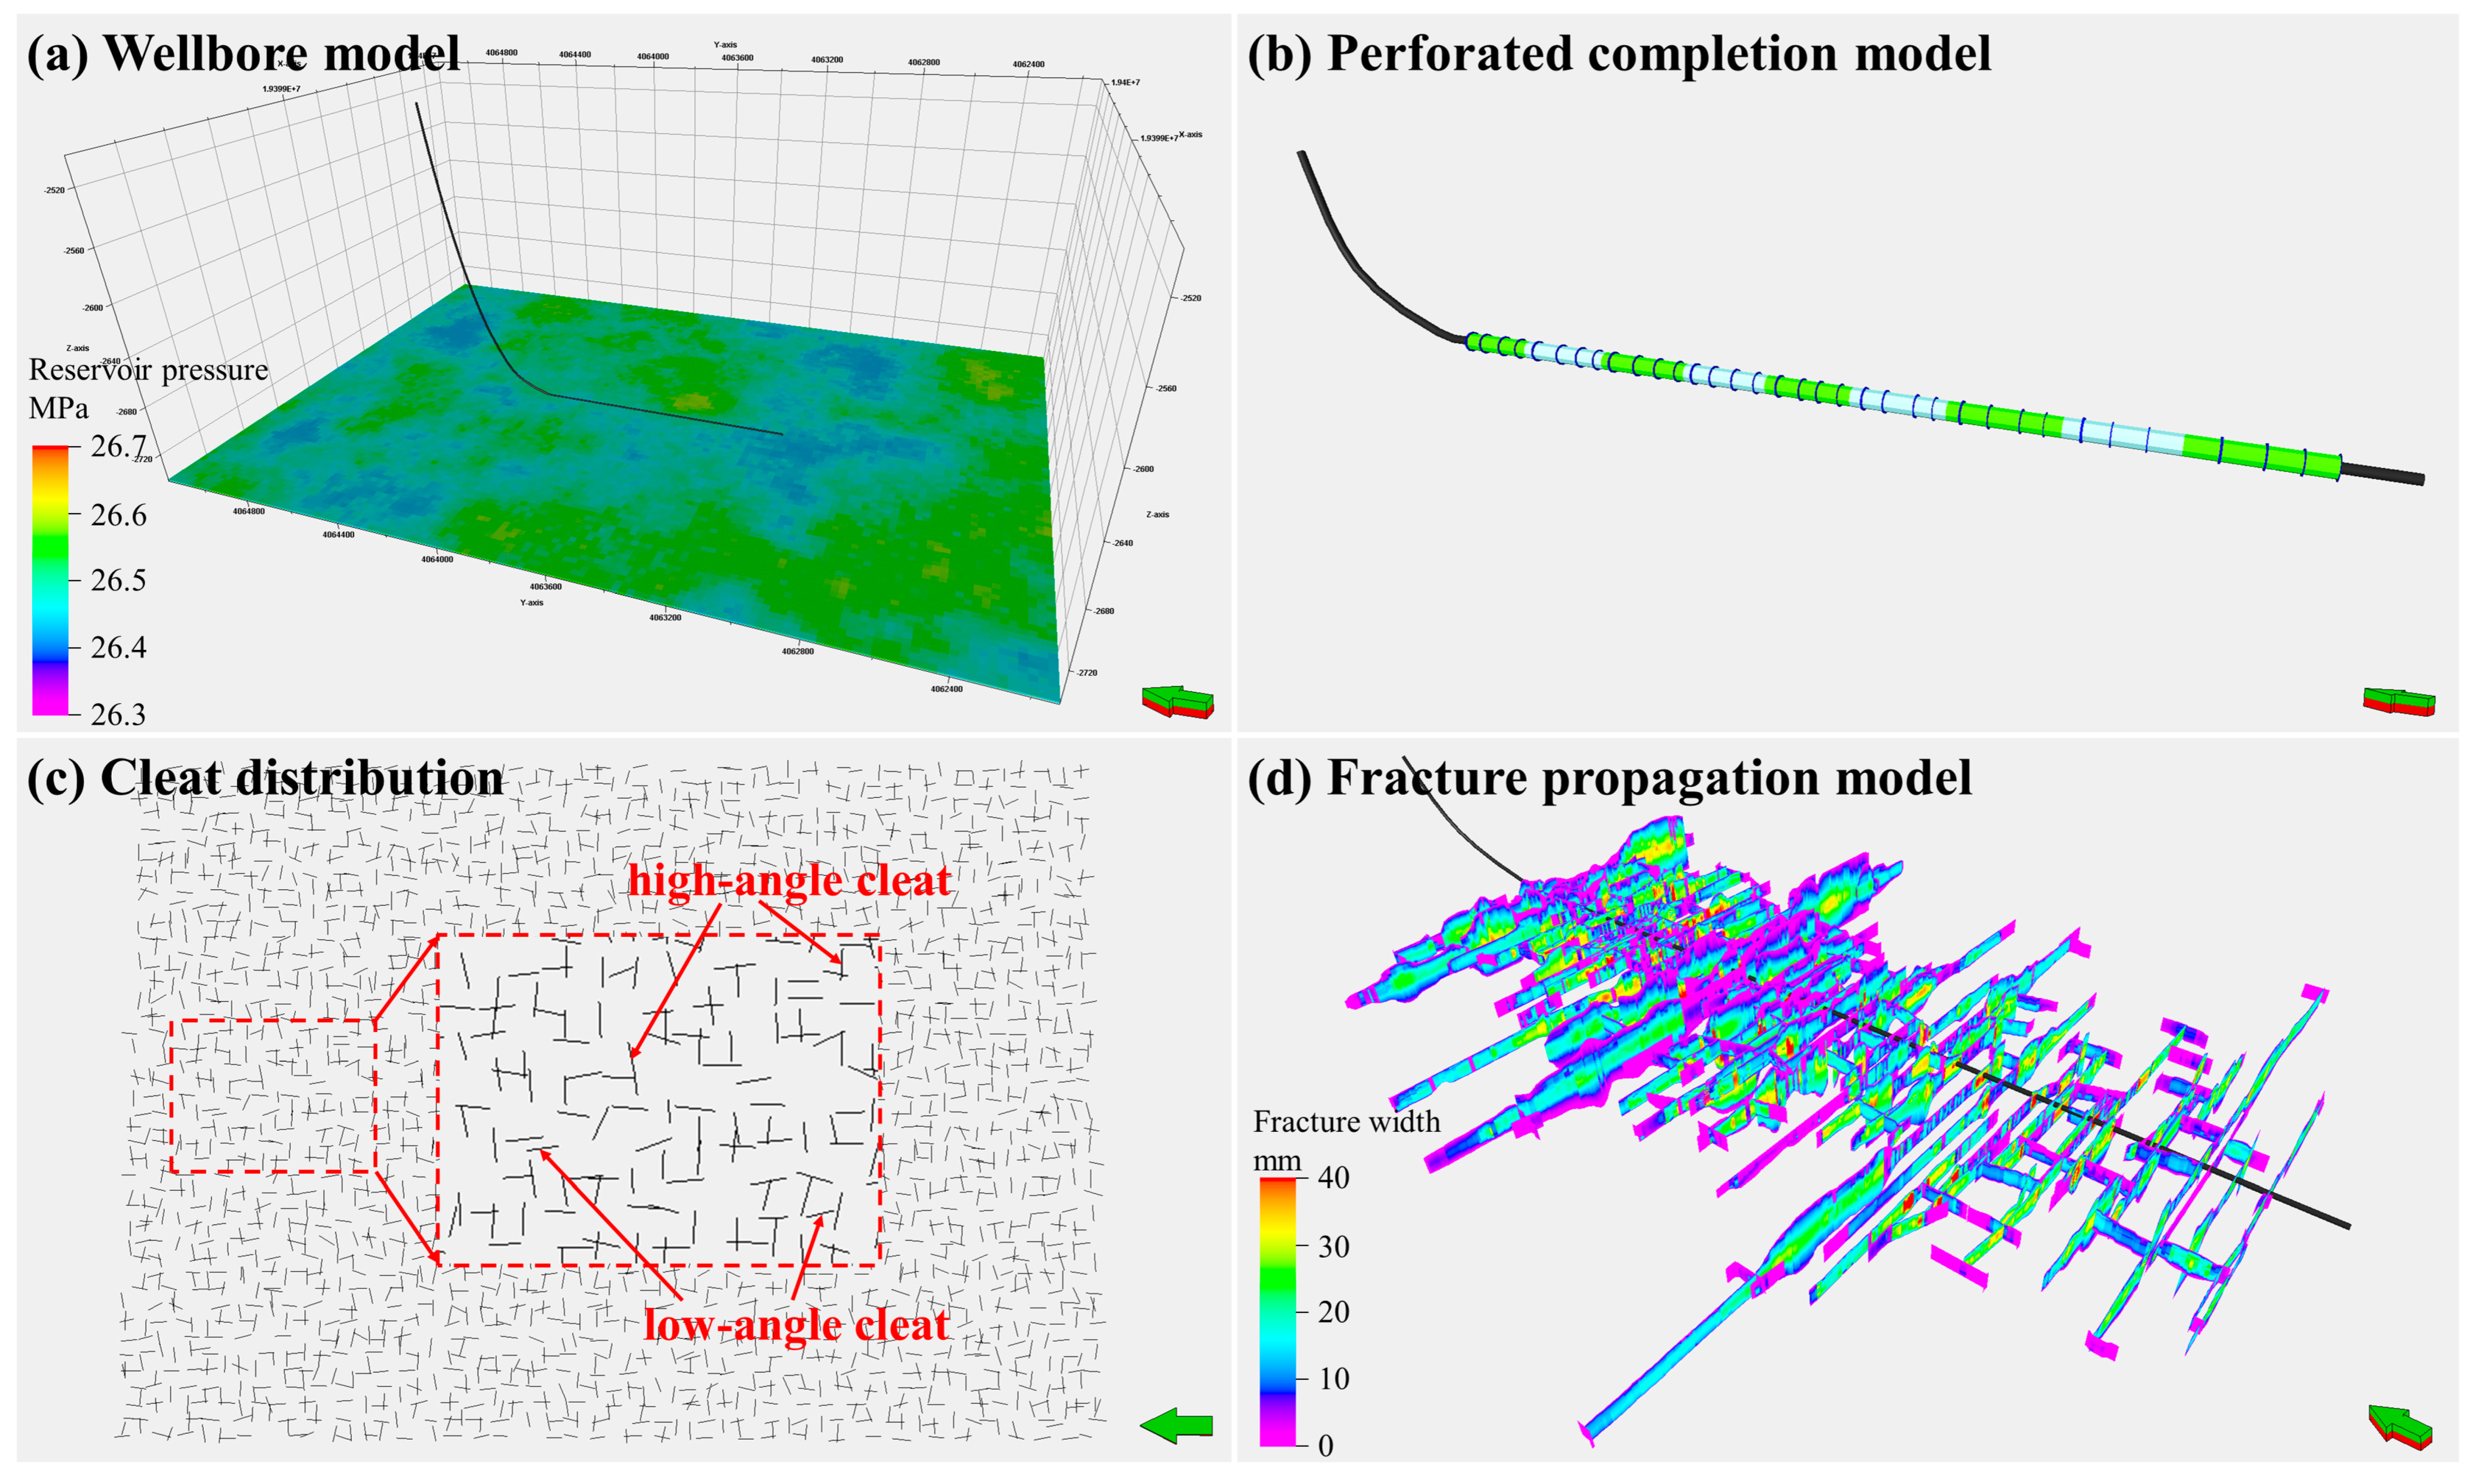
Well JY1, located in the N block of the Yan’an Gas Field, is a typical horizontal well deployed in the No. 8 coal seam of the Benxi Formation. The well has a true vertical depth of 2743 m and a horizontal section length of 1000 m. Based on the geomechanical model, a three-dimensional fracture propagation model was established for Well JY1, as shown in
Figure 3. Well JY1 was hydraulically fractured in nine stages, with four perforation clusters in each stage, and all perforation clusters successfully initiated and propagated fractures. The stage spacing and cluster spacing were non-uniformly distributed, mainly ranging from 20 to 30 m. The perforation density was 16 shots/m, the perforation phasing was 60°, and the tubing/casing diameter was 139.7 mm. Two dominant cleat sets were incorporated into the fracture propagation model, with orientations of approximately 90° ± 10° and 0° ± 10°, representing the main and secondary cleat systems of the No. 8 coal seam. Based on available experimental characterization data, the cleat length ranges from 5 to 15 m. These cleat parameters were used to characterize the spatial distribution of natural fractures and their interaction with propagating hydraulic fractures. First, a wellbore model was established according to completion data by defining tubing and casing parameters. Subsequently, a perforation completion model was developed by specifying perforation locations, perforation density, perforation diameter, and other relevant parameters. Then, a natural cleat network was incorporated into the model based on laboratory experimental data, enabling detailed characterization of the spatial distribution of cleats. After that, the pumping schedule was established according to the field hydraulic fracturing design. Finally, three-dimensional fracture propagation simulations were carried out.
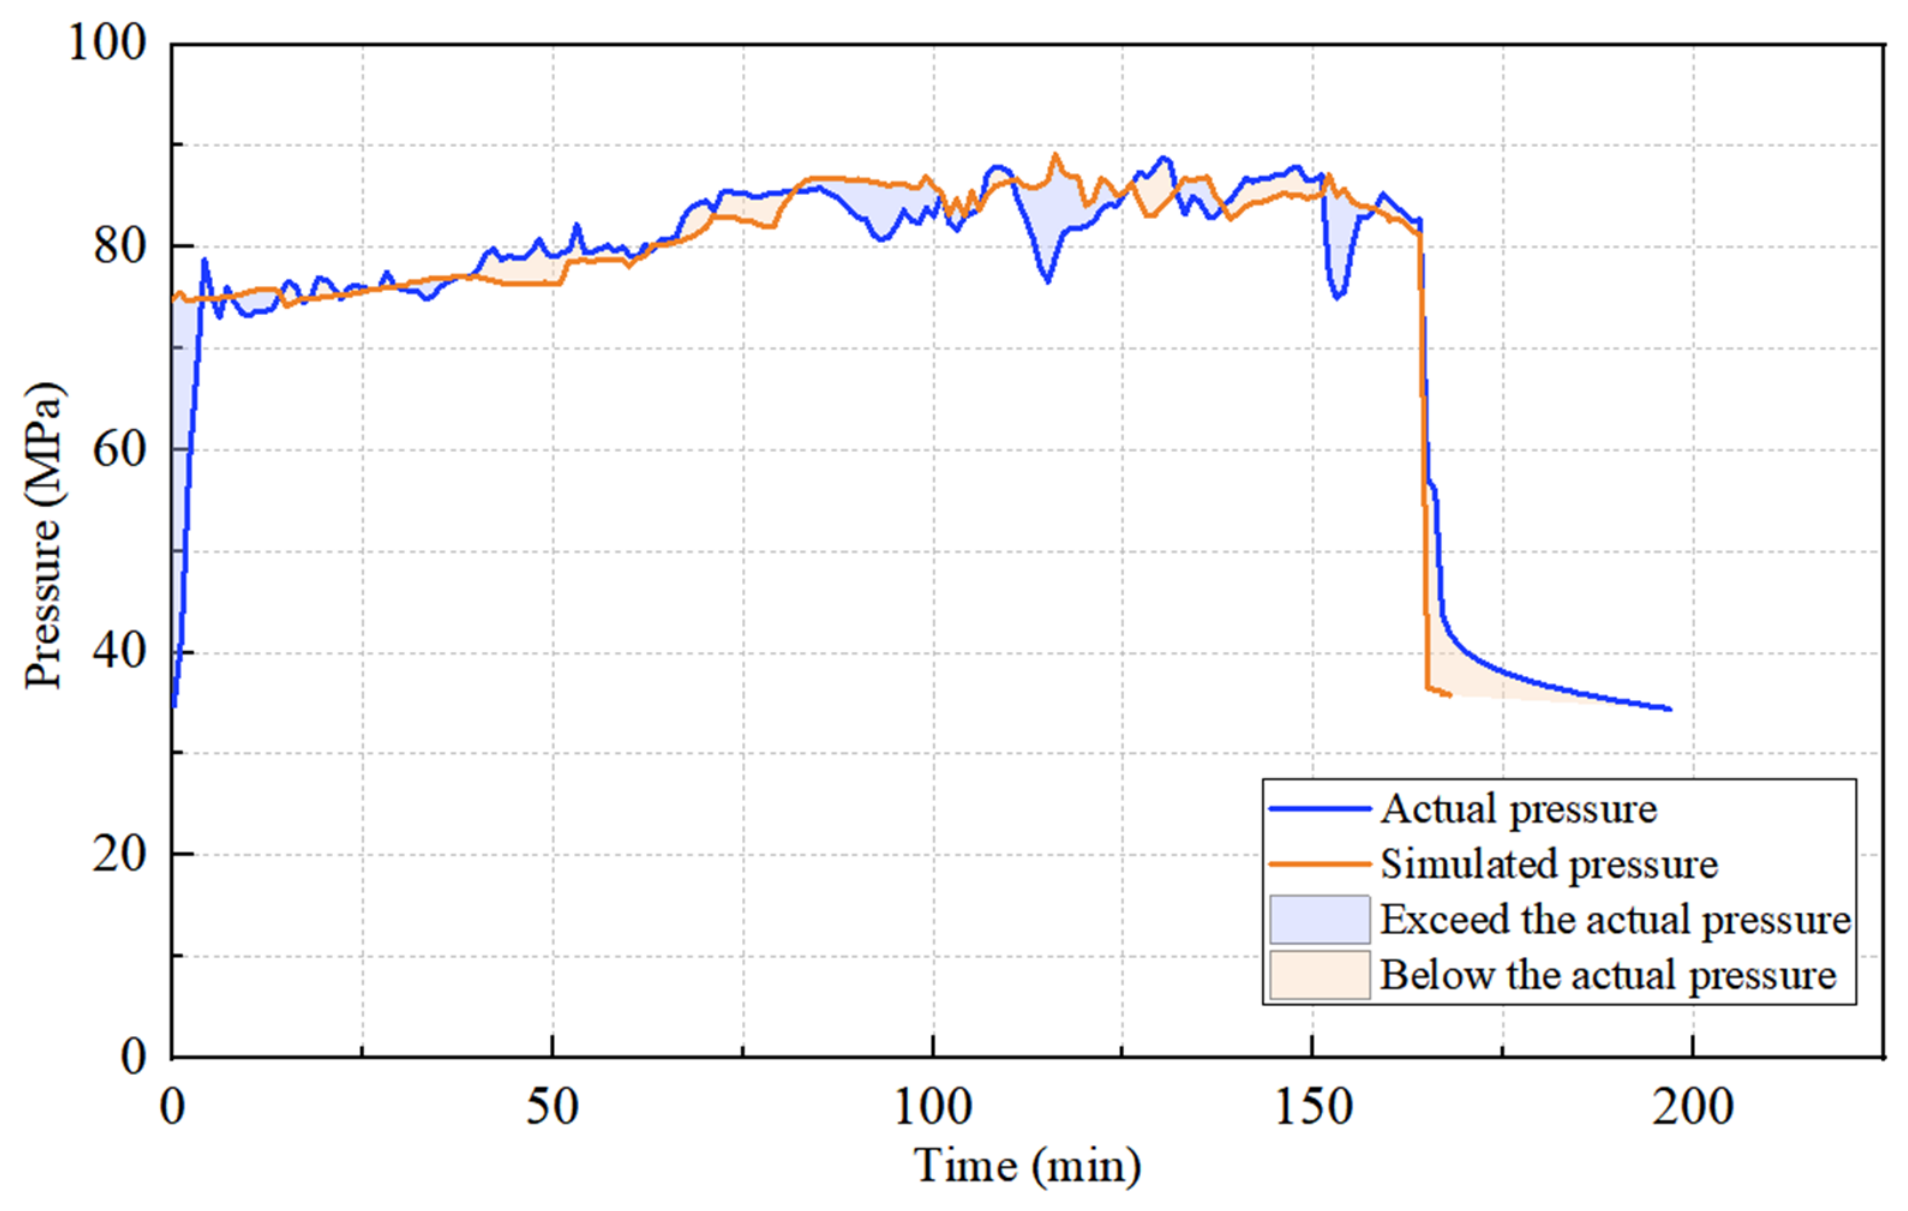
To further improve the predictive accuracy of the model, the fracture propagation model was calibrated through history matching between field treatment data and simulated pressure responses. By comparing the tubing pressure curve recorded during the field operation with the simulated pressure curve, key parameters, including cleat properties and the fluid leak-off coefficient, were continuously adjusted to progressively improve the agreement between the simulation results and field observations. As shown in
Figure 4, a high degree of consistency is observed between the simulated and measured pressure responses. The agreement between the two curves was further quantitatively evaluated using the root mean square error (RMSE), mean absolute error (MAE), and normalized pressure error. The calculated RMSE and MAE are 5.35 MPa and 2.97 MPa, respectively, with a normalized pressure error of approximately 6.7%, indicating good agreement between the simulation results and field observations. These results demonstrate that the established fracture propagation model can accurately represent the hydraulic fracturing process within the reservoir. In addition to pressure response matching, the predicted fracture geometry was further validated using field fracture monitoring data. The average propped fracture length obtained from the simulation was 341.01 m, which was comparable to the results obtained from wide-area electromagnetic monitoring (323 m) and high-frequency pressure monitoring (362 m). The consistency between the simulated and monitored fracture lengths demonstrates that the model can reasonably reproduce fracture propagation behavior and provides further confidence in its capability to predict fracture network characteristics.
3. Numerical Simulation Results
Using the numerical model established in
Section 2, fracture propagation simulations were conducted to investigate the effects of different hydraulic fracturing parameters on fracture development in deep CBM reservoirs of the Yan’an Gas Field. The fracturing fluid injection rate, fluid volume per stage, and proppant volume per stage are considered three key parameters influencing fracture propagation in deep coal reservoirs. Therefore, this study focuses on analyzing the effects of these three parameters on the evolution characteristics of two-dimensional fracture geometries, three-dimensional fracture width distributions, and the distribution locations and concentrations of different types of proppants within fractures. The fracture propagation characteristics are evaluated based on three parameters: the average propped fracture length, which represents the average extension length of propped fractures; the per stage stimulated reservoir volume (SRV), which represents the total fracture volume and is calculated as the sum of the injected fluid volume and proppant volume minus the fluid loss volume; and the complexity of the fracture network. With all other parameters kept constant, single-factor simulations were performed by varying individual parameters to investigate their influence mechanisms on fracture propagation.
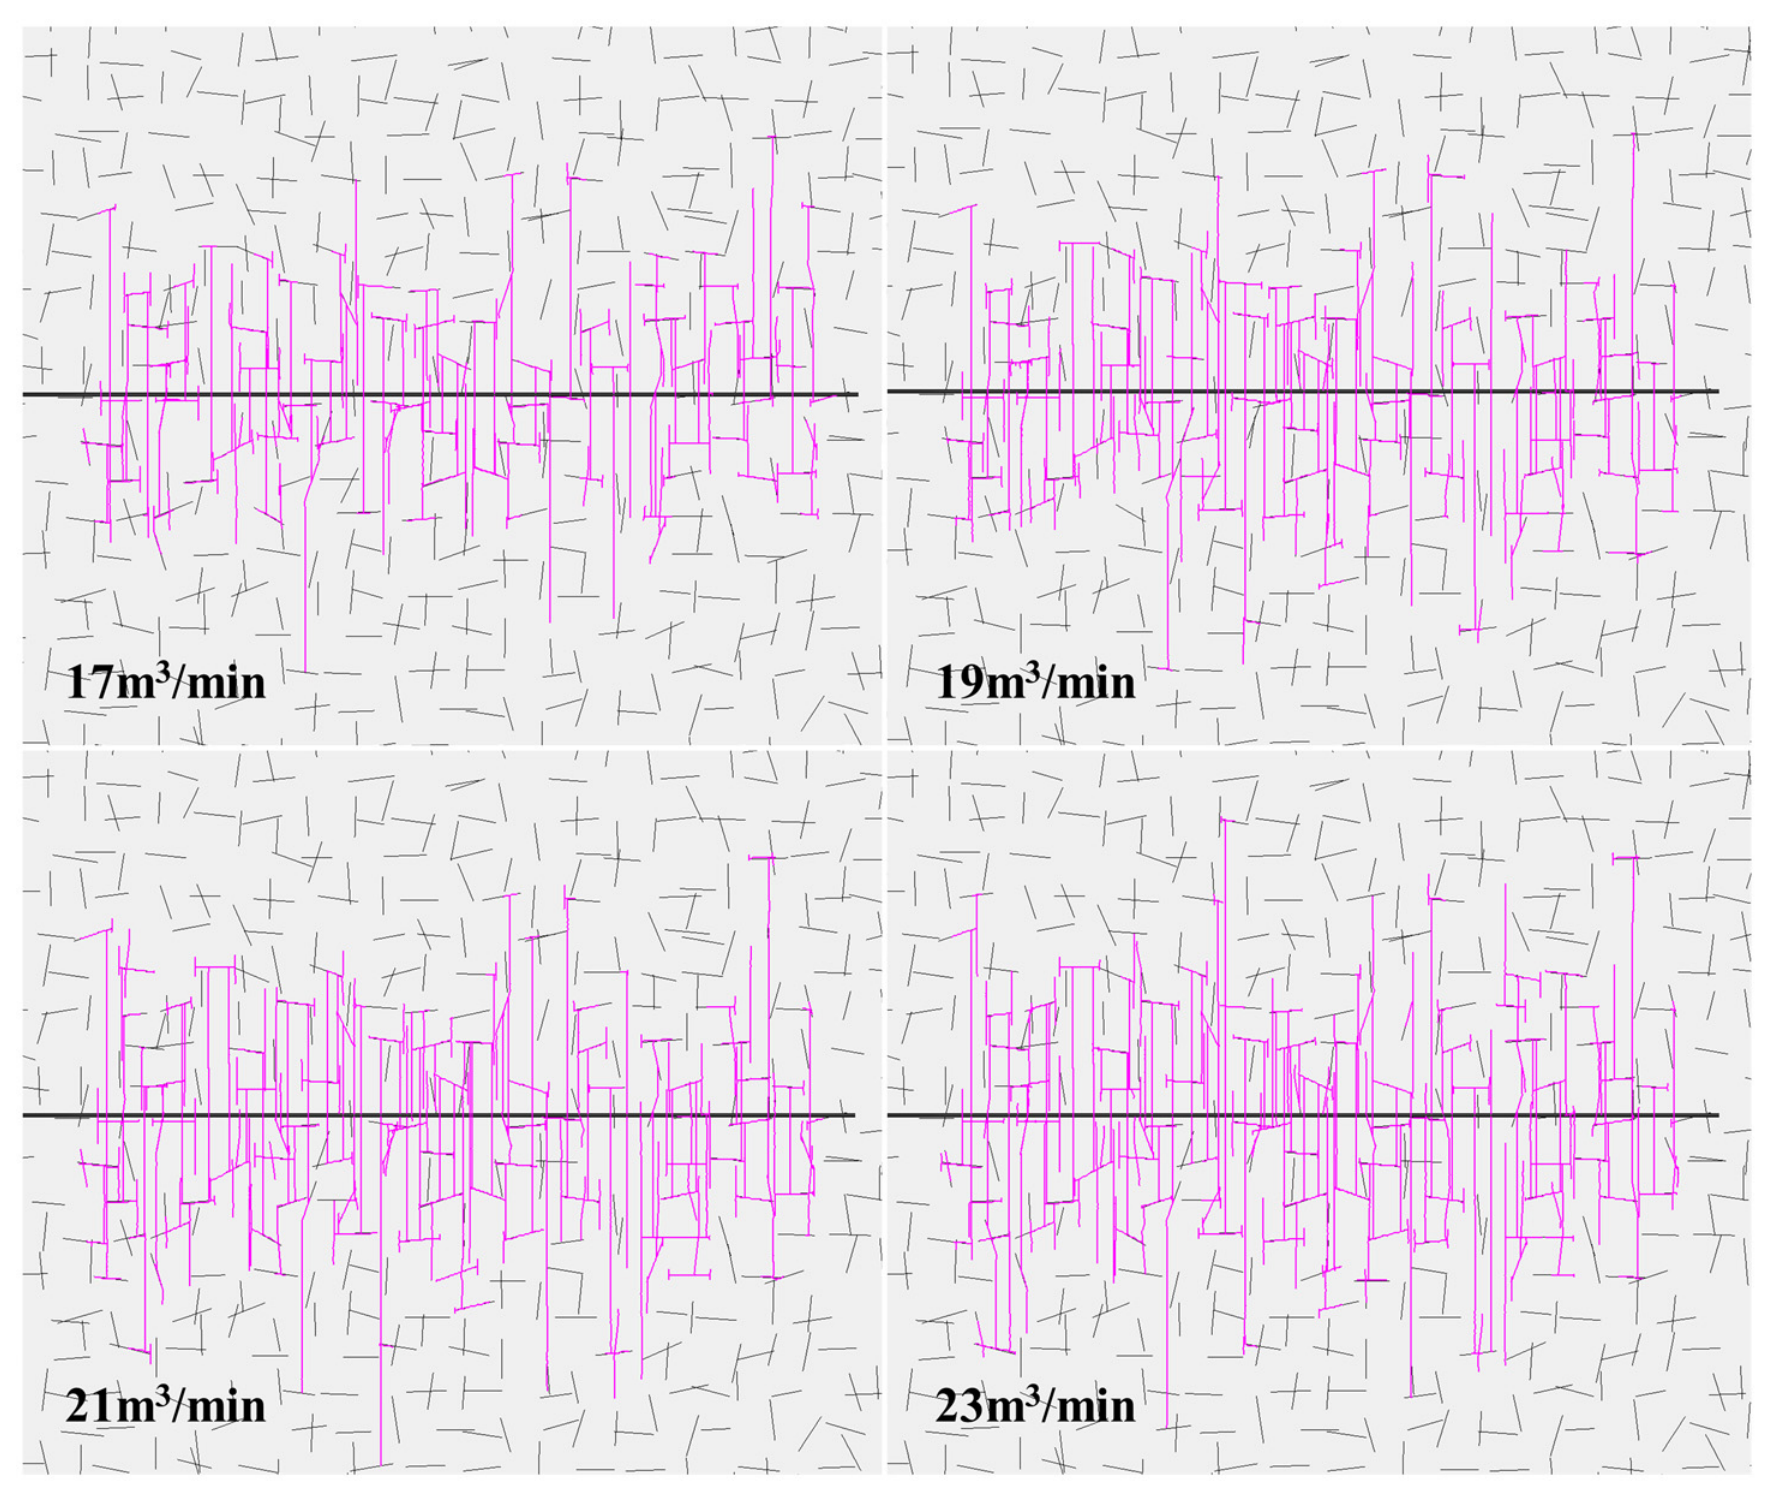
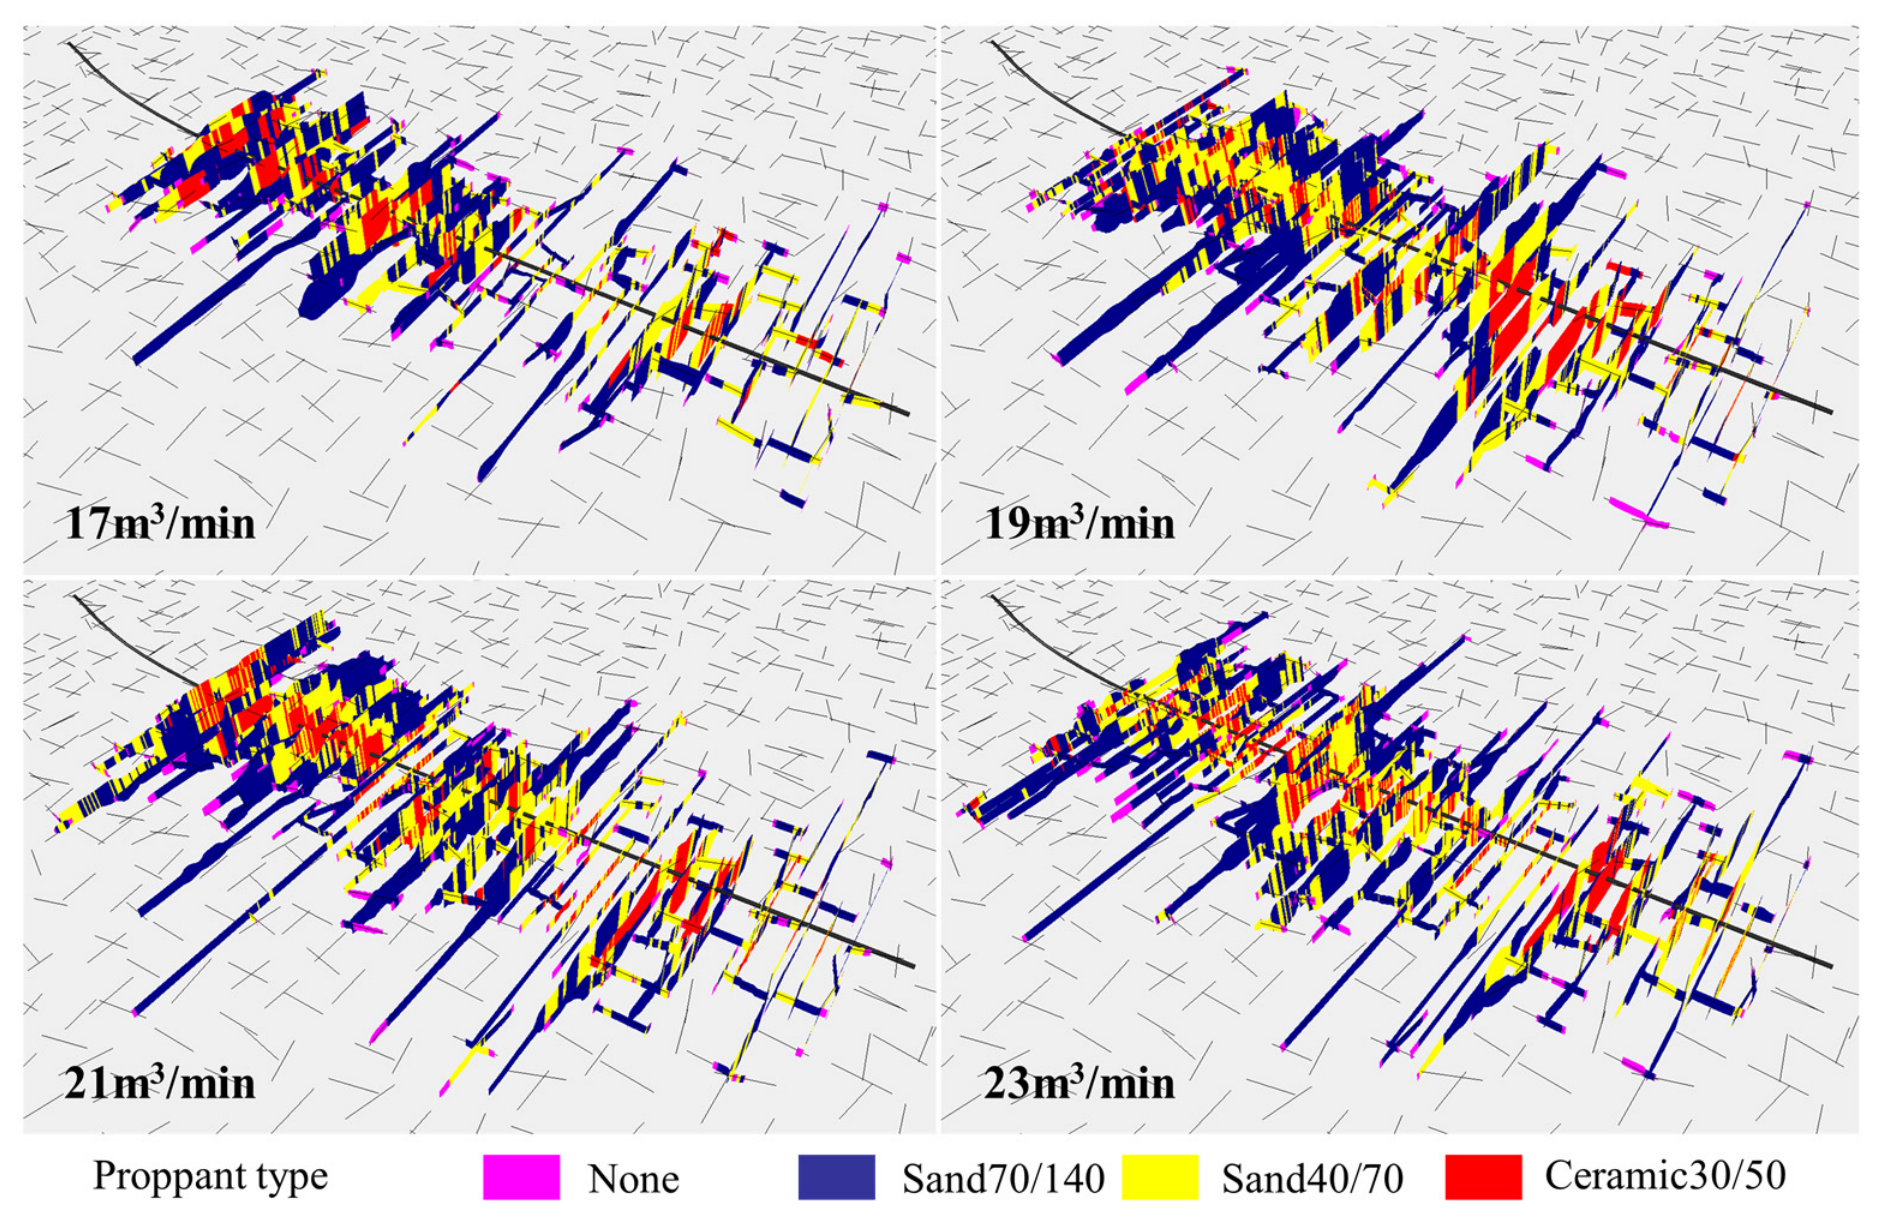
As shown in
Figure 5, the nine fracture clusters propagated sequentially from right to left. Under different injection rates, the main fractures consistently extended along the preferential direction and continuously intersected randomly distributed cleats, forming approximately step-like and zigzag branch networks. At an injection rate of 17 m
3/min, some main fractures turned along the cleats after intersecting them, resulting in relatively short branch fractures, while considerable unconnected regions remained between adjacent clusters. This indicates that the fluid energy was primarily consumed by the opening of near-wellbore fractures. When the injection rate increased to 19–21 m
3/min, the capability of main fractures to cross or connect cleats was enhanced, and the number of branch fractures and the degree of lateral overlap increased, gradually forming continuous fracture networks between adjacent hydraulic fracturing clusters. At 23 m
3/min, distal fractures and long branches became more developed; however, some main fractures tended to extend directionally over long distances. The additional fluid was increasingly used to propagate existing fracture channels rather than fully generating new branches. Statistical results also show that within the range of 17–23 m
3/min, the average propped fracture extension length increased from 331.73 m to 363.64 m, representing an increase of approximately 9.6%, whereas the stimulated reservoir volume decreased from 338.67 m
3 to 308.11 m
3. This indicates that an increase in propped fracture length does not necessarily correspond to a simultaneous increase in stimulated volume. This discrepancy suggests that a higher injection rate enhances the driving force at fracture tips and the connectivity of main fractures, but may also cause fluid to preferentially enter a limited number of low-resistance dominant fractures, thereby reducing the uniform activation of surrounding cleats. Therefore, the effect of injection rate on coal seam fracture networks transitions from insufficient near-wellbore branching to multi-cleat communication and subsequently to dominant fracture channel extension. A moderate injection rate is more favorable for balancing propped fracture length and planar coverage.
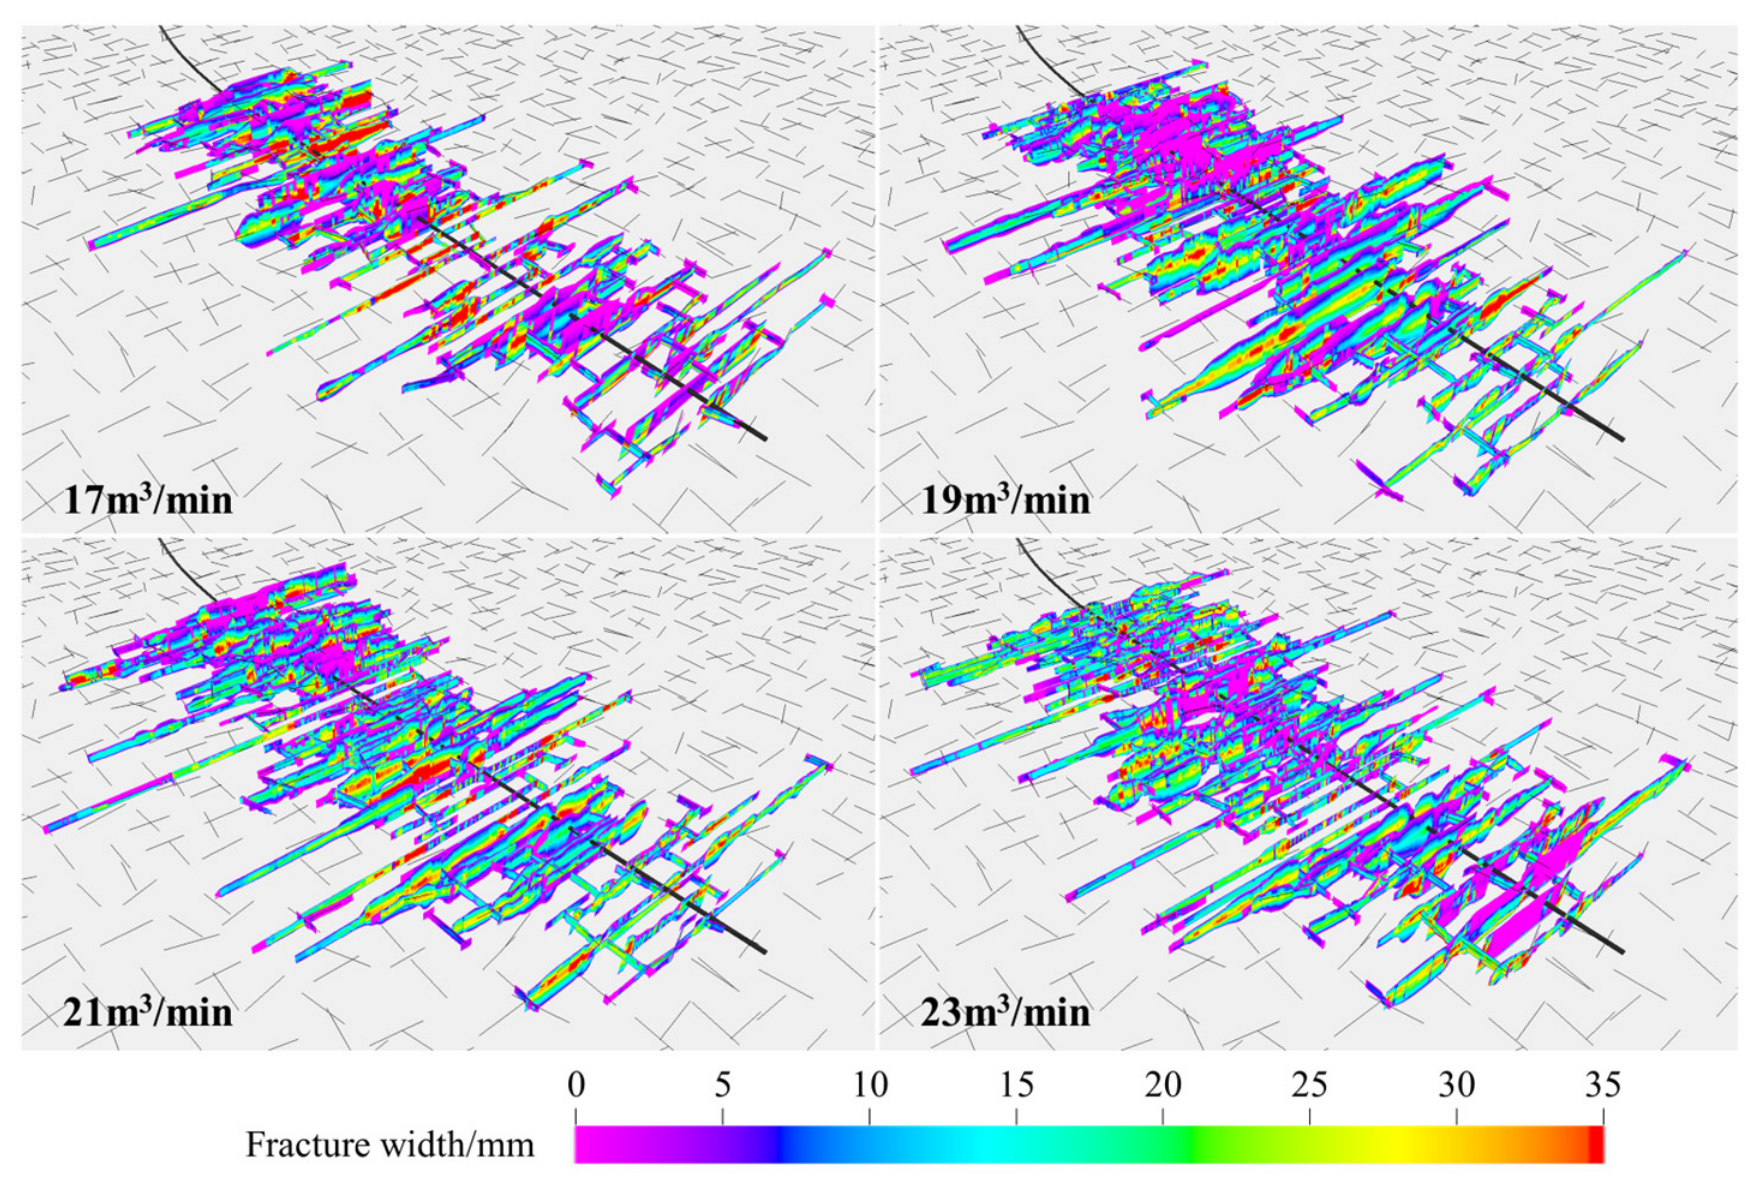
As shown in
Figure 6, all four cases exhibit significant spatial heterogeneity in fracture width. The wider fracture zones mainly occur along the main fractures, near perforation clusters, and at the intersections between main fractures and cleats, whereas distal minor branches generally maintain relatively low widths. At an injection rate of 17 m
3/min, wide fractures are mainly concentrated in a limited number of main fracture segments, while branch fractures are dominated by purple and blue regions, indicating that the flow rate and net pressure entering secondary fractures are limited. When the injection rate increases to 19–21 m
3/min, the cyan-green wide-width zones extend toward more branch fractures and distal regions, and local widening occurs at the intersections between main fractures and cleats. This is attributed to the redistribution of fluid at intersection nodes and the simultaneous opening and propping of multiple fractures. At 23 m
3/min, the fracture coverage area is further expanded; however, the high-width regions do not increase synchronously across all fractures. Some main fractures still exhibit medium-to-low widths, reflecting the diversion of fluid into longer and more complex fracture systems. According to the corresponding statistical results, the average propped fracture width varies from 14.98 mm at 17 m
3/min to 13.97 mm at 23 m
3/min, showing no monotonic increase with injection rate. This indicates that increasing the injection rate primarily enhances fracture propagation capacity and cleat activation range. However, after a large number of new branches are activated, the flow rate and proppant available for individual fractures may decrease, resulting in a dilution effect on the average fracture width. Therefore, the effectiveness of injection rate should not be evaluated solely based on the maximum local fracture width; instead, the continuity of wide fractures, the effective activation ratio of branch fractures, and the uniformity of fracture width distribution among different clusters should also be considered.
As shown in
Figure 7, the dark blue distribution range of 70/140 mesh quartz sand is the widest, allowing it to enter the distal regions of main fractures and a large number of narrow branch fractures, indicating that smaller-sized proppants exhibit stronger transport and diversion capabilities with the fracturing fluid. The 40/70 mesh quartz sand is mainly distributed in the middle sections of main fractures, branch fracture entrances, and local intersection nodes, and its penetration into fine cleats is weaker than that of 70/140 mesh quartz sand. The red regions representing 30/50 mesh ceramic proppant are generally more concentrated, mainly occurring near the wellbore, within main fractures, and in dominant channels with larger widths, indicating that the larger particle size and higher settling tendency restrict its transport into distal narrow fractures. At 17 m
3/min, the differentiation among proppants with different particle sizes is the most significant, with distal branches dominated by 70/140 mesh quartz sand, while coarser proppants are concentrated in a limited number of main fractures. When the injection rate increases to 19–23 m
3/min, the transport distances of 40/70 mesh quartz sand and ceramic proppant along the main fractures increase, and they can enter some sufficiently opened branch fracture entrances. However, distal fine branches remain mainly occupied by 70/140 mesh quartz sand. The underlying reason is that increasing the injection rate enhances suspension and proppant-carrying capacity while increasing branch fracture apertures, allowing coarser particles to enter fracture entrances that originally exhibited particle size screening effects. Consequently, a graded proppant placement structure is formed, characterized by “fine sand occupying distal regions and narrow branches, coarser quartz sand bridging the middle sections, and ceramic proppant supporting wide near-wellbore fractures.” This structure is beneficial for simultaneously maintaining fracture network coverage and the conductivity of dominant flow channels.
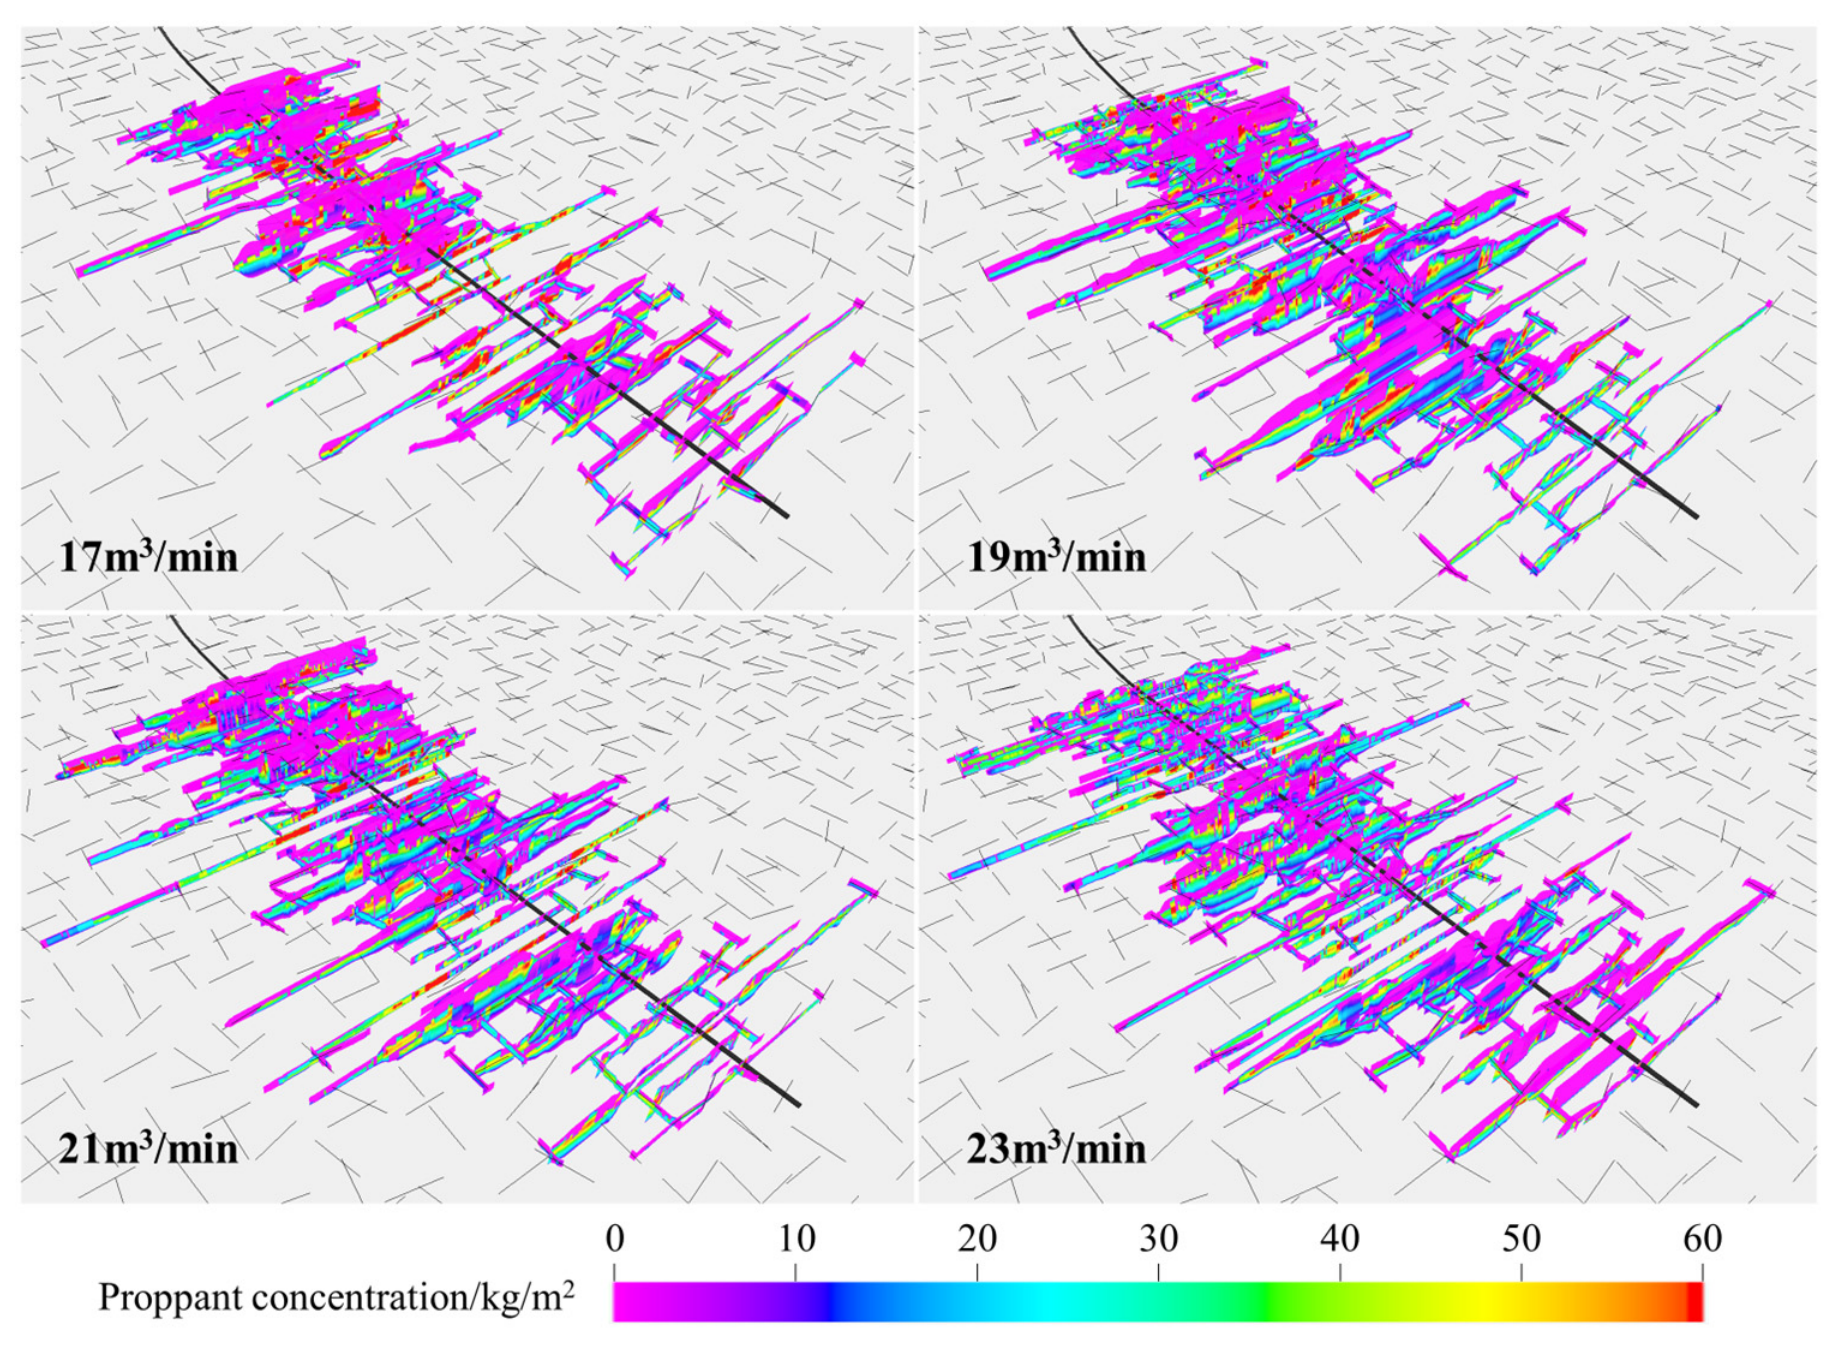
As shown in
Figure 8, the proppant placement concentration generally exhibits a distribution pattern characterized by higher concentrations in main fractures and lower concentrations in branch fractures, with a gradual attenuation from the near-wellbore region toward the fracture tips. This indicates that particle settling, fluid diversion, and narrow fracture screening collectively control the in-fracture proppant concentration distribution. At 17 m
3/min, most fractures exhibit purple to blue regions, and only a few main fracture nodes show relatively high concentrations, indicating that proppants have limited ability to enter complex branch networks under low injection rates. At 19–21 m
3/min, the cyan-green regions increase significantly, and high-concentration zones extend from the main fractures toward the distal regions. Local enrichment occurs at the intersections between main fractures and cleats. These intersection nodes serve not only as locations for flow redistribution but also as regions where fracture width changes abruptly and flow velocity decreases, making them prone to proppant settling and bridging, thereby forming high-concentration patches. At 23 m
3/min, the transport distance of proppants continues to increase; however, some newly activated branches remain dominated by low concentrations, indicating that a high injection rate expands the accessible fracture space while simultaneously dispersing a limited amount of proppant over a larger fracture area. The statistical results show that fracture conductivity decreases from 790.30 mD·m at 17 m
3/min to 729.67 mD·m at 23 m
3/min, further demonstrating that enlarging the fracture network does not necessarily improve the average effective proppant support level. Therefore, an appropriate injection rate should enable proppants to pass through near-wellbore main fractures and reach distal regions while avoiding thin-layer placement and a large number of inadequately supported branch fractures caused by excessive fracture area expansion.
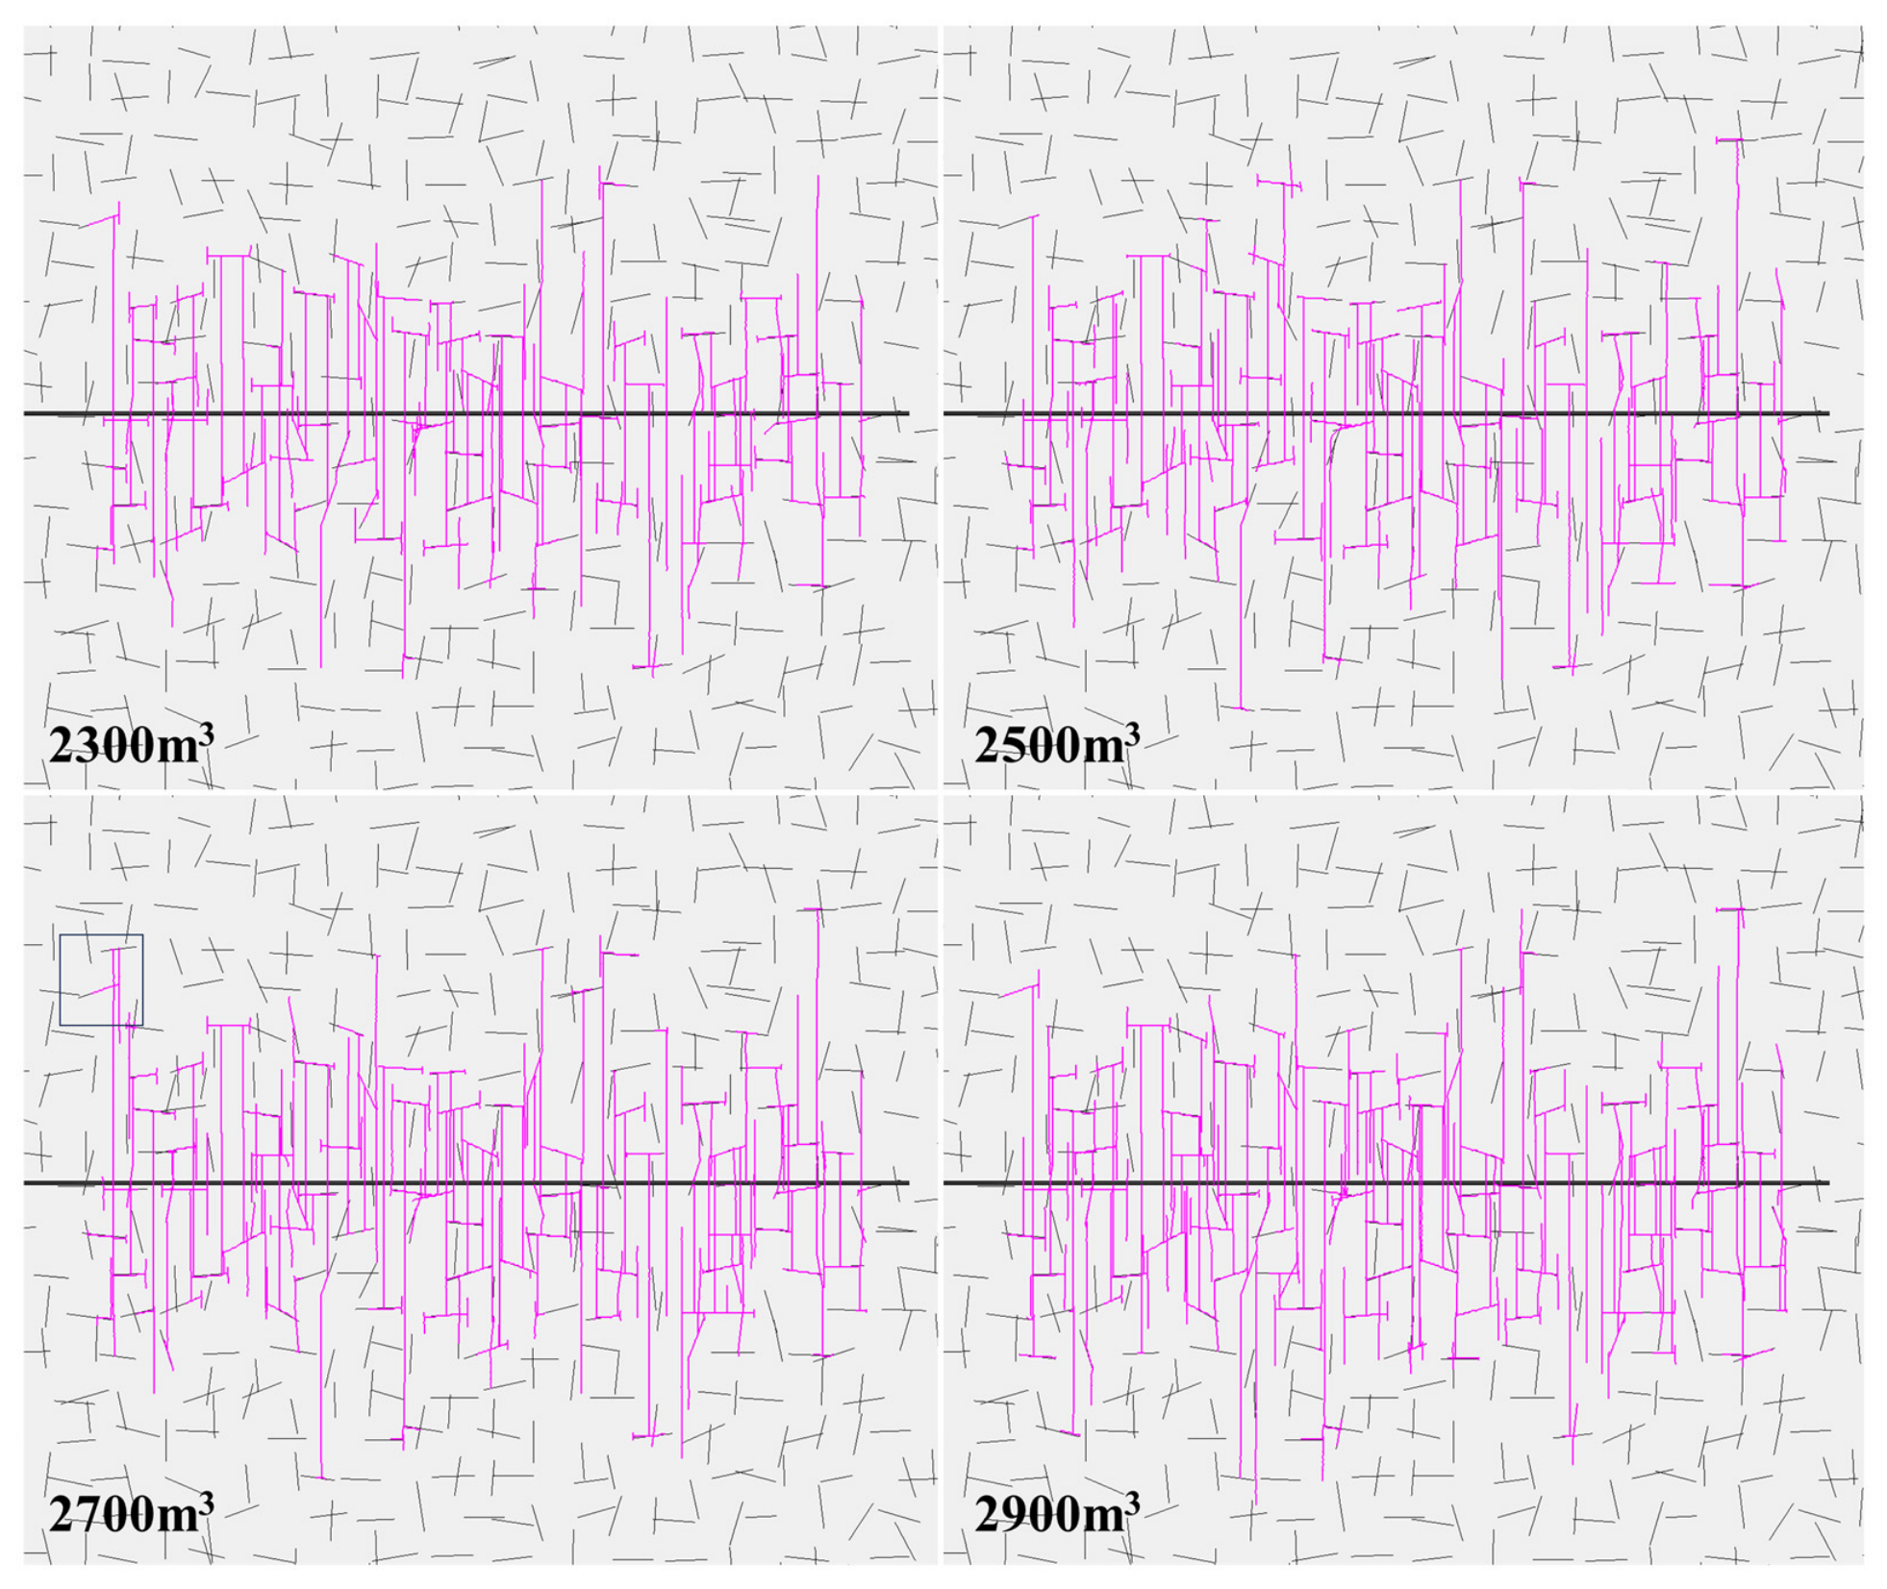
As shown in
Figure 9, as the fluid volume per stage increases from 2300 m
3 to 2900 m
3, the fracture system evolves from a locally discrete pattern into an interconnected network characterized by both longitudinal and transverse extensions, with a significant increase in the number of connections between main fractures and natural cleats. Under lower fluid volumes, although some main fractures can initiate and intersect cleats, their distal propagation is insufficient, and most branch fractures remain concentrated near the wellbore, leaving obvious undeveloped areas between adjacent clusters. With increasing fluid volume, continuous injection prolongs the duration of high pressure maintained at fracture tips, enabling further propagation of existing main fractures and promoting more sufficient fluid infiltration and opening of low-permeability cleats. More overlapping and intersecting regions appear between subsequently stimulated clusters and previously fractured clusters, indicating that higher fluid volumes improve hydraulic connectivity between fractures and reduce isolated propagation of individual clusters. However, from approximately 2700 m
3 to 2900 m
3, the increase in the outer fracture boundary is smaller than the variation in internal fracture density, suggesting that additional fluid is mainly consumed in maintaining existing fracture opening, activating local cleats, and compensating for fluid leak-off rather than continuously extending main fractures. The average propped fracture extension length under the selected conditions ranges from approximately 345 m to 357 m, with limited variation, further indicating that with increasing fluid volume, fracture development gradually shifts from propped fracture length extension to internal enhancement of the fracture network. Therefore, fluid volume per stage primarily controls the sustainability of fracture propagation and the degree of cleat activation. A reasonable increase in fluid volume is beneficial for reducing undeveloped regions between clusters, whereas the marginal stimulation benefit gradually decreases with excessive fluid injection.
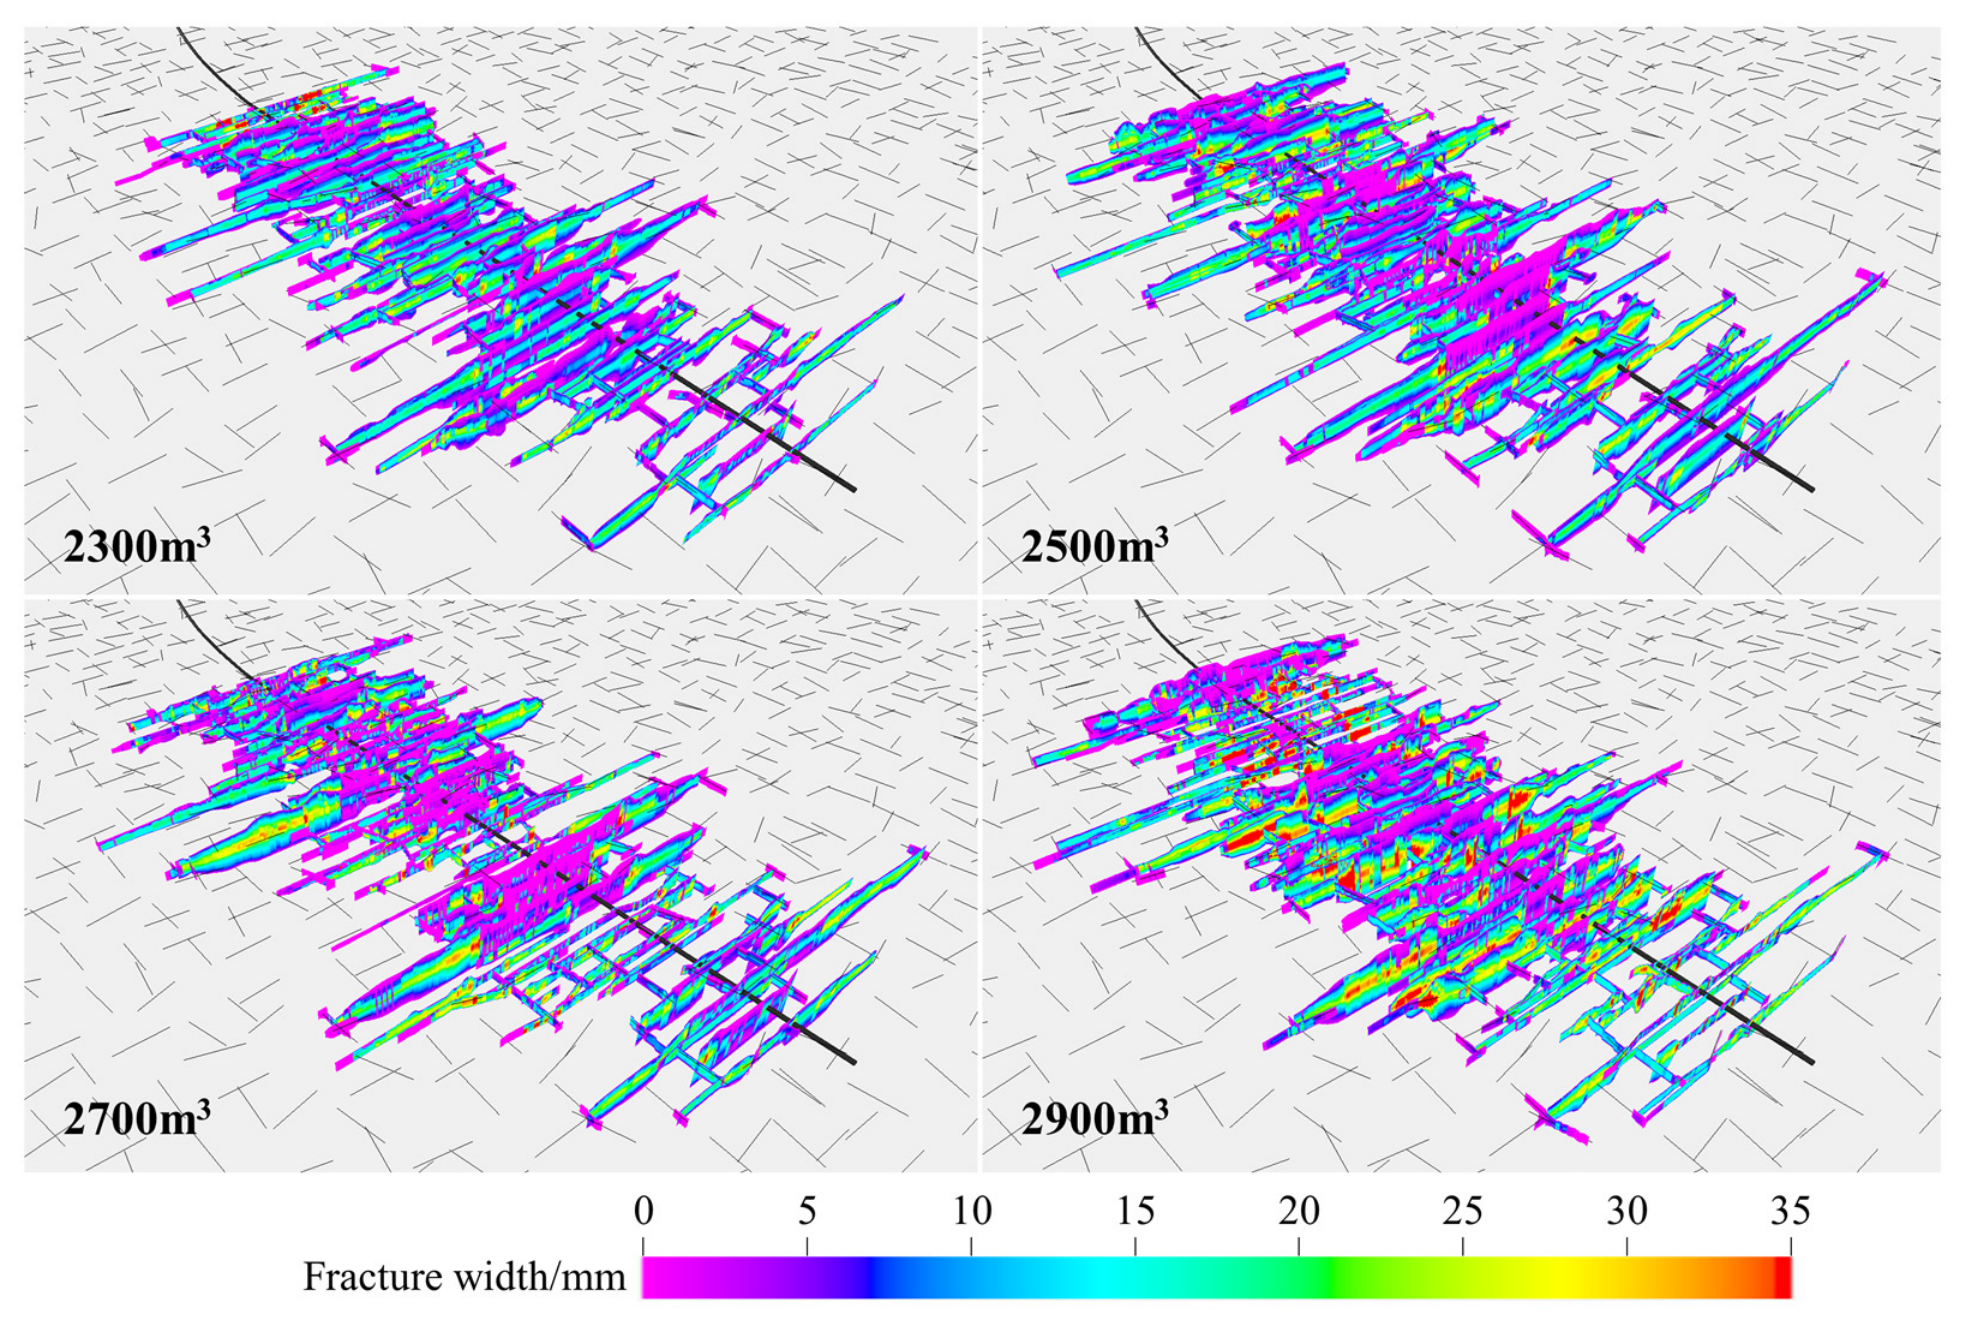
As shown in
Figure 10, under different fluid volumes, fracture width remains concentrated in main fractures and intersection nodes as high-value regions. However, with increasing fluid volume, the continuity of the cyan-green medium-width zones throughout the entire fracture network is significantly enhanced. At approximately 2300 m
3, wider fractures are mainly concentrated in a limited number of dominant main fractures, while distal and lateral branches are characterized by low widths, indicating a strong fluid channeling effect. When the fluid volume increases to approximately 2500–2700 m
3, more branch fractures remain open, and continuous medium-width zones develop on both sides of the main fractures, suggesting that continuous fluid supply can compensate for fluid leak-off and fracture wall closure. At approximately 2900 m
3, yellow-to-red high-width regions appear at local intersection points, while a large number of purple narrow branches remain, indicating significant flow competition within the complex fracture network. The average propped fracture width under the selected conditions increases from approximately 13.11 mm to 14.46 mm, representing an increase of about 10.3%, which is smaller than the variation in local maximum fracture width shown in the figure. This indicates that increasing fluid volume mainly enlarges the proportion of medium-width fractures rather than uniformly widening all fractures. The formation of locally large fracture widths is associated with cleat intersections, flow diversion, and proppant accumulation. Therefore, fluid volume optimization should focus on forming continuous supportable fracture widths while avoiding the generation of only a few excessively wide dominant channels with a large number of branch fractures remaining in low-width and easily closed states.
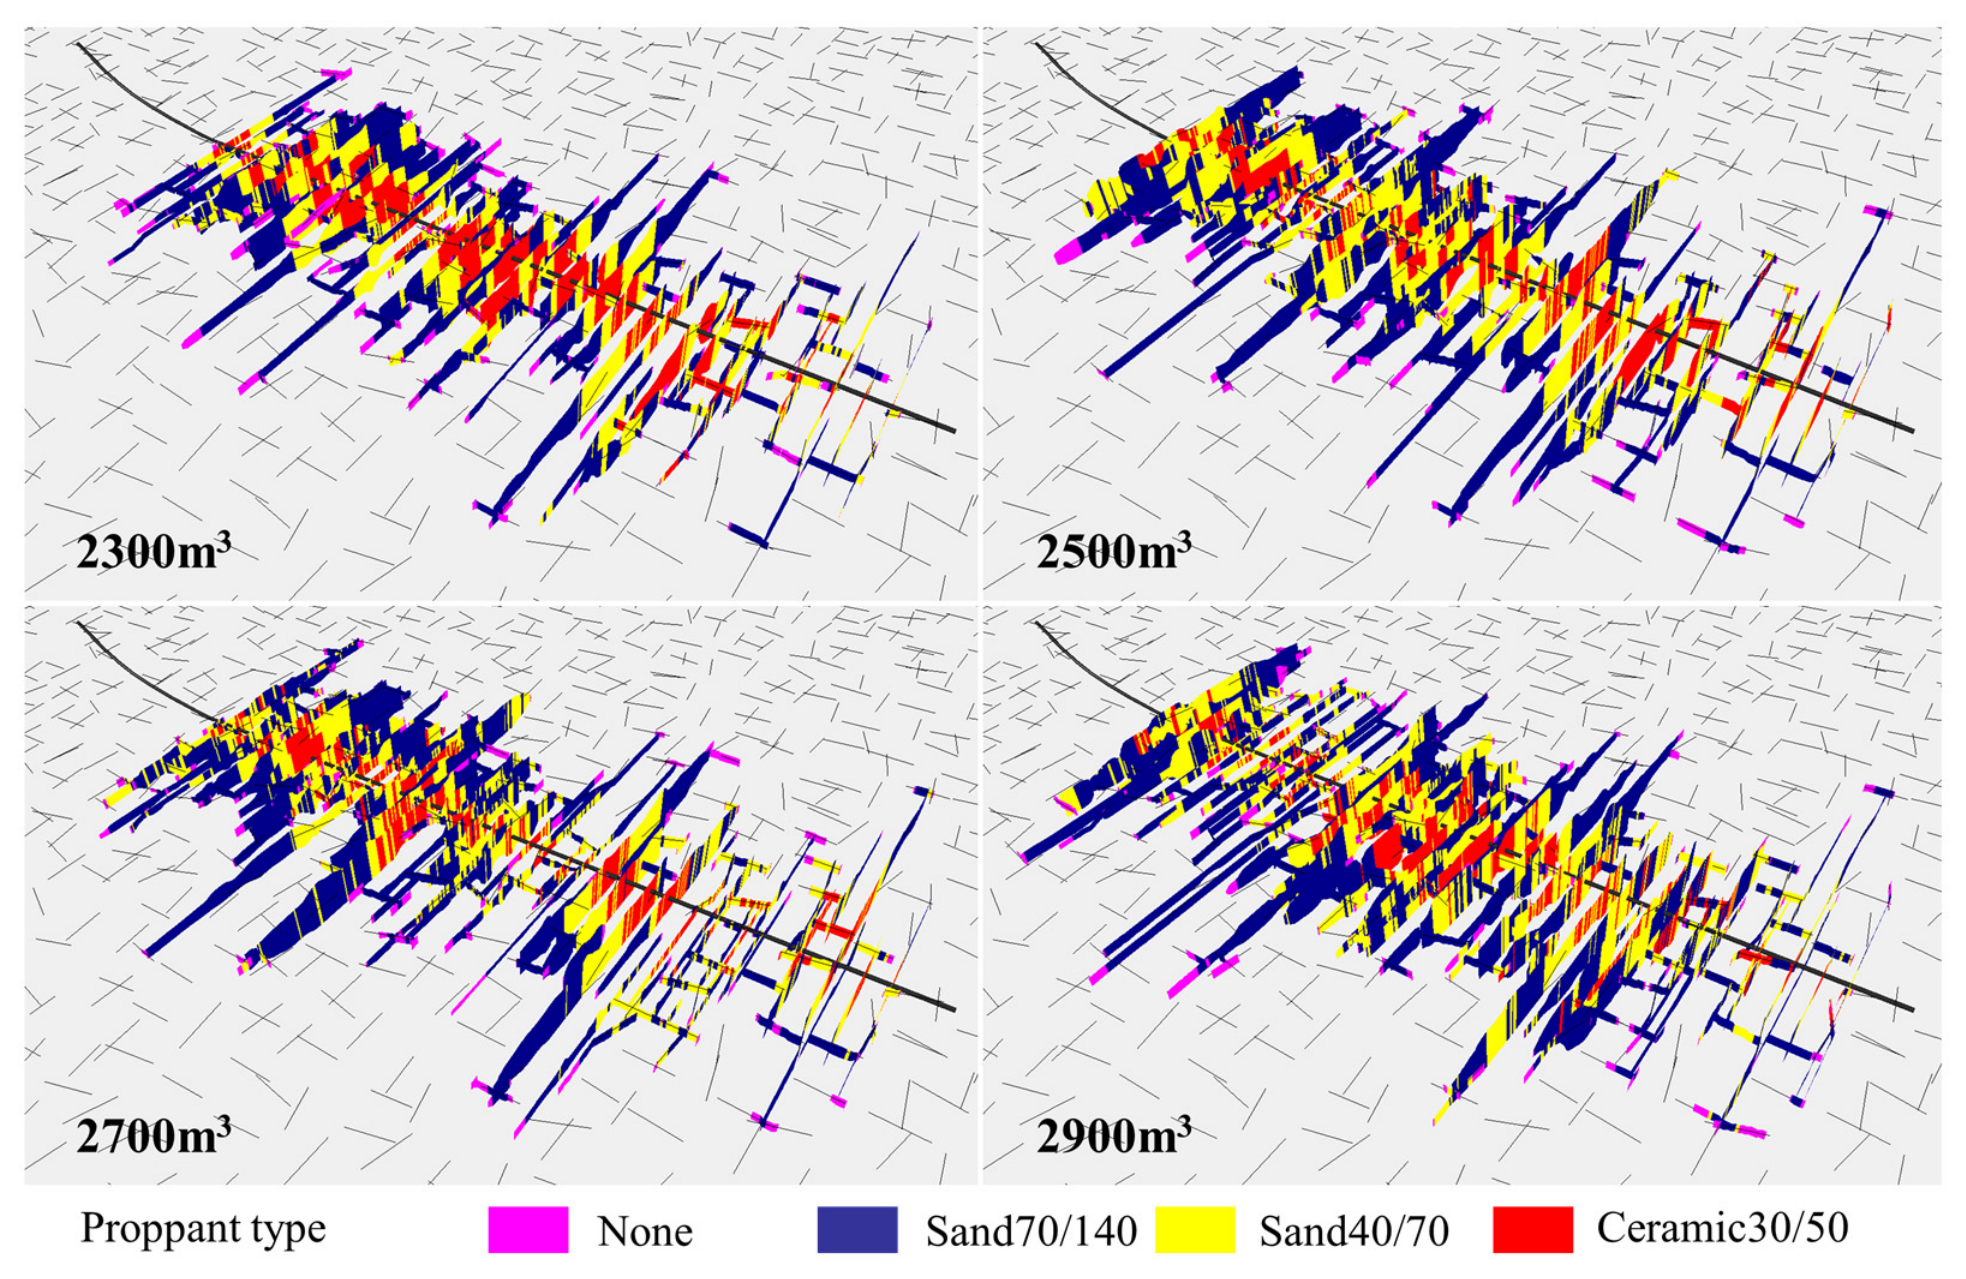
As shown in
Figure 11, the three types of proppants still exhibit significant particle-size-graded transport behavior under different fluid volumes. The 70/140 mesh quartz sand penetrates the deepest regions and covers the largest number of branch fractures, whereas the 30/50 mesh ceramic proppant is mainly retained in wide main fractures and near-wellbore regions. At approximately 2300 m
3, the distribution of coarse proppants is relatively scattered, and only 70/140 mesh quartz sand can enter some distal and branch fractures, indicating that transport distance is restricted under insufficient fluid volumes. When the fluid volume increases to approximately 2500 m
3, the yellow and red regions advance forward along the main fractures and appear at multiple branch entrances, indicating that continuous fluid supply reduces the premature settling of coarse particles. At approximately 2700–2900 m
3, fine-sized proppants are widely distributed into complex branch fractures, while coarser proppants form a more continuous skeleton-like distribution along the main flow channels. At the intersections between main fractures and cleats, changes in flow direction and abrupt variations in fracture width generate particle-size screening effects, allowing fine sand to enter diverted branches, whereas coarse sand and ceramic proppants are more likely to remain at intersection points or continue transporting along wider main fractures. This distribution indicates that increasing fluid volume not only extends proppant transport distance but also enhances the ability of multi-sized proppants to cross low-pressure regions between multiple clusters. Ultimately, a spatially graded proppant placement pattern is formed, in which coarse particles provide high-strength support within main fractures and fine particles maintain the opening of branch fractures, facilitating the transformation of complex fracture geometries into effective conductive fracture networks.
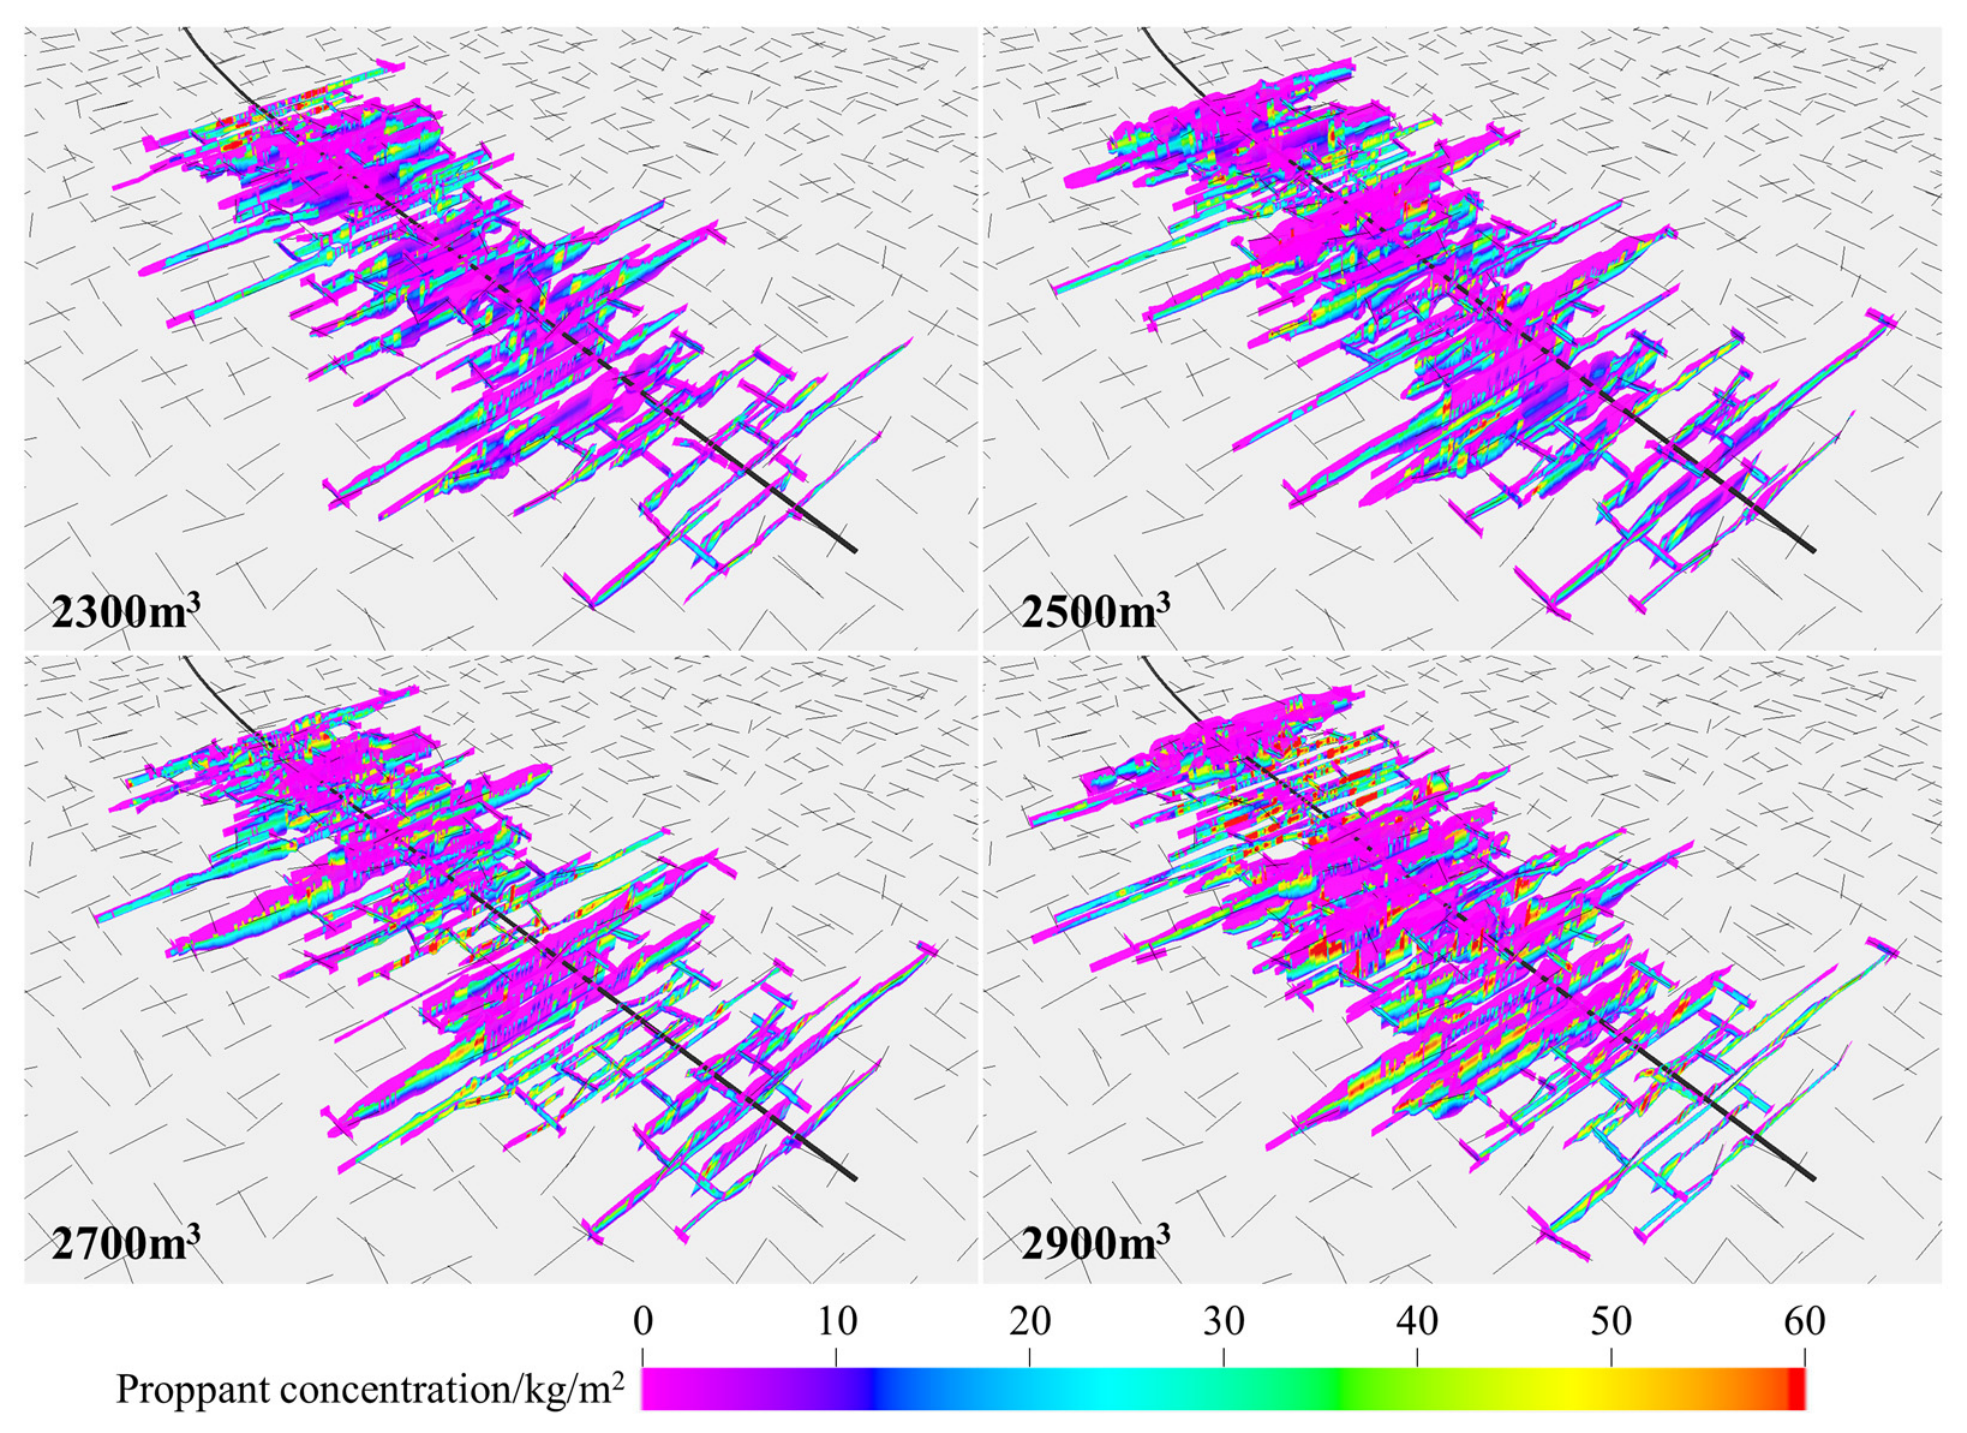
As shown in
Figure 12, increasing the fluid volume per stage gradually transforms the effective proppant placement regions from scattered patches into interconnected bands, particularly within main fractures and highly connected branch fractures. At 2300 m
3, most regions exhibit purple low-concentration areas, indicating that proppants are mainly retained near the wellbore and within a limited number of dominant channels, while many activated branches remain insufficiently filled. When the fluid volume increases to approximately 2500 m
3, the cyan-green medium-concentration zones advance toward distal regions, indicating that the extended transport time enables more particles to pass through the high-friction near-wellbore region. At 2700–2900 m
3, high-concentration zones within main fractures increase, while the range of low-concentration proppant areas also expands significantly, reflecting the simultaneous occurrence of two effects induced by increasing fluid volume: “deeper transport” and “placement dilution.” The proppant concentration near intersection nodes is higher than that in adjacent fine branches because local velocity reduction, particle collisions, and fracture width variations promote proppant deposition, whereas screening and diversion limitations remain at the entrances of fine branches. Under the selected conditions, the propped fracture length increases from approximately 332.07 m to 345.64 m, representing an increase of about 4.1%, indicating that the improvement in effective propped length becomes smaller than the increase in geometric fracture extension with further fluid volume increase. Therefore, larger fluid volumes should be coordinated with proppant volume and pumping schedules; otherwise, a “pseudo fracture network” may be generated, characterized by geometrically complex fractures but insufficient distal proppant concentration and poor post-closure effectiveness.
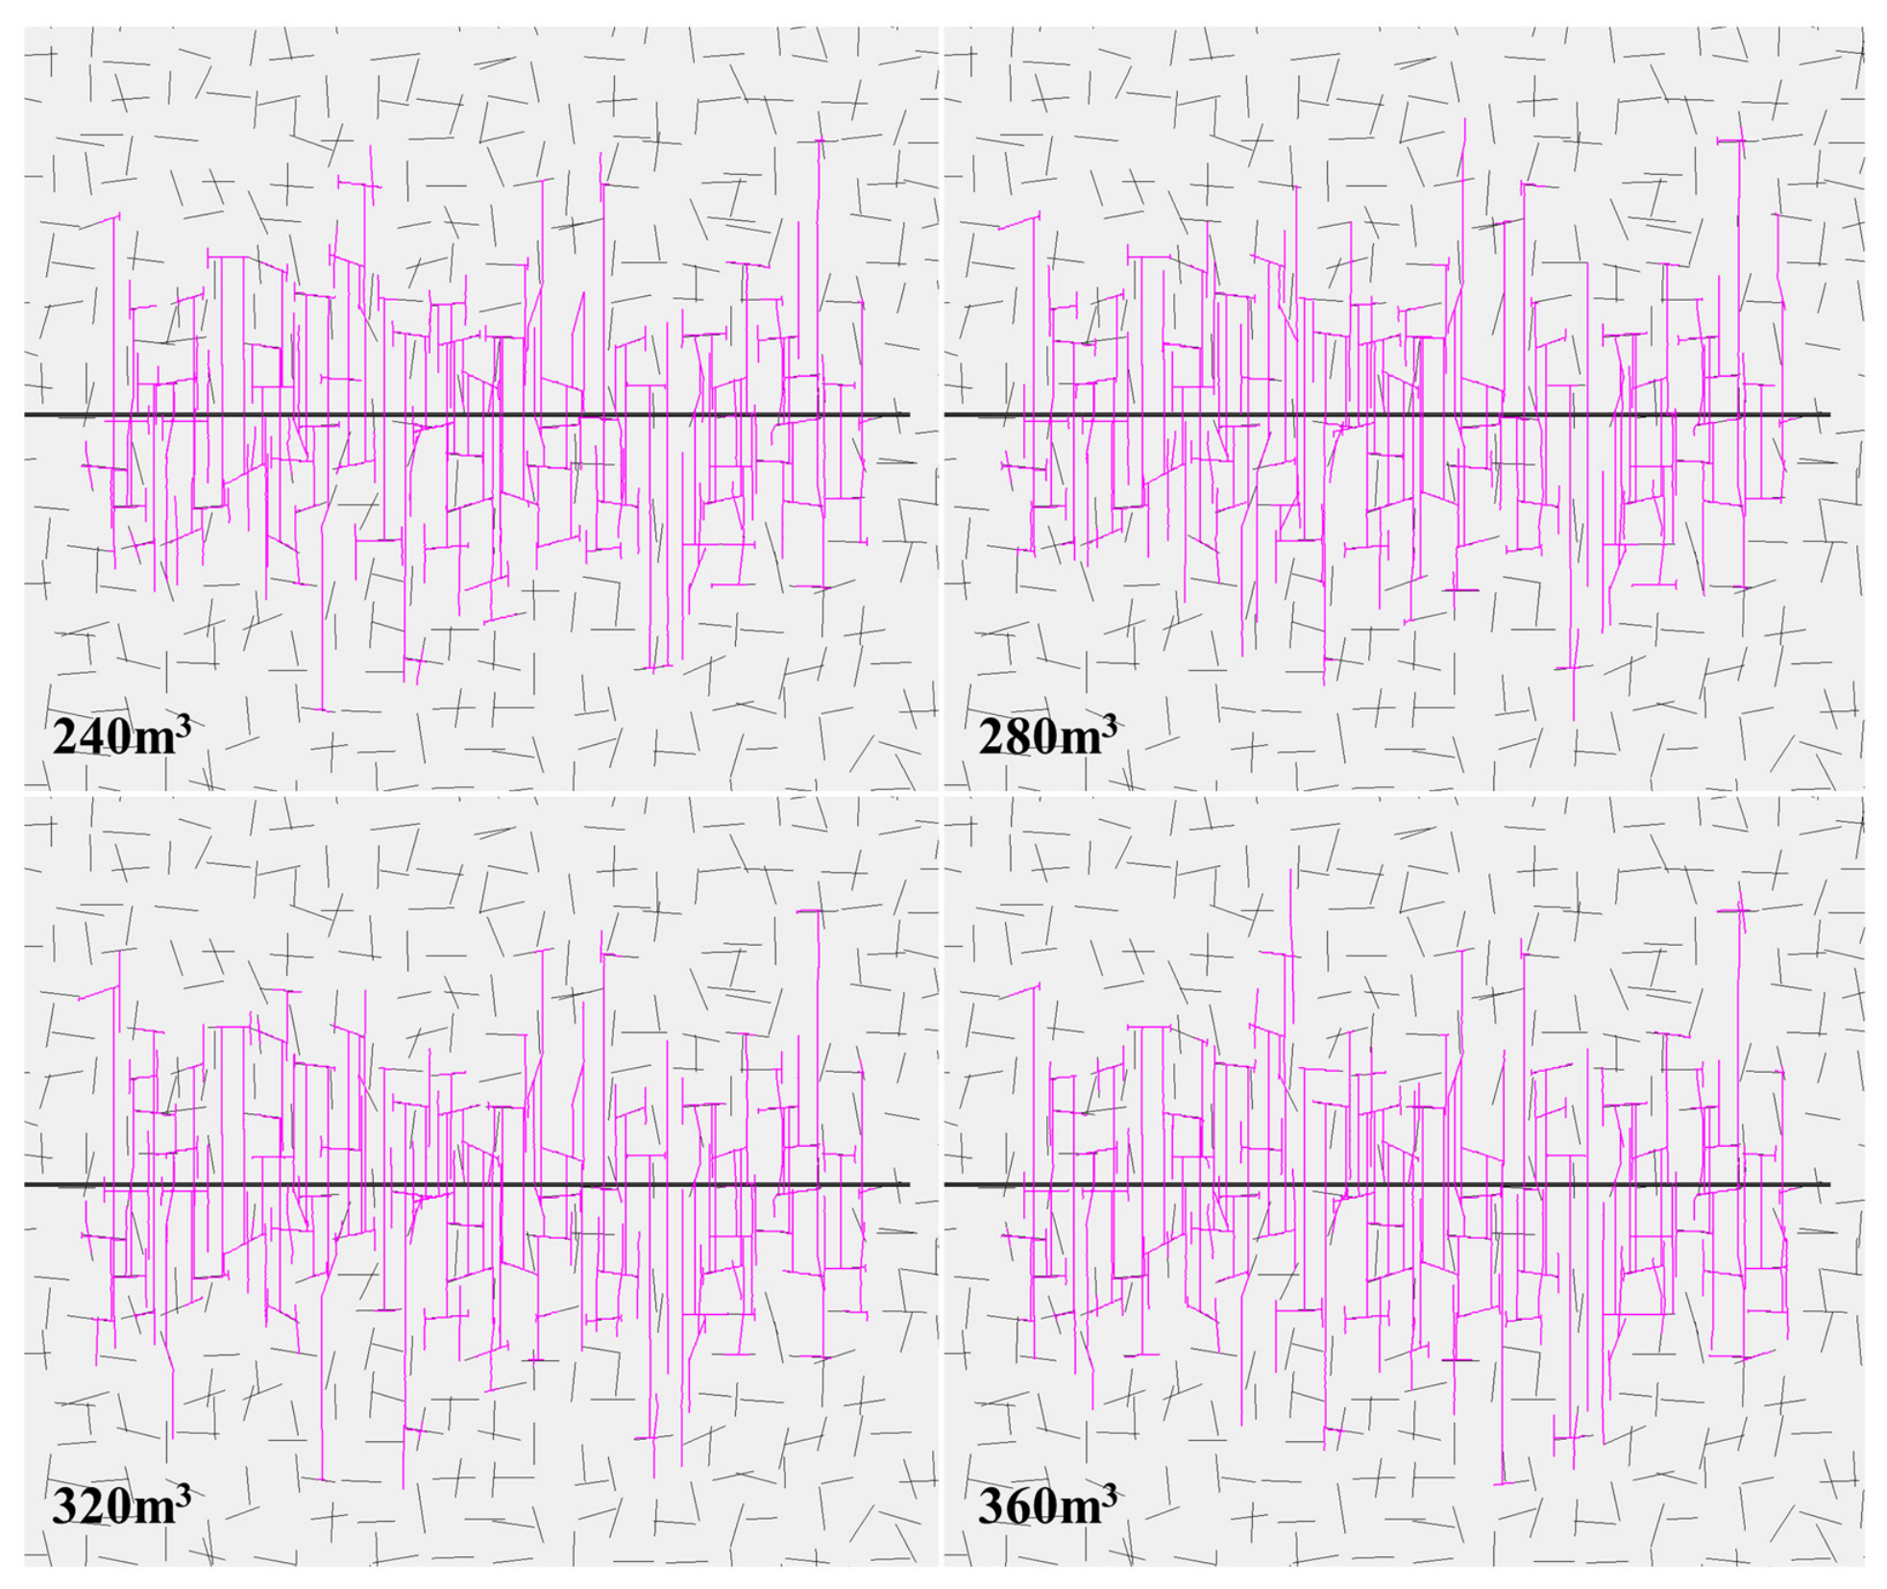
As shown in
Figure 13, when the injection rate and fluid volume remain constant, variations in proppant volume per stage have a relatively limited influence on the macroscopic geometric morphology of the purple hydraulic fractures. In all four cases, complex fracture networks are formed by main fractures connecting multiple natural cleats. This is because fracture initiation, turning, and crossing are primarily controlled by injection pressure, in situ stress conditions, and the geometric relationship of cleats, whereas proppant volume mainly affects the solid-phase occupancy and support conditions within fractures after fracture formation. At 240 m
3, the main fractures and branch fractures are generally developed, but some fine branches exhibit limited extension and insufficient inter-cluster connectivity, indicating that insufficient early-stage proppant support may cause local fracture narrowing during propagation. With increasing proppant volume, main fractures near the wellbore and intersection nodes can maintain more stable opening conditions, thereby providing low-resistance channels for subsequent fluid penetration into branch fractures. Under the conditions of 320–360 m
3, local longitudinal branches and distal connections become more distinct; however, propped fracture length does not show a consistent increasing trend, indicating that the enhancement effect of proppant volume on fracture development is strongly path-dependent. Statistical results show that the propped fracture extension length corresponding to 240–360 m
3 varies from 361.13 m to 354.69 m, whereas the stimulated reservoir volume increases from 324.67 m
3 to 430.89 m
3. This further demonstrates that proppant volume primarily modifies the effective fracture opening volume rather than simply extending propped fracture length. Therefore, the primary role of increasing proppant volume is to improve the stability and retention of complex fracture networks rather than directly generating more fractures. During evaluation, instantaneous geometric fractures should be distinguished from effectively supported fractures after well shut-in.
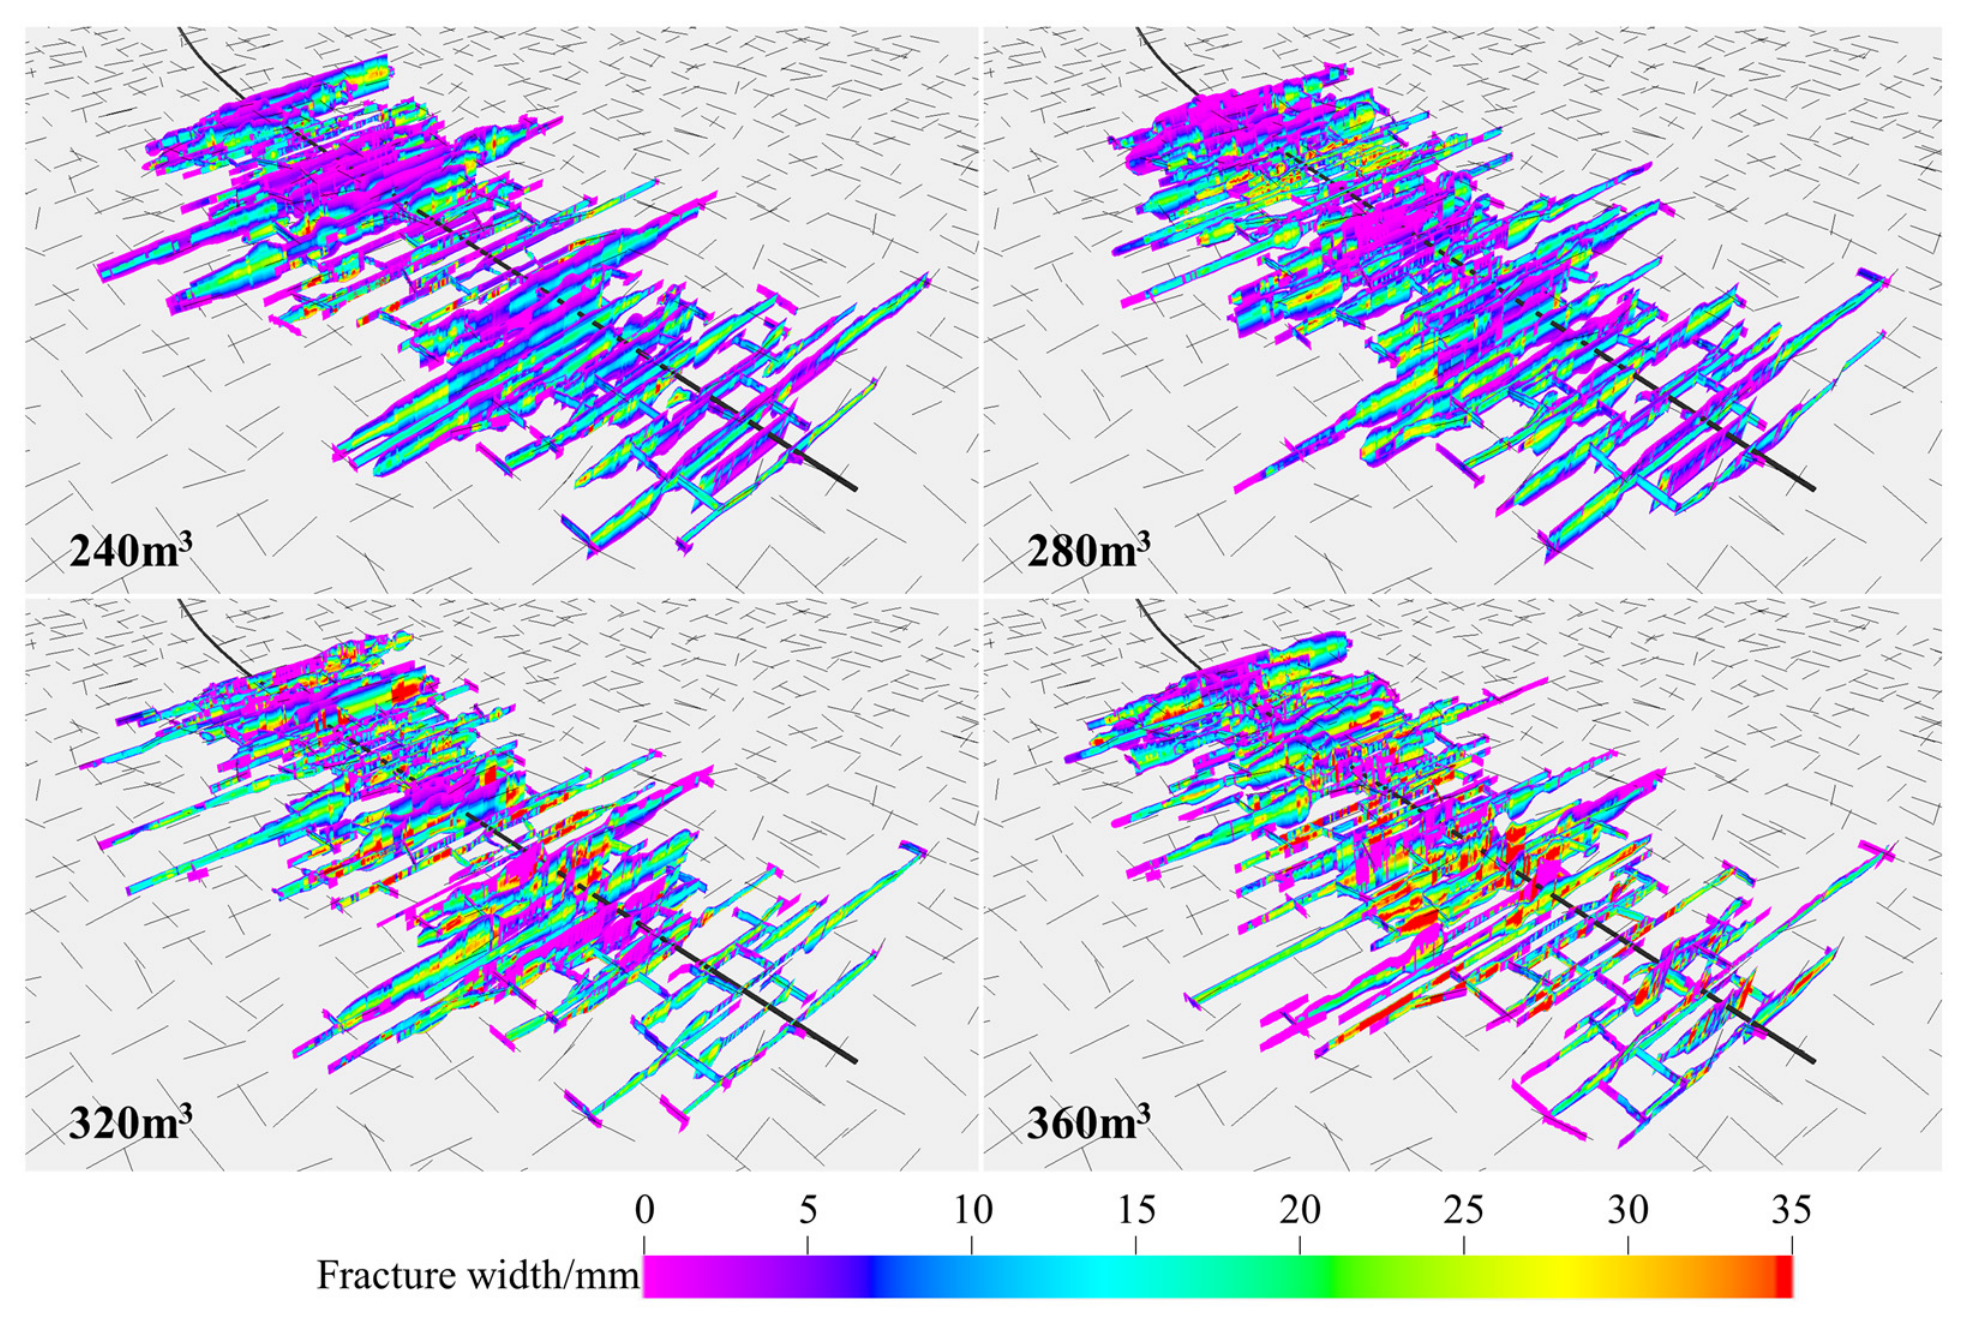
As shown in
Figure 14, the differences in fracture width distribution under different proppant volumes are mainly reflected in the quantity, continuity, and location of high-width regions, while the overall fracture orientation and branch topology remain essentially unchanged. At 240 m
3, some main fractures and intersection nodes already exhibit relatively high widths; however, the width distribution is relatively concentrated, and distal branches are still dominated by purple and blue low-value regions. When the proppant volume increases to 280–320 m
3, medium-width regions extend along the main fractures and dominant branches, indicating that the proppant skeleton gradually bears closure stress and enables more fractures to maintain effective apertures. At 360 m
3, yellow and red high-width patches become more prominent in the middle sections of main fractures and complex intersection zones, suggesting that high proppant volumes are prone to local accumulation at locations with reduced flow velocity and fracture turns. This local widening is not solely caused by hydraulic opening but results from the combined effects of proppant deposition hindering fracture closure and particle bridging, forming the residual fracture width. Statistical results show that the average propped fracture width does not vary strictly monotonically with increasing proppant volume, indicating that after increasing proppant input, proppants may be redistributed among different fractures, with thick placement in local regions and thin placement in distal regions occurring simultaneously. Therefore, high-proppant-volume designs should suppress excessive near-wellbore accumulation through appropriate particle-size grading and sand addition schedules, allowing additional proppants to be more effectively converted into useful fracture width in distal and branch fractures.
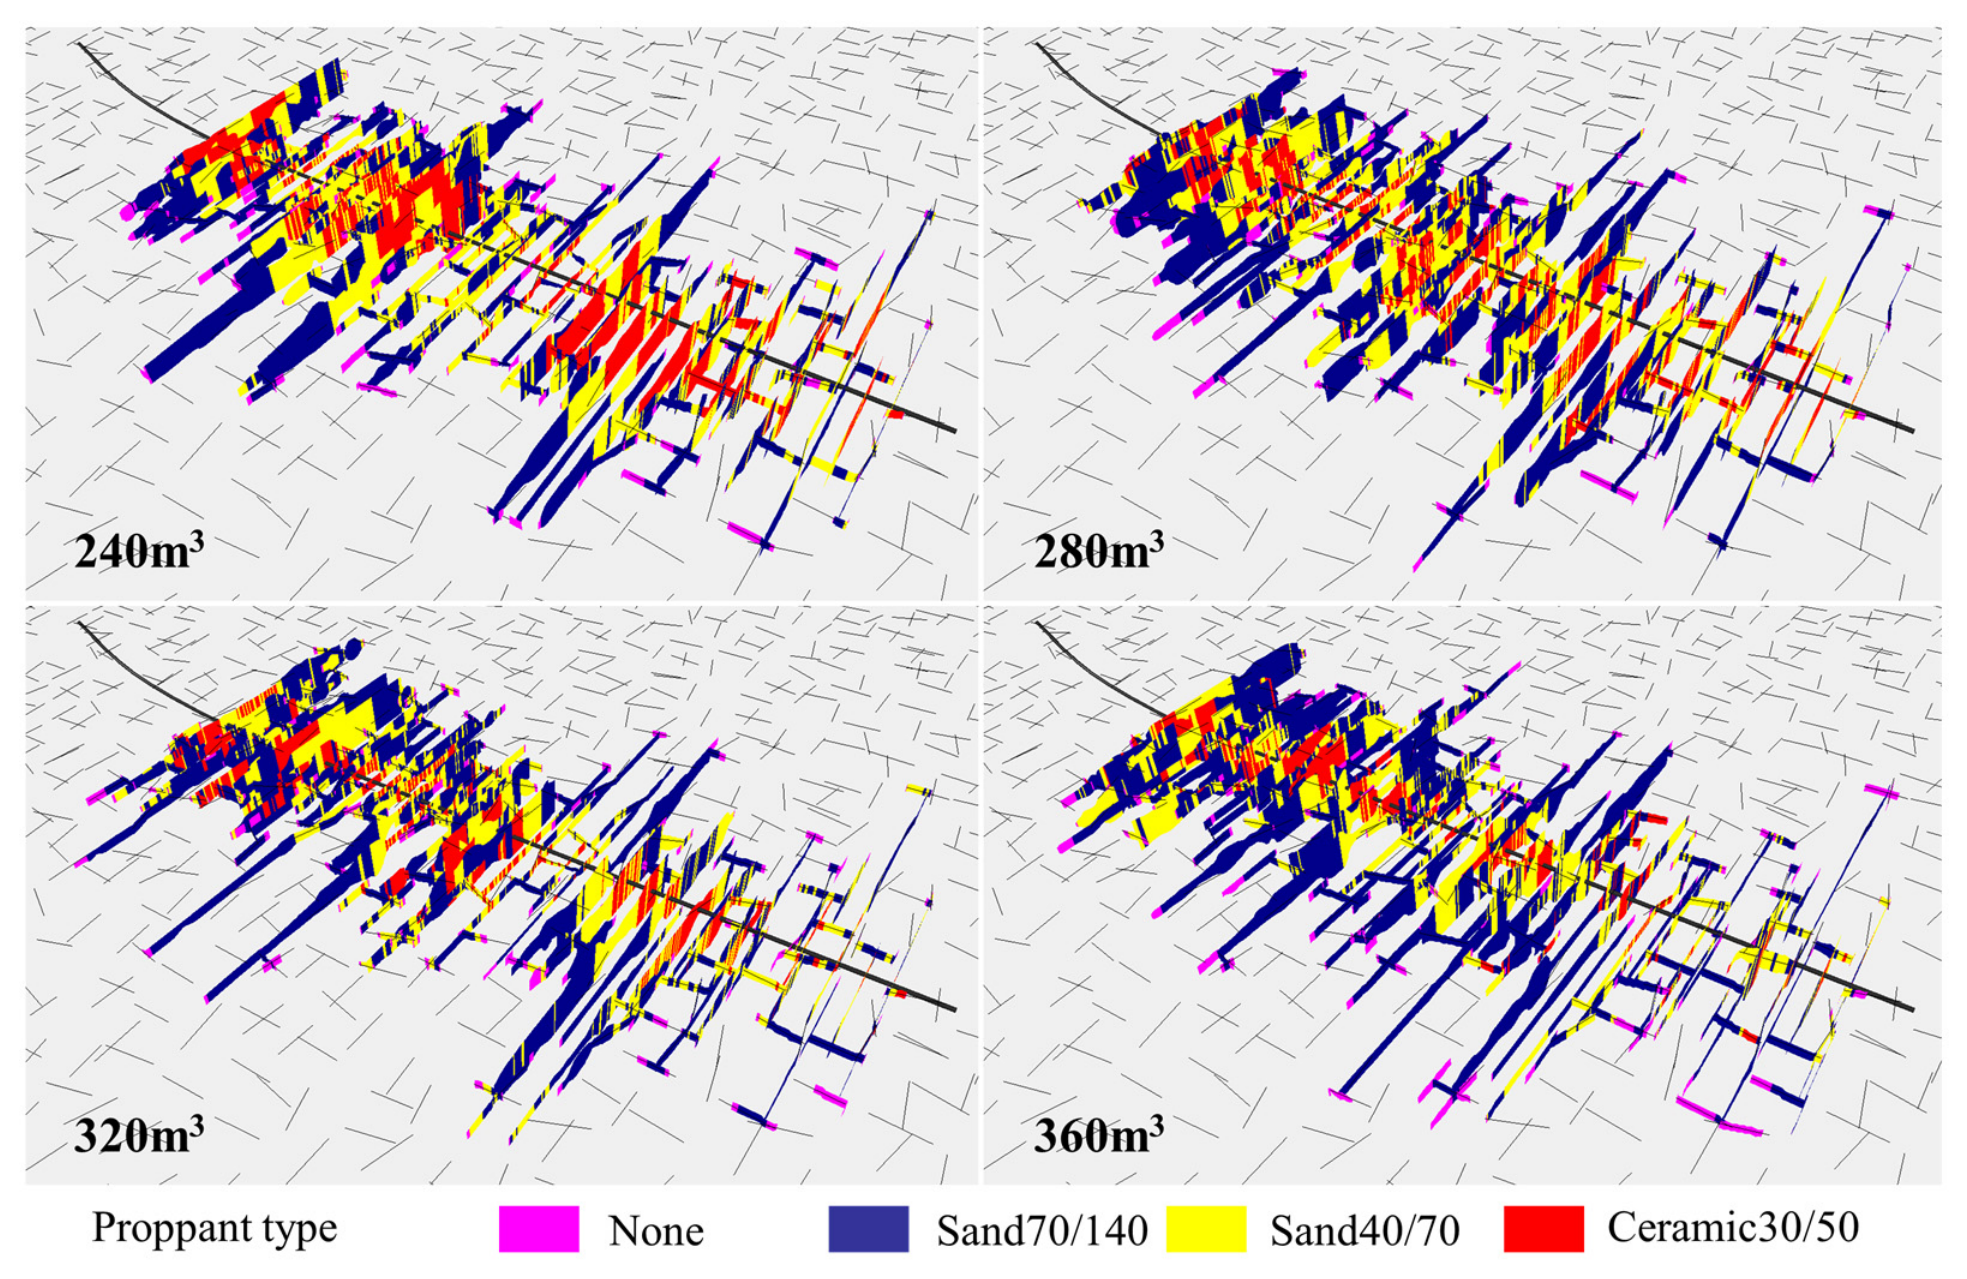
As shown in
Figure 15, the basic spatial differentiation of different proppant types remains unchanged under different proppant volumes: 70/140 mesh quartz sand covers distal regions and fine branch fractures, 40/70 mesh quartz sand is distributed in the middle and distal sections of main fractures, and 30/50 mesh ceramic proppant is concentrated in wide near-wellbore main fractures. At 240 m
3, the continuous placement degree of different-sized proppants is relatively low, with coarse particles forming isolated sections within several main fractures, while distal branches are mainly supported by fine sand. When the proppant volume increases to 280–320 m
3, the coverage of all three proppant types along the main fractures becomes more continuous, and 40/70 mesh quartz sand gradually fills the transition zones between fine sand and ceramic proppant. At 360 m
3, the red ceramic proppant and yellow 40/70 mesh quartz sand become more concentrated near the wellbore and intersection nodes; however, they still have difficulty entering the narrowest terminal branches, indicating that the geometric screening effect is not eliminated by increasing proppant volume. Coarse particles tend to accumulate at the intersections between main fractures and cleats because the larger fracture width allows their entry, while abrupt changes in flow direction reduce particle transport velocity. In contrast, fine sand can enter higher-order branches through fluid diversion. Therefore, increasing proppant volume initially increases the proportion of coarse particles in main flow channels, followed by an improvement in the coverage of fine branch fractures. These results demonstrate that simply increasing total proppant volume cannot replace an appropriate particle-size distribution design. Only by allowing fine sand to first establish connectivity in branch fractures and subsequently using coarse particles to strengthen main fractures can near-wellbore blockage be avoided and the overall effectiveness of the fracture network be improved.
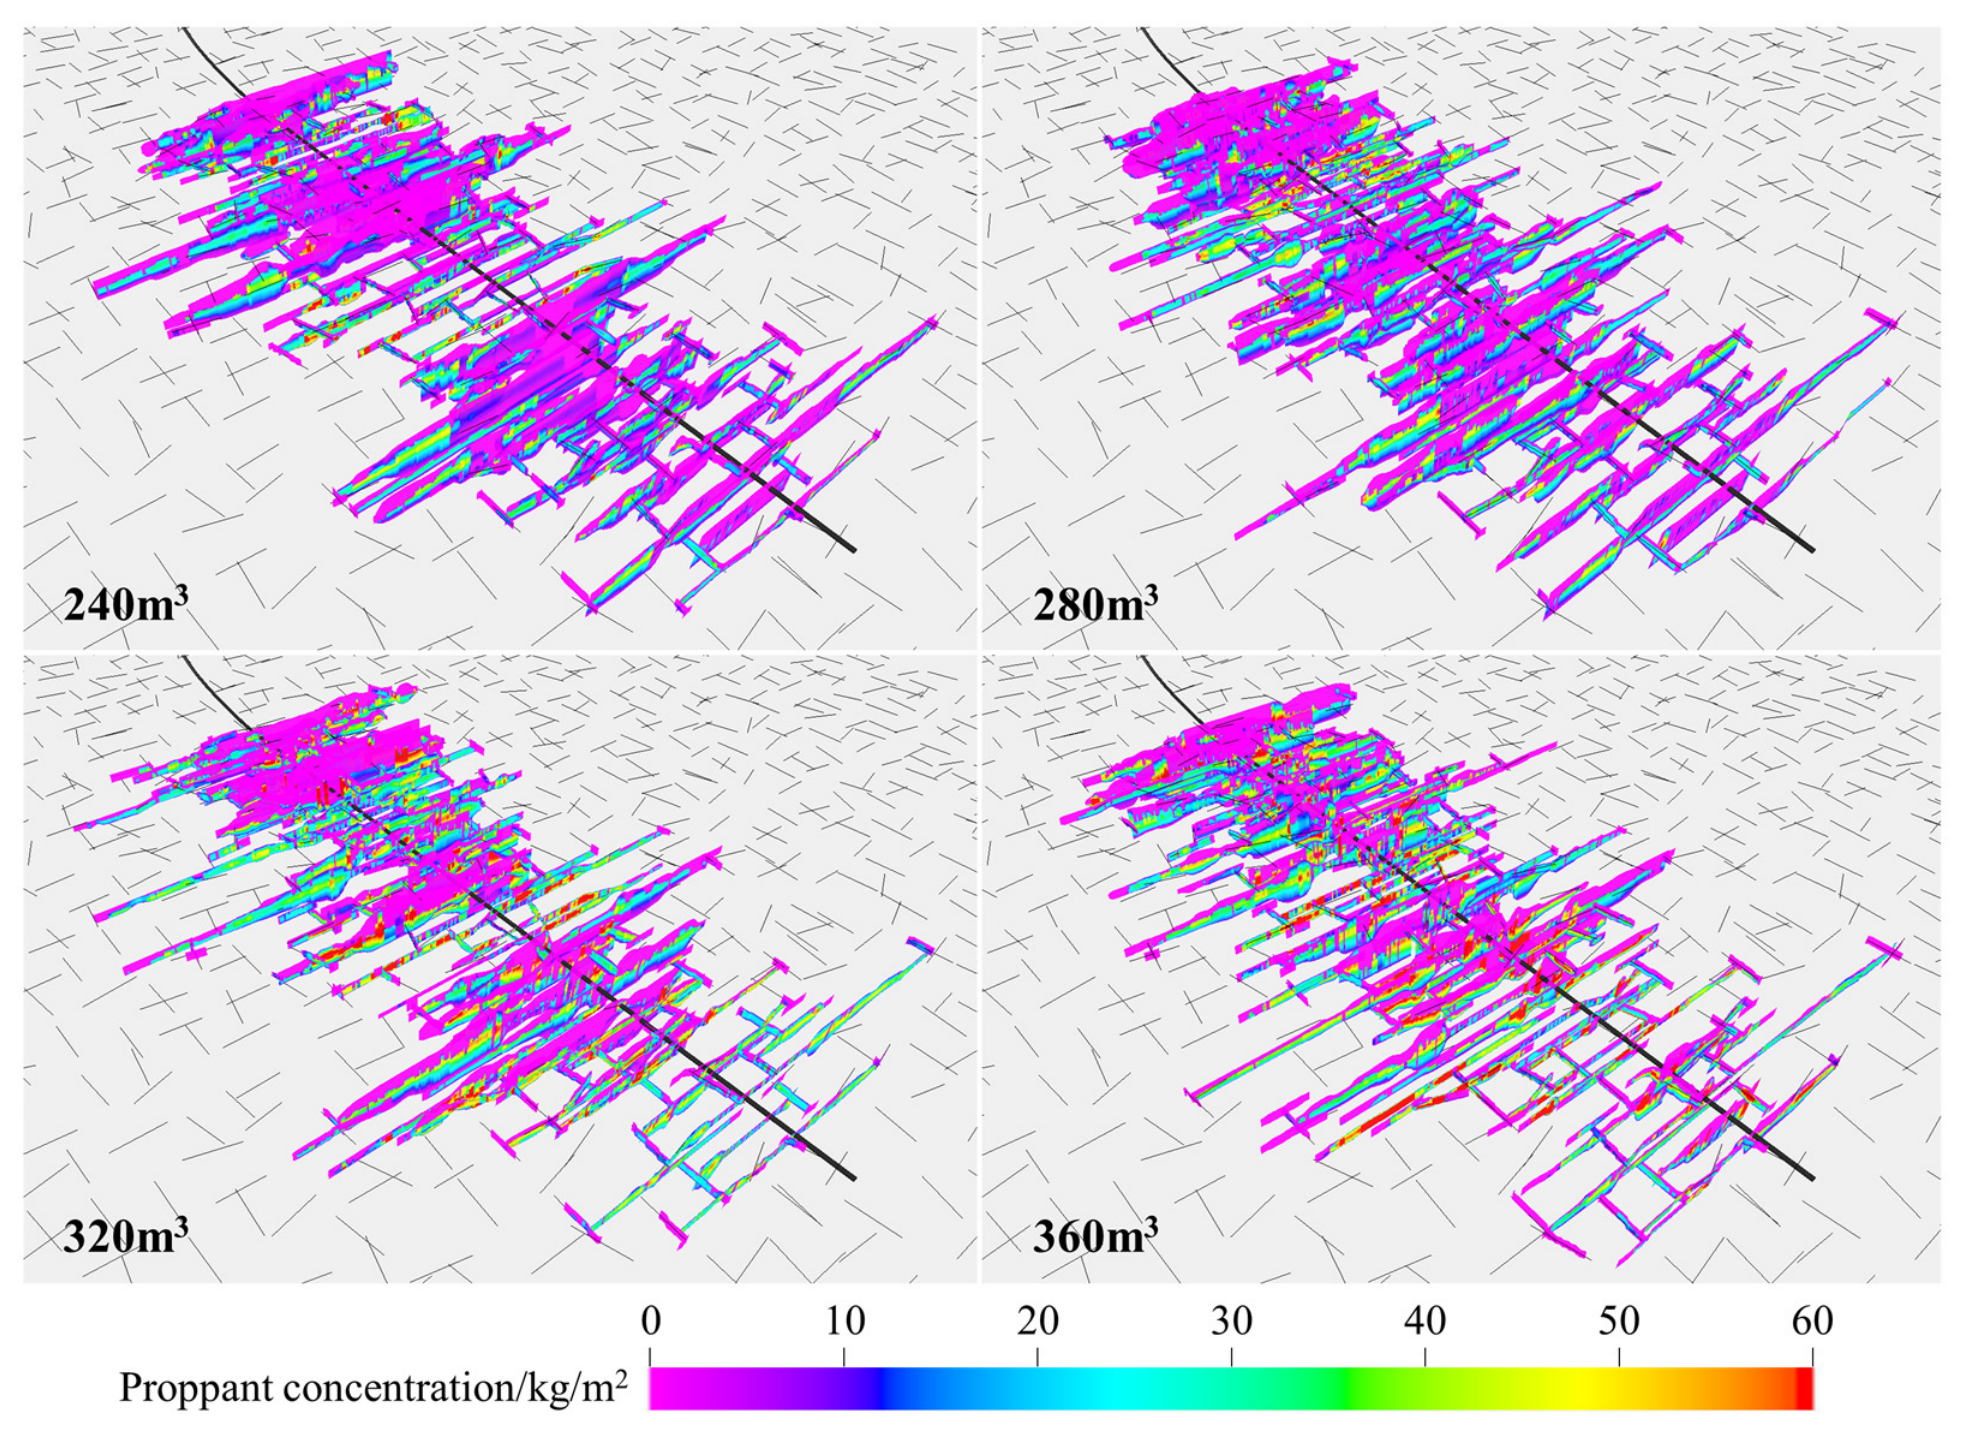
As shown in
Figure 16, with increasing proppant volume per stage, the in-fracture proppant concentration generally evolves from dispersed low-concentration placement toward continuous enrichment within main fractures. However, the responses of different levels of branch fractures are not consistent. At 240 m
3, purple low-concentration regions occupy a large proportion, indicating that although proppants can enter most fractures, the proppant loading per unit area is insufficient, making fine branch fractures more susceptible to losing effective aperture after well shut-in. At 280–320 m
3, cyan-green regions increase in main fractures and some dominant branches, indicating that additional proppants are preferentially supplemented into channels with lower flow resistance and larger widths. At 360 m
3, local yellow-to-red high-concentration bands appear, while some distal fine branches remain at low concentrations, demonstrating significant near-wellbore enrichment and channel competition. This non-uniform distribution results from the combined effects of particle settling, particle-size screening, and branch flow diversion. After entering main fractures, coarse particles tend to deposit at fracture turns and intersection nodes, whereas fine particles continue to be transported into higher-order branches. The corresponding fracture conductivity increases from 603.63 mD·m at 240 m
3 to 859.50 mD·m at 360 m
3, representing an increase of approximately 42.4%, indicating that increasing proppant volume significantly enhances the dominant flow channels. However, if proppant volume continues to increase without improving transport uniformity, additional particles may be mainly converted into local accumulation rather than effective fracture network area. Therefore, proppant volume optimization should be constrained by ensuring that distal branch fractures achieve a minimum effective proppant concentration.
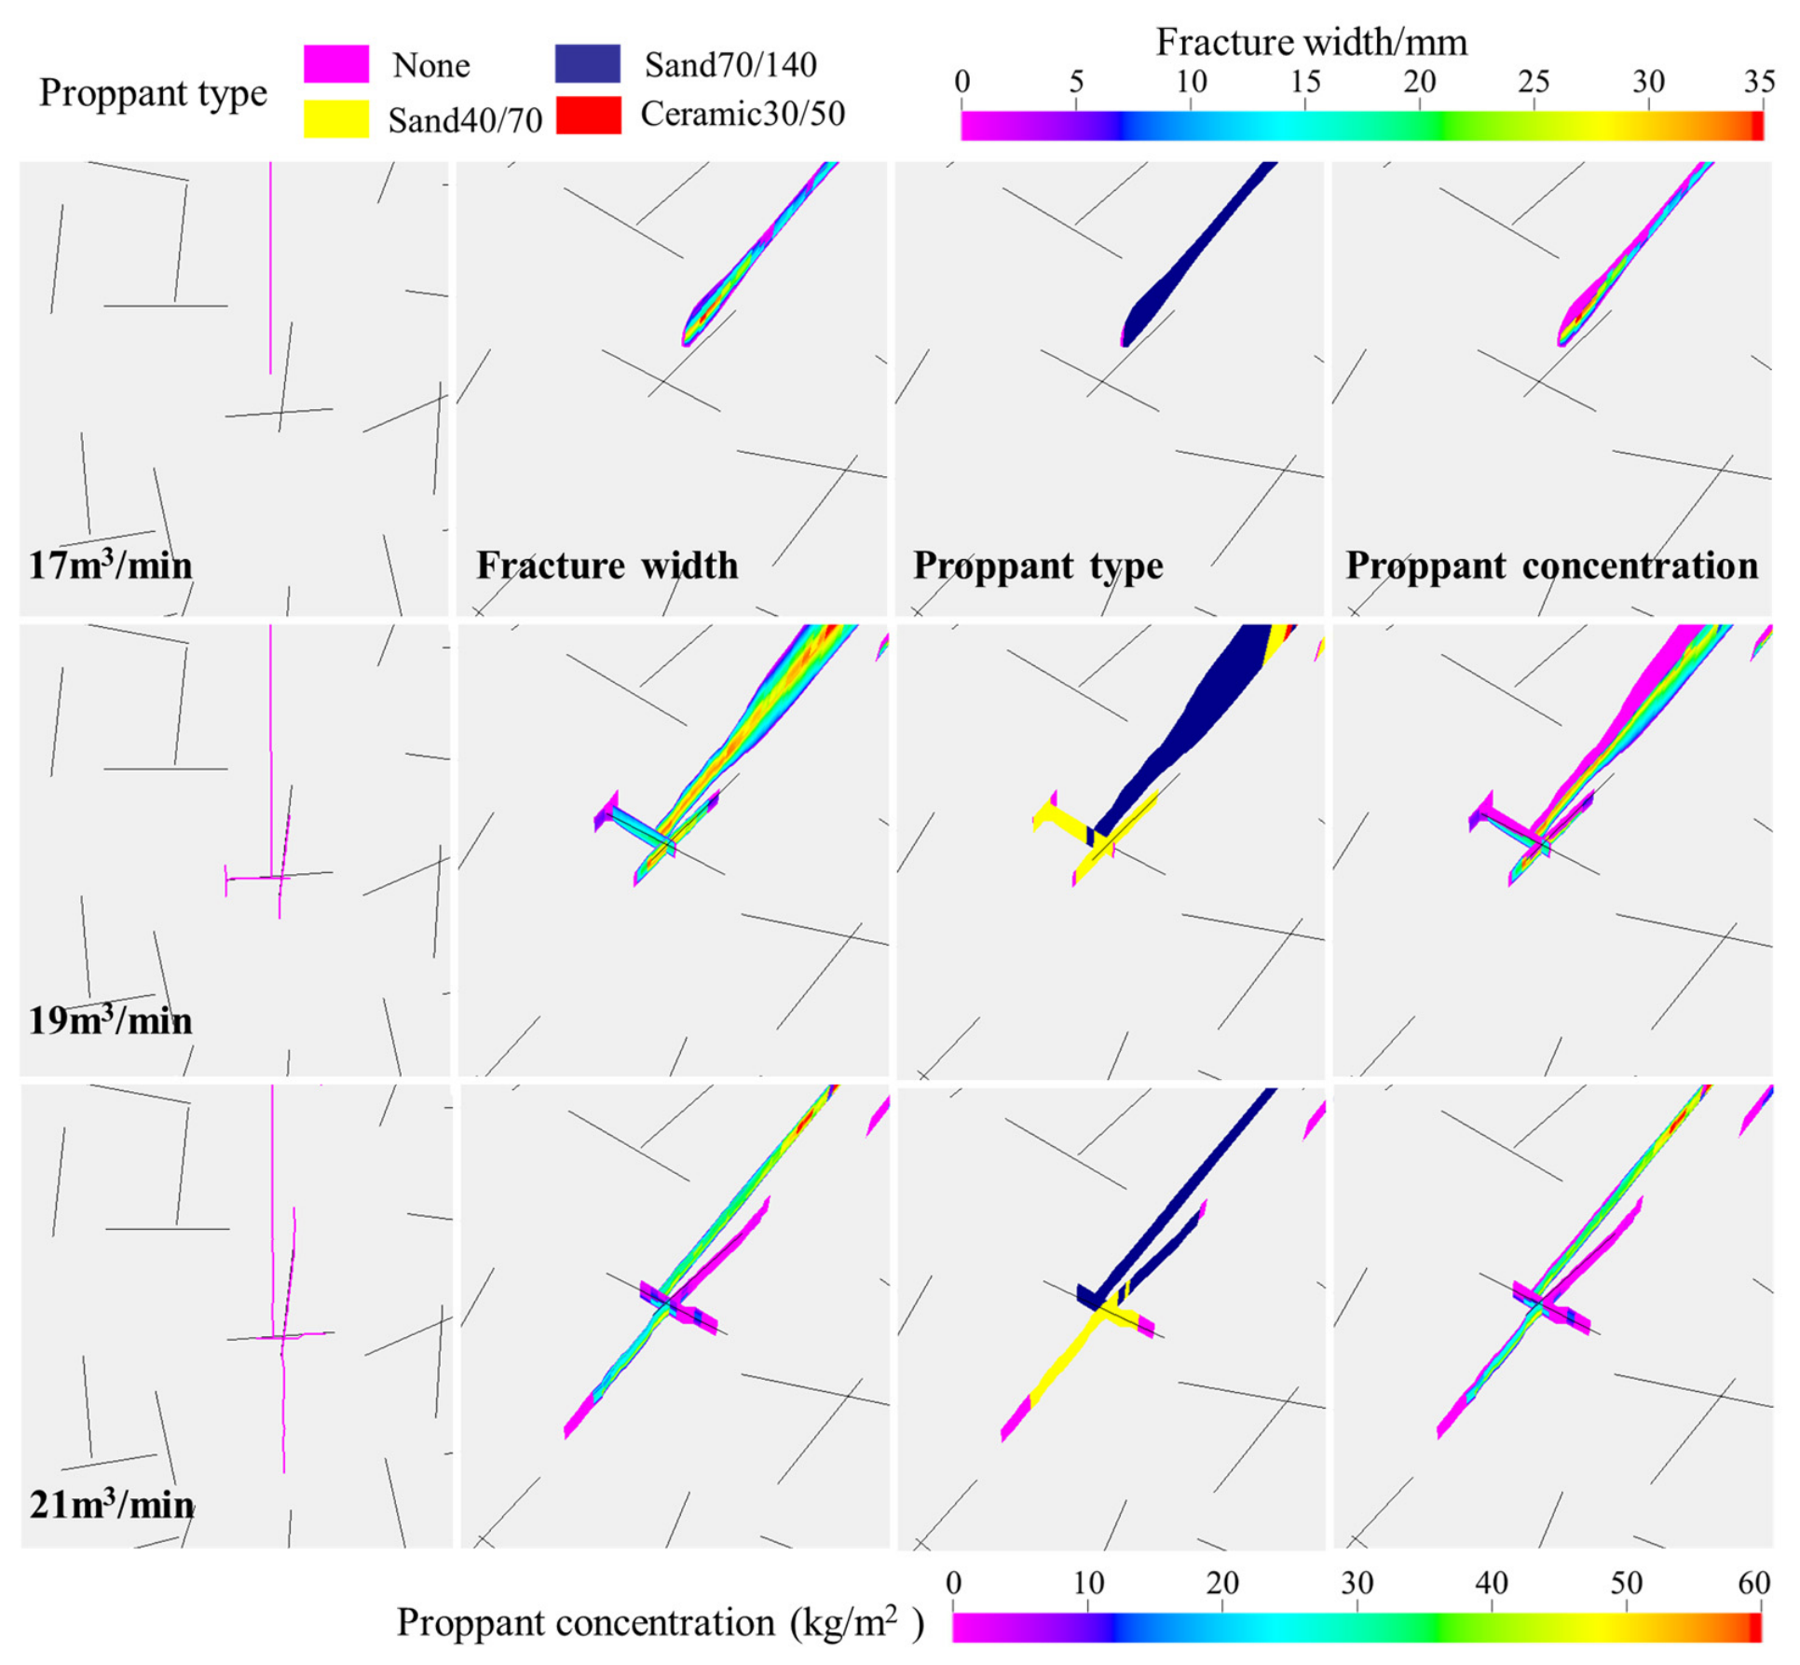
As shown in
Figure 17, the local magnification results indicate that the same cleat intersection undergoes an evolutionary process from non-activation, to branching and turning, and finally to main fracture penetration accompanied by branch opening with increasing injection rate. When the injection rate is 17 m
3/min, the main fracture approaches the natural cleat but does not intersect with it, and the cleat therefore remains in an unactivated state. Under these conditions, the main fracture maintains continuous propagation, while only the fracture tip region exhibits a relatively narrow fracture width. At 19 m
3/min, the cleat is significantly activated, and the main fracture develops a transverse branch at the intersection, accompanied by increased local fracture width and proppant placement concentration, indicating that fluid redistribution between the main fracture and cleat begins to occur. At 21 m
3/min, the main fracture is capable of penetrating the intersection and continuing propagation, while the cleat branch remains open, forming a typical penetration-branching composite mode. The local widening at the intersection is attributed to pressure accumulation caused by cleat disturbance at the fracture tip and multi-directional fracture opening, while the retention of coarse particles at this location further maintains the residual fracture width. With increasing injection rate, the fluid kinetic energy and fracture net pressure become sufficient to overcome cleat surface friction and stress barriers, preventing the main fracture from being captured by low-resistance cleats and enabling it to penetrate through the intersection and continue pressure transmission. Therefore, complex fracture networks in coal seams are not simply determined by the number of cleats, but are jointly controlled by the penetration capability of main fractures, cleat activation conditions, and proppant screening at intersection nodes under different injection rates.
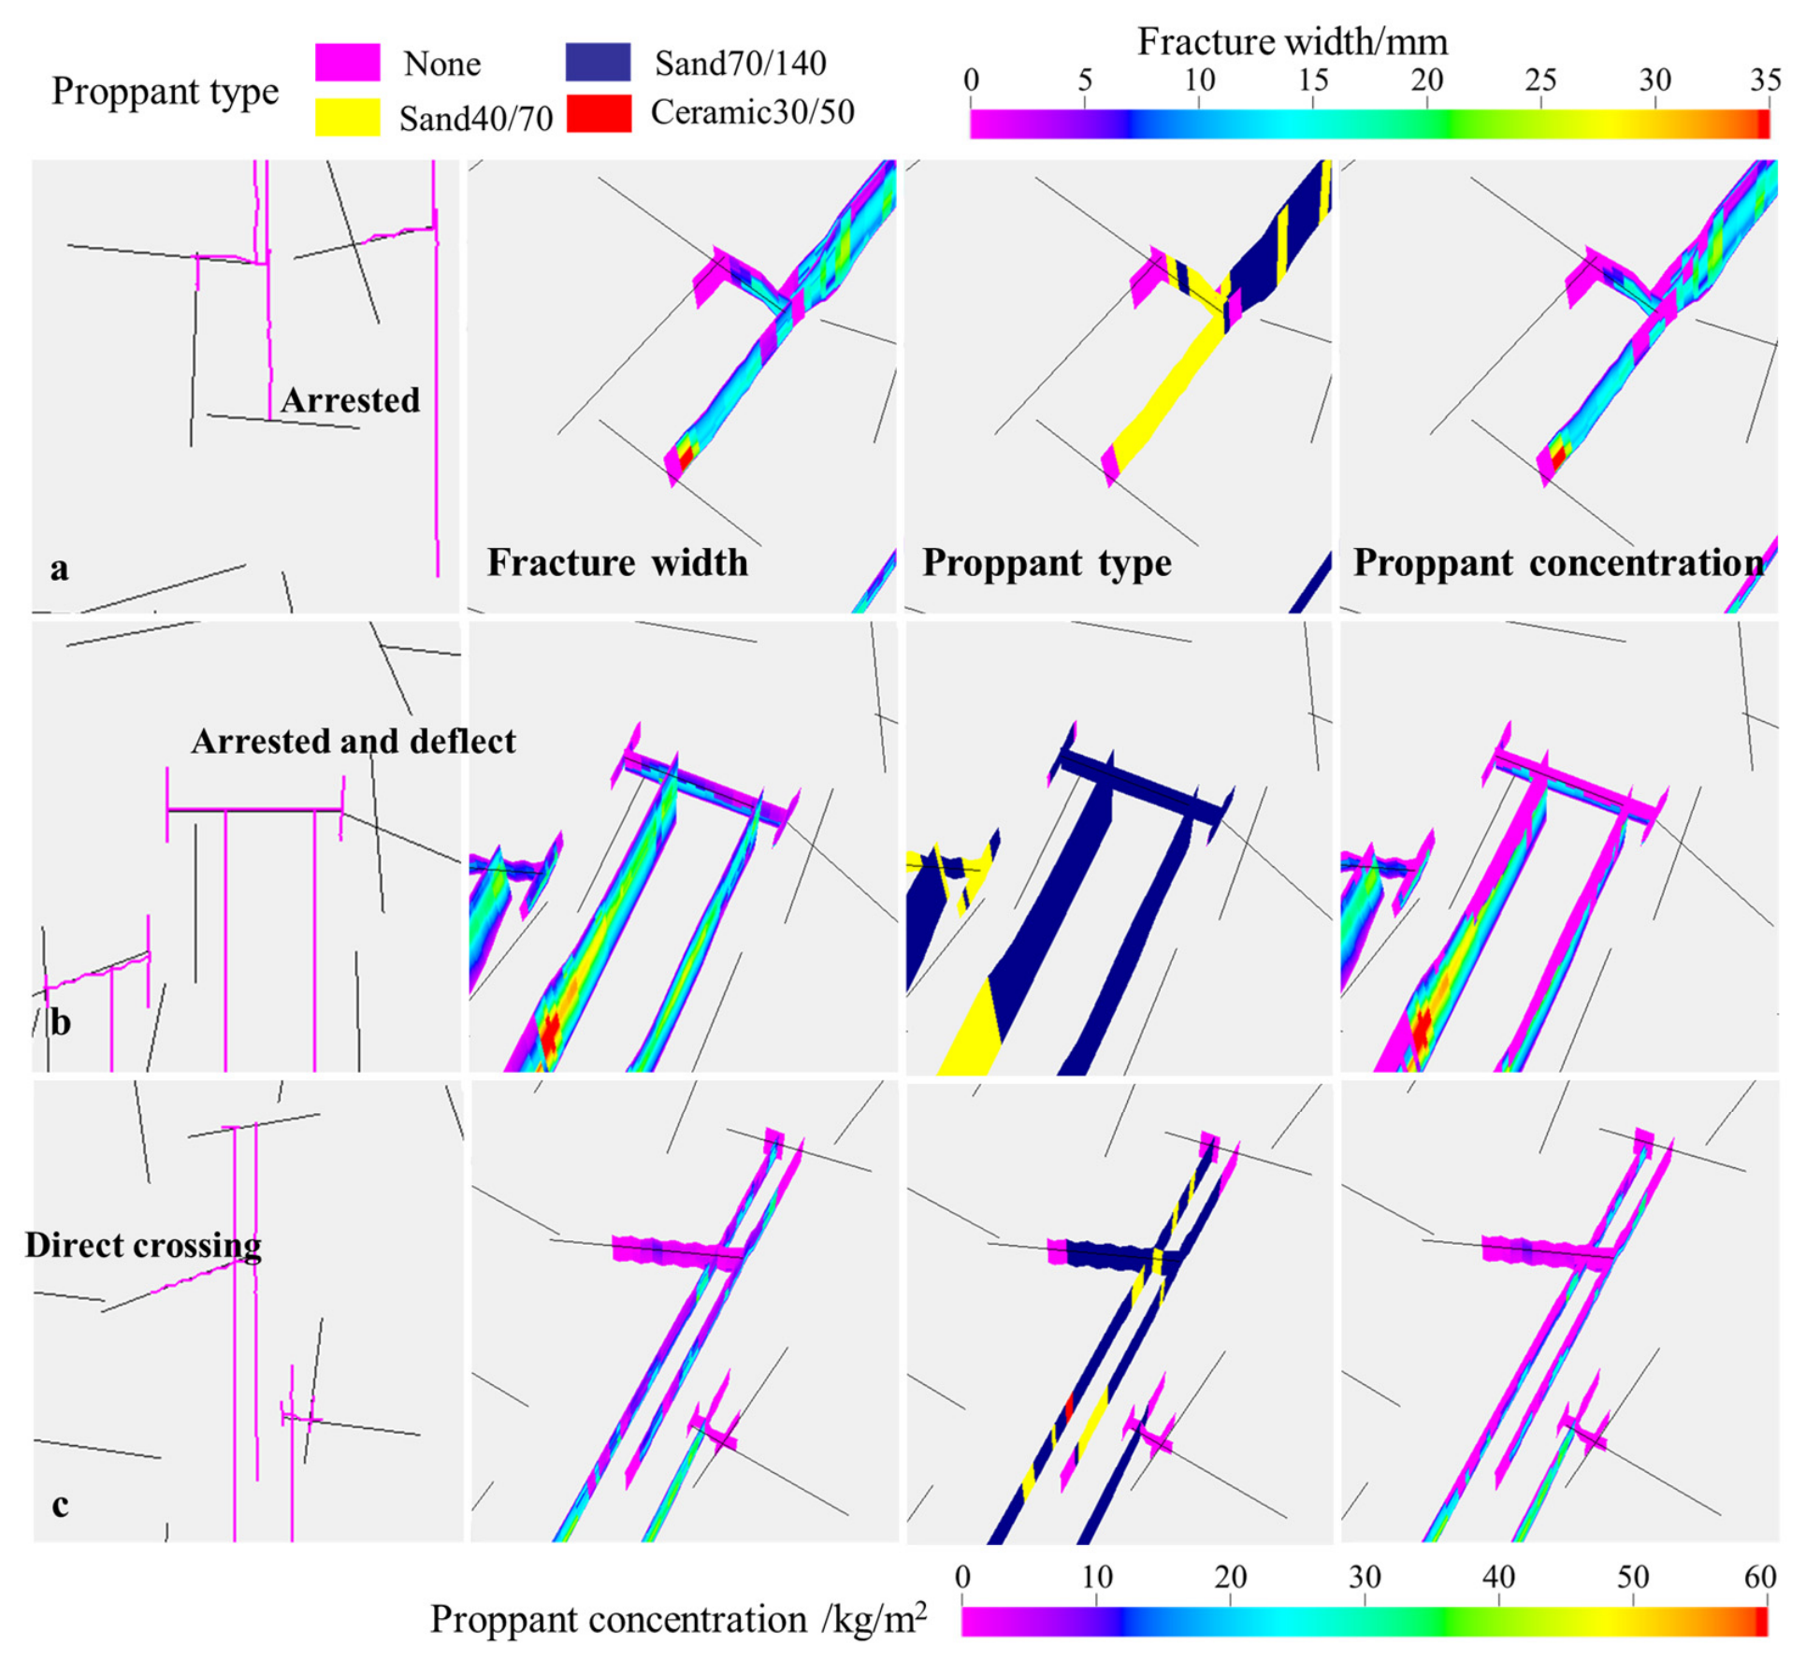
As shown in
Figure 18, the three local cases summarize three basic competitive modes during the intersection between main fractures and branch fractures. The differences among these modes essentially reflect the relative magnitudes of driving forces, interface resistance, and local stress conditions on both sides of the intersection. In mode a, the main fracture is arrested by the branch fracture. The fluid is diverted into the existing branch fracture, causing the main fracture tip to cease propagation. A significant local widening and proppant enrichment occur at the intersection, while continuous support is lacking in the distal region of the main fracture. This mode is beneficial for increasing local fracture network complexity but shortens the effective propagation distance of the main fracture and may result in high-concentration blockage nodes. In mode b, the main fracture is initially arrested and deflected along the branch fracture or an adjacent direction, followed by continued propagation. The fracture pathway exhibits a zigzag geometry, with relatively high fracture width and proppant concentration at the deflection point, while gradually decreasing along the newly developed deflected segment. This mode enables communication with multiple cleats; however, the tortuous flow pathway and increased local flow resistance make coarse particles prone to retention at deflection locations, whereas distal regions are mainly reached by fine-sized proppants. In mode c, the main fracture undergoes direct crossing of the branch fracture and maintains continuous propagation. The width of the main flow channel remains relatively continuous, and proppants can be transported across the intersection toward distal regions, whereas the intersected branch fracture receives relatively limited proppant filling. These three modes collectively demonstrate that the most favorable effective fracture network does not simply correspond to maximizing the number of branches. Instead, a balance must be achieved between the continuous transport capacity of main fractures and the activation degree of branch fractures, ensuring that intersection nodes neither become excessively blocked nor completely lose their fluid diversion function.